newport hazard mitigation plan...
TRANSCRIPT

Natural Hazard Mitigation Plan2016 Update
City of Newport, Rhode Island
FEMA approval date January 5, 2017

Prepared for
The City of Newport 43 Broadway Newport, RI 02840
Prepared by
1 Cedar St, Suite 400 Providence, RI 02903

City of Newport 2016
Hazard Mitigation Committee
City of Newport, Department Zoning and Inspections Guy E. Weston, Zoning Officer William A. Hanley, II, Building Official City of Newport, Department Zoning and Inspections, Planning Division Christine A. O’Grady, City Planner Helen Johnson, Preservation Planner City of Newport, Fire Department Peter Connerton, Chief & Emergency Management Director City of Newport, Police Department
Gary Silva, Chief City of Newport, Department of Public Services William Riccio, Director City of Newport, Department of Utilities Julia Forgue, Director Newport Hospital, Director of Emergency Preparedness (Health Care Representative) Pamela Mace, Director of Emergency Preparedness Coast Guard – Castle Hill Station John Roberts, Commanding Officer Karl Anderson, Executive Petty Officer Environmental Representative – Coastal Resources Center at the University of Rhode Island Teresa Crean, Coastal Manager Community Representative Frank Ray, Esq. Utility Representative – National Grid Jacques Afonso, Prin Program Manager
City Manager
Joseph J. Nicholson, Jr., Esq.
Acting City Solicitor
Christopher J. Behan

City of Newport 2013
Hazard Mitigation Committee
City of Newport, Department of Civic Investment Paul Carroll, Director Melissa Barker, GIS City of Newport, Fire Department Peter Connerton, Chief & Emergency Management Director City of Newport, Police Department
Gary Silva, Chief Daniel Dvorak, Lieutenant (Cyber security specialist) City of Newport, Department of Public Services William Riccio, Director City of Newport, Department of Utilities Julia Forgue, Director City of Newport, Preservation Planner Matthew Weintraub Health Care Representative – Newport Hospital Patricia Grimes, Director of Emergency Services Coast Guard – Castle Hill Station John Roberts, Commanding Officer Scott Blackketter, Executive Petty Officer Regional Representative – Aquidneck Island Planning Commission Tina Dolen, Executive Director Business Community – Newport County Chamber of Commerce Jody Sullivan, Executive Director Environmental Representative – Coastal Resources Center at the University of Rhode Island Teresa Crean, Coastal Manager Community Representative Frank Ray, Esq. Utility Representative – National Grid Amy Willoughby, Lead Environmental Scientist

i Table of Contents
Table of Contents
Executive Summary ............................................................................................... 3
Approval and Adoption Documentation ................................................................ 7
1.0 Background ..............................................................................................11
1.1 Introduction to Hazard Mitigation ............................................................................. 11 1.2 Community Planning Area ....................................................................................... 11
1.2.1 Location Information ..................................................................................... 11 1.2.2 Demographics .............................................................................................. 12 1.2.3 Land Use and Infrastructure ......................................................................... 13 1.2.4 Community Development and Development Trends ................................... 14 1.2.5 Historic and Natural Resource ..................................................................... 15 1.2.6 Commerce, Industry, Academic ................................................................... 16 1.2.7 NFIP Status .................................................................................................. 17
1.3 Significant Weather Events ...................................................................................... 18
2.0 Planning Process ......................................................................................20
2.1 Purpose .................................................................................................................... 20 2.2 Building Support: Community Involvement, Roles and Responsibilities .................. 20
2.2.1 Stakeholders ................................................................................................ 21 2.2.2 Public ........................................................................................................... 21 2.2.3 Neighboring Communities ............................................................................ 21
2.3 Understanding the Community’s Risks .................................................................... 22 2.3.1 Review and Incorporation of Information with Stakeholder and Public
Exchange ..................................................................................................... 22 2.3.2 Updating the Risk Assessment .................................................................... 22
2.4 Updating the Mitigation Strategy .............................................................................. 23 2.4.1 Identification and Review of Existing Goals ................................................. 24 2.4.2 Review and Incorporation of Stakeholder Exchange ................................... 25
2.5 Bringing the Plan to Life: Implementation and Maintenance .................................... 25 2.5.1 Mitigation Methodology ................................................................................ 26 2.5.2 Continued Public Involvement ...................................................................... 30 2.5.3 Plan Maintenance ........................................................................................ 31
3.0 Risk Assessment .......................................................................................33
3.1 Defining Risk and Methodology ............................................................................... 33 3.2 Hazards .................................................................................................................... 33
3.2.1 Hazard Identification .................................................................................... 33

ii Table of Contents
3.2.2 Hazard Profiles ............................................................................................. 35 3.2.2.3.a Climate Change ................................................................................. 61
3.3 Vulnerability ............................................................................................................. 81 3.3.1 Community Assets ....................................................................................... 81
3.4 Risk Analysis and Assessment Matrix ..................................................................... 97 3.4.1 Methodology ................................................................................................. 97 3.4.2 Vulnerability Summary ................................................................................. 99
4.0 Capability Assessment ........................................................................... 109
4.1 Purpose .................................................................................................................. 109 4.2 Types and Evaluation of Capabilities ..................................................................... 109
4.2.1 Local Government and Program Areas ...................................................... 109 4.2.2 National Flood Insurance Program, CRS ................................................... 124
4.3 Integration with Existing Plans and Local Processes ............................................. 126 4.4 Capability Needs/Challenges ................................................................................. 126
5.0 Mitigation Strategy ................................................................................ 128
5.1 Vision and Goals .................................................................................................... 128 5.2 Update of Mitigation Strategy and Actions ............................................................. 129
5.2.1 Identifying Types of Mitigation Actions ....................................................... 130 5.2.2 Prioritization ............................................................................................... 133
5.3 2016-2021 Action Plan ........................................................................................... 135 5.3.1 Primary Actions Program ........................................................................... 135 5.3.2 Continuity Actions Program ........................................................................ 144
5.4 Table/Matrix ........................................................................................................... 147 5.5 Supporting Activities .............................................................................................. 155
6.0 Moving Towards a Safe, Resilient, and Sustainable Rhode Island Community ............................................................................................ 157
6.1 Evaluation: Progress & Challenges ....................................................................... 157
Appendices
A Assessing Risk - Maps B Building Support: Planning Process Additional Documentation C Supplemental Information D Final Local Mitigation Plan Review Tool from Approved Plan E Glossary

3 Executive Summary
Executive Summary
PURPOSE: The purpose of the Natural Hazard Mitigation Plan update is to identify local policies and actions that can be implemented over the long term to reduce risk and future losses from hazards. These mitigation policies and actions are identified based on an assessment of hazards, vulnerabilities, and risks and the participation of a wide range of stakeholders and the public in the planning process. Hazard mitigation is the process of reducing the potential severity of natural or naturally instigated hazards through anticipation and planning. Some hazards require engineering solutions, such as replacing a deteriorating seawall; other hazards, such as an imminent hurricane, require the implementation of an emergency response plan. Pre-disaster planning and investment in preventative measures can significantly reduce the cost of tomorrow’s post-disaster recovery and help post-disaster operations become more efficient. By planning ahead, Newport minimizes the economic and social disruption that results from natural hazards including floods, severe weather and hurricanes which can result in the destruction of property, loss or interruption of jobs, loss of business and loss of life. Mitigation strategies include a mix of physical initiatives to limit the impacts of natural hazards, such as rebuilding riprap walls to protect against coastal erosion, as well as regulatory/planning initiatives such as revised zoning ordinances, and maintaining land use regulations. STRATEGY: The Newport Hazard Mitigation Strategy continues to advocate the concepts of disaster resilient and sustainable communities. Newport is building a disaster resistant community and achieving sustainable development through the commitment of state and local government and its policymakers to mitigate hazard impacts before disaster strikes. Additionally, Newport is striving to be a disaster resilient city, and therefore a safer community, through the implementation of mitigation programs and policies. The City implements and institutionalizes hazard mitigation through its human, legal and fiscal resources; the effectiveness of intergovernmental coordination and communication; and the use of knowledge and tools at hand to analyze and cope with hazard risks and the outcomes of mitigation planning. The Newport mitigation strategy provides a coordinated, consistent set of goals for reducing or minimizing human and property losses, major economic disruption,

4 Executive Summary
degradation of ecosystems and environmental critical habitats, and destruction of cultural and historical resources from natural and technological disasters.
x Provide a basis for intergovernmental coordination in hazard mitigation programs at the state and local level
x Develop partnerships between the City and private sector, local communities and non-profit organizations in order to coordinate and collaborate on hazard mitigation programs
x Identify and establish close coordination with local government departments and agencies responsible for implementing the sound practices of hazard mitigation through building standards and local land use development decisions and practice
x Provide for a continuing public education awareness about the risks and losses from natural and technological disasters, in addition to hazard mitigation programs, policies, and projects
GOALS: To support the implementation of the Newport Mitigation Strategy ten goals have been developed:
1. Protect public health, safety and welfare 2. Reduce the property damages caused by hazard impact 3. Minimize social dislocation and distress 4. Reduce economic losses and minimize disruption to local businesses 5. Protect the ongoing operations of critical facilities 6. Reduce the dependence and needs for disaster assistance funding after
disasters 7. Expedite recovery disaster mitigation efforts during the recovery phase 8. Promote non-structural flood and coastal erosion measures to reduce the risk
of damage to surrounding properties and environmental habitats 9. Establish a continuous local Hazard Mitigation Committee to support,
implement and revise the Newport multi-hazard mitigation strategy and to provide the support necessary for an ongoing forum for the education and awareness of multi-hazard mitigation issues, program, policies, and projects
10. Provide for adequate financial and staffing resources to implement the Newport Hazard Mitigation Strategy
ACTIONS: The types of activities that were considered when developing new actions to reduce the community’s vulnerability have been divided into the following categories:
1. Health, Safety and Welfare 2. Property Protection 3. Resource Preservation 4. Emergency Response Measures
Sixteen primary actions and four sustainment, or continuity, actions have been developed.

5 Executive Summary
Primary Actions Program 1. Creation of evacuation service and support mechanisms for citizens unable
to self-evacuate. 2. Shelter study and acquisition of additional facilities if needed 3. Purchase generators to increase resiliency of health care facilities during
hazard events 4. Public Education/Information dissemination 5. Implement protective measures for historic structures and collections 6. Categorize priority activities for city-owned flood risk properties to develop
sustainable and resilient facilities and infrastructure 7. Revise, amend and enforce the Newport Zoning Code to manage land in
vulnerable areas 8. Seawall sustainment 9. Eliminate flood risk to repetitive loss properties 10. Conduct vulnerability assessment of pre-code structures 11. Protect and reduce the vulnerability of waste water system infrastructure 12. Protect and reduce the vulnerability of the potable water supply 13. Implement emergency planning and permitting procedures 14. Develop an acquisition program 15. Develop a Disaster Recovery Plan 16. Increase shelter capacity
Sustainment (Continuity) Actions Program
17. Improvement of evacuation routes 18. Evacuation route sustainment 19. Reduce vulnerability to power and communication infrastructure 20. Maintain debris management plan

6 Executive Summary

7 Adoption Documentation
Approval and Adoption Documentation

8 Adoption Documentation

9 Adoption Documentation

10 Adoption Documentation

11 Background
1.0 Background
1.1 Introduction to Hazard Mitigation For the purposes of this plan, hazards are defined as natural, or naturally instigated, events that can seriously harm people, property, or both. Hazards referenced in this plan include floods, droughts, high winds, winter storms, nor’easters, hurricanes, tornadoes, dam failure, and coastal erosion. Hazard mitigation is the process of reducing the potential severity of natural or naturally instigated hazards through anticipation and planning. Some hazards require engineering solutions, such as replacing a deteriorating seawall; other hazards, such as an imminent hurricane, require the implementation of an emergency response plan. Besides affording a wide range of protections for the residents and resources of a city, a Hazard Mitigation Plan decreases the extent, and demands for, municipal emergency response and assistance. This report presents the strategy developed by the City of Newport to prepare for, and mitigate, the potential loss of life and property in the event of natural disasters. As the direct and indirect costs of disasters continue to rise, it becomes particularly critical that preparing for the onslaught of damage from these events must be accomplished in order to reduce the amount of damage and destruction. This strategy is commonly known as mitigation. The purpose of multi-hazard mitigation is twofold: 1) to protect people and structures from harm and destruction, and 2) to minimize the costs of disaster response and recovery.
1.2 Community Planning Area
1.2.1 Location Information
Newport is a city on Aquidneck Island in Newport County, Rhode Island, United States, about 30 miles (48 km) south of Providence. It is known as a New England

12 Background
summer resort and is famous for the grand Newport Mansions. In addition to the thriving tourist industry, Newport is the home of Salve Regina University, which hosts approximately 2,500 students during the school year. Newport also hosts a large naval industry with the Naval Undersea Warfare Center, the United States Naval War College, and a major United States Navy training center. The city is the seat of Newport County. Newport is located at 41°29'17"N, 71°18'45"W. It is the largest city on Aquidneck Island in Narragansett Bay. According to the United States Census Bureau, the city has a total area of 11 .5 square miles (29.7 km2) , of which, 7.9 square miles (20.6 km2) of it is island and 3.5 square miles (9.2 km2) of it (30.863) is water. The Newport Claiborne Pell Bridge, the longest suspension bridge in New England, connects Newport to neighboring Conanicut Island across the East Passage of the Narragansett Bay.
1.2.2 Demographics
As of the 2010 census, the population of Newport is 24,672; this is a 6.8% decline in the population since 2000 (Rhode Island Department of Labor and Training 2010), with 10,649 households and 4,941 families residing in the city. The population density is 3,204.2 people per square mile (1,239 .8/km2), with 13,069 housing units at an average density of 1,697.3/sq. mi (656.7 /km2). The racial makeup of the city is 83.1% White, 6.4% African American, 0.8% Native American, 1.2% Asian, 0.1% Pacific Islander, 3.1% from other races, and 5.2% from two or more races. Hispanic or Latino of any race made up 8% of the population (United States Census Bureau 2010). There are 4,941 family households out of which 19.5% had children under the age of 18 living with them, 30.9% are married couples living together, 12.3% have a female householder with no husband present, and 53.6% are non-families. Of all households, 41.5% are made up of individuals and 24.5% have someone living alone who is 65 years of age or older. The average household size is 2.05 people and the average family size is 2.82 people (United States Census Bureau 2010). The Newport population is made up of 17.5% under the age of 18, 17.2% from 15 to 24, 26.9% from 25 to 44, 26.1% from 45 to 64, and 15% who are 65 years of age or older. The median age is 37.9 years. Females make up 53.1 of the population, and males are 46.9% population (United States Census Bureau 2010). The median income for a household in the city is $59,388 and the median income for a family is $83,880. The per capita income for the city is $35,644. About 10.73% of the population is below the poverty line (United States Census Bureau 2010).

13 Background
1.2.3 Land Use and Infrastructure
Newport is a mature community, with approximately 90% of all land parcels developed (Newport Comprehensive Land Use Plan 2004). The 2010 U.S. Census shows a residential vacancy rate of 18.8%, or 2,453 units. This number represents an increase of vacant units of 793. However, during the 10-year period between Censuses, 556 units have converted from year-round to seasonal, recreational, or occasional use. Using Newport's 2010 average occupancy rate of 2.05 persons per household, the vacant units characterized as year-round could accommodate 2,130 persons. The existing housing stock, therefore, contains sufficient excess capacity to absorb anticipated population growth as outlined in the Comprehensive Plan. The build-out analysis conducted by the Department of Planning, Zoning, and Development indicates that the city’s residentially zoned land could accommodate the development of approximately 2,500 additional housing units’ as-of-right under existing zoning (Newport Comprehensive Land Use Plan 2004). Future land use patterns are not predicted to change significantly, however, the current zoning regulations continue to be fine‐tuned to prepare for new land development. Since 2008 (the date of the last approved plan), Newport’s vulnerability to natural disasters has not significantly changed. The city has a limited potential for new development and has seen a significant reduction in new construction. However, new developments are in compliance with the updated floodplain, State building code and stormwater standards. Among the top priorities in future land use are the preservation of open space, preservation of the scale and character of neighborhoods, limiting development to that which can be supported by infrastructure and environment, and the careful reuse of the harbor front (Newport Comprehensive Land Use Plan 2004) and preventing new development that may increase vulnerability to natural hazards. Considering the regulations in place and decrease in population since the last plan update, it may not be quantifiable to state the Newport’s vulnerability to natural hazards has decreased but resiliency has improved due to the City’s planning efforts. The future commercial land use is generally located in areas with adequate transportation (primarily automobile) and areas with adequate lot size to accommodate medium-to-larger commercial establishments. Specific uses within the commercial area would include retail, shopping centers, offices, research facilities, technology centers, guest facilities, restaurants, and other similar uses (Newport Comprehensive Land Use Plan 2004). The future infrastructure land use is for water, sewer and stormwater systems on property owned by the City of Newport. The proposed institutional land use consists of uses such as schools, universities and colleges, governmental functions (local, state, and federal), hospitals, cemeteries, and non-profit community organizations.

14 Background
Institutional land uses will continue to be located throughout Newport (Newport Comprehensive Land Use Plan 2004).
1.2.4 Community Development and Development Trends
When planned properly, physical development can contribute to economic development and the quality of life overall (Newport Comprehensive Land Use Plan 2004). New commercial development, and the rehabilitation of existing commercial areas, will provide a key source of future non-residential tax revenue. Many of the city’s commercial and residential areas have reached maturity; however, there are other areas, particularly the harbor, where there are several underutilized parcels (Newport Comprehensive Land Use Plan 2004).
Newport is an island community and an historic city that grew around its excellent harbor. As of 2001, the City is substantially “built-out.” According to the 2000 US Census approximately 23.6 acres are vacant land that could be developed commercially (Newport Comprehensive Land Use Plan 2004).
Because the harbor area is one of the oldest sections of the City, most streets are narrow and many of the old structures are built to the sidewalk. There is little to no land available on already developed parcels for additional parking. Parking is, therefore, a major factor limiting the expansion of economic activity within older structures, since the city’s zoning ordinance requires additional on-site parking if a commercial use is to be expanded. The parking requirements of commercial activity will also be a key factor in considering new development along the waterfront (Newport Comprehensive Land Use Plan 2004).
As the state’s principal tourist center and resort community, Newport is visited annually by approximately 3 .5 million tourists who attend special events, sail, and view the city’s mansions and other attractions (Newport Comprehensive Land Use Plan 2004). The city’s popularity has stimulated significant private investment in retail shopping facilities, hotels, timeshare units, restaurants, clubs, and other tourist-oriented enterprises (Newport Comprehensive Land Use Plan 2004). City revenue sources to finance municipal expenditures in Newport are limited by statute to a relatively small number of categories, such as real and personal property taxes, bonding, user fees. Therefore, general city services are heavily dependent on the property tax revenue. The property tax revenue in the FY 2015 was $73,924,776. This revenue represented 71.29% of the total revenues and 74.93% of expenses (City of Newport Proposed Budget for Fiscal Years 2014 and 2015). To help more Newport residents participate in the labor force, the available number and type of educational and job training programs needs to expand. The implementation of dropout prevention strategies will also be important. In addition,

15 Background
initiatives to increase participation in existing programs are desirable. Affordable, accessible daycare services and public transportation are important support services required to assist economic development and increase employment opportunities (Newport Comprehensive Land Use Plan 2004).
Faced with very slow growth of the city’s tax base, it is in Newport’s best interests to capture new firms and commercial development that will have direct property tax benefits for the city. Newport contains a relatively small share of this type of office space; much of Newport’s office space is located in smaller historic structures and upper floors of mixed-use buildings (Newport Comprehensive Land Use Plan 2004).
1.2.5 Historic and Natural Resource
The City of Newport has over 300 years of history and culture to be preserved and protected. Colonial structures of the seventeenth century lead to the downtown development of the eighteenth century. The nineteenth century brought the rich history of wealth, and famous Gilded Age summer cottages constructed along Bellevue Avenue by some of the richest families in the country, such as the Vanderbilt’s and Astor’s. The city’s urban character reflects distinctive periods in Newport’s historical and cultural development. The variety and quality of representative architectural styles distinguishes Newport as a unique model for preservation efforts (Newport Comprehensive Land Use Plan 2004). Areas of Newport that are federally registered National Historic Landmark Districts are: the Bellevue Avenue National Historic District (1976), Fort Adams National Historic District (1976), Newport National Historic District (1968), the Ocean Drive National Historic District (1976), and the U.S. Naval War College National Historic District. The National Register of Historic Places Districts in Newport are: the Bellevue Avenue – Casino Historic District (1972), Fort Hamilton (Rose Island) Historic District (2001), Kay Street – Catherine Street – Old Beach Road Historic District (1973), Ochre Point – Cliffs Historic District (1975), and the Southern Thames Historic District (2008). In addition to the historic and cultural aspects of Newport, the city also has a wealth of natural resources. The coastline plays a key ecological role in providing habitat for vegetation and wildlife, which flourish in the unique environment where land meets the sea and where Narragansett Bay meets the Atlantic Ocean (Newport Comprehensive Land Use Plan 2004). Newport’s shallow freshwater wetlands are particularly important as buffers around the coastal ponds (Almy Pond and Lily Pond) in the southern part of the City and at the northern end of Easton Pond. Wetlands contribute significantly to the diversity of plant life and wildlife in the area and to its scenic value (Newport Comprehensive Land Use Plan 2004).

16 Background
1.2.6 Commerce, Industry, Academic
The tourism industry is a mainstay of the Newport economy that provides jobs and brings outside revenue to the community. Newport has experienced substantial growth in tourism-related sectors of the local economy, including hotels, restaurants, retail goods, museums, galleries, and recreational services (Newport Comprehensive Land Use Plan 2004). This growth has the added effect of bolstering related businesses such as construction, banking, real estate, business services, and transportation services. Newport’s tourism industry is seasonably dependent and this cycle can present drawbacks in the winter months. At the close of tourism season local businesses typically reduce their operating hours or close business altogether until the following season (Newport Comprehensive Land Use Plan 2004). Newport’s economy is also closely tied to the defense industry. The Newport Naval Station and its associated contracting companies are Aquidneck Island’s largest employers with 7,552 employees in 2001 (Newport Comprehensive Land Use Plan 2004). Employees of the Newport Naval Station include a mixture of civilian and military personnel. The military, civilian, and student personnel at the Navy Base and their families form an important part of the Newport County social and economic fabric. Aside from these year-round residents, the educational activities at the Base bring short-term residents to the Island. In 2001, the Naval Education and Training Center, Surface Warfare Officers School Command, Naval Justice School, and Naval War College graduated an estimated 11,000 students from programs that last from five to ten months in duration. The housing, goods, and services procured by these adult students also provide benefits to the local economy (Newport Comprehensive Land Use Plan 2004). While the fishing and marine industry is not the boon it once was, it still plays an important role in the local economy (Newport Comprehensive Land Use Plan 2004). Traditional maritime uses currently include a major shipyard, boat building, sail making, and chandlery businesses, as well as other marine services. Currently, there are two firms in Newport that support the local fishing industry by purchasing and processing the catch: Aquidneck Lobster and Parascondolo (Newport Comprehensive Land Use Plan 2004). The retention and expansion of these and similar businesses that serve the fishing industry will be important to the industry’s future in Newport. Aquaculture is becoming a viable alternative to traditional fishing. The research and development of aquaculture, new processing methods, and improved fisheries management and marketing methods could provide a focus for new marine industry to be located on the Newport waterfront (Newport Comprehensive Land Use Plan 2004). Two other important employers in Newport include the Newport Hospital and Salve Regina University (Newport Comprehensive Land Use Plan 2004). Health services provide excellent employment opportunities. State occupational demand projections

17 Background
indicate that there will be continued growth in demand for workers in many health-related occupations, including medical laboratory and radiology technologists, laboratory and pharmacy assisting, and practical nursing (Newport Comprehensive Land Use Plan 2004). As of 2012 the hospital employed 876 people (Newport Hospital Facts and Statistics 2012). Salve Regina University makes a significant contribution to the economy of Newport and provides a broad spectrum of educational and employment opportunities for Newport residents. Salve has 600 employees and a student enrollment of roughly 2,500 (Newport Comprehensive Land Use Plan 2004). The City of Newport is also an important employer; between the school department and the many other city departments the city employs approximately 800 people (Newport Comprehensive Land Use Plan 2004).
1.2.7 NFIP Status
The National Flood Insurance Program (NFIP) was created by Congress in 1968 to protect lives and property and to reduce the financial burden of providing disaster assistance (Floodplain Management in Rhode Island 2007). The NFIP is administered by the Federal Emergency Management Agency (FEMA). Nationwide, over 20,000 communities participate in the NFIP, including all Rhode Island counties, cities, and towns (Floodplain Management in Rhode Island 2007). The NFIP is based on a mutual agreement between the federal government and communities. Communities that participate agree to regulate floodplain development according to certain criteria and standards (Floodplain Management in Rhode Island 2007). Federal flood insurance is required for all buildings in Special Flood Hazard Areas (SFHA) shown on FEMA’s Flood Insurance Rate Maps (FIRM) if they are financed by federally-backed loans or mortgages. All homeowners, business owners, and renters in communities that participate in the NFIP may purchase federal flood insurance on any building, even if outside of the mapped flood zone (Floodplain Management in Rhode Island 2007). The NFIP’s Community Rating System (CRS) gives “extra credit” in the form of Uniform Minimum Credit (UMC) to communities in the form of reduced flood insurance premiums (Floodplain Management in Rhode Island 2007). Communities must apply to the CRS and commit to implement and certify activities that contribute to reduced flood risk. Newport would like to participate in the CRS program, joining the eight other Rhode Island communities that currently take part in it: North Kingstown, Middletown, Narragansett, Westerly, Bristol, Charlestown, Pawtucket, and East Providence (Rhode Island Emergency Management Agency, 2015). The City of Newport is currently in the process of updating its 2013 CRS application information with FEMA prior to applying to the Insurance Services Office (ISO).

18 Background
1.3 Significant Weather Events There have been several significant storm events that have impacted Newport and the region since the HMP was last approved in 2008. Most notably are Major Flooding (March 2010); Hurricane/Tropical Storm Irene (August 2011); Snowstorms (January 2011 & February 2013); and “Superstorm” Sandy (October 2012). Though it did not have a significant impact on Newport, the Virginia Earthquake (August 2011) was felt in the region. Winter Storm Juno, January 26-27, 2015, ranked as the 4th heaviest snowstorm in history for much of Rhode Island. According to the National Weather Service, Juno was followed by the snowiest February on record, totaling over 31 inches in 28 days.

19 Background

20 Planning Process
2.0 Planning Process
2.1 Purpose The purpose of this Natural Hazard Mitigation Plan (NHMP) is to set forth guidelines of short-term and long-term actions that will reduce the actual or potential loss of life or property from hazardous events such as winter storms, flooding, thunderstorms, droughts, hurricanes, and earthquakes (Newport Comprehensive Land Use Plan 2004). This plan is a directive of the Federal Emergency Management Agency (FEMA) and conforms specifically to 44 CFR Parts 201 and 206 Hazard Mitigation Planning and Hazard Mitigation Grant Program: Interim Final Rule. The plan has gone through rigorous scrutiny and review at the local level and has been review and approved by RIEMA and FEMA (see section 2.5.1.1). The City of Newport, upon adoption of this plan, will be an eligible applicant for the Hazard Mitigation Assistance (HMA) program. This status enables the city to file for resources that may be used to mitigate the effects of hazards on both public and private property (Newport Comprehensive Land Use Plan 2004). To ensure a national focus on mitigation, the Federal Emergency Management Agency (FEMA) introduced a National Mitigation Strategy in 1995. The strategy promotes the partnership of government and the private sector to “build” safer communities. Hazard mitigation encourages all Americans to identify hazards that may affect them or their communities and to take action to reduce risks (Newport Comprehensive Land Use Plan 2004).
2.2 Building Support: Community Involvement, Roles and Responsibilities
The development of this mitigation strategy has been a result of the much appreciated work by the Newport 2014 Hazard Mitigation Committee. This working group consisted of members of City Government, affiliates of major institutions located in the City, and the general public. This diverse membership enabled the demographics of the group to reflect the permanent and transient demographics of the City. Planning in this fashion creates a mitigation strategy that fully encompasses all aspects of disaster impact, from concerns of the residency, business continuity,

21 Planning Process
and local disaster response and recovery activities (Newport Comprehensive Land Use Plan 2004).
2.2.1 Stakeholders
As part of the planning process, the City of Newport reached out to a diverse group of stakeholders in an effort to ensure the final product was inclusive and represented a broad spectrum of the community. Inclusion started with the formation of the 2014 Hazard Mitigation Committee. The Committee is comprised of members of the public and private sectors, representing the business community, economic and physical development, building and zoning professionals, climate specialists, utilities, and the general public.
2.2.2 Public
The City conducted two public forums to seek input for the plan. The first forum was targeted towards the business community, while the second was developed for the general public. The meetings were posted on the City website as well as the website of Engage Newport. In addition, advertisements were placed in the local press and multiple notices of meetings were posted in City Hall and the Newport Public Library as well as through the City Hall and Fire Department Facebook pages. Public feedback and recommendations received during these meetings proved invaluable in the planning process and the development of proposed mitigation actions. One example of the result of comments received from public meetings is the decision to provide city-sponsored workshops about hazard preparation steps and mitigation techniques that can be employed by residents. Other members of community, including neighboring towns, agencies, businesses, universities, nonprofits, and other interested parties, were invited to the public meetings. Members from the Newport Hospital, the Newport Naval Station, the United States Coast Guard, National Grid, and the Newport Historical Society attended the public meetings to assist in the development of the Newport mitigation strategy
2.2.3 Neighboring Communities
As an island community, the only directly abutting community is the Town of Middletown. However, Newport shares resources and vulnerabilities with the Towns of Portsmouth and Jamestown. Input was solicited and potential mitigation actions were coordinated with the Town Planners and Emergency Managers for Middletown, Portsmouth and Jamestown. None of the neighboring communities

22 Planning Process
provided specific comments or input, however, all communities agreed in principle to continued coordination and collaboration.
2.3 Understanding the Community’s Risks The 2016 Hazard Mitigation Strategy has been an opportunity for Newport and its stakeholders to take stock of major climatic events that have affected the City since the submission of the original 2008 Hazard Mitigation Strategy. Moreover, it has been an opportunity to examine how the City aims to strengthen existing plan activities and move forward with new hazard mitigation strategies as part of the city’s larger integrated plan to improve physical, economic, and social resiliency.
2.3.1 Review and Incorporation of Information with Stakeholder and Public Exchange
The City of Newport in conjunction with Vanasse Hangen Brustlin, Inc. hosted two public workshops to advocate the concepts of natural disaster preparation and response and to include comments from Newport residents. The first public meeting was held for the local business community on Monday June 30th, 2014 from 5:00-8:00 pm at the Newport Yacht Club on 110 Long Wharf in Newport. A second meeting for the general public was hosted the following day on July 1st, 2014 from 5:00-7:45 pm at the Newport Public Library. Additionally, public input was also sought online via engagenewport.com, which is an evolving forum for opinions and ideas about the City’s major initiatives. The discussion with the general public was productive and insightful. A wide range of ideas were proposed, such as backup communication alternatives in the event of a power outage. Concerns were raised, such as the safe storage of City records. For a complete list of input from the general public please see Appendix B.
As appropriate, public input was incorporated into the mitigation actions contained in this plan. Much of the input received will be incorporated during the implementation phase of this plan.
2.3.2 Updating the Risk Assessment
The City and its stakeholders executed a statistical major event analysis and update to the 2008 Hazard Mitigation Plan and its proposed strategies. This revision process has revealed that the City of Newport and its residents have seen an increase in the financial impacts from hazard situations, primarily natural events, compared with when the previous Hazard Mitigation Plan was developed (2003-2008).

23 Planning Process
During the process of updating the 2016 Natural Hazard Mitigation Plan, the City and its stakeholders reviewed and evaluated the efficacy of recommended actions from the 2008 Hazard Mitigation Plan. From that effort, the Committee was able to determine which of the recommended action items have been completed, which are still ongoing, and which action items were ineffective at addressing original issues. Committee members also used this review process to identify new actions items to improve mitigation response. The process provided the opportunity for the City and its stakeholders to identify new outreach organizations and groups that can better inform the Committee about the continuous improvement in the area of hazard mitigation. Additionally, these outreach groups can provide additional avenues to disseminate information to the larger community. Finally, the process provided the opportunity for the City and its stakeholders to begin to identify and establish ongoing work (post 2016 Natural Hazard Mitigation Plan submission) that addresses current hazard mitigation issues and prepares for long-term mitigation strategies for issues like climate change.
2.4 Updating the Mitigation Strategy Mitigation actions help safeguard personal and public safety. Retrofitting bridges, for example, can help keep them from being washed out, which means they will be available to fire trucks and ambulances in the event of a storm. Installing hurricane clips and fasteners can reduce personal and real property losses for individuals and can reduce the need for individual assistance in the event of a hurricane. Increasing coastal setbacks reduces the risk of deaths and property losses from tsunamis and storm surge. Increased setbacks also reduce the risk of property losses from coastal erosion. An important benefit of hazard mitigation is that money spent today on preventative measures can significantly reduce the impact of disasters in the future, including the cost of post-disaster cleanup. The adoption of this multi-hazard mitigation strategy will enhance Newport’s eligibility for federal grants, which include FEMA’s post-disaster Hazard Mitigation Grant Program (HMGP), the Pre-Disaster Mitigation (PDM) Program and the Flood Mitigation Assistance (FMA) Program. Pre-disaster planning also helps post-disaster operations become more efficient. For instance, procedures and necessary permits can be identified prior to the disaster and permit streamlining procedures can be put into place. Priorities for mitigation during reconstruction can also be identified, helping to reduce the high costs of recovery after a disaster. The state emergency

24 Planning Process
response effort will also run more smoothly because of the guidance provided in this strategy. Documents that were referenced in the development of this Natural Hazard Mitigation Plan include the Rhode Island State Hazard Mitigation Plan Update 2014 and the City of Newport’s 2004 Comprehensive Land Use Plan. Other documents referenced in the development of the plan include local zoning laws and building and subdivision ordinances. Additionally, the Hazard Mitigation Committee incorporated information from the Newport Emergency Operation Plan. The Newport Emergency Operation Plan includes natural hazard mitigation strategies as a principle means of protecting the City from the impacts of natural disasters. The Hazard Mitigation Plan will help Newport to focus on strengthening existing plans, programs, policies and procedures by incorporating hazard mitigation as part of the ongoing process of community development. As the City of Newport updates other important city-wide plans, such as the Newport Harbor Management Plan, the Comprehensive Land Use Plan, and the Emergency Operation Plan, the City will incorporate elements of the Hazard Mitigation Plan to provide consistency of hazard mitigation approaches. Implementation of mitigation actions will allow for a more effective Emergency Management Program via improved protection of critical infrastructure that will remain functional throughout a hazard event. Furthermore, the actions identified in the plan reduce the dangers faced by emergency responders. The incorporation of the Hazard Mitigation Plan into the Emergency Operation Plan will prioritize mitigation strategies to reduce disaster impact on the community and to provide an effective response to damages suffered in natural hazard events.
2.4.1 Identification and Review of Existing Goals
The purpose of the Natural Hazard Mitigation Plan is to identify local policies and actions that can be implemented over the long term to reduce risk and future losses from hazards. These identified mitigation policies and actions are based on an assessment of hazards, vulnerabilities, and risks, as well as the participation of a wide range of stakeholders and the public in the planning process. Hazard Mitigation is a sustained action taken to permanently reduce or eliminate long-term risk to people and their property from the effect of natural hazards. Mitigation actions help safeguard personal and public safety, and they can significantly reduce the impact of future disasters. Pre-disaster planning and investment in preventative measures can significantly reduce the cost of tomorrow’s post-disaster recovery and can help post-disaster operations become more efficient. By planning ahead, Newport minimizes the economic and social disruption that results from natural hazards including floods,

25 Planning Process
severe weather, and hurricanes that can result in the destruction of property, loss or interruption of jobs, loss of business, and loss of life. Mitigation strategies include a mix of physical initiatives to limit the impacts of natural hazards, such as rebuilding riprap walls to protect against coastal erosion, as well as regulatory/planning initiatives such as revised zoning ordinances and maintaining land use regulations.
2.4.2 Review and Incorporation of Stakeholder Exchange
Following the public workshops, the Hazard Mitigation Committee reviewed the hazard mitigation action plans to identify opportunities to incorporate feedback from the public. Concerns and unique perspectives provided by the public helped to shape the mitigation action plans and provided new perspectives on implementation activities. An important matter of discussion at the general public meeting involved the preservation of historic resources and city hall records. Newport is an old city with a wealth of historic buildings that reflect popular architecture styles of the 17th and 18th century. This architecture is crucial to maintaining the historical character of Newport that draws so many visitors. Additionally, it is critical to safely maintain city records and historical documents. This interaction is reflected in the restructured mitigation actions that now include a specific measure to protect historic structures and collections. Another important topic that was discussed at the public meeting was the matter of communication during a natural disaster event. During severe storms power can be lost and can shut down forms of communication. Another important aspect of public communication is discussing the matters of preparedness before a storm and steps that should be taken following a storm. These topics were incorporated into another hazard mitigation action: information dissemination. For this hazard mitigation action item the City of Newport will host informational workshops about the steps that should be taken before and after a disaster in order to minimize risk and improve safety. Additionally, the City will encourage neighborhood meet-and-greets so that neighbors will get to know each other and form neighborhood safety plans; neighbors are important links in ensuring one another’s safety in the event of a disaster. As is evidenced in these two examples, the feedback received from the public meetings were valuable resources in the development of the mitigation action plans.
2.5 Bringing the Plan to Life: Implementation and Maintenance
The City leadership realizes that a plan can only be successful if it is created in an atmosphere of collaborating and cooperation. To see the actions go from concepts to

26 Planning Process
implementation requires a community-wide effort. The 2016 version of the Newport Natural Hazard Mitigation Plan is aggressive, but realistic. We do not live in a world of unconstrained resources and we cannot control the forces of nature. The goals in this plan are challenging, but achievable. There are mitigation measures outlined to be implemented in the near-term that will support the concept of a resilient community for decades to come.
2.5.1 Mitigation Methodology
Each mitigation action has been given a relative priority, a period for implementation, and been assigned to a responsible City department for planning, implementation, and monitoring. The 2016 Hazard Mitigation Committee and the city’s leadership realize that successful hazard mitigation is an ongoing process that requires implementation, evaluation, and updated revisions to this plan. Also realized is the importance of integrating appropriate sections of the plan into the city’s Comprehensive Land Use Plan Update and Emergency Operations Plan. It is intended that this plan and the ongoing efforts of the Newport Hazard Mitigation Committee will preserve and enhance the quality of life, property, and resources for the City of Newport.
2.5.1.1 Plan Review, Adoption, and Approval
The 2016 Natural Hazard Mitigation Plan is a comprehensive strategy designed to help the City of Newport prepare for the impacts of natural disasters. The 2016 plan is an updated version of the 2008 plan and has gone through several stages of review before its adoption and implementation. First, the Newport Department of Civic Investment reviewed the draft document before forwarding it to the City Council for its review and approval to forward the for official review by the Rhode Island Emergency Management Agency (RIEMA) and the Department of Homeland Security (DHS), Federal Emergency Management Agency (FEMA) Region 1. The plan has been revised per FEMA Region I requirements and updated by the Department of Zoning and Inspections in accordance with current city management procedures. Upon receipt of a FEMA notification of conditional approval, it will be formally adopted by the Newport City Council (Rhode Island State Hazard Mitigation Plan 2014). Once implemented, the 2016 Natural Hazard Mitigation Plan will guide future hazard mitigation efforts. All actions identified in this plan have been determined to be viable mitigation actions. As such the responsible departments for each action will work to develop appropriate implementation timeframes and funding mechanisms. Although the priority ranking of the listed mitigation actions should guide their implementation, final decisions on which actions are to be implemented will inevitably be based upon funding availability.

27 Planning Process
2.5.1.2 Monitoring
The Newport Hazard Mitigation Strategy remains an evolving tool. The 2016 Natural Hazard Mitigation Plan is a dynamic document to be reviewed on a regular basis as to its relevancy and usefulness and to add new tasks when old tasks are completed. The City of Newport will review, monitor, and update its 2016 Natural Hazard Mitigation Plan and make recommendations for the improvements and changes throughout the next five years of this plan’s implementation. The City of Newport Planning Division, which is part of the Department of Zoning and Inspections, will be responsible for maintaining a permanent Hazard Mitigation Committee (HMC) and will work with the Emergency Management Director to schedule meetings and set agenda items. At a minimum, the HMC will meet every six months and following any significant events. This committee will continue to be comprised of members from public agencies, nongovernmental groups, academic institutions, business leaders, and private groups with demonstrated expertise in hazard mitigation. They will work collaboratively to strengthen communication and coordination within the city on improving emergency hazard response, operating procedures, and resiliency. The Emergency Management Director will serve as the committee chair and work in collaboration with the Planning Division to determine applicable plan content. It is the responsibility of the Planning Division to gather this information for maintaining and updating the Newport Natural Hazard Mitigation Plan. As actions are implemented or modified, the department responsible for that action will update the Mitigation Action Table and apprise the other members of the committee.
2.5.1.3 Evaluation
Going forward from the 2016 Natural Hazard Mitigation Plan submission, the city will be looking to reestablish the committee members’ involvement in the process in order to ensure that members have the most recent knowledge and experience with hazard issues in order to strengthen both its strategy planning and the city’s strategy implementation. The committee members will be asked to commit to at least two meetings per year. These meetings will provide benchmark tests to evaluate that the goals and deliverables of the plan are being met. In addition, these meetings will be an opportunity for the committee members to bring forward recommendations for potential additional hazard issues that may not be covered in the 2016 plan. In this manner, the City will be better able to judge the effectiveness of the 2016 plan and better able to identify and begin to address issues not anticipated at the time of the 2016 plan’s submission. Additionally, during these meetings and following disaster situations that may test plan implementation items, the Newport Hazard Mitigation Committee (HMC), under the direction of the Emergency Management Director, will review proposed and implemented strategies to determine their effectiveness. The review criteria will

28 Planning Process
evaluate each implemented action to determine the degree to which the action has met its intended purposes (Table 2-1). This review is critical after a hazard event, as that is the time when the degree of protection offered by the strategy is especially apparent. When the HMC meets after an event, the original information regarding cost-to-benefit analysis of each action will be reviewed to determine which actions were the most cost effective. If the actions failed, then new actions will be explored to correct the vulnerability. This type of evaluation will help to shape future actions proposed by the HMC.

29 Planning Process
Table 2-1. Action Item Evaluation Process Project Name and Number: Project Budget: Project Description: Associated Goals: Associated Objectives: Indicator of success (e.g. losses avoided): Was the action implemented? Yes
No If NO: Why not? Was there political support for the action? Yes No Were there enough funds available? Yes No Were workloads equitably or realistically distributed? Yes No Was new information discovered about the risks or community that made implementation difficult or no longer sensible?
Yes No
Was the estimated time of implementation reasonable? Yes No Were there sufficient resources available? Yes No If YES: What were the results of the implemented action? Were the outcomes as excepted? If no, please explain: Yes No Did the results achieve the goals and objectives? Explain how:
Yes No
Was the action cost effective? Explain how or how not:
Yes No
What were the losses avoided after having completed the project? If it was a structural project, how did it change the hazard profile? Additional comments or other outcomes: Date: Evaluated by:
2.5.1.4 Updates
The HMC employed significant revisions in updating the 2008 Hazard Mitigation Plan for the 2016 submission. The HMC followed the new, comprehensive report layout provided by RIEMA, which allows for a more logical flow of the plan. Additionally, several of the hazard mitigation action items were revised to include a broader scope of the many natural hazards that can afflict the City. Action items from 2008 that were found to be narrowly focused were incorporated into other action

30 Planning Process
items; for example, actions items #14 -16 from the 2008 plan were joined together to form action item # 12, “protect and reduce the vulnerability of the potable water supply.” The safety of the potable water supply for Newport is of critical importance and remains a top priority for the city, and this revised action item simply takes a broader scope in evaluating the vulnerabilities of potable water supply and the different management strategies that can reduce these risks. Additionally, two new hazard mitigation actions have been added to the plan: Action # 5 “protective measures for historic structures and collections” and #15 “develop a Disaster Recovery Plan.” Steps to implement action #5 are imperative to maintaining Newport’s historic characteristic. Approximately 40% of Newport’s land area is contained within the historic district and the City recognizes the important community goal of persevering architecturally and historically significant buildings, structures, and other historical/archeological resources. These types of properties may require additional and/or special measures in order to protect them from damage that could occur due to natural hazards. This action item also covers City Hall records and historic documentation, which are important resources that could be needed in the recovery efforts after a natural disaster. With regards to action item #15, putting in place a Disaster Recovery Plan is imperative for a resilient and speedy recovery process after a natural disaster strikes. Although the current Hazard Mitigation Plan is put in place to help to increase the preparedness of the City and mitigate the ill-effects from natural hazards, there will still be a recovery process after the disaster. The purpose of a Disaster Recovery Plan is to mobilize different agencies, utilities, and aid programs as quickly as possible following a natural hazard event and help them work together cohesively to provide a calm and speedy recovery process. Having this type of plan in place before a natural disaster occurs will minimize risks associated with natural disasters and provide seamless coordination of recovery efforts. The Hazard Mitigation Plan will be updated every five years in accordance with FEMA regulations. A copy will be submitted to FEMA for review in order to establish eligibility for FEMA hazard mitigation assistance grant programs. The plan will be updated before the five year cycle if risks, vulnerabilities, objectives or other components of the plan change significantly. As objectives, activities, and projects are accomplished, they will be reviewed and either removed or modified to reflect the current realities. The plan will be modified as necessary to address changing requirements and meet current conditions. The plan will be kept current to meet changes in laws or regulations.
2.5.2 Continued Public Involvement
On behalf of the HMC, the City Manager, under the direction of City Council, will be responsible for making sure that all City departments and the public have adequate

31 Planning Process
opportunity to participate in the planning process. Other administrative staff may be utilized to assist with the public involvement process. The following techniques will be used to increase public involvement at the Hazard Mitigation Committee meetings:
x Provide personal invitations to Budget Committee members x Provide personal invitations to City Department heads x Post notices of meetings at the City Hall, Fire Departments, Police
Departments, and the Public Library x Submit announcements for publication in the local news outlets, including
Newport Daily News and the Newport Patch x Update the City website with Hazard Mitigation meeting notices as well as
the city’s Facebook page and EngageNewport.com
2.5.3 Plan Maintenance
The Newport Hazard Mitigation Committee, under the leadership of the City Planner, will also evaluate and update the plan annually, after a disaster, as funding opportunities arise for the actions and projects identified in the plan, or as actions are completed in order to re-prioritize. Any updates to the plan will be reviewed and submitted to RIEMA upon local approval. The City Council will involve the public in the plan revision process by holding an annual advertised public meeting to present recommended revisions and solicit input. This plan will be available for public viewing via the city website http://cityofnewport.com/. In addition, the city will initiate actions to satisfy the requirement for a 5-year plan update and FEMA review. The update process will be continuous throughout the life of this plan with the actual updating process to begin in year 3 of this plan and a submission to RIEMA by the end of every fourth year.

32 Planning Process

33 Risk Assessment
3.0 Risk Assessment
3.1 Defining Risk and Methodology The purpose of this section is to provide a comprehensive overview of how various natural hazards can impact Newport, Rhode Island. In this section natural hazards will be ranked in order of priority based on the frequency of occurrence and area of impact affected. Identifying the risk and vulnerability of Newport to natural hazards is the primary factor in determining how to allocate finite resources to determine which mitigation actions are feasible and appropriate. The hazard analysis involves identifying the natural hazards that potentially threaten Newport, and then analyzing them individually to determine the degree of threat that is posed by each hazard. Addressing risk and vulnerability through hazard mitigation measures will reduce societal, economic, and environmental exposure to natural hazard impacts (Rhode Island State Hazard Mitigation Plan 2014).
3.2 Hazards A natural hazard is defined as “an event or physical condition that has the potential to cause fatalities, injuries, property and infrastructure damage, agricultural loss, damage to the environment, interruption of business, or other types of harm or loss” (Rhode Island State Hazard Mitigation Plan 2014). A natural hazard can also be exacerbated by societal behavior and practice, such as building in a floodplain, along a sea cliff or an earthquake fault. Natural disasters are inevitable, but the impacts of natural hazards can, at a minimum, be mitigated or, in some instances, prevented entirely Rhode Island State Hazard Mitigation Plan 2014).
3.2.1 Hazard Identification
The City of Newport 2014 Hazard Mitigation Committee reviewed a multitude of hazards in this strategy. Hazards discussed in this plan were included for a variety of reasons including historical records of past events, repetitive losses, and potential losses as identified by predictive modeling (SLOSH, HAZUS, FIRM) and expert knowledge (urban fire). In order to fulfill the planning guidelines outlined in Section 322 of the Disaster Mitigation Act of 2000 (DMA 2000), this NHMP addresses only
34 Risk Assessment
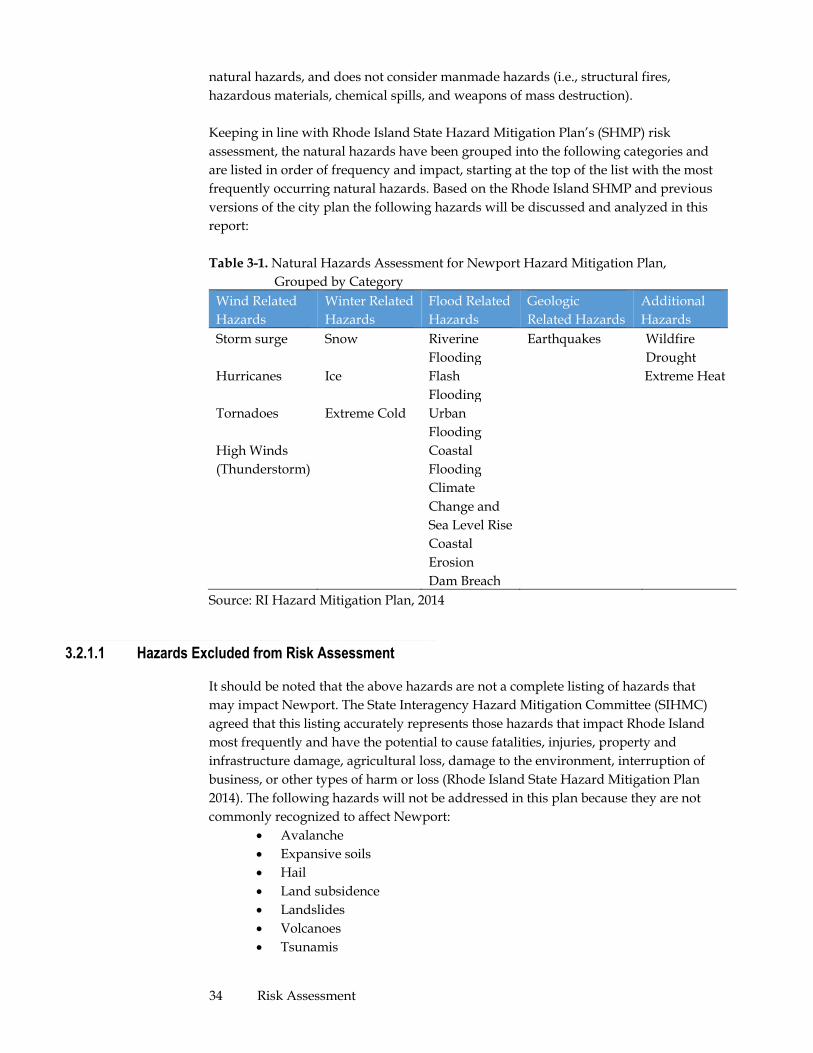
natural hazards, and does not consider manmade hazards (i.e., structural fires, hazardous materials, chemical spills, and weapons of mass destruction). Keeping in line with Rhode Island State Hazard Mitigation Plan’s (SHMP) risk assessment, the natural hazards have been grouped into the following categories and are listed in order of frequency and impact, starting at the top of the list with the most frequently occurring natural hazards. Based on the Rhode Island SHMP and previous versions of the city plan the following hazards will be discussed and analyzed in this report:
Table 3-1. Natural Hazards Assessment for Newport Hazard Mitigation Plan,
Grouped by Category Wind Related Hazards
Winter Related Hazards
Flood Related Hazards
Geologic Related Hazards
Additional Hazards
Storm surge Snow Riverine Flooding
Earthquakes Wildfire Drought
Hurricanes Ice Flash Flooding
Extreme Heat
Tornadoes High Winds (Thunderstorm)
Extreme Cold
Urban Flooding Coastal Flooding
Climate Change and Sea Level Rise
Coastal Erosion
Dam Breach Source: RI Hazard Mitigation Plan, 2014
3.2.1.1 Hazards Excluded from Risk Assessment
It should be noted that the above hazards are not a complete listing of hazards that may impact Newport. The State Interagency Hazard Mitigation Committee (SIHMC) agreed that this listing accurately represents those hazards that impact Rhode Island most frequently and have the potential to cause fatalities, injuries, property and infrastructure damage, agricultural loss, damage to the environment, interruption of business, or other types of harm or loss (Rhode Island State Hazard Mitigation Plan 2014). The following hazards will not be addressed in this plan because they are not commonly recognized to affect Newport:
x Avalanche x Expansive soils x Hail x Land subsidence x Landslides x Volcanoes x Tsunamis

35 Risk Assessment
3.2.1.2 Hazard Probability
The table below provides a generalized probability. Probability of occurrence is further explained for each hazard profile.
Table 3-2 Hazard Probability
Hazard Probability*
(Next 5 Years) (H,M,L)
Wind Related Hazards Medium Winter Related Hazards High Flooding Related Hazards
Medium
Conflagration (Fire) Medium Drought Low Extreme Heat Low Geological Related Hazards (Earthquake)
Low
* High = 90% ‐ 100% chance of occurrence Medium = 10% ‐ 90% chance of occurrence Low = 1% ‐ 10% chance of occurrence
3.2.2 Hazard Profiles
The following subsections present a description of each type of natural hazard Newport may expect to experience, as determined by the Hazard Mitigation Committee.
3.2.2.1 Wind Related Hazards
Description
Wind is the movement of air caused by a difference in pressure from one place to another. Local wind systems are created by the immediate geographic features in a given area, such as mountains, valleys, or large bodies of water. Wind effects can include blowing debris, interruptions in elevated power and communications utilities, and intensification of the effects of other hazards related to winter weather and severe storms (Rhode Island State Hazard Mitigation Plan 2014). Based on historical tornado and hurricane data, FEMA has produced a map that depicts maximum wind speeds for design of safe rooms. Rhode Island is included in Wind Zone II (160 MPH). Rhode Island is also within the Hurricane-Susceptible Region as shown in Figure 3-1 (FEMA 2012). In Newport wind events can produce damage often associated with thunderstorms or tornadoes. In some instances, these events have been associated with weakening tropical weather systems, including downgraded tropical and sub-tropical storm

36 Risk Assessment
systems. This section examines the risks associated with damaging wind events with emphasis on hurricanes, tornadoes, and thunderstorms (Rhode Island State Hazard Mitigation Plan 2014).
Nor’easters, while often a less dramatic storm than a hurricane, are far more frequent in Rhode Island, and can produce considerable damage. On average, one to two nor’easters a year hit Rhode Island with a storm surge equal or greater than two feet. The duration of high surge and winds during a nor’easter can last from 12 hours to three days, while the duration of hurricane conditions generally lasts only six to 12 hours (Rhode Island State Hazard Mitigation Plan 2014).
Location
The Sakonnet River, Mount Hope, Jamestown Verrazano, and Claiborne Pell Newport Bridges are closed when the wind speed reaches 69 miles per hour (Rhode Island Department of Public Safety). When the bridges close, Newport residents are dependent upon the limited number of services available on Aquidneck Island. Consequently, severe wind damage to the buildings in which the island’s businesses are situated could cause major economic and social hardships.

37 Risk Assessment
Tropical cyclones, including hurricanes and tropical storms, impact Rhode Island from the south and southwest during the summer and fall from June 1st through November 30th (Rhode Island State Hazard Mitigation Plan 2014).
Extent
The extent of a flooding event is generally a factor of the causing event. Flash flooding related to a dam failure is best categorized by the rapid speed of onset. Flooding resulting from other storm events such as winter weather, storm surge, and tropical depressions are more appropriately measured by the related scientific scale. Besides the flooding damage from storm surges (see Section 3.2.2.1.a), hurricane winds can knock down structures or rip off roofs. Nor’easters pose the same threat to compromised structures; moreover, if they bring a major snowfall along with heavy wind, the resulting snow drifts could block side streets for days (Rhode Island State Hazard Mitigation Plan 2014). Other hazards posed by high winds include downed power lines, which are lethally dangerous while they continue to carry power. Cable lines can also come down, thereby shutting off communication via telephone and Internet. (“Ice storms” associated with nor’easters are also a threat to utility lines; see Section 3.2.2.1.d) Other
Figure 3-2. Wind risk score for Rhode Island Source: American Society of Civil Engineers
impacts include severe beach erosion, large waves, high winds, flooding, marine over-wash, and loss or injury to life (Rhode Island State Hazard Mitigation Plan 2014). Hurricane- and gale-force winds can also cover roadways with debris, making them impassable to conventional vehicles. This presents a dangerous situation for anyone requiring immediate medical attention (Rhode Island State Hazard Mitigation Plan 2014).

38 Risk Assessment
Previous Occurrences and Probability of Future Events
Over the past century, 15 tropical cyclones (Category H 1-H5) have directly hit or passed near Rhode Island. In addition, numerous other subtropical and tropical storms/depressions pass through Rhode Island each season generating large swells, storm surges and high winds that cause varying degrees of damage to property (Rhode Island State Hazard Mitigation Plan 2014).
The hurricane events that represent much of the wind hazard for Newport are coastal systems. As such, wind hazard areas can be prioritized based on the distance from the coast. Figure 3.2 shows the relative wind hazard ranking for Newport and all of Rhode Island. These rankings are based on the American Society of Civil Engineers (ASCE) Minimum Design Loads for Buildings and Other Structures, ASCE 7-98. The City of Newport is located in the risk Category 4 area. While these storms occur infrequently (rated a medium probability over the next five years), they have the potential to cause large amounts of damage over a widespread area.
3.2.2.1.a Storm Surge
Description Storm surge is the abnormal rise in water level caused by the wind and pressure forces of a hurricane or nor’easter. Nationally, storm surge flooding has caused billions of dollars in damage and hundreds of deaths. Given today's ever increasing population densities in coastal communities, the need for information about the potential for flooding from storm surge has become even more important. Storm surge heights in Rhode Island range from a few feet higher than normal tides during nor’easters to more than 10 feet during hurricanes. The breaking wave height is related to water depth so that as water depth over a given surface increases with storm surge, larger waves can be generated. There are a number of factors that contribute to the generation of storm surge, but the fundamental forcing mechanism is wind and the resultant frictional stress it imposes on the water surface. Winds blowing over a water surface generate horizontal surface currents flowing in the general direction of the wind. These surface currents in turn create subsurface currents which, depending on the intensity and forward speed of the hurricane or nor’easter, may extend from one to several hundred feet below the surface. If these currents are in the onshore direction, water begins to pile up as it is impeded by the shoaling continental shelf causing the water surface to rise. This “dome of water” will increase shoreward until it reaches a maximum height at the shoreline or at some distance inland. The most conducive bathymetry for the formation of large storm surges is a wide gently sloping continental shelf.
3.2.2.1.b Hurricanes
Description
Tropical cyclones, a general term for tropical storms and hurricanes, are low pressure systems that usually form over the tropics. These storms are referred to as “cyclones”

39 Risk Assessment
due to their rotation. Tropical cyclones are among the most powerful and destructive meteorological systems on earth. Their destructive phenomena include very high winds, heavy rain, lightning, tornadoes, and storm surge. As tropical storms move inland, they can cause severe flooding, downed trees and power lines, and structural damage (Rhode Island State Hazard Mitigation Plan 2014). There are three categories of tropical cyclones: 1. Tropical Depression: maximum sustained surface wind speed is less than 39 mph 2. Tropical Storm: maximum sustained surface wind speed from 39-73 MPH 3. Hurricane: maximum sustained surface wind speed exceeds 73 MPH Once a tropical cyclone no longer has tropical characteristics it is classified as an extratropical system (Rhode Island State Hazard Mitigation Plan 2014). Most Atlantic tropical cyclones begin as atmospheric “easterly waves” that propagate off the coast of Africa and cross the tropical North Atlantic and Caribbean Sea. When a storm starts to move toward the north, it begins to leave the area where the easterly trade winds prevail and enters the temperate latitudes where the westerly winds dominate. This situation produces the eastward curving pattern of most tropical storms that pass through the Mid-Atlantic region. When the westerly steering winds are strong, it is easier to predict where a hurricane will go. When the steering winds become weak, the storm follows an erratic path that makes forecasting very difficult (Rhode Island State Hazard Mitigation Plan 2014). Hurricanes are categorized according to the Saffir/Simpson scale (Table 3-3) with ratings determined by wind speed and central barometric pressure. Hurricane categories range from one (1) through five (5), with Category 5 being the strongest (winds greater than 155 MPH). A hurricane watch is issued when hurricane conditions could occur within the next 36 hours. A hurricane warning indicates that sustained winds of at least 74 MPH are expected within 24 hours or sooner (Rhode Island State Hazard Mitigation Plan 2014). Storm surge is the abnormal rise in water level caused by the wind and pressure forces of a hurricane or nor’easter (Rhode Island State Hazard Mitigation Plan 2014). Nationally, storm surge flooding has caused billions of dollars in damage and hundreds of deaths. Given today’s ever-increasing population densities in coastal communities, the need for information about the potential for flooding from storm surge has become even more important. Storm surge heights in Rhode Island range from a few feet higher than normal tides during nor’easters to more than 10 feet during hurricanes. The breaking wave height is related to water depth so that as water depth over a given surface increases with storm surge, larger waves can be generated (Rhode Island State Hazard Mitigation Plan 2014). There are a number of factors that contribute to the generation of storm surge, but the fundamental forcing mechanism is wind and the resultant frictional stress it imposes on the water surface. Winds blowing over a water surface generate horizontal surface currents flowing in the general direction of the wind. These surface currents in turn create subsurface currents, which depending on the intensity and forward speed of the hurricane or nor’easter may extend from one to several hundred feet below the surface.

40 Risk Assessment
If these currents are in the onshore direction, water begins to pile up as it is impeded by the shoaling continental shelf causing the water surface to rise. This “dome of water” will increase shoreward until it reaches a maximum height at the shoreline or at some distance inland. The most conducive bathymetry for the formation of large storm surges is a wide gently sloping continental shelf (Rhode Island State Hazard Mitigation Plan 2014). The magnitude of storm surge within a coastal basin is governed by both the meteorological parameters of the hurricane and the physical characteristics of the basin. The meteorological aspects include:
• Hurricane size - measured by the radius of maximum winds (Measured from the center of the hurricane to the location of the highest wind speeds within the storm. This radius may vary from as little as four (4) miles to as much as 50 miles)
• Hurricane intensity - measured by sea level pressure and maximum surface wind speeds at the storm center
• Hurricane path - or forward track of the storm • Hurricane forward speed
The counterclockwise rotation of a hurricane’s wind field in combination with the forward motion of the hurricane typically causes the highest surge levels to occur to the right of the hurricane’s forward track (Rhode Island State Hazard Mitigation Plan 2014). This phenomenon has been observed in regions where the shoreline is typically straight, not fragmented by large inlets and bays, and when a hurricane travels generally perpendicular to the shore. In Rhode Island, the increased wind stress from the rotational wind field has a large effect on the level of surge. The contribution to surge generation from the forward motion of the storm can be greater than the contribution made by an increase in hurricane intensity (Rhode Island State Hazard Mitigation Plan 2014). The Rhode Island shoreline faces south, so storms passing to the west raise the highest storm surges for Newport. In addition, Narragansett Bay funnels the surge northward where decreasing surface area amplifies the surge height (Boothroyd 2008). The 1938 Hurricane made landfall west of Rhode Island as a Category 3 hurricane with a forward speed in excess of 50 miles per hour. Because the center of the storm made landfall in Connecticut, the Rhode Island shoreline experienced the highest storm surge levels (Rhode Island State Hazard Mitigation Plan 2014). The reduction of atmospheric pressure within the storm system results in another surge-producing phenomenon known as the “inverted barometer” effect. Within the region of low pressure the water level will rise at the approximate rate of 13.2 inches per inch of mercury drop. This can account for a rise of one (1) to two (2) feet near the center of the hurricane. This effect is considered to be a more important factor in the open ocean where there is no depth-related restrictions to water flow (Rhode Island State Hazard Mitigation Plan 2014).

41 Risk Assessment
Location
The entire state of Rhode Island is vulnerable to hurricanes and tropical storms, depending on the storm’s track. The entire perimeter of Newport, including a substantial portion of the western section of the city, is designated as a Zone A Hurricane Evacuation Area. This critical area is largely composed of the Newport Naval Base and tourist attractions along Thames Street and America’s Cup Avenue. Evacuation Zone A areas are recommended for evacuation prior to an expected Category 1 or 2 hurricanes. There are also several portions of inland Newport designated as Evacuation Zone B, which is recommended to be evacuated prior to an expected Category 3 or 4 hurricanes. (Rhode Island Hurricane Evacuation Study 2013).
Extent
Hurricanes are classified by their damage potential according to a scale developed in the 1970s by Robert Simpson and Herbert Saffir, and the classifications were updated slightly by the National Hurricane Center in 2012. The scale is designed to give public officials and the general public usable information on the magnitude of a storm by giving an indication of the potential flooding and wind damages associated with each hurricane category. The scale rates the intensity and effects of hurricanes based on wind speed and barometric pressure measurements as shown in Table 3-3.

42 Risk Assessment
Table 3-3. Saffir/Simpson Scale of Hurricane Intensity, Source: National Weather Service, National Hurricane Center Wind Speed Typical Effects Category 1 Hurricane – Weak
74-95 MPH (64-82kt)
Minimal Damage: Damage is primarily to shrubbery, trees, foliage, and unanchored mobile homes. No real damage occurs in building structures. Some damage is done to poorly constructed signs.
Category 2 Hurricane – Moderate
96-110 MPH (83-95kt)
Moderate Damage: Considerable damage is done to shrubbery and tree foliage, some trees are blown down. Major structural damage occurs to exposed mobile homes. Extensive damage occurs to poorly constructed signs. Some damage is done to roofing materials, windows, and doors; no major damage occurs to the building integrity of structures.
Category 3 Hurricane – Strong
111-130 MPH (96-113kt)
Extensive damage: Foliage torn from trees and shrubbery; large trees blown down. Practically all poorly constructed signs are blown down. Some damage to roofing materials of buildings occurs, with some window and door damage. Some structural damage occurs to small buildings, residences and utility buildings. Mobile homes are destroyed. There is a minor amount of failure of curtain walls (in framed buildings).
Category 4 Hurricane – Very Strong
131-155 MPH (114-135kt)
Extreme Damage: Shrubs and trees are blown down; all signs are down. Extensive roofing material and window and door damage occurs. Complete failure of roofs on many small residences occurs, and there is complete destruction of mobile homes. Some curtain walls experience failure.
Category 5 Hurricane – Devastating
Greater than 155 MPH (135kt)
Catastrophic Damage: Shrubs and trees are blown down; all signs are down. Considerable damage to roofs of buildings. Very severe and extensive window and door damage occurs. Complete failure of roof structures occurs on many residences and industrial buildings, and extensive shattering of glass in windows and doors occurs. Some complete buildings fail. Small buildings are overturned or blown away. Complete destruction of mobile homes occurs.
Previous Occurrences and Probability of Future Events
Rhode Island has experienced tropical depressions and tropical storms as well as hurricanes ranging from Category 1 to Category 3 (Table 3-4) (NOAA 2013). Hurricanes are rare but devastating events in Rhode Island (Rhode Island State Hazard Mitigation Plan 2013). Hurricane wind damages can be costly, but their related storm surge is by far the most destructive force acting on the Rhode Island coast.

43 Risk Assessment
Table 3-4. Hurricane direct hits on the mainland U.S. coastline and individual states by Saffir/Simpson Category 1851-2013
Area Category Major Hurricanes 1 2 3 4 5 All U.S. Coastline (Texas to Maine)
117 76 76 18 3 290 97
Texas 25 19 12 7 0 63 19 North 13 8 3 4 0 28 7 Central 7 5 2 2 0 16 4 South 10 5 7 1 0 23 8 Louisiana 19 15 15 4 1 54 20 Mississippi 2 5 8 0 1 16 9 Alabama 12 5 6 0 0 23 6 Florida 44 33 29 6 2 114 37 Northwest 27 16 12 0 0 55 12 Northeast 13 8 1 0 0 22 1 Southwest 16 8 7 4 1 36 12 Southeast 13 13 11 3 1 41 15 Georgia 12 5 2 1 0 20 3 South Carolina 19 6 4 2 0 31 6 North Carolina 24 13 11 1 0 47 13 Virginia 9 2 1 0 0 12 1 Maryland 1 1 0 0 0 2 0 Delaware 2 0 0 0 0 2 0 New Jersey 2 0 0 0 0 0 0 Pennsylvania 1 0 0 0 0 1 0 New York 6 1 5 0 0 12 5 Connecticut 4 3 3 0 0 10 3 Rhode Island 3 2 4 0 0 9 4 Massachusetts 5 2 3 0 0 10 3 New Hampshire 1 1 0 0 0 2 0 Maine 5 1 0 0 0 6 0 Source: Hurricane Research Division, National Oceanic and Atmospheric Administration, 2013 There have been some devastating historical hurricanes in Rhode Island that have impacted Newport substantially. In the Great New England Hurricane of 1938 Rhode Island suffered an estimated $100 million in property damage and 262 deaths statewide. Newport alone suffered more than $1 million in property damages and six reported deaths (Blaine 2009). The hurricane caused great damage to the South shoreline; the Cliff Walk was partially destroyed and many homes and mansions along Ocean Drive suffered extensive wreckage (Blaine 2009). However, unlike many other towns and cities in Rhode Island, Newport was quick to mobilize its resources to employ relief efforts. The Work Projects Administration, a large New Deal employment agency established during the Great Depression, sent hundreds of men to work for relief projects around the city. The quick response of Newport helped to restore electricity within 24 hours of the hurricane and main streets were open to traffic

44 Risk Assessment
after eight days (Blaine 2009). Newport therefore has successful storm response efforts to draw from in the development of its own Natural Hazard Mitigation Plan. Hurricane Bob struck Rhode Island in 1991 and made landfall over Newport as a Category 2 hurricane. It carried wind gusts up to 100 mph in Newport, drenching the state in seven inches of rain, and four individual tornadoes were reported (Valle and Dion 1998). The winds from the hurricane knocked down trees and utility poles throughout Rhode Island, causing 60% of Rhode Island residents to lose power (Del Santo 2013). Rhode Island was declared a Federal Disaster Area by President George H. W. Bush, and total damages in Southern New England amounted to $680 million (Del Santo 2013). The most recent hurricane to affect Newport and much of the East Coast was Hurricane Sandy in November 2012. By the time Sandy reached Rhode Island it had been reduced to Tropical Storm status, however Rhode Island still experienced a great deal of damage from the storm. Rhode Island sought and received a federal emergency declaration from President Barack Obama prior to the storm to ensure access to funds to assist in the recovery effort. This hurricane left over 122,000 people in Rhode Island without power. In total, Rhode Island received $39.4 million in support from federal disaster relief programs, a majority of which came from NFIP ($31.1 million) (Rhode Island State Hazard Mitigation Plan 2014).
The highest concentration of damage resulting from Hurricane Sandy and its storm surge were located in the southern coastal communities of Newport and Washington Counties (State of Rhode Island Action Plan: Hurricane Sandy Disaster 2013). Newport Harbor was inundated with storm surges of 1-2 meters; the storm surge destroyed houses and businesses, damaged pilings and deck supports, blew out walls on lower levels, and moved significant amounts of sand and debris into homes, businesses, streets, and adjacent coastal ponds. Wind damage left downed trees and branches on homes, businesses, utility lines, and roadways. Utilities at the Newport Housing Authority’s Park Holm Development were damaged. Other impacts included power loss at Martin Luther King Community Center, which provides food assistance and nutritional education to those in need (State of Rhode Island Action Plan: Hurricane Sandy Disaster 2013). Additionally, portions of the famed Cliff Walk were damaged by Tropical Storm Sandy, totaling approximately $2 million in required repairs (Flynn November 6, 2012). Newport municipal officials worked closely with state agencies and FEMA to coordinate debris removal, emergency response, volunteer assistance, infrastructure repairs, damage assessments, and other response efforts (State of Rhode Island Action Plan: Hurricane Sandy Disaster 2013). Following Hurricane Sandy, a Needs Assessment document was developed to gather information on project level needs and to facilitate recovery (State of Rhode Island Action Plan: Hurricane Sandy Disaster 2013). Based on historical frequency of occurrence, Newport may experience a hurricane every four years, or 22.8% annually which can be related to a Medium-Low probability of occurrence. Long-term global climate models under Intergovernmental Panel on Climate Change (IPCC) warming scenarios indicate that it is possible that hurricanes will become more intense, with stronger winds and heavier precipitation through the 21st century.

45 Risk Assessment
3.2.2.1.c Tornadoes
Description
A tornado is a violently rotating column of air in contact with and extending between a cloud and the surface of the earth. Winds in most tornadoes are 100 MPH or less, but in the most violent, and least frequent tornadoes, wind speeds can exceed 250 MPH. Tornadoes typically track along the ground for a few miles or less, and they measure less than 100 yards wide, though some can remain in contact with the earth for well over fifty miles and exceed one (1) mile in width (Rhode Island State Hazard Mitigation Plan 2014). Several conditions are required for the development of tornadoes and the thunderstorm clouds with which most tornadoes are associated. Abundant low level moisture is necessary to contribute to the development of a thunderstorm, and a “trigger” (perhaps a cold front or other low level zone of converging winds) is needed to lift the moist air aloft. Once the air begins to rise and becomes saturated, it will continue rising to great heights and produce a thunderstorm cloud, if the atmosphere is unstable. An unstable atmosphere is one where the temperature decreases rapidly with height. Finally, tornadoes usually form in areas where winds at all levels of the atmosphere are not only strong, and they turn with height in a clockwise, or veering, direction (Rhode Island State Hazard Mitigation Plan 2014). Tornadoes can appear as a traditional funnel shape or in a slender rope-like form. Some have a churning, smoky look to them, and others contain “multiple vortices” – small, individual tornadoes rotating around a common center. Others may be nearly invisible, with only swirling dust or debris at ground level as the only indication of the tornado’s presence (Rhode Island State Hazard Mitigation Plan 2014). A tornado begins in a severe thunderstorm called a supercell. A supercell can last longer than a regular thunderstorm. The wind coming into the storm starts to swirl and forms a funnel. The air in the funnel spins faster and faster and creates a very low pressure area that sucks more air (and possibly objects) into it. The severe thunderstorms that produce tornadoes form where cold dry polar air meets warm moist tropical air. This occurrence is most common in a section of the United States called Tornado Alley (Rhode Island State Hazard Mitigation Plan 2014). Tornadoes can form any time during the year, but most form in May. Northern regions typically experience a later the peak tornado season because it takes longer to warm the northern parts of the plains causing tornadoes form later. Most tornadoes spin cyclonically but a few spin anti-cyclonically. Because there are records of anti-cyclonic tornadoes, scientists do not think that the Coriolis Effect causes the rotations (Rhode Island State Hazard Mitigation Plan 2014). The Fujita scale, introduced in 1971 by Dr. Ted Fujita, provided a way to characterize tornadoes based on the damage they produce and relating that damage to the fastest
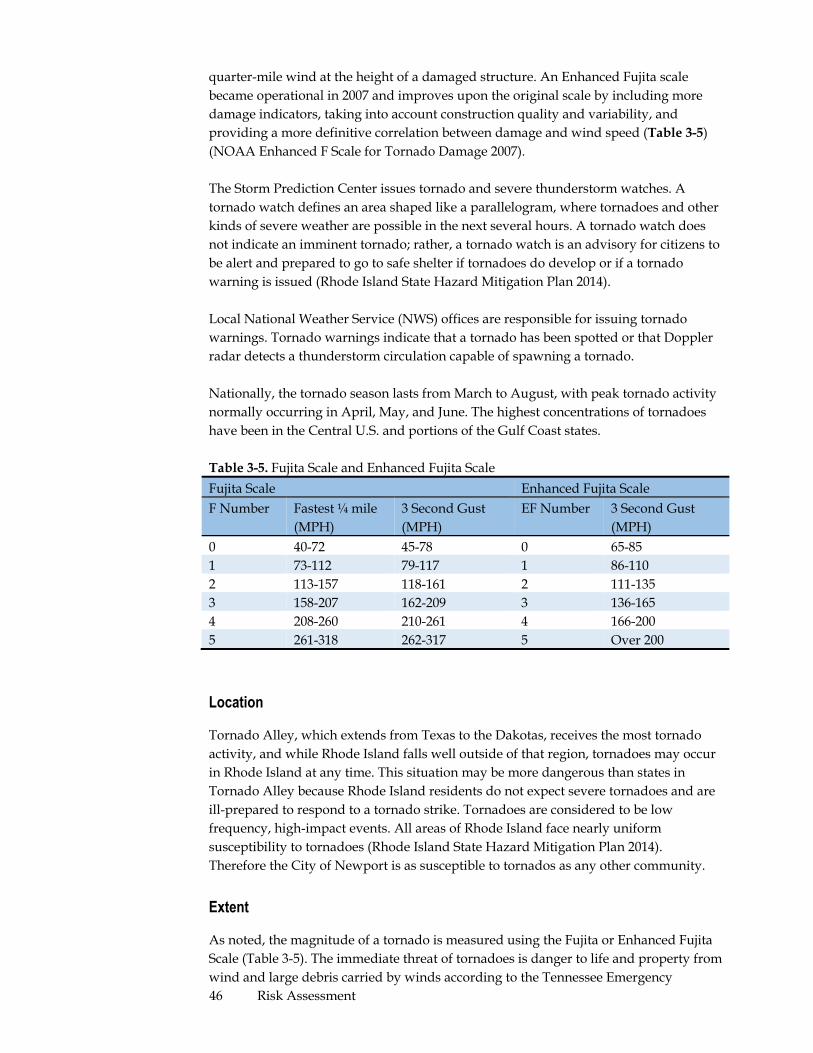
46 Risk Assessment
quarter-mile wind at the height of a damaged structure. An Enhanced Fujita scale became operational in 2007 and improves upon the original scale by including more damage indicators, taking into account construction quality and variability, and providing a more definitive correlation between damage and wind speed (Table 3-5) (NOAA Enhanced F Scale for Tornado Damage 2007). The Storm Prediction Center issues tornado and severe thunderstorm watches. A tornado watch defines an area shaped like a parallelogram, where tornadoes and other kinds of severe weather are possible in the next several hours. A tornado watch does not indicate an imminent tornado; rather, a tornado watch is an advisory for citizens to be alert and prepared to go to safe shelter if tornadoes do develop or if a tornado warning is issued (Rhode Island State Hazard Mitigation Plan 2014).
Local National Weather Service (NWS) offices are responsible for issuing tornado warnings. Tornado warnings indicate that a tornado has been spotted or that Doppler radar detects a thunderstorm circulation capable of spawning a tornado. Nationally, the tornado season lasts from March to August, with peak tornado activity normally occurring in April, May, and June. The highest concentrations of tornadoes have been in the Central U.S. and portions of the Gulf Coast states. Table 3-5. Fujita Scale and Enhanced Fujita Scale Fujita Scale Enhanced Fujita Scale F Number Fastest ¼ mile
(MPH) 3 Second Gust (MPH)
EF Number 3 Second Gust (MPH)
0 40-72 45-78 0 65-85 1 73-112 79-117 1 86-110 2 113-157 118-161 2 111-135 3 158-207 162-209 3 136-165 4 208-260 210-261 4 166-200 5 261-318 262-317 5 Over 200
Location
Tornado Alley, which extends from Texas to the Dakotas, receives the most tornado activity, and while Rhode Island falls well outside of that region, tornadoes may occur in Rhode Island at any time. This situation may be more dangerous than states in Tornado Alley because Rhode Island residents do not expect severe tornadoes and are ill-prepared to respond to a tornado strike. Tornadoes are considered to be low frequency, high-impact events. All areas of Rhode Island face nearly uniform susceptibility to tornadoes (Rhode Island State Hazard Mitigation Plan 2014). Therefore the City of Newport is as susceptible to tornados as any other community.
Extent
As noted, the magnitude of a tornado is measured using the Fujita or Enhanced Fujita Scale (Table 3-5). The immediate threat of tornadoes is danger to life and property from wind and large debris carried by winds according to the Tennessee Emergency
47 Risk Assessment
Management Agency. Other vulnerabilities include electrical utilities, gas lines, and communications infrastructure. Damage to power lines, gas lines, or communication towers has the potential to cause power and communication outages for residents, businesses and critical facilities. In addition to lost revenues, downed power lines and broken gas lines present a threat to personal safety. Further, downed wires and lightning strikes have been known to spark fires. Other critical infrastructure that can be damaged by tornadoes include water mains and sewer systems. Damage to these systems can interrupt drinking water service and cause water contamination if treatment systems fail (Tennessee Emergency Management Agency). A structure’s tornado vulnerability is based in large part on building construction and standards. In general, mobile homes and wood-framed structures are more vulnerable to damage in a tornado than steel-framed structures. Other factors, such as location, condition, and maintenance of trees also plays a significant role in determining vulnerability. Human vulnerability is based on the availability, reception, and understanding of early warnings of tornadoes (i.e. Tornado Warning issued by the NWS) and access to substantial shelter. In some cases, despite having access to technology (computer, radio, television, outdoor sirens, etc.) that allows for the reception of a warning, language differences are sometimes a barrier to full understanding of the risk.
Previous Occurrences and Probability of Future Events
Tornadoes are a rare occurrence in Rhode Island; however, there are records of tornadoes occurring in or close to Rhode Island. The strongest tornado on record in Rhode Island occurred on August 7, 1986 (Del Santo May 21, 2013). An F2 tornado struck Providence County, mostly staying within Providence and Cranston, and caused 20 injuries. Damage costs totaled $5,237,067 (in 2012 dollars) (Del Santo May 21, 2013). While rare in the New England region, a powerful tornado outbreak occurred on June 1, 2011, that spanned southwest and south-central Massachusetts and southern Maine (NOAA 2011). Four tornadoes, one ranked as an EF3, touched down in Massachusetts causing three deaths, over 200 injuries, and cost over $140 million in property damages (Spotts 2011; Turner 2011; Yee 2011). Thus, while uncommon, tornadoes occurring in New England are capable of inflicting substantial damage. In the twenty tornadoes that have touched down in Rhode Island since 1950 only one, a weak F0, touched down east of Newport in 1972 (NOAA Storm Prediction Center). Although no damage was sustained from this tornado, and the probability of future tornados is low, it demonstrates that Newport, like the rest of Rhode Island, is susceptible to the occurrence of tornadoes.

48 Risk Assessment
3.2.2.1.d High Winds (Thunderstorms)
Description
Thunderstorms are formed when the right atmospheric conditions combine to provide moisture, lift, and warm unstable air that can rise rapidly. Thunderstorms occur any time of the day and in all months of the year, but are most common during summer afternoons and evenings and in conjunction with frontal boundaries. The National Weather Service (NWS) classifies a thunderstorm as severe if it produces hail at least one inch in diameter, winds of 58 MPH or greater, or a tornado. About 10% of the estimated 100,000 annual thunderstorms that occur nationwide are considered severe (National Oceanic and Atmospheric Administration, Preparedness Guide). Thunderstorms affect a smaller area compared with winter storms or hurricanes, but they can be dangerous and destructive for a number of reasons. Storms can form in less than 30 minutes, giving very little warning; they have the potential to produce lightning, hail, tornadoes, powerful straight-line winds, and heavy rains that produce flash flooding (Rhode Island State Hazard Mitigation Plan 2014). Wind is the motion of air past a given point caused by a difference in pressure from one place to another. Severe wind poses a threat to Rhode Island in many forms, including that produced by severe thunderstorms and tropical weather systems. The effects can include blowing debris, interruptions in elevated power and communications utilities, and intensified effects of winter weather. Harm to people and animals as well as damage to property and infrastructure may be the result. Two basic types of damaging wind events other than tropical systems affect Rhode Island: synoptic-scale winds and thunderstorm winds. Synoptic-scale winds are high winds that occur typically with cold frontal passages or Nor’easters. When thunderstorm winds exceed 58 MPH, the thunderstorm is considered severe and a warning is issued. “Downbursts” cause the high winds in a thunderstorm. Downburst winds result from the sudden descent of cool or cold air toward the ground. As the air hits the ground, it spreads outward, creating high winds. Unlike tornadoes, downburst winds move in a straight line, without rotation. The term “microburst” refers to a small downburst with damaging winds up to 168 MPH and less than 2.5 miles in length. The term “macroburst” refers to a large downburst that can extend greater than 2.5 miles with winds up to 134 MPH and can last 5 to 30 minutes (Rhode Island State Hazard Mitigation Plan 2014). All thunderstorms produce lightning, and therefore all thunderstorms are dangerous. Lightning often strikes outside of areas where it is raining and may occur as far as 10 miles away from rainfall. It can strike from any part of the storm and may even strike after the storm has seemed to pass. Hundreds of people across the nation are injured annually by lightning, most commonly when they are moving to a safe place but have waited too long to seek shelter. Lightning strike victims often suffer long-term effects such as memory loss, sleep disorders, weakness and fatigue, chronic pain, depression, and muscle spasms. Lightning has the potential to start both house fires and wildfires. Lightning causes an average of 55-60 fatalities, 400 injuries, and over $1 billion in insured losses annually nationwide (Rhode Island State Hazard Mitigation Plan 2014).

49 Risk Assessment
Hail is formed in towering cumulonimbus clouds (thunderheads) when strong updrafts carry water droplets to a height at which they freeze. Eventually, these ice particles become too heavy for the updraft to hold up, and they fall to the ground at speeds of up to 120 MPH. Hail falls along paths called swaths, which can vary from a few square acres to up to 10 miles wide and 100 miles long.1 Hail larger than 0.75 inch in diameter can do great damage to both property and crops, and some storms produce hail over two inches in diameter. Hail causes about $1 billion in damages annually in the U.S. (Rhode Island State Hazard Mitigation Plan 2014).
Location
All areas of Rhode Island are vulnerable to severe thunderstorms and winds, especially those along the Atlantic coast in Washington and Newport counties, and those areas located on Narragansett Bay. New England, with Rhode Island in particular, has a low incidence of lightening-related fatalities and damages (Figure 3-3) (National Lightning Safety Institute, 1990-2003).
Figure 3-3. Number of lightning deaths in the United States, 2005-2014 Source: National Lightning Safety Institute, NOAA.
Extent
There is no universally accepted standard for measuring the strength or magnitude of a lightning storm. Similar to modern tornado characterizations, lightning events are often measured by the damage they produce. Building construction, location, and nearby trees or other tall structures will have a large impact on how vulnerable an individual facility is to a lightning strike. A rough estimate of a structure’s likelihood of being struck by lightning can be calculated using the structure’s ground surface
T�1 University Corporation for Atmospheric Research, http://www.ucar.edu/communications/factsheets/Hail.html.

50 Risk Assessment
area, height, and striking distance between the downward-moving tip of the stepped leader (negatively charged channel jumping from cloud to earth) and the object.2 In general, buildings are more likely to be struck by lightning if they are located on high ground or if they have tall protrusions such as steeples or poles which the stepped leader can jump to. Electrical and communications utilities are also vulnerable to direct lightning strikes. Damage to these lines has the potential to cause power and communication outages for businesses, residencies, and critical facilities. Newport has an additional vulnerability to coastal storms because of the numerous boats that are docked and moored in Newport Harbor. Strong winds from coastal storms can cause extensive damage to these coastal properties; in 1984, a gale wind caused over $5 million worth of damage to moored and docked boats in the harbor (Newport Comprehensive Land Use Plan, 2004). Structure vulnerability to hail is determined mainly by construction and exposure. Metal siding and roofing is better able to stand up to the damages of a hailstorm than many other materials, although it may also be damaged by denting. Exposed windows and vehicles are also susceptible to damage. Crops are extremely susceptible to hailstorm damage, as even the smallest hail stones can rip apart unsheltered vegetation. Human vulnerability is largely determined by the availability and reception of early warnings for the approach of severe storms, and by the availability of nearby shelter. Swimming, boating, and fishing are particularly dangerous during periods of frequent lightning strikes, which can also cause power outages, topple trees, and spark fires. Individuals who immediately seek shelter in a sturdy building or metal-roofed vehicle are much safer than those who remain outdoors. Early warnings of severe storms are also vital for aircraft flying through the area.
Previous Occurrences and Probability of Future Events
The probability of future events is considered medium. Rhode Island does not experience severe thunderstorms with the same frequency as the Midwestern and Southeastern states, but there has been a number of destructive wind, hail, and lightning events in recent history (Rhode Island State Hazard Mitigation Plan 2014). The National Climate Data Center (NCDC) has recorded 151 significant (those causing injury, fatalities, and/or damage) lightning and hail events and 344 high wind events, and these events have caused more than $15.5 million in total damage. One death as a result of lightning was recorded on August 11, 2004, in Washington County. Eleven additional injuries have been recorded since 1956 due to lightning. Some of the most significant wind and lightning events in the state’s history are listed in Table 3-6.
T�2 Hasbrouck, P.E. Determining the Probability of Lightning Striking a Facility, National Lightning Safety Institute,
http://lightningsafety.com/nlsi_lhm/prbshort.html (April 2004).

51 Risk Assessment
Table 3-6. Significant National Climate Data Center hail, lightning, and wind events Date HIRA Type County Property Damage (Inflated to
2012 dollars) 12/23/1994 Wind Statewide $7,746,053 8/5/1994 Lightning Providence $774,605 8/24/1996 Wind Washington $1,097,481 6/22/1997 Lightning Kent $357,621 6/17/2001 Lightning Kent $357,621 8/21/2004 Wind Providence $194,460 10/28/2006 Wind Kent $170,828 6/9/2011 Wind Providence $255,173 6/25/2012 Lightning Providence $150,000 On average, Newport annually experiences approximately 21 thunderstorms, mainly in August, September, and October (Newport Comprehensive Land Use Plan, 2004). Most of these thunderstorms are mild to moderate, but every five to ten years Newport may experience more severe storms with gale force winds or actual hurricanes (Newport Comprehensive Land Use Plan 2004). As indicated by the data in Table 3-7, lightning can pose a risk of personal and property damage in Rhode Island. Examples of effects from recent thunder storms include an incident on September 3, 2013, when a series of thunderstorms traveled through Rhode Island causing more than 5,000 people to be without power. Also, lightning struck a South Kingstown fire station twice, although no injuries were reported (Providence Journal September 2013). While lightning strikes are uncommon, they still occur. In 2012 in the northwestern town of Glocester, three children were indirectly struck by lightning while playing in a yard (Boston.com July 2012). Table 3-7. Lightning Strike Casualties and Damage Reports State Causalities Damage 1960s 1970s 1980s 1990-94 1960s 1970s 1980s 1990-94 Connecticut 13 29 25 11 70 75 79 28 Maine 51 26 19 23 91 48 64 45 Massachusetts 104 101 74 39 166 174 178 57 New Hampshire
14 14 37 11 60 40 64 33
Rhode Island 12 8 25 1 31 40 38 10 Vermont 18 7 3 2 74 27 15 33
3.2.2.2 Winter Related Hazards
Description
Snow A heavy snow is generally defined as having more than eight inches of accumulation in less than 24 hours. Heavy snow can bring a community to a standstill by inhibiting

52 Risk Assessment
transportation, knocking down trees and utility lines, and by causing structural collapse in buildings not designed to withstand the weight of the snow. Repair and snow removal costs can be significant and surpass annual municipal salt and snow removal budgets, often before the end of the season. A winter storm warning is issued when snowfall is expected to accumulate more than four inches in 12 hours and/or a quarter inch or more of freezing rain accumulation (Rhode Island State Hazard Mitigation Plan 2014). The storm radius of a nor’easter is often as large as 1,000 miles, and the horizontal storm speed is about 25 miles per hour, traveling up the eastern United States coast. Sustained wind speeds of 10-40 MPH are common during a nor’easter, with short-term wind speeds gusting up to 70 MPH. Unlike hurricanes and tropical storms, nor’easters can sit off shore, causing damage for days. Nor’easters are a common winter occurrence in New England and repeatedly result in flooding, various degrees of wave and erosion-induced damage to structures, and erosion of natural resources, such as beaches, dunes and coastal bluffs. The erosion of coastal features commonly results in greater potential for damage to shoreline development from future storms (Rhode Island State Hazard Mitigation Plan 2014).
Nor’easters cause varying amounts of coastal erosion depending on the intensity and the duration of the storm; the tidal phase at the time of the storm (neap or spring tide); the path of the storm; and the time interval between storms (Rhode Island State Hazard Mitigation Plan 2014). Back-to-back storms do not allow time for the beaches and dunes to recover sand that has been transported offshore. Damages resulting from nor’easters are often due to coastal erosion and undermining the structures that were previously behind the dunes or on the top of coastal bluffs. Damages to a house that topples off an embankment are usually much more costly than damages resulting from localized areas of flooding (Rhode Island State Hazard Mitigation Plan 2014). Ice The term “ice storm” is used to describe occasions when damaging accumulations of ice are expected during freezing rain situations. Ice storms result from the accumulation of freezing rain, which is rain that becomes super-cooled and freezes upon impact with cold surfaces. Freezing rain most commonly occurs in a narrow band within a winter storm that is also producing heavy amounts of snow and sleet in other locations. If extreme cold conditions are combined with low/no snow cover, the cold can better penetrate downward through the ground and potentially create problems for underground infrastructure as well. When utilities are affected and heaters do not work, water and sewer pipes can freeze and even rupture (Rhode Island State Hazard Mitigation Plan 2014). Extreme Cold Extreme cold may accompany winter storms, be left in their wake, or can occur without storm activity. Extreme cold can lead to hypothermia and frostbite, which are both serious medical conditions. The definition of an excessively cold temperature varies according to the normal climate of a region. In areas unaccustomed to winter weather, near freezing temperatures are considered “extreme cold.” In Rhode Island,

53 Risk Assessment
extreme cold usually involves temperatures below zero degrees Fahrenheit (Rhode Island State Hazard Mitigation Plan 2014).
The wind chill index attempts to quantify the cooling effect of wind with the actual outside air temperature to determine a wind chill temperature that represents how cold people and animals feel, based on the rate of heat loss from exposed skin. A wind chill index of -5 indicates that the effects of wind and temperature on exposed flesh are the same as if the air temperature alone were five (5) degrees below zero (0), even though the actual temperature could be much higher. The NWS issues a wind chill advisory when wind chill temperatures are potentially hazardous and a wind chill warning when the situation can be life-threatening (Rhode Island State Hazard Mitigation Plan 2014).
Location
Newport, Rhode Island, lies outside the heavy snow regions of the northeast. Located along the southern New England coast, Newport has a maritime climate that is cooler in the summer and warmer in the winter than many inland locations. As a result, Newport experiences less snowfall, on average, than cities to the northwest. During an average year, coastal regions of Rhode Island receive nearly 36 inches of snow. Conversely, Worcester, Massachusetts, receives over 67 inches of snow annually. Severe winter storms are spatially expansive. While individual locations can receive varying amounts of snow in a single event, few areas escape the impact entirely. Within the City of Newport, the immediate coastal areas may experience slightly less snow than inland areas. However, local terrain, combined with the size and variability of individual storms makes it difficult to assign relative rankings to the snow and ice hazard.
Extent
Often, winter storms are defined by their components such as wind, snow, ice, and the resultant impact on visibility. The National Weather Service defines a blizzard as a storm that contains a large amount of snow, with winds in excess of 35 mph, and visibility of less than ¼ mile for an extended period of time. In the northeastern United States, the term nor’easter is used to describe storm events that have northeasterly winds that blow in from the ocean. While the winds from nor’easters are not as powerful as hurricane winds, their wind gusts can approach hurricane force, which means nor’easters also have the potential to tear off roofs and topple structures. If a nor’easter hits the coast as a blizzard, the ensuing snowfall can collapse weak roofs, as well. The winds also produce storm surges that, because nor’easters are prolonged events, can continue through multiple high tides – the period when the threat of flooding is greatest along an island such as Aquidneck Island. The National Weather Service defines ice storm as a storm which results in the accumulation of at least 0.25 inch of ice on exposed surfaces. Additionally, the Northeast Snowfall Impact Scale (NESIS) developed by Paul Kocin and Louis Uccellini of the National Weather Service characterizes and ranks high‐impact Northeast snowstorms. These storms have large areas of 10 inch snowfall

54 Risk Assessment
accumulations and greater. NESIS has five categories: Extreme, Crippling, Major, Significant, and Notable shown in Table 3‐8. The index differs from other meteorological indices in that it uses population information in addition to meteorological measurements. Thus NESIS gives an indication of a stormʹs societal impacts.

55 Risk Assessment
Table 3‐8. NESIS Categories Category NESIS Value Description
1 1—2.499 Notable 2 2.5—3.99 Significant 3 4—5.99 Major 4 6—9.99 Crippling 5 10.0+ Extreme
Loss of power and internet communication resulting from an ice storm may present a very dangerous situation. Furnaces and pellet stoves require electricity to function and the temperatures following winter nor’easters typically plunge as cold fronts sweep in behind the departing weather system.
Previous Occurrences and Probability of Future Events
The probability of future winter related events is considered high. Winter weather events in Rhode Island can be described as unpredictable. Days of frigid, arctic air and below freezing temperatures may be followed by days of mild temperatures in the 40s or 50s. Snowfall and rainfall vary; however, Rhode Island residents can expect to experience several nor’easters, which usually bring coastal erosion and a possibility for blizzard conditions or heavy rainstorms dependent on the temperature (Rhode Island State Hazard Mitigation Plan 2014). The worst nor’easter to strike Rhode Island in the last 100 years was the Blizzard of 1978, which had extreme impacts on Rhode Island. Snow accumulation reached 3 to 4 feet and wind speeds exceeded 60 miles per hour. Abandoned cars caused the interstate highways to shut down and more than 10,000 people were stranded on roads and highways throughout the state. In Rhode Island 26 deaths and 232 injuries were attributed to the storm and damage totaled $15 million (Strauss, NOAA). The blizzard of 1978 is still regarded as the storm of the century and is the storm to which all subsequent storms are compared. Newport received 28 inches of snow while areas in the rest of the state got upwards of 40 inches (Weisman 2012). Aside from the snow removal and power restoration that the City undertook after the storm, aftereffects also included looting of parked cars and closed businesses (Weisman 2012). More recently Rhode Island experienced a powerful nor’easter in January 2015, (unofficially known as Winter Storm Juno). The event resulted in a presidential disaster declaration being issued in April 2015. The preliminary damage assessment for the state was approximately $5 million. Juno resulted in 16 inches of snow. The high winds accompanying the storm severely damaged a replica of a Revolutionary War tall ship known as the USS Providence. In February 2013, Newport experienced a storm known unofficially as Winter Storm Nemo. Governor Lincoln Chafee declared a state of emergency in Rhode Island and enacted a state travel ban that lasted nearly 24 hours (Rapoza 2013). National Grid estimated more than 180,000 customers lost power. By Saturday night, 129,000 customers in Rhode Island remained without power, with Bristol and Newport counties suffering the majority of the outages. Rhode Island received $1 million in reimbursements from the Federal Emergency Management System (FEMA) for snow removal costs from the storm (Cicilline 2014).

56 Risk Assessment
Data from The National Climatic Data Center (NCDC) suggest that any county in Rhode Island can anticipate between two to six significant winter weather events per winter season. Between the years of 1999-2012, Newport County experienced the fewest number of significant winter weather events (39) than any other Rhode Island county in that timeframe, with Providence County experiencing the highest frequency of events (139). Newport allots $50,000 in overtime pay for snow removal workers and $133,625 for utilities and supplies and materials for each winter storm season (City of Newport 2013-2014 budget). Table 3-9. Historical Nor’easter Losses for Rhode Island Year Deaths Total Losses (Actual) 1888 400+ Unknown 1978 99 $202M 1991 33 $200M 1992 19 $1,000-2,000M 1993 270 $3,000-6,000M 1996 187 $3,000M
3.2.2.3 Flooding Related Hazards
Description
A flood, which can be slow or fast rising but generally develops over a period of days, is defined by the National Flood Insurance Program (NFIP) as:
x A general and temporary condition of partial or complete inundation of two or more acres of normally dry land area or of two or more properties from: overflow of inland or tidal waters; unusual and rapid accumulation or runoff of surface waters from any source; or a mudflow; or
x The collapse or subsidence of land along the shore of a lake or similar body of water as a result of erosion or undermining caused by waves or currents of water exceeding anticipated cyclical levels that result in a flood as defined above.
By their very nature, floodplains are the low, flat, periodically flooded lands adjacent to rivers, lakes, and oceans, and are subject to geomorphic (land-shaping) and hydrologic (water flow) processes. It is only during and after major flood events that the connections between a river and its floodplain become more apparent. These areas form a complex physical and biological system that not only supports a variety of natural resources but also provides natural flood and erosion control. In addition, the floodplain represents a natural filtering system, with water percolating back into the ground and replenishing groundwater. When a river is divorced from its floodplain with levees and other flood control structures, natural benefits are either lost, altered, or significantly reduced.

57 Risk Assessment
Riverine Flooding
Riverine flooding is a function of precipitation levels (both rain and snow) and water runoff volumes within the stream or river. Riverine flooding is defined as the periodic occurrence of overbank flows of rivers or streams resulting in partial or complete inundation of the adjacent floodplain. The recurrence interval of a flood is defined as the average time interval, in years, expected to take place between the occurrence of a flood of a particular magnitude to an equal or larger flood. Flood magnitude increases with increasing recurrence interval. When land next to or within the floodplain is developed, these cyclical floods can become costly and dangerous events.
Flash Flooding
A flash flood is the fastest-moving type of flood. It happens when heavy rain collects in a stream or gully, turning the normally calm area into an instant rushing current. Any flood involves water rising and overflowing its normal path. A flash flood is a specific type of flood that appears and moves quickly across the land with little warning, making it very dangerous. Flash floods are the result of heavy rainfall concentrated over one area. Most flash flooding is caused by slow-moving thunderstorms, thunderstorms that repeatedly move over the same area or heavy rains from hurricanes and tropical storms. Dam failures can create the most damaging flash flood events. When a dam or levee breaks, a large quantity of water is suddenly let loose downstream, potentially destroying anything in its path. Flash flood waters move at very fast speeds. They have the power to move boulders, tear out trees, destroy buildings, and obliterate bridges. Walls of water can reach heights of 10' to 20', and generally carry a huge amount of debris with them. The best response to any signs of flash flooding is to move immediately and quickly to higher ground.
Urban Flooding
Urban flooding occurs where there has been development within stream floodplains. This situation has developed partly as a result of the use of waterways for transportation purposes in earlier times. Sites adjacent to rivers and coastal inlets provided convenient places to ship and receive commodities. Floodways and wetlands, which are the natural storage basins for flood waters, were filled to accommodate development. The price of this accessibility to the rivers was increased flooding of those urban areas. Urbanization increases the magnitude and frequency of floods by increasing impermeable surfaces, increasing the speed of drainage collection, reducing the carrying capacity of the land, and, occasionally, overwhelming sewer systems. The most common result from these flooded areas is poor or insufficient stormwater drainage, high groundwater levels, and high percentage of impervious surfaces which prevent groundwater recharge. More often than not, when heavy rains occur, Rhode Island’s aging sewer systems (or combined sewer overflows – CSOs) are overrun, resulting in raw sewage flowing into Narragansett Bay, often creating closures to bay shell fishing and swimming.

58 Risk Assessment
Coastal Flooding
Coastal flooding is typically a result of storm surge and wind-driven waves, which erode the coastline. These conditions are produced by hurricanes (tropical storms) during the summer and fall, and nor’easters and other large coastal storms (extra-tropical storms) during the fall, winter, and spring. Storm surges may overrun barrier islands and push sea water up coastal rivers and inlets, blocking the downstream flow of inland runoff. Thousands of acres of crops and forest lands may be inundated by both saltwater and freshwater. Escape routes, particularly from barrier islands, may be cut off quickly, stranding residents in flooded areas and hampering rescue efforts.
Location
Within the established flood risk areas in Newport, certain regions are more susceptible to damaging floods than others. In order to identify such regions, the Newport flood risk areas can be prioritized based on a relative flood risk ranking. The relative risk rankings presented in Table 3-10 are based on the FEMA flood zones. Zone VE designates areas along coasts subject to inundation by a 1-percent-annual-chance flood event in addition to storm-induced velocity wave action. Such areas require mandatory flood insurance. Zones A, AE, AH, & AO are also subject to inundation by the 1-percent-annual-chance flood event and also require mandatory flood insurance. However, regions in these zones are susceptible to shallow flooding from ponding and/or sloping terrain. The Zone X designation is given to those areas subject to flooding by severe, concentrated rainfall coupled with poor drainage systems. Developed flood plain hazards of Newport include the Newport Harbor waterfront, Washington and Thames Streets, the area north of Easton Pond along Ellery Road, the area north of Almy Pond, and Goat Island (Newport County Flood Study, 2013). The terrain of Newport consists of gently rolling hills, with a ma3ximum elevation of 150 feet in the northern portion of the city. The coast is mostly rocky cliffs interspersed with several swamps and sand beaches (Newport County Flood Study, 2013). Several coastal areas are protected by seawalls, including areas of Ocean Drive (Newport County Flood Study, 2013). Table 3-10. Newport Flood Hazard Risk Score FEMA Flood Zone Risk Scores VE Zones 5 A and AE Zones 4 AH and AO Zones 3 X Zone 2 Remainder of the City 1
Extent
Populations and property are extremely vulnerable to flooding. Homes and business may suffer damage and be susceptible to collapse due to heavy flooding. Floodwaters can carry chemicals, sewage, and toxins from roads, factories, and farms; therefore, any

59 Risk Assessment
property affected by a flood may be contaminated with hazardous materials. Debris from vegetation and manmade structures may also be hazardous following a flood. In addition, floods may threaten water supplies and water quality and initiate power outages. Water damage that homeowners and businesses face after flooding can also be an issue. If water damage is not addressed quickly following flood events, which may be the case after significant floods, the likelihood of mold contamination greatly increases (Brandt et al. 2006). Molds are ubiquitous in nature and grow indoors and outdoors, however, moist environments created post-flooding provide optimal mold growth conditions (Brandt et al. 2006). While undisturbed mold is not a substantial health hazard for most people, it can be hazardous to people with conditions such as impaired host defenses or mold allergies (Brandt et al. 2006). The extent of a flood hazard varies by location and type of flooding. Since there is no universally accepted scale associated with this hazard, in order to appropriately quantify and given the number of flooding events the City has experienced, the most severe flood of record occurred as a result of the 1938 Hurricane. The combination of high wind driven storm surge and 2 day rainfall peaking at a rate of approximately 1 inch per hour resulted in flood depths up to 11.58 feet. Coastal areas are most at risk from flooding caused by hurricanes, tropical storms, and nor’easters. Low-lying coastal areas in close proximity to the shore, sounds or estuaries are exposed to the threat of flooding from storm surge and wind-driven waves, as well as from intense rainfall. Areas bordering rivers may also be affected by large discharges caused by heavy rainfall over upstream areas. Inland areas are most at risk from flash flooding caused by intense rainfall over short periods of time. Stream flow tends to increase rapidly. Large amounts of impervious surfaces in urban areas increase runoff amounts and decrease the lag time between the onset of rainfall and stream flooding. Manmade channels may also constrict stream flow and increase flow velocities. In the future, more intense rainfall, the result of climate change, is likely to increase peak flooding, particularly in urban environments. The magnitude of this increase is dependent on the level and rate of greenhouse gas emissions through the end of the century.
Previous Occurrences and Probability of Future Events
Newport has few streams and brooks on the island so its primary flood vulnerabilities stem from coastal flooding from storms such as hurricanes and nor’easters. However, Newport’s entire coastline is vulnerable to high tides and wave action during severe storms. The flood zones of the western side of the island extend relatively far inland, making this side of the island slightly more vulnerable to coastal flooding then the eastern side. The flood zones on the eastern side of Newport do not extend as far inland because of the generally rocky and steep shoreline (Newport Comprehensive Land Use Plan, 2004). The Great New England Hurricane of 1938 and Hurricane Carol in 1954 were severely damaging hurricanes that caused extensive coastal flooding in southern New England (National Oceanic and Atmospheric Administration - NOAA)). Hurricane Carol

60 Risk Assessment
produced a powerful storm surge of 14.4 feet in Narragansett Bay, which surpassed the surge created by the Hurricane of 1938. Flooding hastens coastal erosion, and areas such as Easton’s Beach and Sachuest Beach suffered erosion and sand dune damage after Hurricane Sandy (Gills 11/6/2012). Continuing flood losses during the last 30 years have shifted the federal government’s focus from flood “control” to flood “management.” The goal of flood management is to prevent loss of life and damage to public and private property by reducing the effects of flood damage and forming effective plans for recovery and rehabilitation. The change from flood control to flood management resulted in revisions and improvements to federal policies. One major impetus was flood hazard mapping. The development of Special Flood Hazard Area (SFHA) maps was the first comprehensive attempt to identify flood hazard risk in the nation’s floodplains. This effort began in 1968, with the passage of the NFIP Act by Congress. The program’s intent is to reduce future damage and to provide protection for property owners from potential losses. Flood insurance is made available in communities participating in the NFIP. Policyholders pay premiums that are based on the level of flood risk at an identified location in the community. To accurately identify the risk, FEMA produces Flood Insurance Rate Maps (FIRMs) that show areas subject to flooding. The flood risk information presented on the FIRMs is based on historic, hydrologic, and hydraulic data, as well as on open-space conditions, flood-control works, and development. A 100-year flood is not a flood that occurs every 100 years. In fact, the 100-year flood has a 26% chance of occurring during a 30-year period, the typical length of many mortgages. The 100-year flood is a regulatory standard used by federal agencies, states, and NFIP-participating communities to administer and enforce floodplain management programs. The 100-year flood is also used nationwide by the NFIP as the basis for insurance requirements. The main recurrence intervals used on the FIRMS are shown in Table 3-11. In those FEMA SFHAs or velocity zones (V-Zones) where there are armored shorelines, or any other manmade structures impeding the beaches’ natural process of sediment transport, there is a greater likelihood of coastal flooding as the beaches erode and can no longer protect these areas from flooding. Table 3-11. Annual Probability Based on Flood Recurrence Intervals
Flood Recurrence Interval Annual Chance of Occurrence
10-yr 10.0% 50-yr 2.0%
100-yr 1.0% 500-yr 0.2%
Flooding is the most prevalent and frequent natural hazard that impacts the state. Although there is no distinct flood season in Rhode Island and major river flooding can occur in any month of the year, NOAA has studied a number of past floods from

61 Risk Assessment
the 1990s to 20003 and has noted three times of the year of particular importance with regard for the potential of flood activity to occur:
x Late winter/spring melt x Late summer/early fall x Early winter
The geography and location of Newport makes the city susceptible to some level of flooding every year. However, in the context of hazard mitigation, the probability of a damaging flood event is considered medium.
3.2.2.3.a Climate Change
Based on the NOAA Technical Report NESDIS 142-1, Regional Climate Trends and Scenarios for the U.S. National Climate Assessment: Climate of the Northeast, two climate model simulations have been developed that project the effects of high and low greenhouse gas emission scenarios. Analyses of the simulated future climate are provided for the periods of 2021-2050, 2041-2070, and 2070-2099, with changes calculated with respect to a historical climate reference period (1971-1999, 1971-2000, or 1980-2000) (NOAA TR NESDIS 142-1). The resulting climate change conditions are to be viewed as scenarios, not forecasts, and there no explicit or implicit assumptions about the probability of either scenario (NOAA TR NESDIS 142-1). Key findings of the simulated climate models are as follows:
x Models indicate an increase in temperature for all three future periods, with little spatial variation. Changes along coastal areas, such as Newport, are slightly smaller than inland areas.
x Simulated temperature changes are similar in value for the high and low emissions scenarios for the near future, whereas late in the 21st century the high emissions scenario indicates nearly twice the amount of warming.
x The range of model-simulated temperature changes is substantial, indicating substantial uncertainty in the magnitude of warming associated with each scenario. However, in each scenario, the modeling is unequivocal and large compared to historic variations.
x Increases in the number of days with a maximum temperature above 95ºF are simulated to occur throughout the northeast, with the largest increases occurring in the southern and western areas.
x Simulated decreases in the average annual number of days with a minimum temperature below 10ºF are largest (21 days or more) in northern areas. Decreases in the number of days with a minimum temperature below 32ºF are 20-23 days across most of the region.
x The freeze-free season is simulated to lengthen by at least 19 days across the region by mid-21st century. Simulated increases in most areas are 3-4 weeks.
x The far northern regions show the largest simulated increases in average annual precipitation, while southern and coastal areas show less of an increase. Models are mostly in agreement that precipitation will increase over the entire
T�3 Source: NOAA, A river and Flash Flood Climatology of Southern New England: Results From 1994-2000, website:
http://www.erh.noaa.gov/box/flood%20climatology.htm.

62 Risk Assessment
region under these scenarios. Simulated seasonal changes are mostly upward in winter, spring, and fall, and downward in summer.
x All areas see simulated increases in the number of days with precipitation totals exceeding 1 inch, with the greatest increases (up to 30%) occurring in parts of New York. The simulated increases are statistically significant in most northern areas.
x Most models do not indicate a statistically significant change in temperature (with respect to 2001-2010) for the near future; however, as the time period increases a greater number of models simulate statistically significant temperature changes, with all being significant at the 95% confidence level by 2055 (for the high emission scenario).
Theses modeled scenarios of hotter weather and increased precipitation, along with current climate trends such as increased sea level rise will affect Newport in the long term. Increased precipitation can lead to inland flooding and potentially cause issues, such as dam breach of the drinking water reservoir, which already is deemed a high hazard. Conversely, hotter weather can lead to drought-like conditions and strain Newport’s drinking water supply. The rise in sea level will intensify coastal erosion and damage vulnerable areas such as Hazards Beach and Kings Point Park. Based on the actions outlined in this natural hazard mitigation plan, Newport will be better prepared to respond to and mitigate the effects of climate change.
3.2.2.3.b Coastal Erosion
Description
Coastal zones are dynamic areas that are constantly undergoing change in response to a multitude of factors, including Sea Level Rise (SLR), wave and current patterns, hurricanes, coastal flooding and human influences. High winds and associated marine flooding from storm events such as hurricanes, nor’easters, flooding, and SLR, increase the risk exposure along developed coastal lands. Storm impacts and long-term erosion threatens developed areas with potential loss of life and billions of dollars in property damage. In addition to the natural processes that cause erosion, human alterations are affecting erosion rates. Erosion has been wearing away bluffs and moving beaches and barriers along the U.S. coastal and Great Lakes shores from the powers of flooding, storm surge, rising sea levels, and high surf. As shorelines retreat inland, waterfront homes, public infrastructure, such as roads, bridges, wastewater treatment facilities, and stormwater drainage systems, eventually become severely damaged. The Heinz Center report on the “Evaluation of Erosion Hazards” predicts that over the next 60 years erosion may claim one out of four houses within 500 feet of the U.S. shoreline. Most of the damage will occur in low-lying areas – areas also subject to the highest risk of flooding. Additional damage will also occur along coastal bluffs as waves reach higher on the shoreline and erode the toe of the bluff and gravity takes its course. The beaches, barrier spits and coastal bluffs of Rhode Island are vital economic, environmental, and cultural resources. A healthy, wide sandy beach provides protection against the effects of storm surge, coastal flooding, and high surf impacts. The beach and barrier environment provides habitat for marine and terrestrial

63 Risk Assessment
organisms with beach dependent life stages and is home to species of indigenous and endemic Rhode Island plants. Beaches, barrier spits, and coastal bluffs are also the basis for the tourism industry, exceeding by a factor of three all other industries combined when providing direct income to the state. Rhode Island’s beaches and barriers serve as natural protective buffers between the ocean and the land. During storm events, a beach is able to modify its slope and overall morphology to dissipate the waves. The beach profile is flattened, and the waves coming inshore shoal further out offshore, thus minimizing further erosion. Beaches recover when sand is moved back onto the shore by fair weather waves and then is blown inland to reestablish the frontal dunes. The final stage of recovery of the beach and dunes occurs when vegetation grows back over these new dunes. Hence, the narrowing of healthy beaches in response to a high wave event is often a temporary condition.
Location
The glacially derived sediments found in the bluffs surrounding Narragansett Bay are highly susceptible to the erosion from storm surges, waves, and tidal forces. During storm surges, water levels can rise 8 to 20 feet above mean sea level and subject the unconsolidated sediments of glacial headland bluffs to the direct attack of waves (Providence Journal 1938). The beaches are sand-starved, which leaves them susceptible to storm-surge and overwash processes. Easton’s Beach area, as well as Hazards Beach and Bailey’s Beach, are especially vulnerable to erosion as they are relatively exposed to waves generated by southwesterly winds (Boothroyd, Personal Communication). Continuous erosion of this nature will decrease the coastal buffer making waterfront property more susceptible to storm surge. Another area prone to erosion is on the western side of the Newport neck section of the city. Erosion in this area is the result of a continuous, “natural” process rather than the result of storm events (Dein, M. 1981, Narragansett Bay Shoreline 1938-1975 Thesis (MS) URI). The Rhode Island Coastal Resources Management Council (CRMC) has adopted shoreline change maps that delineate shoreline rates of change that will be applied to pertinent sections of the Council’s regulatory programs to address issues including setbacks of activities from coastal features. These shoreline change maps detail erosion rates for the shoreline, and are further detailed into shoreline segments for each map. In total there are 11 such maps for Newport.
Extent
The average coastal erosion rate is 1.6 feet per year in Rhode Island (Sullivan 2012). Rhode Island’s shoreline is naturally eroding and migrating over time (Save the Bay 2013). Based on measurements of the Newport tide gauge, sea level is expected to rise one foot per century, thus adversely impacting low lying areas of coastal Rhode Island, which comprises approximately 76% of the shoreline. Most of this erosion occurs during short term storm events such as hurricanes and nor’easters, although factors such as sea level rise and coastal armoring also contribute to erosion (Save the Bay

64 Risk Assessment
2013). The vulnerability of many of Rhode Island’s beaches and shoreline areas to coastal erosion and flooding tends to increase dramatically as manmade structures are allowed to be built along the shoreline thus impeding the natural, dynamic system of the beach. Coastal armoring and the construction of jetties and groins may save the beach or one private property owner, but it severely impacts sediment deposits from occurring down shore of the structure, thus accelerating erosion activity and negatively impacting property owners in these locations.
Previous Occurrences and Probability of Future Events
Hurricane Bob in 1991 produced several incidents of erosion; these were located along Newport’s Cliff Walk, the Easton’s Beach area, Hazards Beach, and Bailey’s Beach. The Cliff Walk incidents of erosion were documented in the Cliff Walk Rehabilitation Study. Newport also experienced extensive coastal erosion from the effects of Hurricane Sandy. Portions of the famed Cliff Walk were washed away in the storm, which cost about $2 million in repairs (Flynn 11/6/12). Additionally, the seawall along Ocean Drive was severely damaged from the high surf generated by the hurricane (RI Press Release) as were the beaches, including Easton’s and Third Beaches (Gillis 11/6/12). The Save the Bay Exploration Zone located in the Rotunda at Easton’s Beach was flooded with sand and its exhibits featuring more than 100 marina animals had to be relocated (Gillis 11/6/12). The probability of future storms resulting in additional coastal erosion is high and will continue to become a more significant hazard as the climate continues to change.
3.2.2.3.c Dam Breach
Description
Dam failures can result from natural events, human-induced events, or a combination of the two. Failures due to natural events such as prolonged periods of rainfall and flooding can result in overtopping, which is the most common cause of dam failure. Overtopping occurs when a dam’s spillway capacity is exceeded and portions of the dam that are not designed to convey flow begin to pass water, erode away, and ultimately fail. Other causes of dam failure include design flaws, foundation failure, internal soil erosion, inadequate maintenance, or misoperation. Complete failure occurs if internal erosion or overtopping results in a complete structural breach, releasing a high-velocity wall of debris-laden water that rushes downstream, damaging or destroying everything in its path. An additional hazard concern is the cascading effect of one dam failure causing multiple dam failures downstream due to the sudden release of flow. Intense storms may produce a flood in a few hours or even minutes for upstream locations. Flash floods occur within six hours of the beginning of heavy rainfall, and dam failure may occur within hours of the first signs of breaching. Other failures and breaches can take much longer to occur, from days to weeks, as a result of debris jams or the accumulation of melting snow.

65 Risk Assessment
While dam failures that occur during flood events compound an already tenuous situation and are certainly problematic, the dam failures that occur on dry days are the most dangerous. These “dry day” dam failures typically occur without warning, and downstream property owners and others in the vicinity are more vulnerable to being unexpectedly caught in life threatening situations than in failures during predicted flood events. Dams are classified by size and hazard ratings. The size classification, which provides a relative description of small, medium, or large, is based on the storage capacity and height of the impounded water. The hazard classification relates to the probable consequences of failure or misoperation of the dam; however, it does not relate to the current condition or the likelihood of failure of the dam. The hazard classifications are defined in the Rhode Island Dam Safety Regulations as follows:
x High Hazard – means a dam where failure or misoperation will result in a probable loss of human life.
x Significant Hazard – means a dam where failure or misoperation results in no probable loss of human life but can cause major economic loss, disruption of lifeline facilities, or impact other concerns detrimental to the public’s health, safety, or welfare.
x Low Hazard – means a dam where failure or misoperation results in no probable loss of human life and low economic losses.
Location
Newport’s water supply is exclusively dependent on surface water for drinking water; the city owns nine surface water reservoirs located within five Rhode Island municipalities. The Newport Water Division provides water services to residents and business in the three communities on Aquidneck Island; the district provides public drinking water to 100% of residents and businesses in Newport, 75% in the town of Middletown, and 3% in the town of Portsmouth. In addition, Newport Water provides Portsmouth Water and Fire District with 60% of that district’s supply. The nine reservoirs owned by Newport are: Lawton Valley Reservoir, St. Mary’s Pond, Sisson Pond, Easton Reservoir (North and South Ponds), Gardiner Pond, Nelson Pond, Nonquit Pond, and Harold E. Watson Pond (Newport Source Water Assessment). Since all Newport residents rely on the public water supply and residents of two other municipalities rely on the Newport water supply, the structural integrity of the dams is critical from a water supply standpoint and a physical safety perspective. RIDEM has the responsibility to inspect dams and determine their condition (Dam Safety Program report 2015). In accordance with Dam Safety Regulations, visual inspections of significant hazard dams are required every five years (Dam Safety Program report 2015). As part of each visual inspection, the condition of the major components of the dam are subjectively rated as good, fair or poor. The major components of a dam are the embankment, the spillway, and the low-level outlet (Dam Safety Program report, 2015). According to the 2015 Annual Report to the Governor on the Activities of the Dam Safety Program, none of the Newport-owned reservoirs have dams that are designated as presenting a hazard (Dam Safety Program, 2015).

66 Risk Assessment
Extent
Safety, liability, and environmental hazards of aging dams are issues for every community in Rhode Island (Save the Bay, 2010). Most of the dams in Rhode Island were constructed before 1900 for water supply, industrial mill use, power supply, and recreation (Save the Bay, 2010). This aging infrastructure has costs for cities, towns, the state, and private landowners. Most of these structures do not fulfill their original purpose, but have become a permanent fixture in the landscape (Save the Bay, 2010). Depending on the location and population density around a dammed area, a dam failure can cause loss of life in addition to the inevitable economic damages associated with dam failure. Second Beach in Middletown and Easton’s Beach in Newport are both barrier beaches that protect four freshwater ponds from saltwater intrusion. Each of the dams in Newport have been mapped and in the event of a dam failure, municipal decision makers and emergency response are aware of probable reach of inundation. Even though a dam breach is unlikely, as there are no significant or high hazard dams, if the Easton Pond South Dam were to fail, it would cause significant damage to Memorial Boulevard and several hundred feet of Easton’s Beach. Failure of the dams associated with Newport’s water supply do not directly impact the City in the event of a failure. Previous Occurrences and Probability of Future Events Rhode Island has experienced many dam failures, mainly resulting from major flood events (RINHMP). There have been over 111 dam incidents recorded in Rhode Island from as early as 1889, seven of which have included some degree of dam failure (National Performance of Dams Program). A notable dam failure in Rhode Island is the collapse of California Jim’s dam in Peace Dale in 1998 (South Kingstown Hazard Mitigation Strategy). The failure caused a total draining of the 12.8 acre pond and the resultant flooding cost $400,000 in property damages and $250,000 in repairs to the dam (Damsafety.org). This incident highlighted the lack of dam maintenance and emergency preparedness related to dam failure in Rhode Island and created an impetus for the revised dam safety regulation promulgated in 2007 (Save the Bay Dam Safety document, 2010). There have been two minor dam incidents with the Newport-owned reservoirs in recent history. A dam incident was detected in the Lawton Valley Reservoir Dam in February 2000; the vegetation on the earth concrete dam was deemed to be excessive and recommendations were made to remove it. Additionally, missing riprap and erosion issues were in need of repair (National Performance Dams Program). Another dam incident was recorded in March 2000 with the Harold E. Watson Reservoir Dam. During the inspection the dam was found to have an eroded embankment and recommendations were made to remove excessive vegetation and to regrade the crest and plant it with grass for erosion protection (National Performance Dams Program). Given that Lawton and Watson are still classified as high hazard dams it seems unlikely that the dam repair recommendations have been implemented. The probability of future dam failure events is not easily measured, but correlates to some extent with the probability of future major flood events coupled with preventative measures, including the routine inspection, maintenance, repair, and proper operation of dams by their owners, and as regulated by Rhode Island
67 Risk Assessment
Department of Environmental Management Dam Safety Program (RINHMP). Based on the DEM report to the Governor that stated none of the Newport dams are presenting a hazard to the City, the probability of future events is considered low.
3.2.2.4 Conflagration (Fire)
Description
Wildfires are fueled by natural cover, including native and non-native species of trees, brush and grasses, and crops along with weather conditions and topography. While available fuel, topography, and weather provide the conditions that allow wildfires to spread, most wildfires are caused by people through criminal or accidental misuse of fire. Wildfires pose serious threats to human safety and property in rural and suburban areas. They can destroy crops, timber resources, recreation areas, and habitat for wildlife. Wildfires are commonly perceived as hazards in the western part of the country; however, wildfires are a growing problem in the wildland/urban interface of the eastern United States, including Rhode Island. Wildfires are dependent upon the quantity and quality of available fuels. Fuel quantity is the mass per unit area. Fuel quality is determined by a number of factors, including fuel density, chemistry, and arrangement. Arrangement influences the availability of oxygen. Another important aspect of fuel quality is the total surface exposed to heat and air. Fuels with large area-to-volume ratios, such as grasses, leaves, bark and twigs, are easily ignited when dry. Climatic and meteorological conditions that influence wildfires include solar insulation, atmospheric humidity, and precipitation, all of which determine the moisture content of wood and leaf litter. Dry spells, heat, low humidity, and wind increase the susceptibility of vegetation to fire. In Rhode Island, common factors leading to large fires include short-term drought, humidity below 20%, and fuel type. Various natural and human agents can be responsible for igniting wildfires. Natural agents include lightning, sparks generated by rocks rolling down a slope, friction produced by branches rubbing together in the wind, and spontaneous combustion.
Human-caused wildfires are typically worse than those caused by natural agents. Arson and accidental fires usually start along roads, trails, streams, or at dwellings that are generally on lower slopes or bottoms of hills and valleys. Nurtured by updrafts, these fires can spread quickly uphill. Arson fires are often set deliberately at times when factors such as wind, temperature, and dryness contribute to the fires’ spread.
Location
Newport is a highly developed city; however it does maintain pockets of open space in places such as Fort Adams and areas along Ocean Drive. While the threat of wildfires in these limited open spaces may be slim, fires could still occur under the right

68 Risk Assessment
conditions. Wildfires that occur in undeveloped, natural areas may be less accessible to fire protection services, thus further increasing the risk of wildfire. A more pressing issue is the risk of urban fire; greater than 50% of the structures in Newport were built prior to 1950, and the majority of those structures are predominantly wooden. Urban fires are usually thought of as human caused or technological hazards. Fire is often a common secondary hazard that can be caused by a lightning strike, a ruptured gas line from an earthquake, or a downed power line. Appendix A, Map 4 characterizes the location of urban fire risk. Like the rest of Rhode Island, Newport generally exhibits a humid continental climate, with hot, rainy summers and cold, snowy winters, and thus often has a low or medium (Class 1 or 2) fire class rating. However, fires can and do occur at any time of year (Wildland fire weather information for Rhode Island). Dry, windy weather does occur, and fire conditions can be exacerbated by drought. The peak fire season in Rhode Island is typically between March and May (Wildland fire weather information for Rhode Island). During this time of year there is no leaf canopy so the sun dries out grasses and fallen leaves (considered one hour fuel sources) and dormant brush, dead twigs, and small branches (ten hour fuels) (Wildland fire weather information for Rhode Island). Windy conditions and the low humidity of the spring (typically less than 40%) further contribute to increased fire risk (Wildland fire weather information for Rhode Island). Although less common, wildfires may be a risk during the summer and fall months particularly if drought conditions occur (Wildland fire weather information for Rhode Island). Open air burning, the act of any fire in the outdoors or in a structure not completely enclosed by walls and a roof, require a written permit from the Newport Fire Department when risk of wildfires is low. Open air burning can increase the risk of wildfires and if the risk of wildfires is heightened the decisions of permit issuance is superseded by state law (Wildland fire weather information for Rhode Island).
Extent
Wildfires, commonly called “forest fires” or “brush fires,” have the potential to destroy valuable natural resources, damage real estate property, and threaten people’s lives and livelihoods (Wildland fire weather information for Rhode Island). Due the limited amount of open space vulnerable to wildfire, it is anticipated that Newport is susceptible to a wildfire event that would expose approximately 175 acres of park land (including Brenton Point and Fort Adams State Parks) to hazards associated with fire. The accurate prediction of the potential risk of a wildfire and the forewarning of dangerous wildfire conditions can help reduce the incidence and seriousness of wildfires (Wildland fire weather information for Rhode Island). It can also provide firefighters the critical time needed for important preparation and readiness for wildfire suppression, as well as assist decision makers in the appropriate uses and activities for the public at large during times of extreme fire danger to aid in the prevention efforts (Wildland fire weather information for Rhode Island). RIDEM’s Division of Forestry is responsible for predicting the risk of wildfires using a modified

69 Risk Assessment
NFDRS to account for local conditions (Wildland fire weather information for Rhode Island). Vulnerability to wildfire is influenced by a variety of factors, such as land cover conditions, weather, and the effectiveness of land management techniques. Highly urbanized areas are less vulnerable to wildfire; however, the risk of urban fire is heightened. Suburban neighborhoods located at the state’s Wildland Urban Interface (WUI), the area where structures and human development meet and intermingle with undeveloped wild land, are very vulnerable to wildfire. Individual buildings may be more or less vulnerable to damage from wildfire based on factors such as the clear distance around the structure and the structure’s construction materials. Wildfire primarily impacts timber and forest ecosystems, although the threat to nearby buildings is always present. The U.S. Forest Service has established the National Fire Danger Rating System (NFDRS) to determine the daily risk to fire experienced by different regions of the country (Table 3-12). The system uses mathematical formulas including wind speed and fuel type to determine a fire index. The fire indexes are grouped into five groups based on severity, and each group has an associated class rating (Classes 1 through 5) and an associated fire risk level. A fire index of zero occurs when there is snow on the ground or there has been a prolonged period of substantial rain. Table 3-12. Fire Index Class Ratings Fire Index Rating Description 0 Class 1 No rating 1-30 Class 2 Low danger 31-60 Class 3 Medium danger 61-80 Class 4 High danger 81+ Class 5 Extreme
Source: Rhode Island Department of Environmental Management, http://www.dem.ri.gov/programs/bnatres/forest/pdf/firewthr.pdf
Previous Occurrences and Probability of Future Events
The probability of a future event is considered medium. While wildfires are not especially common in Rhode Island, they have happened and their effects have been devastating. In 1894, an immense woodland fire burned along Post Road (Route 1) between Wakefield and Westerly and destroyed timber supplies in Charlestown as well as several farmhouses (New York Times, 1894). In 1930 and 1942 major forest fires swept through western Rhode Island burning tens of thousands of acres of timber (Rhode Island Forest History). Newport has experienced urban fires. On December 29, 1912, at 12:35 am, a fire began in George Weaver’s hardware store located at the corner of Broadway and Stone Street. The fire rapidly spread quickly causing some fatalities and the destruction of many local businesses. Another fire in 1967 took place in a similar location; it began at Fred Mahogany’s bar and spread to Bull Street where it damaged a number of houses in addition to some local bars. In 2007 a suspected serial arsonist set ablaze several

70 Risk Assessment
historic buildings, including the popular souvenir shop, House of Scrimshaw, which caught fire on May 9th (Zezima NYT May 17, 2007). This was a five alarm fire that completely destroyed the building and required the assistance of fire departments from the neighboring towns of Jamestown, Middletown, Portsmouth, Bristol, and aid from Naval Station Newport. Much of the fire danger in the City of Newport stems from with its historic nature. An important part of the city is comprised of mainly historic structures. These structures were not built to today’s fire protection standards. Current fire safety standards enforced today, such as fire blocking between floors and the use of fire resistant building materials, did not exist when most of the structures were built. Also these districts are characterized by buildings in close proximity to one another, which was once a common practice used to limit heat loss. Unfortunately, this practice also increases heat radiation between structures and thus increases fire spread potential. When high winds, which are characteristic in the coastal city of Newport, are added to the mix, the threat of a major conflagration increases. Today these historic districts have shifted from being primarily residential structures to mixed-use zones. This configuration only adds to the fire threat by combining hazardous industrial processes with the pre-existing dangers of high density and flammable construction. After recognizing the potential severity of damage Newport faces from an urban fire, the Hazard Mitigation Committee (HMC) set out to identify those specific areas vulnerable to conflagration. The NHMC Fire Department representative explained that the “Fire Limits” described in the city's building code would be a good model to base the demarcation of this zone upon because it identified those areas of high density where industrial uses were mixed with residential and other uses. He stated these areas are known to experience the greatest risk of urban fire.
3.2.2.5 Drought
Description
Drought is characterized as a continuous period of time in which rainfall is significantly below the norm for a particular area. The American Meteorology Society defines drought as a period of abnormally dry weather sufficiently long enough to cause a serious hydrological imbalance. Drought differs from other natural hazards in that this situation occurs suddenly. Rather, a drought evolves over months or even years and, while causing very little structural damage, can have profound economic, environmental, and social impacts. Four methods are used to define the severity of drought: meteorological, hydrological, agricultural, and socioeconomic. Meteorological drought refers to a reduction in the normal rainfall for a given geographic area. This needs to be area-specific, as the average rainfall can vary greatly in different areas.

71 Risk Assessment
Hydrological drought is based on the amount of surface and groundwater relative to normal levels. Agricultural drought deals with the amount of moisture in soils available for plants. The last, socioeconomic drought, measures the impact that any or all of the first three have on people and businesses. Rhode Island, as with most states within the United States, uses both the Palmer Drought Severity Index (PDSI) and the Crop Moisture Index (CMI) as indices for a drought occurrence. The CMI (a derivative of the PDSI) provide information on the short-term or current status of purely agricultural drought or moisture surplus. The PDSI is most effective for determining long-term drought conditions, while the CMI is effective at helping determine short-term drought. Drought levels are measured using several major hydrologic indices; precipitation, groundwater, and surface water are evaluated in terms of departure from normal. Normal is defined as the statistical average of the data for the period of record. It is important to note that time of year may influence the process considerably. In the fall and winter months, the CMI and Palmer Drought Index (PDI) may react slowly but decline rapidly once the spring “green-up” occurs. The lag between surface water levels and groundwater levels could similarly skew the relative importance and number of indicators that are critical to determining the level of drought. In the final two stages, groundwater and reservoir data particular to the supplier will be used in conjunction with statewide data to determine drought levels.
1. Palmer Drought Index (PDI): is an index that reflects soil moisture and weather conditions, including temperature. It is compiled by the NWS and the NCDC.
2. CMI: is an index that reflects short-term soil moisture conditions, particularly as it pertains to agriculture. The agricultural sector is usually the first to be affected because of its heavy dependence on stored soil water, which can be rapidly depleted in extended dry periods.
3. Precipitation: data is collected by the NWS at eight data points and reported by county. A drought phase determination is based on conditions relative to normal in 3-, 6-, and 12-month intervals.
4. Groundwater levels: are monitored by the USGS from 38 observation wells. A drought phase determination is based on the number of month’s groundwater levels are below normal (lowest 25% of period of record). Local water suppliers also monitor public wells in order to make seasonal water availability comparisons.
5. Stream flow: conditions are monitored by the USGS from 21 near-real-time stations with 30 or more years of record. A drought phase determination is based on the number of months that stream flow levels are below normal compared to historical trend data.
6. Surface water reservoir levels: data is typically reported by water suppliers, relative to normal conditions or percent “full” A drought phase determination considers historic monthly averages of small, medium, and large index reservoirs.
The RI Drought Steering Committee assigns drought levels, for the seven designated drought regions in the state, based on hydrological indices such as precipitation, groundwater, stream flow, and the PDI, as well as on local supply indices such as static groundwater levels and reservoir levels. The Normal, Advisory, and Watch levels are

72 Risk Assessment
issued statewide. The Warning and Emergency levels are issued on a regional basis and consider local conditions, source of water supply, and water storage capacity issues.
Location
Newport draws its drinking water from nine surface water reservoirs located within five Rhode Island municipalities. The Newport Water Division provides water services to residents and business in the three communities on Aquidneck Island: the district provides public drinking water to 100% of residents and businesses in Newport, 75% in the town of Middletown, and 3% in the town of Portsmouth. In addition, Newport Water provides Portsmouth Water and Fire District with 60% of that district’s supply. The nine reservoirs owned by Newport are: Lawton Valley Reservoir, St. Mary’s Pond, Sisson Pond, Easton Reservoir (North and South Ponds), Gardiner Pond, Nelson Pond, Nonquit Pond, and Harold E. Watson Pond (Newport Source Water Assessment). The nine watersheds that Newport draws from total approximately 13,500 acres (Newport Source Water Assessment).
Extent
On Aquidneck Island, rain falls into one of two watersheds, affecting either the drinking water or the Narragansett Bay as it flows according to the natural contours of the land. Aquidneck Island is the largest and most densely developed of all the islands in Narragansett Bay. How the land is used, therefore, has a significant impact on the quality and quantity of both fresh and salt water resources and, consequently, on the vast number of far reaching land and water based ecosystems that are related through a complex environmental web. Annual rainfall is distributed evenly throughout the year and is reported between 41 and 44 inches. A lush growing season occurs between April and September. Characteristics and impacts of drought differ in many ways, so it is difficult to quantify drought. The Palmer Drought Severity Index (PDSI) (Table 3-13) uses temperature and precipitation levels to determine dryness, measuring a departure from the normal rainfall in a given area. The advantage of the PDSI is that it is standardized to local climate, so it can be applied to any part of the country to demonstrate relative drought or rainfall conditions. A monthly PDSI value below -2.0 indicates moderate drought, and a value below -3.0 indicates severe drought. Table 3-13. Palmer Drought Severity Index
Severity Index Value Extreme Drought -4 or less Severe Drought -4 to -3 Moderate Drought -3 to -2 Mild Drought -2 to -1 Incipient Dry Spell -1 to -0.5

73 Risk Assessment
Previous Occurrences and Probability of Future Events
The probability of future drought events is considered low. Extended droughts are rare in Rhode Island with a record of six major droughts (those lasting for more than one year) since 1929 (Table 3-14; USGS: Rhode Island Floods and Droughts). The longest and most severe drought occurred in 1963-67 and affected most of the northeast (USGS: Rhode Island Floods and Droughts). Water shortages affected most communities in Rhode Island and several municipal-supply wells were drilled to augment declining public supplies (USGS: Rhode Island Floods and Droughts). Table 3-14. Rhode Island Historical Droughts and Locations Date Area Affected Notes
1930-1931 Statewide Estimated stream flow about 70% of normal.
1941-1945 Statewide – Particularly severe in Pawtuxet & Blackstone Rivers
Estimated stream flow about 70% of normal.
1949-1950 Statewide Estimated stream flow about 70% of normal.
1963-1967 Statewide Water restrictions and well replacements common.
1980-1981 Statewide – Groundwater deficient in eastern part of state
Considerable crop damage in 1980.
1987-1988 Southern part of state Crop damage, $25 million. Source: Rhode Island Hazard Mitigation Plan, 2014
3.2.2.6 Extreme Heat
Description
The National Weather Service issues Extreme (or Excessive) Heat warnings when the maximum expected heat index is expected to be 105o of higher for at least 2 consecutive days and night time air temperatures are not expected to fall below 750. In the northeast, this criteria is generally modified to a heat index of 920 or higher for 2 consecutive days.
Location
An extreme heat event would be a regional issue affecting Newport and significant portions of Southern New England. Extreme Heat is a rare occurrence in the region and is not expected to increase during the life of this plan. For the purposes of this plan, extreme heat is included as a precursor or contributor to potential of dangerous drought conditions described above.
Extent
The National Weather Service issues some or all of the following notices related to heat:

74 Risk Assessment
Excessive Heat Warning - Take Action! An Excessive Heat Warning is issued within 12 hours of the onset of extremely dangerous heat conditions. The general rule of thumb for this Warning is when the maximum heat index temperature is expected to be 105° or higher for at least 2 days and night time air temperatures will not drop below 75°; however, these criteria vary across the country, especially for areas not used to extreme heat conditions. If you don't take precautions immediately when conditions are extreme, you become seriously illness or even die. Excessive Heat Watches - Be Prepared! Heat watches are issued when conditions are favorable for an excessive heat event in the next 24 to 72 hours. A Watch is used when the risk of a heat wave has increased but its occurrence and timing is still uncertain. Heat Advisory - Take Action! A Heat Advisory is issued within 12 hours of the onset of extremely dangerous heat conditions. The general rule of thumb for this Advisory is when the maximum heat index temperature is expected to be 100° or higher for at least 2 days, and night time air temperatures will not drop below 75°; however, these criteria vary across the country, especially for areas that are not used to dangerous heat conditions. Take precautions to avoid heat illness. If you don't take precautions, you could become seriously illness or even die. Excessive Heat Outlooks are issued when the potential exists for an excessive heat event in the next 3-7 days. An Outlook provides information to those who need considerable lead-time to prepare for the event.
Previous Occurrences and Probability of Future Events
There has only been one recorded incident of excessive heat in Newport in the past 50 years. On July 22, 2011 humidity levels increased causing the heat index to rise above 105 degrees for a few hours. While increased temperatures are an expected byproduct of the changing climate, the probability of an extreme heat event in Newport during the next 5 years is low.
3.2.2.7 Geologic Related Hazards (Earthquake)
Description
An earthquake is caused by a sudden displacement within the earth. Strong and destructive earthquakes usually result from the rupturing or breaking of great masses of rocks far beneath the surface of the earth. The ultimate cause of these deep ruptures has not been established. All earthquakes produce both vertical and horizontal ground shaking. This ground movement begins at the focus or hypocenter, deep in the earth, and spreads in all directions. The felt motion is the result of several kinds of seismic vibrations. The primary or P waves are compressional. The secondary or S waves have a shear motion. These body waves radiate outward from the fault to the ground surfaces where they cause ground shaking. The fast moving P waves are the first waves to cause the vibrations of a building. The S waves arrive next and may cause a structure to vibrate from side to side. Rayleight and

75 Risk Assessment
Love waves (surface waves), which arrive last, cause low-frequency vibrations and are more likely than P and S waves to cause tall buildings to vibrate. Surface waves decline less rapidly than body waves, so as the distance from the fault increases, tall buildings located at relatively great distances from the epicenter can be damaged. Geologists have found that earthquakes tend to reoccur along faults, which reflect zones of weakness in the Earth’s crust, a theory known as plate tectonics (Kafka, Boston College). A fault is a fracture in the Earth’s crust along which two blocks of the crust have slipped with respect to each other. Faults are divided into three main groups, depending on how they move. Normal faults occur in response to pulling or tension; the overlying block moves down the dip of the fault plane. Thrust (reverse) faults occur in response to squeezing or compression; the overlying block moves up the dip of the fault plane. Strike-slip (lateral) faults occur in response to either type of stress; the blocks move horizontally past one another. Most faulting along spreading zones is normal, along subduction zones is thrust, and along transform faults is strike-slip. Even if a fault zone has recently experienced an earthquake there is no guarantee that all the stress has been relieved. The focal depth of an earthquake is the depth from the Earth’s surface to the region where an earthquake’s energy originates (the focus). Earthquakes with focal depths from the surface to about 70 kilometers (43.5 miles) are classified as shallow. Earthquakes with focal depths from 70 to 300 kilometers (43.5 to 186 miles) are classified as intermediate. The focus of deep earthquakes may reach depths of more than 700 kilometers (435 miles). The focuses of most earthquakes are concentrated in the crust and upper mantle. The depth to the center of the Earth’s core is about 6,370 kilometers (3,960 miles), so even the deepest earthquakes originate in relatively shallow parts of the Earth’s interior. The epicenter of an earthquake is the point on the Earth’s surface directly above the focus. The location of an earthquake is commonly described by the geographic position of its epicenter and by its focal depth. Earthquakes beneath the ocean floor sometimes generate immense sea waves or tsunamis. These waves travel across the ocean at speeds as great as 960 kilometers per hour (597 miles per hour) and may be 15 meters (49 feet) high or higher by the time they reach the shore. Liquefaction, which happens when loosely packed, water-logged sediments lose their strength in response to strong shaking, causes major damage during earthquakes.
Location
Rhode Island is located in a region of the North American plate and falls within seismic zone 2A with 8-16% ground acceleration, which translates to a “moderate” seismic hazard (Petersen et al. 2008 USGS; UBC Seismic Zone Map). This means that people may experience moderate intensity shaking that can lead to slight damage during an earthquake event (FEMA Earthquake Hazard maps). There are no significant geologic fault lines in Rhode Island or New England, and the USGS Earthquake Hazards Program identifies all of Rhode Island as occurring in a low seismic risk area (<2%g peak acceleration). Earthquakes that occur in the northeast, which is considered an intraplate area, do not meet the assumptions of the plate

76 Risk Assessment
tectonic theory since there is no obvious relationship between earthquake occurrence and fault lines in intraplate areas (Kafka, Boston College). A commonly accepted explanation for the occurrence of earthquakes in the northeast is that “ancient zones of weakness” are being reactivated by the present stress field (Kafka, Boston College). This theory hypothesizes that pre-existing faults and other geologic features formed during ancient geological episodes persist today and that earthquakes occur when present-day stress is released along these zones of weakness (Kafka, Boston College). Earthquakes occur infrequently in Rhode Island and surrounding New England, but historically earthquakes originating in other states have been felt in various parts of Rhode Island. It is probable that an earthquakes affecting Newport would also impact the surrounding communities as well. Special consideration must be taken for buildings and infrastructure that has greater exposure or susceptibility to earthquake related damage.
Extent
The severity of an earthquake can be expressed in terms of both intensity and magnitude. Intensity is based on the observed effects of ground shaking on people, buildings, and natural features. It varies from place to place within the disturbed region depending on the location of the observer with respect to the earthquake epicenter. Although numerous intensity scales have been developed over the last several hundred years to evaluate the effects of earthquakes, the one currently used in the United States is the Modified Mercalli Intensity (MMI) Scale. This scale, composed of 12 increasing levels of intensity that range from imperceptible shaking to catastrophic destruction, is designated by Roman numerals. It does not have a mathematical basis; instead it is an arbitrary ranking based on observed effects. Magnitude is related to the amount of seismic energy released at the hypocenter of the earthquake. It is based on the amplitude of the earthquake waves recorded on instruments which have a common calibration. The magnitude of an earthquake is thus represented by a single, instrumentally determined value. The magnitudes of seismic waves are recorded on instruments called seismographs, using the Richter Magnitude Scale. The Richter scale is not used to express damage. An earthquake in a densely populated area that results in many deaths and considerable damage may have the same magnitude as a shock in a remote area that does nothing more than frightens the wildlife. Large magnitude earthquakes that occur beneath the oceans may not even be felt by humans. Earthquakes with magnitude of 2.0 or less are usually called micro earthquakes. They are not commonly felt by people and are generally recorded only on local seismographs. Events with magnitudes of 4.5 or greater are strong enough to be recorded by sensitive seismographs all over the world. Great earthquakes, such as the 1964 Good Friday earthquake in Alaska, have magnitudes of 8.0 or higher. On the average, one earthquake of such size occurs somewhere in the world each year. Although the Richter scale has no upper limit, the largest known shocks have had magnitudes in the 8.8 to 8.9 range. Recently, another scale called the moment magnitude scale has been devised for more precise study of great earthquakes. Only a couple earthquakes of MMI Scale V or greater have been centered in Rhode Island, including the 1951 South Kingstown earthquake of magnitude 4.6 on the Richter scale.

77 Risk Assessment
Impacts from earthquakes can be severe and cause significant damage. Ground shaking can lead to the collapse of buildings and bridges and disruption of gas and electric lines, phone service, and other critical utilities. Death, injuries, and extensive property damage are possible vulnerabilities from earthquakes. Some secondary hazards caused by earthquakes may include fire, hazardous material release, landslides, flash flooding, avalanches, tsunamis, and dam failure. Earthquakes can cause flooding due to the tilting of the valley floor, dam failure, and seiches in lakes and reservoirs. Flooding can also result from the disruption of the rivers and streams. Water tanks, pipelines, and aqueducts may be ruptured or canal and streams altered by ground shaking surface faulting, ground tilting, and land sliding. Earthquake-caused fires are generally the result of broken natural gas lines. These types of fires were very evident in the 1906 and 1989 San Francisco earthquakes. Other types of fires may include oil refineries, electrical, gasoline stations and chemical spills. Earthquakes may also result in a hazardous materials spill. Despite the low probability of a high impact earthquake, physical characteristics in Rhode Island may increase earthquake vulnerability:
1. Hard Rock: Due to the geological makeup of New England’s base rock, seismic energy is conducted on a greater scale (four (4)-10 times that of an equivalent Richter magnitude earthquake in California) 2. Soft Soil: Many coastal regions of New England are made up of soft soils. These soils can magnify an earthquake as much as two times. 3. Structures: The New England region, being one (1) of the first settled areas of the United States, has an abundance of older, unreinforced masonry structures that are inherently brittle and very vulnerable to seismic forces. 4. Low Public Awareness of Vulnerability: Little public recognition of earthquake threat, and no established system of educating or informing the public of the threat or how to prepare for or respond during an earthquake. Therefore, higher losses will occur here than in other regions of the country.
Table 3-15. Richter Magnitude Scale Richter Magnitude Scale Modified Mercalli Intensity Scale 1.0 - 3.0 I 3.0 - 3.9 II – III 4.0 - 4.9 IV – V 5.0 - 5.9 VI – VII 6.0 - 6.9 VIII – IX 7.0 and higher X and higher

78 Risk Assessment
Table 3-16. Modified Mercalli Intensity Scale Defined MMI Rating Description I Not felt except by a very few under especially favorable
conditions. II Felt only by a few persons at rest, especially on upper floors
of buildings. III Felt quite noticeably by persons indoors, especially on
upper floors of buildings. Many people do not recognize it as an earthquake. Standing motor cars may rock slightly. Vibrations similar to the passing of a truck.
IV Felt indoors by many, outdoors by few during the day. At night, some awakened. Dishes, windows, doors, disturbed; walls make cracking sound. Sensation like heavy truck striking building. Standing motor cars rocked noticeably.
V Felt by nearly everyone; many awakened. Some dishes, windows broken. Unstable objects overturned. Pendulum clocks may stop.
VI Felt by all, many frightened. Some heavy furniture moved; a few instances of fallen plaster. Damage slight.
VII Damage negligible in buildings of good design and construction; slight to moderate in well-built ordinary structures; considerable damage in poorly built or badly designed structures; some chimneys broken
VIII Damage slight in specially designed structures; considerable damage in ordinary substantial buildings with partial collapse. Damage great in poorly built structures. Fall of chimneys, factory stacks, columns, monuments, walls. Heavy furniture overturned
IX Damage considerable in specially designed structures; well-designed frame structures thrown out of plumb. Damage great in substantial buildings, with partial collapse. Buildings shifted off foundations.
X Some well-built wooden structures destroyed; most masonry and frame structures destroyed with foundations. Rails bent.
XI Few, if any (masonry) structures remain standing. Bridges destroyed. Rails bent greatly.
XII Damage total. Lines of sight and level are distorted. Objects thrown into the air.
Previous Occurrences and Probability of Future Events
European settlers in Rhode Island noted the effects of a number of earthquakes beginning in the mid-17th century. Between 1776 and 2007, 38 earthquakes were recorded in Rhode Island, far fewer than any New England state. Most of these earthquakes measured low on the intensity scale, and are believed to have originated elsewhere, some as far away as Quebec. In 1883 an earthquake believed to have been centered on Rhode Island was felt (Intensity V effects) from Bristol to Block Island. On December 20 and 24 in 1940 there were strong earthquakes centered around Lake

79 Risk Assessment
Ossipee, New Hampshire that caused some damage in the epicentral area and caused Intensity V effects on the MMI scale in Newport, Rhode Island (von Hake 1976). The largest earthquake recorded in Rhode Island occurred on June 10, 1951 and was centered in Kingston with a 4.6 Richter Scale rating (RISHMP, 2014). The most recent earthquake that affected Newport occurred on March 11, 1976 when a 3.5 magnitude earthquake struck the lower Narragansett Bay area. Intensity VI effects were generated from the quake but did not cause any damage (Stover & Coffman 1993). Seismologists and geologists agree that earthquakes are impossible to predict with any degree of accuracy. Rhode Island is located in an area of “moderate” seismicity and “high” risk. Seismic risk applies to the seismic hazard, location demographics, and regional economics to the vulnerabilities of the structure or lifeline on the site. Seismologists have estimated that there is about a 50% probability of a very damaging magnitude 5.0 earthquake occurring anywhere in New England, in a 50-year period. Using the hazard ranking criteria, probability of future occurrence has been rated to a low probability of occurrence based on previous occurrences of earthquakes in Rhode Island. Vulnerability of property to seismic hazards is determined by the prevalence of earthquake-resistant construction (FEMA – Your earthquake risk).
Table 3-17. Historic Earthquakes Felt in Rhode Island
Date Epicenter Richter Scale Effects in RI
February 28, 1925 St. Lawrence River, Canada
7.0 Intensity V effects felt on Block Island and in Providence; intensity IV in Charlestown.
November 19, 1929 Grand Banks, Newfoundland
7.2 Moderate vibrations were felt on Block Island and in Chepachet, Newport, Providence, and Westerly.
November 1, 1935 Quebec 6.2 Intensity IV effects felt on Block Island and in Providence and Woonsocket.
December 20 & 24, 1940
Lake Ossipee, New Hampshire
N/A Intensity V effects felt in Newport, Intensity IV effects in Central Falls, Pascoag, Providence, and Woonsocket, and Intensity I - III effects in Kingston, New Shoreham, and Wakefield.
September 4, 1944 Massena, New York Intensity I - III effects reported in Kingston, Lonsdale, Providence, Wakefield, and Woonsocket.
October 16, 1963 Coast of Massachusetts 4.5 Intensity V effects in Chepachet, less intense effects in northern RI.
December 7, 1965 N/A N/A Windows and doors rattled and trees and bushes were shaken slightly (Intensity V effects) in Warwick. Small objects and furnishings shifted at Bristol.
February 2, 1967 N/A 2.4 Intensity V effects in Middleton, Newport, and North Kingstown, but no damage was sustained; also felt in Adamsville and Jamestown.

80 Risk Assessment
Date Epicenter Richter Scale Effects in RI
February 3, 1973 N/A N/A Noises like an explosion or sonic boom shook houses and rattle windows throughout Rhode Island and eastern Massachusetts, but seismographs recorded nothing.
June 14, 1973 Western Maine 5.2 Intensity IV effects in Charlestown, and Intensity I - III in Bristol, East Providence, Harmony, and Providence.
March 11, 1976 N/A 3.5 Intensity VI effects felt from Oakland south to Newport.

81 Risk Assessment
Table 3-18. New England States Historic Earthquakes State Years of Record # of Earthquakes Connecticut 1668-2007 137 Maine 1766-2007 544 Massachusetts 1668--2007 355 New Hampshire 1638-2007 360 Rhode Island 1776-2007 38 Vermont 1843-2007 73 Total number of earthquakes within New England: 1507 Total number of earthquakes in the Northeast, 1638-2007: 2403 Information in this table has been reproduced in tabular form, and comes from the NESEC publication (to 2007)
3.3 Vulnerability Vulnerability includes all populations and assets (environmental, economic and critical facilities) that may be at risk from the natural hazards. Vulnerability analysis measures the level of assets, populations, and resources within Newport. The vulnerability is a function of the built environment, local economy, demographics, and environmental uses of a given region. A critical first step in assessing the risk and vulnerability of Newport to natural hazards is to identify the links between the built environment vulnerability and the community’s vulnerability to hazard-related business interruptions, disruptions of social structure and institutions, and damage to the natural environment and the flow of economic goods and services. The City of Newport has updated their Natural Hazard Mitigation Plan to outline resources that address vulnerabilities and pressures the city faces: economic stability, historic and cultural preservation, public infrastructure and public facilities. Updating the plan will help reduce the actual or potential loss of life or property from a natural disaster. The City of Newport acknowledges that incorporating this plan and its mitigation initiatives (both pre-and post-disaster) into the Comprehensive Plan would not only benefit the community by reducing human suffering, damages, and the costs of recovery, but will also help build and maintain the sustainability and economic health of the city over the long run.
3.3.1 Community Assets
Newport’s community assets include its population, natural and cultural resources, its abundant historic architecture, the local economy, public infrastructure, and public services and facilities. By examining and outlining the vulnerabilities of each of these assets, the city will be better prepared to respond to natural hazards that may affect them and therefore better protect their community assets.

82 Risk Assessment
3.3.1.1 People
As of the 2010 census the population of Newport was 24,672; this is a 6.8% decline in the population since 2000 (US Census Bureau). The population density was 3,215 people per square mile. There were 13,069 households and 10,917 households residing in the city. The racial makeup of the city was 82.53% White, 6.93% African American, 0.83% Native American, 1.43% Asian, 0.13% Pacific Islander, 3.13% from other races, and 5.23% from two or more races. Hispanic or Latino of any race made up 8.43% of the population. As of 2000 over half of Newport residents are renters (Newport Comprehensive Land Use Plan). Housing affordability is an issue in Newport, and the gap between the cost of housing and the income needed to purchase housing is greater in Newport than any other Rhode Island community aside from the East Side of Providence (Newport Comprehensive Plan). Two key sectors of Newport’s economic activity, the Navy and tourism, bring families to Newport on a temporary basis and help to drive the demand for rental units (Newport Comprehensive Land Use Plan). Public Housing in Newport provided to meet the needs of two main groups: family units for low-to-moderate income families and elderly housing units for the elderly and handicapped who meet federal income eligibility requirements (Newport Comprehensive Land Use Plan). As of 2000, there were 250 housing units for the elderly and handicapped and 836 for low-to-moderate income families. To expedite assistance response, persons requiring assistance due an access or functional need, which include those with disabilities, chronic conditions, and special healthcare needs, are encouraged to enroll in the Rhode Island Special Needs Emergency Registry (RIDOH). This registry provides a reliable system for the identification of Rhode Islanders who may require special assistance during emergencies (RIDOH). It is important to know the number of people that are considered to be at a higher risk in a natural hazard event in order to plan for their needs and safety.
3.3.1.2 Economy
The largest revenue source of the General Fund for Newport is from the property tax, which represents approximately 76% of the total General Fund Budget (Newport Comprehensive Land Use Plan). Should any of the tax bases be destroyed as a result of a natural disaster, the immediate effect would be that remaining property owners would carry an increased property-tax burden. It is therefore very important to protect property as well residents from natural disasters. The City of Newport also relies on other sectors for its tax base; chief among them is the local labor force. As of 2000, 46% of the total Newport population made up the local labor force (Newport Comprehensive Land Use Plan). A significant source of city revenue stems from the tourism industry. Newport is visited annually by 3.5 million tourists that attend special events, sail, and visit the city’s attractions like the mansions. The city receives 25% of the hotel tax as well as a significant source from retail sales.

83 Risk Assessment
Newport has experienced substantial growth in tourism-related sectors of the local economy, such as hotels, restaurants, retail goods, museums, galleries, and recreational services (Newport Comprehensive Land Use Plan). The economic benefits of this growth have a multiplier effect for other sectors of the economy: construction, banking, real estate, business services, transportation services, and others (Newport Comprehensive Land Use Plan). Another significant portion of the local economy is tied to the defense industry. In 2001 the largest single employer on the island was U.S. Navy with 19% of all jobs. The military, civilian, and student personnel at the Navy Base and their families form an important part of the Newport County social and economic fabric (Newport Comprehensive Land Use Plan). Aside from these year-round residents, the educational activities at the Navy Base bring short-term residents to the island (Newport Comprehensive Land Use Plan). The Naval Station Newport falls completely within the Zone A hurricane evacuation zone and is therefore vulnerable to flooding in the event of storms. Due to the significant economic ties that Newport has to the Navy Base it is imperative to implement mitigation actions to lessen the effects of the storm.
3.3.1.3 Built Environment
The damage to and destruction of the built environment, particularly in the critical lifeline sectors (communications, emergency services, energy, healthcare and public health, transportation, water) represents enormous economic, social, and general functional costs to a community, while also impeding emergency response and recovery activities. Since Newport is a coastal community, it has increased vulnerability to extreme weather events like hurricanes. To better prepare for natural hazard events this report examines elements of Newport’s built environment and addresses vulnerabilities in the action section.
Existing structures
Newport is an island community and an historic city that grew around its harbor. As of 2001 the city was considered substantially “built-out.” Along with its extraordinary natural resources, Newport’s historic, architectural, and maritime resources are the city’s greatest assets in shaping a vision for the future. The city recognizes that the preservation of cultural heritage protects the unique character of Newport and provides important environmental, economic, and educational benefits to the community. Critical structures in Newport include the following:
x Fire Station 1: Located in the flood zone. In the event of a 100-year flood this fire station would be completely unusable and apparatus would have to be re-located. This would negatively impact the residents in the first response district because response times would increase substantially. This fire station also falls within the urban fire zone.
x City Hall: The Newport City Hall houses the administration offices for the city. It is a critical structure that falls within the urban fire zone.
x Police Station: The Newport Police Station falls within the urban fire zone.
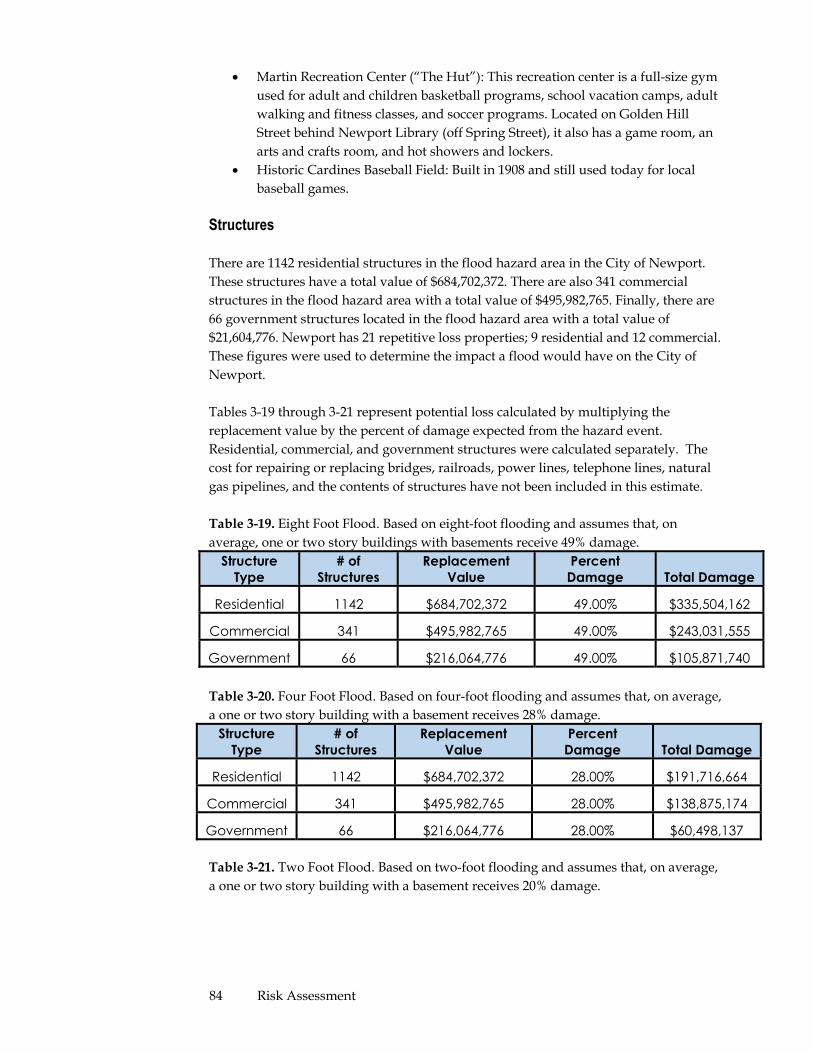
84 Risk Assessment
x Martin Recreation Center (“The Hut”): This recreation center is a full-size gym used for adult and children basketball programs, school vacation camps, adult walking and fitness classes, and soccer programs. Located on Golden Hill Street behind Newport Library (off Spring Street), it also has a game room, an arts and crafts room, and hot showers and lockers.
x Historic Cardines Baseball Field: Built in 1908 and still used today for local baseball games.
Structures There are 1142 residential structures in the flood hazard area in the City of Newport. These structures have a total value of $684,702,372. There are also 341 commercial structures in the flood hazard area with a total value of $495,982,765. Finally, there are 66 government structures located in the flood hazard area with a total value of $21,604,776. Newport has 21 repetitive loss properties; 9 residential and 12 commercial. These figures were used to determine the impact a flood would have on the City of Newport. Tables 3-19 through 3-21 represent potential loss calculated by multiplying the replacement value by the percent of damage expected from the hazard event. Residential, commercial, and government structures were calculated separately. The cost for repairing or replacing bridges, railroads, power lines, telephone lines, natural gas pipelines, and the contents of structures have not been included in this estimate.
Table 3-19. Eight Foot Flood. Based on eight-foot flooding and assumes that, on average, one or two story buildings with basements receive 49% damage.
Structure Type
# of Structures
Replacement Value
Percent Damage Total Damage
Residential 1142 $684,702,372 49.00% $335,504,162
Commercial 341 $495,982,765 49.00% $243,031,555
Government 66 $216,064,776 49.00% $105,871,740
Table 3-20. Four Foot Flood. Based on four-foot flooding and assumes that, on average, a one or two story building with a basement receives 28% damage.
Structure Type
# of Structures
Replacement Value
Percent Damage Total Damage
Residential 1142 $684,702,372 28.00% $191,716,664
Commercial 341 $495,982,765 28.00% $138,875,174
Government 66 $216,064,776 28.00% $60,498,137
Table 3-21. Two Foot Flood. Based on two-foot flooding and assumes that, on average, a one or two story building with a basement receives 20% damage.

85 Risk Assessment
Infrastructure
Wastewater Treatment The Water Pollution Control Division is responsible for providing wastewater treatment for the residents of Newport. In addition, the division provides wastewater treatment on a wholesale basis to the Town of Middletown and Naval Station Newport, as well as flow from privately owned and operated sanitary collection systems in the Newport Neck area. The Water Pollution Control Division also manages the storm drainage system within the city (Newport Water Pollution Control Division). The sanitary sewer collection system and wastewater treatment facility are operated and maintained in accordance with a service contract with United Water, Inc. The City of Newport and United Water are issued a Rhode Island Pollutant Discharge Elimination System Permit # RI0100293 to operate the wastewater facilities. The city owns and operates approximately 97 miles of gravity and force main sewer collection pipe delivering domestic, commercial, and industrial waste to a water pollution control plant (WPCP) on JT Connell Highway. In addition to the sewer collection pipes, the city also owns and operates 15 sanitary pump stations to assist in conveying flows to the WPCP for treatment (Newport Water Pollution Control Division).
During dry weather, sanitary sewer flows are conveyed to the Newport WPCP. All dry weather flows receive secondary treatment and disinfection at the WPCP prior to discharge into Newport Harbor. During wet weather, despite the sewer separation projects that have been completed, large quantities of stormwater enter the Newport combined sewer system and can overload the system. Relief points in the system divert the excess flow and allow the excess flow to discharge to Newport Harbor. These discharges are called combined sewer overflows (CSOs). Newport currently has two permitted CSO outfalls, each served by a CSO treatment facility that provides partial treatment and disinfection prior to discharge to the harbor: one is on Wellington Avenue and the other is on Washington Street. The City of Newport developed a System Master Plan in 2012 to work towards reducing CSO events through projects such as catch basin separation and sanitary sewer improvements (Newport Water Pollution Control Division). Conditional approval for the plan was received in November 2013 from the EPA and RIDEM and the City continues to work towards the final approval for the System Master Plan (Newport Water Pollution Control Division). Drinking Water Treatment In 2012 Newport initiated upgrades to the treatment processes at Station No. 1 Water Treatment Plant at 100 Bill Miss Road in Newport. Additionally, construction for a new Lawton Valley Water Treatment Plant in Portsmouth began (WaterWorld, 2012). The Lawton Valley and Station No. 1 plants provide drinking water to Newport Water
Structure Type
# of Structures
Replacement Value
Percent Damage Total Damage
Residential 1142 $684,702,372.00 20.00% $136,940,474
Commercial 341 $495,982,765.00 20.00% $99,196,553
Government 66 $216,064,776.00 20.00% $43,212,955
86 Risk Assessment
Division’s 14,500 retail customers in Newport, Middletown, and Portsmouth, as well as the wholesale customers at Naval Station Newport and the Portsmouth Water and Fire District. The project, which will improve drinking water quality for all Aquidneck Island water users, responds to the mandate by the Rhode Island Department of Health to reduce the amount of trihalomethanes in treated water. Trihalomethanes are disinfectant by-products that are formed when natural organics in the water react with chlorine that is added to the water for disinfection. The upgrades at both facilities will incorporate an advanced water treatment process using granular activated carbon contactors, which will remove organics from the water as well as improve the aesthetic quality in terms of taste and odor. Once completed, the Newport water treatment plants will be the only facilities in Rhode Island to have advanced treatment. Unlike most systems that use a single water source, the Newport treatment plants rely on nine reservoirs over five municipalities with a wide range of water quality and susceptibility to algae blooms and weather patterns (WaterWorld, 2012). In early 2013, the Newport Water Division announced that its drinking water had exceeded the maximum contaminant level (MCL) set for trahalomethanes (THHMs) (Newport Patch, 2013). This has been an ongoing issue for the Newport Water Division, and Newport therefore mandated that advanced treatment methods for organics removal be included in the treatment plant improvements at Station 1 and design in the Lawton Valley treatment plant. As of the writing of this plan, construction of the Lawton Valley Water Treatment Plant and the improvements to Station 1 Water Treatment Plant have essentially been complete. Roads Newport’s circulation system has maintained the narrow streets that were built in the 18th and 19th centuries. However, the transportation needs of the 21st century place a much greater demand on the aging roads and parking areas in Newport (Newport Comprehensive Land Use Plan). Seasonal demands also place stress on the transportation system and often pit visitor against resident as they compete for limited space on the roads and parking lots (Newport Comprehensive Land Use Plan). There are three major routes in the City: Broadway (Rt. 114), Memorial Boulevard (Rt. 138), and the Newport Bridge to America’s Cup Avenue. Due to its geographical location, Newport is not directly connected to any major highway. Access to the mainland portion of southern Rhode Island is achieved via the Newport Claiborne Pell Bridge and the Jamestown Verrazzano Bridge, which are maintained by the Rhode Island Turnpike and Bridge Authority (RITBA). Other routes out of Newport must be taken through Middletown and Portsmouth; Route 114 may be taken over the Mount Hope Bridge to the East Bay and Route 138 may be taken to the Sakonnet River Bridge to Tiverton. The opening on the Newport Pell Bridge in 1968 and the construction of American’s Cup Avenue in 1972 greatly increased access to Newport, and thus the number of visitors to Newport substantially increased (Newport Comprehensive Land Use Plan). Investment in road infrastructure has declined as the city budget stretches between many competing needs. As in many Rhode Island communities, the condition of some roads in Newport is poor. The quality of Newport’s road infrastructure is important as it contributes to the community’s public welfare and its economic well-being.

87 Risk Assessment
Public transportation in Newport is provided by the Rhode Island Public Transit Authority (RIPTA). RIPTA provides intra-city bus service as well as service to Middletown, Portsmouth, Jamestown, Providence, and the West Bay. RIPTA offers free service to those with disabilities and those over 65 with the presentation of a RIPTA No Fare bus pass (RI Division of Elderly Affairs). Those over 65 and those with disabilities that do not have the No Fare pass can receive reduced prices during off-peak hours with a RIPTA Senior/Disabled pass or Medicare ID card (RI Division of Elderly Affairs). LogistiCare is another senior/disability transportation service that is available on a by-appointment basis (RI Division of Elderly Affairs). Bridges As an island community, bridge access and safety are important issues to Newport. Access to the mainland portion of southern Rhode Island is achieved via the Newport Claiborne Pell Bridge and the Jamestown Verrazzano Bridge, which are maintained by the Rhode Island Turnpike and Bridge Authority (RITBA). Each bridge is four lanes wide, with two lanes in each direction. The Jamestown Verrazzano Bridge, which was built in 1992, is in very good condition. The Newport Bridge, being significantly older, is currently undergoing deck repairs and repainting. Work is expected to be completed by November of 2016(RITBA Construction Updates). On-call maintenance work, such as patching existing roadway, is carried out on an ongoing basis (RITBA Construction Updates). The bridges are vital for the safety and transportation needs of Newport residents, and it is imperative for the state/RIBTA to maintain them to ensure that, in the event of a disaster, residents have an escape route off the island. There are two other important bridges that connect northern Aquidneck Island to the East Bay and the Tiverton/Little Compton area. The Mount Hope Bridge is a two-lane bridge that connects Portsmouth and Bristol. The newly constructed four-lane Sakonnet River Bridge connects Portsmouth and Tiverton. Both of these bridges are also maintained by RITBA and are needed as alternative evacuation routes in the case of an emergency. Waste Removal The Newport Department of Public Services’ Clean City Program through a contract with Waste Management Inc. provides services for the curbside collection of residential refuse and yard waste (Clean City Newport). The City of Newport also coordinates a mandatory recycling program in cooperation with Rhode Island Resource Recovery. Electrical and Natural Gas Network Newport’s electricity and natural gas supply is provided by National Grid.
Critical Facilities
Each jurisdiction classifies “critical facilities” based on the relative importance of that facility’s assets for the delivery of vital services, the protection of special populations, and other important functions. If damaged, the loss of that critical facility would present an immediate threat to life, public health, and safety. Protection of critical facilities is also important for rapid response and recovery of a community, its

88 Risk Assessment
neighborhoods, and its businesses. Internal and external facilities that provide critical services to the City of Newport are classified under the following subsections: Critical Infrastructure
x City Hall: 43 Broadway x Fire Station 1: 21 West Marlborough Street at America’s Cup Avenue (Built
1934) x Fire Station 2: 100 Old Fort Road (Built 1986) x Fire Station 5: Touro Street at Mary Street (Built 1867, renovated 1895) x Police Station: 120 Broadway x Newport Hospital: 11 Friendship Street x Newport Animal Hospital: 541 Thames Street x Claiborne Pell Newport Bridge: Route 138 x Pell School: 35 Dexter Street x Thompson Middle School: 55 Broadway x Rogers High School: 15 Wickham Road x Newport Area Career and Technical Center: 16 Wickham Road x Aquidneck Island Adult Learning Center: 435 Broadway x Naval War College x Naval Station Newport
Critical Historic Structures in the Flood Zone:
x Weatherly (yacht), 49 America's Cup Boulevard, (8/28/12) x Castle Hill Lighthouse, Castle Hill, off Ocean Avenue, at the west end of
Newport Neck (3/30/88) x Fort Adams State Park/Fort Adams, Harris Avenue-Fort Adams (7/28/70) x Newport Harbor Lighthouse, Goat Island (Newport Harbor) (3/30/88) x Ida Lewis Rock Lighthouse, Lime Rock (in Newport Harbor off Wellington
Avenue) (2/25/88) x Seamen's Church Institute, Market Square (8/4/83) x Rose Island Lighthouse, Rose Island (4/10/87) x The Brick Market, 127 Thames Street (10/15/66) NHL 1960 x Perry Mill, 337 Thames Street (1/13/72) x Francis Malbone House, 392 Thames Street (4/28/75) x Samuel Whitehorne House, 414 Thames Street (5/6/71) x Coronet, 449 Thames Street (6/3/04) x Newport Steam Factory, 449 Thames Street (1/20/72), 37 Touro Street
(2/23/72) x Army and Navy YMCA, 50 Washington Square (12/29/88) x Hunter House, 54 Washington Street (11/24/68) NHL x William King Covell III House/Milton H. Sanford House, 72 Washington
Street (5/31/72) Nursing & Elderly Facilities:
x Heatherwood Nursing and Subacute Center, 398 Bellevue Avenue x St. Claire Home, 309 Spring Street x Village House Nursing and Rehabilitation Center, 70 Harrison Avenue
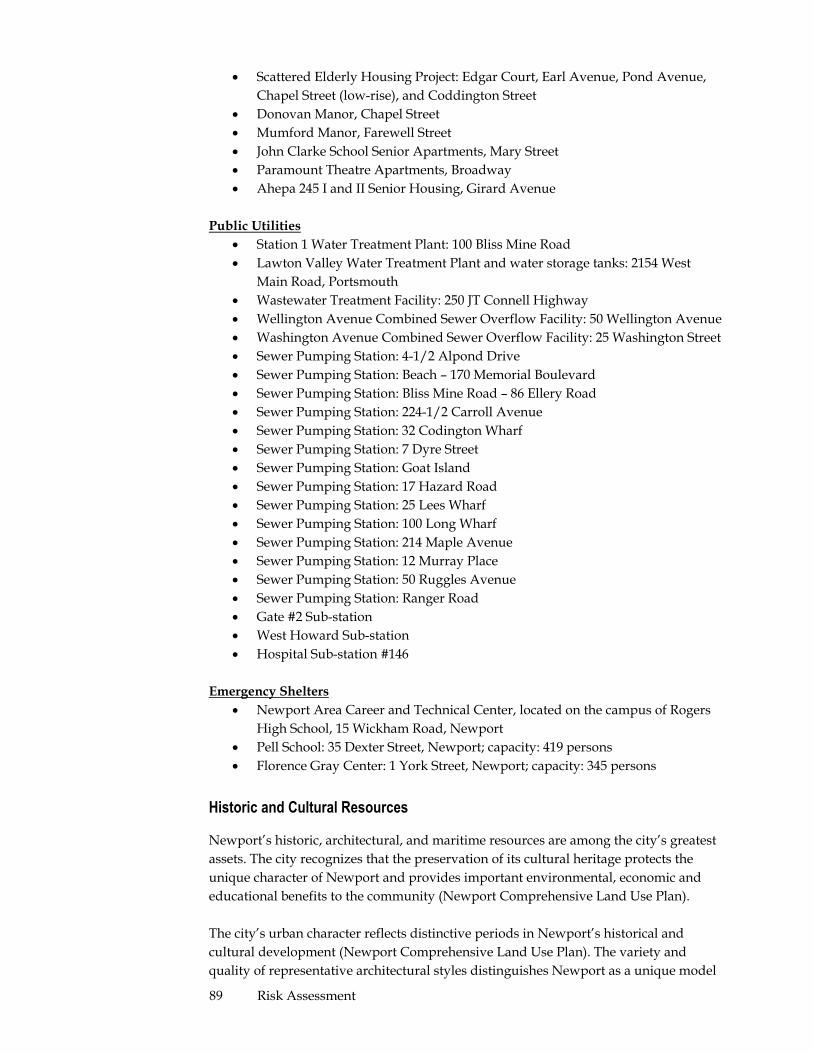
89 Risk Assessment
x Scattered Elderly Housing Project: Edgar Court, Earl Avenue, Pond Avenue, Chapel Street (low-rise), and Coddington Street
x Donovan Manor, Chapel Street x Mumford Manor, Farewell Street x John Clarke School Senior Apartments, Mary Street x Paramount Theatre Apartments, Broadway x Ahepa 245 I and II Senior Housing, Girard Avenue
Public Utilities
x Station 1 Water Treatment Plant: 100 Bliss Mine Road x Lawton Valley Water Treatment Plant and water storage tanks: 2154 West
Main Road, Portsmouth x Wastewater Treatment Facility: 250 JT Connell Highway x Wellington Avenue Combined Sewer Overflow Facility: 50 Wellington Avenue x Washington Avenue Combined Sewer Overflow Facility: 25 Washington Street x Sewer Pumping Station: 4-1/2 Alpond Drive x Sewer Pumping Station: Beach – 170 Memorial Boulevard x Sewer Pumping Station: Bliss Mine Road – 86 Ellery Road x Sewer Pumping Station: 224-1/2 Carroll Avenue x Sewer Pumping Station: 32 Codington Wharf x Sewer Pumping Station: 7 Dyre Street x Sewer Pumping Station: Goat Island x Sewer Pumping Station: 17 Hazard Road x Sewer Pumping Station: 25 Lees Wharf x Sewer Pumping Station: 100 Long Wharf x Sewer Pumping Station: 214 Maple Avenue x Sewer Pumping Station: 12 Murray Place x Sewer Pumping Station: 50 Ruggles Avenue x Sewer Pumping Station: Ranger Road x Gate #2 Sub-station x West Howard Sub-station x Hospital Sub-station #146
Emergency Shelters
x Newport Area Career and Technical Center, located on the campus of Rogers High School, 15 Wickham Road, Newport
x Pell School: 35 Dexter Street, Newport; capacity: 419 persons x Florence Gray Center: 1 York Street, Newport; capacity: 345 persons
Historic and Cultural Resources
Newport’s historic, architectural, and maritime resources are among the city’s greatest assets. The city recognizes that the preservation of its cultural heritage protects the unique character of Newport and provides important environmental, economic and educational benefits to the community (Newport Comprehensive Land Use Plan). The city’s urban character reflects distinctive periods in Newport’s historical and cultural development (Newport Comprehensive Land Use Plan). The variety and quality of representative architectural styles distinguishes Newport as a unique model

90 Risk Assessment
for preservation efforts. Newport’s architectural heritage spans three centuries, and its architecture reflects this with some important 17th century houses, many 18th century buildings, and several post-colonial and Greek Revival structures (Newport Comprehensive Land Use Plan). The current level of preservation in Newport results from the combined efforts of state and municipal commissions as well as the activities of private organizations and individual members of the community (Newport Comprehensive Land Use Plan). Over 1,900 properties are protected by historic area zoning and approximately 40% of the city is part of the Local Historic District. Newport also has a wealth of cultural resources that its residents and visitors enjoy. These include large-scale special events such as the Newport Jazz and Folk festivals, as well as more intimate events like art gallery openings (Newport Comprehensive Land Use Plan). Newport has developed a cultural plan to enhance the cultural experiences of residents and visitors alike (Newport Comprehensive Land Use Plan). National Historic Landmark Districts Certain areas in Newport have been designated as National Historic Landmark Districts. Bellevue Avenue National Historic Landmark District: This historic district is an assemblage of American architecture distinguished by the variety of styles and famous architectural firms represented. The district includes Gothic Revival villas, stick- and shingle-style buildings, and great summer palaces of the late 19th century (National Historic Landmarks Program). The area of this district is east and west of Bellevue Avenue from Memorial Boulevard to the Atlantic Ocean at Land’s End, bounded on the east by Easton Bay and the west by properties along the west side of Bellevue Avenue. It was designated on May 11, 1976. Fort Adams National Historic District: Based on French military design and completed in 1857, Fort Adams is an outstanding example of American military engineering and technology. It was designed by Simon Bernard, and Joseph G. Totten supervised its construction (National Historic Landmarks Program). It is located at Fort Adams Road at Harrison Avenue and was designated December 8, 1976. Newport National Historic Landmark District: From around 1740 until the Revolution, when it was occupied by the British, Newport flourished as a port and mercantile center and as Rhode Island’s colonial capital. The district’s Georgian public buildings and mansions are among the most advanced in style of any erected in the Colonies. Rows of small dwellings and shops, largely near the waterfront, form a harmonious ensemble of buildings that relate to each other in scale, texture, mass and materials, and also give the area architectural distinction. Providence became the capital and most important urban center of the state after the Revolution, and Newport was left to slumber until it became a prosperous summer resort in the 19th century (National Historic Landmarks Program). The area included in this district is bounded on the north by Van Zandt Avenue; east and north by Farewell Street, Warner Street, Spruce Street, and Oak Street; east by Broadway, Bull Street, Whitfield Place, and Touro Street;

91 Risk Assessment
south on William and Golden Hill Streets; east on Spring Street; south on Pope Street; west on Thames Street; from America’s Cup Avenue west to Narragansett Bay, and from the Goat Island Collector north to Sycamore Street (Newport Comprehensive Land Use Plan). The district received its designation on May 25, 1968. Ocean Drive National Historic Landmark District: This large historic district includes the southwestern tip of Newport. It has a rugged, informal character, as compared with the formal aspect of the Bellevue Historic District. It includes early farms and elaborate summer homes, as well as landscapes designed by the Olmsteds to accord with the natural contours of rocky cliffs, green hills and pastures (National Historic Landmarks Program). The area was favored by 19th century industrial magnates and the social elite. The district includes all of Ocean Drive from Almy Pond west to Wellington Avenue and Newport Harbor (Newport Comprehensive Land Use Plan). It received its designation on May 11, 1976. U.S. Naval War College Historic Landmark District: The island originally known as “Weenachasett” was sold by the local Native American population to John Green and Benedict Arnold on May 22, 1658. Before acquisition by the U.S. Navy in 1881, the island remained undeveloped except for a hospital built in 1716 and a quarantine house was built to accommodate persons suspected of having smallpox constructed in the early nineteenth century. This structure later served as a deaf 'and dumb asylum as well as poor house for the city. In the summer of 1880, the U.S. Navy appointed a board of naval officers to find a suitable place for a Naval Training Station. In December 1880 the board reported in favor of Coasters Harbor Island and in 1881 the island was purchased by the U.S. Navy. At the time of transfer, the appraised value of the island was $190,000, consisting of 92 acres of land, an old asylum building and a house. The asylum and other buildings on the island were vacated in June 1884. On June 13, 1884 the naval board recommended that the proposed war college be located at Newport, Rhode Island, on Coasters Harbor Island and be housed in the old Asylum building there. On October 6, 1884 the Secretary of the Navy issued General Order No. 325 which ordered that "A College is hereby established for an advanced course of professional study for naval officers, to be known as the Naval War College," describing the first military service training facility to be called a "war college." In the Naval Appropriations Act approved March 2, 1889, Congress provided $100,000 to design, erect and furnish a building for the Naval Torpedo School and War College. The school, then situated on Goat Island, was to remain there according to specification in this act, however the site of the building was changed in 1890 to Coasters Harbor Island where there was much more space. The War College Building constructed at this time was given the name Luce Hall. Other large buildings have been constructed directly north of Luce Hall, and most of the island is developed for a variety of Navy facilities. A large modern complex for the war college was constructed in the early 1970s and is located North of the Luce Hall complex. National Historic Districts Bellevue Avenue/Casino Historic District: Built in 1880-1881, this shingle-style wood-frame complex of buildings is architecturally significant as an early design of the famed American architectural firm of McKim, Mead, and White. It is also one of the first examples of the suburban and resort country clubs built with recreational

92 Risk Assessment
facilities, which were a new feature of the sophisticated social life of the 1880s. The Casino District hosted the U.S. Lawn Tennis Championships from 1881 to 1914 and has continued as a site for international tennis tournaments. Today it includes the International Tennis Hall of Fame (National Historic Landmarks Program). The area falls within 170-230 Bellevue Avenue. It was designated a National Historic District on February 27, 1987 (Newport Comprehensive Land Use Plan). Kay Street/Catherine Street/Old Beach Road Historic District: This area is near Newport’s well-known Bellevue Avenue and features various 19th century Greek Revival, American stick, and Queen Anne style architecture. This district was added on May 22, 1973 (Newport Comprehensive Land Use Plan). Ochre Point/Cliffs Historic District: Ochre Point is a residential area about 230 acres in extent, projecting into the ocean near the middle of the east side of Newport. North of the north-eastern portion of Ochre Point and sharing the Point’s precipitous shoreline is an area known as The Cliffs, which is also part of the Historic District. This section runs from the Forty Steps, which go down to the water at the east end of Narragansett Avenue, to a termination at the north, at-Memorial Boulevard, and has as its western boundary Cliff Avenue, which runs south from the boulevard only part of the way to Ochre Point. Because of its airiness, view, and relative inaccessibility to the general public, this area became a desirable summer residence location, and four estates were built there. Of these estates, excepting the 18th century John Easton farmhouse on a small property, is Cliff Lawn, built c. 1870 at the boulevard end and today is a restaurant or inn. To its south are the Hopedene, Seaward, and Ocean Lawn summer houses – the last a mansion dating from the 1880s and the first two dating respectively from the beginning and the middle of the 1900s and probably replacing Victorian villas. The Ochre Point-Cliffs Historic District also includes the Cliff Walk from its beginning at Memorial Boulevard south to Marine Avenue (the remainder of the Walk is included in the eastern perimeter of the Bellevue Avenue Historic District). The Cliff Walk is a foot path of unusual beauty, approximately three miles in total length, running along the crest of the Cliffs, with the sea below and the gardens of the District’s estates on the west (National Register of Historic Places Inventory-Nomination Form, 1969). The district received its designation on May 18, 1975 (Newport Comprehensive Land Use Plan). Fort Hamilton (Rose Island) Historic District: Fort Hamilton is a quadrilateral, irregular, bastioned fort located on Rose Island in Narragansett Bay facing the entrance to the Bay’s East Passage at the entrance to Newport Harbor. The fort is composed of several distinct characteristic elements of 18th and early 19th century fortification design, which survive with considerable integrity, although the island was reused in the late 19th and early 20th centuries for explosives storage, ordnance testing, and torpedo manufacturing (National Register of Historic Places Registration form, 1995). The fort was designated a National Historic District in 2001 (Newport Comprehensive Land Use Plan). Southern Thames Historic District: in 2008 The Southern Thames Historic District is set in the port city of Newport on a west sloping, harborside location. It includes a large neighborhood divided into a grid of narrow lots by two major north-south arteries, Thames Street and Spring Street, and by

93 Risk Assessment
many cross streets running east-west up the hill from the waterfront. Historically a mostly working-class Irish neighborhood (though dating back in its origins to the 17th century), the Southern Thames area flourished and expanded between 1850 and 1920, experienced a stable period in the mid-20th century, until once again it became a desirable neighborhood in the 1980s. Physically, the area’s building stock is overwhelmingly late-19th-century—compact, unassuming, cohesive. The district is divided into three areas: a residential area, the Thames Street commercial corridor, and the waterfront. Newport Historic Landmarks x Edward King House, Aquidneck Park and Spring Streets (10/15/70) NHL 1971 x Redwood Library, 50 Bellevue Avenue (10/15/66) NHL x The Newport Casino and The Van Alen Casino Theatre and Newport Performing
Arts Center (The Casino Theatre), 194 Bellevue Avenue (12/2/70) NHL 1987 x Kingscote, NW corner of Bellevue Avenue and Bowery Street (5/17/73) NHL
6/13/96 x Marble House/William K. Vanderbilt House, Bellevue Avenue, between Bancroft
and Yznaga Streets (8/10/71) NHL 1976 x Wanton-Lyman Hazard House, 17 Broadway (10/15/66) NHL x Vernon House, 46 Clarke Street (11/24/68) NHL x United States Naval War College, Coaster's Harbor Island (10/15/66) NHL x The Breakers/Cornelius Vanderbilt II House, Ochre Point Avenue (9/10/71) NHL
10/12/94 x Isaac Bell House/Edna Villa, 70 Perry Street (1/13/72) NHL 9/25/97 x William Watts Sherman House, 2 Shepard Avenue (12/30/70) NHL 1971 x Trinity Church, 141 Spring Street (11/24/65) NHL x The Brick Market, 127 Thames Street (10/15/66) NHL 1960 x Touro Synagogue, 85 Touro Street (10/15/66) NHL x Hunter House, 54 Washington Street (11/24/68) NHL x The Old Colony House/The Old State House, Washington Square (10/15/66) NHL x The Elms/Edward J. Berwind House, Bellevue Avenue, between Bellevue Court and
Dixon Street (9/10/71) NHL 1996

94 Risk Assessment
National Register of Historic Places x Weatherly (yacht), 49 America's Cup Boulevard, (8/28/12) x The Art Association of Newport/John N.A. Griswold House, 76 Bellevue Avenue
(11/5/71) x Charles H. Baldwin House, Bellevue Avenue, opposite Perry Street (5/6/71) x Wetmore House, Bellevue Avenue, bounded by Leroy, Lawrence, Shepard Avenues
(11/8/68) x Rosecliff/Herman Oelrichs House, Bellevue Avenue, between Marine and Yznaga
Streets (2/6/73) x "The Bird's Nest," 526 Broadway at One Mile Corner (6/9/82) x Castle Hill Lighthouse, Castle Hill, off Ocean Avenue, at the west end of Newport
Neck (3/30/88) x Clarke Street Meeting House/Second Congregational Church, 13-17 Clarke Street
(1/25/71) x Henderson House/Ezra Stiles House, 14 Clarke Street (3/16/72) x Armory of the Newport Artillery Company, 23 Clarke Street (6/30/72) x President's House, U.S. Naval War College, Coaster's Harbor Island (9/18/89) x Dr. Charles Cotton House, 5 Cotton Court (1/13/72) x Emmanuel Church, 42 Dearborn Street (5/16/96) x Lucas-Johnston House/Augustus Lucas House, 40 Division Street (5/6/71) x Common Burying Ground and Island Cemetery, Farewell Street and Warner Street
(5/1/74) x Fort Adams State Park/Fort Adams, Harris Avenue-Fort Adams (7/28/70) x Newport Harbor Lighthouse, Goat Island (Newport Harbor) (3/30/88) x Commandant's Residence, Quarters #1, Fort Adams Harrison Avenue, Fort Adams
(5/8/74) x Miantonomi Memorial Park and WW I Memorial Tower, between Hillside and
Girard Avenues (6/23/69) x Ida Lewis Rock Lighthouse, Lime Rock (in Newport Harbor off Wellington Avenue)
(2/25/88) x Malbone, Malbone Road (10/22/76) x Seamen's Church Institute, Market Square (8/4/83) x The White Horse Tavern, 26 Marlborough Street (1/23/72) x John Tillinghast House, 142 Mill Street (4/11/73) x Rose Island Lighthouse, Rose Island (4/10/87) x Shiloh Church/Trinity School House, 25 School Street (8/12/71) x United Congregational Church, Spring and Pelham Streets (11/19/71) x Bull-Mawdsley House, 228 Spring Street (7/2/72) x Perry Mill, 337 Thames Street (1/13/72) x Francis Malbone House, 392 Thames Street (4/28/75) x Samuel Whitehorne House, 414 Thames Street (5/6/71) x Coronet, 449 Thames Street (6/3/04) x Newport Steam Factory, 449 Thames Street (1/20/72), 37 Touro Street (2/23/72) x Joseph Rogers House/Preservation Society of Newport County Headquarters x Levi H. Gale House/Jewish Community Center, 89 Touro Street (5/6/71) x Army and Navy YMCA, 50 Washington Square (12/29/88)

95 Risk Assessment
x William King Covell III House/Milton H. Sanford House, 72 Washington Street (5/31/72)
x St. Mary’s Church, 14 William Street (3/6/08)
3.3.1.4 Natural Environment
Water Resources, Watershed
Freshwater Wetlands While freshwater wetlands in Newport do not support commercially valuable fish/shellfish populations, Newport’s shallow freshwater wetlands are particularly important as buffers around the coastal ponds (Almy and Lily) in the southern part of the city and at the northern end of Easton Pond. Occurring elsewhere throughout the Newport Neck area, wetlands contribute significantly to the diversity of plant life and wildlife in the area and to its scenic value. Most of the inventories of Newport’s freshwater wetlands, fish, animal, and bird populations have been compiled from “guesstimates” based on what is present in the rest of the state. In order to accurately evaluate the combined significance of Newport’s natural resources, more accurate inventories should be created and maintained. It is important to recognize, for example, that while the removal of a single small wetland area may not seem to be significant, the accumulated loss of many small wetlands scattered across a larger area may, indeed, pose a threat. Saltwater Resources The coastline plays a key ecological role in providing habitat for vegetation and wildlife. Inlets, coves, and tidal pools along the city’s undeveloped coast, particularly in the Ocean Drive area and including the large salt marsh at Cherry Neck Creek, function as nurseries and feeding grounds for many coastal and estuarine species. Narragansett Bay has an active shellfish and fish industry and includes important species like lobster and quahog (Newport Comprehensive Land Use Plan). Prior to installing a new wastewater treatment plant, Newport had difficulty complying with federal and state clean water standards (Newport Comprehensive Land Use Plan). Due to the water quality issues, Newport Harbor is closed for shellfish harvesting. Newport Harbor A Special Area Management Plan was originally developed in 1984 for Newport Harbor and was updated in 2009 to include the entire west side of Aquidneck Island. Additionally, a Harbor Management Plan was most recently updated in 2010 to establish Newport’s goals, objectives, and policies for the public and private uses of its tidal waters (Newport Comprehensive Harbor Management Plan). Together, these documents aid the City of Newport in managing the many uses of one of its most valuable resources.

96 Risk Assessment
Protected Natural/Special Areas
The Cliff Walk Along the shore on the eastern side of the Newport, a unique walkway, 3.5 miles in length, extends along the cliffs at the water's edge. The Walk, from Newport (Easton’s) Beach at the northern entrance to Bailey’s (Spouting Rock) Beach on the southern end, is about 10 feet wide and passes over cliffs ranging in height from 10 to 50 feet. By the late 19th century, the public right to the Cliff Walk had become universally established and accepted. At every point there are spectacular views of the coastline, the open ocean, surf (and surfers), shore birds, and other forms of wildlife. In addition, the Cliff Walk affords a commanding view of Newport’s now famous mansions and their spacious grounds, access to which can be gained only from Bellevue Avenue. Beaches Beaches in Newport, except for one small area, are either public (owned by the city or state) or semi-public (owned by individual corporations or companies comprising beach club members).
x Easton’s Beach: The largest public beach in Newport, it is a major community facility and a prime attraction for visitors. Major improvements were made to Easton’s Beach including boardwalk improvements, parking lot resurfacing, and a re-built pavilion.
x King Beach: Located on Ocean Drive, King Beach is primarily a fishing beach with a place to swim and launch small boats.
x Fort Adams Beach: This beach is part of Fort Adams State Park, which is located at the mouth of Newport Harbor. Other recreational activities at Fort Adams include fishing, boating, soccer, rugby, and picnicking.
x Bailey’s Beach: Located off of Ocean Drive, this is a private beach and club, owned by the Sprouting Rock Beach Association. The northeast section of the beach is open to the public and is known as “Reject’s Beach.”
x Gooseberry Beach: This beach is set back in a cove adjacent to Bailey Beach and is open to the public.
x Collins Beach: A private beach located to the south of Castle Hill. x Hazard’s Beach: A private beach located off of Ocean Avenue.
Major Parks Major parks are sizable tracts of land that may be adapted to many different uses. The two major parks in Newport are Fort Adams State Park, located on the Fort Adams peninsula, and Brenton Point State Park, located on the Ocean Drive. Brenton Point State Park, with its spectacular view of the Atlantic Ocean, has been turned into a major recreational facility. Besides a large parking lot, a substantial area has been dedicated to an expansive monument to the early Portuguese explorers. Inland is a large natural area of fields and trees, as well as a building, originally the stable-garage for the Davis-Budlong Estate, and now containing information facilities and restrooms. Another section of the park contains a marsh, a raised interior lot, and a segment of land on the shore with a small beach and boat ramp.

97 Risk Assessment
Fort Adams State Park comprises Fort Adams itself, extensive surrounding grounds, and an access route bordering Hammersmith Farm to Brenton Cove from Harrison Avenue. The fort buildings proper are not open to the public, as they require extensive restoration. The surrounding grounds, besides providing space for soccer and rugby fields, are open for passive recreation. During the winter, sections of the park above the soccer fields have become favorite sledding areas.
3.4 Risk Analysis and Assessment Matrix Risk assessment is the determination of the likelihood of adverse impacts associated with specific natural hazards to the built, natural, business, and social environments. (Heinz Coastal Hazards Panel Report, 1999, p.110) In order to assess the risk of the City of Newport to the hazards previously identified, the NOAA Community Risk Assessment Tool was used to determine the frequency, area of impact and potential damage magnitude of each hazard.
3.4.1 Methodology
Evaluating the number of times that the natural hazard has impacted Newport or a region within Rhode Island in the past provides a measure of the likelihood of the event occurring again in the future. This rating is derived from an investigation of trends in the long-term (30 years at least) data. Examination of past events helps to determine the probability of similar events occurring in the future, which is shown in Table 3-22. Table 3-22. Frequency Score Approximate Recurrence (years)
Approximate Annual Probability
Subjective Description Frequency Score
1 100.0% Frequently recurring hazards, multiple recurrences in one lifetime
5
50 2.0% Typically occurs at least once in lifetime of average building
4
250 0.40% 25% chance of occurring at least once in lifetime of average building
3
500 0.20% 10% chance of occurring at least once in lifetime of average building
2
1000 0.10% Highly infrequent events, e.g. maximum considered earthquake
1
25000 0.004% Unlikely event 0
3.4.1.1 Exposure Analysis
A second criteria used in evaluating the risk of Newport to natural hazards is to determine the area of impact. Some hazard events impact only a small region, while

98 Risk Assessment
others can affect the entire area. The area of impact determination, shown in Table 3-23, indicates how much of the immediate area is impounded by a single event. Again, historical data was used to investigate damage and loss records of previous hazard events to develop an estimate of the amount of property damage that may occur from future events. Table 3-23. Area of Impact Score Mean Affected Area (sq. miles)
Subjective Description Area Score Impact
0 No affected area 0 1 Highly localized (city block scale) 1 10 Single zip code impact 2 50 City scale impact 3 100 County scale impact 4 500 Regional impact (e.g. statewide) 5
3.4.1.2 Historical Analysis
Intensity or magnitude criteria are used to determine the range of the severity of damage (from minor to devastating) expected from a single event. Previous damage reports and other historical data (e.g. newspaper articles, personal accountings, video clips, etc.) are used in assigning this number, which is shown in Table 3-24. Table 3-24. Hazard Magnitude Measuring Magnitude Score Earthquake MMI Hurricane SSI Average Flood
Elevation 0 3 0 0 1 4 1 1 2 5 2 8 3 7 3 12 4 9 4 14 5 12 5 24
Repetitive and Severe Repetitive Loss Properties
The Severe Repetitive Loss (SRL) grant program was authorized by the Bunning-Bereuter-Blumenauer Flood Insurance Reform Act of 2004, which amended the National Flood Insurance Act of 1968 to provide funding to reduce or eliminate the long-term risk of flood damage to severe repetitive loss structures insured under the National Flood Insurance Program. Under this program the riskiest SRL properties could be targeted and owners would be offered financial help to get their buildings high and dry: either moved to a safer location or elevated well above the flood elevations. However, the SRL program was eliminated by July 2013 based on the Biggert Water Flood Insurance Reform Act of 2012. The City of Newport has nine severe repetitive loss residential properties and twelve severe repetitive loss commercial properties. This area has been targeted as a high

99 Risk Assessment
priority for mitigation action. Although the SRL program has been terminated, applicants with eligible properties are still able to apply for assistance under the Flood Mitigation Assistance (FMA) Program. Residential or non-residential properties currently insured with the NFIP are eligible to receive FMA funds and must meet the definitions of either a repetitive loss property or severe repetitive loss property.
3.4.2 Vulnerability Summary
The measure of vulnerability of a community includes the potential for direct damage to residential, commercial, and industrial property, as well as to schools, government, and critical facilities. It also includes the potential for disruption of communication and transportation following disasters. Any disruption of the infrastructure, such as a loss of electric power or a break in gas lines, can interrupt business activity and cause stress to affected families, particularly if they are forced to evacuate their residences and are subject to shortage of basic supplies. If the destruction of the infrastructure causes additional damage (e.g., property destroyed by fires caused by breaks in the gas lines), this vulnerability needs to be taken into account. One also has to consider the exposure of the population to each hazard type and the potential number of fatalities and injuries to different socioeconomic groups. Table 3-25 summarizes those areas considered most vulnerable and having the most impact on the city. Hurricanes As with the rest of Rhode Island and other New England states, Newport is particularly vulnerable to hurricanes. One reason is due to the geography of southern New England in relation to the Atlantic seaboard. Historically, most hurricanes that have struck the New England region re-curved northward on tracks that paralleled the eastern seaboard by maintaining a slight north-northeast track direction. The states of Connecticut, Rhode Island, and Massachusetts geographically project easterly into the Atlantic and have southern exposed shorelines, which place them in direct line of any storm that tracks in this manner. Therefore, even though New England is a relatively far distance from the tropics, its susceptibility to hurricane strikes can statistically be greater than other states closer to the tropics. Another explanation giving evidence to New England’s unique vulnerability to hurricanes is that hurricanes that eventually strike the region undergo significant increases in forward speed. Historically, it can be shown that hurricanes tend to lose their strength and accelerate in a forward motion after passing the outer banks of Cape Hatteras, North Carolina. The increase in forward speed that usually occurs simultaneously as a hurricane weakens with further northward movement can often compensate for any discounting in hurricane intensity. Surge flooding, wave effects, and wind speeds that accompany a faster moving, weaker hurricane may exceed overall conditions caused by more intense hurricanes. This means that for some locations, depending on the meteorology of the storm, the affects from a Category 2 hurricane traveling at 60 MPH might be worse than that from a Category 4 hurricane moving at 20 MPH. There are primarily three components of vulnerability from the impact of a hurricane: storm surge (coastal flooding); ability to evacuate in a timely manner; and shelter capacity. Storm surge has the potential to create a serious problem in Newport because

100 Risk Assessment
the waters can rise to high levels with the potential to cover roads and bridges completely with water. If roads are inundated with water evacuation routes can be eliminated, which can be of particular concern in frequently flooded areas such as downtown Newport. Electrical utilities and communications, as well as transportation infrastructure, are vulnerable to significant coastal events. Damage to power lines or communication towers has the potential to cause power and communication outages for residents, businesses and critical facilities. In addition to lost revenues, downed power lines present a threat to personal safety. Furthermore, downed wires and lightning strikes have been known to spark fires. Human vulnerability is based on the availability, reception, and understanding of early warnings of coastal hazard events (i.e., Hurricane Watches and Warnings issued by the NWS), as well as access to substantial shelter and a means and desire to evacuate if so ordered. In some cases, despite having access to technology (computer, radio, television, outdoor sirens, etc.) that allows for the reception of a warning, language differences are sometimes a barrier to individuals understanding them. Once warned of an impending significant coastal hazard event, seeking shelter in a substantial indoor structure, that is wind resistant and outside of storm surge zones, is recommended as the best protection against bodily harm. Tornadoes Tornadoes are high-impact, low-probability hazards whose effect is dependent on its intensity and the vulnerability of development in its path. Tornado vulnerability is based on building construction and standards, the availability of shelters or safe rooms, and advanced warning capabilities. Even well-constructed buildings are vulnerable to the effects of a stronger (generally EF-2 or higher) tornado. Due to the relatively low incidence and risk for tornado, traditional “Tornado Alley” mitigation methods such as tornado safe rooms may not be economically feasible in Rhode Island to appear in the NCDC database. In the twenty tornadoes that have touched down in Rhode Island since 1950, only one, a weak F0, touched down east of Newport in 1972 (Storm Prediction Center). Although no damage was sustained from this tornado, it demonstrates that Newport, like the rest of Rhode Island, is susceptible to the occurrence of tornadoes. The type and age of construction plays a role in vulnerability of facilities to tornadoes. In general, concrete, brick and steel-framed structures tend to fare better in tornadoes than older, wood-framed structures. High Wind and Thunderstorms The impact of wind can be measured in financial terms as well as fatalities and injuries. Wind vulnerability is based in large part on building construction and standards. Other factors, such as location, condition, and maintenance of trees, also plays a significant role in determining vulnerability. All facilities within Rhode Island are considered equally vulnerable to thunderstorms. The location and construction of a facility plays a role in how it will be affected by lightning and hail incidents. If a structure is located on a hilltop, is tall or has other tall structures around it, or has large exposed windows, it may be damaged during a storm. Communications and power

101 Risk Assessment
supplies may be compromised during thunderstorms, and some critical facilities might not be equipped with a backup power source. Annualized property damages from wind, lightning, and hail can be very costly. Between 1956 and 2012 Newport County are $26,105 with total damages amounting to $1,540,188. As previously described, the NCDC loss estimates are only available at the county level and are believed to be an underrepresentation of the actual losses experienced due to hazards as losses from events that go unreported or that are difficult to quantify are not likely to appear in the NCDC database; this is especially true with crop damages. Winter In general, Newport does not experience winter weather of the same significance and frequency with which it affects the northwestern areas of Rhode Island. However, effects from winter storms can still be severe. Electrical utilities and communications, as well as transportation infrastructure, are vulnerable to damages from winter storms. Damage to power lines or communication towers has the potential to cause power and communication outages for residents, businesses and critical facilities. In addition to lost revenues, downed power lines present a threat to personal safety. Further, downed wires have been known to spark fires. Based on NCDC data, Rhode Island can expect approximately six events and damages upward of $808,098 annually in winter weather related damages. The current facilities dataset does not contain attribute information to accurately quantify facility vulnerability due to winter weather. Facility data necessary for vulnerability assessment would include, but not be limited to, roof type, building construction type, building and contents values, and use. For example, identifying the type of roof would determine whether or not the roof is flat and therefore more susceptible to failure under heavy snow loads. To address the vulnerability of infrastructure to the impacts of ice storms, it would be important to complete an inventory of utility lines as they are very susceptible to breakage when ice forms on the lines, which, of course, could result in power failure. It would also be important to describe this potential impact (such as a power failure) in terms of the direct impact on Rhode Island’s economy. In addition, building construction type, particularly roof span and construction methods, support the capacity of a building to withstand severe stress weights from snow. Human vulnerability is based on the availability, reception and understanding of advanced warnings of impending significant winter weather events (i.e. Winter Storm Watches and Warnings issued by the NWS) and heeding the advice of local officials. In some cases, despite having access to technology (computer, radio, television, etc.) that allow for the reception of a watch or warning, language differences are sometimes a barrier to individuals understanding and responding to them. Winter storms, ice storms, and extreme cold can adversely affect people, some more than others. Infants and those persons 65 years of age or older are especially vulnerable. Flood All areas of Rhode Island continue to be vulnerable to flooding and the impacts associated with this natural hazard. Rhode Island is a water-rich state in that it has

102 Risk Assessment
many rivers, streams, and brooks flowing within its boundaries and between other states. Past land use patterns and the continued use of structures within areas vulnerable to flooding will continue to promote future risk and vulnerability of flood impacts to structures and people. Local land use regulations and ordinances have done much to curb unregulated development within flood hazard areas. However, Newport is an old city that developed around Newport Harbor, and there is a substantial amount of residential and business properties located within coastal flooding areas. Coastal Erosion New development along coastal areas in Newport is regulated by CRMC and the City of Newport. One regulation requires a Coastal Buffer Zone, or a “land area adjacent to a Shoreline (Coastal) Feature that is, or will be, vegetated with native shoreline species and which acts as a natural transition zone between the coast and adjacent upland development,” on property within 200 feet of the inland edge of a coastal feature. The benefits of the Coastal Buffer Zone include protection of water quality, protection of coastal habitat, protection of scenic and aesthetic quality, erosion control, and flood control. Dam Breach RIDEM has the responsibility to inspect dams and determine their condition (Dam Safety Program report 2013). In accordance with Dam Safety Regulations, visual inspections of significant hazard dams are required every five years (Dam Safety Program report 2013). As part of each visual inspection, the condition of the major components of the dam are subjectively rated as good, fair or poor. According to the 2015 Annual Report to the Governor on the Activities of the Dam Safety Program, there are no significant or high hazard dams in Newport. Fire Greater than 50% of the structures in Newport were built prior to 1950, and the majority of those structures are predominantly wooden and situated in high housing density areas. While wildfires are not especially common in Rhode Island and are less likely in the mostly developed city of Newport, urban fires still pose a substantial risk to the city. Newport has had several occurrences of urban fires. Today the enforcement of proper zoning and quality emergency response are the best way to minimize the effects of urban fires. Geologic An earthquake risk assessment is difficult because of the challenge to monetize potential damages accurately. FEMA has developed a software suite, HAZUS-MH, for estimating potential losses to natural disasters. The HAZUS-MH earthquake model was utilized to estimate damage and loss to buildings, lifelines, and essential facilities from deterministic (scenario-based) and probabilistic earthquakes. Estimates for the annualized losses in Newport County were based on the historic earthquakes of 1755 in Cape Ann, which had a magnitude 6.5, and the 1951 North Kingstown, which had a magnitude 5.0. The annualized economic losses based on data from these earthquakes for Newport County are projected as $183,329 for an earthquake that could possibly happen today. Though the projected economic impacts resulting from these

103 Risk Assessment
simulations may appear low, the results do indicate that attention does need to be given to potential economic impacts as a result of earthquakes. Currently, the Rhode Island Building Code follows the Building Official & Code Administration (BOCA) code, which has very basic earthquake provisions. Thus, an even moderate earthquake could cause severe damage to aged structures and unreinforced masonry buildings. In addition, these codes are only for new structures, and they do not take into account past structures like the “classic mill building.” So, although New England is considered to have a moderate seismic risk, in general it has a high seismic vulnerability because of the built environment. In addition to the physical characteristics of the soil and built environment, one of the most critical factors of vulnerability is low public awareness. In Rhode Island, there is little public recognition of earthquake threat, and no established system of educating or informing the public of the threat or how to prepare for or respond during an earthquake. Therefore, higher losses will occur than in other regions of the country. Although Rhode Island has not suffered a major quake in modern times, seismicity is occurring, and any strong earthquake in the northeast region may affect the area to some degree. Inherent risks to life and property are: the increase in population since the Cape Ann earthquake (magnitude 6.25) of 1755; buildings that were built prior to seismic building code regulation; older infrastructure, which is vulnerable to any ground shaking; and any construction in “filled areas,” which would be victim to liquefaction. The high number of old buildings (many from the 17th and 18th centuries) in Newport make the city’s property particularly vulnerable to the effects of earthquakes. Drought The entire state is susceptible and vulnerable to the occurrence of a drought event. Although the Newport Water Division has an extensive network of reservoirs across five municipalities, it is nonetheless susceptible to the effects of drought. Newport already suffers from frequent water quality issues, in particular from THMs, and these water quality issues can be exacerbated by drought due to depleted reservoirs levels and warming water temperatures. The vulnerability of the state to drought is increasing as water use and land use change. People tend to assume that plentiful water is the norm for Rhode Island, when in fact, occasional droughts of at least moderate intensity and duration have occurred in the state. Impacts from droughts can be moderated through mitigation planning and preparedness. Because droughts are a normal part of any climate, it is important to have a plan in place providing for response actions. Rhode Island is highly vulnerable to a drought occurrence, whether short- or long-term in duration. Impacts will be costly in both social and economic terms. The responsibility for drought planning lies with the Rhode Island Water Resources Board. Extreme Heat

104 Risk Assessment
An extreme heat event would be a regional issue affecting Newport and significant portions of Southern New England. Extreme Heat is a rare occurrence in the region and is not expected to increase during the life of this plan. For the purposes of this plan, extreme heat is included as a precursor or contributor to potential of dangerous drought conditions described above.
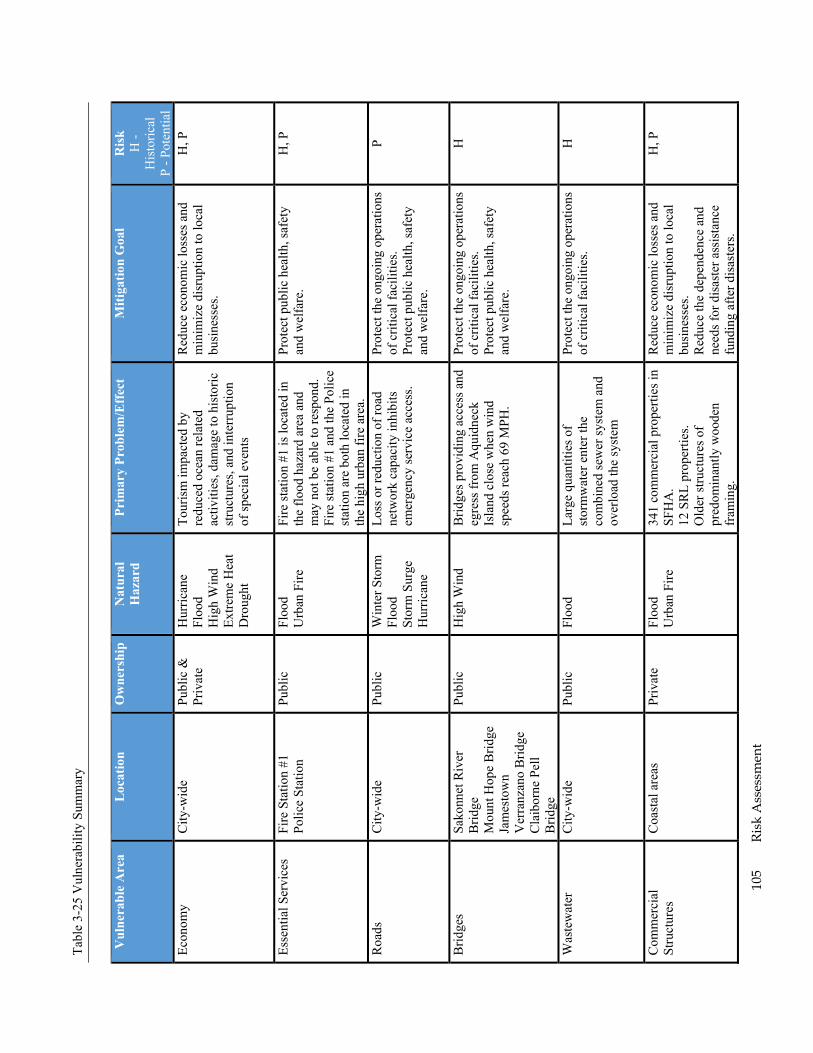
10
5 Ri
sk A
sses
smen
t
Tabl
e 3-
25 V
ulne
rabi
lity
Sum
mar
y
Vul
nera
ble
Are
a
Loc
atio
n O
wne
rshi
pN
atur
al
Haz
ard
Prim
ary
Prob
lem
/Eff
ect
Miti
gatio
n G
oal
Ris
k H
-H
isto
rical
P
- Pot
entia
l Ec
onom
y C
ity-w
ide
Publ
ic &
Pr
ivat
e H
urric
ane
Floo
d H
igh
Win
d Ex
trem
e H
eat
Dro
ught
Tour
ism
impa
cted
by
redu
ced
ocea
n re
late
d ac
tiviti
es, d
amag
e to
his
toric
st
ruct
ures
, and
inte
rrup
tion
of sp
ecia
l eve
nts
Red
uce
econ
omic
loss
es a
nd
min
imiz
e di
srup
tion
to lo
cal
busi
ness
es.
H, P
Esse
ntia
l Ser
vice
s Fi
re S
tatio
n #1
Po
lice
Stat
ion
Publ
ic
Floo
d U
rban
Fire
Fi
re st
atio
n #1
is lo
cate
d in
th
e flo
od h
azar
d ar
ea a
nd
may
not
be
able
to re
spon
d.
Fire
stat
ion
#1 a
nd th
e Po
lice
stat
ion
are
both
loca
ted
in
the
high
urb
an fi
re a
rea.
Prot
ect p
ublic
hea
lth, s
afet
y an
d w
elfa
re.
H, P
Roa
ds
City
-wid
e Pu
blic
W
inte
r Sto
rm
Floo
d St
orm
Sur
ge
Hur
rican
e
Loss
or r
educ
tion
of ro
ad
netw
ork
capa
city
inhi
bits
em
erge
ncy
serv
ice
acce
ss.
Prot
ect t
he o
ngoi
ng o
pera
tions
of
crit
ical
faci
litie
s. Pr
otec
t pub
lic h
ealth
, saf
ety
and
wel
fare
.
P
Brid
ges
Sako
nnet
Riv
er
Brid
ge
Mou
nt H
ope
Brid
ge
Jam
esto
wn
Ver
ranz
ano
Brid
ge
Cla
ibor
ne P
ell
Brid
ge
Publ
ic
Hig
h W
ind
Brid
ges p
rovi
ding
acc
ess a
nd
egre
ss fr
om A
quid
neck
Is
land
clo
se w
hen
win
d sp
eeds
reac
h 69
MPH
.
Prot
ect t
he o
ngoi
ng o
pera
tions
of
crit
ical
faci
litie
s. Pr
otec
t pub
lic h
ealth
, saf
ety
and
wel
fare
.
H
Was
tew
ater
C
ity-w
ide
Publ
ic
Floo
d La
rge
quan
titie
s of
stor
mw
ater
ent
er th
e co
mbi
ned
sew
er sy
stem
and
ov
erlo
ad th
e sy
stem
Prot
ect t
he o
ngoi
ng o
pera
tions
of
crit
ical
faci
litie
s.
H
Com
mer
cial
St
ruct
ures
C
oast
al a
reas
Pr
ivat
e Fl
ood
Urb
an F
ire
341
com
mer
cial
pro
perti
es in
SF
HA
. 12
SR
L pr
oper
ties.
Old
er st
ruct
ures
of
pred
omin
antly
woo
den
fram
ing.
Red
uce
econ
omic
loss
es a
nd
min
imiz
e di
srup
tion
to lo
cal
busi
ness
es.
Red
uce
the
depe
nden
ce a
nd
need
s for
dis
aste
r ass
ista
nce
fund
ing
afte
r dis
aste
rs.
H, P

10
6 Ri
sk A
sses
smen
t
Tabl
e 3-
25 V
ulne
rabi
lity
Sum
mar
y
Vul
nera
ble
Are
a
Loc
atio
n O
wne
rshi
pN
atur
al
Haz
ard
Prim
ary
Prob
lem
/Eff
ect
Miti
gatio
n G
oal
Ris
k H
-H
isto
rical
P
- Pot
entia
l R
esid
entia
l Pr
oper
ty
Coa
stal
are
as
Priv
ate
Floo
d Fi
re
1,27
8 pr
oper
ties l
ocat
ed in
SF
HA
. 9
SRL
Prop
ertie
s.
Mor
e th
an 5
0% o
f stru
ctur
e bu
ilt b
efor
e 19
50
Red
uce
the
depe
nden
ce a
nd
need
s for
dis
aste
r ass
ista
nce
fund
ing
afte
r dis
aste
rs.
Min
imiz
e so
cial
dis
loca
tion
and
dist
ress
. Pr
omot
e no
n-st
ruct
ural
floo
d an
d co
asta
l ero
sion
mea
sure
s to
redu
ce th
e ris
k of
dam
age
to su
rrou
ndin
g pr
oper
ties a
nd
envi
ronm
enta
l hab
itats
.
H, P
Com
mun
icat
ions
an
d Po
wer
D
istri
butio
n
City
-wid
e Pr
ivat
e H
igh
Win
ds
Win
ter S
torm
s D
own
or d
amag
ed
com
mun
icat
ion
and
pow
er
lines
. B
lock
ed ro
ads.
Prot
ect t
he o
ngoi
ng o
pera
tions
of
crit
ical
faci
litie
s. H
Coa
stal
Fea
ture
s C
oast
al a
reas
Pu
blic
and
Pr
ivat
e St
orm
Sur
ge
Floo
ding
/ C
oast
al E
rosi
on
Nar
raga
nset
Bay
ero
sion
su
scep
tible
blu
ffs.
East
on’s
. Haz
ard,
and
B
aile
y’s B
each
es e
xpos
ure
to so
uthw
este
rly w
ind
driv
en
wav
es.
Prom
ote
non-
stru
ctur
al fl
ood
and
coas
tal e
rosi
on m
easu
res
to re
duce
the
risk
of d
amag
e to
surr
ound
ing
prop
ertie
s and
en
viro
nmen
tal h
abita
ts.
H
Ope
n Sp
ace/
Rec
reat
iona
l A
reas
Bre
nton
Poi
nt a
nd
Fort
Ada
ms S
tate
Pa
rks
Publ
ic
Wild
fire
Dro
ught
A
ppro
xim
atel
y 17
0 ac
res o
f pa
rk la
nd e
xpos
ed to
w
ildfir
e.
Mai
nten
ance
of t
he p
ark
land
s to
pre
vent
ove
rgro
wth
. M
aint
ain
situ
atio
nal
awar
enes
s to
redu
ce fi
re
depa
rtmen
t res
pons
e tim
e.
P

107 Risk Assessment
3.4.2.1 Identified Risk in the Community
Like most Rhode Island coastal communities, the greatest risks in the Newport community are related to flooding and storm surge. The risk matrix rates flood as the natural event with the highest score, as shown in Table 3-27. Natural events that spur flooding, such as tropical cyclones and nor’easters also received high rankings.
3.4.2.2 Risk Assessment Matrix
Table 3-27. Relative Risk Rankings Hazard Frequency Area Impact Magnitude Total Hurricane 5 5 4 40 Nor’easters 5 5 2 20 Thunderstorms 5 2 1 7 Tornado 1 1 4 8 Severe Winter Storms 5 5 1 10 Hail Storms 4 2 1 6 Temperature Extremes 5 5 1 10 Flood 5 1 5 30 Storm Surge 4 1 3 15 Coastal Erosion 5 1 1 6 Droughts 3 5 1 8 Earthquake 1 3 3 12
Dam Failures 1 1 4 8 Fire 2 1 5 15
(Frequency + Area Impact) X Magnitude = Total

108 Risk Assessment

109 Capability Assessment
4.0 Capability Assessment
4.1 Purpose The following section details the different programs and departments the City of Newport has to aid in hazard mitigation. The city has the capability to implement and institutionalize hazard mitigation through its human, legal, and fiscal resources, the effectiveness of intergovernmental coordination and communication, and with the knowledge and tools at hand to analyze and cope with hazard risks and the outcomes of mitigation planning.
4.2 Types and Evaluation of Capabilities Newport has a variety of planning and support capabilities to apply towards hazard mitigation activities. Most importantly, Newport has an active community base. The business owners, residents, and visitors all contribute to promote growth and stability in city. The following sections provide an overview of the critical capabilities within the City of Newport and how they play a role in the mitigation effort. The capabilities outlined below reflect current conditions. The city has the capacity to expand on certain capabilities through the passage and enforcement of additional codes and regulations. The city also has the capacity to continually grow the stakeholders involved in the Hazard Mitigation Committee to reflect growth and change in the community.
4.2.1 Local Government and Program Areas
Local city plans and policies were consulted for the creation of this Natural Hazard Mitigation Plan, including the Newport Comprehensive Harbor Management Plan prepared by the City of Newport Waterfront Commission. Additionally, the public services and facilities provided by the City of Newport are crucial resources for the preparation of natural hazard events, as well as the response to and mitigation of such events.

110 Capability Assessment
4.2.1.1 Form of government
Newport Governance The City of Newport, by charter, is governed by a Council-Manager form of government. Council members are elected every two years, four members serving at large, and three members serving from a specific ward of the city. The Council is empowered to enact local legislation, adopt budgets, and determine policy. The Council chooses one of its members who was elected at large as Chair and another of its members as Vice-Chair (Newport RI City Charter). The Chair receives the title of Mayor and presides at all meetings of the Council and is recognized as the official head of the city for all ceremonial purposes. The mayor signs and executes all contracts or other evidences of indebtedness on behalf of the city, makes all proclamations in the name of the city, and is the executive head of the city to the extent required by this charter. Under the direction of the mayor, the Newport Police Department is designated as headquarters for emergency management response. The Council appoints a City Solicitor, Probate Judge, and Municipal Court Judge. With the exception of the School Committee, whose members are elected through city-wide contests, members of city boards and commissions are appointed by the Council to serve for definite terms. The City Council is also charged with acting as the Board of License Commissioners. The City Manager is the Chief Administrative Officer and serves at the pleasure of the Council, and is authorized to execute the laws and administer the government of the city. The Manager is charged with specific duties in connection with the administration of the city. Under the provisions of the City of Newport’s charter, the Manager is responsible for the appointment of department heads within the city administration. Eight departments report directly to the City Manager. City Boards and Commissions City governance receives assistance from a large number of residents of the city who make a substantial commitment of time, talent, and energy to serve on the City of Newport's many boards and commissions. Members of these commissions are appointed by the Council. The following boards are active in Newport:
x Planning Board x Zoning Board x Personnel Appeal Board x Tax Appeals Board
The following commissions are active in Newport:
x Affirmative Action Committee x Beach Commission x Bicycle and Pedestrian Advisory Commission

111 Capability Assessment
x Charter Review Commission x Cliff Walk Commission x Critical Area Review Committee x Energy and Environment Commission x Newport Film Commission x Henderson Home Commission x Historic District Commission x Hospitality Commission x Miantonomi Park Commission x Tree and Open Space Commission x Trust and Investment Commission x Washington Square Advisory Commission x Waterfront Commission
The City of Newport is also an active member of the:
x Aquidneck Island Planning Commission Records Management and Storage The City of Newport has implemented a series of records storage procedures in recent years, which address both hard copy and electronic filing systems on and off site. Onsite hard copy storage includes Land Evidence and Probate records which continue to be housed on the ground floor of City Hall. Three offsite storage units for Canvassing, Assessors, and MIS hard copy records now reside at Middletown Self Storage on Aquidneck Avenue. The City has also begun consolidating electronic management information system (MIS) services as part of an ongoing reorganization effort for onsite data backup of all City Departments. Exceptions to this effort are the Police, Fire, and Schools MIS systems which operate outside the City’s protective measures. Those departments included within the citywide MIS system have electronic data recovery storage of server information at the NaviSite Data Center in Adover Massachusetts. It is advised that those systems currently being operated outside the existing citywide MIS system be brought onboard to ensure proper storage and recovery at multiple levels.
4.2.1.2 Social Services
Homeless Shelters Homelessness in Newport is a persistent problem. With the active involvement and leadership of the City of Newport, the old Armed Services YMCA at 50 Washington Square was converted into a multi-service institution that provides emergency shelter, transitional housing with supportive social services, and rental housing, as well as office space for non-profit social service and legal service providers. In addition to the 50 Washington Square project, Lucy’s Hearth, based in St. Lucy’s Church in Middletown, provides shelter to homeless women and their families. Other shelters in the area include McKinney Cooperative Shelter, Child and Family Services, Family Promise of Newport County, and the Newport Housing Hotline. Community Programs

112 Capability Assessment
East Bay Community Action Group, formerly New Visions for Newport County is the Community Action Program that has operated in the Newport area for 35 years. It provides a variety of services, including health care services, job training and counseling, a Headstart program, child care, and many other services designed to support the underprivileged in the community. The Dr. Martin Luther King Jr. Center provides an emergency food program, day care, senior programs, education and recreation programs, and a variety of special events. Rhode Island Legal Services provides high quality legal representation to indigent residents of Newport County. These agencies contribute significantly to the quality of life in Newport County for individuals and families with incomes below the federal poverty guidelines.
4.2.1.3 Transportation and Public Services
Transportation Due to the extreme traffic congestion that Newport experiences in the summer, the city has increased visitor and resident opportunities for walking, bicycling, public bus transportation, public compressed natural gas (CNG) trolleys, water transport services, air transport, and taxi services. The RIPTA ferry and the compressed natural gas (CNG) trolleys have created incentives for residents and visitors to park at the Visitor Center and get reduced rates for using alternate modes of transportation within Newport. The Donnelly Newport Gateway Transportation and Visitors Center serves as an intermodal transportation center for the region. All major public transportation systems commence and terminate their trips at the center. Two public bus lines (excluding the charter and tour bus operators) operate from here. Peter Pan Bus Lines/Bonanza Bus Service, a private bus company, operates round-trip service from Newport to Fall River and Boston. Rhode Island Public Transportation Authority (RIPTA) provides intra-city bus service as well as service to Middletown, Portsmouth, Jamestown, Providence, and the West Bay. Public Services and Utilities Public services functions, handled under the Department of Public Services, include: engineering and operations; building and grounds; fleet maintenance; and the Clean City Program. A sample of the services provided include: street and sidewalk maintenance and repair; street sweeping; snow removal; design and inspection of streets and sidewalks traffic engineering; and street lighting. Through a contract with Waste Management Inc., the Newport Department of Public Services’ Clean City Program provides services for the curbside collection of residential refuse and yard waste (Clean City Newport). The City of Newport also coordinates a mandatory recycling program in cooperation with Rhode Island Resource Recovery. The Department of Utilities includes the Water Division and Water Pollution Control Division which oversee the public water supply, wastewater treatment, and stormwater management systems.

113 Capability Assessment
4.2.1.4 Floodplain, Stormwater, and Open Space Management
Floodplain Management A major objective for floodplain management is to continue participation in the National Flood Insurance Program (NFIP) which Newport has been a participant in 1978. NFIP, established by Congress in 1968, provides flood insurance to property owners in participating communities. This program is a direct agreement between the federal government and the local community that flood insurance will be available to residents in exchange for the community’s compliance with minimum floodplain management requirements such as the adoption of a floodplain management or flood damage prevention ordinance. Since homeowners’ insurance policies do not cover flooding, a community’s participation in the NFIP is vital to protecting property in the floodplain and ensuring that federally backed mortgages and loans can be used to finance property and improvements within the Special Flood Hazard Area (SFHA) (RIHMP 2014) Pursuant to the Flood Disaster Protection Act of 1973, many forms of federal financial assistance, including disaster assistance and federally-insured loans, related to structures located in the SFHA are contingent on the purchase of flood insurance. Such federal assistance includes not only direct aid from agencies, but also products and assistance from federally insured institutions. Because Newport maintains compliance with the minimum floodplain management requirements, property owners are able to purchase insurance through the NFIP. There is no requirement that the property be located within an identified SFHA. Instead, any property in the city can be insured through the NFIP as long as Newport maintains its good participant standing. In 2013 there was a nationwide project underway to update the FEMA Flood Insurance Rate Maps (FIRMs). As new data became available, many of the old FIRMs were outdated (RIEMA 2014). The maps were completed by FEMA contractor, STARR, through extensive modeling using new transects, surveys, and coastal analyses (RIEMA 2014). New FIRMs for Newport County were adopted by the City of Newport on September 4, 2013 (cityofnewport.com). Adopting the FIRMs and updating the ordinance Newport remains in good standing with NFIP. Stormwater Management Stormwater runoff is collected in a system of catch basins and is directed through a network of pipes and swales to one of the 50 stormwater outfalls (cityofnewport.com). United water maintains the storm drain pipes and catch basins as part of their service contract with the City. Proper management of stormwater is imperative because urban flooding in Rhode Island (or stormwater flooding) is a very common problem. Large amounts of impervious surfaces in urban areas, such as Newport, increase runoff amounts and decrease the lag time between the onset of rainfall and stream flooding. The EPA promulgated the Storm Water Phase II Rule, which targets municipal stormwater systems to comply with the requirements of the Clean Water Act and to protect the nation’s streams, rivers, and beaches from polluted stormwater runoff. In

114 Capability Assessment
Rhode Island the EPA Phase II Rule is administered by the RIDEM (cityofnewport.com). Owners of regulated small municipal separate storm sewer systems (MS4s) authorized to discharge stormwater under the Rhode Island Pollution Discharge Elimination System (RIPDES) Stormwater General Permit for Small MS4s must submit an Annual Report to the RIDEM Office of Water Resources. The report tracks the progress of compliance with requirements of the general permit. The City of Newport is a regulated small MS4 (cityofnewport.com). Open Space and Land Conservation The creation of the Newport Tree and Open Space Commission was approved by the City Council on June 27, 2008. The responsibilities of the Commission are to advise the City Council on acquisition, management, preservation, and improvement of city parks and other open spaces in order to enhance and protect the quality of life of Newport residents (Aquidneck Land Trust, enflyer.com). The Newport Tree Society is a private nonprofit volunteer organization of citizens whose mission is to protect, maintain, regenerate and expand our urban forest. Their role is to encourage and assist government action and participation, to support the goals of the Newport Tree & Open Space Commission and the Newport Tree Warden and to foster private sector initiatives and efforts. Newport is home to two state parks: Fort Adams and Brenton Point. The city also has many beaches, three large ponds (Almy Pond, Easton Pond, and Lily Pond), and numerous mini, neighborhood, and community parks and green spaces.. Additionally, the United States Government owns Naval Station Newport, which has some open space parcels (Aquidneck Island Open Space Mapping Project 2012).
Areas of limited development, which are defined as parcels that contain structures or impervious surfaces (not more than 5% of a parcel), but consist primarily of open space, cover 831 acres of Newport, comprising 34.5% of the city’s open space (Aquidneck Island Open Space Mapping Project 2012). Newport also has numerous outdoor recreation sites. Land devoted to recreation makes up 27% of the city’s open space, covering 650 acres, with an average parcel size of close to eight acres. Newport’s areas of limited development and its largest recreation areas, which include Fort Adams, Brenton Point State Park, and Newport Country Club, are concentrated at the city’s southern end. . There are more vacant parcels in Newport than any other open space category, although they account for only 8% of the total open space area – at an average lot size of 0.75 acres. These are scattered throughout the city, but there are a number of multi-acre vacant parcels around Ocean Avenue and Harrison Avenue (Aquidneck Island Open Space Mapping Project 2012). Almost all (91%) of Newport’s open space is zoned for residential use; 69% is designated low-density residential (R-60, R-80, R120). The low-density areas are concentrated in the Ocean Drive area of the city. The city has only fifty acres devoted to agriculture, the fewest of the three Aquidneck Island communities, which is not surprising given its urban character. The average size of Newport’s open space parcels is 3.29 acres, the lowest on the island. The small parcel size reflects the city’s dense street fabric, which

115 Capability Assessment
differs considerably from those of Middletown and Portsmouth (Aquidneck Island Open Space Mapping Project 2012). Urban Forest As Rhode Island’s oldest city and one of the most urbanized, Newport’s development has had a dramatic effect on the tree cover. During its colonial period Newport’s trees were steadily cleared for construction and farmland (Newport Tree Society). However, when the Gilded Age blossomed in the late 19th century there was a great deal of effort invested in developing an urban forest in Newport (Newport Tree Society). Tree hunters, plant collectors, gardeners, and landscape architects replanted Newport with many different species of trees (Newport Tree Society). Newport’s urban forest had reached maturity by the early 20th century, but the Hurricane of 1938 decimated many of the trees. Today there is an initiative being carried out by the Newport Tree Society that is dedicated to replanting a vibrant urban forest in Newport (Newport Tree Society). This help to beautify the city, of course, but studies that have shown that trees provide many other benefits. Healthy tree canopies reduce energy consumption (Akbari 2002), reduce air pollution (Nowak et al. 2006), mitigate stormwater runoff (Sierra Club), increase property values (Tanaka, WSJ 2013), and improve mental health (Gutierrez 2009). The Newport Tree Society has begun the urban forest revival effort and is largely supporting the effort through reaching out to Newport residents as environmental stewards.
4.2.1.5 Emergency Management
Protective and emergency services for the City of Newport reside under the direction of the City Manager the Newport Police Department is designated as the Emergency Operations Center for emergency management in the City. The Fire Chief serves as the City’s Emergency Management Agency (EMA) Director. Police Department The Newport Police Department occupies relatively new headquarters, placed in service in 1985. From this facility, the Department deals with a full range of law enforcement services. The Department owns a substantial number of vehicles, which are maintained by the city yard. These are included in the Capital Improvement Plan (CIP) Equipment Depreciation Fund for replacement as needed. The proposed budget for the 2015 fiscal year for the Newport Police Department budget is $16,939,678 and is staffed by 78 sworn officers between the uniformed patrol, the criminal investigative services and the administrative services divisions (Newport 2014-2015 Budget). The mission of the Newport Police Department is to provide excellence in police service, which is accomplished by forging a partnership with the citizenry of Newport, to enhance the quality of life, reduce the fear of crime, preserve the peace, and impartially enforce the law. The Newport Police Department will play a critical role in disaster preparation and recovery.

116 Capability Assessment
Fire Department The mission of the Newport Fire Department is to preserve lives and property within the community by providing services directed at the prevention and control of fires, accidents, and other emergencies (City of Newport Budget 2014-2015). In addition to the Administrative Division within the Newport Fire Department, there are two other main divisions. The first is the Fire Prevention Division, which is responsible for fire safety and education, code enforcement (inspection and plans review) and fire investigation. The second is the Fire Suppression/EMS personnel Division, which is responsible for fire suppression, property conservation, pre-hospital emergency medical care and transportation, and the mitigation of other incidents that potentially could cause harm to the general public and the environment. The Fire Department’s proposed budget for the 2015 fiscal year is $18,289,607 and is staffed by 95 people between the three divisions. The Fire Department’s facilities include Station One (Headquarters) at 21 W. Marlborough Street and America's Cup Avenue; Station Two at 100 Old Fort Road; and Station Five at Touro Street at Mary Street. The Fire Department, like the Police Department, experiences a higher demand in the summer months when the summer population can increase to over 100,000 persons due to tourism activities (Newport Comprehensive Land Use Plan).
The City of Newport’s membership in the Southern New England Mutual Aid Agreement allows for rapid deployment of mutual aid assets from surrounding communities. This allows for a coordinated response of mutual aid without reducing staffing in any one community to dangerously low levels. The city also benefits from agreements with Naval Station Newport. The Naval Station Newport Fire Department provides fire, Advanced Life Support (ALS) emergency medical services, and hazardous materials responses, as well as non-emergency support services to the Newport Navy complex. The Naval Station Newport Fire Department is staffed 24 hours a day, seven days a week, to respond to emergencies both on and off of the installation via reciprocal mutual aid agreements with the City of Newport. In addition to emergency response responsibilities, the Naval Station Newport Fire Department resources also include a fire inspection staff responsible for fire safety compliance and fire prevention.
In the event of a disaster or emergency, a large part of a city’s business district may need to be shut down and major roadways blocked to facilitate the movement of emergency vehicles. Also viewers, sightseers, and news media personnel can add to the disruption as an indirect effect. The mass movement of citizens through evacuation or disaster migration may also affect emergency forces. If people are removed from a residential area, emergency shelters may be required. The evacuation may have a significant effect on other parts of the community depending on the size of the fire zone, the materials burning, the population density, and the number of people needing to be housed. Some notable safety advancements following the Rhode Island Fire Code revisions include the elimination of “grandfathering” structures that are not in compliance with current code standards. Currently, all structures must adhere to the code requirements. A variance can be applied for pending support by the local Fire Marshal’s Office and must make inclusions for alternative protections that offset risks that may result from non-compliance to code standards. Additionally, some structures may require automatic

117 Capability Assessment
fire suppression systems or fire detection systems that sound locally. Where applicable, some structures may be required to have a system that notifies the Fire Department directly. The Newport Fire Department notes that, “Early fire detection notification and fire suppression has greatly diminished the likelihood of Conflagrations in the Urban Fire Hazard Zone Area.” Further efforts for early fire detection and suppression should be encouraged to promote safety in this area. Harbormaster Established as an Enterprise Fund in 2005, the Maritime Fund provides for the operation of the Newport Harbor. The Harbormaster's position is full-time and is augmented by a full-time administrative assistant and twenty temporary seasonal employees. Presently, the Harbormaster’s Office has eight Assistant Harbormasters and three administrative personnel. This department is responsible for enforcement of ordinances and state and federal boating laws pertaining to the operation of commercial and pleasure craft within the harbor and surrounding public waters. It is also charged with collecting fees for mooring rentals, mooring maintenance, harbor patrol, oversight of special events and regattas, cruise ship arrivals, removing hazardous debris, and providing first aid when the need arises. The department also performs inspections of vessel waste holding tanks to enforce the state "no-discharge" regulation. The Harbormaster works in coordination with Federal and State Officials on security, immigration, and other joint responsibilities in addition to providing public safety services on the water in cooperation with the Newport Police and Fire Departments; the Rhode Island Department of Environmental Management (RIDEM); and the United States Coast Guard. The Maritime Fund operates four patrol boats during the height of the season. This fund operates the public piers and public dinghy docks throughout the harbor, cruise ship passenger operations, the Harbormaster building, and the transient boater facility at the Maritime Center. The budget for the Harbormaster’s office was projected at $860,980 for Fiscal Year 2015 (City of Newport Budget 2014-2015).
Emergency Evacuation An evaluation of a number of factors effecting evacuation of the Newport area, including the roadway system, likely evacuation destinations, traffic, seasonal population, severity of storm, and many other factors, was conducted by U.S. Army Corps of Engineers (USACE) for the Hurricane Evacuation Study (USACE 2009). This transportation analysis was utilized to compose an evacuation route map that illustrates evacuation zones and shelters for the affected community. Municipal and state emergency management officials have the Inundation Map Atlas and the Evacuation Map Atlas, both products of this study, for each community. This information would be most useful if it resulted in municipal signs posting appropriate evacuation routes on roadways. It is recommended by FEMA that coastal communities use an 8-hour clearance time estimate for well-publicized daytime evacuations. Nighttime evacuations should allot 10 hours for clearance. In addition to the actual evacuation time, officials must add the time required for dissemination of information to the public, which can vary from community to community. It is a community decision to conduct an evacuation based

118 Capability Assessment
on information made available to municipal officials. The USACE recommends that the evacuation be complete before the arrival of gale-force winds. Emergency transportation and traffic control is a key component of Newport’s response to natural disasters. In the event of a disaster, the Police Department would be assisted by DPW and the Newport Fire Department, as well as logistical support units such as National Grid, in order to maintain access and exit routes throughout the city. Based on the SLOSH maps, areas that would need to be evacuated during a hurricane include but are not limited to the Bailey’s Beach area Hazard Beach area. A complete description of evacuation areas and routes is depicted on Map 7. The primary evacuation shelter for Newport is the Joseph H. Gaudet Middle School located on 113 Aquidneck Avenue in Middletown. The Gaudet Middle School has the capacity to hold 549 persons and also serves as the primary emergency shelter for Middletown and Portsmouth, the other communities on Aquidneck Island. Other properties that have been approved for emergency shelter use include the Newport Area Career and Technical Center, located on the campus of Rogers High School at 15 Wickham Road in Newport; the Pell Elementary School at 35 Dexter Street in Newport with a capacity of 419 person; the Florence Gray Center at 1 York Street in Newport with a capacity of 345 persons; and the Middletown High School at 130 Valley Road in Middletown. According to the American Red Cross, 25% of an evacuated population will seek public shelters in the event of most disasters. FEMA requires that a community provide shelters to accommodate 15% of an evacuated population. In order to evaluate the likely shelter populations for various areas in a jurisdiction a behavioral analysis is performed by the USACE on the population located projected inundation zones. This “vulnerable population” categorization varies depending on the strength of the storm. The estimate for a weak hurricane in Newport is that 6,370 people will evacuate, and during a severe hurricane 8,330 people will evacuate. The likely demand on public shelters is 825 persons under weak storm conditions, and 1,180 under severe storm conditions. The total shelter capacity for the City of Newport, not including hospital capacity (the hospital is not approved as an emergency shelter but has 124 beds), is 1,313 people. Dam Safety RIDEM has the responsibility to inspect dams and determine their condition (Dam Safety Program report 2013). In accordance with Dam Safety Regulations, visual inspections of high hazard dams are required every two years (Dam Safety Program report 2012). As part of each visual inspection, the condition of the major components of the dam are subjectively rated as good, fair or poor. The major components of a dam are the embankment, the spillway and the low level outlet (Dam Safety Program report, 2012). According to the 2013 Annual Report to the Governor on the Activities of the Dam Safety Program, the dam of the Easton South reservoir named Easton Pond South (ID# 585), which is designated as a high hazard, was inspected in 2013 and was identified as a high hazard dam in the 2014 Dam Safety Program report. The high hazard designation indicates that in the event of “dam failure or misoperation there would be a probable loss of human life.”

119 Capability Assessment
In 2008 Section nine of RIGL Chapters 46-18 and 46-19 were amended to require that a city or town where a significant or high hazard dam is located complete an Emergency Action Plan (EAP) for the dam (Dam Safety Program report 2013). An EAP is a formal document that identifies potential emergency conditions and specifies pre-planned actions to be followed to minimize loss of life and property damage (Dam Safety Program report, 2012). RIEMA is responsible for coordinating development of EAPs and granting final approval of the plans (Dam Safety Program, 2012). The City of Newport was notified in March of 2016 via a letter from the Rhode Island Emergency Management (RIEMA) that an EAP should be developed for the dam through a coordinated effort between the city and the town of Middletown.
4.2.1.6 Economic Development
Newport’s location, natural and cultural resources, and sense of history are responsible for the growth of tourism into a primary source of revenue. The growth of tourism is evidenced by an increase in traffic over the Newport Bridge from 2.9 million vehicles in 1978 to over 6.5 million in 1990 and almost 7.1 million in 2000. The third largest economic factor in Newport, the service sector, has benefited by both the defense and tourist industries (Newport Comprehensive Land Use Plan). While growth and development are inevitable and, indeed, necessary for job creation and economic opportunity, it is the feeling of Newport’s citizens that the greatest benefit will accrue to all if change is managed giving full respect to Newport’s natural beauty and magnificent harbor. Unique natural and historic resources provide Newport with a competitive advantage (Newport Comprehensive Plan). There are approximately 1,200 businesses operating in Newport, and most of these are small businesses. However, there are several employers that make a major contribution to the full-time employment base in the community. Some of these employers include: Newport Hospital, Naval Undersea Warfare Center, the City of Newport, Salve Regina University, Walmart, and Super Stop & Shop. Adjusting for Navy Base employment located in Middletown, the above employers provide approximately 4,000 civilian jobs – roughly 25% of all employment in Newport. Emphasis should be placed on retaining these jobs and creating new jobs in both large and small enterprises. Typically large businesses may generate more secondary services jobs, but small firms (under 20 employees) are more likely to grow at a faster rate (Newport Comprehensive Plan). Today, the visitor industry is a mainstay of the Newport economy, providing jobs and bringing outside revenue into the community. Tourism is Rhode Island’s second largest industry (Tyrell, May 2001). Newport has experienced substantial growth in tourism-related sectors of the local economy like hotels, restaurants, retail goods, museums and galleries, and recreational services. The economic benefits of this growth have a multiplier effect for other sectors of the economy: construction, banking, real estate, business services, transportation services, and other businesses. (Newport Comprehensive Plan). As a direct result of the increase in tourism, there has been considerable expansion of land development along America’s Cup Avenue and on Bowen’s and Bannister’s

120 Capability Assessment
wharves, along Thames and Spring Streets, on Bellevue Avenue, along Memorial Boulevard – significantly boosting the local tax base and providing employment opportunities (Newport Comprehensive Plan). In addition to the tourist industry, the economy of Aquidneck Island is to a large degree dependent upon the defense-related industries. In 2001, the largest employer on Aquidneck Island was the U.S. Navy with 19% of all jobs. While many of the major private employers are located in Middletown and Portsmouth, many of their employees make their home in Newport and thereby contribute to the local economy. These workers represent a highly skilled and desirable component of the local labor force and economy. The retail industry represents the second largest source of private employment in Newport. Employment growth remains strong for food preparation and serving occupations as well as retail (gaining 508 jobs from 1994-2000, RIDOL). Much of this retail may be called recreational or specialty retail, as it provides shopping opportunities for visitors as well as Newport residents. The primary shopping areas in Newport are located on Thames Street, America’s Cup Avenue, and Bellevue Avenue. The many antique shops and art galleries in Newport add to the city’s historic and cultural character. Tax records show that this activity makes up roughly 8% of all retail firms in Newport (Newport Comprehensive Plan). In terms of job gains, the leading employment sector continues to be services. The service sector of Newport’s economy consists of a wide range of diverse activities, including operating the mansions, health care services, business services, educational services, automotive repair shops, and hospitality. The service sector in Newport paid $188,890,735 in wages and employed 6,873 people in 2001 (Newport Comprehensive Land Use Plan).
The two-decade decline in the commercial fishing industry has stabilized, but new growth lies mainly in marine services and aquaculture. Additionally, the escalating cost of land and property taxes on the Newport waterfront has been an incentive for some fishing and marine businesses to sell their property. According to the National Marine Fisheries, Rhode Island fishing steadily declined from 1990, with a yield of 60,233 metric tons worth $73.3 million, to 2000, with a yield of 54,111 metric tons worth $72.5 million. The State Pier #9 operated by the Department of Environmental Management (RIDEM) accommodates 25 vessels with additional vessels on a waiting list. Aquaculture continues to grow as a viable alternative to traditional fishing. Organizations such as the Rhode Island Seafood Council, the New England Fisheries Development Association, the Rhode Island Economic Develop Corporation (now the Commerce Corporation), and the University of Rhode Island are working to promote aquacultural efforts in Newport and throughout Rhode Island (Newport Comprehensive Land Use Plan). Manufacturing is a desirable activity in that it provides better paying jobs and a significant multiplier effect attracting support firms as well as external spending. Rhode Island Department of Labor data show 45 manufacturing firms in Newport in 2002, providing 369 jobs. The city’s current zoning designation for manufacturing is CI (Commercial Industrial), in which both commercial and industrial uses are permitted.

121 Capability Assessment
The CI zone is located in Newport’s North End adjacent to the Navy Base and along Connell Highway, a major artery that has long been the location of highway commercial uses, economy hotels, and other retail uses, including a regional mall. There is yet some vacant land within the Commercial Industrial district to support expanded industrial activity (Newport Comprehensive Land Use Plan).
4.2.1.7 Healthcare Resources
Newport County Mental Health Center Mental health programs are provided by the Newport County Community Mental Health Center (NCCMHC). NCCMHC is a private, nonprofit organization that serves Newport County. It was established in 1964 to provide mental health care and treatment to people living and/or working in Jamestown, Little Compton, Middletown, Newport, Portsmouth and Tiverton. Newport Hospital Newport Hospital serves the Newport area with a full range of health care services. It is complemented by the Newport Naval Hospital, which serves the active and retired military population and shares some programs and resources with Newport Hospital. Newport Hospital provides a broad range of services to the disabled. The Vanderbilt Unit at the Hospital has developed a specialty of head injuries and rehabilitation. While many programs and services exist in the community for the disabled, there is a generally low level of awareness of the special needs of handicapped members of the community. Despite the 1997 American’s with Disabilities Act, many buildings and sidewalks are not fully accessible to the handicapped. An outpatient clinic at the New Visions for Newport County offices provides health care services for the poor residents of Newport County. Newport Hospital also provides some health care services at free or reduced charge. Currently, several agencies provide day care in the City of Newport, although the New Visions Daycare program alone provides nighttime child care, an important commodity in a community where many parents perform service-sector jobs with evening or night hours.

122 Capability Assessment
Rhode Island Department of Health (RIDOH) Agency Description The mission of the Rhode Island Department of Health is to prevent disease and to protect and promote health and safety of the people of Rhode Island. Plans and Programs RIDOH maintains the Center for Emergency Preparedness and Response (CEPR) whose mission centers on public health and healthcare emergency preparedness and response. During emergencies, CEPR is tasked with facilitating the Department’s response, and with the coordination between private, local, state, and federal partners to further the state’s overall response. When not responding to emergencies, the CEPR is routinely engaged with both internal and external partners in activities to prepare for and mitigate against threats to the public’s health and the healthcare system. RIDOH also coordinates the Medical Emergency Distribution Systems (MEDS) program, which maintains the state’s plan to receive, stage, distribute, and dispense medical countermeasures and supplies during a public health emergency with the assistance of state and federal partners. The MEDS program reviews and offers guidance for all local MEDS Point-of-Dispensing (POD) Plans, provides POD staff training, and gives direction for dispensing the countermeasures to the general public (RIDOH website). RIDOH maintains an ongoing pursuit of public water supply resiliency within the state. The following bullets outline programs that support this pursuit:
x The Drinking Water Incident Response Plan – The 2004 Drinking Water Quality (DWQ) emergency plan is being updated by a consultant hired by the Office of DWQ with the goal of aligning the plan with the framework of HEALTH’s EOP. The document is targeted for completion by the end of 2013. The project includes tabletop exercises.
x Small System Emergency Preparedness Planning – DWQ grant to the University of Rhode Island (URI) to assist small systems using professional training and tools for development and implementation of vulnerability assessments, emergency preparedness plans, and communication and public notification strategies.
x Rhode Island Water & Wastewater Agency Response Network (RIWARN) – continue to be a member of the RIWARN steering committee. RIWARN is a Water/Wastewater Agency Response Network (WARN) that allows water and wastewater systems in Rhode Island to receive rapid mutual aid and assistance from other systems in Rhode Island to restore facilities damaged by natural or manmade incidents.
x Hired a staff person to further develop and implement the Office’s Emergency Preparedness and Security.
x Ongoing program development to achieve better communication with all Public Water Systems (PWSs) before, during, and after emergency events.
Through numerous emergency responses, RIDOH has tested and evaluated the mitigation actions for healthcare facilities, drinking water systems, food establishments,

123 Capability Assessment
and the public, and has developed ongoing recommendations for additional mitigation actions. Some of these activities include improving systems that provide warning and emergency communications and providing additional training to first responders. Data collected about storm-related health impacts are driving projects related to climate change to mitigate the impacts of heat and cold weather on individuals who are most vulnerable to their effects.
4.2.1.8 Planning and Geographic Information Systems
Newport has a strong planning department. Newport implements and enforces the state building code, International Residential Code and International Building Code. The State building codes were updated in 2009 to require all new structures to withstand a minimum of 110 mph winds. The city’s development review process works to ensure that residential, commercial, and industrial developments have minimal impact on surrounding land uses and the environment. The plan review process includes technical review by staff members of the planning, building, public works, police, fire, and school departments. GIS Five Hurricane Surge Inundation GIS layers were developed for this project – one each of the five coastal Rhode Island counties (Washington, Kent, Providence, Bristol, and Newport) (USACE 2009). See Map 2 in Appendix A. The hurricane surge inundation areas shown on this map depict the inundation that can be expected to result from a worst-case combination of hurricane landfall location, forward speed, and direction for each hurricane category (USACE 2009). The source of basemap transportation features such as roads and railroads is Tele Atlas 2008. The source of other basemap features is the Rhode Island Geographic Information System (RIGIS) (USACE 2009). The horizontal projection of this map is Rhode Island State Plane NAD83 feet. All elevation data was referenced to the NAVD88 vertical datum (USACE 2009). The primary ground elevation data source was a photogrammetrically derived Digital Terrain Model created by the Rhode Island Department of Transportation (RIDOT). This data was supplemented with several other elevation data sources listed below:
x FEMA Map Mod LiDAR, portions of Washington County (Terrapoint LLC, 2006)
x South Kingston, Cranston, and Charlestown Digital Terrain Models (EarthData International, 2001,2006)
x Providence Digital Terrain Model (Sanborn, 2004) x Narragansett and Middletown Digital Terrain Models (Chas. H. Sells, Inc., 2005) x ACE/FEMA/NOAA LiDAR (Fugro Pelagos, Inc., 2005)
SLOSH The Sea, Lake, and Overland Surges from Hurricanes (SLOSH) model was developed by the National Weather Service to calculate potential surge heights from hurricanes (USACE 2009). The SLOSH models for the Rhode Island Hurricane Evacuation Study were run by the Storm Surge Group, National Hurricane Center, National Centers for Environmental Prediction, and National Oceanic and Atmospheric Administration, Miami Florida (USACE 2009). The SLOSH model calculates the hurricane surge

124 Capability Assessment
elevation that would result from over 500 combinations of hurricane category, landfall location, forward speed, and direction. This study used the BOS SLOSH model basin (USACE 2009). See Map 2 in Appendix A. Maximum envelopes of water for each hurricane category and forward speed were calculated to reduce SLOSH model results to only those surge elevations that could potentially cause the greatest flooding. Further classification of maximum surges enabled three categories and forward speed dependent inundation areas to be developed and presented on each map. The inundation matrix of each community map can be used to determine the corresponding inundation area (A, B, or C) for a given hurricane category and forward speed. The classification of inundation areas by this matrix suggests that, in this region, worst-case hurricane surges are predominantly a function of a hurricane’s category and forward speed, and that a hurricane’s track and direction have less of an effect on resulting storm surge. Worst-case surge tide estimations were based on maximum storm surge elevations derived for each inundation area within each community. The SLOSH model provides estimates of Stillwater surge elevations only and does not consider additional flooding from wave run up. Separate analyses showed that wave run-up effects based on the derived Stillwater estimates do not significantly increase the limits of flooding. Surge elevations corresponding to worst-case surge tides were superimposed on Rhode Island Department of Transportation base maps using U.S. Geological Survey 7.5 minute quadrangle maps. Community specific hurricane surge tides [referenced to the National Geodetic Vertical Datum (NGTVD)] that are depicted for each inundation area are shown in the surge tide profiles provided on Plate 1-17 of the U.S. Army Corps 1993 SLOSH Study. For the Newport area, based on the SLOSH model, storm surges are predicted to range from 4 to 18 feet high. (U.S. Army Corps of Engineers, SLOSH Study, 2009). As can be seen from these pictures, high tide plus only 3 feet will cause substantial flooding to the harbor area of downtown Newport. When coupled with a spring tide, the impact increases significantly. The Great New England Hurricane of 1938 produced the greatest storm tides this century in southern New England. The storm tide reached 9 feet above MHHW off the coast of Newport during the 1938 Hurricane. Hurricane Carol produced a slightly lower storm tide of 7 feet above MHHW, due to its arrival shortly after high tide. Hurricane Bob caused a storm surge of 5 feet above MHHW along the Newport shore. Future storm surge events will only be exacerbated by continued sea level rise due to the effects from climate change.
4.2.2 National Flood Insurance Program, CRS
Floodplain management begins at the community level with operation of a community program of corrective and preventative measures for reducing flood damage. These measures take a variety of forms; for inclusion in the NFIP, communities adopt their flood hazards maps and the community Flood Insurance Study (FIS). In addition, a FEMA-compliant floodplain management ordinance that regulates activity in the

125 Capability Assessment
floodplain is adopted and enforced. All 39 Rhode Island communities and the Narragansett Indian Tribe participate in the NFIP. NFIP participants maintain and enforce floodplain regulations conforming to NFIP requirements as part of their zoning ordinance or as a standalone ordinance. These regulations can involve regulation of development within a designated floodway area, restrictions on activities that involve alteration of watercourses or sand dunes, and criteria for the location of mobile homes. In addition, some communities also impose special zoning regulations governing accessory structures, storage of buoyant or hazardous materials, and set-backs for new/substantially improved and/or damaged structures within flood hazard zones. The NFIP affords homeowners, renters or business owners the opportunity to purchase flood insurance if their community agrees to enact and enforce regulations that meet or exceed FEMA’s floodplain requirements.
The City of Newport utilizes the Federal Emergency Management Agency’s (FEMA) Flood Insurance Rate Maps (FIRM) to determine the location of flood zones and flood prone areas. These maps were last updated in 2013 by FEMA. In Newport 1,391 acres and 1,619 structures are located within a FEMA designated Special Flood Hazard Area (SFHA). The SFHA is mapped as Zone A, which includes areas subject to inundation by the one-percent-annual-chance flood event generally determined using the approximate methodologies (fema.gov). In coastal situations, Zone V, which includes areas along coasts subject to inundation by the one-percent-annual-chance flood event with additional hazards associated with storm-induced wave, is also part of the SFHA. The SFHA may or may not encompass all of the community’s flood problems.
Flood damage is reduced by nearly $1 billion a year through partnerships with communities, the insurance industry, and the lending industry. Further, buildings constructed in compliance with NFIP building standards suffer approximately 80 percent less damage annually than those not built in compliance. Additionally, every $3 paid in flood insurance claims saves $1 in disaster assistance payments. The NFIP is self-supporting for the average historical loss year, which means that operating expenses and flood insurance claims are not paid by the taxpayer, but through premiums collected for flood insurance policies. The program has borrowing authority from the U.S. Treasury for times when losses are heavy; however, these loans are paid back with interest. Newport has been a participant in the National Flood Insurance Program since 1978. As of July 2014, there are 116 VE-zone policies and 899 A zones, with all policies in Newport totaling 1,433. Total premiums of the policies cost $2,329,863 with total coverage totaling $331,419,000. There have been a total of 286 claims made since 1978 with a total payout of $7,057,036.
The Community Rating System (CRS) is a voluntary program that recognizes and encourages a community’s efforts that exceed the NFIP minimum requirements for floodplain management. The CRS program emphasizes three goals: the reduction of flood losses, facilitating accurate insurance rating, and promoting the awareness of flood insurance. By participating in the CRS program, communities can earn a 5-45% discount for flood insurance premiums based upon the activities that reduce the risk of flooding within the community. Currently eight Rhode Island communities participate in the

126 Capability Assessment
CRS and receive flood insurance premium discounts. The City of Newport intends to participate in the CRS program. There are many categories for which a community may gain credit for public education and awareness activities regarding floodplain management and mitigation. The maintenance of non-federally-owned open space land in floodplains can also help a municipality gain credit points under the CRS program. In addition, vegetated open-space land enhances the natural beauty and the beneficial functions that floodplains serve while helping to prevent flood damage. Participating in the CRS can help communities save money, protect the environment, and improve the overall quality of life. For example, when the City of Newport preserves open space in the floodplain, the residents will be able to enjoy the natural beauty of the land. If there is a flood, participating in the CRS brings the following benefits:
x Prevent property damage x Avoid lost jobs and economic devastation caused by flooding in offices,
factories, farms, stores, and other businesses x Prevent damage and disruption to roads, schools, public buildings, and other
facilities people rely on every day x Possibly reduce casualties if setbacks decrease impact to physical structures
4.3 Integration with Existing Plans and Local Processes
The Newport Hazard Mitigation Plan has been developed and implemented in conjunction with other city planning and management efforts. This update incorporates many elements of the recently affirmed through other planning efforts. In addition, the HMP recognizes the ongoing relevance and importance of zoning regulations, land use and study projects. As described previously, all reviews of the Hazard Mitigation Plan will include a corresponding review of the relevant sections contained in other community planning documents to include the Comprehensive Plan, the Emergency Operations Plan, and capital improvement plans. The Hazard Mitigation Committee will maintain liaison with the departments and bodies responsible for these other planning efforts to ensure a coordinated approach to continued integration. The long range impacts of changing climate and the resulting increased storm activity have been ingrained in the planning and assessment process.
4.4 Capability Needs/Challenges The number one need/challenge for implementing the Newport mitigation strategy is funding. While the vast majority of mitigation actions outlined in this plan are funded through department operating budgets, some of the costlier actions exceed the financial resources available to the city. The city leadership will continue to seek out public/private partnership opportunities to help share or eliminate some of the costs.

127 Capability Assessment

128 Mitigation Strategy
5.0 Mitigation Strategy
5.1 Vision and Goals The Newport Hazard Mitigation Strategy advocates the concepts of disaster resilient and sustainable communities. Newport is building a disaster resistant community and achieving sustainable development through the commitment of state and local government and its policymakers to mitigate hazard impacts before disaster strikes. As Newport is striving to be a disaster resilient city, it is therefore becoming a safer community, through the implementation of mitigation programs and policies. The city implements and institutionalizes hazard mitigation through its human, legal and fiscal resources; the effectiveness of intergovernmental coordination and communication; and the knowledge and tools at hand to analyze and cope with hazard risks and the outcomes of mitigation planning. The Newport mitigation strategy provides a coordinated, consistent set of goals for reducing or minimizing: human and property loss; major economic disruption; degradation of ecosystems and environmental critical habitats; and destruction of cultural and historical resources from natural and technological disasters by:
x Providing a basis for intergovernmental coordination in hazard mitigation programs at the state and local level
x Developing partnerships between the city and private sector, local communities, and non-profit organizations in order to coordinate and collaborate hazard mitigation programs
x Identifying and establishing close coordination with local government departments and agencies responsible for implementing the sound practices of hazard mitigation through building standards and local land use development decisions and practices
x Providing for a continuing public education and awareness about the risks and losses from natural and technological disasters, in addition to hazard mitigation programs, policies and projects

129 Mitigation Strategy
GOALS: To support the implementation of the Newport Mitigation Strategy, ten goals have been developed:
1. Protect public health, safety and welfare 2. Reduce property damages caused by hazard impact 3. Minimize social dislocation and distress 4. Reduce economic loss and minimize disruption to local business 5. Protect the ongoing operations of critical facilities 6. Reduce the dependence and need for disaster assistance funding after disasters 7. Expedite recovery disaster mitigation efforts during the recovery phase 8. Promote non-structural flood and coastal erosion measures to reduce the risk of
damage to the surrounding properties and environmental habitats 9. Establish a continuous local Hazard Mitigation Committee to support, implement,
and revise the Newport multi-hazard mitigation strategy and to provide the support necessary for an ongoing forum for the education and awareness of multi-hazard mitigation issues, program, policies and projects
10. Provide for adequate financial and staffing resources to implement the Newport Hazard Mitigation Strategy
Each mitigation action has been given an expected timeframe for implementation. The assigned timelines are based on a combination of factors that includes the relative priority of the action, the availability of resources needed to complete the action, and the status of any requisite projects that may impede the completion of the action. The 2014 committee worked to set goals and objectives that are bounded by a time frame following plan adoption, are compatible and consistent with state hazard mitigation goals and availability of funding. The time frames used for these strategies are as follows:
x Near-term = 0 to 6 Months x Medium-term = 6 to 18 Months x Long-term = 18 Months to 5 Years
5.2 Update of Mitigation Strategy and Actions The Local 2008 Hazard Mitigation Committee identified a number of pro-active protection mechanisms currently in place in the City of Newport that reduce damages and loss in the event of a natural disaster or secondary disaster. In 2013-2014, these mitigation strategies were reviewed by department heads to update or confirm that these strategies continue to be maintained. Description of Existing Strategies and Activities In addition to the programs and activities that the City of Newport is currently undertaking to protect its residents and property from a natural disaster, a number of additional strategies were identified by the 2014 Hazard Mitigation Committee for

130 Mitigation Strategy
consideration. Many of these newly identified mitigation strategies will be considered for further action using the Mitigation Action Plan in the Evaluation and Implementation of Actions chapter. Some of them are the result of improvements to the existing strategies identified in 2008. The types of activities that were considered when developing new actions to reduce the community’s vulnerability have been divided into the following categories:
x Health, Safety and Welfare x Property Protection x Resource Preservation x Emergency Response Measures
City and regional planning documents that were referenced in the development of this Natural Hazard Mitigation Plan (NHMP) include the City of Newport Comprehensive Land Use Plan. Other documents referenced in the development of the plan include local zoning laws and building and subdivision ordinances. Additionally the 2014 Hazard Mitigation Committee incorporated information from the Newport Emergency Operation Plan. The Newport Emergency Operation Plan includes natural hazard mitigation strategies as a principle means of protecting the city from the impacts of natural disasters. The NHMP will help Newport to focus on strengthening existing plans, programs, policies and procedures by incorporating hazard mitigation as part of the ongoing process of community development. As the City of Newport updates other important city-wide plans, such as the Newport Harbor Management Plan, the Comprehensive Land Use Plan, and the Emergency Operation Plan, it will incorporate elements of the Natural Hazard Mitigation Plan (NHMP) to ensure the consistency of hazard mitigation approaches. Implementation of mitigation actions will allow for a more effective Emergency Management Program via improved protection of critical infrastructure that will remain functional throughout a hazard event. Furthermore, the actions identified in the plan reduce the dangers faced by emergency responders. The incorporation of the NHMP into the Emergency Operation Plan will prioritize mitigation strategies to reduce disaster impact on the community and to ensure an effective response to damages suffered in natural hazard events
5.2.1 Identifying Types of Mitigation Actions
The 2014 Hazard Mitigation Committee conducted several reviews of the 2008 Mitigation Plan Actions. The 2008 actions were assessed for their continued relevance and value to the community in light of changes in the community and events that have occurred since the previous plan was implemented. During the 2013 review, several changes were made to the mitigation actions. At the June 2014 Committee meeting, actions were again realigned and modified to address current needs and future development trends. The newly formatted actions were presented to the public for comment and input. Based on input

131 Mitigation Strategy
from the public and the Hazard Mitigation Committee, the following is the disposition of the 2008 Actions.
Table 5-1. 2008 Mitigation Action Disposition 2008
Action # 2008 Action Description 2016 Action # 2016 Disposition
1 Study of existing evacuation routes X
Completed. Results included in 2016 Continuity Action Program 17
2 Evacuation service for elderly, special needs, and homebound 1 Continued
3 Road Reconstruction X Removed. Moved to Continuity Action Program 18
4 Shelter study and acquisition of additional facilities if needed 2 Continued
X 3 Increase resiliency of health care facilities during hazard events
5 Annual Mailing 4 Action expanded to address overall information dissemination
X 5 Implement protective measures for
historic structures and collections
6 Local funding assistance for displaced homeowners X Removed-Determined to not be
financially feasible
X 6 Categorize priority activities for city owned flood risk properties
7 Flat roof snow load study X Removed-Determined to not meet benefit-cost estimates
X 7 Revise, amend and enforce the Newport Zoning Code to manage land in vulnerable areas
8 Retrofitting at risk flat roof structures X Removed-Determined to not meet
benefit-cost estimates X 8 Seawall sustainment
9 Local funding assistance for homeowner mitigation actions X Removed-Determined to not be
financially feasible 10 Infrastructure inventory X Removed-Inventory exists
X 10 Conduct vulnerability assessment of pre-code structures
11 Retrofitting flood risk structures X Removed-Intent incorporated into other actions
12 Evaluation of zoning to allow for flood retrofitting X Removed – Incorporated into 2016
Action 7
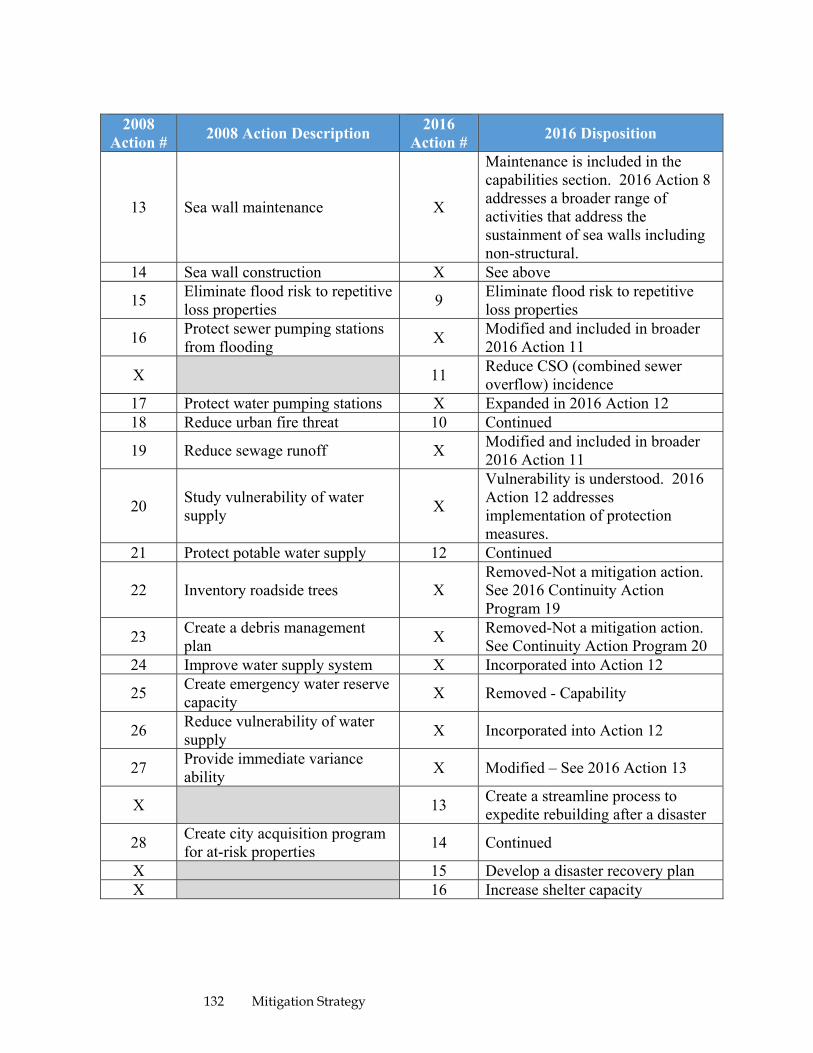
132 Mitigation Strategy
2008
Action # 2008 Action Description 2016 Action # 2016 Disposition
13 Sea wall maintenance X
Maintenance is included in the capabilities section. 2016 Action 8 addresses a broader range of activities that address the sustainment of sea walls including non-structural.
14 Sea wall construction X See above
15 Eliminate flood risk to repetitive loss properties 9 Eliminate flood risk to repetitive
loss properties
16 Protect sewer pumping stations from flooding X Modified and included in broader
2016 Action 11
X 11 Reduce CSO (combined sewer overflow) incidence
17 Protect water pumping stations X Expanded in 2016 Action 12 18 Reduce urban fire threat 10 Continued
19 Reduce sewage runoff X Modified and included in broader 2016 Action 11
20 Study vulnerability of water supply X
Vulnerability is understood. 2016 Action 12 addresses implementation of protection measures.
21 Protect potable water supply 12 Continued
22 Inventory roadside trees X Removed-Not a mitigation action. See 2016 Continuity Action Program 19
23 Create a debris management plan X Removed-Not a mitigation action.
See Continuity Action Program 20 24 Improve water supply system X Incorporated into Action 12
25 Create emergency water reserve capacity X Removed - Capability
26 Reduce vulnerability of water supply X Incorporated into Action 12
27 Provide immediate variance ability X Modified – See 2016 Action 13
X 13 Create a streamline process to expedite rebuilding after a disaster
28 Create city acquisition program for at-risk properties 14 Continued
X 15 Develop a disaster recovery plan X 16 Increase shelter capacity

133 Mitigation Strategy
5.2.2 Prioritization
Once all the possible actions are on the table, there must be a way to determine their suitability as measures to solve the identified problems. Using some basic evaluation criteria can help to decide which actions will work best. Following the period of public input, the 2014 Hazard Mitigation Committee assigned priorities to each mitigation action. The most important criterion is whether the proposed action mitigates the particular hazard or potential loss. Each action should also be examined for conflict with other community programs or goals, and for how this action will impact the environment, as it is very important to consider whether the proposed action will meet state and local environmental regulations. Other considerations include whether the mitigation action affects historic structures or archeological areas or whether it helps achieve multiple community objectives. Another important issue is timing, and how quickly the action has to take place to be effective, as well as which actions will produce quick results. It is particularly important to consider if funding sources have application time limits, whether it is the beginning of storm season, or if the community is in the post-disaster scenario, where everyone wants to recover at maximum speed. Each of the considered actions was given a priority score based upon the STAPLEE criterion as described in Section 5.2.3.1. The scores were then translated into a relative priority ranking. Highest priority was placed on those actions given a ranking of 1. Those actions scoring the same were given equal ranking and may be accomplished simultaneously or at the very least they should be given equal consideration for implementation. This prioritization exercise helped the Committee evaluate seriously the new hazard mitigation strategies that had been developed throughout the Hazard Mitigation Planning process. While all the actions would help improve the city’s resilience, funding availability will be a driving factor in determining what and when new mitigation strategies are implemented. For example, while elevating structures out of the 100-year floodplain will definitely decrease floodplain losses, the cost of this project may require the project be put off until funding is made available. In contrast, the city can distribute preparedness information to the public at a much lesser cost, making this project more reasonable as a short-term goal. This type of cost to benefit analysis was taken into account when selecting and prioritizing each action.
5.2.3 STAPLEE
The Newport Hazard Mitigation Committee developed and refined hazard mitigation actions using careful evaluation criteria based on the concept of STAPLEE. STAPLEE is an acronym for a general set of criterion common to public administration officials and planners. It stands for the Social, Technical, Administrative, Political Legal and Economic/Environmental criterion for making planning decisions. The 2014 Hazard Mitigation Committee ranked each of the new or improved mitigation strategies by

134 Mitigation Strategy
utilizing the STAPLEE criterion. The Committee asked and then answered questions in order to determine the acceptability of the proposed mitigation action when being viewed in terms of six distinct criteria. See Table 5-2 for further explanation of the STAPLEE criterion. Table 5-2. STAPLEE Criteria for Selecting Mitigation Actions Criteria Explanation Social Is the proposed action socially acceptable to the community? Are
there equity issues involved that would mean that one segment of the community is treated unfairly? Will the action cause social disruption?
Technical Will the proposed action work? Will it create more problems than it solves? Does it solve a problem or only a symptom? Is it the most useful action in light of the community goals?
Administrative Can the community implement the action? Is there someone to coordinate and lead the effort? Is there sufficient funding, staff, and technical support available? Are there ongoing administrative requirements that need to be met?
Political Is the action politically acceptable? Is there public support both to implement and to maintain the project? Will the Mayor, his Cabinet, County Council and other decision-making political bodies support the mitigation measure?
Legal Is the community authorized to implement the proposed action? Is there a clear legal basis or precedent for this activity? Is enabling legislation necessary? Are there any legal side effects (e.g. could the action be construed as a taking)? Will the community be liable for action or lack of action? Will the activity be challenged?
Economic What are the costs and benefits of this action? Does the cost seem reasonable for the size of the problem and the likely benefits? Are maintenance and administrative costs taken into account as well as initial costs? How will this action affect the fiscal capability of the community? What burden will this action place on the tax base or the local economy? What are the budget and revenue effects of this action? Does the action contribute to other community goals, such as capital improvements or economic development? What benefits will the action provide?
Environmental Sustainable mitigation actions should not have an adverse effect on the environment; they should comply with federal, state, and local environmental regulations and should be consistent with the community’s environmental goals.
The Committee responded to each of these above listed criteria, with a numeric score of “1” (indicating low impact), a “2” (indicating medium impact), and a “3” (indicating high impact). These numbers were then totaled and developed into an overall priority score detailed in Table 5-3 in Section 5.5. Also included in this table is the department responsible for implementing the action and the project and cost justifications.

135 Mitigation Strategy
A total of 16 actions were developed by the 2014 Newport Hazard Mitigation Committee along with input from stakeholders and the general public. Four separate actions are considered “program continuity” actions due to their ongoing nature and the monitoring required to ensure appropriate progress. See Table 5-3 for a description of each Action Strategy and its respective priority scores. The overall program priorities for the city have not changed since the 2008 plan. Coastal related vulnerabilities emanating from a variety of potential hazard events remains the primary focus.
5.3 2016-2021 Action Plan The Newport action plan consists of 19 mitigation actions in two categories, Primary and Continuity. During the update process the Committee reduced the number of Primary Actions from 18 to 15 by eliminating several that were considered no longer valid due to changes in the community or completion of the action and by combining several actions to reduce redundancy and overlap. Two new Primary Actions have been added. The Hazard Mitigation Committee added four continuity items in addition to the sixteen primary action items. These four actions were found to have been completed since the 2008 Hazard Mitigation Plan, however, the committee felt these items were particularly important and further monitoring and sustainment was desirable and necessary. The actions are not listed in priority order. As stated previously, the committee worked to set goals and objectives that are bounded by a time frame following plan adoption by the City Council.
5.3.1 Primary Actions Program
ACTION #1 Creation of evacuation service and support mechanisms for citizens unable to self-evacuate At-risk populations, such as the homebound, must be protected during a hazard event requiring evacuation. Therefore, Action #1 has been identified to provide a support system for those people who are unable to leave their residences during a hazard event. Primarily, this system’s purpose will be the identification of those people requiring special transportation arrangements during an evacuation. Currently, evacuation of the elderly, special needs, and homebound are listed as a Police Department responsibility, however, the Fire Department works in conjunction with them to facilitate this need. Additionally, the Newport Emergency Management Agency (NEMA) has a Memorandum of Understanding with First Student, the local school bus transportation provider, should evacuation needs overwhelm the Fire and Police departments capacities.

136 Mitigation Strategy
Priority: Medium Pre or Post Disaster: Pre-disaster, Planning Responsible Department: Police Department Funding Resources: Police Department Budget Cost: Staff Time Action Justification: There are many residents who will be unable or unwilling to leave their homes during an evacuation. Cost Justification: Cost of developing a strategy to support persons unable to evacuate vs. life safety. Timeframe: Near-term
ACTION #2 Shelter study and acquisition of additional facilities if needed
Currently, a Red Cross Shelter Study has been completed and the study of additional shelter locations is ongoing. This action calls for the continued cataloging and evaluation of approved shelters. Some shelters have been recently removed due to not being ADA compliant and others have been added (Florence Gray Center and Pell School). The city’s Planning Division is developing content for a hazard mitigation web link to the city’s home page, where an easily accessible list would be kept of approved shelters. Distinctions would be made between Red Cross shelters and other city-approved temporary areas of refuge. In addition, new Memorandums of Understanding are being sought to ensure that shelter facilities have the ability to be used as Post Impact Shelters (providing public facilities, portable showers, etc.) Because Newport is a tourist destination, more study should be sought to determine whether current shelter facilities would be adequate if a hazard struck during the peak tourist season.
Priority: Medium Pre or Post Disaster: Pre-disaster, Planning Responsible Department: Fire Department Funding Resources: Fire Department Budget Cost: Staff Time Action Justification: There may not be enough evacuation and post impact shelters to house the residential and tourist volumes in Newport. Cost Justification: Cost of shelter study and development of additional shelter locations vs. risk of shelters being over capacity Timeframe: Near-term
ACTION #3 Purchase generators to increase resiliency of health care facilities during hazard events A private, not-for-profit hospital located in Newport, Newport Hospital was founded in 1873 to provide better access to mariners and residents of Aquidneck Island. Newport Hospital is a member of the Lifespan health system and partners with the Naval Station Newport in offering services to the military. Services provided by the hospital include emergency care, diagnostic imaging, a birthing center, behavioral health unit, surgical services, intensive care, and acute inpatient and outpatient rehabilitation. Currently,

137 Mitigation Strategy
Newport Hospital has 119 beds. Last year, the hospital had 4,903 admissions; its emergency room had 31,188 visits; and it performed 1,632 annual inpatient and 4,906 outpatient surgeries. People on Aquidneck Island need to have access to a health care facility during a hazard event. Additionally, Newport Hospital must be able to maintain operations during a hazard event. During Tropical Storm Irene (2011), Tropical Storm Sandy (2012), Winter Storm Nemo (2013) and Winter Storm Juno (2015), Newport Hospital lost electrical power. The Hazard Mitigation Committee proposed purchasing high output emergency generators to ensure that the hospital facilities remain operable when the power is lost. Access to and ability of Newport Hospital to respond to need are critical to the health, safety, and welfare of the people remaining on Aquidneck Island during a hazard event.
Priority: High Pre or Post Disaster: Pre-disaster, Emergency Services Responsible Department: Civic Investment Funding Resources: Public/Private Partnership, FEMA Grant Cost: $150,000 Action Justification: Evacuation of health care facilities is extremely resource intensive and not generally in the best interest of the patients. Cost Justification: Cost of generators vs. life safety Timeframe: Near-term
ACTION #4 Public Education/Information dissemination Public education and outreach can go a very long way in protecting the safety and welfare of citizens. The City of Newport established a city-wide emergency notification system known as “Code Red.” This system can issue a telephone message, text message, and/or an email message to warn city residents and businesses of an emergency, provided they register for the service. Also, the Newport Fire Department makes public announcements and provides information regarding property protection measures and preparedness activities on its Facebook page. The City of Newport is has redesigned its web page and is exploring posting hazard mitigation information and dates for public engagement activities in order to strengthen communication and improve preparedness at all levels (grass roots, emergency responders, etc.). Engage Newport and the Newport Emergency Management Agency (NEMA) will continue to work to distribute information focused on high probability hazards at city-sponsored public events. Educational materials, videos, and planning tools will be distributed to assist homeowners and businesses in understanding their role in reducing vulnerabilities and implementing hazard mitigation measures on their own. In addition, social media applications should be explored and used to assist in emergency warnings and to engage its citizens in learning hazard procedures. Studies have found that a good pre-emergency information program increases response to hazard warnings.

138 Mitigation Strategy
Priority: Medium Pre or Post Disaster: Pre-disaster, Education Responsible Department: Civic Investment & Engage Newport Funding Resources: Fire Prevention Budget Cost: $10,000 Action Justification: Many residents lack knowledge of how to mitigate their homes and protect themselves during a hazard event. Cost Justification: Cost of providing information vs. preventable damages and increased life safety risk Timeframe: Near-term
ACTION #5 Implement protective measures for historic structures and collections Newport is rich in historic architecture, which is one of the main reasons that the city maintains a vibrant tourist industry. If historic structure and collections were lost this could negatively impact Newport’s economy. Action #5 is intended to identify the location and relative vulnerability of the historic properties and collections in the city. The city will partner with the owners/managers of vulnerable historic properties and collections to identify feasible and cost-effective mitigation measures. This action calls for the development and implementation of a plan to protect historic structures, collections, and public records.
Priority: High Pre or Post Disaster: Pre-disaster, Planning/Property Protection Responsible Department: Civic Investment & Engage Newport Funding Resources: Public/Private Partnership, Grants Cost: $250,000 Action Justification: The historic properties and collections in the city are essential elements of the city economy that cannot be replaced. Cost Justification: Cost to protect historic structures and collections vs. preventable damages Timeframe: Near-term
ACTION #6 Categorize priority activities for city owned flood risk properties to develop sustainable and resilient facilities and infrastructure
This action entails categorizing priority activities for city-owned flood risk structures. This action would help to determine which structures are most in need of retrofitting to reduce the threat of flooding during a hazard event. Facility modification plans will include elements to develop sustainable and resilient facilities and infrastructure. A cost-benefit analysis would be included to calculate and compare costs for each structure and determine the project’s priority level and economically viability. Information found in this study could be posted on the city’s web page to assist private citizens who own flood risk property and may be interested in making improvements.

139 Mitigation Strategy
Priority: Low Pre or Post Disaster: Pre-disaster, Planning Responsible Department: Building Official Funding Resources: TBD. Dependent on facility Cost: TBD Action Justification: There are some structures within Newport that are at higher risk of structural damage due to weather-related incidents. Cost Justification: Cost of developing inventory vs. possibility of overlooking a more cost effective mitigation action Timeframe: Medium-term
ACTION #7 Revise, amend and enforce the Newport Zoning Code to manage land in vulnerable areas Zoning complications resulting from mitigating structures against hazards are anticipated. For example, many of the flood-prone homes in the city are at, or in some cases already, exceed current zoning height restrictions. Therefore, this action provides for the evaluation and revision of current zoning regulations to determine appropriate changes to allow for the retrofitting of these structures. The Committee has suggested exploring the creation of a floodplain overlay zoning district for structures located within the special flood hazard area (SFHA) and evaluate its mitigation tools available to reduce the insurance costs for property owners.
Priority: Medium Pre or Post Disaster: Pre-disaster, Planning Responsible Department: Zoning Official Funding Resources: None required Action Justification: Accommodating flood prevention measures for properties located within the SFHA Cost Justification: Cost of zoning variance vs. cost of structural loss Timeframe: Medium-term
ACTION #8 Seawall sustainment As the only city on Aquidneck Island, Newport is particularly vulnerable to property damage and loss resulting from sea wall deterioration through erosion. Sea walls protect unique public amenities such as the Cliff Walk and Ocean Avenue. Additionally, historic areas such as the Point section and the Thames Street downtown area are both protected by seawalls. Reinforcement and improvement of the city’s sea walls are vital to the protection of public and private property from natural hazards such as storms and coastal erosion. As a result, their sustainment has been included in this action.

140 Mitigation Strategy
In 2011, Ocean Avenue seawall repairs were completed in the area east of Harrison Avenue. Additional repairs to these seawalls were also made in 2013 from Harrison Avenue to Brenton State Park. Repairs to the Cliff Walk received approval from the Coastal Resources Management Council (CRMC). The repairs stretch between Ruggles Avenue and Bailey’s Beach, at the end of Bellevue Avenue. The bidding process was completed in August 2013 and construction was scheduled to begin in fall 2013. The work included concrete and stone foundation repairs, new walkways, decorative railing, and landscaping. The project ran into delays after the original plan included stone jetties located off Ruggles Avenue, but were latter removed from the final plans. Construction concluded in June 2014 at an approximate cost of $3.5 million. Of particular concern is an uneven section of the seawall located at King Park. This seawall is of vital importance in protecting the King Park area against storm surge. As a solution, this action calls for the leveling of this section of the sea wall to create a uniform barrier against storm surge. Currently, the King Park Beach seawall restoration project is 80% completed. Repairs include the replacement of several sections of seawall, totaling over 150 linear feet, including a newly designed section. The new section was analyzed for wave impact loading and scour. Improvements also included installing new concrete parapets above an existing section of seawall (approximately 300 7feet in length). Newport has currently invested $644,000 for this restoration project. There is still a significant section of seawall and the Cliff Walk that need to be addressed.
Priority: High Pre or Post Disaster: Pre-disaster, Property Protection Responsible Department: Public Services Department Funding Resources: FEMA Grant/Operating Budget Cost: $3 Million Action Justification: Areas of seawall and Cliff Walk are deteriorating and therefore more susceptible to storm surge impact. Cost Justification: Cost preventative maintenance vs. cost of reconstruction Timeframe: Near-term
ACTION #9 Eliminate flood risk to repetitive loss properties The Easton’s Beach area has historically received repeated damage from hurricanes. The beach facilities and structures including buildings, parking lots, and seawalls have been significantly damaged or destroyed during past hurricane events. In addition to beach facilities and structures, the homes located behind Easton Pond have experienced repeated flood damage during past hurricane events, as well, representing the only area of repetitive flood insurance claims in Newport. Recently, Hurricane Sandy (2012) devastated the Easton’s Beach area and the beach facilities. The area was rebuilt and modified to better resist hurricane damage. However, it remains unclear if these structures were adequately designed to withstand the most severe hurricanes, those of Category 3 and higher. As such

141 Mitigation Strategy
this action is in place to determine appropriate structural activities to mitigate the potential risk to repetitive loss properties.
Priority: Low Pre or Post Disaster: Pre-disaster, Property Protection Responsible Department: Building Official Funding Resources: Building department budget/ FEMA, HUD Cost: $150,000 Action Justification: There are several repetitive loss properties in the city of Newport Cost Justification: Cost of mitigation actions vs. cost of repetitive losses Timeframe: Medium-term
ACTION #10 Conduct vulnerability assessment of pre-code structures The section of the City of Newport identified as the Urban Fire Hazard Zone during the hazard risk assessment consists of those areas of Newport where industrial uses are mixed with other uses such as residential and commercial. These areas are known to have the highest vulnerability to conflagration. As a result, mitigation actions have been provided that call for a study to identify those structures constructed prior to the adoption of modern building codes. This study will identify those buildings that have not been brought up to standard as a result of a remodeling or modification, and whose cost was in excess of 75 percent of the structure’s original value. This study should pay particularly close attention to the recently revised Rhode Island Fire Code.
Priority: Medium Pre or Post Disaster: Pre-disaster, Planning and Regulations Responsible Department: Fire Department Funding Resources: Fire prevention budget Cost: Staff Time Action Justification: There are many areas of the city at risk of a conflagration. Cost Justification: Cost of preventative measures vs. cost of property loss and life safety risk Timeframe: Medium-term
ACTION #11 Protect and reduce the vulnerability of the waste water system infrastructure Separate remaining combined sewer and stormwater drainage systems; protect WWTF in the event of hazard. Some sections of the sewer system become overwhelmed during flood events and discharge effluent into the harbor, bay, and ocean. This occurrence is the result of an aged combined sewer and stormwater system built prior to modern environmental regulations. Eighty percent of the sewer system has been separated from the stormwater system, but the remaining twenty percent remains to be disconnected. Therefore, this action calls for the separation of the remaining combined sewer and stormwater system.

142 Mitigation Strategy
Currently, the city has initiated sewer separation contracts; however, these bids may be reconsidered due to their possible impacts of the redirected stormwater. The city is working with RIDEM and the EPA per a consent agreement to develop a System Master Plan that establishes long-term control and regulation of the combined sewer overflows.
Priority: High Pre or Post Disaster: Pre-disaster, Property Protection Responsible Department: Utility Department Funding Resources: City Operating Budget, Grant Cost: 1.5 Million Action Justification: Several areas of the city have a combined sewer drainage system, Newport WWTF falls within floodplain. Cost Justification: Cost of separation of combined systems vs. cost of continued environmental impact Timeframe: Long-term
ACTION #12 Protect and reduce the vulnerability of the potable water supply Easton Pond is a public drinking water reservoir that has in the past become contaminated with salt water when hurricane storm surge overwhelms its banks. Of particular concern is the Easton Pond shore bank facing Easton’s Beach. It has been reinforced to withstand storm surge. However, it is unclear whether Easton Pond can withstand the highest storm surge this area could potentially receive. To mitigate this scenario, this action calls for a study to determine the vulnerability of the pond to contamination by salt water. The Department of Public Utilities continues to monitor this situation. The city is in the process of reviewing this item as part of an ongoing city-wide sea level rise analysis. The information obtained from this research will help the city develop regional mitigation steps to secure the Aquidneck Island drinking water supply and mitigate against contamination.
Priority: High Pre or Post Disaster: Pre-disaster, Emergency Services Responsible Department: Utility Department Funding Resources: FEMA Grant/Operating Budget Cost: $1.2 Million Action Justification: Critical water supply infrastructure lies within the SFHA and is therefore subject to damage. Single supply lines leave the city’s water system susceptible to failure. Cost Justification: Cost of mitigation actions and maintaining a timeworn water delivery system vs. cost of water reservoir cleanup and system failure Timeframe: Medium-term
ACTION #13 Implement emergency planning and permitting procedures

143 Mitigation Strategy
Implement a streamline process to assure efficiency in the rebuilding process after a disaster. It is a likely scenario that a hazard event will strike before all necessary retrofitting has been completed. Therefore, in the event of a natural hazard incident that produces significant damage to private property, this action calls for creating a streamline process to expedite rebuilding after a disaster. Implementing such a process during recovery will facilitate a more rapid return to normal social, economic, and civic activity.
Priority Medium Pre or Post Disaster: Pre-disaster, Planning and Regulation Responsible Department: Zoning and Inspections Department Funding Resources: None required Cost: Staff Time Action Justification: Current process does not take into consideration the loss of a primary dwelling and the associated effects that may be encountered following a disaster. Cost Justification: There is no direct cost associated with this action. Timeframe: Near-term
ACTION #14 Develop an acquisition program This action calls for partnering with alternative agencies to identify at-risk properties that may be suitable for acquisition. This program would offer homeowners whose private property was severely impacted by a natural hazard event an option to be “bought out.” The purpose of this action item is to provide relief to those properties and their owners the greatest risk of damage from natural hazard events to sell if they do not desire to be located in harm’s way.
Priority: Low Pre or Post Disaster: Post-disaster, Property Protection Responsible Department: Zoning and Inspections Department Funding Resources: Operating Budget/FEMA HMGP Cost: TBD Action Justification: Many residents may not have means to retrofit homes post-impact and may prefer to sell property to alternative agencies. Cost Justification: Cost of acquiring at risk properties vs. cost of funding repetitive losses Timeframe: Medium-term
ACTION #15 Develop a Disaster Recovery Plan This action calls for the development of a disaster recovery plan that aligns with the precepts contained in the National Disaster Recovery Framework. Completion of this plan will facilitate a more efficient recovery operation to restore and revitalize the social, economic and environmental health of the city.

144 Mitigation Strategy
Priority: High Pre or Post Disaster: Pre-disaster, Planning Responsible Department: Zoning and Inspections Department Funding Resources: Operating Budget/ FEMA preparedness grant Cost: $35,000 Action Justification: There are immediate (e.g. restoring power) and longer-term (e.g. rebuilding structures) recovery actions that must be implemented post-disaster; an effective disaster recovery plan increases preparedness and accelerates the recovery process. Cost Justification: Cost of planning ahead and developing a Disaster Recovery Plan vs. cost of an unprepared, slower recovery effort Timeframe: Near-term
ACTION #16 Increase shelter capacity The Dr. Martin Luther King Jr. Community Center, 20 Dr. Marcus Wheatland Boulevard, was recently removed from the city’s list of available shelters due, in part to a lack of generator capability. This action calls for the development of additional local sheltering capacity to address shortfalls needed to support year-round and seasonal populations.
Priority: High Pre or Post Disaster: Pre-disaster, Planning Responsible Department: Zoning and Inspections Department Funding Resources: Operating Budget/ FEMA preparedness grant Cost: $25,000 Action Justification: As an island community with a significant seasonal population increase, and limited road network to support evacuation. Local sheltering may be the only option in a short or no-notice scenario. Cost Justification: Provision of adequate local sheltering vs. cost of an exposed and vulnerable population Timeframe: Near-term
5.3.2 Continuity Actions Program
The 2014 Hazard Mitigation Committee added four continuity items in addition to the sixteen primary action items. These four actions were found to have been completed since the 2008 Hazard Mitigation Plan, however, the committee felt these items were particularly important and further monitoring and sustainment was desirable and necessary. By including these actions in the 2016 update, the City will continue to build capacity to implement long-term risk reduction actions in the future. The following actions have been classified as preparedness and response measures that the City will continue to implement throughout the lifecycle of this mitigation plan. ACTION #17 Improvement of evacuation routes

145 Mitigation Strategy
The limited road network in Newport and throughout Aquidneck Island requires constant vigilance to ensure access and egress. REIMA posted and established evacuation routes throughout Rhode Island based on the U.S. Army Corps of Engineers, Hurricane Evacuations Study Program (2009). These maps show which areas would be flooded during a hurricane in order that local communities develop emergency planning and response systems to mitigate against these hazards. The current Newport evacuation map (RIEMA) outlines hurricane approved shelters, areas most affected by hurricanes, and evacuation routes. Action #17 includes continuing study of evacuation routes to take into consideration the significant fluctuations in population during the various tourism periods.
Priority: High Pre or Post Disaster: Pre-disaster, Emergency Services Responsible Department: Police Department Funding Resources: Police Department Budget Cost: Staff Time Action Justification: Limited available evacuation routes; tourist volume can impact evacuation. Cost Justification: Cost of evacuation study vs. life safety risk Timeframe: Ongoing
ACTION #18 Evacuation route sustainment
Due to the high volume of traffic that will be using roads during an emergency evacuation, it is imperative that critical evacuation routes be well maintained. This action will set evacuation route maintenance as a continuous priority for the Newport’s Department of Public Services. In addition, the city is using a pavement management system (BETA) to evaluate the condition and prioritize scheduled maintenance of these roads. This action includes special projects for critical roads to be used during evacuation to ensure overall readiness
Priority: High Pre or Post Disaster: Pre-disaster, Emergency Services Responsible Department: Public Services Department Funding Resources: Public Services Department Budget Cost: Staff Time, Operating budget Action Justification: Evacuation routes in disrepair may impact evacuation. Cost Justification: Cost of maintenance vs. increased evacuation times Timeframe: Ongoing
ACTION #19 Reduce vulnerability of power and communications infrastructure
Newport has an impressive array of public decorative and street trees. These trees are often extensively damaged during storm and flooding events, and as a result can cause significant disruptions to traffic. This action calls for the maintenance of roadside trees to

146 Mitigation Strategy
reduce vulnerability to blockages and interference with above ground utilities and facilitate quick roadway clearing. The Newport Tree Society has completed its professional tree inventory of Newport’s public street trees. The inventory was a collaborative effort by the Davey Resource Group and the Newport Department of Public Services, Buildings, Grounds & Forestry Division. Newport is dedicated to maintaining its beautiful trees and supports the Newport Tree Society’s mission to foster a healthy, growing urban forest in the City of Newport. This tree management program allows staff to monitor, prioritize, schedule, and budget effectively in order to encourage citizen volunteers and residents to participate in its care. In addition, the Newport Tree and Open Space Commission assists the city’s tree warden in protecting and improving the public and private tree stands. This group of citizen volunteers helps to guide the city’s overall policies and plans for the city’s treescapes, reviews major tree removal and planting proposals, encourages cooperation among key groups and leaders, and educates the public about trees.
Priority: High Pre or Post Disaster: Pre-disaster, Emergency Services Responsible Department: City Public Services, Building and Grounds Supervisor/Tree Warden Funding Resources: City Public Services budget Cost: Staff Time Action Justification: Maintaining trees will assist debris removal teams in clearing major roads after a disaster event and minimize interference with above ground utilities. Cost Justification: Cost of maintenance vs. life safety Timeframe: Ongoing
ACTION #20 Maintain debris management plan
The onset of a hazard event usually brings with it the hefty chore of debris removal. Action #19 calls for the maintenance of a debris management plan, which has been recently completed. This plan is to be exercised regularly so that debris removal assets are in place for rapid clearing of critical roadways. A regional response to debris management should be reviewed in the future. If a major category storm directly hit the Aquidneck Island, existing debris streams and debris management sites may not be large enough to support that amount of waste.
147 Mitigation Strategy
Priority: Medium Pre or Post Disaster: Pre-disaster, Emergency Services Responsible Department: Public Services Department Funding Resources: Public Services Department budget Cost: Staff Time Action Justification: Having a debris removal plan will expedite debris removal Cost Justification: Cost of plan development vs. life safety Timeframe: Ongoing
5.4 Table/Matrix The tables on the following pages represent the Newport Natural Hazard Mitigation matrix.

148 Mitigation Strategy

14
9 M
itiga
tion
Stra
tegy
Tabl
e 5-
3. N
atur
al H
azar
d M
itiga
tion
Prim
ary
Act
ions
AC
TION
#
PRIO
RITY
HA
ZARD
TYPE
PO
TEN
TIAL
PRO
GRA
M
DESC
RIPT
ION
OF
STRA
TEG
Y A
FFEC
TED
LOC
ATIO
N
TYPE
OF
AC
TIVITY
RE
LATE
D G
OA
L(S)
FU
NDI
NG
SO
URC
ES
TIMEF
RAM
E (S
ectio
n 5-
1)
RESP
ON
SIBL
E DE
PART
MEN
T ST
ATU
S
NEW
, C
ON
TINUE
D,
MO
DIFI
ED F
ROM
20
08
1 M
EDIU
M
ALL
HA
ZARD
S
EVA
CUA
TION
SER
VIC
E FO
R EL
DER
LY, S
PEC
IAL
NEE
DS,
AN
D
HO
MEB
OUN
D
CRE
ATIO
N O
F EV
AC
UATIO
N
SERV
ICE
AN
D S
UPPO
RT
MEC
HAN
ISM
S FO
R C
ITIZE
NS
UNA
BLE
TO S
ELF-
EVA
CUA
TE.
CITY
WID
E
HEA
LTH
, SA
FETY
, AN
D
WEL
FARE
EM
ERG
ENC
Y RE
SPO
NSE
1, 3
PO
LIC
E D
EPA
RTM
ENT
BUD
GET
N
EAR-
TERM
PO
LIC
E D
EPA
RTM
ENT
POLI
CE
AN
D F
IRE
HA
VE
ESTA
BLIS
HED
PRO
CED
URES
.
NEM
A &
FIR
ST S
TUD
ENT
AC
T A
S BA
CKU
P. E
XPA
NSI
ON
OF
SERV
ICE
TO B
E EX
PLO
RED
.
CO
NTIN
UED
2 M
EDIU
M
ALL
HA
ZARD
S
SHEL
TER
STUD
Y A
ND
A
CQ
UISI
TION
OF
AD
DITI
ON
AL
FAC
ILITI
ES
IF N
EED
ED
EVA
LUA
TE E
XPEC
TED
SH
ELTE
R D
EMA
ND
AN
D E
XIST
ING
C
APA
CITY
TO
ASS
URE
NEE
D
WIL
L BE
MET
CITY
WID
E
HEA
LTH
, SA
FETY
, AN
D
WEL
FARE
EM
ERG
ENC
Y RE
SPO
NSE
1, 3
FI
RE
DEP
ART
MEN
T BU
DG
ET
NEA
R-TE
RM
FIRE
DEP
ART
MEN
T
RED
CRO
SS S
HEL
TER
STUD
Y C
OM
PLET
E.
FU
RTH
ER S
TUD
Y N
EED
ED T
O
ASS
ES D
EMA
ND
VS.
EXI
STIN
G
CA
PAC
ITY.
CO
NTIN
UED
3 HI
GH
A
LL H
AZA
RDS
PURC
HA
SE G
ENER
ATO
R TO
INC
REA
SE
RESI
LIA
NC
Y O
F H
EALT
H
CA
RE F
AC
ILITE
IS
DUR
ING
HA
ZARD
EV
ENTS
PURC
HA
SE H
IGH
OUT
PUT
EMER
GEN
CY
GEN
ERA
TORS
TO
EN
SURE
HO
SPITA
L FA
CIL
ITIES
REM
AIN
OPE
RABL
E W
HEN
PO
WER
IS L
OST
NEW
PORT
H
OSP
ITAL
HEA
LTH
, SA
FETY
, AN
D
WEL
FARE
1,
3, 5
, 7
PUBL
IC/P
RIV
ATE
PA
RTN
ERSH
IP,
FEM
A
PREP
ARE
DN
ESS
GRA
NT
NEA
R-TE
RM
CIV
IC IN
VES
TMEN
T N
OT
CO
MPL
ETED
, REQ
UIRE
S FU
ND
ING
C
ON
TINUE
D
4 M
EDIU
M
ALL
HA
ZARD
S PU
BLIC
ED
UCA
TION
/ IN
FORM
ATIO
N
DIS
SEM
INA
TION
IMPL
EMEN
T ED
UCA
TION
&
OUT
REA
CH
WO
RKSH
OPS
FO
CUS
ING
ON
HA
ZARD
M
ITIG
ATIO
N R
EAD
INES
S A
ND
PR
EPA
RED
NES
S
CITY
WID
E
HEA
LTH
, SA
FETY
, AN
D
WEL
FARE
PR
OPE
RTY
PRO
TEC
TION
1, 2
, 3, 4
, 6, 7
, 8,
9
FIRE
PR
EVEN
TION
BU
DG
ET
NEA
R-TE
RM
CIV
IC IN
VES
TMEN
T EN
GA
GE
NEW
PORT
“CO
DE
RED
” EM
ERG
ENC
Y C
OM
MUN
ICA
TION
C
OM
PLET
E.
FU
RTH
ER S
TUD
Y RE
CO
MM
END
ED E
XPLO
RIN
G
OTH
ER O
UTRE
AC
H
OPP
ORT
UNITI
ES.
MO
DIF
IED
5 HI
GH
A
LL H
AZA
RDS
IMPL
EMEN
T PR
OTE
CTIV
E M
EASU
RES
TO P
ROTE
CT
HIST
ORI
C S
TRUC
TURE
S A
ND
CO
LLEC
TION
S
DEV
ELO
PMEN
T A
ND
IM
PLEM
ENTA
TION
OF
A P
LAN
TO
PRO
TEC
T H
ISTO
RIC
ST
RUC
TURE
S, C
OLL
ECTIO
NS,
A
ND
PUB
LIC
REC
ORD
S
CITY
WID
E
PRO
PERT
Y PR
OTE
CTIO
N
RESO
URC
E PR
ESER
VA
TIO
N
2, 4
, 5, 6
, 7, 8
PU
BLIC
/PRI
VA
TE
PART
NER
SHIP
, G
RAN
TS
NEA
R-TE
RM
CIV
IC IN
VES
TMEN
T EN
GA
GE
NEW
PORT
N
EW A
CTIO
N
NEW
6 LO
W
FLO
OD
EV
ENTS
CA
TEG
ORI
ZE P
RIO
RITY
A
CTIV
ITIES
FO
R C
ITY
OW
NED
FLO
OD
RIS
K ST
RUC
TURE
S
MITI
GA
TE S
TRUC
TURE
S M
OST
LI
KELY
TO
BE
DA
MA
GED
D
URIN
G A
HA
ZARD
EV
ENT
CITY
WID
E &
FL
OO
DPL
AIN
PR
OPE
RTY
PRO
TEC
TION
2,
3, 5
, 6, 7
, 8
TBD
D
EPED
ENT
ON
FA
CIL
ITY
MED
IUM
-TER
M
BUIL
DIN
G O
FFIC
IAL
NO
T C
OM
PLET
ED
MO
DIF
IED

15
0 M
itiga
tion
Stra
tegy

15
1 M
itiga
tion
Stra
tegy
AC
TION
#
PRIO
RITY
HA
ZARD
TYPE
PO
TEN
TIAL
PRO
GRA
M
DESC
RIPT
ION
OF
STRA
TEG
Y A
FFEC
TED
LOC
ATIO
N
TYPE
OF
AC
TIVITY
RE
LATE
D G
OA
L(S)
FU
NDI
NG
SO
URC
ES
TIMEF
RAM
E Se
ctio
n 5-
1 RE
SPO
NSI
BLE
DEPA
RTM
ENT
STA
TUS
NEW
, C
ON
TINUE
D,
MO
DIFI
ED F
ROM
20
08
7 M
EDIU
M
ALL
HA
ZARD
S RE
VIS
E ZO
NE
CO
DE
REV
ISE,
AM
END
AN
D
ENFO
RCE
ZON
ING
CO
DE
TO
MA
NA
GE
LAN
D IN
V
ULN
ERA
BLE
ARE
AS
CITY
WID
E
PRO
PERT
Y PR
OTE
CTIO
N
RESO
URC
E PR
ESER
VA
TIO
N
2, 4
, 5, 6
, 7, 8
N
ON
E RE
QUI
RED
M
EDIU
M-T
ERM
ZO
NIN
G O
FFIC
IAL
NEW
AC
TION
N
EW
8 HI
GH
ST
ORM
SU
RGE
SEA
WA
LL S
USTA
INM
ENT
PREV
ENTA
TIVE
MEA
SURE
S FO
R SE
A W
ALL
S A
ND
CLI
FF W
ALK
TO
MIN
IMIZ
E D
AM
AG
E FR
OM
ST
ORM
SUR
GE
CO
AST
AL
PRO
PERT
Y PR
OTE
CTIO
N
2, 3
, 4, 6
, 7
FEM
A
MITI
GA
TION
G
RAN
T N
EAR-
TERM
PU
BLIC
SER
VIC
ES
DEP
ART
MEN
T N
OT
CO
MPL
ETED
M
OD
IFIE
D
9 LO
W
FLO
OD
EV
ENTS
ELIM
INA
TE F
LOO
D R
ISK
TO R
EPET
ITIV
E LO
SS
PRO
PERT
IES
DET
ERM
INE
APP
ROPR
IATE
A
CTIO
NS
TO M
ITIG
ATE
FLO
OD
RI
SK T
O R
EPET
ITIV
E LO
SS
STRU
CTU
RES.
FLO
OD
PLA
IN
PRO
PERT
Y PR
OTE
CTIO
N
2, 4
, 7
BUIL
DIN
G
DEP
ART
MEN
T BU
DG
ET
MED
IUM
-TER
M
BUIL
DIN
G O
FFIC
IAL
NO
T C
OM
PLET
ED; W
ORK
ING
W
ITH C
RC/C
RMC
TO
D
ETER
MIN
E IM
PRO
VEM
ENTS
M
OD
IFIE
D
10
MED
IUM
UR
BAN
FIR
E
CO
ND
UCT
A
VUL
NER
ABI
LITY
A
SSES
SMEN
T O
F PR
E-C
OD
E ST
RUC
TURE
S
PERF
ORM
STU
DY
TO D
EVEL
OP
AC
TION
S W
HIC
H W
ILL
RED
UCE
FIRE
SPR
EAD
PO
TEN
TIAL
IN U
RBA
N F
IRE
ZON
E
URBA
N F
IRE
ZON
E PR
OPE
RTY
PRO
TEC
TION
1,
2, 3
, 4, 5
, 6, 7
, 8
FIRE
DEP
ART
MEN
T BU
DG
ET
MED
IUM
-TER
M
FIRE
DEP
ART
MEN
T
CO
MPL
ETE
REV
ISIO
N O
F RI
FI
RE C
OD
E. B
UILD
ING
CO
DE
UPD
ATE
S &
REM
OV
AL
OF
GRA
ND
FATH
ER L
AW
S.
ZO
NIN
G C
OD
E UP
DA
TES
REC
OM
MEN
DED
MO
DIF
IED
11
HIG
H
FLO
OD
EV
ENTS
PR
OTE
CT
WA
STEW
ATE
R SY
STEM
SEPA
RATE
REM
AIN
ING
C
OM
BIN
ED S
EWER
AN
D
STO
RM W
ATE
R D
RAIN
AG
E SY
STEM
S.
PRO
TEC
T W
AST
EWA
TER
TREA
TMEN
T FA
CIL
ITY
CO
AST
AL
HEA
LTH
, SA
FETY
, &
WEL
FARE
RE
SOUR
CE
PRES
ERV
ATI
ON
1,2,
5 O
PERA
TING
BU
DG
ET, G
RAN
T LO
NG
-TER
M
UTIL
ITY D
EPA
RTM
ENT
WO
RKIN
G W
ITH R
IDEM
& E
PA
TO D
EVEL
OP
A S
YSTE
M
MA
STER
PLA
N F
OR
LON
GTE
RM C
ON
TRO
L O
F C
OM
BIN
ED S
EWER
O
VER
FLO
WS
NEW
12
HIG
H
FLO
OD
EV
ENTS
/ SU
RGE
PRO
TEC
T PO
TABL
E W
ATE
R SU
PPLY
USE
RESU
LT O
F RE
GIO
NA
L ST
UDY
TO D
EVEL
OP
AN
D
IMPL
EMEN
T M
ITIG
ATIO
N
AC
TION
S TO
RED
UCE
VUL
NER
ABI
LITY
CITY
WID
E
HEA
LTH
, SA
FETY
, &
WEL
FARE
RE
SOUR
CE
PRES
ERV
ATI
ON
1,3,
,5
FEM
A
MITI
GA
TION
G
RAN
T M
EDIU
M-T
ERM
UT
ILITY
DEP
ART
MEN
T N
EW A
CTIO
N
NEW

15
2 M
itiga
tion
Stra
tegy

15
3 M
itiga
tion
Stra
tegy
AC
TION
#
PRIO
RITY
HA
ZARD
TYPE
PO
TEN
TIAL
PRO
GRA
M
DESC
RIPT
ION
OF
STRA
TEG
Y A
FFEC
TED
LOC
ATIO
N
TYPE
OF
AC
TIVITY
RE
LATE
D G
OA
L(S)
FU
NDI
NG
SO
URC
ES
TIMEF
RAM
E Se
ctio
n 5-
1 RE
SPO
NSI
BLE
DEPA
RTM
ENT
STA
TUS
NEW
, C
ON
TINUE
D,
MO
DIFI
ED F
ROM
20
08
13
MED
IUM
A
LL H
AZA
RDS
IMPL
EMEN
T EM
ERG
ENC
Y PL
AN
NIN
G
AN
D P
ERM
ITTIN
G
PRO
CED
URES
ALL
OW
FO
R A
STR
EAM
LIN
E PR
OC
ESS
TO A
SSUR
E EF
FIC
IEN
CY
IN T
HE
REBU
ILD
ING
PRO
CES
S A
FTER
A
DIS
AST
ER
CITY
WID
E EM
ERG
ENC
Y RE
SPO
NSE
3,
4, 7
, 10
NO
NE
REQ
UIRE
D
NEA
R-TE
RM
PLA
NN
ING
& Z
ON
ING
D
EPA
RTM
ENT
NO
T C
OM
PLET
E C
ON
TINUE
D
14
LOW
A
LL H
AZA
RDS
DEV
ELO
P A
N
AC
QUI
SITIO
N
PRO
GRA
M
CRE
ATE
A B
UYO
UT P
ROG
RAM
TO
ALL
OW
FO
R A
CQ
UISI
TION
O
F LO
CA
L A
T-RI
SK
RESI
DEN
TIAL
STRU
CTU
RES
CITY
WID
E EM
ERG
ENC
Y RE
SPO
NSE
3,
4, 6
, 8, 9
, 10
OPE
RATIN
G
BUD
GET
FE
MA
HM
GP
MED
IUM
-TER
M
PLA
NN
ING
& Z
ON
ING
D
EPA
RTM
ENT
NO
T C
OM
PLET
E C
ON
TINUE
D
15
HIG
H
ALL
HA
ZARD
S D
EVEL
OP
A D
ISA
STER
RE
CO
VER
Y PL
AN
AN
EFF
ECTIV
E D
ISA
STER
RE
CO
VER
PLA
N IN
CRE
ASE
S PR
EPA
RED
NES
S A
ND
A
CC
ELER
ATE
S TH
E RE
CO
VER
Y PR
OC
ESS
CITY
WID
E EM
ERG
ENC
Y RE
SPO
NSE
1,
2, 3
, 4, 6
, 7, 1
0
OPE
RATIN
G
BUD
GET
FE
MA
PR
EPA
RED
NES
S G
RAN
T
NEA
R-TE
RM
PLA
NN
ING
& Z
ON
ING
D
EPA
RTM
ENT
NO
T C
OM
PLET
E N
EW
16
HIG
H
ALL
HA
ZARD
S IN
CRE
ASE
LO
CA
L SH
ELTE
R C
APA
CITY
DEV
ELO
P A
DD
ITIO
NA
L LO
CA
L SH
ELTE
RIN
G C
APA
CITY
TO
SU
PPO
RT Y
EAR-
ROUN
D A
ND
SE
ASO
NA
L PO
PULA
TION
CITY
-WID
E EM
ERG
ENC
Y RE
SPO
NSE
1,
3, 5
, 7, 1
0
OPE
RATIN
G
BUD
GET
FE
MA
PR
EPA
RED
NES
S G
RAN
T
NEA
R-TE
RM
PLA
NN
ING
& Z
ON
ING
D
EPA
RTM
ENT
NO
T C
OM
PLET
E N
EW
Tabl
e 5-
4. N
atur
al H
azar
d M
itiga
tion
Con
tinui
ty A
ctio
ns
SUST
AIN
MEN
T A
CTIO
N
#
PRIO
RITY
HA
ZARD
TYPE
PO
TEN
TIAL
PRO
GRA
M
DESC
RIPT
ION
OF
STRA
TEG
Y A
FFEC
TED
LOC
ATIO
N
TYPE
OF
AC
TIVITY
RE
LATE
D G
OA
L(S)
FU
NDI
NG
SO
URC
ES
TIMEF
RAM
E Se
ctio
n 5-
1 RE
SPO
NSI
BLE
DEPA
RTM
ENT
STA
TUS
NEW
, C
ON
TINUE
D,
MO
DIFI
ED F
ROM
20
08
17
HIG
H
ALL
HA
ZARD
S IM
PRO
VEM
ENT
OF
EVA
CUA
TION
RO
UTES
STUD
Y O
F EX
ISTIN
G
EVA
CUA
TION
RO
UTES
PA
YIN
G
CLO
SE A
TTEN
TION
TO
HIG
H
TOUR
IST
VO
LUM
E
CITY
WID
E HE
ALT
H,
SAFE
TY, A
ND
W
ELFA
RE
1, 2
PO
LIC
E D
EPA
RTM
ENT
BUD
GET
N
EAR-
TERM
PO
LIC
E D
EPA
RTM
ENT
EVA
CUA
TION
RO
UTE
CRE
ATE
D &
PO
STED
BY
RIEM
A.
O
NG
OIN
G M
AIN
TEN
AN
CE
AN
D IM
PRO
VEM
ENTS
D
ESIR
ED
CO
NTIN
UED
18
HIG
H
ALL
HA
ZARD
S RO
AD
RE
CO
NST
RUC
TION
SPEC
IAL
PRO
JEC
TS F
OR
CRI
TICA
L RO
AD
S TO
BE
USED
D
URIN
G E
VA
CUA
TION
TO
EN
SURE
OV
ERA
LL R
EAD
INES
S
CITY
WID
E HE
ALT
H,
SAFE
TY, A
ND
W
ELFA
RE
1, 2
PU
BLIC
SER
VIC
ES
BUD
GET
N
EAR-
TERM
PU
BLIC
SER
VIC
ES
DEP
ART
MEN
T
ON
GO
ING
. PA
VEM
ENT
MA
NA
GEM
ENT
SYST
EM
INST
ITUTE
D T
O M
ON
ITOR
PRO
GRE
SS A
ND
GIV
E PR
IORI
TY T
O D
AM
AG
ED
ROA
DS
CO
NTIN
UED
19
HIG
H
ALL
HA
ZARD
S
RED
UCE
VUL
NER
ABI
LITY
TO
PO
WER
AN
D
CO
MM
UNIC
ATIO
N
INFR
AST
RUC
TURE
MA
INTA
IN R
OA
DSI
DE
TREE
S TO
FA
CIL
ITATE
QUI
CKE
R RO
AD
WA
Y C
LEA
RIN
G
CITY
WID
E EM
ERG
ENC
Y RE
SPO
NSE
M
EASU
RES
1,2,
4, 5
, 7
CITY
ARB
ORI
ST
BUD
GET
PU
BLIC
/PRI
VA
TE
PART
NER
SHIP
NEA
R-TE
RM
CITY
ARB
ORI
ST
ON
GO
ING
C
ON
TINUE
D
20
MED
IUM
A
LL H
AZA
RDS
MA
INTA
IN D
EBRI
S M
AN
AG
EMEN
T PL
AN
MA
INTA
IN D
EBRI
S M
AN
AG
EMEN
T PL
AN
AN
D
EXER
CIS
E PL
AN
TO
ASS
URE
RESO
URC
ES A
RE IN
PLA
CE
FOR
RAPI
D D
EBRI
S RE
MO
VA
L FR
OM
ESS
ENTIA
L RO
AD
WA
YS
CITY
WID
E EM
ERG
ENC
Y RE
SPO
NSE
M
EASU
RES
1, 2
, 7
PUBL
IC S
ERV
ICES
BU
DG
ET
NEA
R-TE
RM
PUBL
IC S
ERV
ICES
O
NG
OIN
G
CO
NTIN
UED

15
4 M
itiga
tion
Stra
tegy

155 Mitigation Strategy
5.5 Supporting Activities The following table contains actions that were included in the 2008 Plan. While they are important components of the overall mitigation strategy, the actions in this table are now viewed as supporting activities.
Table 5-5. Supporting Activities – 2008 Hazard Mitigation Plan
EXIST. PROGRAM DESCRIPTION COVERAGE ENFORCEMENT EFFECTIVENESS IMPROVEMENTS
DRAIN MAINTENANCE
REPAIR & CLEAN PIPES &
STRUCTURES CITY WIDE UTILITIES DEPT. REFER TO DPS DIR. MORE BONDS &
PERSONNEL
DRAINAGE INVENTORY
HARD COPY MAPS WITH PROJECT LIST CITY WIDE UTILITIES DEPT. MODERATE NONE
ROAD INVENTORY LIST OF ROAD LENGTHS AND CONDITION
CITY WIDE DPS ENG. DIVISION MODERATE
MAINTAIN CURRENT LIST
USING PAVEMENT MANAGEMENT
PROGRAM
ROAD RECONSTRUCTION
ANNUAL PAVING PROGRAM THRU
BIDDER CITY WIDE DPS VERY EFFECTIVE INCREASE PAVING
BUDGET
SIGNAGE INVENTORY
LIST OF TRAFFIC REGULATIONS @
DPW CITY WIDE DPS TRAFFIC
DIVISION MODERATE NONE.
SLOPE PROTECTION
SOIL EROSION AND SEDIMENT
CONTROL PERMITS CITY WIDE BUILDING DEPT. MODERATE NONE
SNOW PLOWING PLOWING CITY
STREETS DURING SNOW STORM
CITY WIDE DPS STREETS AND SIDEWALKS EFFECTIVE NONE
STORM WATER DESIGN AND
INSTALL DRAINAGE SYSTEMS
CITY WIDE UTILITIES EFFECTIVE MORE FED/STATE GRANTS
VEHICLE MAINTENANCE
MAINTAIN MUNICIPAL
VEHICLES; STAFF CALL LIST
CITY WIDE DPS EQUIPMENT OPERATIONS VERY EFFECTIVE NONE
SOIL AND SLOPE PROTECTION REGS
REMOVAL OF SOIL OR CHANGING
CONTOUR CITY WIDE DPS AND BLDG.
DEPT HIGH NONE
BUILDING CODE FOR MULTI-FAMILY,
COMMERCIAL AND INDUSTRIAL
BUILDINGS
FOLLOW RISBC 1 2007 CITY WIDE
BLDG. DEPT INSPECTION
DIVISION HIGH NONE
RESIDENTIAL 1 & 2 FAMILY CODE
FOLLOW RISBC 2 2006 CITY WIDE
BLDG. DEPT INSPECTION
DIVISION HIGH NONE

156 Mitigation Strategy
Table 5-5. Supporting Activities (continued)
EXIST. PROGRAM DESCRIPTION COVERAGE ENFORCEMENT EFFECTIVENESS IMPROVEMENTS
ZONING ORDINANCE MAX. BUILDING HEIGHT
MAX 45 FT. HEIGHT FOR STRUCTURES CITY WIDE ZONING HIGH NONE
MIN. HOUSING CODE
PROPTERY MAINTENANCE
FOLLOW RHODE ISLAND GENERAL
HOUSING AND OCCUPANCY
CODE
CITY WIDE
BLDG. DEPT MINIMUM HOUSING
INSPECTOR
HIGH NONE
EVACUATION ROUTES
MAINTAIN EXISTING
EVACUATION ROUTES
CITY WIDE DPS STREETS AND SIDEWALKS HIGH NONE
EVACUATION ROAD
RECONSTRUCTION
MAINTAIN CRITICAL ROADS
USED DURING EVACUATION TO
ENSURE READINESS
CITY WIDE DPS STREETS AND SIDEWALKS HIGH NONE
INVENTORY OF ROADSIDE TREES
MAINTAIN INVENTORY OF
ROADSIDE TREES TO FACILITATE
QUICKER ROADWAY CLEARING
CITY WIDE DPS & RIDOT HIGH NONE
DEBRIS MANAGEMENT
PLAN
MAINTAIN DEBRIS MANAGEMENT
PLAN CITY WIDE
DPS & RIDOT STREETS AND SIDEWALKS
HIGH
DEVELOP A DEBRIT MANAGEMENT
STRATEGY AT THE REGIONAL LEVEL.
CREATE A CENTRALIZED LARGE SCALE
DEBRIT MANAGEMENT SITE

157 Moving Towards a Safe, Resilient, and Sustainable Rhode Island Community
6.0 Moving Towards a Safe, Resilient, and Sustainable Rhode Island
Community
6.1 Evaluation: Progress & Challenges Disaster resilient communities employ a long-range community-based approach to mitigation. Mitigation enables communities to proactively address potential damage that could occur from hurricanes, coastal erosion, earthquakes, flooding and other natural hazards. When hazard mitigation is combined with the standards of creating sustainable communities, the long-term beneficial result is smarter and safer development that reduces the vulnerability of populations to natural disasters while reducing poverty, providing jobs, promoting economic activity, and most importantly, improving people’s living conditions (Munasinghe and Clarke 1995). In addition to a community’s sustainability criteria for social, environmental and economic protection, there is also the criterion that development must be disaster resistant (FEMA 1997; Institute for Business and Home Safety 1997). Resilient communities may bend before the impact of disaster events, but they do not break. They are constructed so that their lifeline systems of roads, utilities, infrastructure, and other support facilities are designed to continue operating in the midst of high winds, rising water, and shaking ground. Hospitals, schools, neighborhoods, businesses, and public safety centers are located in safe areas, rather than areas prone to high hazards. Resilient and sustainable communities’ structures are built or retrofitted to meet the safest building code standards available. It also means that their natural environmental habitats such as wetlands and dunes are conserved to protect the natural benefits of hazard mitigation that they provide. The Newport Hazard Mitigation Strategy embraces the concepts of disaster resilient and sustainable communities. Newport is committed to building a disaster resistant community and achieving sustainable development through the commitment of state and local government and its policymakers to mitigate hazard impacts before disaster strikes. Additionally, Newport will achieve a disaster resilient, and therefore, safer community, through the process of completing its Hazard Risk and Vulnerability Assessment (RVA), and Multi-Hazard Mitigation Strategy (HMS) and through the implementation of mitigation programs and policies. The city will have

158 Moving Towards a Safe, Resilient, and Sustainable Rhode Island Community
the capability to implement and institutionalize hazard mitigation through its human, legal and fiscal resources, the effectiveness of intergovernmental coordination and communication, and with the knowledge and tools at hand to analyze and cope with hazard risks and the outcomes of mitigation planning.
159 References
References
Blaine, Stephanie. Rhode Island’s Greatest Natural Tragedy. 2009. Pell Scholars and Senior Theses. Paper 41.< http://digitalcommons.salve.edu/pell_theses/41/>. Boston.com July 2, 2012. Police: three kids indirectly hit by lightning in RI. <http://www.boston.com/yourtown/boston/fenway_kenmore/articles/2012/07/02/police_3_kids_indirectly_hit_by_lightning_in_ri/>. Cicilline, David. February 24, 2014. Delegation announces $1 million to reimburse RI for snow removal costs. Press Release from Congressman David Cicilline. <http://cicilline.house.gov/press-release/delegation-announces-1-million-reimburse-ri-snow-removal-costs.
Community Facts 2010. U.S. Census Bureau, U.S. Department of Commerce. <http://factfinder2.census.gov/> Del Santo, T.J. A Look Back at the 1986 Cranston/Providence Tornado. May 21, 2014. WPRI Eyewitness News. < http://blogs.wpri.com/2013/05/21/a-look-back-at-the-1986-cranstonprovidence-tornado/>. Del Santo, T.J. Hurricane Bob 22nd Anniversary. August 19, 2013. WPRI Eyewitness News. <http://blogs.wpri.com/2013/08/19/hurricane-bob-22nd-anniversary/>. Floodplain Management in Rhode Island: Quick Guide. Rhode Island Emergency Management Agency, Rhode Island National Flood Insurance Program. 2007. Flynn, Sean. The Damage is done: Repairs to the Cliff Walk will cost the city about $2 million. Newport Daily News. <http://www.newportri.com/features/the-damage-is-done/article_7a245871-18ef-56d9-89a3-2bcb4362e17d.html>. National Oceanic and Atmospheric Administration, Enhanced F Scale for Tornado Damage. 2007.< http://www.spc.noaa.gov/faq/tornado/ef-scale.html >. National Oceanic and Atmospheric Administration, Hurricane Research Division. Frequently Asked Questions: How many direct hits by hurricanes have affected each state? May 2013. <http://www.aoml.noaa.gov/hrd/tcfaq/E19.html>. National Oceanic and Atmospheric Administration, National Lightning Safety Institute. 2004. Lightning, Fatalities, Injuries, and Damage Reports in the United States. < http://www.lightningsafety.com/nlsi_lls/fatalities_us.html>.

160 References
National Oceanic and Atmospheric Administration, National Weather Service. Massachusetts Tornado Outbreak 2011. <http://www.erh.noaa.gov/box/sigevents/jun01_2011_summary.php>. National Oceanic and Atmospheric Administration, A Preparedness Guide for Thunderstorms, Tornadoes, and Lightning. <http://www.nws.noaa.gov/om/severeweather/resources/ttl6-10.pdf>. National Oceanic and Atmospheric Administration, Severe Plot. Historical Severe Weather Report Analysis Program. <http://www.spc.noaa.gov/software/svrplot2/>. Newport Comprehensive Land Use Plan. 2004. Newport City Council, City of Newport. <http://www.cityofnewport.com/departments/planning-development/comprehensive-land-use-plan>. Accessed June 17, 2014 Newport Hospital Facts and Statistics for Fiscal Year 2012. Newport Hospital. < http://www.newporthospital.org/about/newport-hospital-statistics.html>. Providence Journal. September 2, 2013. Lightning strikes Tower Hill Fire Station. <http://www.providencejournal.com/breaking-news/content/20130903-thunderstorms-in-r.i.-prompt-power-outages-lightning-strike.ece>. Rapoza, Kenneth. February 9, 2013. Massachusetts, Rhode Island Grounded from Blizzard ‘Nemo’. Forbes News. <http://www.forbes.com/sites/kenrapoza/2013/02/09/massachusetts-rhode-island-grounded-from-blizzard-nemo/>. Rhode Island City and Town Resident Population from Census 2010. Census Statistics. Rhode Island Department of Labor and Training. < http://www.dlt.ri.gov/lmi/census/pop/townpop.htm>. Rhode Island Hurricane Evacuation Study, Hurricane Evacuation Mapping. Rhode Island Emergency Management Agency. June 2013. <http://www.riema.ri.gov/preparedness/evacuation/hurricane_evac.php#EvacMaps>. Rhode Island State Hazard Mitigation Plan 2014 Update. Rhode Island Emergency Management Agency. April 2014. Spotts. Pete. June 2, 2011. Massachusetts tornado: What are deadly tornadoes doing way up in New England? The Christian Science Monitor. <http://www.csmonitor.com/USA/2011/0602/Massachusetts-tornado-What-are-deadly-tornadoes-doing-way-up-in-New-England>.

161 References
State of Rhode Island Action Plan: Hurricane Sandy Disaster. March 2014. Rhode Island Department of Administration, Division of Planning. Strauss, Neal. 2008. The great northeast blizzard of 1978 remembered 30 years later in southern New England. National Oceanic and Atmospheric Administration. <http://www.erh.noaa.gov/box/papers/blizzard78/mainblizzardof78.htm>. Tennessee Emergency Management Agency. Tornadoes. <http://www.tnema.org/public/tornado.html>. Turner, Greg. June 11, 2011. Governor Deval Patrick requests federal disaster aid for tornadoes. The Boston Herald. <http://bostonherald.com/news_opinion/local_coverage/2011/06/gov_deval_patrick_requests_federal_disaster_aid_tornadoes>. Valle, David R. and Dion, Michael R. 1998. Hurricane Bob from Southern New England Tropical Storms and Hurricanes, A Ninety-Eight Year Summary (1909-1997). National Weather Service, Taunton, MA. <http://www.erh.noaa.gov/box/hurricane/hurricaneBob.shtml >. Weisman, Janine. January 25, 2012. The Storm Governor. Newport Daily News. <http://www.newportri.com/features/personalities/the-storm-governor/article_86f22e9a-4775-11e1-9f1a-001871e3ce6c.html>. Wind Zones in the United States. Federal Emergency Management Agency. 2012. <http://www.fema.gov/safe-rooms/wind-zones-united-states>. Yee, Vivian. June 18, 2011. Insurance claims for tornadoes hit $140 million. Boston.com. <http://www.boston.com/news/local/massachusetts/articles/2011/06/18/insurance_claims_for_tornadoes_hit_140m/>. FEMA-How to deal with specific hazards http://www.ready.gov/natural-disasters “Local Mitigation Planning Handbook”, Federal Emergency Management Agency, March 2013. “State and Local Plan Interim Criteria under the Disaster Mitigation Act of 2000”, Federal Emergency Management Agency, March 26, 2002. “Mitigation Ideas, A Resource for Reducing Risk to Natural Hazards”, FEMA, January 2013. The Natural Hazards Center at www.colorado.edu/hazards Association of State Floodplain Managers

162 References
www.floods.org. National Climatic Data Center. http://lwf.ncdc.noaa.gov/oa/ncdc.html National Oceanic and Atmospheric Administration. http://noaa.gov American Red Cross Disaster Services Regulations and Procedures, Mass Care Preparedness and Operations, ARC 3031 Rhode Island Hurricanes and Tropical Storms: A Fifty-Six Year Summary 1936 to 1991. David R. Vallee 1997. National Weather Service Office. Providence, Rhode Island. Disaster Prevention for Sustainable Development: Economic and Policy Issues. Munasinghe, Mohan, & Clarke, Caroline 1995. Floodsmart http://www.floodsmart.gov/floodsmart/ National Flood Insurance Program (NFIP) http://www.fema.gov/nfip Reducing Damage from Localized Flooding: A Guide for Communities, FEMA http://www.fema.gov/library/viewRecord.do?id=1448 Adapting to Climate Change in the Ocean State: A Starting Point. Rhode Island Climate Change Commission. November 2012. The Year That Shook the Rich: A review of Natural Disasters in 2011. The Brookings Institution – London School of Economics. March 2012. Human Links to Coastal Disasters. The Heinz Center for Science, Economics and the Environment. 2002. http://www.newportriweather.com/mwd/hurricanes/hurricanes.htm NOAA Coastal Services Center http://www.csc.noaa.gov/FEMA Coastal Barrier Resource System: Rhode Island http://www.fema.gov/national-flood-insurance-program/coastal-barrier-resource-system-rhode-island National Hurricane Center

163 References
http://www.nhc.noaa.gov/ Rhode Island State Hazard Mitigation Plan http://www.riema.ri.gov/preparedness/preparenow/prepare_docs/RI_State_HM_Plan%20Final.pdf RIEMA Flood Prevention Risk Map http://www.riema.ri.gov/prevention/floods/RiskMAP.php National Weather Service http://www.nws.noaa.gov/os/assessments/index.shtml Hurricane Sandy Event Recap Report http://thoughtleadership.aonbenfield.com/Documents/20130514_if_hurricane_sandy_event_recap.pdf

164 References

Appendix A – Assessing Risk – Maps
��
Appendix A: Assessing Risk – Maps
Map 1 – Critical Facilities in Newport This map depicts the critical facilities in the City of Newport. Map 2 – Surge Risks in Newport This map depicts the inundation areas within the City of Newport. Map 3 – Flood Risks in Newport This map depicts the 100 year floodplain within the City of Newport. Map 4 – Urban Fire Risks in Newport This map depicts the areas in the City of Newport that are at risk of an urban fire conflagration. Map 5 – Past Hurricane Strikes in and around Newport This map depicts past hurricane strikes in and around Newport. Map 6 – Evacuation Routes in Newport This map depicts the evacuation routes in the City of Newport.

Appendix A – Assessing Risk – Maps
Map 1 – Critical Facilities

Appendix A – Assessing Risk – Maps
Map 2 – Inundation Area in Newport from Storm Surge

Appendix A – Assessing Risk – Maps
Map 3 – Flood Risks in Newport

Appendix A – Assessing Risk – Maps
Map 4 – Urban Fire Risks in Newport

Appendix A – Assessing Risk – Maps
Map 5 – Past Hurricane Strikes in and around Newport

Appendix A – Assessing Risk – Maps
Map 6 – Evacuation Routes

Appendix A – Assessing Risk – Maps

Appendix B – Building Support Planning Process Additional Documentation
��
Appendix B: Building Support: Planning Process Additional
Documentation

Appendix B – Building Support Planning Process Additional Documentation
Outreach Strategy & Materials Activity Date Public Outreach
Newport Hazard Mitigation Committee Meeting
Aug. 22, 2013, Newport City Hall, Council Chambers from 3:00 – 5:00 PM.
Posted on City Facebook Page, Newport Police Department and Newport Fire Department Facebook page on 8/16 with a reminder on 8/20. Posted on the Newport Planning Department webpage on 8-16-13 and the city’s agenda calendar. Also posted in city hall and on the library posting board. This meeting was open to the public. There was also a 30 minute power point presentation given by city planner.
Engage Newport Sea Aware event Thursday October 24, 2013 from 5:30pm-6:30pm at the Visitor's Center
Representatives from the following organizations were present and they presented/had information available on the topic of Sea Level Rise and the effects on Newport.
- City of Newport Planning Department
- Coastal Resource Center (CRC)/URI Sea Grant
- RI Department of Environmental Management
- Save the Bay - Coastal Resources Management
Council (CRMC) - RI Emergency Management
Agency (RIEMA) Melissa Barker (GIS) and Melissa Stolhammer(planning) represented the Planning Department and presented information about the HMP
Newport Hazard Mitigation Committee Meeting
June 25th, 2014 from 9-12, Newport City Hall, Council Chambers
Staff conducted a doodle poll from 6-6-14 to 6-10-14 to determine the best possible date. This meeting was closed to the public and for committee members only.
Solicitation for HMP comments posted on the city’s Engage Newport and City Facebook pages (i.e. Social Media Outreach)
HMP Public Outreach (Business Community)
June 30th 2014 from 5:00-8:00PM, Newport Yacht Club
Flyers posted in City Hall and in the Public Library posting board. Sam Crichton sent out a “save the date” posting to all local Newport media outlets (see attachment). Jody Sullivan sent out the flyer to all business community contacts affiliated with the Chamber of Commerce. Alliance for Livable Newport was contacted and asked to distribute the flyers and information to their contacts. Public Outreach events were advertised on the city’s webpage, Facebook page, planning department webpage, and on the city’s agenda calendar.
Newport Daily News Article 7-1-14 Informed the public about HMP and advertised the next meeting on 7-1-14.

Appendix B – Building Support Planning Process Additional Documentation
HMP Public Outreach (General Public) July 1st 2014 from 5:00-7:45 PM, Newport Public Library
Flyers posted in City Hall and in the Public Library posting board. Sam Crichton sent out a “save the date” posting to all local Newport media outlets (see attachment). Jody Sullivan sent out the flyer to all business community contacts affiliated with the Chamber of Commerce. Alliance for Livable Newport was contacted and asked to distribute the flyers and information to their contacts. Public Outreach events were advertised on the city’s webpage, Facebook page, planning department webpage, and on the city’s agenda calendar

Appendix B – Building Support Planning Process Additional Documentation
Meeting Summaries, Notes, Sign-In Sheets Newport Public Meeting for Public Input Regarding the development of the updated Newport Natural Hazard Mitigation Plan @ Newport Public Library on Tuesday, July 1st 2014
1.) Communications are a major concern in the event of a storm. If the power/cell towers go out, how will people communicate? Suggestions include a backup form of communications as well as a local neighborhood communications plan (e.g. condos should have an emergency communication plan; check on your neighbors).
2.) Ensure that the Mayor of Newport is engaged in the natural hazard mitigation process. There is concern that he is not involved in this process.
3.) Public outreach and education about what to do in the event of a natural hazard emergency; specific concerns include:
a. The public is resistant to evacuating to emergency evacuation shelters; is there something that can be done to make people go to these shelters before it is too late/in the middle of weather event?
b. The above ties in to better evacuation outreach 4.) There is concern about the viability of public emergency shelters. One of the emergency shelters is
the fire department headquarters and it is in a flood zone. There should be more shelters in better locations.
5.) Overhead power lines are an issue because they can be toppled by falling trees in storms. Underground power lines were suggested as an alternative, but someone raised the point that coastal flooding can pose a similar issue to underground power lines.
6.) Are zoning requirements followed? Sal’s restaurant (now closed) was given as an example of a building that was not built to code, and another restaurant was built in its place – still in a flood zone.
7.) Portsmouth is un‐sewered and flooding there causes a water quality issues because septic tanks and cesspools flood and get into the Bay.
8.) Repetitive loss properties that are in the flood zone: how will these be addressed in the plan? 9.) Improve other aspects of Newport communications. Make better use of the Code Red System. One
member of the public gave an example of its poor use. An elderly woman with dementia had wandered from her home. The Code Red system was not used to notify local residents that she was missing and the woman was found 1 day later deceased.
10.) Suggest/Require that Newport residents make themselves emergency supply kits with non‐perishable food items.
11.) Create a city‐sponsored neighborhood meet‐and‐greet. This Newport resident stressed that the people you need to communicate with and account for in the event of an emergency are your neighbors. A meet‐and‐greet would be a good way for people to get to know each other before a disaster occurs.
12.) Create a plan to save cultural and historic resources/ landscapes. 13.) Ensure the safety and preservation of city hall records (this falls under the same category as historic
resources). There should be backup copies of city hall records.

Appendix B – Building Support Planning Process Additional Documentation
14.) Coordinate with the City historic planner to map out historic resources. Hawaii has an excellent map model that should be replicated by Newport.
15.) Another local resident raised concerns about the vulnerability of the fire department headquarters. 16.) Newport has a relatively large population of low‐income residents. As these residents largely live
pay check‐to‐pay check, it will be difficult for them to create an emergency supply kit because of their limited resources. How will the City of Newport address this issue?
17.) Public transit is limited in Newport and a large percentage of residents do not have cars. How will public evacuations be facilitated?
18.) What is the plan for sheltering of animals? This concern includes pets as well as livestock (especially heritage breeds).
19.) Will the plan anticipate effects from very large storms (e.g. Category 3 hurricanes?) 20.) There is concern about the Newport Private Airport; but this should have a mitigation plan of its
own, similar to that of Quonset Point Air Base. 21.) What can be done to mitigate the corrosive effects of salt water? 22.) What are the risks of washouts at culverts? 23.) Sinkholes seem to be more common these days, what can be done to prevent them? 24.) How does the city prioritize response and recovery efforts? How are decisions made? 25.) Hotels may be needed for temporary shelters following a storm. It is important to find out the
current occupancy prior to a storm. 26.) Eliminate redundancies of other hazard mitigation plans by incorporating stakeholders from
important sectors (e.g. National Grid). 27.) It is important to take an inventory of pilot‐light appliances in the event of a gas outage. 28.) Permitting processes should be streamlined post‐disaster to help quicken the recovery efforts. 29.) City records are critical to Newport moving forward post‐disaster, it is imperative to protect these
records. 30.) What happens to the historic, low‐lying areas that are sure to be flooded? 31.) Ice storms are perceived as a greater threat than hurricanes; ice storms are more common and
when ice forms on overhead power lines they can take out electricity (e.g. this is a concern for elderly that rely on electricity for medical equipment like oxygen tanks).
32.) Communications in storms is a major issue. Two suggestions for back up communications: a. Ham radio b. Small, battery‐operated two‐way radios. One resident said that he purchased several of
these prior to one of the last storms and distributed them to his neighbors. This way they could communicate amongst each other if they lost power and tell one another if they were in trouble or needed any supplies.
33.) One resident commented that Newport’s 2008 Hazard Mitigation Plan looked like a “FEMA boiler plate” and said that he hopes the new one is better.
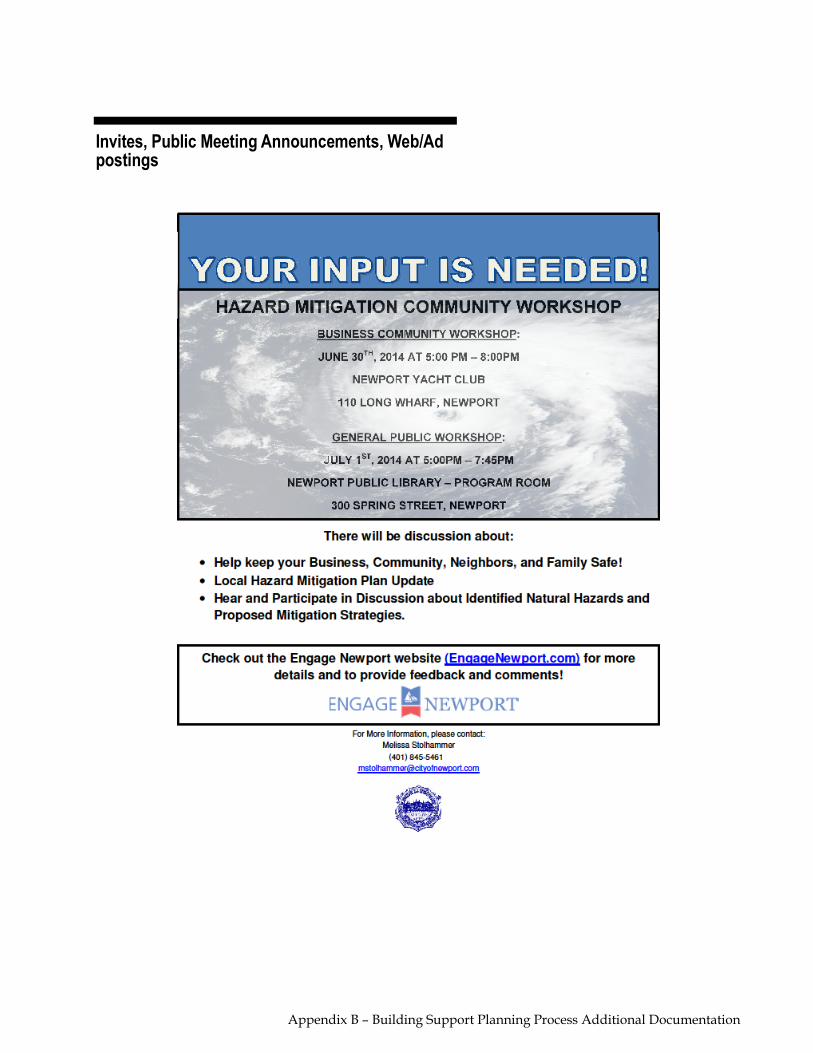
Appendix B – Building Support Planning Process Additional Documentation
Invites, Public Meeting Announcements, Web/Ad postings

Appendix B – Building Support Planning Process Additional Documentation
City of Newport Civic Investment Office
Save the Date
Engage Newport - Hazard Mitigation Plan update community events What: Hazard Mitigation Plan update community events
Why: To inform Newport residents and businesses about the City of Newport
Hazard Mitigation Plan update, its effects on local Newport locations and what the City is doing to assist with information and mitigation for the present and future and assisting with identifying natural hazards. Members of the public are invited to attend either meeting scheduled or both if they have experiences to share with the Hazard Mitigation Committee and lessons learned and strategies implemented.
Who: The City of Newport Hazard Mitigation Plan committee and
representatives from Vanasse Hangen Brustlin, Inc. (VHB), the company hired to assist with the revisions and finalizing the City of Newport's Hazard Mitigation Plan.
When: Monday, June 30, 2014 – 5pm to 8pm - Business Community
Tuesday, July 1, 2014 - 5:45pm to 7:45pm - General Public Where: Monday, June 30, 2014 – 5pm to 8pm at the Newport Yacht Club, 110 Long Wharf, Newport RI 02840
Tuesday, July 1, 2014 - 5:45pm - 7:45pm at the Newport Public Library, Program
Room, 300 Spring St, Newport RI 02840 For more information about this event please contact Melissa Stolhammer - City Planner at the City of Newport Civic Investment Department on ph 401 845 5461 or email [email protected]

Appendix C – Supplemental Information
��
Appendix C: Supplemental Information
This Appendix contains supplemental information to this Hazard Mitigation Plan. The intent of this plan is to provide information about potential disasters, assets and risk, and a means of implementing the actions to help minimize loss to life and property. In addition, the process by which grant and relief money can be obtained and what programs are available to assist the City and its residents are equally important. Process for Disaster Declaration in the City of Newport There are two phases to a disaster - first response and then recovery. The recovery phase, or clean-up efforts, is where the majority of grant funds could be applied for. Having a Hazard Mitigation Plan in place before a disaster occurs, according to the U.S. Disaster Mitigation Act of 2000 and its amendments, is required after November 2004 in order to be eligible to apply for these recovery funds. These grant programs are briefly explained later in this chapter under the Grant Programs for Disaster Relief section. FEMA Information The Federal Emergency Management Agency (FEMA) has extensive resources related to disaster prevention and disaster recovery on its website at www.fema.gov. The following is an excerpt from their online library: The first response to a disaster is the job of local government’s emergency services with help from nearby municipalities, the state and volunteer agencies. In a catastrophic disaster, and if the governor requests, federal resources can be mobilized through the Federal Emergency Management Agency (FEMA) for search and rescue, electrical power, food, water, shelter and other basic human needs. It is the long-term recovery phase of a disaster which places the most severe financial strain on a local or state government. Damage to public facilities and infrastructure, often not insured, can overwhelm even a large city. A governor’s request for a major disaster declaration could mean an infusion of federal funds, but the governor must also commit significant state funds and

Appendix C – Supplemental Information
resources for recovery efforts. A major disaster could result from a hurricane, earthquake, flood, tornado or major fire which the President determines warrants supplemental federal aid. The event must be clearly more than State or local governments could handle alone. If declared, funding comes from the President’s Disaster Relief Fund, which is managed by FEMA, and disaster aid programs of other participating federal agencies. A Presidential Major Disaster Declaration puts into motion long-term federal recovery programs, some of which are matched by state programs, and designed to help disaster victims, businesses and public entities. An Emergency Declaration is more limited in scope and without the long-term federal recovery programs of a Major Disaster Declaration. Generally, federal assistance and funding are provided to meet a specific emergency need or to help prevent a major disaster from occurring. The Major Disaster Process A Major Disaster Declaration usually follows these steps: The local government responds, supplemented by neighboring communities and volunteer agencies. If overwhelmed, turn to the state for assistance; The State responds with state resources, such as the National Guard and state agencies; Damage assessment by local, state, federal, and volunteer organizations determines losses and recovery needs; A Major Disaster Declaration is requested by the governor, based on the damage assessment, and an agreement to commit state funds and resources to the long-term recovery; FEMA evaluates the request and recommends action to the White House based on the disaster, the local community and the state’s ability to recover; The President approves the request or FEMA informs the governor it has been denied. This decision process could take a few hours or several weeks depending on the nature of the disaster.

Appendix C – Supplemental Information
Disaster Aid Programs There are two major categories of disaster aid: Individual Assistance is for damage to residences and businesses or personal property losses, and Public Assistance is for repair of infrastructure, public facilities and debris removal. Individual Assistance Immediately after the declaration, disaster workers arrive and set up a central field office to coordinate the recovery effort. A toll-free telephone number is published for use by affected residents and business owners in registering for assistance. Disaster Recovery Centers are also opened where disaster victims can meet with program representatives and obtain information about available aid and the recovery process Disaster aid to individuals generally falls into the following categories: Disaster Housing may be available for up to 18 months, using local resources, for displaced persons whose residences were heavily damaged or destroyed. Funding also can be provided for housing repairs and replacement of damaged items to make homes habitable. Disaster Grants are available to help meet other serious disaster related needs and necessary expenses not covered by insurance and other aid programs. These may include replacement of personal property, and transportation, medical, dental and funeral expenses. Low-interest Disaster Loans are available after a disaster for homeowners and renters from the U.S. Small Business Administration (SBA) to cover uninsured property losses. Loans may be for repair or replacement homes, automobiles, clothing or other damaged personal property. Loans are also available to businesses for property loss and economic injury. Other Disaster Aid Programs include crisis counseling, disaster-related unemployment assistance, legal aid and assistance with income tax, Social Security and Veteran’s benefits. Other state or local help may also be available. Assistance Process – After the application is taken, the damaged property is inspected to verify the loss. If approved, an applicant will soon receive a check for rental assistance or a grant. Loan applications require more information and approval may take up to several weeks after initial application. The deadline for most individual assistance programs is 60 days following the President’s major disaster declaration. Audits are done later to ensure that aid went only to those who were eligible and that disaster aid funds were used only for their intended purposes. These federal

Appendix C – Supplemental Information
program funds cannot duplicate assistance provided by other sources such as insurance. After a major disaster, FEMA tries to notify all disaster victims about the available aid programs and urge them to apply. The news media are encouraged to visit a Disaster Recovery Center, meet with disaster officials, and help publicize the disaster aid programs and the toll-free telephone registration number. Public Assistance Public Assistance is aid to state or local governments to pay part of the cost of rebuilding a community’s damaged infrastructure. Generally, public assistance programs pay for 75% of the approved project costs. Public assistance may include debris removal, emergency protective measures and public services, repair of damaged public property, loans needed by communities for essential government functions, and grants for public schools.
Hazard Mitigation Disaster victims and public entities are encouraged to avoid the life and property risks of future disasters. Examples include the elevation or relocation of chronically flood damaged homes away from flood hazard areas, retrofitting buildings to make them resistant to earthquakes or strong winds, and adoption and enforcement of adequate codes and standards by local, state and federal government. FEMA encourages and helps fund damage mitigation measures when repairing disaster damaged structures. Grant Programs for Disaster Relief Through the Rhode Island Emergency Management Agency, the Federal Emergency Management Agency provides funds for assistance to municipalities in the event of a disaster. The programs are described briefly here; some of them may not be currently active. Emergency Management Program Grant (EMPG) This proactive funding program requires a 50% match from communities. It supports projects that will improve local emergency management preparedness and response in the following areas: planning, training, drills and exercise, and administration. It is designed to fund projects such as Hazard Mitigation Plans, Emergency Management/Action Plans, and other administrative projects.
Appendix C – Supplemental Information
Mitigation Assistance Program (MAP) This program requires a 25% match (in-kind or cash) and supports planning and implementation activities that reduce long-term hazard vulnerability and risk under the following categories: public awareness and education; mitigation planning and implementation; and preparedness and response planning. Pre-Disaster Mitigation Program (PDM) The Pre-Disaster Mitigation (PDM) program provides technical and financial assistance to States and local governments for cost-effective pre-disaster hazard mitigation activities that complement a comprehensive mitigation program, and reduce injuries, loss of life, and damage and destruction of property. FEMA provides grants to States and Federally recognized Indian tribal governments that, in turn, provide sub-grants to local governments (to include Indian Tribal governments) for mitigation activities such as planning and the implementation of projects identified through the evaluation of natural hazards. Flood Mitigation Assistance Program (FMA) This program requires a 25% match (half in-kind and half local cash) and awards funds for Planning Grants, Technical Assistance Grants, and Project Grants. A Flood Mitigation Plan must be in place before funds can be sought for Technical Assistance or Projects. This program awards funding for Flood Mitigation Plans, structural enhancements, acquisition of buildings or land, and relocation projects. Community Development Block Grant (CDBG) A disaster must be declared to take advantage of this program, which awards emergency funds to cover unmet needs in a community. At least one of three national objectives must be met: the funds must have a direct benefit to low and moderate income persons; or must prevent or eliminate slums and blight in neighborhoods; or must eliminate conditions which threaten the public health and welfare. Hazard Mitigation Grant Program (HMGP) A disaster must be declared to take advantage of this program, which is designed to protect public and private property from future disasters. This program typically awards funding for projects that are structural in nature or for the acquisition of buildings or land.

Appendix C – Supplemental Information
Local Mitigation Plan Review Tool – Final City of Newport, RI A-1
��
Appendix D: Final Local Mitigation Plan Review Tool from
Approved Plan

Local Mitigation Plan Review Tool – Final City of Newport, RI A-2
LOCAL MITIGATION PLAN REVIEW TOOL City of Newport, Rhode Island The Local Mitigation Plan Review Tool demonstrates how the Local Mitigation Plan meets the regulation in 44 CFR §201.6 and offers States and FEMA Mitigation Planners an opportunity to provide feedback to the community. • The Regulation Checklist provides a summary of FEMA’s evaluation of whether the Plan has
addressed all requirements. • The Plan Assessment identifies the plan’s strengths as well as documents areas for future
improvement. • The Multi‐jurisdiction Summary Sheet is an optional worksheet that can be used to
document how each jurisdiction met the requirements of the each Element of the Plan (Planning Process; Hazard Identification and Risk Assessment; Mitigation Strategy; Plan Review, Evaluation, and Implementation; and Plan Adoption).
The FEMA Mitigation Planner must reference this Local Mitigation Plan Review Guide when completing the Local Mitigation Plan Review Tool.
Jurisdiction: City of Newport, Rhode Island
Title of Plan: Natural Hazard Mitigation Plan 2016 Update, City of Newport Rhode Island
Date of Plan: October 2016
Single or Multi‐jurisdiction plan? SINGLE New Plan or Plan Update? UPDATE Local Point of Contact: Christine O’Grady, City Planner 43 Broadway Newport, RI 02840 401‐845‐5472 [email protected] Guy Weston [email protected]
Local CEO: Jeanne‐Marie Napolitano Mayor, City of Newport 43 Broadway Newport, RI 02840 401‐845‐5437 [email protected]
State Reviewer: Jessica Stimson, CFM
Title: State Hazard Mitigation Officer
Date:7/21/2016, 9/22/16 & 12/12/2016
FEMA Reviewer: Shannon Burke David Mendelsohn Nan Johnson Barbara Ellis Brigitte Ndikum‐Nyada
Title: CERC RI HM Specialist Region I Community Planner HM Community Planner, RSV Community Planner
Date:1/12/2016 2/11/16, 2/16/16 2/12/16, 3/18/16, 9/9/16, 9/22/16, 10/25/16 8/20/2016, 10/24/2016 1/5/2017
Date Received in FEMA Region I 12/23/2015, Resubmitted 7/21/2016 & 10/17/2016 & 12/12/2016Plan Not Approved Returned for Required Revisions 3/21/2016, 9/12/2016 (revised per response and
call with the State 9/22/16) Plan Approvable Pending Adoption YES – 10/25/16Plan Adopted by Jurisdiction 11/09/2016Plan Approved 01/05/2017

Local Mitigation Plan Review Tool – Final City of Newport, RI A-3
SECTION 1: REGULATION CHECKLIST
INSTRUCTIONS: The Regulation Checklist must be completed by FEMA. The purpose of the Checklist is to identify the location of relevant or applicable content in the Plan by Element/sub‐element and to determine if each requirement has been ‘Met’ or ‘Not Met.’ The ‘Required Revisions’ summary at the bottom of each Element must be completed by FEMA to provide a clear explanation of the revisions that are required for plan approval. Required revisions must be explained for each plan sub‐element that is ‘Not Met.’ Sub‐elements should be referenced in each summary by using the appropriate numbers (A1, B3, etc.), where applicable. Requirements for each Element and sub‐element are described in detail in this Plan Review Guide in Section 4, Regulation Checklist.
1. REGULATION CHECKLIST Location in Plan (section and/or page number) Met
Not Met Regulation (44 CFR 201.6 Local Mitigation Plans)
ELEMENT A. PLANNING PROCESS
A1. Does the Plan document the planning process, including how it was prepared and who was involved in the process for each jurisdiction? (Requirement §201.6(c)(1))
Section 2.0, p. 15‐25; Throughout the plan; Appendix B
X
A2. Does the Plan document an opportunity for neighboring communities, local and regional agencies involved in hazard mitigation activities, agencies that have the authority to regulate development as well as other interests to be involved in the planning process? (Requirement §201.6(b)(2))
Section 2, pp.15‐25; Section 5.3, p. 123, Appendix B
X
A3. Does the Plan document how the public was involved in the planning process during the drafting stage? (Requirement §201.6(b)(1))
Section 2.0, p. 15‐25; Appendix B X
A4. Does the Plan describe the review and incorporation of existing plans, studies, reports, and technical information? (Requirement §201.6(b)(3))
Section 2.4, pp. 18‐20; Section 4; References, pp. 135‐140; Appendices
X
A5. Is there discussion of how the community(ies) will continue public participation in the plan maintenance process? (Requirement §201.6(c)(4)(iii))
Section 2.5, pp. 20‐24 X
A6. Is there a description of the method and schedule for keeping the plan current (monitoring, evaluating and updating the mitigation plan within a 5‐year cycle)? (Requirement §201.6(c)(4)(i))
Section 2.5, pp. 20‐21; Section 2.5, pp. 22‐24 X
ELEMENT A: REQUIRED REVISIONS
ELEMENT B. HAZARD IDENTIFICATION AND RISK ASSESSMENT

Local Mitigation Plan Review Tool – Final City of Newport, RI A-4
1. REGULATION CHECKLIST Location in Plan (section and/or page number) Met
Not Met Regulation (44 CFR 201.6 Local Mitigation Plans)
B1. Does the Plan include a description of the type, location, and extent of all natural hazards that can affect each jurisdiction(s)? (Requirement §201.6(c)(2)(i))
Sect. 3.0, p. 27‐99; Sect. 4 (Dam Safety) pp 57‐58; Wildfire p 60; App. A, some maps not readable
X
B2. Does the Plan include information on previous occurrences of hazard events and on the probability of future hazard events for each jurisdiction? (Requirement §201.6(c)(2)(i))
Sect. 3.2, pp. 27‐29, pp. 34‐35, p. 38, pp. 41‐42, p. 45, p. 49, p. 53, p. 55, p. 58, p. 61, p. 66, p. 67, App. A, Map 5 ‐ not readable
X
B3. Is there a description of each identified hazard’s impact on the community as well as an overall summary of the community’s vulnerability for each jurisdiction? (Requirement §201.6(c)(2)(ii))
Sect. 3, pp 27 ‐ 72 Sect. 3.3, pp. 73‐98; Sect. 4, pp. 100‐117; App. A maps
X
B4. Does the Plan address NFIP insured structures within the jurisdiction that have been repetitively damaged by floods? (Requirement §201.6(c)(2)(ii))
Sect. 3.3, Pp 75‐76 Sect. 3.4, pp. 90
X
ELEMENT B: REQUIRED REVISIONS
ELEMENT C. MITIGATION STRATEGY
C1. Does the plan document each jurisdiction’s existing authorities, policies, programs and resources and its ability to expand on and improve these existing policies and programs? (Requirement §201.6(c)(3))
Section 4, pp. 99‐116; Table 5‐4, pp. 135; Appendix C
X
C2. Does the Plan address each jurisdiction’s participation in the NFIP and continued compliance with NFIP requirements, as appropriate? (Requirement §201.6(c)(3)(ii))
Section 4.2, pp. 99; Section 4.2.2, pp. 114
X
C3. Does the Plan include goals to reduce/avoid long‐term vulnerabilities to the identified hazards? (Requirement §201.6(c)(3)(i))
Executive Summary, p. 4; Section 2.4, p. 18; Section 5.1, pp. 117
X
C4. Does the Plan identify and analyze a comprehensive range of specific mitigation actions and projects for each jurisdiction being considered to reduce the effects of hazards, with emphasis on new and existing buildings and infrastructure? (Requirement §201.6(c)(3)(ii))
Section 5.0, pp. 118‐139 X
C5. Does the Plan contain an action plan that describes how the actions identified will be prioritized (including cost benefit review), implemented, and administered by each jurisdiction? (Requirement §201.6(c)(3)(iv)); (Requirement §201.6(c)(3)(iii))
Section 5.2, pp. 118 X
C6. Does the Plan describe a process by which local governments will integrate the requirements of the mitigation plan into other planning mechanisms, such as comprehensive or capital improvement plans, when appropriate? (Requirement §201.6(c)(4)(ii))
Section 2.5, p.20; Section 4.3, p. 116; Section 5.2, p. 118
X

Local Mitigation Plan Review Tool – Final City of Newport, RI A-5
1. REGULATION CHECKLIST Location in Plan (section and/or page number) Met
Not Met Regulation (44 CFR 201.6 Local Mitigation Plans)
ELEMENT C: REQUIRED REVISIONS
ELEMENT D. PLAN REVIEW, EVALUATION, AND IMPLEMENTATION (applicable to plan updates only)
D1. Was the plan revised to reflect changes in development? (Requirement §201.6(d)(3))
Section 1.2, p.9 X
D2. Was the plan revised to reflect progress in local mitigation efforts? (Requirement §201.6(d)(3))
Section 2.5, pp. 23‐24; Section 5.2, pp. 118‐119, 121; Section 5.4, Table 5.1, p 122‐123
X
D3. Was the plan revised to reflect changes in priorities? (Requirement §201.6(d)(3))
Section 5.2.3, p.124 X
ELEMENT D: REQUIRED REVISIONS
ELEMENT E. PLAN ADOPTION
E1. Does the Plan include documentation that the plan has been formally adopted by the governing body of the jurisdiction requesting approval? (Requirement §201.6(c)(5))
Plan adopted by the community on 11/9/2016. Signed Adoption Certificate is on file
X
E2. For multi‐jurisdictional plans, has each jurisdiction requesting approval of the plan documented formal plan adoption? (Requirement §201.6(c)(5))
This is a single jurisdiction plan.
n/a
ELEMENT E: REQUIRED REVISIONS
ELEMENT F. ADDITIONAL STATE REQUIREMENTS (OPTIONAL FOR STATE REVIEWERS ONLY; NOT TO BE COMPLETED BY FEMA) F1.
F2.
ELEMENT F: REQUIRED REVISIONS

Appendix D – Final Local Mitigation Plan Review Tool from Approved Plan
SECTION 2: PLAN ASSESSMENT A. Plan Strengths and Opportunities for Improvement This section provides a discussion of the strengths of the plan document and identifies areas where these could be improved beyond minimum requirements. Element A: Planning Process Plan Strengths x The planning process is explained well in the plan. Good organization of the plan. An Executive
Summary is provided at the start of the plan. x The plan appears to have included a variety of departments and individuals from the city, strengthening
interagency coordination for future efforts. x The plan describes the coordination with the adjacent towns of Middletown, Portsmouth, and
Jamestown which will strengthen opportunities for future efforts. Opportunities for Improvement x Suggest clearly identifying closer to the start of the plan (possibly in the Executive Summary and
Purpose) that this is a continuation of the planning process and update of the previously FEMA approved plan (provide the date or year). This was not established until Section 2.3.
x The public outreach appears to be limited to the Mitigation Committee meeting attendance. Expand to other means for public involvement such as those used in updating other local plans and policies. When listing notifications and invitations and postings be clear on the means for the public to provide input. It is equally important to follow this with a discussion on the incorporation of the public’s input and involvement as well as for the stakeholders.
x Pages 93‐94 lists several Boards that serve the community. These can be valuable in bringing different perspectives when identifying risk and the solutions. Continue to seek their involvement in the planning and implementation process.
x For Element A6 ‐‐ More specifically clarify the designated staff and committee responsible for the 5 year plan update like in the sections on monitoring and evaluating the plan (noted on p. 20‐23, 24). If others will be involved in the plan update, identify who these will or may be such as consultants. Include in the update timeframe specifics such as applying for any grants and/or obtaining data and necessary studies.
x Ensure the process and documentation is current up until the plan is submitted/reviewed, adopted and approved.
x Since the 2004 Comprehensive Land Use Plan and the mitigation plan are being updated concurrently, it is recommended that the city use that opportunity to align the mitigation plan with goals and actions with those of the comprehensive plan and other local planning mechanisms. This is also recommended for the continued public involvement opportunities by integrating the planning processes and public outreach efforts (Elements A4, A5, A6, and C6).
x The documentation of the two public workshops indicates that the discussion focused on mostly preparedness and response‐type actions rather than mitigation actions. The plan document also struggles to provide a clear understanding of hazard mitigation. This is due in part to several interchanges between statements made about mitigation and those made about preparedness and response. Also, the plan does not concur with the FEMA definition of hazard mitigation (on pages 3, 4, 7). While preparedness, response, and recovery can be addressed in the plan, it is important that the

Appendix D – Final Local Mitigation Plan Review Tool from Approved Plan
plan distinguishes these differences and maintains a focus on mitigation. Section 6.1 provides a good description of what it means to move towards a safe, resilient, and sustainable community in Rhode Island through hazard mitigation. However, the descriptions in the beginning of the plan, the vulnerability findings, the capabilities, and the resulting Mitigation Strategy confuse this with references to preparedness, response, and recovery or other non‐mitigation references. Refer to the comments below for Element C (Mitigation Strategy).
x Hazard Mitigation are sustained actions that reduce loss of life and property by lessening the impacts of natural hazards (the vulnerabilities) or even avoiding them for the long term. These are often addressed through the location, the design, and the construction of a community. When people and their built environment come between these natural processes/hazards these can lead to impacts and even disasters. Preparedness is a continuous cycle of planning, organizing, training, equipping, exercising, evaluating, and taking corrective action to ensure effective coordination during incident response, while response includes activities that address the short‐term, direct effects of an incident, including immediate actions to save lives, protect property, and meet basic human needs. Continue to make improvements to this distinction in the plan.
x Also (page 3), the meaning of “actions that can be implemented over the long term” is different than the meaning of “sustained actions to reduce or eliminate the long‐term risk.” It appears that Action #4 (page 4) “Emergency Response Measures” may be misunderstood as mitigation for example.
x Refer to the FEMA Guidance documents for more explanations and examples. The links to these reference documents are provided in the Resources section (B) below.
x Recommend adding the City of Newport’s Seal to the document. Currently, only the contractor’s logo represents the document on the second cover page.
Element B: Hazard Identification and Risk Assessment Plan Strengths x The Plan presents a thorough work‐up on the risk of flooding. The Plan references the FEMA, Newport
County Flood Study, 2013 and goes beyond, providing an excellent description of the dynamics of flood risk. The Plan demonstrated a detailed understanding of the various types of flooding that may affect the community. (See pp. 46‐51, 95‐96, 107‐108 & Appendix Map 3.)
x The plan assesses most of its hazards. Good hazard descriptions are provided. Very informative (see comments below). Loss estimates are provided for flooding. The historic structures in the flood zone are identified.
Opportunities for Improvement x The risk assessment can be challenging for the reader to follow. The plan includes a list of hazards which
align with Rhode Island Mitigation Plan, but doesn’t consistently align with the hazards profiled in the narrative and maps included in the Risk Assessment. The plan includes a list of hazards profiled on page 26 of the plan; however, that list doesn’t match with other hazards identified and partially profiled in the risk assessment. For example, thunderstorms, hail, and temperature extremes are included in Table 3‐18, but not included in the list. Some hazards that fall under a category such as Wind Related (storm surge, hurricanes, tornadoes, high winds) are not consistent with their profile info with some found to be incomplete. Each profiled hazard must provide the location and extent, previous occurrence and probability, and the impacts and vulnerability information for the City of Newport.
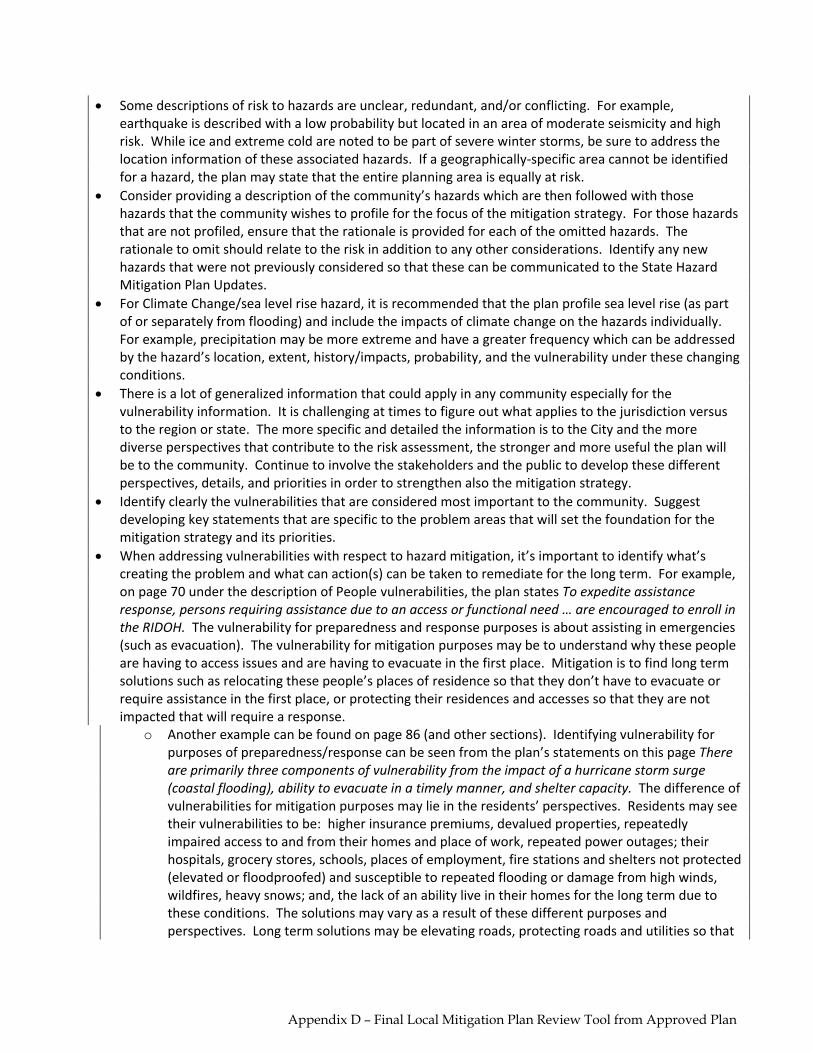
Appendix D – Final Local Mitigation Plan Review Tool from Approved Plan
x Some descriptions of risk to hazards are unclear, redundant, and/or conflicting. For example, earthquake is described with a low probability but located in an area of moderate seismicity and high risk. While ice and extreme cold are noted to be part of severe winter storms, be sure to address the location information of these associated hazards. If a geographically‐specific area cannot be identified for a hazard, the plan may state that the entire planning area is equally at risk.
x Consider providing a description of the community’s hazards which are then followed with those hazards that the community wishes to profile for the focus of the mitigation strategy. For those hazards that are not profiled, ensure that the rationale is provided for each of the omitted hazards. The rationale to omit should relate to the risk in addition to any other considerations. Identify any new hazards that were not previously considered so that these can be communicated to the State Hazard Mitigation Plan Updates.
x For Climate Change/sea level rise hazard, it is recommended that the plan profile sea level rise (as part of or separately from flooding) and include the impacts of climate change on the hazards individually. For example, precipitation may be more extreme and have a greater frequency which can be addressed by the hazard’s location, extent, history/impacts, probability, and the vulnerability under these changing conditions.
x There is a lot of generalized information that could apply in any community especially for the vulnerability information. It is challenging at times to figure out what applies to the jurisdiction versus to the region or state. The more specific and detailed the information is to the City and the more diverse perspectives that contribute to the risk assessment, the stronger and more useful the plan will be to the community. Continue to involve the stakeholders and the public to develop these different perspectives, details, and priorities in order to strengthen also the mitigation strategy.
x Identify clearly the vulnerabilities that are considered most important to the community. Suggest developing key statements that are specific to the problem areas that will set the foundation for the mitigation strategy and its priorities.
x When addressing vulnerabilities with respect to hazard mitigation, it’s important to identify what’s creating the problem and what can action(s) can be taken to remediate for the long term. For example, on page 70 under the description of People vulnerabilities, the plan states To expedite assistance response, persons requiring assistance due to an access or functional need … are encouraged to enroll in the RIDOH. The vulnerability for preparedness and response purposes is about assisting in emergencies (such as evacuation). The vulnerability for mitigation purposes may be to understand why these people are having to access issues and are having to evacuate in the first place. Mitigation is to find long term solutions such as relocating these people’s places of residence so that they don’t have to evacuate or require assistance in the first place, or protecting their residences and accesses so that they are not impacted that will require a response.
o Another example can be found on page 86 (and other sections). Identifying vulnerability for purposes of preparedness/response can be seen from the plan’s statements on this page There are primarily three components of vulnerability from the impact of a hurricane storm surge (coastal flooding), ability to evacuate in a timely manner, and shelter capacity. The difference of vulnerabilities for mitigation purposes may lie in the residents’ perspectives. Residents may see their vulnerabilities to be: higher insurance premiums, devalued properties, repeatedly impaired access to and from their homes and place of work, repeated power outages; their hospitals, grocery stores, schools, places of employment, fire stations and shelters not protected (elevated or floodproofed) and susceptible to repeated flooding or damage from high winds, wildfires, heavy snows; and, the lack of an ability live in their homes for the long term due to these conditions. The solutions may vary as a result of these different purposes and perspectives. Long term solutions may be elevating roads, protecting roads and utilities so that

Appendix D – Final Local Mitigation Plan Review Tool from Approved Plan
they are not repeatedly impacted preventing them from going to their jobs and schools, elevating homes and their electric components, or relocation options. Evacuation is an important vulnerability but for mitigation it may require protecting those roads with better design, reinforcements, better bridges, etc. Continue to develop the identified vulnerabilities for mitigation purposes.
Element C: Mitigation Strategy Plan Strengths x The capabilities of the community are well described. x Table 5‐2, Natural Hazard Mitigation Primary Actions is a good way to present the actions. x Following each disaster event, there is a window of opportunity to take advantage of funding and
technical assistance opportunities to accomplish mitigation activities. It is commendable that the city intends to prepare a Disaster Recovery Plan as well as consider how to streamline permitting post‐disaster; these two activities promote resilience, help the city recover more quickly, and speed up grant funding opportunities. However, little is said in the action description that states how mitigation will be integrated into the Recovery Plan. See the Plan’s Section 6.1 for language that can go into this action’s description if the community is committed to achieving its hazard mitigation goals.
x A good source for pre‐disaster planning for post‐disaster recovery is the American Planning Association’s publication titled Planning for Post‐Disaster Recovery. It includes multiple references to mitigation planning, a discussion of land use and reconstruction standards as well as a discussion of a variety of funding sources available post‐disaster. Page 177 includes a Model Pre‐Event Recovery Ordinance that can be adapted for Newport. This publication is available at no cost through FEMA. The link is provided in the Resources section of this document.
Opportunities for Improvement x The plan generally describes the NFIP program and Newport’s participation, but this could be further
improved with more specifics. Describe in more depth Newport’s floodplain management program (adoption and enforcement of floodplain management requirements), regulating new construction in Special Flood Hazard Areas, floodplain identification and mapping, including any local request for map updates or a description of community assistance and monitoring activities. Include the city’s capability to implement the NFIP/CRS for continued compliance (e.g., staffing and resources, management of the program, enforcement, site visits, education/outreach, etc.). Describe the steps the city has taken so far with its intent to participate in the CRS program noted on page 108.
x For more information about describing continued NFIP compliance, refer to page 4‐4 in FEMA’s Local Mitigation Planning Handbook as well as the NFIP Worksheet located in the appendix, A‐27. The link is provided in the Resources section of this document.
x Ensure that the strategies reflect what’s presented in the vulnerability findings of the risk assessment, especially the summaries that point out the vulnerabilities most important to the community. Ensure that the Plan’s vulnerability and risk assessment findings concur and align with the Plan’s Mitigation Strategy (goals, proposed actions, capabilities). Clearly identify these connections which can be addressed in the Table 5‐2 and/or in the action descriptions prior to the Table. This can also be related to the prioritization methods.
x The mitigation actions included in the plan are interchanged with preparedness and response actions, and other non‐mitigation actions. Then, these are all identified as mitigation. It is important for the community to understand and recognize the differences between hazard mitigation actions (sustained actions that result in long term risk reduction) and non‐mitigation actions (maintenance, repairs, and replacements without improvement to remediate the problem for the long term; preparedness,

Appendix D – Final Local Mitigation Plan Review Tool from Approved Plan
response and recovery). Mitigation should be thought of as actions that are targeting the cause of the vulnerability that’s impacting the community in the first place. Then finding ways to avoid or eliminate these vulnerabilities for the long term. Thus, by doing so the community reduces its need and costs to prepare, respond, and recover from these vulnerabilities to the natural hazards. See the FEMA reference materials listed below in Section B (Resources) for ideas on mitigation actions. Also within these resources, FEMA’s Mitigation Building Science Branch develops guides that focus on creating disaster‐resilient communities to reduce loss of life and property.
x Regarding Required Revisions for Element C4: x Eight of the 16 actions listed are considered non‐mitigation for the reasons noted in the paragraph
above. The remaining actions are for flooding vulnerabilities. The remaining actions could be considered in the overall range of alternatives with more specifics and developing them into long term risk reduction (mitigation) actions. This range will also need to be reexamined after the vulnerabilities of the community have been identified per the Required Revisions for Element C3.
x More specificity on how the City integrates or will integrate the elements of this plan and planning process into its other relevant local planning mechanisms will strengthen Element C6.
x Throughout the document, the plan indicates that as various city plans are updated, the mitigation plan will be incorporated into the other plans. It is recommended that the mitigation committee add these to the list of actions identified in the Mitigation Strategy (pp 126‐135). In addition to identifying a department responsible for carrying out the actions, it puts the city in a position to reach several of the goals identified on page 120 in the Mitigation Strategy.
x Recommended correction: The information provided in the plan on Pages 3‐7 that defines hazard mitigation does not concur with FEMA’s definition of hazard mitigation which is more closely reflected on page 15. FEMA defines hazard mitigation as the following: HAZARD MITIGATION means any sustained action taken to reduce or eliminate the long‐term risk to human life and property from hazards [CFR 201.2].
Element D: Plan Update, Evaluation, and Implementation (Plan Updates Only) Plan Strengths x Overall, the plan does a good job describing changes in development and expectations for growth in the
future as well as some consideration for development in hazard‐prone areas (however see Required Revision D1). The plan includes a general description of land uses and highlights both development trends and regulatory tools that are used to address natural hazard mitigation.
x The City’s Comprehensive Land Use Plan is well integrated into these sections. Opportunities for Improvement x Consider ways to document changes in development in the community’s identified hazard areas over
time. This can be then used to monitor how the community’s risk is being impacted by these changes – identifying whether it is increasing, decreasing, or having no effect on its vulnerability. For example, describe whether the change from year‐round residences to seasonal residences is having an effect on the City’s vulnerability. This could also address changes to the water and waste/septic systems are impacting the vulnerability. New codes and standards may have decreased some vulnerabilities in new (re‐) construction.

Appendix D – Final Local Mitigation Plan Review Tool from Approved Plan
x Clearly identify and document the changes in the actions status and the community’s priorities between the plan updates. Assist the reader to be able to see these changes by documenting the differences between plans.
x Addressing the NFIP continued compliance requirement, the City of Newport is reminded and encourage to revisit all 1142 residential structures in the flood hazard area in the City of Newport )valued at $684,702,372) and strategize how to better mitigate these and other structures in SFHA’s
x Highlight the successes of the community’s progress of long term risk reduction over time (meeting its mitigation goals)! Be sure to include the highlights in the Executive Summary for each update. Suggest addressing whether the benefits that are being achieved are outweighing the costs.
B. Resources for Implementing Your Approved Plan
State Sources of Technical Assistance & Funding: The Rhode Island State Hazard Mitigation Officer (SHMO) and State Mitigation Planner(s) can provide guidance regarding grants, technical assistance, available publications, and training opportunities. Contact the Rhode Island Emergency Management Agency (RIEMA) and the Rhode Island Division of Planning for further assistance. View agency websites for contact information at http://www.riema.ri.gov//planning/hazardmitigation/index.php and http://www.planning.ri.gov/ Refer to the Rhode Island State Hazard Mitigation Plan Update (Section 4.3) which identifies a number of potential funding sources for various mitigation activities at http://www.riema.ri.gov//planning/hazardmitigation/planning/index.php. Communities are encouraged to work with the State to maximize use of every 406 Hazard Mitigation opportunity when available during federally declared disasters. A better alignment and increasing the effectiveness of 406 and 404 Mitigation funds, greatly benefit the community in the long run. Federal and Non‐Profit Sources of Technical Assistance & Funding: Federal Grants Resource Center and Grants.gov Federal agencies may support integrated planning efforts such as rural development, sustainable communities and smart growth, climate change and adaptation, historic preservation, risk analyses, wildfire mitigation, conservation, Federal Highways pilot projects, etc. The Federal Grants Resource Center is located on the website of the national non‐profit Reconnecting America, and provides a compilation of key funding sources for projects in your community. Examples are HUD, DOT/FHWA, EPA, and Sustainable Communities grant programs. For more information visit: http://reconnectingamerica.org/resource‐center/federal‐grant‐opportunities/ or www.grants.gov. GrantWatch.com The website posts current foundation, local, state, and federal grants on one website. When seeking funding opportunities for mitigation, consider a variety of sources for grants, guidance, and partnerships, including academic institutions, non‐profits, community organizations, and businesses, in addition to governmental agencies. Examples are The Partnership for Resilient Communities, the Institute for Sustainable Communities, the Rockefeller Foundation Resilience, The Nature Conservancy, The Kresge Climate‐Resilient Initiative, the Threshold Foundation’s Thriving Resilient Communities funding, the RAND Corporation, and ICLEI Local Governments for Sustainability. http://www.grantwatch.com FEMA Hazard Mitigation Assistance

Appendix D – Final Local Mitigation Plan Review Tool from Approved Plan
FEMA’s Hazard Mitigation Assistance provides funding for projects under the Hazard Mitigation Grant Program (HMGP), Pre‐Disaster Mitigation (PDM), and Flood Mitigation Assistance (FMA). Individuals and businesses are not eligible to apply for HMA funds; however, an eligible applicant or subapplicant may apply on their behalf. http://www.fema.gov/hazard‐mitigation‐assistance Recommended FEMA Publications & Websites: Hazard Mitigation Planning Online Webliography, FEMA Region I This compilation of government and private online sites is a useful source of information for developing and implementing hazard mitigation programs and plans in New England. http://www.fema.gov/about‐region‐i/about‐region‐i/hazard‐mitigation‐planning‐webliography FEMA Library FEMA publications can be downloaded for free from its Library website. This repository contains a wealth of information that can be especially useful in public information and outreach programs. Search by keyword to find documents related to a particular topic. Examples include building and construction techniques, the NFIP, integrating historic preservation and cultural resource protection with mitigation, and helpful fact sheets. http://www.fema.gov/library FEMA RiskMAP Technical assistance is available through RiskMAP to assist communities in identifying, selecting, and implementing activities to support mitigation planning and risk reduction. Attend any RiskMAP discovery meetings that may be scheduled in the state (or neighboring communities with shared watersheds boundaries) in the future. https://www.fema.gov/risk‐mapping‐assessment‐and‐planning‐risk‐map FEMA Climate Change Website Provides resources that address climate change. http://www.fema.gov/climate‐change Other Recommended Publications & Websites: U.S. Climate Resilience Toolkit Scientific tools, information, and expertise are provided to help manage climate‐related risks and improve resilience to extreme events. This aid assists planning through links to a wide‐variety of web‐tools covering topics, including coastal flood risk, ecosystem vulnerability, and water resources. Experts can be located in the NOAA, USDA, and Department of Interior. https://toolkit.climate.gov EPA’s Resilience and Adaptation in New England (RAINE) Climate Change Program A collection of vulnerability, resilience and adaptation reports, plans, and webpages at the state, regional, and community levels. Communities can use the RAINE database to learn from nearby communities about building resiliency and adapting to climate change. http://www.epa.gov/raine USDA Rural Community Development Grant Programs

Appendix D – Final Local Mitigation Plan Review Tool from Approved Plan
USDA operates over fifty financial assistance programs for a variety of rural applications. http://www.rd.usda.gov/programs‐services NOAA Sea Grant Sea Grant’s mission is to provide integrated research, communication, education, extension and legal programs to coastal communities that lead to the responsible use of the nation’s ocean, coastal and Great Lakes resources through informed personal, policy and management decisions. Examples of the resources available help communities plan, adapt, and recovery are the Community Resilience Map of Projects and the National Sea Grant Resilience Toolkit, both located on this website. http://seagrant.noaa.gov USDA, Natural Resources Conservation Service (NRCS) Provides conservation technical assistance, financial assistance, and conservation innovation grants. http://www.nrcs.usda.gov/wps/portal/nrcs/main/national/programs/ The Rockefeller Foundation Resilience Helping cities, organizations, and communities better prepare for, respond to, and transform from disruption. https://www.rockefellerfoundation.org/our‐work/topics/resilience/

Appendix D – Final Local Mitigation Plan Review Tool from Approved Plan

Appendix E – Glossary
��
Appendix E: Glossary
Accretion – the deposition of sediment, sometimes indicated by the seaward advance of a shoreline indicator such as the water line, the berm crest, or the vegetation line. Active beach – the portion of the littoral system that is frequently (daily or at least seasonally) subject to transport by wind, waves, and currents. Algal bloom – a sudden increase in the amount of marine algae (seaweed) often caused by high levels of phosphates, nitrates, and other nutrients in the near shore area. Armoring - the placement of fixed engineering structures, typically rock or concrete, on or along the shoreline to reduce coastal erosion. Armoring structures include seawalls, revetments, bulkheads, and rip rap (loose boulders). Backshore – the generally dry portion of the beach between the berm crest and the vegetation line that is submerged only during very high sea levels and eroded only during moderate to strong wave events. Beach – an accumulation of loose sediment (usually sand or gravel) along the coast. Beach loss – a volumetric loss of sand from the active beach. Beach management district – a special designation for a group of neighboring coastal properties that is established to facilitate cost sharing and streamline the permitting requirements for beach restoration projects. Beach narrowing – a decrease in the useable beach width caused by erosion. Beach nourishment – the technique of placing sand fill along the shoreline to widen the beach. Beach profile – a cross-sectional plot of a shore-normal topographic and geomorphic beach survey, usually in comparison to other survey dates to illustrate seasonal and longer-term changes in beach volume.

Appendix E – Glossary
Berm – a geomorphologic feature usually located at mid-beach and characterized by a sharp break in slope, separating the flatter backshore from the seaward-sloping foreshore. Building setback – the country-required seaward limit of major construction for a coastal property. Building setbacks on Maui vary from 25 feet to 150 feet landward of the certified shoreline. Coastal dunes – dunes within the coastal upland, immediately landward of the active beach. Coastal erosion – the wearing away of coastal lands, usually by wave attack, tidal or littoral currents, or wind. Coastal erosion is synonymous with shoreline (vegetation line) retreat. Coastal plain – the low-lying, gently-sloping area landward of the beach often containing fossil sands deposited during previously higher sea levels. Coastal upland – the low-lying area landward of the beach often containing unconsolidated sediments. The coastal upland is bounded by the hinterland (the higher-elevation areas dominated by bedrock and steeper slopes). Day-use mooring – a buoy or other device to which boats can be secured without anchoring. Deflation – a lowering of the beach profile. Downdrift – in the direction of net longshore sediment transport. Dune – a landform characterized by an accumulation of wind-blown sand, often vegetated. Dune restoration – the technique of rebuilding an eroded or degraded dune through one or more various methods (sand fill, drift fencing, re-vegetation, etc.). Dune walkover – light construction that provides pedestrian access without trampling dune vegetation. Dynamic equilibrium – a system in flux, but with influxes equal to outfluxes. Erosion – the loss of sediment, sometimes indicated by the landward retreat of a shoreline indicator such as the waterline, the berm crest, or the vegetation line. Erosion hotspots – areas where coastal erosion has threatened shoreline development or infrastructure. Typically, the shoreline has been armored and the beach has narrowed considerably or been lost.

Appendix E – Glossary
Erosion watchspots – areas where the coastal environment will soon be threatened if shoreline erosion trends continue. Foreshore – the seaward sloping portion of the beach within the normal range of tides. Hardening – see Armoring. Inundation – the horizontal distance traveled inland by a tsunami. Improvement districts – a component of a beach management district established to help facilitate neighborhood-scale improvement projects (e.g., beach nourishment). Land banking – the purchase of shoreline properties by a government, presumably to reduce development pressure or to preserve the parcel as a park or as open space. Littoral budget – the sediment budget of the beach consisting of sources and sinks. Littoral system – the geographical system subject to frequent or infrequent beach processes. The littoral system is the area from the landward edge of the coastal upland to the seaward edge of the near-shore zone. Longshore transport – sediment transport down the beach (parallel to the shoreline) caused by longshore currents and/or waves approaching obliquely to the shoreline. Lost beaches – a subset of erosion hotspots. Lost beaches lack a recreational beach, and lateral shoreline access is very difficult if not impossible. Monitoring – periodic collection of data to study changes in an environment over time. Nutrient loading – the input of fertilizing chemicals to the nearshore marine environment, usually via non-point source runoff and sewage effluent. Nutrient loading often leads to algal blooms. Offshore – the portion of the littoral system that is always submerged. Overwash – transport of sediment landward of the active beach by coastal flooding during a tsunami, hurricane, or other event with extreme waves. Revetment – a sloping type of shoreline armoring often constructed from large, interlocking boulders. Revetments tend to have a rougher (less reflective) surface than seawalls. Risk – refers to the predicted impact that a hazard would have on people, services, specific facilities and structures in the community.

Appendix E – Glossary
Risk management – the process by which the results of an assessment are integrated with political, economic, and engineering information to establish programs, projects and policies for reducing future losses and dealing with the damage after it occurs. Scarp – a steep slope usually along the foreshore and/or at the vegetation line, formed by wave attack. Scarping – the erosion of a dune or berm by wave-attack during a storm or a large swell. Sea bags – large sand-filled geotextile tubes used in coastal protection projects. Seawall – a vertical or near-vertical type of shoreline armoring characterized by a smooth surface. Shoreline setback – see Building setback. Siltation – the input of non-calcareous fine-grained sediments to the nearshore marine environment, or the settling out of fine-grained sediments on the seafloor. Storm surge – a temporary rise in sea level associated with a storm’s low barometric pressure and onshore winds. Urban runoff – the input of hydrocarbons, heavy metals, pesticides and other chemical to the near shore marine environment from densely populated areas. Vulnerability – the characteristics of the society or environment affected by the event that resulted in the costs from damages. Vulnerability assessment – the qualitative or quantitative examination of the exposure of some component of society, economy or the environment to natural hazards.

Appendix E – Glossary
Acronyms FEMA Federal Emergency Management Agency HUD Housing and Urban Development NFIP National Flood Insurance Program NOAA National Oceanic and Atmospheric Administration NWS National Weather Service USACE United States Army Corps of Engineers USDA United States Department of Agriculture USEPA United States Environmental Protection Agency USGS United States Geological Survey