newgen - bombay stock exchange · 2018-08-10 · at infosys finacle global partner meet 2017...
TRANSCRIPT
Date: August 10,2018
BSE Limited
• NEWGEN
Newgen Software Technologies Limited CIN: L72200DL 1992PLC049074
E-44/13, Okhla Phase-11, New Delhi- II 0 020, INDIA Tel: +91-11-4653 3200 Fax: +91-11-2638 3963
Email: [email protected] URL: https://newgensoft.com
National Stock Exchange of India Limited Phiroze Jeejeebhoy Towers, Exchange Plaza, Plot No. C/1, G Block, Dalal Street, Bandra- Kurla Complex Mumbai - 40000 I Bandra (E), Mumbai- 400051
Ref.: Newgen Software Technologies Ref.: Newgen Software Technologies Limited Limited (NEWGEN/INE619B01017) (NEWGEN/INE619B01 017) ScriJ! Code - 540900
Subject: Annual Report under Regulation 34(1) of SEBI (Listing Obligations and Disclosure Requirements) Regulations, 2015:
Dear Sir/ Ma'am,
Pursuant to the provisions of Regulation 34(1) of SEBI (Listing O~ligations and Disclosure Requirements) Regulations, 2015, please find enclosed herewith a copy of the Annual Report of the Company for the Financial Year 2017-18.
The same shall also be available on the website of the Company at https://newgensoft.com.
This is for your information and records.
Thanking you,
Yours truly
For Newgen Software Technologies Limited
~ i\man Mourya Company Secretary & Complianc(\'{J'1J.b~
Encl.: Annual Report
Registered Office: A-6, Satsang Vihar Marg, Qutab Institutional Area, New Delhi- II 0 067 INDIA Email: [email protected]
Tel: +91-11-4077 0100, +91-11-2696 3571,2696 4733, Fax: +91-11-2685 6936

Reinvent YouR WoRkplace
Newgen Software Technologies Limited
2017-18AnnuAl RepoRtNewgen Software Technologies Limited
https://newgensoft.com
_06
_11
Chairman’s Message
Making an Impact - CSR
Newgen - A Great Place to Work
_10
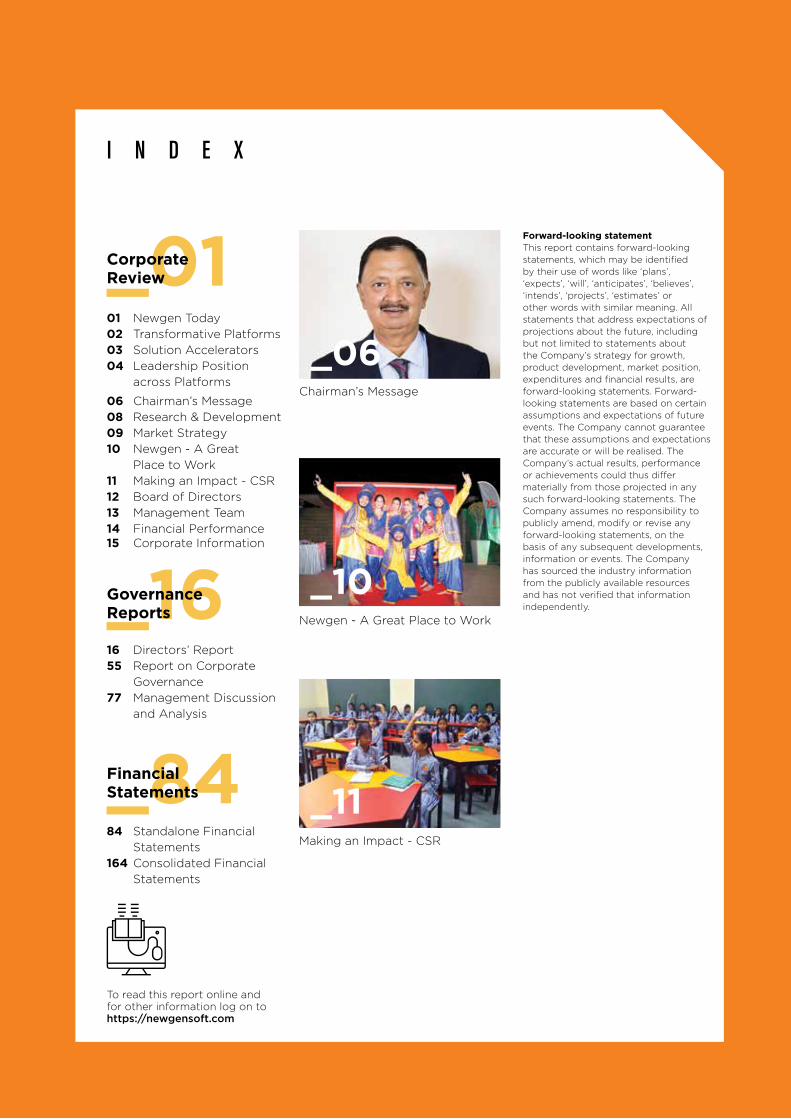
i n D e X
Forward-looking statementThis report contains forward-looking statements, which may be identified by their use of words like ‘plans’, ‘expects’, ‘will’, ‘anticipates’, ‘believes’, ‘intends’, ‘projects’, ‘estimates’ or other words with similar meaning. All statements that address expectations of projections about the future, including but not limited to statements about the Company’s strategy for growth, product development, market position, expenditures and financial results, are forward-looking statements. Forward-looking statements are based on certain assumptions and expectations of future events. The Company cannot guarantee that these assumptions and expectations are accurate or will be realised. The Company’s actual results, performance or achievements could thus differ materially from those projected in any such forward-looking statements. The Company assumes no responsibility to publicly amend, modify or revise any forward-looking statements, on the basis of any subsequent developments, information or events. The Company has sourced the industry information from the publicly available resources and has not verified that information independently.
01 Newgen Today
02 Transformative Platforms
03 Solution Accelerators
04 Leadership Position
across Platforms
06 Chairman’s Message
08 Research & Development
09 Market Strategy
10 Newgen - A Great
Place to Work
11 Making an Impact - CSR
12 Board of Directors
13 Management Team
14 Financial Performance15 Corporate Information
_01Corporate Review
84 Standalone Financial
Statements
164 Consolidated Financial
Statements
_84Financial Statements
16 Directors’ Report
55 Report on Corporate
Governance
77 Management Discussion
and Analysis
_16Governance Reports
To read this report online and for other information log on tohttps://newgensoft.com
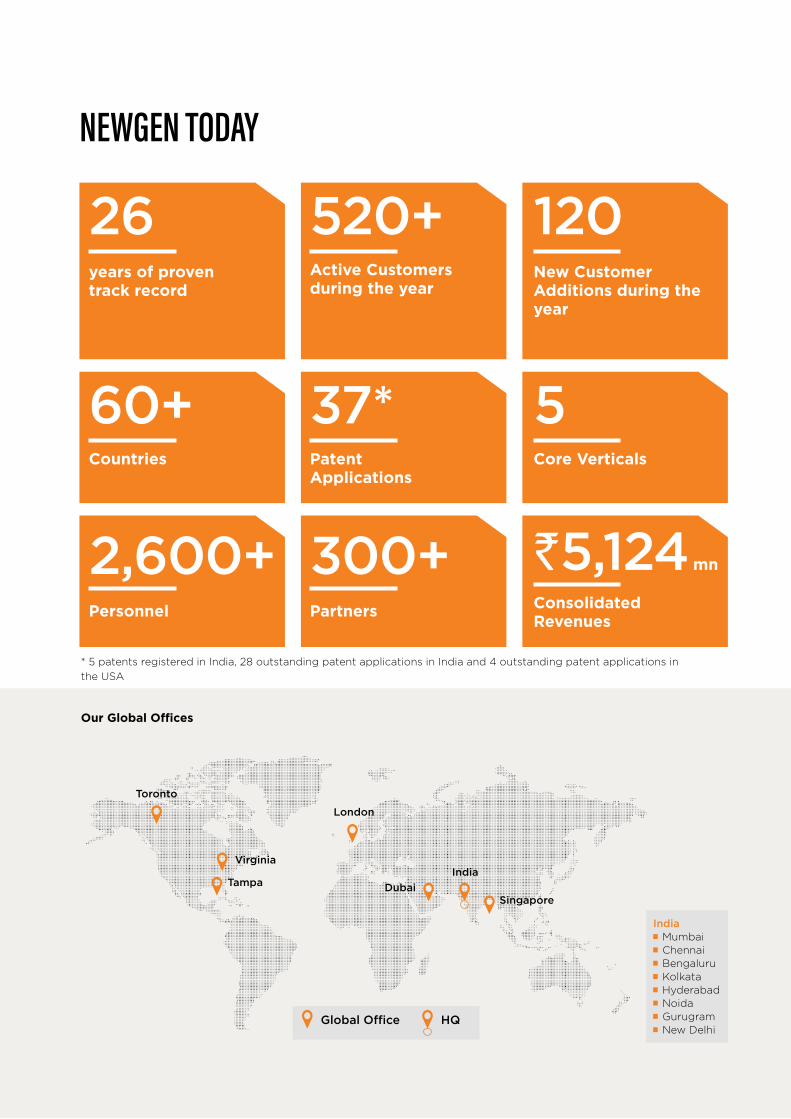
NewgeN Today
26
60+
520+
37*
120
5
`5,124 mn
years of proven track record
Countries
Active Customers during the year
Patent Applications
New Customer Additions during the year
Core Verticals
Consolidated Revenues
Global Office HQ
Toronto
Virginia
Tampa
London
DubaiSingapore
India
Our Global Offices
2,600+ 300+Personnel Partners
* 5 patents registered in India, 28 outstanding patent applications in India and 4 outstanding patent applications in
the USA
India Mumbai Chennai Bengaluru Kolkata Hyderabad Noida Gurugram New Delhi

ReINVeNT yoUR woRKPLaCe wITH oUR TRaNSFoRMaTIVe PLaTFoRMSOur comprehensive and dynamic low code product platform integrates systems, processes, people and things – so that businesses can increase their efficiency and responsiveness and enhance customer experience.
Deliver contextual content for smarter decision-making and improved collaboration
Digital Sensing RPA Enterprise Mobility
CloudAnalytics
Create smarter processes, empower knowledge
workers and build responsive business
Create, personalise and deliver interactive
communication to enhance customer experience
Enterprise Content
Management
Business Process & Case
Management
Customer Communication
Management
OmniDocs
POwERED by DIGITAL TRAnSfORMATIOn EnAbLERS
TRAnSfORMATIVE PRODuCT PLATfORMS
Omniflow ibPS OmniOMS
Newgen Software Technologies Limited02

SOLuTIOn ACCELERATORS
ReINVeNT THe CoRe oF yoUR BUSINeSS
We possess multi-vertical
industry expertise with
solutions in 17 different
verticals (with 5 core
verticals).
We build domain rich
solution frameworks.
Applications developed
on the Newgen platform
extend multiple benefits
to our customers, such
as fit to purpose with
minor changes. They are
adaptable to customer
needs and changing
regulations.
Further, specialised centre
of excellence teams have
been set up to guide and
train both implementation
partners and customers
on best practices for
effective and quick
implementations.
bAnkInG
Account Opening
Retail Lending
Commercial Lending
FATCA Compliance
Trade Finance
Collections and Payment Systems
GOVERnMEnT/PSus
Correspondence Management
Agenda Management
Citizen-Centric Services
Office Automation
Grants Management
InSuRAnCE
New Business Underwriting
Claims Processing
Policy Servicing
bPO/IT
Accounts Payable
Accounts Receivable
Invoice Processing
Vendor Portal
HEALTHCARE
Provider Contract Management
Appeals and Grievances
Management
Mobile Member Enrolment
Claims Repair
CORPORATE REVIEW FINANCIAL STATEMENTSSTATUTORY REPORTS
03ANNUAL REPORT 2017-18
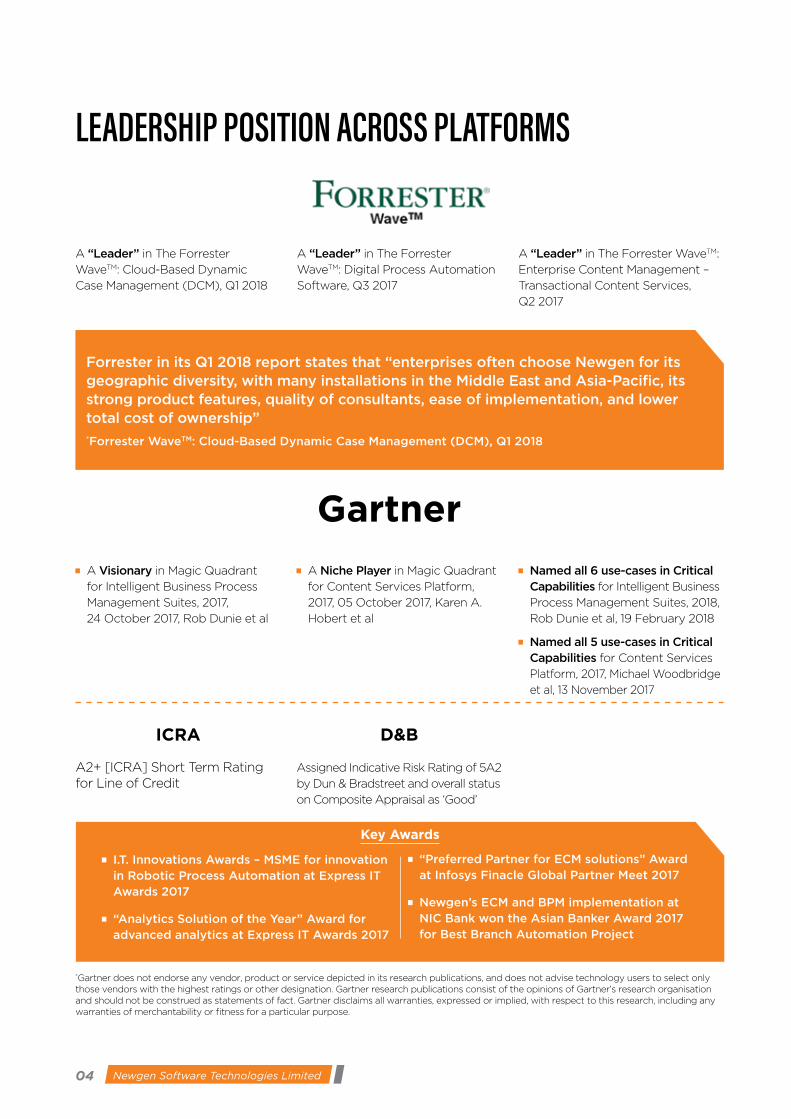
LeadeRSHIP PoSITIoN aCRoSS PLaTFoRMS
A “Leader” in The Forrester
WaveTM: Cloud-Based Dynamic
Case Management (DCM), Q1 2018
A “Leader” in The Forrester
WaveTM: Digital Process Automation
Software, Q3 2017
A “Leader” in The Forrester WaveTM:
Enterprise Content Management –
Transactional Content Services,
Q2 2017
D&B
Assigned Indicative Risk Rating of 5A2
by Dun & Bradstreet and overall status
on Composite Appraisal as ‘Good’
ICRA
A2+ [ICRA] Short Term Rating for Line of Credit
A Visionary in Magic Quadrant
for Intelligent Business Process
Management Suites, 2017,
24 October 2017, Rob Dunie et al
I.T. Innovations Awards – MSME for innovation in Robotic Process Automation at Express IT Awards 2017
“Analytics Solution of the year” Award for advanced analytics at Express IT Awards 2017
“Preferred Partner for ECM solutions” Award at Infosys finacle Global Partner Meet 2017
newgen’s ECM and bPM implementation at nIC bank won the Asian banker Award 2017 for best branch Automation Project
Key Awards
forrester in its Q1 2018 report states that “enterprises often choose newgen for its geographic diversity, with many installations in the Middle East and Asia-Pacific, its strong product features, quality of consultants, ease of implementation, and lower total cost of ownership”*forrester waveTM: Cloud-based Dynamic Case Management (DCM), Q1 2018
A niche Player in Magic Quadrant
for Content Services Platform,
2017, 05 October 2017, Karen A.
Hobert et al
named all 6 use-cases in Critical Capabilities for Intelligent Business
Process Management Suites, 2018,
Rob Dunie et al, 19 February 2018
named all 5 use-cases in Critical Capabilities for Content Services
Platform, 2017, Michael Woodbridge
et al, 13 November 2017
*Gartner does not endorse any vendor, product or service depicted in its research publications, and does not advise technology users to select only those vendors with the highest ratings or other designation. Gartner research publications consist of the opinions of Gartner’s research organisation and should not be construed as statements of fact. Gartner disclaims all warranties, expressed or implied, with respect to this research, including any warranties of merchantability or fitness for a particular purpose.
Gartner
04 Newgen Software Technologies Limited

oTHeR aCHIeVeMeNTS
Successful listing
in January 2018
on National Stock
Exchange and BSE Ltd.
25 years of Newgen:
NEWS Celebration
CORPORATE REVIEW FINANCIAL STATEMENTSSTATUTORY REPORTS
05ANNUAL REPORT 2017-18
CHaIRMaN’S MeSSage
Due to global thrust on
digitalisation, customers are
looking for software solutions that
empower their transformation to
a digital integrated enterprise.
Our comprehensive product
portfolio presents us an excellent
opportunity for growth. Our
proven platforms innovatively
connect systems, processes,
people and things. The
applications built on our platform
are extremely powerful and help
organisations achieve their critical
objectives. Our applications are
scalable, secure, cloud-ready,
highly available, and usable on all
devices. We provide both on-
premise and cloud solutions to suit
customer needs.
During Fiscal 2018, we have
continued with our strong growth
and profitability momentum and
delivered broadbased growth
across geographies by expanding
our sales distribution, both direct
and indirect, with an emphasis on
expanding our recurring revenues
and operating cash flows. On a
consolidated basis, we reported
revenues of ` 5,124 million in
Fiscal 2018, that is a 20% growth
(YoY) compared to the previous
year revenues of ` 4,271 million.
We continue to remain well
diversified across geographies,
with India comprising 35% of our
revenues, EMEA comprising 33%,
USA comprising 23% and APAC
(excluding India) comprising 9%
of revenues. This year, EMEA
and APAC were two strong
growth centers for us. In USA,
the business is focused on SaaS/
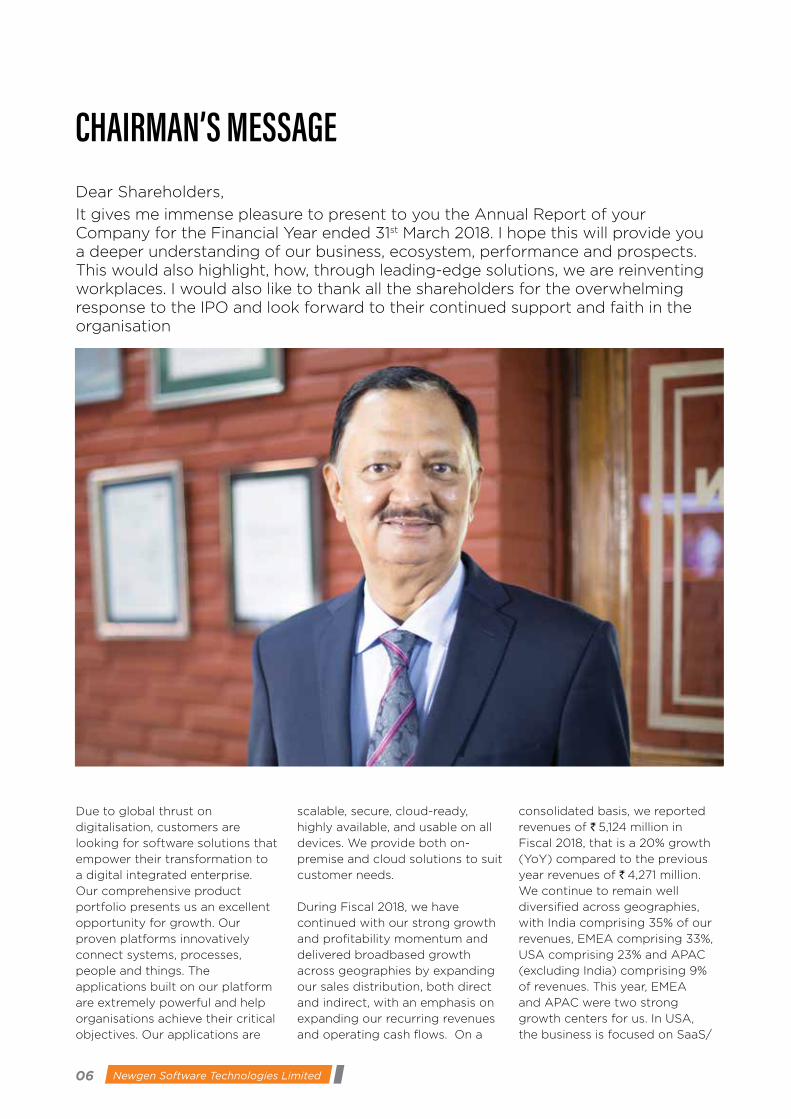
Dear Shareholders,
It gives me immense pleasure to present to you the Annual Report of your Company for the Financial Year ended 31st March 2018. I hope this will provide you a deeper understanding of our business, ecosystem, performance and prospects. This would also highlight, how, through leading-edge solutions, we are reinventing workplaces. I would also like to thank all the shareholders for the overwhelming response to the IPO and look forward to their continued support and faith in the organisation
06 Newgen Software Technologies Limited

Cloud and thus the upfront
revenues are in line with the
business model, but these would
be better quality revenue streams
in future.
Newgen continues to be a global
business; well diversified across
geographies, customers and
verticals. Our product leadership
has enabled us to establish a
marquee and diversified global
customer base with long-
standing relationships. We have
an active customer base of 520+
clients running their businesses
and critical operations on our
platforms in 60+ countries. We are
providing solutions to some of the
world’s leading banks, insurance
companies, healthcare firms,
global manufacturers etc. We have
made substantial customer wins
during the year and added 120
new customers including some
Fortune 500 companies. Our
investments in USA are starting to
bear fruit and we have seen large
customer wins in this area.
Newgen continues to strengthen
its horizontal product platform
with constant focus on Research &
Development. We have continued
to enhance our solutions to take
advantage of market trends and
released product upgrades for
our customers. Our new offerings
include Mobility (Newgen
Enterprise Mobility Framework),
Virtual Repository Services,
Dynamic Case Management, RPA
with BPM, Digital Sensing and
Flexible Designing and Authoring.
Newgen’s commitment to delivering
innovative products and solutions
makes us one of the few software
products organisations which have
attracted multiple recognitions
from leading advisory and research
firms from time to time including
Forrester and Gartner.
We are building vertical service
accelerators to enhance the
overall portfolio. We possess
multi-vertical industry expertise
and target a broad spectrum
of services in our business and
product offerings. This has helped
us build solution frameworks
which are enriched with domain
knowledge from the relevant
sector and subject matter experts
across several industries. These
frameworks have been built on
our platform and are scalable and
adaptable based on a particular
customer’s unique and constantly
evolving business needs. Banking
& Financial Services vertical
continued to be a stronghold
for us. During the year, we have
built high level domain expertise
and created robust frameworks
for Retail and Corporate lending
which are successfully operating
across banks and geographies.
The Company witnessed substantial
improvements in the operational
performance, which reflect in the
39% increase in EBITDA (adjusted
for other income). The Company
reported the EBITDA (adjusted for
other income) of `975 million in
Fiscal 2018 as against ` 702 million
in Fiscal 2017. PAT improved by 42%
from `513 million in Fiscal 2017 to
touch `729 million in Fiscal 2018.
We continue to strike a fine balance
between investing for our future
growth and managing our margins.
We are focusing on scaling our
Cloud / Saas business by increasing
penetration and strengthening the
platforms to meet all compliance/
regulatory requirements. SaaS
revenues witnessed robust growth
of 3X and comprised 2% of revenue
from operations.
Apart from our direct presence in
several countries around the world,
our robust partner network has
played a pivotal role in expanding
our outreach. We will continue to
leverage our association with our
partners to accelerate business
growth.
Our outstanding performance
is due to the efforts of our
dedicated, skilled and professional
employees. To ensure that we have
the right mix of next-generation
skills to achieve our goals, we
will continue to attract, develop
and retain the best talent in the
industry. Our people are our most
important asset and we remain
committed to provide them with a
workplace that fosters innovation,
collaboration and satisfaction.
We are heading towards exciting
and transformative times in
the industry as well as for the
organisation. Our performance
in Fiscal 2017-18 has set the
foundation for the future.
We continue to work towards
improvement of our products to
make them future-ready and look
forward to the continued support
from all our stakeholders.
With Best Regards,
Diwakar Nigam
On a consolidated basis, we reported revenues of ` 5,124 Million in Fiscal 2018, that is a 20% growth YoY compared to the previous year revenues of ` 4,271 Million.
CORPORATE REVIEW FINANCIAL STATEMENTSSTATUTORY REPORTS
07ANNUAL REPORT 2017-18

FoCUS oN ReSeaRCH aNd deVeLoPMeNT
37Patents Applied(1)
(with 5 Registrations)
250+R&D Employees
Newgen is proud of its skilled R&D team of 250+ employees with deep product domain expertise which continuously focuses on driving innovation and adopting solutions in line with rapidly-evolving technological trends. The Company has 32 patent applications under process and 5 patents granted as of March 2018.
We aim at expansion of product
portfolio to address the
digitisation market opportunity
and lay strong emphasis on
elements like Digital Sensing,
Robotic Process Automation,
Enterprise Mobility, Analytics and
Cloud that are ruling the new
world order.
We, at Newgen, are making continuous investments to develop Cloud
and SaaS delivery models. Our Cloud-based infrastructure is certified
for various security and industry compliances and is witnessing strong
traction in mature markets, including the US specifically in banking and
healthcare verticals and witnessed a 3X revenue growth in Fiscal 2018.
The customer base increased from 8 in Fiscal 2017 to 2022 in Fiscal 2018.
R&D Expenses (` in Million)
fy16 fy17 fy18
250
313
369
(1)5 patents registered in India, 28 outstanding patent applications in India and 4 outstanding patent applications in the USA
Product Pipeline
ECM nXT Virtual Repository Services
Corrus
Digital Sensing bPM nXT RPA with bPM
08 Newgen Software Technologies Limited
MULTI-PRoNged go-To-MaRKeT STRaTegy
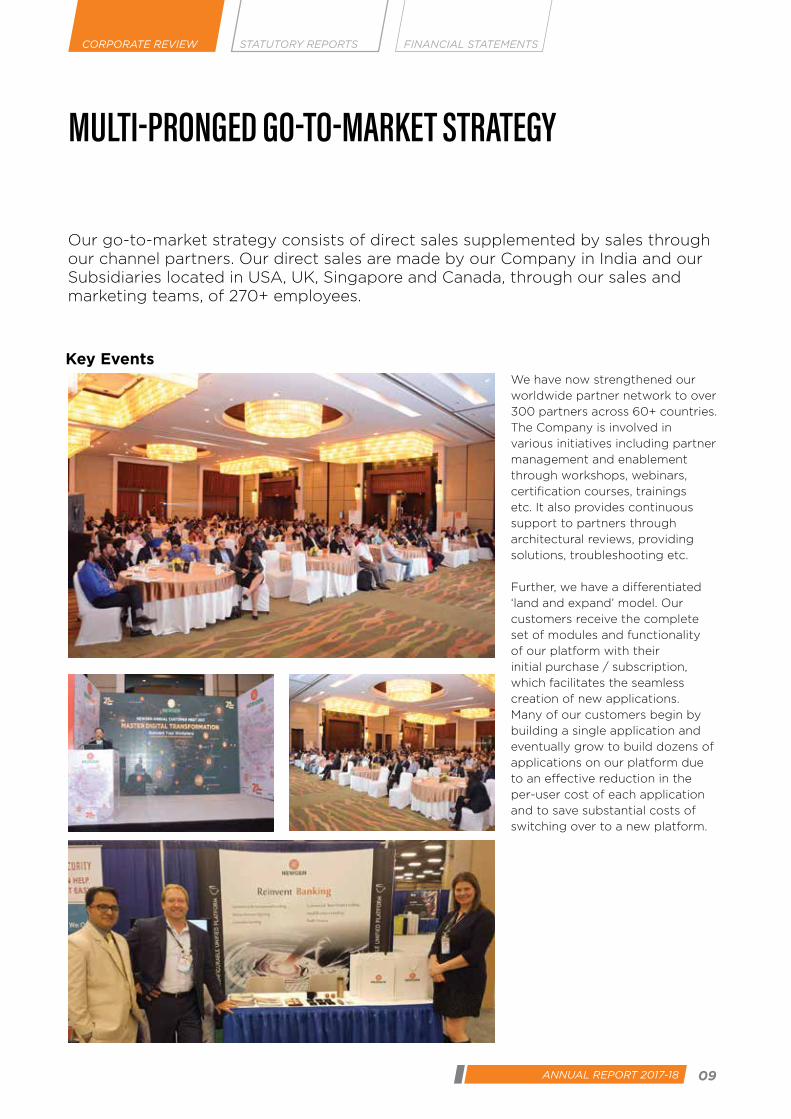
Our go-to-market strategy consists of direct sales supplemented by sales through our channel partners. Our direct sales are made by our Company in India and our Subsidiaries located in USA, UK, Singapore and Canada, through our sales and marketing teams, of 270+ employees.
We have now strengthened our
worldwide partner network to over
300 partners across 60+ countries.
The Company is involved in
various initiatives including partner
management and enablement
through workshops, webinars,
certification courses, trainings
etc. It also provides continuous
support to partners through
architectural reviews, providing
solutions, troubleshooting etc.
Further, we have a differentiated
‘land and expand’ model. Our
customers receive the complete
set of modules and functionality
of our platform with their
initial purchase / subscription,
which facilitates the seamless
creation of new applications.
Many of our customers begin by
building a single application and
eventually grow to build dozens of
applications on our platform due
to an effective reduction in the
per-user cost of each application
and to save substantial costs of
switching over to a new platform.
Key Events
CORPORATE REVIEW FINANCIAL STATEMENTSSTATUTORY REPORTS
09ANNUAL REPORT 2017-18
NewgeN - a gReaT PLaCe To woRK
Capacity ManagementHuman capital management is
of critical importance in ensuring
that an organisation operates
smoothly, especially in a knowledge
business like ours. Our key efforts
to strengthen our focus on capacity
management include:
Attracting the brightest people
in the industry through Talent
Acquisition, Internal Job Postings,
and Employee Referrals
Making the on-boarding process
smoother for new recruits through
structured programmes such
as Newgen Broad Spectrum
Orientation, Product Training and
Mentorship Programmes
We have an employee base
of 2,400+ across several
developmental centres in leading
metros including Noida, Gurugram,
New Delhi, Mumbai and Chennai
Capability ManagementIn a dynamic and evolving
marketplace, the need of the hour
is an integrated and proactive
approach towards competency
development to achieve business
objectives and enhance employee
and client satisfaction levels. Our key
efforts in this direction include:
Goal-based assessment system
to align individual’s goals with
Company’s mission and vision
In-house certifications, behavioural
and technical training such as
Newgen Certified Implementation
Professional (NCIP), Newgen BI
Certification, Newgen Emerge and
Soul of Leading Teams and several
other workshops under Newgen’s
iLearn and iEvolve initiative
Engagement and EmpowermentOur ability to excel and lead clients
on their digital transformation is
driven by the collective excellence
of our people. In the past years, we
reinforced our focus on leadership
development and building an
engaged workforce through the
following initiatives:
Holding town hall meetings with
the senior management, aligning
all Newgenites with a shared vision
Conducting an Annual Employee
Engagement Survey aimed at
assessing the overall health of the
Company and devising strategic
interventions to strengthen the
Employee Engagement Index
Recognising employees for their
outstanding contributions through
a well-thought-out Reward and
Recognition (R&R) Policy
Supporting platforms such as
Newgen Women’s Forum and
Newgen Employee Welfare
Society (NEWS) for giving
employees a forum to engage
in collaborative discussions and
activities
ESOPs (Employee Stock Options)
granted from time to time for
employees concurrent growth
with the Company
Ethics and ComplianceAn unwavering commitment to
integrity and ethical practices is
the only way for conducting our
business. To uphold a culture of
compliance in which employees
understand what the Company
expects them to practice at work
every day, we have implemented the
following initiatives:
Articulating our ethical focus
by sharing and enforcing the
Newgen’s Code of Ethics and
Business Conduct
Focused awareness campaigns,
robust complaints and redressal
mechanisms
Making all internal policies
gender neutral to establish the
philosophy of ‘Zero Tolerance to
Sexual Harassment’ at every level.
(Prevention of Sexual Harassment)
Establishment of a Vigil
Mechanism and Whistle
Blower Policy
Our people are our biggest source of energy and inspiration and the torch-bearers of our values-led journey. Cognizant of their invaluable role towards accomplishing our purpose of reinventing workplaces globally, we believe we first have a moral responsibility to make Newgen a great workplace. Investing in our people, empowering them with next-generation skills and remaining committed to their happiness and satisfaction; we are continually implementing strategic HR programmes that make Newgen a thriving workplace.
10 Newgen Software Technologies Limited
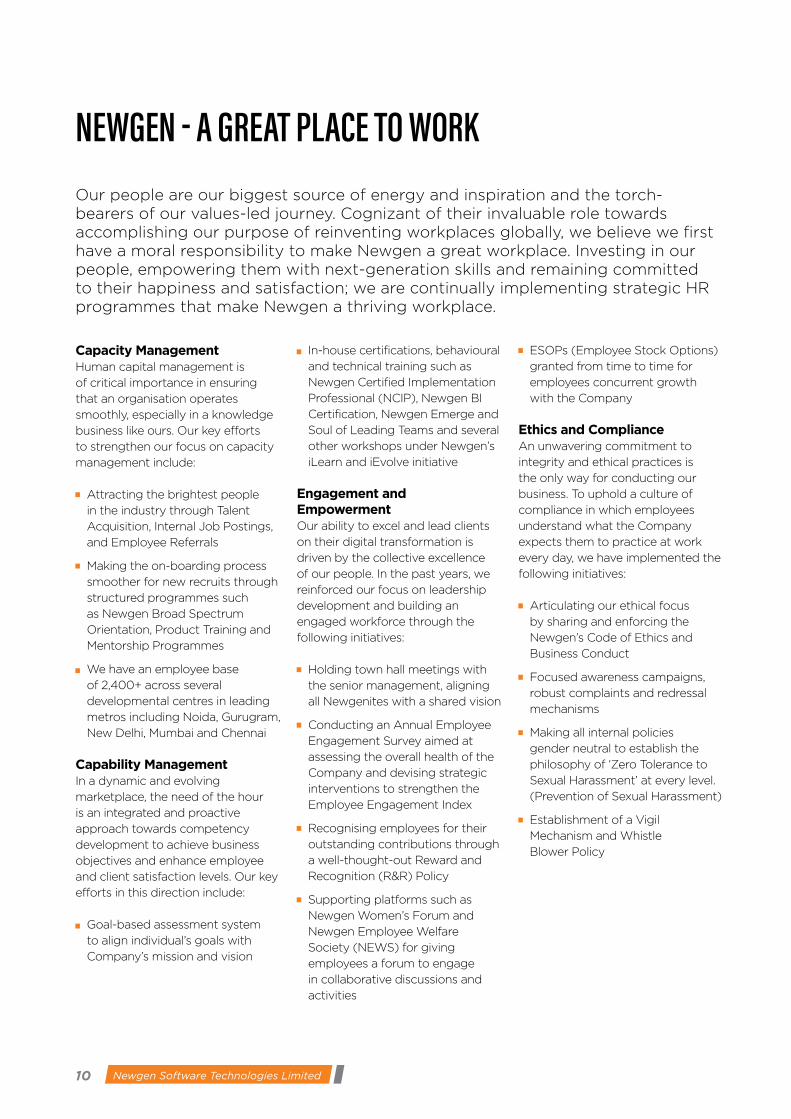
MaKINg aN IMPaCT - CSR
With Newgen’s Corporate Social Responsibility initiative, we aim to actively contribute in the social and economic development of the less privileged children. We concentrate our efforts to raise the Human Development Index of our nation by enhancing their quality of lives. Our objective is to make CSR a key business process for sustainable development of the society and to have an insightful business engagement with society at large.
We believe in corporate responsibility and contributing to the communities in which we operate. While being focused on sustained financial performance, we are also aware of the necessity and importance of social stewardship. As part of our initiatives to realise our CSR vision, we seek to, inter alia, promote education, care of abandoned children and gender equality.
Major Social Development ProjectsNewgen Digital Discovery Paathshala (NDDP)The digital literacy programme aims at stimulating the minds of children through the use of iPads and internet. The NDDP programme aims at transforming classroom sessions into fun–learning activities and making education more meaningful, taking the school curriculum as the baseline.
The Digital Paathshala is a fun place to learn textbook concepts digitally through iPads. Also, Newgen’s facilitators conduct sessions using methodologies like role plays, quizzes, movies and
presentations. Under the aegis of NDDP, Newgen has adopted Government’s Girls’ Senior Secondary School, Harkesh Nagar, Okhla. It is currently conducting classes for 1,300 + children of classes 6th, 7th and 8th. Newgen has also equipped the school’s Computer lab with colourful furniture, iPads and projector.
Newgen adopted Soami Nagar Model School to run its NDDP programme in April 2017, for 150+ children of classes 6th, 7th and 8th.
S.O.S. Village Newgen has adopted three families at the SOS Children’s Village, Surajkund, Greenfields in Faridabad and also supports another three families at SOS Children’s Village in Bhopal. Each house accommodates ten children and are looked after by a mother. Newgen volunteers occasionally visit the families and conduct fun learning activities such as arts and craft, diya painting, quizzes, quilling workshops and others.
Akshaya Patra FoundationNewgen has partnered with Akshaya Patra, in March 2018 to sponsor mid-day meals for
1,000+ children.
S.O.S. Youth HostelPersonality Development sessions are conducted by “I AM” a professional organisation, dealing with youth. The organisation conducts personality development and career counselling sessions. Once a month, children from SOS Youth hostel and Sadbhavna join in the session. These sessions
help to build self confidence, self-esteem and enhance the personality development of the children. As a monitoring mechanism, the organisation submits an impact report of the activities conducted during the year.
In addition to these initiatives, the promoters of the Company have also taken up the Sadbhavna Project, which looks at the holistic development of children, with the members offering tutorials for scholastic curriculums as well as guidance for vocational education.
NDDP classes are interesting way to learn about new topics. I liked the sessions in which I learnt various topics using a real iPad. I learned about using internet for search by using keywords. Our search topics were then explained by the teachers to us. Also, Videos related to our NCERT curriculum were shown, topics were discussed and quiz given from them. I learned a lot in the NDDP classes while having fun!-Satnoor Saran, Class VII (NDDP Programme)
CORPORATE REVIEW FINANCIAL STATEMENTSSTATUTORY REPORTS
11ANNUAL REPORT 2017-18

BoaRd oF dIReCToRS
Diwakar NigamChairman and Managing Director
Diwakar co-founded Newgen. He is also a founding member of NASSCOM, India’s apex Information Technology industry association. He was one of the members of NASSCOM’s Anti Piracy Task Group. Prior to joining Newgen, he founded Softek and was associated with it for 12 years.
Diwakar has been on our Board since April 1, 1993 and has more than 35 years of experience in the information technology industry. He is an alumnus of University of Allahabad, IIT Delhi and IIT, Madras.
Subramaniam Ramnath IyerIndependent Director
Subramaniam Ramnath Iyer is an Independent Director of our Company. A qualified chartered accountant, company secretary and cost accountant and holds a bachelor’s degree in Commerce from Shri Ram College of Commerce, University of Delhi. He is the sole proprietor of S.R. Iyer & Associates, Chartered Accountants. He has more than 36 years of experience in the field of finance, accounting and corporate law.
Priyadarshini Nigam Whole-time Director
Priyadarshini has been on our Board since 1997. Previously, she was a journalist with over 10 years of experience. She has freelanced and published with South-North News Service and Depthnews Press Foundation Asia.
She holds a bachelor’s and a master’s degree in Economics.
Saurabh Srivastava Independent Director
Saurabh is an Independent Director of our Company. He is an alumnus of the Indian Institute of Technology, Kanpur and the Harvard University, USA. He has also been awarded Padma Shri by the Government of India. Mr. Saurabh Srivastava has several years of experience in the field of Information Technology. He is one of India’s leading IT entrepreneurs, angel investors and venture capitalists. He is a founder director of Indian Angel Network and a former chairman of NASSCOM.
T S VaradarajanWhole-time Director
Varadarajan co-founded Newgen. He has been on our Board since its incorporation. Prior to promoting Newgen, he promoted Softek Private Limited and was associated with it for 13 years. He has more than 35 years of experience in the field of software designing and development. He did his bachelor’s in science from the Bangalore University and engineering (electrical technology) from the Indian Institute of Science, Bengaluru. He holds a master’s degree in technology (computer science) from IIT, Madras.
Kaushik DuttaIndependent Director
Kaushik is an Independent Director of our Company. He previously served as Partner of Lovelock and Lewes and Price Waterhouse, Bangalore. He has served as an expert with the Indian Institute of Corporate Affairs and Serious Fraud Investigation Office of the MCA. He is the founder and co-director of Thought Arbitrage Research Institute.
He graduated in commerce from St. Xavier’s College, University of Calcutta. He is a qualified chartered accountant and a fellow member of ICAI.
12 Newgen Software Technologies Limited

MaNageMeNT TeaM
S J Raj Senior Vice President (HR Operations)
Raj has been with us for over 25 years and is responsible for our human resources strategy, global operations and programmes aligned with human resource strategy. Before joining Newgen, he worked with Eicher Goodearth, SRF Nippondenso, PCS Data Products and Semiconductor Complex Limited.
He holds a master’s degree in Arts with specialisation in Social Work from the Jamia Millia Islamia University, New Delhi.
Virender Jeet Senior Vice President,
(Sales & Marketing / Products)
Jeet has been with us for over 26 years and manages the overall strategic and operational responsibility for our entire portfolio of offerings. He oversees the key functions of product development, global sales and marketing and business enabling functions. He has led us in filing of more than 37 patents in India, of which five have been granted.
He holds a bachelor’s degree in Engineering from the Savitribai Phule Pune University.
Arun Kumar Gupta Chief Financial Officer
Arun has been with us since 2010. He oversees financial planning, treasury, global taxation, investor relations, business finance, and compliances as well as financial reporting. He has 25 years of experience in finance. Previously, he worked with companies like Maersk, Thermax, Satyam. He holds a bachelor’s degree in Science from the University of Calcutta. He is a qualified Chartered Accountant, Cost and Works Accountant and a Company Secretary.
Tarun Nandwani Vice President,
(Customer Relations / Delivery)
Tarun has been with us for over 25 years. He is responsible for implementation of our products and solutions across industry segments, improving implementation processes, systems, policies, talent management and leadership development with a focus on customer relationship management, delivery management and development centre management.
He holds a bachelor’s degree in Engineering from the University of Delhi.
CORPORATE REVIEW FINANCIAL STATEMENTSSTATUTORY REPORTS
13ANNUAL REPORT 2017-18
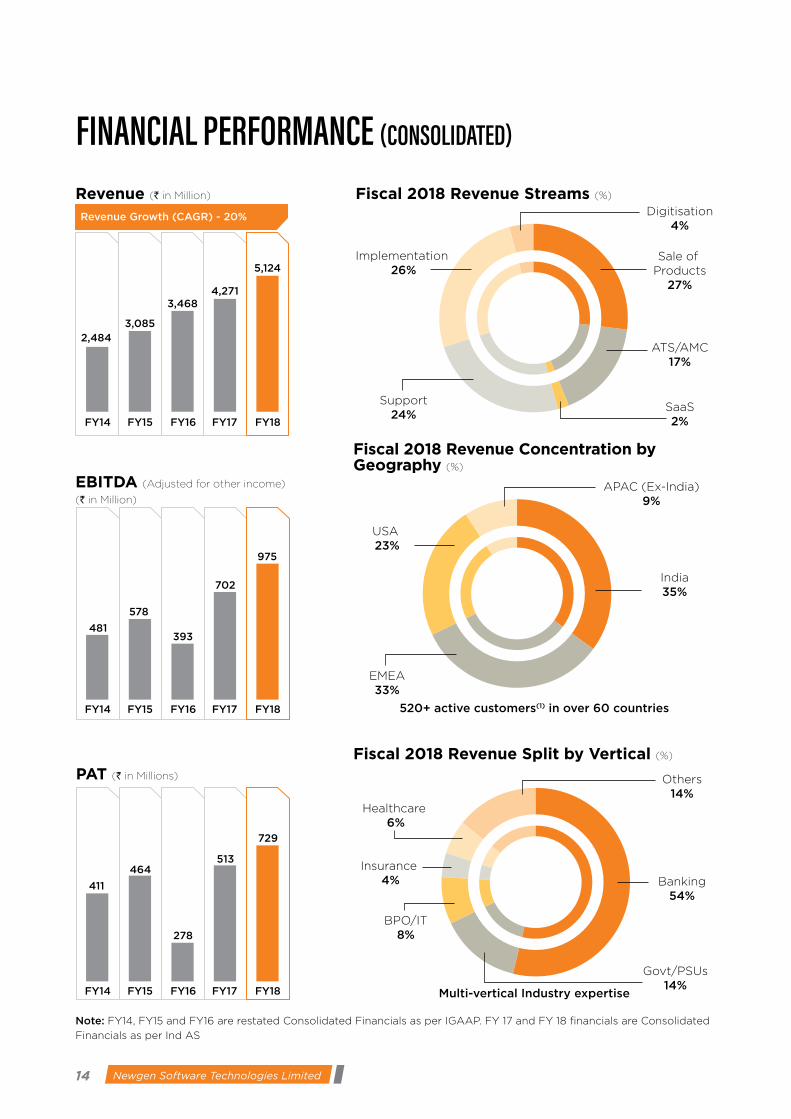
FINaNCIaL PeRFoRMaNCe (CoNSoLIdaTed)
2,484
Revenue Growth (CAGR) - 20%
3,085
3,4684,271
5,124
Revenue (` in Million)
fy14 fy15 fy16 fy17 fy18
Fiscal 2018 Revenue Streams (%)
Fiscal 2018 Revenue Concentration by Geography (%)
520+ active customers(1) in over 60 countries
note: FY14, FY15 and FY16 are restated Consolidated Financials as per IGAAP. FY 17 and FY 18 financials are Consolidated
Financials as per Ind AS
EBITDA (Adjusted for other income) (` in Million)
fy14 fy15 fy16 fy17 fy18
481
578
393
702
975
PAT (` in Millions)
fy14 fy15 fy16 fy17 fy18
411
464
278
513
729
Digitisation4%
Sale of Products
27%
Implementation 26%
Support24%
ATS/AMC17%
SaaS2%
APAC (Ex-India)9%
India35%
USA 23%
EMEA33%
Fiscal 2018 Revenue Split by Vertical (%)
Multi-vertical Industry expertise
Others14%
Banking54%
Insurance 4%
Healthcare 6%
BPO/IT8%
Govt/PSUs14%
14 Newgen Software Technologies Limited
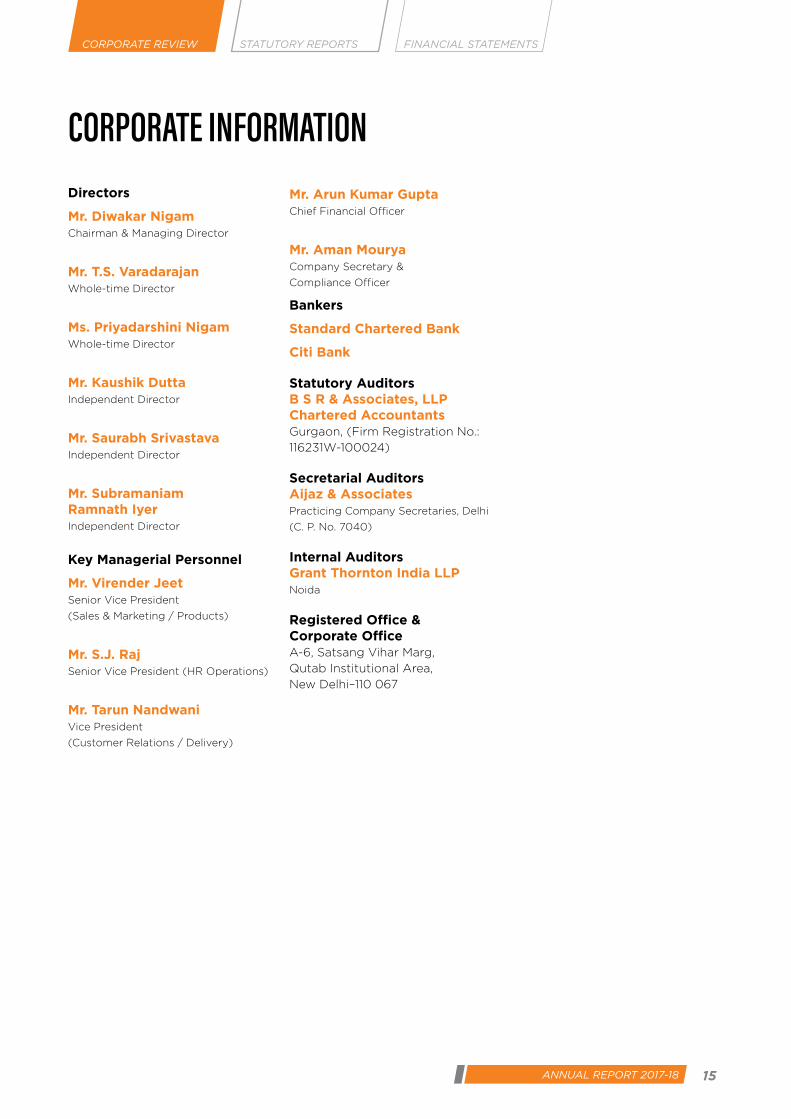
CoRPoRaTe INFoRMaTIoNDirectors
Mr. Diwakar Nigam Chairman & Managing Director
Mr. T.S. Varadarajan Whole-time Director
Ms. Priyadarshini Nigam Whole-time Director
Mr. Kaushik Dutta Independent Director
Mr. Saurabh Srivastava Independent Director
Mr. Subramaniam Ramnath Iyer Independent Director
Key Managerial Personnel
Mr. Virender JeetSenior Vice President
(Sales & Marketing / Products)
Mr. S.J. RajSenior Vice President (HR Operations)
Mr. Tarun NandwaniVice President
(Customer Relations / Delivery)
Mr. Arun Kumar Gupta Chief Financial Officer
Mr. Aman Mourya Company Secretary &
Compliance Officer
Bankers
Standard Chartered Bank
Citi Bank
Statutory Auditors B S R & Associates, LLP Chartered Accountants Gurgaon, (Firm Registration No.:
116231W-100024)
Secretarial AuditorsAijaz & AssociatesPracticing Company Secretaries, Delhi
(C. P. No. 7040)
Internal AuditorsGrant Thornton India LLPNoida
Registered Office & Corporate Office A-6, Satsang Vihar Marg,
Qutab Institutional Area,
New Delhi–110 067
CORPORATE REVIEW FINANCIAL STATEMENTSSTATUTORY REPORTS
15ANNUAL REPORT 2017-18
16 Newgen Software Technologies Limited
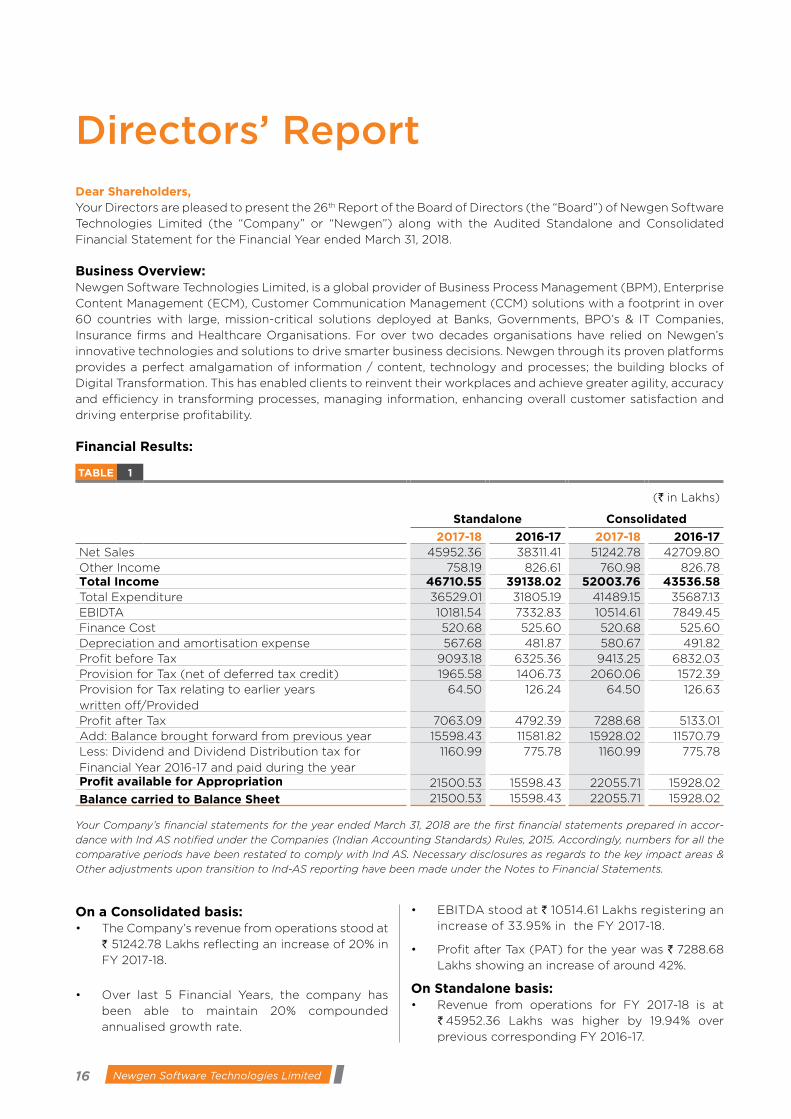
Directors’ Report Dear Shareholders,Your Directors are pleased to present the 26th Report of the Board of Directors (the “Board”) of Newgen Software
Technologies Limited (the “Company” or “Newgen”) along with the Audited Standalone and Consolidated
Financial Statement for the Financial Year ended March 31, 2018.
Business Overview: Newgen Software Technologies Limited, is a global provider of Business Process Management (BPM), Enterprise
Content Management (ECM), Customer Communication Management (CCM) solutions with a footprint in over
60 countries with large, mission-critical solutions deployed at Banks, Governments, BPO’s & IT Companies,
Insurance firms and Healthcare Organisations. For over two decades organisations have relied on Newgen’s
innovative technologies and solutions to drive smarter business decisions. Newgen through its proven platforms
provides a perfect amalgamation of information / content, technology and processes; the building blocks of
Digital Transformation. This has enabled clients to reinvent their workplaces and achieve greater agility, accuracy
and efficiency in transforming processes, managing information, enhancing overall customer satisfaction and
driving enterprise profitability.
Financial Results:
TABLE 1
(` in Lakhs)
Standalone Consolidated
2017-18 2016-17 2017-18 2016-17Net Sales 45952.36 38311.41 51242.78 42709.80Other Income 758.19 826.61 760.98 826.78Total Income 46710.55 39138.02 52003.76 43536.58Total Expenditure 36529.01 31805.19 41489.15 35687.13EBIDTA 10181.54 7332.83 10514.61 7849.45Finance Cost 520.68 525.60 520.68 525.60Depreciation and amortisation expense 567.68 481.87 580.67 491.82Profit before Tax 9093.18 6325.36 9413.25 6832.03Provision for Tax (net of deferred tax credit) 1965.58 1406.73 2060.06 1572.39Provision for Tax relating to earlier years
written off/Provided
64.50 126.24 64.50 126.63
Profit after Tax 7063.09 4792.39 7288.68 5133.01Add: Balance brought forward from previous year 15598.43 11581.82 15928.02 11570.79Less: Dividend and Dividend Distribution tax for
Financial Year 2016-17 and paid during the year
1160.99 775.78 1160.99 775.78
Profit available for Appropriation 21500.53 15598.43 22055.71 15928.02
Balance carried to Balance Sheet 21500.53 15598.43 22055.71 15928.02
Your Company’s financial statements for the year ended March 31, 2018 are the first financial statements prepared in accor-
dance with Ind AS notified under the Companies (Indian Accounting Standards) Rules, 2015. Accordingly, numbers for all the
comparative periods have been restated to comply with Ind AS. Necessary disclosures as regards to the key impact areas &
Other adjustments upon transition to Ind-AS reporting have been made under the Notes to Financial Statements.
On a Consolidated basis:• TheCompany’srevenuefromoperationsstoodat
` 51242.78 Lakhs reflecting an increase of 20% in
FY 2017-18.
• Over last 5 Financial Years, the company has
been able to maintain 20% compounded
annualised growth rate.
• EBITDAstoodat` 10514.61 Lakhs registering an
increase of 33.95% in the FY 2017-18.
• ProfitafterTax(PAT)fortheyearwas` 7288.68
Lakhs showing an increase of around 42%.
On Standalone basis:• Revenue from operations for FY 2017-18 is at
` 45952.36 Lakhs was higher by 19.94% over
previous corresponding FY 2016-17.

17ANNUAL REPORT 2017-18
CORPORATE REVIEW FINANCIAL STATEMENTSSTATUTORY REPORTS
Company increased from ` 6535.82 Lakhs (comprised
of 6,53,58,150 equity shares) to ` 6923.57 Lakhs
(comprised of 6,92,35,701 equity shares). The Equity
Shares in the IPO were offered at a price of ` 245 per
equity share (including share premium of ` 235 per
equity share). The Company listed its Equity Shares
on BSE Limited and National Stock Exchange of India
Limited on January 29, 2018.
Utilisation of IPO Proceeds:There is no deviation or variation proposed or
contemplates in the use of net proceeds of IPO
fund from the objects stated in the prospectus. As
on March 31, 2018, the net proceeds of the IPO Fund
have been deposited in the Scheduled Commercial
bank. As per stated object of the IPO, your Company
has identified an Institutional building near Noida-
Greater Noida Expressway, Uttar Pradesh for an
Office Premises. After completion of satisfactory due
diligence, requisite agreements will be executed in
this respect. After taking possession of the building,
furnishing of the office premises will start.
Details Pertaining to Shares in Suspense Account:Disclosures with respect to demat suspense account/
unclaimed suspense account as provided in Para
F of Schedule V of the SEBI (Listing Obligations &
Disclosure Requirements) Regulations, 2015 are
provided in the Corporate Governance Report forming
a part of this Report.
Details of Significant and Material Orders Passed by the Regulators or Courts or Tribunals Impacting the Going Concern Status and Company’s Operations in Future:NIL
Quality Systems & Information Security Initiative:Newgen has sustained its commitment to the
highest levels of quality, robust information security
management practices that have collectively helped
in achieving significant milestone during the year.
Newgen’s Quality and Information Security System
journey has been a steady one and with full conviction
starting from 1997. The same is evident from the
implementation of industry standards namely ISO
9001:2008, ISO 27001:2013 and Process Improvement
Models namely CMMi Dev v1.3 and CMMi Svc v1.3.
Emphasis has been on System driven transparent
process, which delivers exceptional Quality first time
right with the required level of Security.
The Company has focused on continuous
improvements in Customer engagements as well
as internal operations leveraging best-in-class
methodologies and information security practices.
Cross-functional Teams monitor and optimize the
processes & policies to meet the ever growing
demands of Newgen’s engagements.
• EBITDA are ` 10181.54 Lakhs registering an
increase of 38.85%.
• Profit after Tax (PAT) for the year is ` 7063.09
Lakhs registering an increase of 47.38%.
Credit Rating and Liquidity:ICRA has reaffirmed the short-term rating of [ICRA]
A2+ (pronounced ICRA A two plus) assigned earlier
to the ` 7050 Lakhs line of credit of the Company,
and also assigned a short-term rating of [ICRA] A2+
(pronounced ICRA A two plus) to the additional limit
of ` 1000 Lakhs.
The Company follows a conservative investment
policy and invests in high quality debt instruments
and bonds. As on March 31, 2018, on Standalone basis,
cash and cash equivalents were ` 13520.79 Lakhs and
in addition to that ` 5022.07 Lakhs was invested in
mutual funds & bonds and ` 204.74 Lakhs in non-
current fixed deposits. As on March 31, 2018, on
Consolidated basis, cash and cash equivalents were
` 14548.34 Lakhs and in addition to that ` 5022.07
Lakhs was invested in mutual funds & bonds and
` 210.49 Lakhs in non-current fixed deposits.
Dividend:Considering the Company’s financial performance,
your Directors are pleased to recommend a dividend
@ 20 % i.e. ` 2 per share for the Financial Year ended
March 31, 2018 (dividend declared in previous year
was @ 15 % i.e. ` 1.5 per share). The total outgo for the
current year amounts to ` 1668.65 Lakhs, including
dividend distribution tax of ` 283.94 Lakhs as against
` 1160.99 Lakhs including dividend distribution tax of
` 196.37 Lakhs in the previous year.
Change in the Nature of Business, if any:There is no change of nature of business of the
Company during the Financial Year 2017-18.
Share Capital:Authorised Share Capital:During the Financial Year 2017-18, there is a change
in share capital structure of the Company. During the
year under review, the Authorised Share Capital of
the Company was increased from ` 7,640 Lakhs to
` 11,000 Lakhs.
Initial Public Offering:During the year under review, the Company offered
its equity shares of ` 10 each (“Equity Shares”) for
subscription by the public, by way of Initial Public
Offer (“IPO”). The IPO comprised of fresh issue of
3,877,551 equity shares by your Company for cash at
a price of ` 245/- per share and an offer for sale by
outgoing investors of 1,34,53,932 equity shares for
cash at a price of ` 245/- per share. Consequently,
the Paid up, Issued and Subscribed Capital of the

18 Newgen Software Technologies Limited
The Company’s commitment towards customer
satisfaction and resilient systems/services has resulted
into the adaptation of other industry standards/acts
namely PCI-DSS, HIPAA, ISAE3402/SoC-1 Type-2 and
Soc-2+HITRUST Type-2 attestation. These standards
provide assurance to the customers on the design
and operating effectiveness of the security controls.
The Company also drives the process and product
improvements based on Voice of Customer i.e. Customer
Satisfaction Surveys (CSS). These surveys are conducted
at the specific project mile stone as well as at the
organisational level on an annual basis by a third party to
get an independent feedback from its customers.
Subsidiary Companies:The Company has five wholly owned subsidiaries
(WOS). There are no associate companies or joint
venture companies within the meaning of Section
2(6) of the Companies Act, 2013 (“Act”). There has
been no material change in the nature of the business
of the subsidiaries.
Names of wholly owned subsidiaries:
1. Newgen Software Inc. USA,
2. Newgen Software Technologies Pte. Ltd., (Singapore)
3. Newgen Software Technologies Canada Ltd.,
4. Newgen Software Technologies (UK) Ltd.
5. Newgen Computers Technologies Limited
Pursuant to first proviso to sub-section (3) of
Section 129 of the Act read with Rule 5 of Companies
(Accounts) Rules, 2014 the statement containing
salient features of the financial statement of
subsidiaries is enclosed in form AOC-1 as Annexure -1.
Financial Statements of the aforesaid subsidiary
companies are kept open for inspection by the
Members at the Registered Office of the Company
during business hours on all days except Saturday
& Sunday up to the date of the AGM as required
under Section 136 of the Act. Any Member desirous
of obtaining a copy of the said Financial Statements
may write to the Company at its Registered Office
or to the Compliance Officer of the Company.
The Financial Statements including the
Consolidated Financial Statements and all other
documents required to be attached to this Report
have been uploaded on the website of the Company
at https://newgensoft.com.
To comply with the provisions of Regulation 16(c) of
SEBI (LODR) Regulations, the Board of Directors of
the Company have adopted a Policy for determining
Material Subsidiary. The policy on Material Subsidiary
has been uploaded on the website of the Company
https://newgensoft.com.
Deposits:During the year under review, the Company has not
accepted any fixed deposit within the meaning of
Section 73 of the Companies Act, 2013 and the rules
made thereunder.
Statutory Auditors:The tenure of the Statutory Auditors of the
Company M/s. B S R & Associates, LLP, Chartered
Accountants, having Firm Registration number
116231W/W-100024 is upto five years with effect
from conclusion of 24th Annual General Meeting
held on August 22, 2016 till the conclusion of 29th
Annual General Meeting.
Auditors’ Report:The Statutory Auditors’ Report for the Financial Year
2017-18 does not contain any qualification, reservation
or adverse remarks.
Secretarial Audit:The Secretarial Audit Report from M/s Aijaz &
Associates, Company Secretaries in Practice, New Delhi,
for the Financial Year ended March 31, 2018 is enclosed
herewith as “Annexure-2”. The Secretarial Audit Report
for the Financial Year 2017-18 does not contain any
qualification, reservation or adverse remarks.
Employee Stock Options Schemes:During the year under review, the Newgen ESOP
Scheme 1999 and Newgen ESOP Scheme 2000 have
been closed, no Options granted thereunder are
outstanding. At present the Company has in place
Newgen Employees Stock Option Scheme-2014
(Newgen ESOP 2014). The Scheme is operated
through demat mode only. Newgen ESOP 2014 is
administered by the Nomination & Remuneration
Committee of the Board, through Newgen ESOP
Trust. The information on Options granted, exercised
and lapsed during the Financial Year 2017-18 and
other particulars as required under Companies
Act 2013 read with its rules and SEBI (Share Based
Employee Benefits) Regulation, 2014 with regard to
Employees’ Stock Options is enclosed herewith as
“Annexure-3”.
Extract of the Annual Return:As required under Section 92(3) of the Act, the extract
of the Annual Return in Form No. MGT–9 is enclosed
herewith as Annexure-4
Particulars of Employees and Related Disclosures:The information required pursuant to Section 197(12)
of the Companies Act 2013 read with Rule 5 of
the Companies (Appointment and Remuneration
of Managerial Personnel) Rules, 2014 and SEBI
Regulations in respect of employees of the Company,
is enclosed herewith as Annexure–5.

19ANNUAL REPORT 2017-18
CORPORATE REVIEW FINANCIAL STATEMENTSSTATUTORY REPORTS
Directors and Key Managerial Personnel:A) Changes in Directors and Key Managerial
Personnel: During the year under review, the Board of
Directors appointed Mr. Saurabh Srivastava and
Mr. Subramaniam Ramnath Iyer as Non-Executive
Independent Directors for a period of five years
with effect from August 30, 2017 and November
22, 2017 respectively, subject to the approval of
shareholders at the ensuing 26th Annual General
Meeting of the Company.
Mr. Sudhir Kumar Sethi and Mr. Sunil Kumar
Kolangara who were appointed as Nominee
Directors on behalf of IDGVI and Ascent Capital
respectively, ceased to be Directors of the
Company on September 18, 2017, consequent
to the withdrawal of their nomination. Mr. Mohit
Goyal has resigned from the Board of the
Company on November 22, 2017.
Pursuant to the provisions of Section 152 of
the Companies Act, 2013, Mr. T.S. Varadarajan,
Whole-time Director of the Company is liable to
retire by rotation at the ensuing Annual General
Meeting and being eligible, seeks re-appointment
in the ensuing Annual General Meeting.
KMPs and Senior Management Personnel of the
Company are:
1. Mr. Diwakar Nigam – Chairman & Managing
Director
2. Mr. T.S. Varadarajan – Whole-time Director
3. Ms. Priyadarshini Nigam - Whole-time
Director
4. Mr. Surender Jeet Raj - Sr. Vice President
(HR Operations)
5. Mr. Virender Jeet - Sr. Vice President (Sales
and Marketing/Product)
6. Mr. Tarun Nandwani - Vice President
(Customer Relations/Delivery)
7. Mr. Arun Kumar Gupta – Chief Financial
Officer
8. Mr. Aman Mourya - Company Secretary &
Compliance Officer
B) Declaration by Independent Director(s) and re- appointment, if any:
The Independent Directors have submitted
required declarations that they fulfill the
requirements as stipulated in Section 149(6)
of the Companies Act, 2013 and SEBI (LODR)
Regulations. Pursuant to Clause VII (1) of
Schedule IV of the Companies Act, 2013. The
Independent Directors had a separate meeting
on April 25, 2017 during Financial Year 2017-18.
C) Board Annual Evaluation: Pursuant to the provisions of the Companies
Act, 2013 and Regulation of SEBI (LODR)
Regulations, the Board has carried out the annual
performance evaluation of its own performance,
Board Committee(s) and that of the Individual
Director(s). The performance of the Board was
evaluated by the Board itself after seeking inputs
from all the individual directors on the basis
of criteria such as structure & composition of
Board Culture, effectiveness of Board processes,
functioning, execution and performance of
specific duties, obligations and governance etc.
The performance of all the Committees was
evaluated by the Board after seeking inputs from
respective Committee members. The manner in
which the annual performance evaluation has
been stated in the Corporate Governance Report
which forms a part of this Report.
In a separate meeting of Independent Directors
held on 16th May 2018, performance of the non-
independent directors, performance of the Board
as a whole and performance of the Chairman
was evaluated, taking into account the views of
executive directors and non-executive directors.
D) Remuneration Policy: The Board, on the recommendation of the
Nomination & Remuneration Committee framed
a policy for selection and appointment of
Directors, Senior Management Personnel and their
remuneration. The Policy is available on the website
of the Company at https://newgensoft.com. and is
enclosed with this report as Annexure–6.
E) Meetings: The number of meetings of the Board and
various Committees of your Company are set out
in the Corporate Governance Report which forms
part of this Report. The intervening gap between
Board Meetings was within the period prescribed
under the provisions of Section 173 of the Act
and the SEBI (LODR) Regulations.
Whistle Blower Policy / Vigil Mechanism for Directors and Employees:The Company has adopted a Whistle Blower Policy
and Vigil Mechanism that provides a mechanism to
report violations, any unethical behaviour, suspected
or actual fraud, violation of the Code of Conduct
etc. During the year under review no case has been
reported under Whistle Blower Policy of the Company.
Whistle Blower Policy / Vigil Mechanism is available on
the website of the Company at https://newgensoft.com.

20 Newgen Software Technologies Limited
CSR Initiative:The brief outline of the Corporate Social Responsibility
(CSR) policy of the Company and the initiatives
undertaken by the Company on CSR activities during
the year are set out in Annexure-7 of this report in
the format prescribed in the Companies (Corporate
Social Responsibility Policy) Rules, 2014. As part of
its initiatives under “Corporate Social Responsibility
(CSR), the Company has undertaken projects in
the areas of Digital Literacy Education, Livelihood,
besides personality development of the students.
Other details regarding Company’s CSR activities
and CSR Policy are available on the website of the
Company at https://newgensoft.com.
Risk Management:The Company has framed a Risk Management Policy
and plan for enabling the Company to identify
elements of major risks as contemplated by the
provisions of Section 134 of the Companies Act 2013.
The Company recognizes that these risks need to
be managed and mitigated to protect the interest of
the stakeholders and to achieve business objectives.
This risk management policy is aimed at effectively
mitigating the Company’s various business and
operational risks, through strategic action plan.
Internal Control Systems and their Adequacy:Your Company has in place adequate Internal Financial
Controls. The Report on Internal Financial Controls
issued by the Statutory Auditor is attached with the
Auditor Report on the Financial Statements of the
Company and it does not report any weakness. Your
Board has also reviewed the internal processes, systems
and the internal financial and operational controls were
also tested by Grant Thornton, Internal Auditor on behalf
of the Board. The Directors’ Responsibility Statement
contains a confirmation as regards adequacy of the
internal financial and controls. For more details, please
refer MD&A section.
Corporate Governance:Your Company is committed to maintain the highest
standards of the Corporate Governance and adhere
to the Corporate Governance requirements as set
out by SEBI. The report on Corporate Governance
as stipulated under the SEBI (LODR) Regulations
forms an integral part of this Report and the same
is enclosed herewith as Annexure – 8. The requisite
certificate from Independent Company Secretaries
confirming compliances with the conditions of
Corporate Governance is also attached with the
Corporate Governance Report.
Management Discussion and Analysis:The Management Discussion and Analysis (MD&A),
highlighting the important aspects of the business
of the Company is enclosed as Annexure 9 to
this Report.
Particulars of Loans, Guarantees or Investments Under Section 186 of the Companies Act, 2013:The Company has not given any loans or guarantees
covered under the provisions of Section 186 of the
Companies Act, 2013. The details of the investments
made by Company have been set out in the financial
statements.
Particulars of Contracts or Arrangements with Related Parties:All Related Party Transactions with the subsidiary
Companies are on an arm’s length basis and were
in the ordinary course of business. Information
on transactions with related parties pursuant to
section 134(3)(h) of Companies Act, 2013 read with
rule 8(2) of Companies (Accounts) Rules, 2014 are
given in Annexure–10 in form AOC-2.
Conservation of Energy, Technology Absorption and Foreign Exchange Earnings and Outgo:The particulars as prescribed under section 134 of
the Companies Act, 2013, read with the Companies
(Accounts) Rules, 2014 are as follows:
a) Details of Conservation of energy The operations of your Company do not
consume high levels of energy. Nevertheless,
adequate measures have been taken to
conserve energy by using energy-efficient
computers and related equipment with the
latest technologies. Your Company is on a
constant look out for newer and efficient energy
conservation technologies and introduces them
appropriately. As the cost of energy consumed
by your Company forms a very small portion of
the total costs, the impact of changes in energy
cost on total costs is not significant.
b) Research and Development: The Company has made and will continue
to make, significant investments in software
product research and development and related
product opportunities. For fiscals 2017, 2016
and 2015, the Company spent 8.55%, 7.92% and
7.91% (as a proportion of our total expenditure)
respectively on research and development.
For fiscal 2018 under review, the Company
had spent 8.67% (as a proportion of the total
expenditure) on research and development.
We believe that the industry, in which we
compete, witnesses rapid technological
advances in software development due to
constantly evolving customer preferences
and requirements. The Company believes that
emphasis on R&D has enabled us to remain up-
to-date with the technological developments,
as well as to cater to the evolving needs of
our customers.
21ANNUAL REPORT 2017-18
CORPORATE REVIEW FINANCIAL STATEMENTSSTATUTORY REPORTS
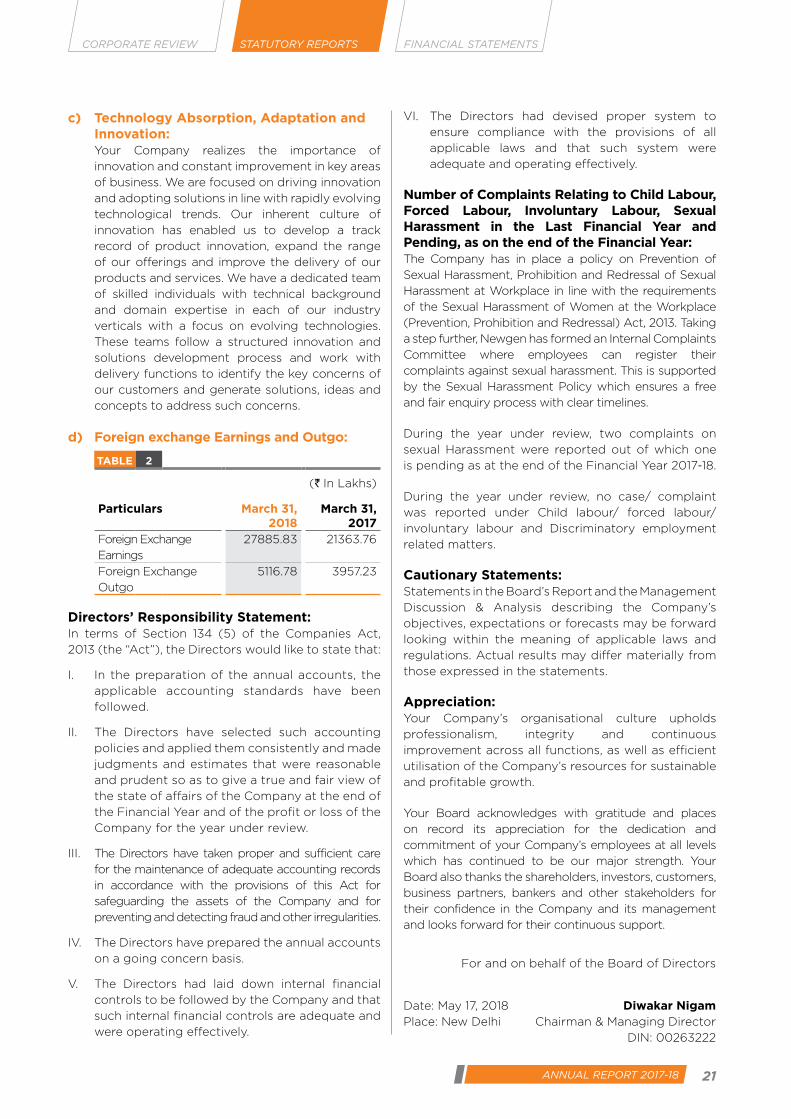
c) Technology Absorption, Adaptation and Innovation:
Your Company realizes the importance of
innovation and constant improvement in key areas
of business. We are focused on driving innovation
and adopting solutions in line with rapidly evolving
technological trends. Our inherent culture of
innovation has enabled us to develop a track
record of product innovation, expand the range
of our offerings and improve the delivery of our
products and services. We have a dedicated team
of skilled individuals with technical background
and domain expertise in each of our industry
verticals with a focus on evolving technologies.
These teams follow a structured innovation and
solutions development process and work with
delivery functions to identify the key concerns of
our customers and generate solutions, ideas and
concepts to address such concerns.
d) Foreign exchange Earnings and Outgo:
TABLE 2
(` In Lakhs)
Particulars March 31, 2018
March 31, 2017
Foreign Exchange
Earnings
27885.83 21363.76
Foreign Exchange
Outgo
5116.78 3957.23
Directors’ Responsibility Statement:In terms of Section 134 (5) of the Companies Act,
2013 (the “Act”), the Directors would like to state that:
I. In the preparation of the annual accounts, the
applicable accounting standards have been
followed.
II. The Directors have selected such accounting
policies and applied them consistently and made
judgments and estimates that were reasonable
and prudent so as to give a true and fair view of
the state of affairs of the Company at the end of
the Financial Year and of the profit or loss of the
Company for the year under review.
III. The Directors have taken proper and sufficient care
for the maintenance of adequate accounting records
in accordance with the provisions of this Act for
safeguarding the assets of the Company and for
preventing and detecting fraud and other irregularities.
IV. The Directors have prepared the annual accounts
on a going concern basis.
V. The Directors had laid down internal financial
controls to be followed by the Company and that
such internal financial controls are adequate and
were operating effectively.
VI. The Directors had devised proper system to
ensure compliance with the provisions of all
applicable laws and that such system were
adequate and operating effectively.
Number of Complaints Relating to Child Labour, Forced Labour, Involuntary Labour, Sexual Harassment in the Last Financial Year and Pending, as on the end of the Financial Year:The Company has in place a policy on Prevention of
Sexual Harassment, Prohibition and Redressal of Sexual
Harassment at Workplace in line with the requirements
of the Sexual Harassment of Women at the Workplace
(Prevention, Prohibition and Redressal) Act, 2013. Taking
a step further, Newgen has formed an Internal Complaints
Committee where employees can register their
complaints against sexual harassment. This is supported
by the Sexual Harassment Policy which ensures a free
and fair enquiry process with clear timelines.
During the year under review, two complaints on
sexual Harassment were reported out of which one
is pending as at the end of the Financial Year 2017-18.
During the year under review, no case/ complaint
was reported under Child labour/ forced labour/
involuntary labour and Discriminatory employment
related matters.
Cautionary Statements:Statements in the Board’s Report and the Management
Discussion & Analysis describing the Company’s
objectives, expectations or forecasts may be forward
looking within the meaning of applicable laws and
regulations. Actual results may differ materially from
those expressed in the statements.
Appreciation:Your Company’s organisational culture upholds
professionalism, integrity and continuous
improvement across all functions, as well as efficient
utilisation of the Company’s resources for sustainable
and profitable growth.
Your Board acknowledges with gratitude and places
on record its appreciation for the dedication and
commitment of your Company’s employees at all levels
which has continued to be our major strength. Your
Board also thanks the shareholders, investors, customers,
business partners, bankers and other stakeholders for
their confidence in the Company and its management
and looks forward for their continuous support.
For and on behalf of the Board of Directors
Date: May 17, 2018 Diwakar NigamPlace: New Delhi Chairman & Managing Director
DIN: 00263222

22 Newgen Software Technologies Limited
Annexure 1
Form AOC-I(Pursuant to first proviso to sub-Section (3) of Section 129 read with Rule 5
of Companies (Accounts) Rules, 2014)
Statement containing salient features of the financial statement of
subsidiaries/ associate companies/ joint ventures
Part “A”: Subsidiaries((Information in respect of each subsidiary to be presented with amounts in ` (in Lakhs)
TABLE 3
1 S. No. 1 2 3 4 5Name of the subsidiary
Newgen Computers
Technologies Ltd
Newgen Software
Technologies (UK) Ltd.
Newgen Software Inc.
USA,
Newgen Software
Technologies Canada Ltd
Newgen Software
Technologies Pte. Ltd
(Singapore)
Reporting period
for the subsidiary
concerned, if different
from the holding
company’s reporting
period
– – – – –
Reporting currency
and Exchange rate
as on the last date of
the relevant Financial
Year in the case of
foreign subsidiaries.
INR GBP @
92.28
USD @
65.04
CAD @
50.51
SGD @
49.68
Share capital 21.00 184.56 780.48 50.51 124.20
Reserves & surplus 36.91 8.13 76.20 52.93 81.19
Total assets 60.24 314.56 4418.03 566.89 584.98
Total Liabilities 2.33 121.87 3561.35 463.45 379.59
Investments 0.00 0.00 0.00 0.00 0.00
Turnover 0.00 317.24 10873.47 957.93 1224.65
Profit before taxation 5.73 -2.69 248.76 26.76 28.16
Provision for taxation 1.50 -0.44 67.38 7.18 1.89
Profit after taxation 4.22 -2.25 181.39 19.58 26.26
Proposed Dividend - - - - -
% of shareholding 100% 100% 100% 100% 100%
2 Names of subsidiaries which are yet to commence operations Not Applicable
3 Names of subsidiaries which have been liquidated or sold during the year. Not Applicable

23ANNUAL REPORT 2017-18
CORPORATE REVIEW FINANCIAL STATEMENTSSTATUTORY REPORTS
Part “B”: Associates and Joint VenturesStatement pursuant to Section 129 (3) of the Companies Act, 2013 related to
Associate Companies and Joint Ventures
Name of Associates/Joint Ventures There are no associates or joint venture of the Company During the year
1. Latest audited Balance Sheet Date - NA
2. Shares of Associate/Joint Ventures held by the company on the year end - NA
Amount of Investment in Associates/Joint Venture - NA
Extend of Holding % - NA
3. Description of how there is significant influence - NA
4. Reason why the associate/joint venture is not consolidated - NA
5. Networth attributable to Shareholding as per latest audited Balance Sheet - NA
6. Profit / Loss for the year - NA
i. Considered in Consolidation - NA
ii. Not Considered in Consolidation - NA
1. Names of associates or joint ventures which are yet to commence operations - NA
2. Names of associates or joint ventures which have been liquidated or sold during the year. - NA
For and on behalf of the Board of Directors
Diwakar Nigam T. S. Varadarajan Arun Kumar Gupta Aman Mourya
Date: May 17, 2018 Managing Director Whole Time Director Chief Financial Officer Company Secretary
Place: New Delhi DIN: 00263222 DIN: 00263115 PAN: ADTPG6017D ACS: 27299
24 Newgen Software Technologies Limited
Annexure 2
SECRETARIAL AUDIT REPORT(For the Financial Year ended 31.03.2018)
[Pursuant to section 204(1) of the Companies Act, 2013 and Rule 9 of the Companies
(Appointment and Remuneration of Managerial Personnel) Rules, 2014]
To
The Members,
Newgen Software Technologies LimitedA-6, Satsang Vihar Marg, Qutab Institutional Area
New Delhi- 110067
We have conducted the Secretarial Audit of the
compliance of applicable statutory provisions and the
adherence to good corporate practices by Newgen
Software Technologies Limited (hereinafter called
the ‘Company’). Secretarial Audit was conducted
in a manner that provided us a reasonable basis
for evaluating the corporate conducts/statutory
compliances and expressing our opinion, subject to
Annexure ‘A’ to this report, thereon.
Based on our verification of the Company’s books,
papers, minute books, forms and returns filed and
other records maintained by the Company and also
the information provided by the Company, its officers,
agents and authorised representatives during the
conduct of secretarial audit, we hereby report that in
our opinion the Company has, during the audit period
covering the Financial Year ended on March 31, 2018
(‘audit period’) complied with the statutory provisions
listed hereunder and also that the Company has
proper Board processes and compliance-mechanism
in place to the extent, in the manner and subject to
the reporting made hereinafter:
We have examined the books, papers, minute books,
forms and returns filed and other records maintained
by the Company for the Financial Year ended on
March 31, 2018. According to the provisions of:
(i) The Companies Act, 2013 (the ‘Act’) and the rules
made thereunder;
(ii) The Securities Contracts (Regulation) Act, 1956
(‘SCRA’) and the rules made thereunder;
(iii) The Depositories Act, 1996 and the Regulations
and Bye laws framed thereunder;
(iv) Foreign Exchange Management Act, 1999 and
the rules and regulations made thereunder to the
extent of Foreign Direct Investment, Overseas
Direct Investment and External Commercial
Borrowings;
(v) The following Regulations and Guidelines
prescribed under the Securities and Exchange
Board of India Act, 1992 (‘SEBI Act’):
a. The Securities and Exchange Board of
India (Substantial Acquisition of Shares and
Takeovers) Regulations, 2011;
b. The Securities and Exchange Board of India
(Prohibition of Insider Trading) Regulations,
2015;
c. The Securities and Exchange Board of
India (Issue of Capital and Disclosure
Requirements) Regulations, 2009;
d. The Securities and Exchange Board of
India (Share Based Employee Benefits)
Regulations, 2014;
e. The Securities and Exchange Board of
India (Issue and Listing of Debt Securities)
Regulations, 2008 [Not Applicable];
f. The Securities and Exchange Board of India
(Registrars to an Issue and Share Transfer
Agents) Regulations, 1993 regarding the
Companies Act and dealing with client [Not
Applicable];
g. The Securities and Exchange Board of India
(Delisting of Equity Shares) Regulations,
2009 [Not applicable];
h. The Securities and Exchange Board of India
(Buyback of Securities) Regulations, 1998
[Not applicable].
25ANNUAL REPORT 2017-18
CORPORATE REVIEW FINANCIAL STATEMENTSSTATUTORY REPORTS
(vi) The company carries business of software
development and related activities for which
it has registration with the SEZ Noida and the
Management has identified and confirmed the
following laws as specifically applicable to the
Company:
a) The Information Technology Act, 2000;
b) The Special Economic Zone Act, 2005;
c) The Indian Copyright Act, 1957;
d) The Patents Act, 1970; and
e) The Trade Marks Act, 1999.
We have also examined compliance with the
applicable clauses of the following:
(i) Secretarial Standards with regard to Meeting of
Board of Directors (SS-1) and General Meetings
(SS-2) issued by The Institute of Company
Secretaries of India;
(ii) The Listing Agreements entered into by the
Company with Bombay Stock Exchange Limited
(BSE) and National Stock Exchange of India
Limited (NSE) and SEBI (Listing Obligations and
Disclosure Requirements) Regulations, 2015.
During the period under review, the Company has
complied with the provisions of the Acts, Rules,
Regulations, Guidelines, Standards, etc., mentioned
above.
We further report that:-
§ The Board of directors of the Company is
duly constituted with proper balance of
Executive Directors, Non-executive Directors
and Independent Directors. The changes in
the composition of the Board of Directors that
took place during the audit period were carried
out in compliance with the provisions of the
Act, however, the change in the appointment
of two Independent Directors is subject to the
ratification/approval by the members of the
Company at ensuing Annual General Meeting.
Place: New Delhi Name of Firm : Aijaz & Associates
Date : May 04, 2018 FCS No. : 6563
C.P. No. : 7040
§ Advance notice is given to all directors to schedule
the Board Meetings, agenda and detailed notes
on agenda were sent at least seven days in
advance, and a system exists for seeking and
obtaining further information and clarifications
on the agenda items before the meeting and for
meaningful participation at the meeting.
§ All decisions at Board Meetings and Committee
Meetings are carried out unanimously as recorded
in the minutes of the meetings of the Board or
Committees of the Board, as the case may be.
We further report that there are adequate systems
and processes in the Company commensurate with
the size and operations of the Company to monitor
and ensure compliance with applicable laws, rules,
regulations and guidelines.
We further report that during the audit period the
Company has:
i) Pursuant to the resolution passed by the Board
at its meeting held on January 24, 2018, allotment
of 38,77,551 Equity Shares of the face value of
10/- (Rupees Ten Only) @ ` 245/- per Equity
share (including a premium of ` 235/- per Equity
Share) was made through IPO of the Company,
which were listed on National Stock Exchange of
India (“NSE”) & Bombay Stock Exchange of India
(“BSE”) w.e.f. January 29, 2018.
ii) Increased Authorised Share Capital from
` 76,40,00,000 to ` 1,10,00,00,000.
iii) Increased paid up share capital by public issue to
the tune of ` 3,87,75,510/-.
iv) Declared and distributed dividend at the 25th
Annual General Meeting held on July 28, 2017
@ ` 1.5 per share.
v) Altered its MoA and AoA according to the above
events.

26 Newgen Software Technologies Limited
Place: New Delhi Name of Firm : Aijaz & Associates
Date : May 04, 2018 FCS No. : 6563
C.P. No. : 7040
Annexure ‘A’
To,
The Members,
Newgen Software Technologies LimitedNew Delhi
Our report of even date is to be read along with this Annexure.
1. Maintenance of secretarial record is the responsibility of the management of the Company. Our responsibility
is to express an opinion on these secretarial records based on our audit.
2. We have followed the audit practices and processes as were appropriate to obtain reasonable assurance
about the correctness of the contents of the secretarial records. The verification was done on test basis to
ensure that correct facts are reflected in secretarial records. We believe that the processes and practices,
we followed provide a reasonable basis for our opinion.
3. We have not verified the correctness and appropriateness of financial records and books of accounts of the
Company.
4. Where ever required, we have obtained the Management Representation about the compliance of laws,
rules and regulations and happening of events, etc.
5. The compliance of the provisions of corporate and other applicable laws, rules, regulations, standards is the
responsibility of management. Our examination was limited to the verification of procedures on test basis.
6. The Secretarial Audit report is neither an assurance as to the future viability of the Company nor of the
efficacy or effectiveness with which the management has conducted the affairs of the Company.
27ANNUAL REPORT 2017-18
CORPORATE REVIEW FINANCIAL STATEMENTSSTATUTORY REPORTS
Annexure 3
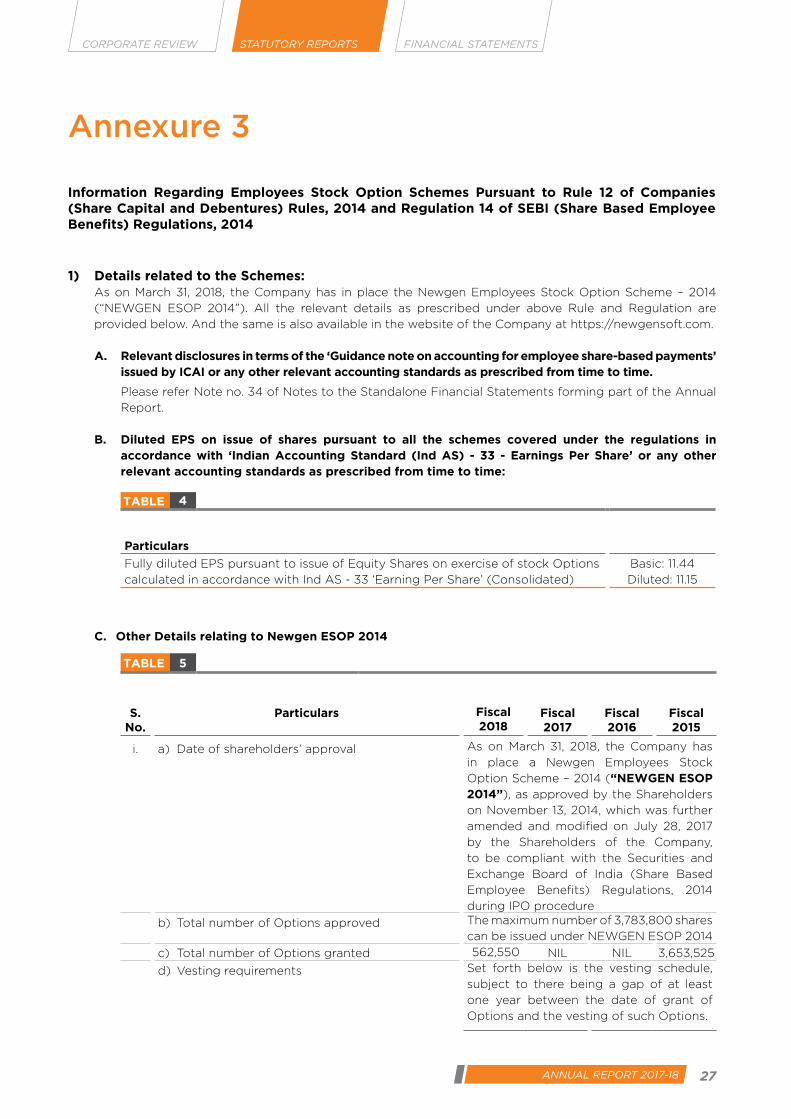
Information Regarding Employees Stock Option Schemes Pursuant to Rule 12 of Companies (Share Capital and Debentures) Rules, 2014 and Regulation 14 of SEBI (Share Based Employee Benefits) Regulations, 2014
1) Details related to the Schemes: As on March 31, 2018, the Company has in place the Newgen Employees Stock Option Scheme – 2014
(“NEWGEN ESOP 2014”). All the relevant details as prescribed under above Rule and Regulation are
provided below. And the same is also available in the website of the Company at https://newgensoft.com.
A. Relevant disclosures in terms of the ‘Guidance note on accounting for employee share-based payments’ issued by ICAI or any other relevant accounting standards as prescribed from time to time.
Please refer Note no. 34 of Notes to the Standalone Financial Statements forming part of the Annual
Report.
B. Diluted EPS on issue of shares pursuant to all the schemes covered under the regulations in accordance with ‘Indian Accounting Standard (Ind AS) - 33 - Earnings Per Share’ or any other relevant accounting standards as prescribed from time to time:
TABLE 4
Particulars
Fully diluted EPS pursuant to issue of Equity Shares on exercise of stock Options
calculated in accordance with Ind AS - 33 ‘Earning Per Share’ (Consolidated)
Basic: 11.44
Diluted: 11.15
C. Other Details relating to Newgen ESOP 2014
TABLE 5
S. No.
Particulars Fiscal 2018
Fiscal 2017
Fiscal 2016
Fiscal 2015
i. a) Date of shareholders’ approval As on March 31, 2018, the Company has
in place a Newgen Employees Stock
Option Scheme – 2014 (“NEWGEN ESOP 2014”), as approved by the Shareholders
on November 13, 2014, which was further
amended and modified on July 28, 2017
by the Shareholders of the Company,
to be compliant with the Securities and
Exchange Board of India (Share Based
Employee Benefits) Regulations, 2014
during IPO procedure
b) Total number of Options approved The maximum number of 3,783,800 shares
can be issued under NEWGEN ESOP 2014
c) Total number of Options granted 562,550 NIL NIL 3,653,525
d) Vesting requirements Set forth below is the vesting schedule,
subject to there being a gap of at least
one year between the date of grant of
Options and the vesting of such Options.
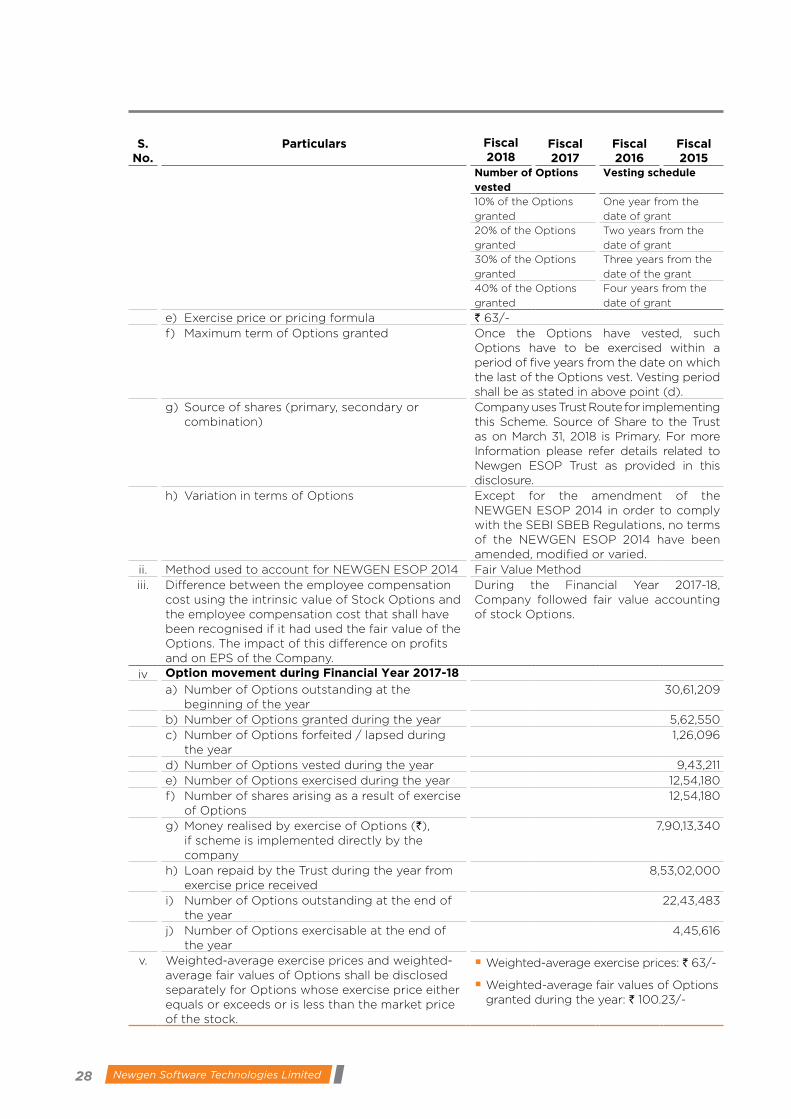
28 Newgen Software Technologies Limited
S. No.
Particulars Fiscal 2018
Fiscal 2017
Fiscal 2016
Fiscal 2015
Number of Options vested
Vesting schedule
10% of the Options
granted
One year from the
date of grant
20% of the Options
granted
Two years from the
date of grant
30% of the Options
granted
Three years from the
date of the grant
40% of the Options
granted
Four years from the
date of grant
e) Exercise price or pricing formula ` 63/-f) Maximum term of Options granted Once the Options have vested, such
Options have to be exercised within a period of five years from the date on which the last of the Options vest. Vesting period shall be as stated in above point (d).
g) Source of shares (primary, secondary or combination)
Company uses Trust Route for implementing this Scheme. Source of Share to the Trust as on March 31, 2018 is Primary. For more Information please refer details related to Newgen ESOP Trust as provided in this disclosure.
h) Variation in terms of Options Except for the amendment of the NEWGEN ESOP 2014 in order to comply with the SEBI SBEB Regulations, no terms of the NEWGEN ESOP 2014 have been amended, modified or varied.
ii. Method used to account for NEWGEN ESOP 2014 Fair Value Methodiii. Difference between the employee compensation
cost using the intrinsic value of Stock Options and the employee compensation cost that shall have been recognised if it had used the fair value of the Options. The impact of this difference on profits and on EPS of the Company.
During the Financial Year 2017-18, Company followed fair value accounting of stock Options.
iv Option movement during Financial Year 2017-18
a) Number of Options outstanding at the beginning of the year
30,61,209
b) Number of Options granted during the year 5,62,550c) Number of Options forfeited / lapsed during
the year1,26,096
d) Number of Options vested during the year 9,43,211e) Number of Options exercised during the year 12,54,180f) Number of shares arising as a result of exercise
of Options12,54,180
g) Money realised by exercise of Options (`), if scheme is implemented directly by the company
7,90,13,340
h) Loan repaid by the Trust during the year from exercise price received
8,53,02,000
i) Number of Options outstanding at the end of the year
22,43,483
j) Number of Options exercisable at the end of the year
4,45,616
v. Weighted-average exercise prices and weighted-average fair values of Options shall be disclosed separately for Options whose exercise price either equals or exceeds or is less than the market price of the stock.
§ Weighted-average exercise prices: ` 63/-
§ Weighted-average fair values of Options granted during the year: ` 100.23/-
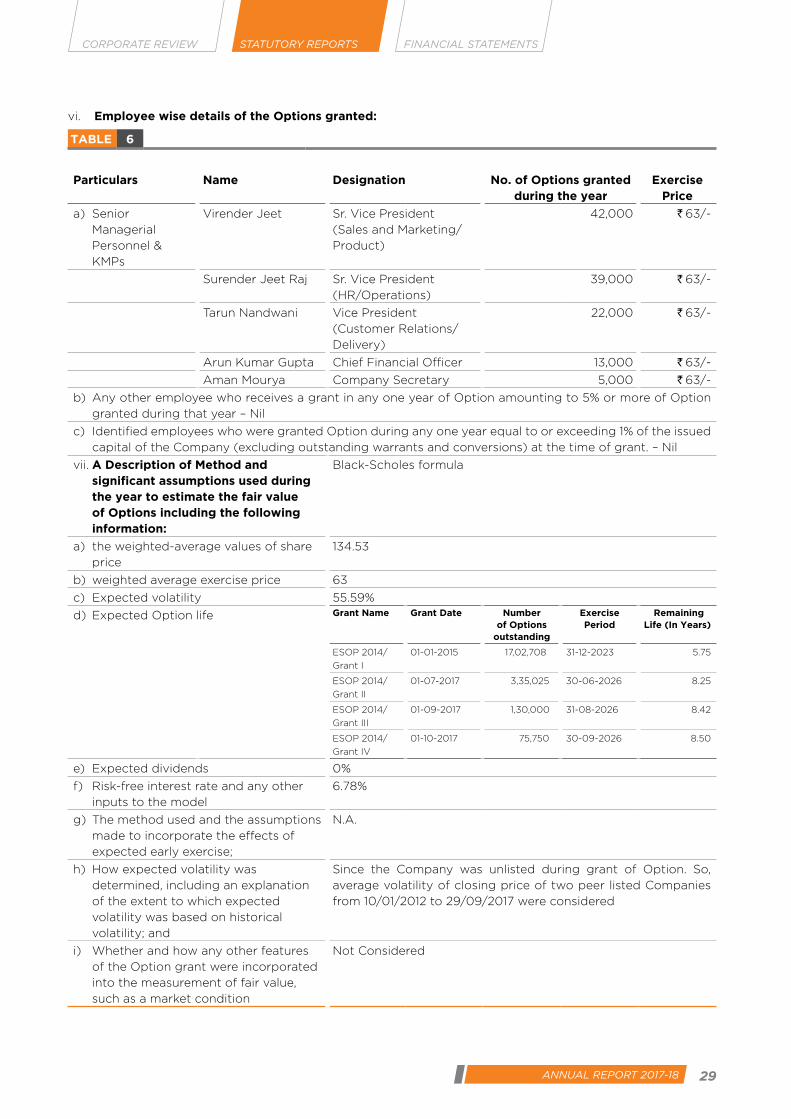
29ANNUAL REPORT 2017-18
CORPORATE REVIEW FINANCIAL STATEMENTSSTATUTORY REPORTS
vi. Employee wise details of the Options granted:
TABLE 6
Particulars Name Designation No. of Options granted during the year
Exercise Price
a) Senior
Managerial
Personnel &
KMPs
Virender Jeet Sr. Vice President
(Sales and Marketing/
Product)
42,000 ` 63/-
Surender Jeet Raj Sr. Vice President
(HR/Operations)
39,000 ` 63/-
Tarun Nandwani Vice President
(Customer Relations/
Delivery)
22,000 ` 63/-
Arun Kumar Gupta Chief Financial Officer 13,000 ` 63/-
Aman Mourya Company Secretary 5,000 ` 63/-
b) Any other employee who receives a grant in any one year of Option amounting to 5% or more of Option
granted during that year – Nil
c) Identified employees who were granted Option during any one year equal to or exceeding 1% of the issued
capital of the Company (excluding outstanding warrants and conversions) at the time of grant. – Nil
vii. A Description of Method and significant assumptions used during the year to estimate the fair value of Options including the following information:
Black-Scholes formula
a) the weighted-average values of share
price
134.53
b) weighted average exercise price 63
c) Expected volatility 55.59%
d) Expected Option life Grant Name Grant Date Number of Options
outstanding
Exercise Period
Remaining Life (In Years)
ESOP 2014/
Grant I
01-01-2015 17,02,708 31-12-2023 5.75
ESOP 2014/
Grant II
01-07-2017 3,35,025 30-06-2026 8.25
ESOP 2014/
Grant III
01-09-2017 1,30,000 31-08-2026 8.42
ESOP 2014/
Grant IV
01-10-2017 75,750 30-09-2026 8.50
e) Expected dividends 0%
f) Risk-free interest rate and any other
inputs to the model
6.78%
g) The method used and the assumptions
made to incorporate the effects of
expected early exercise;
N.A.
h) How expected volatility was
determined, including an explanation
of the extent to which expected
volatility was based on historical
volatility; and
Since the Company was unlisted during grant of Option. So,
average volatility of closing price of two peer listed Companies
from 10/01/2012 to 29/09/2017 were considered
i) Whether and how any other features
of the Option grant were incorporated
into the measurement of fair value,
such as a market condition
Not Considered

30 Newgen Software Technologies Limited
Disclosure under Newgen ESOP Scheme 1999 and Newgen ESOP Scheme 2000
Under NEWGEN ESOP SCHEME 1999 a maximum
of 2,93,160 Options could be granted to eligible
employees, determined in terms of the NEWGEN
ESOP SCHEME 1999, convertible into 2,93,160 Equity
Shares. Subsequently, additional Options were made
available under the NEWGEN ESOP SCHEME 1999 to
give effect to the bonus issue by the Company and,
accordingly, an aggregate of 7,33,610 Options were
available for grant under the NEWGEN ESOP SCHEME
1999, which were convertible into 7,33,610 Equity
Shares. Our Company has granted an aggregate
of 6,82,400 Employee Stock Options under the
NEWGEN ESOP SCHEME 1999 to eligible employees
(after adjusting bonus stock Option), of which,
cumulatively, 2,46,160 Options were exercised and
consequently, 2,46,160 Equity Shares were transferred
from the Newgen Employees Trust to such eligible
employees at an exercise price of ` 80.00, which
was further adjusted due to bonus Option issue, per
Equity Share. Further, 2,41,950 Options granted under
the NEWGEN ESOP SCHEME 1999 lapsed. Prior to
IPO and as on the date of filing RHP, the NEWGEN
ESOP SCHEME 1999 has been closed, no Options
granted thereunder are outstanding and no additional
Options will be granted by our Company under the
NEWGEN ESOP SCHEME 1999.
Under NEWGEN ESOP SCHEME 2000 a maximum
of 6,00,000 Options could be granted to eligible
employees, determined in terms of the NEWGEN
ESOP SCHEME 2000, convertible into 6,00,000 Equity
Shares on exercise of such Options, as permitted in the
Scheme. Further, all Options that were outstanding,
including Options that had not been granted or had
been granted but not exercised under the NEWGEN
ESOP SCHEME 1999, whether outstanding as on
date of or any future date were made available under
NEWGEN ESOP SCHEME 2000, and consequently,
an aggregate of 8,62,850 Options were available
for grant under the NEWGEN ESOP SCHEME 2000.
Subsequently, additional Options were made available
under the NEWGEN ESOP Scheme 2000 to give effect
to the bonus issue by the Company and, accordingly,
an aggregate of 12,92,300 Options were available
for grant under the NEWGEN ESOP SCHEME 1999,
which were convertible into 12,92,300 Equity Shares.
Our Company has granted an aggregate of 15,55,150
Options under the NEWGEN ESOP SCHEME 2000
to eligible employees (after adjusting bonus stock
Option), of which 9,48,170 Options were exercised
and 9,48,170 Equity Shares were transferred from the
Newgen Employees Trust to such eligible employees
at an exercise price of ` 40 per Equity Share, which
was further adjusted pursuant to a bonus issue by our
Company. Prior to IPO and as on the date of RHP, the
NEWGEN ESOP SCHEME 2000 has been closed, no
Options are outstanding and no additional Options
will be granted by our Company under the NEWGEN
ESOP SCHEME 2000.
Furtherance to the above, no Option was granted
under (“NEWGEN ESOP SCHEME 1999”) and
(“NEWGEN ESOP SCHEME 2000”), in three years
prior to IPO and all the Options granted under these
two schemes were exercised or lapsed. Prior to IPO,
both the schemes were closed and no Option was
outstanding under these schemes.
A. Other Details relating to Newgen ESOP 2000 and Newgen ESOP 1999
TABLE 7
S. No.
Particulars Fiscal 2018
Fiscal 2017
Fiscal 2016
Fiscal 2015
i. a) Date of shareholders’ approval NEWGEN ESOP SCHEME 1999:
February 20, 1999
NEWGEN ESOP SCHEME 2000:
May 5, 2000
b) Total number of Options approved As explained above in the brief description
of the respective Schemes.
c) Total number of Options granted No Option was granted under (“NEWGEN
ESOP 1999”) and (“NEWGEN ESOP 2000”),
in three years prior to IPO.
d) Vesting requirements Set forth below is the vesting schedule,
subject to there being a gap of at least
one year between the date of grant of
Options and the vesting of such Options.

31ANNUAL REPORT 2017-18
CORPORATE REVIEW FINANCIAL STATEMENTSSTATUTORY REPORTS
S. No.
Particulars Fiscal 2018
Fiscal 2017
Fiscal 2016
Fiscal 2015
Number of Options vested
Vesting schedule
10% of the Options
granted
One year from the
date of grant
20% of the Options
granted
Two years from the
date of grant
30% of the Options
granted
Three years from the
date of the grant
40% of the Options
granted
Four years from the
date of grant
e) Exercise price or pricing formula As explained above in brief description of the respected schemes.
f) Maximum term of Options granted Prior to IPO, both the schemes were closed and no Option was outstanding under these schemes
g) Source of shares (primary, secondary or combination)
Company used Trust Route for implementing this Scheme.
h) Variation in terms of Options No variation. ii. Method used to account for NEWGEN ESOP 1999
& 2000 SchemesIntrinsic value Method. No cost impact in the Financial Year 2017-18
iii. Difference between the employee compensation cost using the intrinsic value of stock Options and the employee compensation cost that shall have been recognised if it had used the fair value of the Options. The impact of this difference on profits and on EPS of the Company.
During the Financial Year 2017-18, Company followed fair value accounting of stock Options.
iv Option movement during Financial Year 2017-18
a) Number of Options outstanding at the beginning of the year
Newgen ESOP 1999: 52600
Newgen ESOP 2000: 386700b) Number of Options granted during the year NILc) Number of Options forfeited / lapsed during
the yearNIL
d) Number of Options vested during the year NILe) Number of Options exercised during the year Newgen ESOP 1999: 52600
Newgen ESOP 2000:386700f) Number of shares arising as a result of exercise
of Options Newgen ESOP 1999: 52600
Newgen ESOP 2000: 386700g) Money realised by exercise of Options (`),
if scheme is implemented directly by the company
Newgen ESOP 1999: 233807
Newgen ESOP 2000: 2578129
h) Loan repaid by the Trust during the year from exercise price received
N.A.
i) Number of Options outstanding at the end of the year
Newgen ESOP 1999: Nil
Newgen ESOP 2000: Nilj) Number of Options exercisable at the end of
the year Newgen ESOP 1999: Nil
Newgen ESOP 2000: Nilv. Weighted-average exercise prices and weighted-
average fair values of Options shall be disclosed separately for Options whose exercise price either equals or exceeds or is less than the market price of the stock.
Newgen ESOP 1999
Weighted-average exercise prices: ` 4.45
Newgen ESOP 2000:
Weighted-average exercise prices: ` 6.67

32 Newgen Software Technologies Limited
vi. Employee wise details of the Option granted during the year:
TABLE 8
Particulars Name Designation No. of Options granted during the year
Exercise Price
a) Senior
Managerial
Personnel &
KMPs
NIL NIL NIL N.A.
b) Any other employee who receives a grant in any one year of Option amounting to 5% or more of Option
granted during that year – Nil
c) Identified employees who were granted Option during any one year equal to or exceeding 1% of the issued
capital of the Company (excluding outstanding warrants and conversions) at the time of grant. – Nil
vii. A Description of Method and significant assumptions used during the year to estimate the fair value of Options including the following information:
Note Applicable.
No cost impact in the Financial Year 2017-18
a) the weighted-average values of share
price
N.A.
b) weighted average exercise price Newgen ESOP 1999 Scheme: ` 4.45/-
Newgen ESOP 2000 Scheme: ` 6.67/-
c) Expected volatility N.A.
d) Expected Option life N.A.
e) Expected dividends NIL
f) Risk-free interest rate and any other
inputs to the model
NIL
g) The method used and the assumptions
made to incorporate the effects of
expected early exercise;
N.A.
h) How expected volatility was
determined, including an explanation
of the extent to which expected
volatility was based on historical
volatility; and
N.A.
i) whether and how any other features
of the Option grant were incorporated
into the measurement of fair value,
such as a market condition
N.A.
2) Details Related to Trust: Newgen ESOP 2014 will continue to be implemented through the Trust Route and accordingly Newgen
ESOP Trust was constituted for Newgen ESOP 2014. In Trust Route, the Trust will utilize the shares already
held by it and will acquire the shares of the Company either through fresh allotment from the Company or
by way of secondary acquisition including transfer of shares from any existing shareholder. Newgen ESOP
2000 and Newgen ESOP 1999, which were already been closed, were also implemented through trust route
and accordingly a Newgen Employees Trust was constituted to implement these two Schemes.

33ANNUAL REPORT 2017-18
CORPORATE REVIEW FINANCIAL STATEMENTSSTATUTORY REPORTS
(i) Details:
TABLE 9
S. No.
Particulars Newgen ESOP Trust(For Newgen ESOP 2014)
Newgen Employees Trust(For Newgen ESOP 2000 and Newgen ESOP 1999
1. Name of the Trust Newgen ESOP Trust Newgen Employees Trust
2. Details of the Trustee (s) Mr. A K Sharan
Mr. Arvind Kaul
Mr. A K Sharan
Mr. Arvind Kaul
3 Amount of Loan disbursed by the Company/ any company in the Group during the year
` 661.50 Lakhs NIL
4 Amount of loan outstanding (repayable to Company/ any company in the Group) as at the end of the year*
` 391.23 Lakhs NIL
5. Amount of Loan, if any, taken from any other sources for which the Company or any company in the group has provided any security or guarantee
NIL NIL
6. Any other Contribution made to the Trust during the year
NIL NIL
*excluding Interest of ` 53,52,899/- on Loan payable by Newgen ESOP Trust.
(ii) Brief details of transactions in shares by the Trust:
TABLE 10
S. No.
Particulars Newgen ESOP Trust
(For Newgen ESOP 2014)
Newgen Employees Trust
(for Newgen ESOP 2000 and Newgen ESOP 1999)
1. Number of shares held at the beginning of the year
15,32,384 4,62,680
2. Number of shares acquired during the year through (i) primary issuance (ii) secondary acquisition, also as a percentage of paid up equity capital as at the end of the Previous Financial Year, along with information on weighted average cost of acquisition per share;
Primary Issue: 10,50,000 (1.63% of paid up capital as at the end of the Previous Financial Year 2016-17.)
Weighted average cost of primary acquisition: ` 63/-
Shares obtained from Newgen Employees Trust: 23,380/-*
Secondary acquisition: Nil**
NIL
3 Number of shares transferred to the employees / sold along with the purpose thereof during the year
12,54,180 a. Shares transferred to the Employees due to exercise of Options: 4,39,300
b. Shares transferred to the Newgen ESOP Trust: 23,380/-*
4. Number of shares held at the end of the year.
13,51,584 Nil
*At the time of closure of the old schemes viz Newgen ESOP 2000 and Newgen ESOP 1999, Newgen Employees Trust had transferred remaining shares to the Newgen ESOP Trust without monetary consideration for the common object of implementing Newgen ESOP Schemes.
**As defined under SEBI (Share Based Employee Benefits) Regulations 2014, secondary acquisition” means acquisition of existing shares of the Company by the Trust on the platform of a recognised Stock Exchange for cash consideration.
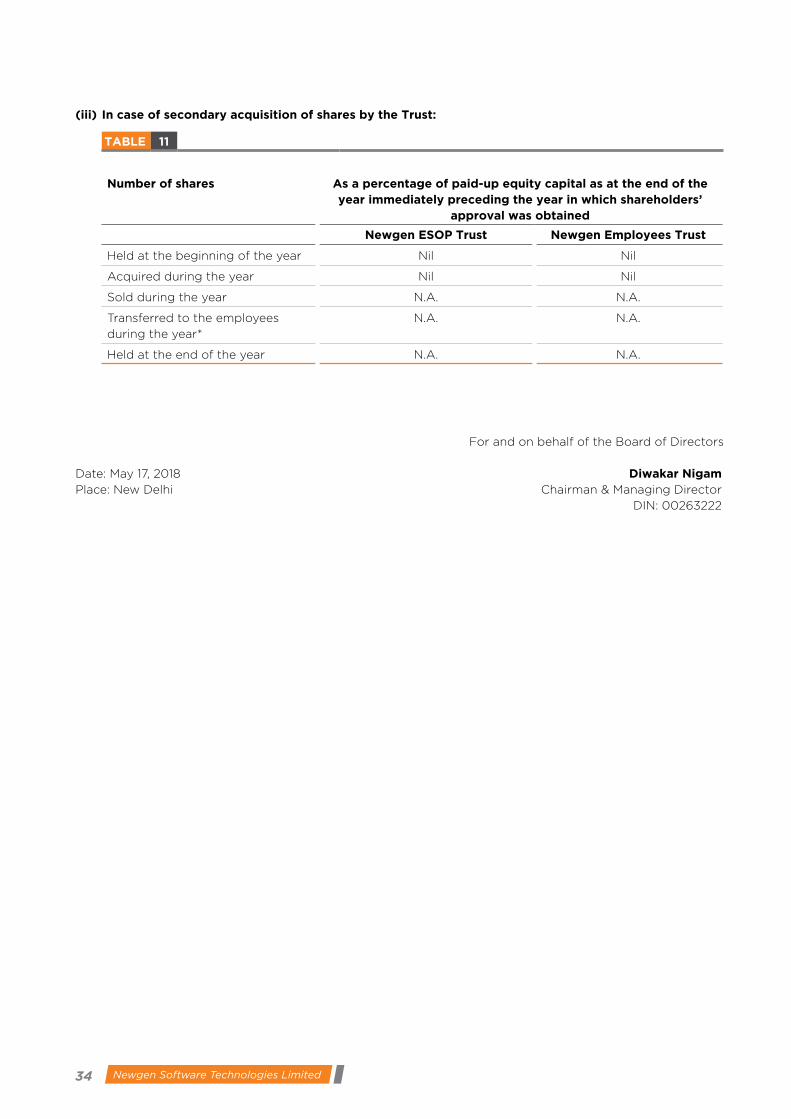
34 Newgen Software Technologies Limited
(iii) In case of secondary acquisition of shares by the Trust:
TABLE 11
Number of shares As a percentage of paid-up equity capital as at the end of the year immediately preceding the year in which shareholders’
approval was obtained
Newgen ESOP Trust Newgen Employees Trust
Held at the beginning of the year Nil Nil
Acquired during the year Nil Nil
Sold during the year N.A. N.A.
Transferred to the employees
during the year*
N.A. N.A.
Held at the end of the year N.A. N.A.
For and on behalf of the Board of Directors
Date: May 17, 2018 Diwakar NigamPlace: New Delhi Chairman & Managing Director
DIN: 00263222
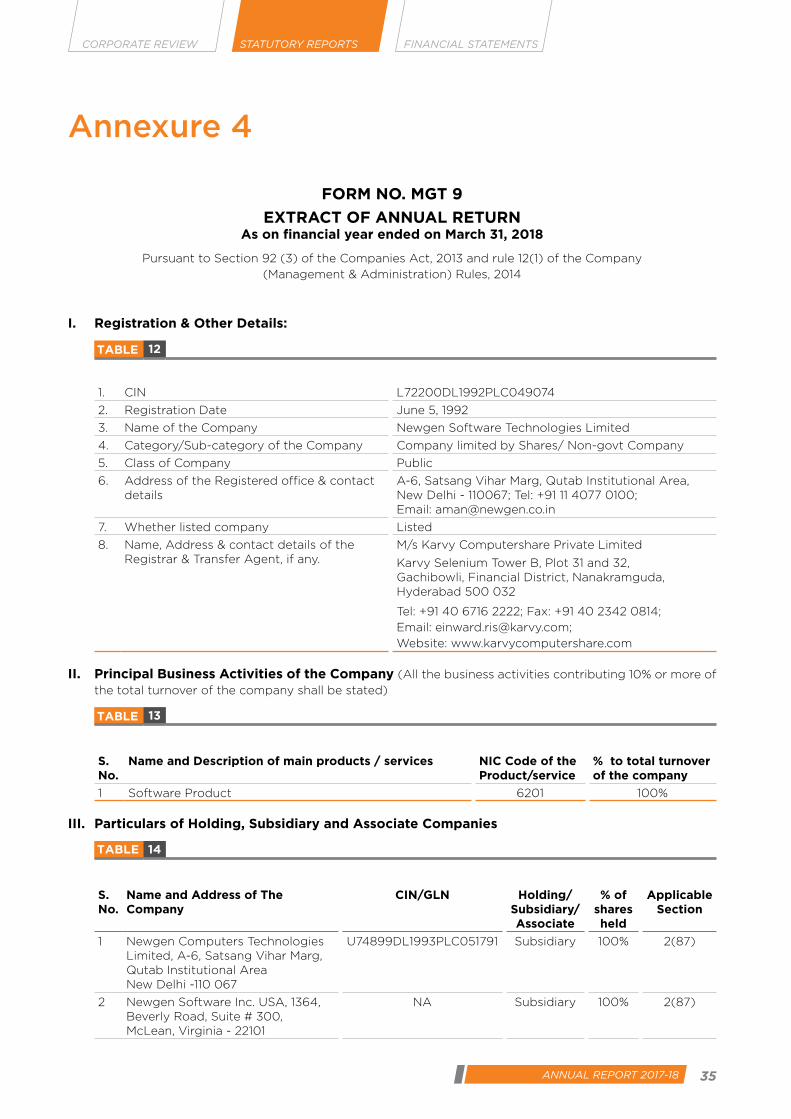
35ANNUAL REPORT 2017-18
CORPORATE REVIEW FINANCIAL STATEMENTSSTATUTORY REPORTS
Annexure 4
FORM NO. MGT 9
EXTRACT OF ANNUAL RETURNAs on financial year ended on March 31, 2018
Pursuant to Section 92 (3) of the Companies Act, 2013 and rule 12(1) of the Company
(Management & Administration) Rules, 2014
I. Registration & Other Details:
TABLE 12
1. CIN L72200DL1992PLC049074
2. Registration Date June 5, 1992
3. Name of the Company Newgen Software Technologies Limited
4. Category/Sub-category of the Company Company limited by Shares/ Non-govt Company
5. Class of Company Public
6. Address of the Registered office & contact details
A-6, Satsang Vihar Marg, Qutab Institutional Area, New Delhi - 110067; Tel: +91 11 4077 0100; Email: [email protected]
7. Whether listed company Listed
8. Name, Address & contact details of the Registrar & Transfer Agent, if any.
M/s Karvy Computershare Private Limited
Karvy Selenium Tower B, Plot 31 and 32, Gachibowli, Financial District, Nanakramguda, Hyderabad 500 032
Tel: +91 40 6716 2222; Fax: +91 40 2342 0814;
Email: [email protected];
Website: www.karvycomputershare.com
II. Principal Business Activities of the Company (All the business activities contributing 10% or more of
the total turnover of the company shall be stated)
TABLE 13
S. No.
Name and Description of main products / services NIC Code of the Product/service
% to total turnover of the company
1 Software Product 6201 100%
III. Particulars of Holding, Subsidiary and Associate Companies
TABLE 14
S. No.
Name and Address of The Company
CIN/GLN Holding/ Subsidiary/ Associate
% of shares held
Applicable Section
1 Newgen Computers Technologies Limited, A-6, Satsang Vihar Marg, Qutab Institutional Area New Delhi -110 067
U74899DL1993PLC051791 Subsidiary 100% 2(87)
2 Newgen Software Inc. USA, 1364, Beverly Road, Suite # 300, McLean, Virginia - 22101
NA Subsidiary 100% 2(87)
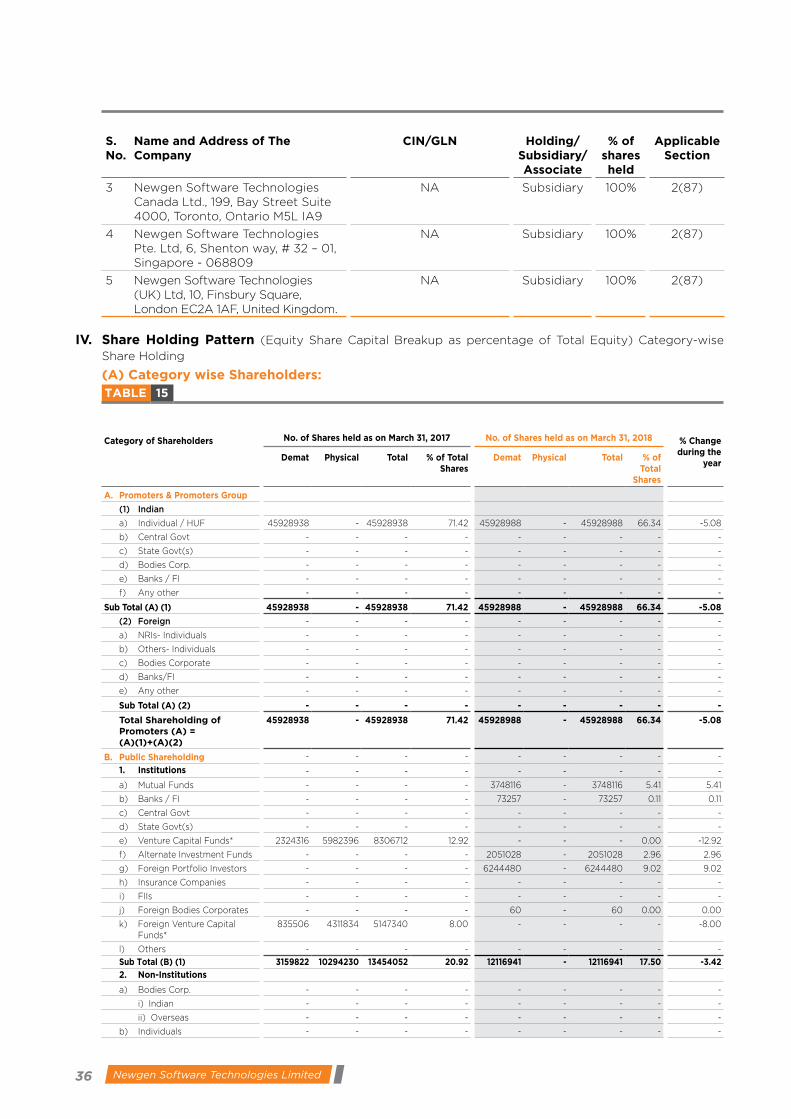
36 Newgen Software Technologies Limited
S. No.
Name and Address of The Company
CIN/GLN Holding/ Subsidiary/ Associate
% of shares held
Applicable Section
3 Newgen Software Technologies Canada Ltd., 199, Bay Street Suite 4000, Toronto, Ontario M5L IA9
NA Subsidiary 100% 2(87)
4 Newgen Software Technologies Pte. Ltd, 6, Shenton way, # 32 – 01, Singapore - 068809
NA Subsidiary 100% 2(87)
5 Newgen Software Technologies (UK) Ltd, 10, Finsbury Square, London EC2A 1AF, United Kingdom.
NA Subsidiary 100% 2(87)
IV. Share Holding Pattern (Equity Share Capital Breakup as percentage of Total Equity) Category-wise
Share Holding
(A) Category wise Shareholders: TABLE 15
Category of Shareholders No. of Shares held as on March 31, 2017 No. of Shares held as on March 31, 2018 % Change during the
year Demat Physical Total % of Total
SharesDemat Physical Total % of
Total Shares
A. Promoters & Promoters Group
(1) Indian
a) Individual / HUF 45928938 - 45928938 71.42 45928988 - 45928988 66.34 -5.08
b) Central Govt - - - - - - - - -
c) State Govt(s) - - - - - - - - -
d) Bodies Corp. - - - - - - - - -
e) Banks / FI - - - - - - - - -
f) Any other - - - - - - - - -
Sub Total (A) (1) 45928938 - 45928938 71.42 45928988 - 45928988 66.34 -5.08
(2) Foreign - - - - - - - - -
a) NRIs- Individuals - - - - - - - - -
b) Others- Individuals - - - - - - - - -
c) Bodies Corporate - - - - - - - - -
d) Banks/FI - - - - - - - - -
e) Any other - - - - - - - - -
Sub Total (A) (2) - - - - - - - - -
Total Shareholding of Promoters (A) = (A)(1)+(A)(2)
45928938 - 45928938 71.42 45928988 - 45928988 66.34 -5.08
B. Public Shareholding - - - - - - - - -
1. Institutions - - - - - - - - -
a) Mutual Funds - - - - 3748116 - 3748116 5.41 5.41
b) Banks / FI - - - - 73257 - 73257 0.11 0.11
c) Central Govt - - - - - - - - -
d) State Govt(s) - - - - - - - - -
e) Venture Capital Funds* 2324316 5982396 8306712 12.92 - - - 0.00 -12.92
f) Alternate Investment Funds - - - - 2051028 - 2051028 2.96 2.96
g) Foreign Portfolio Investors - - - - 6244480 - 6244480 9.02 9.02
h) Insurance Companies - - - - - - - - -
i) FIIs - - - - - - - - -
j) Foreign Bodies Corporates - - - - 60 - 60 0.00 0.00
k) Foreign Venture Capital Funds*
835506 4311834 5147340 8.00 - - - - -8.00
l) Others - - - - - - - - -
Sub Total (B) (1) 3159822 10294230 13454052 20.92 12116941 - 12116941 17.50 -3.422. Non-Institutions
a) Bodies Corp. - - - - - - - - -
i) Indian - - - - - - - - -
ii) Overseas - - - - - - - - -
b) Individuals - - - - - - - - -
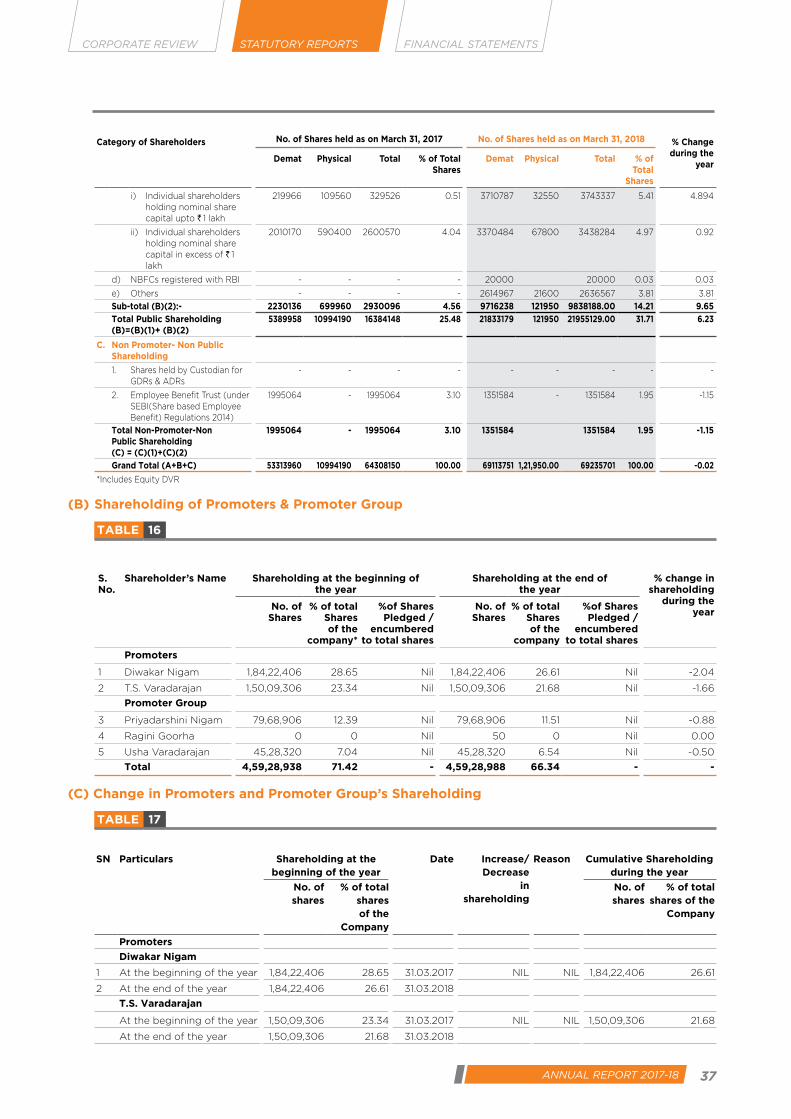
37ANNUAL REPORT 2017-18
CORPORATE REVIEW FINANCIAL STATEMENTSSTATUTORY REPORTS
Category of Shareholders No. of Shares held as on March 31, 2017 No. of Shares held as on March 31, 2018 % Change during the
year Demat Physical Total % of Total
SharesDemat Physical Total % of
Total Shares
i) Individual shareholders holding nominal share capital upto ` 1 lakh
219966 109560 329526 0.51 3710787 32550 3743337 5.41 4.894
ii) Individual shareholders holding nominal share capital in excess of ` 1 lakh
2010170 590400 2600570 4.04 3370484 67800 3438284 4.97 0.92
d) NBFCs registered with RBI - - - - 20000 20000 0.03 0.03
e) Others - - - - 2614967 21600 2636567 3.81 3.81
Sub-total (B)(2):- 2230136 699960 2930096 4.56 9716238 121950 9838188.00 14.21 9.65Total Public Shareholding (B)=(B)(1)+ (B)(2)
5389958 10994190 16384148 25.48 21833179 121950 21955129.00 31.71 6.23
C. Non Promoter- Non Public Shareholding
1. Shares held by Custodian for GDRs & ADRs
- - - - - - - - -
2. Employee Benefit Trust (under SEBI(Share based Employee Benefit) Regulations 2014)
1995064 - 1995064 3.10 1351584 - 1351584 1.95 -1.15
Total Non-Promoter-Non Public Shareholding (C) = (C)(1)+(C)(2)
1995064 - 1995064 3.10 1351584 1351584 1.95 -1.15
Grand Total (A+B+C) 53313960 10994190 64308150 100.00 69113751 1,21,950.00 69235701 100.00 -0.02
*Includes Equity DVR
(B) Shareholding of Promoters & Promoter Group
TABLE 16
S. No.
Shareholder’s Name Shareholding at the beginning of the year
Shareholding at the end of the year
% change in shareholding
during the year
No. of Shares
% of total Shares of the
company*
%of Shares Pledged /
encumbered to total shares
No. of Shares
% of total Shares of the
company
%of Shares Pledged /
encumbered to total shares
Promoters
1 Diwakar Nigam 1,84,22,406 28.65 Nil 1,84,22,406 26.61 Nil -2.04
2 T.S. Varadarajan 1,50,09,306 23.34 Nil 1,50,09,306 21.68 Nil -1.66
Promoter Group
3 Priyadarshini Nigam 79,68,906 12.39 Nil 79,68,906 11.51 Nil -0.88
4 Ragini Goorha 0 0 Nil 50 0 Nil 0.00
5 Usha Varadarajan 45,28,320 7.04 Nil 45,28,320 6.54 Nil -0.50
Total 4,59,28,938 71.42 - 4,59,28,988 66.34 - -
(C) Change in Promoters and Promoter Group’s Shareholding
TABLE 17
SN Particulars Shareholding at the beginning of the year
Date Increase/ Decrease
in shareholding
Reason Cumulative Shareholding during the year
No. of shares
% of total shares of the
Company
No. of shares
% of total shares of the
Company
Promoters
Diwakar Nigam
1 At the beginning of the year 1,84,22,406 28.65 31.03.2017 NIL NIL 1,84,22,406 26.61
2 At the end of the year 1,84,22,406 26.61 31.03.2018
T.S. Varadarajan
At the beginning of the year 1,50,09,306 23.34 31.03.2017 NIL NIL 1,50,09,306 21.68
At the end of the year 1,50,09,306 21.68 31.03.2018

38 Newgen Software Technologies Limited
SN Particulars Shareholding at the beginning of the year
Date Increase/ Decrease
in shareholding
Reason Cumulative Shareholding during the year
No. of shares
% of total shares of the
Company
No. of shares
% of total shares of the
Company
Promoter Group
Priyadarshini Nigam
1 At the beginning of the year 7968906 12.39 31.03.2017 NIL NIL 7968906 11.51
2 At the end of the year 7968906 11.51 31.03.2018
Ragini Goorha
1 At the beginning of the year 0 0.00 31.03.2017 50 Market
Purchase
50 0.00
2 At the end of the year 50 0.00 31.03.2018
Usha Varadarajan
1 At the beginning of the year 4528320 7.04 31.03.2017 NIL NIL 4528320 6.54
2 At the end of the year 4528320 6.54 31.03.2018
(D) Shareholding Pattern of top ten Shareholders: (Other than Directors, Promoters, Promoter Group and Holders of GDRs and ADRs):
TABLE 18
SN For Each of the Top 10 Shareholders
Shareholding at the beginning of the year
Date Increase/ Decrease in share-holding
during the year
Reason Cumulative Shareholding during the year
No. of shares
% of total shares of the
Company
No. of shares
% of total shares of the
Company
At the beginning of the year/ At the end of the year*
1 Goldman Sachs India
Limited
0 0.00 31.03.2017 29,79,640 Allotment
under IPO
29,79,640 4.30
29,79,640 4.30 31.03.2018
2 Malabar India Fund Limited 0 0.00 31.03.2017 26,78,270 Allotment
under IPO
26,78,270 3.87
26,78,270 3.87 31.03.2018
3 Newgen ESOP Trust 15,32,384 2.38 2017-18 (12,54,180) ESOP
Transfer
2,78,204 -
23,380 Transfer
from
Newgen
Employees
Trust to
Newgen
ESOP Trust.
3,01,584 -
10,50,000 Allotment 13,51,584 1.95
13,51,584 1.95 31.03.2018
4 HDFC Trustee Company
Limited- HDFC Equity
Saving Fund
0 0.00 31.03.2017 12,03,311 Allotment
under IPO
12,03,311 1.74
12,03,311 1.74 31.03.2018
5 Canara HSBC Oriental
Bank of Commerce Life
Insurance Company
Limited
0 0.00 31.03.2017 10,36,001 Allotment
under IPO
10,36,001 1.50
10,36,001 1.50 31.03.2018
6 HDFC Trustee Company
Limited- HDFC Capital
Builder Fund
0 0.00 31.03.2017 10,22,444 Allotment
under IPO
10,22,444 1.48
10,22,444 1.48 31.03.2018

39ANNUAL REPORT 2017-18
CORPORATE REVIEW FINANCIAL STATEMENTSSTATUTORY REPORTS
SN For Each of the Top 10 Shareholders
Shareholding at the beginning of the year
Date Increase/ Decrease in share-holding
during the year
Reason Cumulative Shareholding during the year
No. of shares
% of total shares of the
Company
No. of shares
% of total shares of the
Company
7 IL & FS Trust Company
Limited - FOREFRONT
ALTERNAT
0 0.00 31.03.2017 10,13,324 Allotment
under IPO
10,13,324 1.46
10,13,324 1.46 31.03.2018
8 Aditya Birla Sun Life
Trustee Private Limited A/C
0 0.00 31.03.2017 9,30,030 Allotment
under IPO
9,30,030 1.34
9,30,030 1.34 31.03.2018
9 Malabar Value Fund 0 0.00 31.03.2017 5,37,704 Allotment
under IPO
5,37,704 0.78
5,37,704 0.78 31.03.2018
10 Alchemy Leaders of
Tomorrow
0 0.00 31.03.2017 5,00,000 Allotment
under IPO
5,00,000 0.72
5,00,000 0.72 31.03.2018
* Top Ten Shareholders as on 31.03.2018
(E) Shareholding of Directors and Key Managerial Personnel:
TABLE 19
SN Shareholding of each Directors and each Key Managerial Personnel
Shareholding at the beginning of the year
Date Increase/ Decrease
in shareholding
Reason Cumulative Shareholding during the year
No. of shares
% of total shares of the
Company
No. of shares
% of total shares of the
Company
At the beginning of the year/ At the end of the year
1 Diwakar Nigam 1,84,22,406 28.65 0 NIL 1,84,22,406 26.61
Chairman & Managing
Director
1,84,22,406 26.61 31.03.2018
2 T.S. Varadarajan 1,50,09,306 23.34 0 NIL 1,50,09,306 21.68
Whole-Time Director 1,50,09,306 21.68 31.03.2018
3 Priyadarshini Nigam 79,68,906 12.39 0 NIL 79,68,906 11.51
Whole-Time Director 79,68,906 11.51 31.03.2018
4 Virender Jeet* 2,16,000 0.34 33,000 ESOP 2,49,000 0.36
Sr. VP-Sales & Marketing/
Product
2,49,000 0.36 31.03.2018
5 Surender Jeet Raj* 1,99,900 0.31 27,500 ESOP 2,27,400 0.33
Sr. VP- HR/Operations 2,27,400 0.33 31.03.2018
6 Tarun Nandwani* 2,21,700 0.34 16,500 ESOP 2,38,200 0.34
VP- Customer Relations/
Delivery
2,38,200 0.34 31.03.2018
7 Arun Kumar Gupta 44,100 0.07 10,500 ESOP 54,600 0.08
Chief Financial Officer 54,600 0.08 31.03.2018
8 Aman Mourya 0 0.00 0 NIL 0 0.00
Company Secretary 0 0.00 31.03.2018
*Officer of the Company designated as Key Managerial Personnel.

40 Newgen Software Technologies Limited
V. Indebtedness - Indebtedness of the Company including interest outstanding/accrued but not due for payment
TABLE 20
(` In Lakh)
Secured Loans excluding deposits
Unsecured Loans
Deposits Total Indebtedness
Indebtedness at the beginning of the financial year
i) Principal Amount 5226.18 Nil Nil 5226.18
ii) Interest due but not paid Nil Nil Nil
iii) Interest accrued but not due Nil Nil Nil Nil
Total (i+ii+iii) 5226.18 Nil Nil 5226.18
Change in Indebtedness during the financial year
Nil Nil Nil Nil
* Addition 0 Nil Nil 0
* Reduction 279.91 Nil Nil 279.91
Net Change -279.91 Nil Nil -279.91
Indebtedness at the end of the financial year
Nil Nil Nil Nil
i) Principal Amount 4946.27 Nil Nil 4946.27
ii) Interest due but not paid Nil Nil Nil Nil
iii) Interest accrued but not due Nil Nil Nil Nil
Total (i+ii+iii) 4946.27 Nil Nil 4946.27
VI. Remuneration of Directors and Key Managerial Personnel as on March 31, 2018
(A) Remuneration to Managing Director, Whole-time Directors and/or Manager:
TABLE 21
(in ` Lakh)
Particulars of Remuneration:
Diwakar Nigam T.S. Varadarajan Priyadarshini Nigam Total AmountMD WTD WTD
Salary as per provisions
contained in section 17(1)
of the Income Tax Act,
1961
1,59,70,240 75,43,360 38,88,400 2,74,02,000
Value of perquisites u/s
17(2) of the Income Tax
Act, 1961
64,440 88,428 39,600 1,92,468
Profits in lieu of salary
under
0 0 0 0
section 17(3) of the
Income Tax Act, 1961
0 0 0 0
Stock Option 0 0 0 0
Sweat Equity 0 0 0 0
Commission 0 0 0 0
Others 0 0 0 0
Total Amount 1,60,34,680 76,31,788 39,28,000 2,75,94,468
Ceiling as per the Act ` 909.32 Lakh (being 10% of the net profits of the Company calculated as
per Section 198 of the Companies Act, 2013)
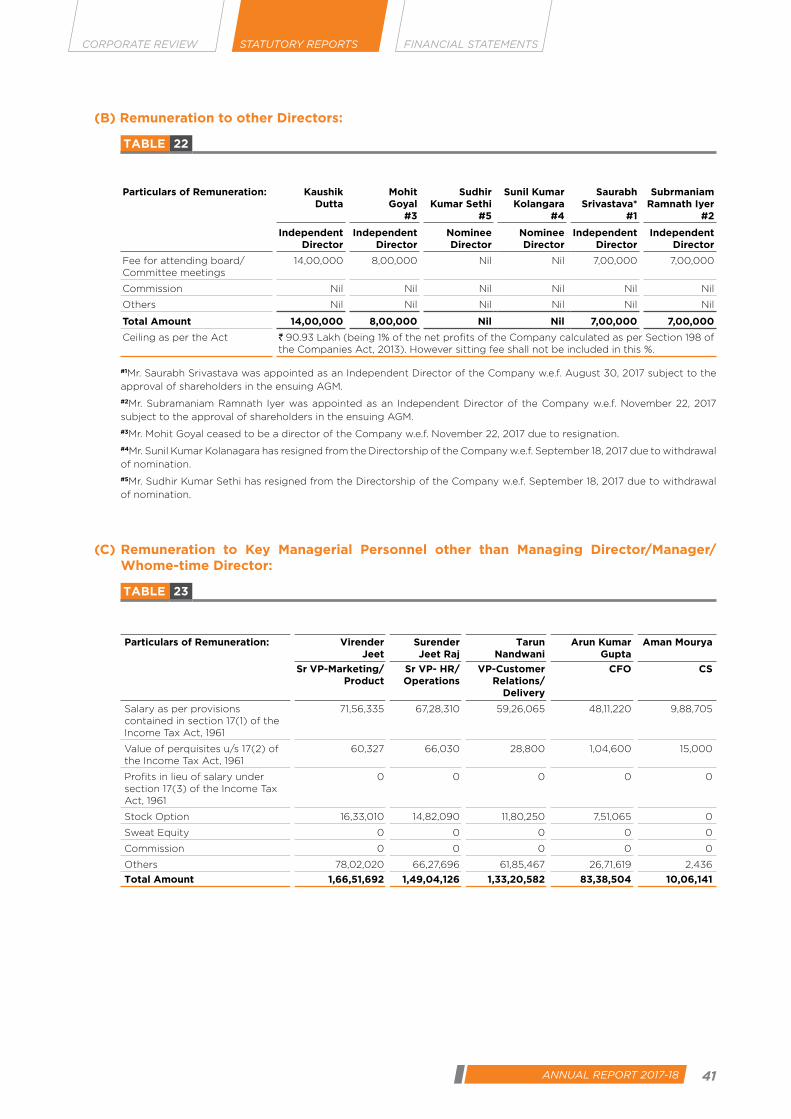
41ANNUAL REPORT 2017-18
CORPORATE REVIEW FINANCIAL STATEMENTSSTATUTORY REPORTS
(B) Remuneration to other Directors:
TABLE 22
Particulars of Remuneration: Kaushik Dutta
Mohit Goyal
#3
Sudhir Kumar Sethi
#5
Sunil Kumar Kolangara
#4
Saurabh Srivastava*
#1
Subrmaniam Ramnath Iyer
#2
Independent Director
Independent Director
Nominee Director
Nominee Director
Independent Director
Independent Director
Fee for attending board/Committee meetings
14,00,000 8,00,000 Nil Nil 7,00,000 7,00,000
Commission Nil Nil Nil Nil Nil Nil
Others Nil Nil Nil Nil Nil Nil
Total Amount 14,00,000 8,00,000 Nil Nil 7,00,000 7,00,000
Ceiling as per the Act ` 90.93 Lakh (being 1% of the net profits of the Company calculated as per Section 198 of the Companies Act, 2013). However sitting fee shall not be included in this %.
#1Mr. Saurabh Srivastava was appointed as an Independent Director of the Company w.e.f. August 30, 2017 subject to the
approval of shareholders in the ensuing AGM.
#2Mr. Subramaniam Ramnath Iyer was appointed as an Independent Director of the Company w.e.f. November 22, 2017
subject to the approval of shareholders in the ensuing AGM.
#3Mr. Mohit Goyal ceased to be a director of the Company w.e.f. November 22, 2017 due to resignation.
#4Mr. Sunil Kumar Kolanagara has resigned from the Directorship of the Company w.e.f. September 18, 2017 due to withdrawal
of nomination.
#5Mr. Sudhir Kumar Sethi has resigned from the Directorship of the Company w.e.f. September 18, 2017 due to withdrawal
of nomination.
(C) Remuneration to Key Managerial Personnel other than Managing Director/Manager/ Whome-time Director:
TABLE 23
Particulars of Remuneration: Virender Jeet
Surender Jeet Raj
Tarun Nandwani
Arun Kumar Gupta
Aman Mourya
Sr VP-Marketing/Product
Sr VP- HR/Operations
VP-Customer Relations/
Delivery
CFO CS
Salary as per provisions contained in section 17(1) of the Income Tax Act, 1961
71,56,335 67,28,310 59,26,065 48,11,220 9,88,705
Value of perquisites u/s 17(2) of the Income Tax Act, 1961
60,327 66,030 28,800 1,04,600 15,000
Profits in lieu of salary under section 17(3) of the Income Tax Act, 1961
0 0 0 0 0
Stock Option 16,33,010 14,82,090 11,80,250 7,51,065 0
Sweat Equity 0 0 0 0 0
Commission 0 0 0 0 0
Others 78,02,020 66,27,696 61,85,467 26,71,619 2,436
Total Amount 1,66,51,692 1,49,04,126 1,33,20,582 83,38,504 10,06,141
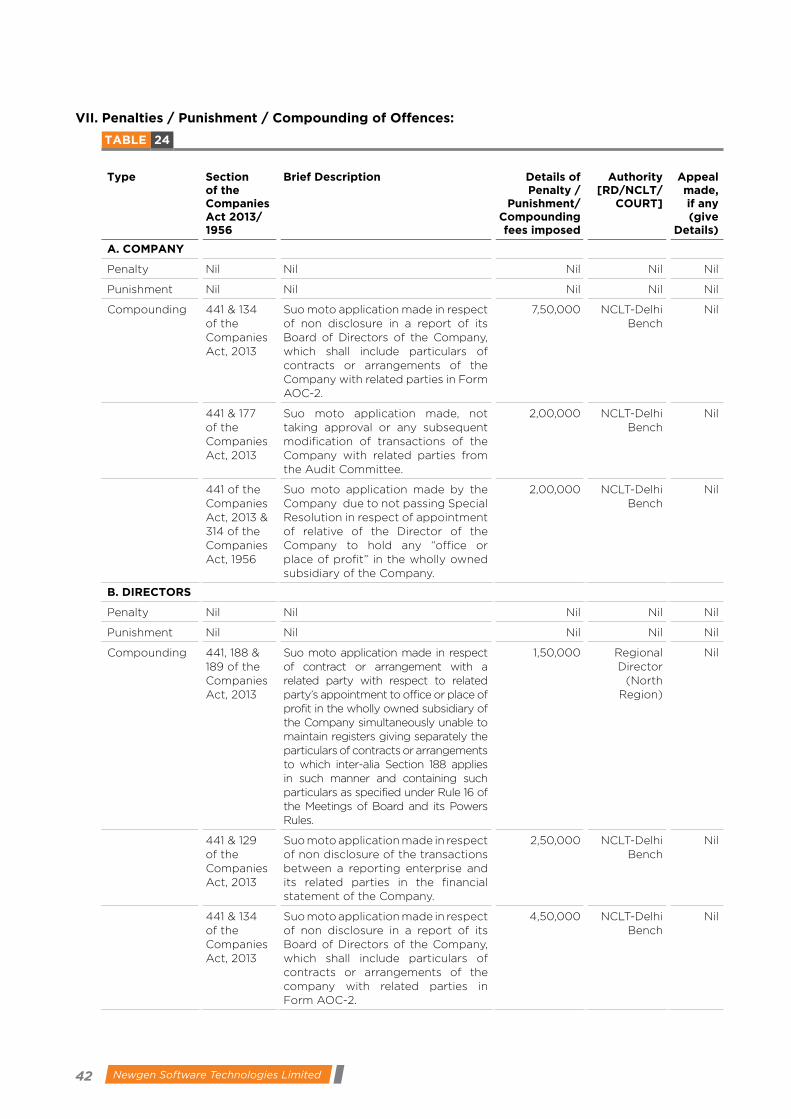
42 Newgen Software Technologies Limited
VII. Penalties / Punishment / Compounding of Offences:
TABLE 24
Type Section of the Companies Act 2013/ 1956
Brief Description Details of Penalty /
Punishment/ Compounding fees imposed
Authority [RD/NCLT/
COURT]
Appeal made, if any (give
Details)
A. COMPANY
Penalty Nil Nil Nil Nil Nil
Punishment Nil Nil Nil Nil Nil
Compounding 441 & 134 of the Companies Act, 2013
Suo moto application made in respect of non disclosure in a report of its Board of Directors of the Company, which shall include particulars of contracts or arrangements of the Company with related parties in Form AOC-2.
7,50,000 NCLT-Delhi Bench
Nil
441 & 177 of the Companies Act, 2013
Suo moto application made, not taking approval or any subsequent modification of transactions of the Company with related parties from the Audit Committee.
2,00,000 NCLT-Delhi Bench
Nil
441 of the Companies Act, 2013 & 314 of the Companies Act, 1956
Suo moto application made by the Company due to not passing Special Resolution in respect of appointment of relative of the Director of the Company to hold any “office or place of profit” in the wholly owned subsidiary of the Company.
2,00,000 NCLT-Delhi Bench
Nil
B. DIRECTORS
Penalty Nil Nil Nil Nil Nil
Punishment Nil Nil Nil Nil Nil
Compounding 441, 188 & 189 of the Companies Act, 2013
Suo moto application made in respect of contract or arrangement with a related party with respect to related party’s appointment to office or place of profit in the wholly owned subsidiary of the Company simultaneously unable to maintain registers giving separately the particulars of contracts or arrangements to which inter-alia Section 188 applies in such manner and containing such particulars as specified under Rule 16 of the Meetings of Board and its Powers Rules.
1,50,000 Regional Director
(North Region)
Nil
441 & 129 of the Companies Act, 2013
Suo moto application made in respect of non disclosure of the transactions between a reporting enterprise and its related parties in the financial statement of the Company.
2,50,000 NCLT-Delhi Bench
Nil
441 & 134 of the Companies Act, 2013
Suo moto application made in respect of non disclosure in a report of its Board of Directors of the Company, which shall include particulars of contracts or arrangements of the company with related parties in Form AOC-2.
4,50,000 NCLT-Delhi Bench
Nil

43ANNUAL REPORT 2017-18
CORPORATE REVIEW FINANCIAL STATEMENTSSTATUTORY REPORTS
Type Section of the Companies Act 2013/ 1956
Brief Description Details of Penalty /
Punishment/ Compounding fees imposed
Authority [RD/NCLT/
COURT]
Appeal made, if any (give
Details)
441 & 177 of the Companies Act, 2013
Suo moto application made, not taking approval or any subsequent modification of transactions of the Company with related parties from the Audit Committee.
1,50,000 NCLT-Delhi Bench
Nil
441 of the Companies Act, 2013 & 314 of the Companies Act, 1956
Suo moto application made by the Company due to not passing special resolution in respect of appointment of relative of the Director of the Company to hold any “office or place of profit” in the wholly owned subsidiary of the Company.
1,50,000 NCLT-Delhi Bench
Nil
C. OTHER OFFICERS IN DEFAULT
Penalty Nil Nil Nil Nil Nil
Punishment Nil Nil Nil Nil Nil
Compounding 441 & 129 of the Companies Act, 2013
Suo moto application made in respect of non disclosure of the transactions between a reporting enterprise and its related parties in the financial statement of the Company.
NCLT -Delhi Bench
2,50,000 Nil
441 & 134 of the Companies Act, 2013
Suo moto application made in respect of non disclosure in a report of its Board of Directors of the Company, which shall include particulars of contracts or arrangements of the company with related parties in Form AOC-2.
NCLT -Delhi Bench
2,50,000 Nil
441 & 177 of the Companies Act, 2013
Suo moto application made, not taking approval or any subsequent modification of transactions of the Company with related parties from the Audit Committee.
NCLT -Delhi Bench
75,000 Nil
441 of the Companies Act, 2013 & 314 of the Companies Act, 1956
Suo moto application made by the Company due to not passing special resolution in respect of appointment of relative of the Director of the Company to hold any “office or place of profit” in the wholly owned subsidiary of the Company.
NCLT -Delhi Bench
50,000 Nil
For and on behalf of the Board of Directors
Diwakar Nigam
Date: May 17, 2018 Chairman & Managing Director
Place: New Delhi DIN: 00263222
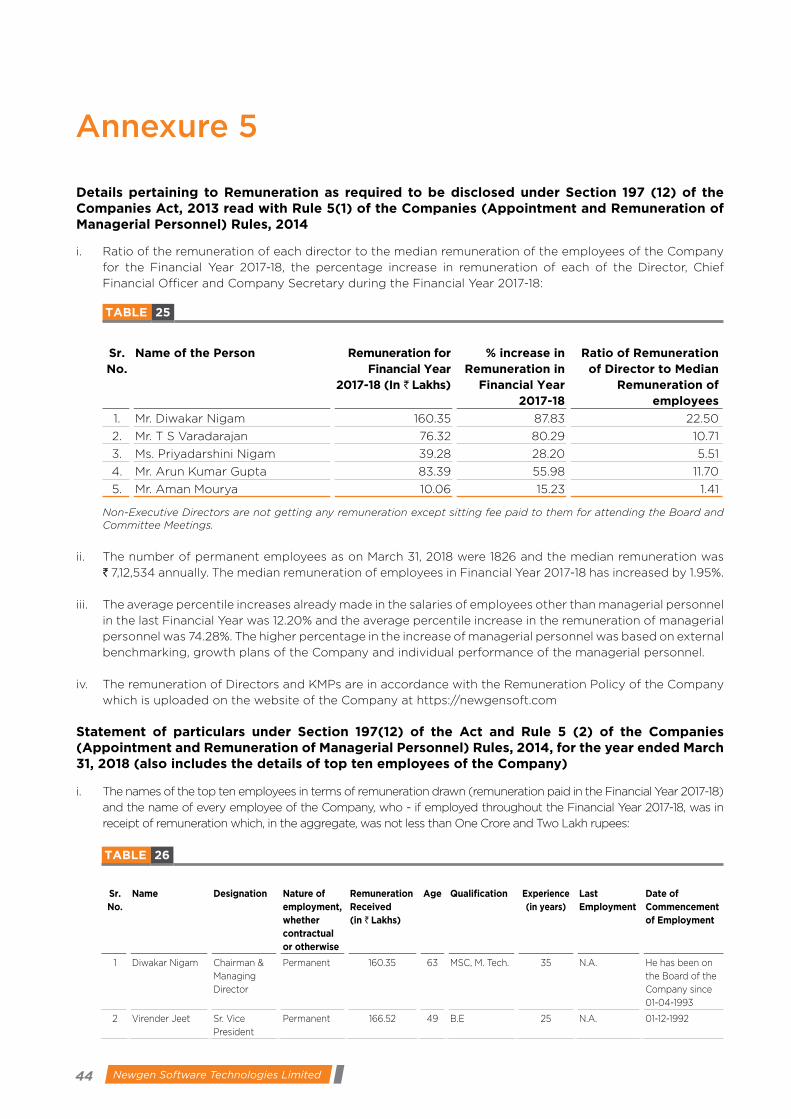
44 Newgen Software Technologies Limited
Annexure 5
Details pertaining to Remuneration as required to be disclosed under Section 197 (12) of the Companies Act, 2013 read with Rule 5(1) of the Companies (Appointment and Remuneration of Managerial Personnel) Rules, 2014
i. Ratio of the remuneration of each director to the median remuneration of the employees of the Company
for the Financial Year 2017-18, the percentage increase in remuneration of each of the Director, Chief
Financial Officer and Company Secretary during the Financial Year 2017-18:
TABLE 25
Sr. No.
Name of the Person Remuneration for Financial Year
2017-18 (In ` Lakhs)
% increase in Remuneration in
Financial Year 2017-18
Ratio of Remuneration of Director to Median
Remuneration of employees
1. Mr. Diwakar Nigam 160.35 87.83 22.50
2. Mr. T S Varadarajan 76.32 80.29 10.71
3. Ms. Priyadarshini Nigam 39.28 28.20 5.51
4. Mr. Arun Kumar Gupta 83.39 55.98 11.70
5. Mr. Aman Mourya 10.06 15.23 1.41
Non-Executive Directors are not getting any remuneration except sitting fee paid to them for attending the Board and Committee Meetings.
ii. The number of permanent employees as on March 31, 2018 were 1826 and the median remuneration was
` 7,12,534 annually. The median remuneration of employees in Financial Year 2017-18 has increased by 1.95%.
iii. The average percentile increases already made in the salaries of employees other than managerial personnel
in the last Financial Year was 12.20% and the average percentile increase in the remuneration of managerial
personnel was 74.28%. The higher percentage in the increase of managerial personnel was based on external
benchmarking, growth plans of the Company and individual performance of the managerial personnel.
iv. The remuneration of Directors and KMPs are in accordance with the Remuneration Policy of the Company
which is uploaded on the website of the Company at https://newgensoft.com
Statement of particulars under Section 197(12) of the Act and Rule 5 (2) of the Companies (Appointment and Remuneration of Managerial Personnel) Rules, 2014, for the year ended March 31, 2018 (also includes the details of top ten employees of the Company)
i. The names of the top ten employees in terms of remuneration drawn (remuneration paid in the Financial Year 2017-18)
and the name of every employee of the Company, who - if employed throughout the Financial Year 2017-18, was in
receipt of remuneration which, in the aggregate, was not less than One Crore and Two Lakh rupees:
TABLE 26
Sr. No.
Name Designation Nature of employment, whether contractual or otherwise
Remuneration Received (in ` Lakhs)
Age Qualification Experience (in years)
Last Employment
Date of Commencement of Employment
1 Diwakar Nigam Chairman &
Managing
Director
Permanent 160.35 63 MSC, M. Tech. 35 N.A. He has been on
the Board of the
Company since
01-04-1993
2 Virender Jeet Sr. Vice
President
Permanent 166.52 49 B.E 25 N.A. 01-12-1992

45ANNUAL REPORT 2017-18
CORPORATE REVIEW FINANCIAL STATEMENTSSTATUTORY REPORTS
Sr. No.
Name Designation Nature of employment, whether contractual or otherwise
Remuneration Received (in ` Lakhs)
Age Qualification Experience (in years)
Last Employment
Date of Commencement of Employment
3 Surender Jeet
Raj
Sr. Vice
President
Permanent 149.03 61 MSW 38 PCS DG 16-08-1993
4. Tarun Nandwani Vice President Permanent 133.21 46 B.E 25 N.A. 15-07-1993
5 Arun Kumar
Gupta
CFO Permanent 83.39 48 CA, CS, CMA 22 Interra
Infotech
15.10.2010
6 R. Krishna
Kumar
Vice President Permanent 133.68 49 B.E 24 Wipro
Infotech
01-08-2013
7 Dushyant Kumar Vice President Permanent 146.17 58 B.E 36 Softek Ltd. 16-11-1999
8 Ashish Vikram
Singh
Vice President Permanent 98.94 49 M.E 22 Pitney Bowes 13-01-2014
9 Atin Kumar Associate
Vice President
Permanent 82.03 44 MCA 21 N.A. 03-06-1997
10 Binu Remani
Sundaresan
Regional
Manager
Permanent 110.35 42 B.Tech 19 Cimcon
Software (I)
Pvt Ltd
12-07-2010
Remuneration also includes provisions for bonus, variable incentives and ESOP perquisites to the extent Options exercised during the year and includes amount outstanding at the year end.
Notes: a) Except Mr. Diwakar Nigam, Chairman & Managing Director (holding 26.6% of equity shares himself and 11.5%
of equity shares through his spouse), no other employee holding by himself or along with his/her spouse and
dependent children, 2% or more of equity shares of the Company.
b) Mr. Diwakar Nigam is the spouse of Ms. Priyadarshini Nigam, Whole-time Director of the Company
ii. Details of employee if employed for a part of the Financial Year, was in receipt of remuneration for any part
of that year, at a rate which, in the aggregate, was not less than Eight Lakh and Fifty Thousand rupees per
month. NIL
iii. Details of employee if employed throughout the Financial Year 2017-18 or part thereof, was in receipt of
remuneration in that year which, in the aggregate, or as the case may be, at a rate which, in the aggregate,
is in excess of that drawn by the Managing Director and holds by himself or along with his spouse and
dependent children, not less than two percent of the equity shares of the Company, except the details of
employees forming part of this annexure. NIL
For and on behalf of the Board of Directors
Date: May 17, 2018 Diwakar NigamPlace: New Delhi Chairman & Managing Director
DIN: 00263222
46 Newgen Software Technologies Limited
Annexure 6
NOMINATION AND REMUNERATION POLICY OF NEWGEN SOFTWARE TECHNOLOGIES LIMITED
Document Title : Nomination and Remuneration Policy
Last Updated : May 7, 2015
1. Purpose: This Nomination and Remuneration Policy (“Policy”) shall be in compliance with Section 178 of the
Companies Act, 2013 read with Companies (Meetings of Board and its Powers) Rules, 2014, which is
formulated by Nomination and Remuneration Committee and approved by the Board of Directors, to
guide the Board on various issues on appointment, evaluate performance, remuneration of Directors, Key
Managerial Personnel and Senior Management.
2. Applicability: This policy is applicable to all types of Directors, Key Managerial Personnel (KMP), and Senior Management
team and other employees of Newgen Software Technologies Limited (“Company”) as prescribed under
Companies Act, 2013
3. Objectives: This policy is framed with the following objectives:
I. To guide the Board in relation to the appointment and removal of Directors, Key Managerial Personnel
and Senior Management.
II. To evaluate the performance of members of the Board and provide necessary report to the Board for
further evaluation.
III. To attract, retain and motivate the Senior Management including its Key Managerial Personnel,
evaluation of their performance and provide necessary report to the Board for further evaluation.
IV. The relationship of remuneration with performance is clear and meets appropriate performance
benchmarks.
V. To recommend the Board through this policy the Remuneration payable to the Directors, Key Managerial
Personnel and Senior Management.
VI. To promote and develop a high performance workforce in line with the Company strategy.
VII. To lay down criteria and terms and conditions with regard to identifying persons who are qualified
to become Director (Executive & Non-Executive/ Independent/ Nominee) and persons who may be
appointed in Senior Management, Key Managerial Personnel and determine their remuneration.
VIII. To determine the remuneration based on the Company’s size and financial position and practices in the
industry..
4. Definitions: I. “Act” means Companies Act, 2013 and rules framed thereunder as amended from time to time.
II. “Board of Directors” or Board, in relation to the company, means the collective body of the Directors
of the Company.
47ANNUAL REPORT 2017-18
CORPORATE REVIEW FINANCIAL STATEMENTSSTATUTORY REPORTS
III. “Committee” means Nomination and Remuneration Committee of the Company as constituted or
reconstituted by the Board.
IV. “Company” means “Newgen Software Technologies Limited”.
V. “Managerial Personnel” means Managerial Personnel or Persons as applicable under section 196
and other applicable provisions of the Companies Act, 2013.
VI. “Policy” or “This policy” means Nomination and Remuneration Policy.
VII. “Remuneration” means any money or its equivalent given or passed to any person for services
rendered by him and includes perquisites as defined under the Income Tax Act, 1961.
VIII. “Independent Director” means a Director referred to in Section 149 (6) of the Companies Act, 2013.
IX. “Key Managerial Personnel” (KMP) means the Chief Executive Officer or the Managing Director or
the Manager and in their absence the Whole-time Director; The Company Secretary and The Chief
Financial Officer.
X. “Senior Management” mean personnel of the company who are members of its core management
team excluding Board of Directors comprising all members of management one level below the
executive directors including the functional heads.
XI. “Manager” means an individual who, subject to the superintendence, control and direction of the
Board of Directors, has the management of the whole, or substantially the whole, of the affairs of
a company, and includes a director or any other person occupying the position of a manager, by
whatever name called, whether under a contract of service or not.
Unless the context otherwise requires, words and expressions used in this policy and not defined herein
but defined in the Companies Act, 2013 and or in any applicable laws/rules as may be amended from time
to time shall have the meaning respectively assigned to them therein.
5 Constitution of Nomination and Remuneration Committee:5.1 The Nomination and Remuneration Committee shall be consist of three or more non-executive directors,
out of which at least one-half shall be independent director(s), provided that Chairperson of the Company
may be appointed as a member of this Committee but shall not chair such Committee.
5.2 The Board shall reconstitute/re-constitute the Committee as and when required to comply with the
provisions of the Companies Act, 2013 and other applicable statutory requirements.
5.3 The meeting of Committee shall be held at such regular intervals as may be required to carry out the
objectives set out in the Policy.
5.4 The Committee members may attend the meeting physically or through Video conference or through
permitted audio –visual mode, subject to the provisions of the applicable laws.
5.5 Minimum two (2) members shall constitute a quorum for the Committee meeting.
5.6 Membership of the Committee shall be disclosed in the Annual Report.
5.7 Term of the Committee shall be continued unless terminated by the Board of Directors.
5.8 Chairperson of the Committee shall be an Independent Director.
5.9 In the absence of the Chairperson, the members of the Committee present at the meeting shall choose one
amongst them to act as Chairperson.
5.10 Chairperson of the Company (whether executive or Non-Executive) may be appointed as a member of the
Committee but shall not be a Chairman of the Committee.

48 Newgen Software Technologies Limited
5.11 Chairman of the Nomination and Remuneration Committee meeting could be present at the Annual General
Meeting or may nominate some other member to answer the shareholders’ queries
5.12 A member of the Committee is not entitled to be present when his or her own remuneration is discussed
at a meeting or when his or her performance is being evaluated.
5.14 Matters arising for determination at Committee meetings shall be decided by a majority of votes of Members
present and voting and any such decision shall for all purposes be deemed a decision of the Committee.
5.15 In the case of equality of votes, the Chairman of the meeting will have a casting vote.
5.16 The Company Secretary shall act as Secretary to the Committee.
6 Applicability: The Policy is applicable to Directors (Executive and Non Executive), Key Managerial Personnel and Senior
Management Personnel. This policy is divided into 3 parts as follows:
6.1 PART – A: Matters to be Dealt with, Perused and Recommended to the Board by the Nomination and Remuneration Committee:
The Committee shall:
I. Formulate the criteria for determining qualifications, positive attributes and independence of a
director.
II. Identify persons who are qualified to become Director and persons who may be appointed in Key
Managerial and Senior Management positions in accordance with the criteria laid down in this policy
as prescribed under section 178(2) of the Companies Act, 2013.
III. Recommend to the Board, appointment and removal of Director, KMP and Senior Management
Personnel with the criteria laid down in this policy.
6.1 PART – B: Policy for Appointment and Removal of Director, Independent Director KMP and Senior Management:
6.1 Appointment: I. The Committee shall identify and ascertain the integrity, qualification, expertise and experience of the
person for appointment as Director and recommend to the Board his / her appointment.
II. A person to be act as director should possess adequate qualification, expertise and experience for
the position he / she is considered for appointment. The Committee has discretion to decide whether
qualification, expertise and experience possessed by a person is sufficient / satisfactory for the
concerned position.
III. The Company shall not appoint or continue the employment of any person as Whole-time Director/
Managing Director/CEO who has attained the age of seventy years. Provided that the term of the
person holding this position may be extended beyond the age of seventy years with the approval
of shareholders by passing a special resolution based on the explanatory statement annexed to the
notice for such motion indicating the justification for extension of appointment beyond seventy years.
IV. For appointing any person as an Independent Director he/she should possess qualifications as
mentioned in section 149 of the Companies Act, 2013 and Rule 5 of The Companies (Appointment and
Qualification of Directors) Rules, 2014.
V. The candidate for a position at Company Secretary, Chief Financial Officer and Senior Management
level is met by the Head-HR/ Managing Director and the interview is targeted at assessing the candidate
on his/her functional and leadership capabilities and cultural fitment to the organisation. The Head-
HR/ Managing Director shall ensure that the person possesses adequate qualification, expertise and
experience for the position he / she is considered for appointment.
49ANNUAL REPORT 2017-18
CORPORATE REVIEW FINANCIAL STATEMENTSSTATUTORY REPORTS
VI. The Head-HR/ Managing Director Managing Director shall assess the shortlisted candidates for the
position of Company Secretary, Chief Financial Officer and Senior Management Level.
6.2.2 Disqualifications for Appointment of Directors: I. A person shall not be eligible for appointment as a director of a company if (a). He/she is of unsound
mind and stands so declared by a competent court; (b). He/she is an undercharged insolvent; (c). He/
she has applied to be adjudicated as an insolvent and his application is pending; (d). He/she has been
convicted by a court of any offence, whether involving moral turpitude or otherwise, and sentenced in
respect thereof to imprisonment for not less than six months and a period of five years has not elapsed
from the date of expiry of the sentence:
II. If a person has been convicted of any offence and sentenced in respect thereof to imprisonment for a
period as prescribed in companies Act, 2013, he/she shall not be eligible to be appointed as a director;
III. If any order disqualifying him/her for appointment as a director has been passed by a court or Tribunal
and the order is in force;
IV. He/she has not paid any calls in respect of any shares of the company held by him/her, whether alone
or jointly with others, and six months have elapsed from the last day fixed for the payment of the call;
V. He/she has been convicted of the offence dealing with related party transactions under section 188 at
any time during the last preceding five years; or He has not complied with sub-section (3) of section 152.
VI. No person who is or has been a director of a company which (a). Has not filed financial statements
or annual returns for any continuous period of three Financial Years; or (b). Has failed to repay the
deposits accepted by it or pay interest thereon or to redeem any debentures on the due date or pay
interest due thereon or pay any dividend declared and such failure to pay or redeem continues for one
year or more, shall be eligible to be re-appointed as a director of that company or appointed in other
company for a period of five years from the date on which the said company fails to do so.
VII. Other disqualification as may be prescribed under Companies Act, 2013 and under any other applicable
laws, rules.
6.2.3 Term / Tenure: I. The tenure for Directors, Managing Director/ Whole-Time Director/CEO shall be governed by the terms
defined in the Companies Act, 2013.
II. The tenure for other KMPs and Senior Management Personnel will be governed by Newgen HR Policy.
6.2.4 Term / Tenure for Independent Director: I. An Independent Director shall hold office for a term up to five consecutive years on the Board of the
Company and will be eligible for reappointment as specified in Companies Act, 2013. No Independent
Director shall hold office for more than two consecutive terms, but such Independent Director shall be
eligible for appointment after expiry of three years of ceasing to become an Independent Director.
II. Provided that an Independent Director shall not, during the said period of three years, be appointed
in or be associated with the Company in any other capacity, either directly or indirectly. At the time
of appointment of Independent Director, it should be ensured that number of Boards on which such
Independent Director serves is restricted to seven listed companies as an Independent Director and
three listed companies as an Independent Director in case such person is serving as a Whole-time
Director of a listed company.
III. The maximum tenure of Independent Directors shall also be in accordance with the Companies Act,
2013 and clarifications/ circulars issued by the Ministry of Corporate Affairs, in this regard, from time
to time.
50 Newgen Software Technologies Limited
6.2.5 Evaluation: I. The HR-Head/Managing Director performs the evaluation of performance of Company Secretary, Chief
Financial Officer and Senior Management Personnel at regular intervals as per Newgen HR Policy or
he can authorised any official person or respective reporting head of evaluated person to perform this
function.
II. The performance evaluation of Independent Directors shall be done by the Board, excluding the Director
being evaluated, basis the contributions made to the Board deliberations on various matters including
business strategy, financial strategy, operations, cost and risk management, etc., and suggestions given
in this regard.
6.2.6 Removal: I. Due to reasons for any disqualification mentioned in the Companies Act, 2013, rules made thereunder
or under any other applicable Act, rules and regulations, the Committee may recommend, to the Board
with reasons recorded in writing, removal of a Director, subject to the provisions and compliance of the
said Act, rules and regulations.
II. For other KMP or Senior Management Personnel the removal will be governed by Newgen HR Policy.
6.2.7 Retirement: I. The Director, KMP and Senior Management Personnel shall retire as per the applicable provisions of the
Companies Act, 2013 and the prevailing Newgen HR Policy.
II. The Managing Director will have the discretion to retain the Director, KMP, Senior Management
Personnel in the same position/remuneration or otherwise even after attaining the retirement age, for
the benefit of the Company subject to the applicable laws and rules.
6.3 PART – C: Policy Relating to the Remuneration for the Whole-Time Director, KMP and Senior Management Personnel:
6.3.1 Evaluation Process :
I. The performance metrics shall be defined by the Nomination and Remuneration Committee for
Directors, Managing Director/ Whole-Time Director/ CEO and for other KMPs & Senior Management
Personnel the metrics shall be determined by the Managing Director and / or HR-Head as per Newgen
HR Policy.
II. An holistic view of the ratings will be reviewed by the Board in relation to Directors, Managing Director/
Whole-Time Director/ CEO, whereas for other KMPs and Senior Management Personnel the same shall
be reviewed by the Managing Director and / or HR-Head as per Newgen HR Policy. The Managing
Director/ HR-Head shall do qualitative review of the performance based on the efforts put in by the
employee, results achieved and impact of the external and internal factors to arrive at the Final Rating.
6.3.2 Remuneration: I. The revision in the total remuneration is directly linked to the Final Rating for all employees. The
remuneration / compensation / commission etc., to other KMPs and Senior Management Personnel will
be determined by the Managing Director/ HR-Head in accordance with the Newgen HR Policy, which
is based on the Final rating, employee potential and market benchmark compensation.
II. The ESOP’s to the Senior Management Personnel will be determined by the Managing Director/ HR-
Head as prescribed under Newgen ESOP Scheme/(s) of the Company.
III. The remuneration/compensation/commission etc., to the Directors and Managing Director/ Whole-
Time Director/ CEO shall be subject to the prior / post approval of the Shareholders of the Company
and Central Government wherever required as per Companies Act, 2013.

51ANNUAL REPORT 2017-18
CORPORATE REVIEW FINANCIAL STATEMENTSSTATUTORY REPORTS
IV. The remuneration and commission to be paid to Whole Time Director/Managing Director/Independent
Director shall be in accordance with the percentage/ slabs/ conditions laid down in the Articles of
Association of the Company and as per the provision of the Companies Act, 2013 and the rules made
thereunder.
V. If any Managerial Personnel draws or receives, directly or indirectly by way of remuneration any such
sums in excess of the limits prescribed under the Companies Act, 2013 or without the prior sanction
of the Central Government, where required, he / she shall refund such sums to the Company and until
such sum is refunded, hold it in trust for the Company.
VI. Increments to the existing Remuneration /compensation structure may be recommended by the
Managing Director to the Committee and the Board which should be within the slabs approved by
the Shareholders in the case of Whole time Director/ Managing Director. Where any insurance is taken
by the Company on behalf of its Whole-Time Director, Managing Director, Chief Executive Officer,
Chief Financial Officer, Company Secretary and any other employee for indemnifying them against any
liability, the premium paid on such insurance shall not be treated as part of the remuneration payable
to any such personnel. Provided that if such person is proved to be guilty, the premium paid on such
Insurance may be treated as part of the remuneration.
VII. An Independent Director, promoter director shall not be entitled to any stock Option of the Company
as prescribed under Companies Act, 2013.
6.3.3 Sitting Fees: I. The Non- Executive / Independent Director may receive remuneration by way of fees for attending
meetings of Board or Committee thereof and by way of other means as may be prescribed by
applicable laws. Provided that the amount of such fees shall not exceed the maximum amount as
provided in the Companies Act, 2013, per meeting of the Board or Committee or such amount as
may be prescribed by the Central Government from time to time.
7 Amendment to the Policy: The Board of Directors on its own and / or as per the recommendations of Nomination and Remuneration
Committee can amend this Policy, as and when deemed fit. However, any amendment in respect of criteria
for determining qualifications, positive attributes and independence of directors shall be done with the
approval of Nomination and Remuneration Committee only.
In case of any amendment(s), clarification(s), circular(s) etc. issued by the relevant authorities, not being
consistent with the provisions laid down under this Policy, then such amendment(s), clarification(s),
circular(s) etc. shall prevail upon the provisions hereunder and this Policy shall stand amended accordingly
from the effective date as laid down under such amendment(s), Clarification, circular(s) etc.

52 Newgen Software Technologies Limited
Annexure 7
Corporate Social Responsibility (CSR) Report
[Pursuant to section 134 of the Companies Act, 2013 and Rule 9 of the Companies
(Corporate Social Responsibility) Rules, 2014]
1. A brief outline of the Company’s CSR policy, including overview of projects or programs proposed to be undertaken and a reference to the web-link to the CSR policy and projects or programs:
Newgen looks at CSR differently. We relate this to the Company’s core values, precisely driven by the
Newgen’s Code of Ethics & Business Conduct. We see our employees as a part of Newgen family and thus
the Community we dwell in becomes our extended family. We thus do not connect it to our business or
profit. It is not only our moral and social responsibility as a Corporate, but the obligation to empower them
so that India becomes an empowered nation in the years to come.
Newgen’s sustainability strategy is premised on the belief that transformational capacity of business can be
very effectively leveraged to create significant societal value through a spirit of innovation and enterprise.
The sustainability strategy aims to significantly contribute to both social and economic development of
young minds who would impact future of the nation. Presently we are dealing with 1500+ children under
our Newgen Digital Discovery Paathshala (NDDP) program and 1000+ children for mid-day meal with
Akshaya Patra Foundation. Our CSR Programs are as below:
i. Newgen Digital Discovery Paathshala (NDDP): The NDDP program is based on empowering children
through Digital Education. This stems from the vision of Newgen’s Chairman & Managing Director, Mr.
Diwakar Nigam. It aims at transforming their classroom sessions into fun–learning activities. To make
their education more meaningful, to achieve the same, their school curriculum is taken as the baseline.
The Newgen Digital Discovery Paathshala is a fun place to learn the textbook concepts digitally. Also,
Newgen’s facilitators are using methodologies like role play, quiz, movies and presentations while
conducting the sessions.
ii. NDDP at Harkesh Nagar: Newgen has adopted Government’s Girls’ Senior Secondary School, Harkesh
Nagar, Okhla. It is currently conducting classes for 1300+ children of 6th, 7th and 8th Standard.
iii. NDDP at Soami Nagar: After the successful completion of NDDP Pilot run for 150 children in the month of
February 2017, for 6th, 7th and 8th Standard students at Soami Nagar Model School, Newgen has adopted
the school in April 2017. The students are taught lessons using I-Pads, presentations and audio visuals.
iv. Partnership with Akshaya Patra Foundation: Newgen has recently collaborated with Akshaya Patra
to provide mid-day meal to 1000+ children in Government schools.
v. Partnership with SOS Village: Newgen has adopted six family houses at SOS Children’s Village. Three
are in Greenfields, Faridabad i.e. house number 6, 10 and 11 and three family houses at SOS Bhopal i.e.
house number 1, 2 and 3. Each house has ten children looked after by one mother. Newgen volunteers
conduct fun learning activities like arts & craft, diya painting, quizzes, quelling workshop with the
children and SOS mothers.
vi. SOS Youth Hostel: Personality Development sessions are conducted by “I AM” a professional
organisation, dealing with youth. The organisation conducts Personality development and career
counseling sessions. Once a month, children from SOS Youth hostel and Sadbhavna join in the session.
These sessions help to build self confidence, self esteem and enhance the personality development of
the children. As a monitoring mechanism the organisation submits an impact report of the activities
conducted during the year.

53ANNUAL REPORT 2017-18
CORPORATE REVIEW FINANCIAL STATEMENTSSTATUTORY REPORTS
Web-link to the CSR Policy:
https://newgensoft.com/company/about-newgen/corporate-social-responsibility/
2. The Composition of the CSR Committee: CSR Committee of the Board of Directors consists of Ms. Priyadarshini Nigam, Whole –Time Director, Mr. T.S.
Varadarajan, Whole time Director and Mr. Kaushik Dutta, Independent Director. Ms. Priyadarshini Nigam is
the Chairperson of the CSR Committee.
3. Average net profit of the company for last three Financial Years: ` 5306.58 Lakhs
4. Prescribed CSR Expenditure (two per cent of the amount as in item 3 above): ` 106.13 Lakhs
5. Details of CSR spent during the Financial Year 2017-18:
(a) Total amount spent during the Financial Year: ` 107.31 Lakhs
(b) Amount unspent, if any: NIL
(c) Manner in which the amount spent during the Financial Year is detailed below.
TABLE 27
(1) (2) (3) (4) (5) (6) (7) (8)S. No
CSR project or activity identified
SectorinwhichtheProjectis covered
Projects or programs(1) Local area or other(2) Specify the State and district where projects or programs were undertaken
Amount outlay (budget) project or programs wise
Amount spent on the projects or programsSub – heads: (1) Direct expenditure on projects or programs(2) Overheads
Cumulative expenditure upto to the reporting period
Amount spent: Direct or throughimplementing agency*
1. Adoption of
SOS Village
- Children
Families
Promoting
preventive
healthcare &
Education
Delhi NCR ` 33.75
Lakhs
` 33.75 Lakhs ` 33.75
Lakhs
Implementing
Agency.
Through
SOS Children
Village
2. Adoption of
SOS Village
Children
Families,
Training, and
educating
orphaned
children
Promoting
preventive
healthcare &
Education
Bhopal ` 33.75
Lakhs
` 33.75 Lakhs ` 33.75 Lakh Implementing
Agency.
Through
SOS Children
Village
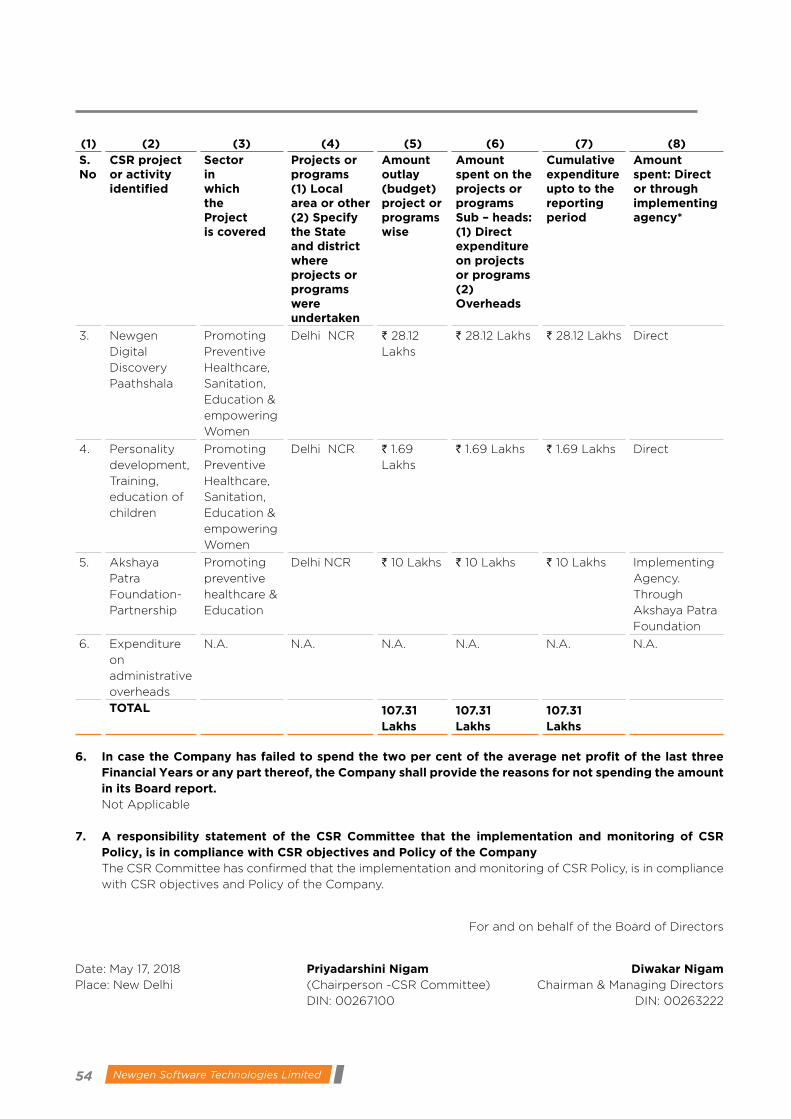
54 Newgen Software Technologies Limited
(1) (2) (3) (4) (5) (6) (7) (8)S. No
CSR project or activity identified
SectorinwhichtheProjectis covered
Projects or programs(1) Local area or other(2) Specify the State and district where projects or programs were undertaken
Amount outlay (budget) project or programs wise
Amount spent on the projects or programsSub – heads: (1) Direct expenditure on projects or programs(2) Overheads
Cumulative expenditure upto to the reporting period
Amount spent: Direct or throughimplementing agency*
3. Newgen
Digital
Discovery
Paathshala
Promoting
Preventive
Healthcare,
Sanitation,
Education &
empowering
Women
Delhi NCR ` 28.12
Lakhs
` 28.12 Lakhs ` 28.12 Lakhs Direct
4. Personality
development,
Training,
education of
children
Promoting
Preventive
Healthcare,
Sanitation,
Education &
empowering
Women
Delhi NCR ` 1.69
Lakhs
` 1.69 Lakhs ` 1.69 Lakhs Direct
5. Akshaya
Patra
Foundation-
Partnership
Promoting
preventive
healthcare &
Education
Delhi NCR ` 10 Lakhs ` 10 Lakhs ` 10 Lakhs Implementing
Agency.
Through
Akshaya Patra
Foundation
6. Expenditure
on
administrative
overheads
N.A. N.A. N.A. N.A. N.A. N.A.
TOTAL 107.31 Lakhs
107.31 Lakhs
107.31 Lakhs
6. In case the Company has failed to spend the two per cent of the average net profit of the last three Financial Years or any part thereof, the Company shall provide the reasons for not spending the amount in its Board report.
Not Applicable
7. A responsibility statement of the CSR Committee that the implementation and monitoring of CSR Policy, is in compliance with CSR objectives and Policy of the Company
The CSR Committee has confirmed that the implementation and monitoring of CSR Policy, is in compliance
with CSR objectives and Policy of the Company.
For and on behalf of the Board of Directors
Date: May 17, 2018 Priyadarshini Nigam Diwakar NigamPlace: New Delhi (Chairperson -CSR Committee) Chairman & Managing Directors
DIN: 00267100 DIN: 00263222

55ANNUAL REPORT 2017-18
CORPORATE REVIEW FINANCIAL STATEMENTSSTATUTORY REPORTS
Annexure 8
Report on Corporate Governance
The SEBI (Listing Obligations and Disclosure
Requirements) Regulations, 2015 became applicable
to the Company w.e.f. January 29, 2018, i.e. the date
when the Equity Shares of face value of ` 10/- of
the Company got listed on BSE Limited (BSE) and
National Stock Exchange of India Limited (NSE). The
information stated herein pertains to the Financial
Year 2017-18.
I. Corporate Governance Philosophy: Your Company’s philosophy on Corporate
Governance envisages accomplishment of a
high level of transparency, integrity, honesty and
accountability in the conduct of its businesses
and puts high prominence towards regulatory
compliances. Effective Corporate Governance
practices constitute the strong foundation on
which successful business organisation are built
to last. At Newgen, Corporate Governance is
considered as a benchmark for efficient working
of the Board of Directors, Management reviews,
strong control procedures and a guiding culture
for employees. Your Company always strives to
adopt best global practices in the Corporate
Governance and remains up-to-date with the
continuous developments in the Corporate
Governance practices.
II. Board of Directors: a) As on March 31, 2018, the Board comprises
of six Directors, out of which three Directors
(i.e. 50%) are Executive Directors including
one-woman Director and three Directors
(i.e. 50%) are Non-Executive Directors in
the category of Independent Directors. The
profiles of the Directors can be found on the
Company’s website: https://newgensoft.com.
The composition of the Board is in conformity
with the requirements of the Companies Act,
2013 (the “Act”) including the rules framed
thereunder and the SEBI (Listing Obligations
and Disclosure Requirements) Regulations, 2015.
b) None of the Directors on the Board hold
directorships in more than ten public
Companies. Further none of them is a member
of more than ten Committees or chairman
of more than five Committees across all the
public Companies in which he is a Director, as
prescribed under SEBI (Listing Obligations
and Disclosure Requirements) Regulations,
2015. Necessary disclosures regarding their
directorship and the Committee positions in
other public Companies as on March 31, 2018
have been made by the Directors.
c) Independent Directors are non-executive
directors as defined under Regulation 16(1)
(b) of the SEBI (Listing Obligations and
Disclosure Requirements) Regulations,
2015 read with Section 149(6) of the Act.
The maximum tenure of Independent
Directors is in compliance with the Act.
All the Independent Directors have
confirmed that they meet the criteria
of independence as mentioned under
Regulation 16(1)(b) of the SEBI Listing
Regulations read with Section 149(6) of
the Companies Act, 2013.
d) As on March 31, 2018, there are no
institutional nominee director on the Board
of the Company.
e) The names and categories of the Directors
on the Board, their attendance at Board
Meetings held during the Financial Year
2017-18 and at the last Annual General
Meeting (AGM) and the number of
Directorships and Committee Chairmanships
/ Memberships held by them in other public
limited Companies as on March 31, 2018
are given herein below. For the purpose
of determination of the limit of Directors,
in the Committees, chairpersonship and
membership of the Audit Committee and
Stakeholders’ Relationship Committee has
alone been considered as per SEBI (Listing
Obligations and Disclosure Requirements)
Regulations, 2015.
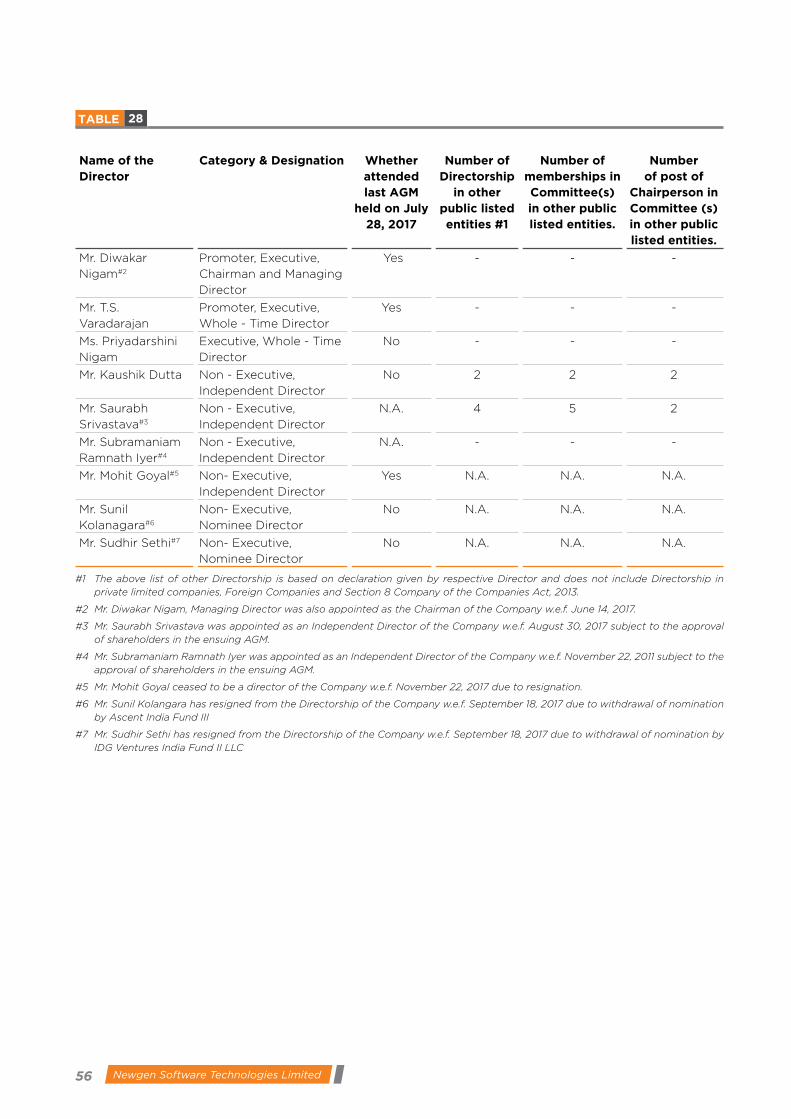
56 Newgen Software Technologies Limited
TABLE 28
Name of the Director
Category & Designation Whether attended last AGM
held on July 28, 2017
Number of Directorship
in other public listed entities #1
Number of memberships in Committee(s) in other public listed entities.
Number of post of
Chairperson in Committee (s) in other public listed entities.
Mr. Diwakar
Nigam#2
Promoter, Executive,
Chairman and Managing
Director
Yes - - -
Mr. T.S.
Varadarajan
Promoter, Executive,
Whole - Time Director
Yes - - -
Ms. Priyadarshini
Nigam
Executive, Whole - Time
Director
No - - -
Mr. Kaushik Dutta Non - Executive,
Independent Director
No 2 2 2
Mr. Saurabh
Srivastava#3
Non - Executive,
Independent Director
N.A. 4 5 2
Mr. Subramaniam
Ramnath Iyer#4
Non - Executive,
Independent Director
N.A. - - -
Mr. Mohit Goyal#5 Non- Executive,
Independent Director
Yes N.A. N.A. N.A.
Mr. Sunil
Kolanagara#6
Non- Executive,
Nominee Director
No N.A. N.A. N.A.
Mr. Sudhir Sethi#7 Non- Executive,
Nominee Director
No N.A. N.A. N.A.
#1 The above list of other Directorship is based on declaration given by respective Director and does not include Directorship in private limited companies, Foreign Companies and Section 8 Company of the Companies Act, 2013.
#2 Mr. Diwakar Nigam, Managing Director was also appointed as the Chairman of the Company w.e.f. June 14, 2017.
#3 Mr. Saurabh Srivastava was appointed as an Independent Director of the Company w.e.f. August 30, 2017 subject to the approval of shareholders in the ensuing AGM.
#4 Mr. Subramaniam Ramnath Iyer was appointed as an Independent Director of the Company w.e.f. November 22, 2011 subject to the approval of shareholders in the ensuing AGM.
#5 Mr. Mohit Goyal ceased to be a director of the Company w.e.f. November 22, 2017 due to resignation.
#6 Mr. Sunil Kolangara has resigned from the Directorship of the Company w.e.f. September 18, 2017 due to withdrawal of nomination by Ascent India Fund III
#7 Mr. Sudhir Sethi has resigned from the Directorship of the Company w.e.f. September 18, 2017 due to withdrawal of nomination by IDG Ventures India Fund II LLC

57ANNUAL REPORT 2017-18
CORPORATE REVIEW FINANCIAL STATEMENTSSTATUTORY REPORTS
f) During the Financial Year 2017-18, total 9 Board meetings were held as per details given below:
TABLE 29
Name of the
Director
Category Date(s) of the Board Meetings
25.04.
2017
14.06.
2017
18.09.
2017
21.09.
2017
24.11.
2017
05.01.
2018
19.01.
2018
24.01.
2018
28.03.
2018
Mr. Diwakar Nigam Promoter, Chairman
and Managing Director
Yes Yes Yes Yes Yes Yes Yes Yes Yes
Mr. T.S. Varadarajan Promoter, Executive,
Whole - Time Director
Yes Yes Yes Yes No Yes No Yes Yes
Ms. Priyadarshini
Nigam
Executive, Whole - Time
Director
Yes Yes Yes Yes Yes Yes Yes Yes Yes
Mr. Kaushik Dutta Non- Executive and
Independent Director
Yes Yes Yes Yes No Yes Yes No Yes
Mr. Saurabh
Srivastava
Non- Executive and
Independent Director
N.A. N.A. Yes No Yes No Yes Yes Yes
Mr. Subramaniam
Ramnath Iyer
Non- Executive and
Independent Director
N.A. N.A. N.A. N.A. Yes Yes Yes Yes Yes
Mr. Mohit Goyal Non- Executive and
Independent Director
Yes Yes Yes No N.A. N.A. N.A. N.A. N.A.
Mr. Sunil Kolanagara Non-executive and
Nominee Director
Yes Yes No N.A. N.A. N.A. N.A. N.A. N.A.
Mr. Sudhir Sethi Non-executive and
Nominee Director
No Yes Yes N.A. N.A. N.A. N.A. N.A. N.A.
The necessary Quorum was present for all the meetings and all the meetings were held within maximum prescribed time gap.
g) Disclosure of relationship between Directors inter-se:
Except Ms. Priyadarshini Nigam, Whole-time Director who is the spouse of Mr. Diwakar Nigam, Chairman &
Managing Director of the Company, none of the other Director is a relative of another Director(s).
h) Details of Equity Shares of the Company held by the Directors as on March 31, 2018 are given below:
TABLE 30
Name of the Director Category Number of Equity Shares
Mr Diwakar Nigam Chairman and Managing Director 1,84,22,406
Mr. T.S. Varadarajan Whole-time Director 1,50,09,306
Ms. Priyadarshini Nigam Whole-time Director 79,68,906
Mr. Kaushik Dutta Independent Director NIL
Mr. Saurabh Srivastava Independent Director NIL
Mr. Subramaniam Ramnath Iyer Independent Director NIL
As on March 31, 2018, the Company does not have any outstanding convertible instruments.
i) The details of the familiarisation programme for Independent Directors are given below:
With a view to familiarise Independent
Directors, as required under Regulation 25(7)
of the SEBI (Listing Obligations and Disclosure
Requirements) Regulations, 2015 and Schedule
IV to the Companies Act, 2013, Newgen
Software Technologies Limited (the “Company”)
has introduced a program to familiarize the
Independent Directors with the Company, their
roles, rights and responsibilities in the Company,
nature of the industry in which the Company
operates, business model of the Company etc.
The Company has divided the familiarisation
initiatives in two parts viz, orientation programme
upon induction of new director and other
initiatives to update the directors on a continuing
basis.
Orientation Programme upon Induction of New Director:
A set of information is being handed over to
the new inductee, which includes the latest
Annual Report and various policies such as
Code of Conduct, Whistle Blower Policy,
Nomination & Remuneration Policy, Policy on
58 Newgen Software Technologies Limited
Related Party Transactions, Insider Trading etc.
A detailed Appointment Letter is being issued
to the Independent Directors incorporating the
role, duties and responsibilities, remuneration
and performance evaluation process etc. A
brief introduction is being provided about
the Company, its subsidiaries and associate
companies.
Other Initiatives to update the Directors on a continuing basis:
Meetings with Company’s officials have been
arranged as and when necessary to understand
the business and operations of the Company.
The presentations at Board meetings include
updates on business operations and financial
performance, working capital management,
senior management changes, compliances,
cash flow, budgets, operation of the Company’s
subsidiaries.
The familiarisation of Independent Directors
can be find on the website of the Company:
https://newgensoft.com.
III. Composition of Committees of the Board: There are total five (5) Board Committees as on
March 31, 2018 comprising four (4) mandatory
Committees and one (1) other Committee that
have been constituted considering the best
practices in Corporate Governance and needs of
the Company:
1. Audit Committee: The Board had constituted first Audit Committee
at its meeting held on November 18, 2002 and
subsequently reconstituted the Committee
from time to time. At present, Committee was
constituted by the Board on November 22, 2017
and is in compliance with Section 177 of the
Companies Act, 2013 and Regulation 18 of the SEBI
(Listing Obligations and Disclosure Requirements)
Regulations, 2015.
The terms of reference of the Audit Committee
are as set forth below:
Powers of Audit Committee: The Audit Committee shall have powers, including
the following:
(1) To investigate any activity within its terms of
reference;
(2) To seek information from any employee;
(3) To obtain outside legal or other professional
advice; and
(4) To secure attendance of outsiders with
relevant expertise, if it considers necessary.
Role of Audit Committee The role of the Audit Committee shall include the
following:
(1) Oversight of the Company’s financial
reporting process and the disclosure of
its financial information to ensure that the
financial statements are correct, sufficient
and credible;
(2) Recommendation for appointment, re-
appointment, replacement, remuneration
and terms of appointment of auditors of the
Company and the fixation of the audit fee;
(3) Approval of payment to statutory auditors
for any other services rendered by the
statutory auditors;
(4) Reviewing, the financial statements with
respect to its unlisted Subsidiary(ies),
in particular investments made by such
subsidiary(ies) of the Company;
(5) Reviewing, with the management, the annual
financial statements and auditor’s report
thereon before submission to the Board for
approval, with particular reference to:
a. Matters required to be included in the
Directors’ Responsibility Statement
to be included in the Board’s report in
terms of clause (c) of sub-Section 3 of
Section 134 of the Companies Act, 2013;
b. Changes, if any, in accounting policies
and practices and reasons for the same;
c. Major accounting entries involving
estimates based on the exercise of
judgment by management;
d. Significant adjustments made in the
financial statements arising out of audit
findings;
e. Compliance with listing and other
legal requirements relating to financial
statements;
f. Disclosure of any related party
transactions; and
g. Modified opinion(s) in the draft audit
report.
(6) Reviewing, with the management, the
quarterly, half-yearly and annual financial
statements before submission to the Board
for approval;
(7) Reviewing, with the management, the
statement of uses / application of funds
raised through an issue (public issue, rights

59ANNUAL REPORT 2017-18
CORPORATE REVIEW FINANCIAL STATEMENTSSTATUTORY REPORTS
issue, preferential issue, etc.), the statement of
funds utilised for purposes other than those
stated in the offer document / prospectus
/ notice and the report submitted by the
monitoring agency monitoring the utilisation
of proceeds of a public or rights issue, and
making appropriate recommendations to
the Board to take up steps in this matter;
(8) Reviewing and monitoring the auditor’s
independence and performance, and
effectiveness of audit process;
(9) Approval of any subsequent modification
of transactions of the Company with
related parties and omnibus approval for
related party transactions proposed to be
entered into by the Company, subject to the
conditions as may be prescribed;
Explanation: The term “related party
transactions” shall have the same meaning
as provided in Clause 2(zc) of the SEBI
Listing Regulations and/or the applicable
Accounting Standards and/or the Companies
Act, 2013.
(10) Scrutiny of inter-corporate loans and
investments;
(11) Valuation of undertakings or assets of the
Company, wherever it is necessary;
(12) Evaluation of internal financial controls and
risk management systems;
(13) Reviewing, with the management,
performance of statutory and internal
auditors, adequacy of the internal control
systems;
(14) Reviewing the adequacy of internal audit
function, if any, including the structure
of the internal audit department, staffing
and seniority of the official heading the
department, reporting structure coverage
and frequency of internal audit;
(15) Discussion with internal auditors of any
significant findings and follow up there on;
(16) Reviewing the findings of any internal
investigations by the internal auditors into
matters where there is suspected fraud or
irregularity or a failure of internal control
systems of a material nature and reporting
the matter to the board;
(17) Discussion with statutory auditors before
the audit commences, about the nature
and scope of audit as well as post-audit
discussion to ascertain any area of concern;
(18) Looking into the reasons for substantial
defaults in the payment to depositors,
debenture holders, shareholders (in case of
non-payment of declared dividends) and
creditors;
(19) Recommending to the board the
appointment and removal of the external
auditor, fixation of audit fees and approval
for payment for any other services;
(20) Reviewing the functioning of the whistle
blower mechanism;
(21) Overseeing the vigil mechanism established
by the Company, with the chairman of
the audit Committee directly hearing
grievances of victimisation of employees
and directors, who used vigil mechanism
to report genuine concerns in appropriate
and exceptional cases;
(22) Carrying out any other functions required
to be carried out by the audit Committee in
terms of applicable law.
The audit Committee shall mandatorily review
the following information:
a) Management discussion and analysis
of financial condition and results of
operations;
b) Statement of significant related party
transactions (as defined by the audit
Committee), submitted by management;
c) Management letters / letters of internal
control weaknesses issued by the statutory
auditors;
d) Internal audit reports relating to internal
control weaknesses;
e) The appointment, removal and terms of
remuneration of the chief internal auditor
shall be subject to review by the audit
Committee; and
f) Statement of deviations in terms of the SEBI
listing regulations:
i. Quarterly statement of deviation(s)
including report of monitoring agency,
if applicable, submitted to stock
exchange(s) in terms of the SEBI listing
regulations;
ii. Annual statement of funds utilised for
purposes other than those stated in
the offer document/prospectus/notice in
terms of the SEBI listing regulations.
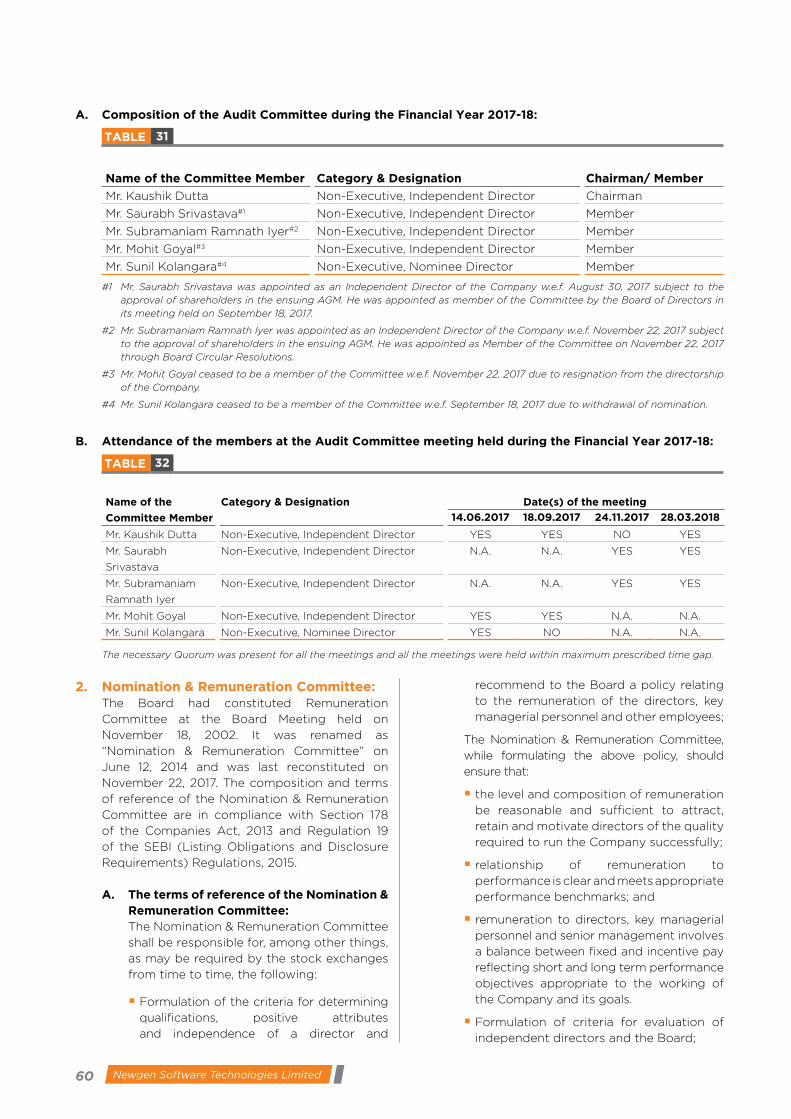
60 Newgen Software Technologies Limited
A. Composition of the Audit Committee during the Financial Year 2017-18:
TABLE 31
Name of the Committee Member Category & Designation Chairman/ Member
Mr. Kaushik Dutta Non-Executive, Independent Director Chairman
Mr. Saurabh Srivastava#1 Non-Executive, Independent Director Member
Mr. Subramaniam Ramnath Iyer#2 Non-Executive, Independent Director Member
Mr. Mohit Goyal#3 Non-Executive, Independent Director Member
Mr. Sunil Kolangara#4 Non-Executive, Nominee Director Member
#1 Mr. Saurabh Srivastava was appointed as an Independent Director of the Company w.e.f. August 30, 2017 subject to the approval of shareholders in the ensuing AGM. He was appointed as member of the Committee by the Board of Directors in its meeting held on September 18, 2017.
#2 Mr. Subramaniam Ramnath Iyer was appointed as an Independent Director of the Company w.e.f. November 22, 2017 subject to the approval of shareholders in the ensuing AGM. He was appointed as Member of the Committee on November 22, 2017 through Board Circular Resolutions.
#3 Mr. Mohit Goyal ceased to be a member of the Committee w.e.f. November 22, 2017 due to resignation from the directorship of the Company.
#4 Mr. Sunil Kolangara ceased to be a member of the Committee w.e.f. September 18, 2017 due to withdrawal of nomination.
B. Attendance of the members at the Audit Committee meeting held during the Financial Year 2017-18:
TABLE 32
Name of the
Committee Member
Category & Designation Date(s) of the meeting
14.06.2017 18.09.2017 24.11.2017 28.03.2018
Mr. Kaushik Dutta Non-Executive, Independent Director YES YES NO YES
Mr. Saurabh
Srivastava
Non-Executive, Independent Director N.A. N.A. YES YES
Mr. Subramaniam
Ramnath Iyer
Non-Executive, Independent Director N.A. N.A. YES YES
Mr. Mohit Goyal Non-Executive, Independent Director YES YES N.A. N.A.
Mr. Sunil Kolangara Non-Executive, Nominee Director YES NO N.A. N.A.
The necessary Quorum was present for all the meetings and all the meetings were held within maximum prescribed time gap.
2. Nomination & Remuneration Committee: The Board had constituted Remuneration
Committee at the Board Meeting held on
November 18, 2002. It was renamed as
“Nomination & Remuneration Committee” on
June 12, 2014 and was last reconstituted on
November 22, 2017. The composition and terms
of reference of the Nomination & Remuneration
Committee are in compliance with Section 178
of the Companies Act, 2013 and Regulation 19
of the SEBI (Listing Obligations and Disclosure
Requirements) Regulations, 2015.
A. The terms of reference of the Nomination & Remuneration Committee:
The Nomination & Remuneration Committee
shall be responsible for, among other things,
as may be required by the stock exchanges
from time to time, the following:
§ Formulation of the criteria for determining
qualifications, positive attributes
and independence of a director and
recommend to the Board a policy relating
to the remuneration of the directors, key
managerial personnel and other employees;
The Nomination & Remuneration Committee,
while formulating the above policy, should
ensure that:
§ the level and composition of remuneration
be reasonable and sufficient to attract,
retain and motivate directors of the quality
required to run the Company successfully;
§ relationship of remuneration to
performance is clear and meets appropriate
performance benchmarks; and
§ remuneration to directors, key managerial
personnel and senior management involves
a balance between fixed and incentive pay
reflecting short and long term performance
objectives appropriate to the working of
the Company and its goals.
§ Formulation of criteria for evaluation of
independent directors and the Board;

61ANNUAL REPORT 2017-18
CORPORATE REVIEW FINANCIAL STATEMENTSSTATUTORY REPORTS
§ Devising a policy on Board diversity;
§ Identifying persons who are qualified
to become directors and who may be
appointed in senior management in
accordance with the criteria laid down, and
recommend to the Board their appointment
and removal and shall carry out evaluation
of every director’s performance (including
independent director);
§ Whether to extend or continue the term of
appointment of the independent director,
on the basis of the report of performance
evaluation of directors; and
§ Carrying out any other functions required
to be undertaken by the Nomination
& Remuneration Committee under
applicable law.”
Administer and implement the Newgen
ESOP-2014 Scheme including:
§ delegation of duties and powers in whole
or in part as it determines, to one or more
officers of the Company and/ or to any
one or more sub-Committees in respect of
Newgen ESOP schemes;
§ to choose eligible employees for grant of
Options and formulate the detailed terms
and conditions of the scheme;
§ to meet at such intervals as may be
required for consideration of grant of
Options and for giving Options to exercise;
§ to take decision about the criteria of
employees to whom shares, under Newgen
ESOP-2014 scheme, to be directly issued
or through transfer of shares from trust as
may be set up under this scheme; and
§ to do all such other act and matters as may
be provided in the Newgen ESOP-2014
Scheme and empowered by the Board of
Directors time to time.
B. Composition of the Nomination & Remuneration Committee during the Financial Year 2017-18:
TABLE 33
Name of the Committee Member Category Chairman/ Member
Mr. Subramaniam Ramnath Iyer#1 Non-Executive, Independent Director Chairman
Mr. Saurabh Srivastava#2 Non-Executive, Independent Director Member
Mr. Kaushik Dutta Non-Executive, Independent Director Member
Mr. Mohit Goyal#3 Non-Executive, Independent Director Member
Mr. Sudhir Sethi#4 Non-Executive, Nominee Director Member
#1 Mr. Saurabh Srivastava was appointed as an Independent Director of the Company w.e.f. August 30, 2017 subject to the approval of shareholders in the ensuing AGM. He was appointed as member of the Committee by the Board of Directors in its meeting held on September 18, 2017.
#2 Mr. Subramaniam Ramnath Iyer was appointed as Chairman of the Committee w.e.f. November 22, 2017 subject to the approval of shareholders in the ensuing AGM. He was appointed as Member of the Committee on November 22, 2017 through passing Board Circular Resolutions.
#3 Mr. Mohit Goyal, Chairman of the Committee, ceased to be a member of the Committee w.e.f. November 22, 2017 due to resignation from the directorship of the Company.
#4 Mr. Sudhir Sethi ceased to be a member of the Committee w.e.f. September 18, 2017 due to withdrawal of nomination.
C. Meetings and attendance of the Nomination & Remuneration Committee meeting held during the Financial Year 2017-18:
During the Financial Year 2017-18 total 3 Nomination & Remuneration Committee meetings were held as below:
TABLE 34
Name of the Committee
Member
Category Date of the meeting
14.06.2017 30.08.2017 18.09.2017
Mr. Subramaniam Ramnath Iyer Non-Executive, Independent Director N.A. N.A. N.A.
Mr. Saurabh Srivastava Non-Executive, Independent Director N.A. N.A. N.A.
Mr. Kaushik Dutta Non-Executive, Independent Director YES YES YES
Mr. Mohit Goyal Non-Executive, Independent Director YES YES YES
Mr. Sudhir Sethi Non-Executive, Nominee Director YES YES YES
The necessary Quorum was present for all the meetings and all the meetings were held within maximum prescribed time gap.

62 Newgen Software Technologies Limited
D. Board Annual Evaluation: Pursuant to the provisions of Section 178 of the
Companies Act, 2013 and Regulation 19(4) read
with Part D of the Schedule II to the SEBI (Listing
Obligations and Disclosure Requirements)
Regulations, 2015, the Board has carried out
the annual performance evaluation of its own
performance, Board Committees and that of the
Individual Director.
The performance of the Board was evaluated
by the Board itself after seeking the inputs from
all the directors on the basis of the criteria such
as structure & composition of Board Culture,
effectiveness of Board processes, functioning,
execution and performance of specific duties,
obligations and governance etc. The performance
of Committees was evaluated by the Board
after seeking inputs from respective Committee
members on the basis of the criteria such as
composition of Committees, effectiveness
of Committee meetings, and quality of
recommendation to the Board etc.
The Board and the Nomination & Remuneration
Committee reviewed the performance of the
individual directors on the basis of the criteria
such as the contribution of the individual
director to the Board and Committee meetings
like preparedness on the issues to be discussed,
meaningful and constructive contribution and
inputs in meetings, etc. In addition, the Chairman
was also evaluated on the key aspects of his
role. In a separate meeting of Independent
Directors, performance of Non-Independent
Directors, performance of the Board as a whole
and performance of the Chairman was evaluated,
taking into account the views of executive
directors and non-executive directors. The same
was discussed in the board meeting held on May
17, 2018.
The performance evaluation of the Independent
Directors was carried out by the entire Board. All
the Directors expressed their satisfaction with
the evaluation process.
E. Details of the Remuneration of Directors: (i) Pecuniary transactions with Non-Executive
Directors: During the year under review, there was no
pecuniary transaction with any of the Non-
Executive Director of the Company except
payment of sitting fees.
The Register of Contracts is maintained by
the Company under Section 189 of the Act
and the same is placed before the Board for
approval from time to time, as required.
(ii) Criteria of making payments to Non-Executive Directors:
Independent Directors (“ID”) and Non-
Executive Directors (“NED”) receive
remuneration of ` 1,00,000 (Rupees One
Lakh) by way of sitting fees for attending
each of the meeting of the Board and of
the Committees which is within the limits
prescribed under the provisions of the
Companies Act, 2013.
(iii) Details of Remuneration to Directors:
TABLE 35
§ Non-Executive Directors:
Name Sitting Fees (` in Lakhs) Other Expenses reimbursed, if any
Kaushik Dutta 14 Nil
Saurabh Srivastava 7 Nil
Subramaniam Ramnath Iyer 7 Nil
Mohit Goyal 8 Nil
§ Executive Directors: (in `)
Particulars Name of the Executive DirectorsDiwakar Nigam T.S. Varadarajan Priyadarshini Nigam
Salary 15970240 7543360 3888400
Benefits, Perquisites & Allowances 64440 88428 39600
Commission - - -
Bonus - - -
ESOPs - - -
§ Mr. Diwakar Nigam has been appointed as Managing Director by the shareholders, in 25th Annual
General Meeting, for the period of three years with effect from June 1, 2017.

63ANNUAL REPORT 2017-18
CORPORATE REVIEW FINANCIAL STATEMENTSSTATUTORY REPORTS
§ Mr. T.S. Varadarajan has been appointed as
Whole-time Director by the shareholders, in
25th Annual General Meeting, for the period
of three years with effect from June 1, 2017.
§ Ms. Priyadarshini Nigam has been appointed
as Whole-time Director by the shareholders,
in 25th Annual General Meeting, for the period
of three years with effect from June 1, 2017.
3. Stakeholders’ Relationship Committee: The Board constituted the Stakeholders
Relationship Committee on June 14, 2017
and had last reconstituted the Committee on
November 22, 2017 and the composition is in
compliance with Section 178 of the Companies
Act, 2013 and Regulation 20 of the SEBI (Listing
Obligations and Disclosure Requirements)
Regulations, 2015.
A. The terms of reference of the Stakeholders’ Relationship Committee:
a. Considering and resolving grievances of
shareholders, and other security holders;
b. Redressal of grievances of the security
holders of the Company, including complaints
in respect of allotment of Equity Shares,
transfer of Equity Shares, non-receipt of
declared dividends, annual reports, balance
sheets of the Company, etc.;
c. Allotment of Equity Shares;
d. Issue of duplicate certificates and new
certificates on split/consolidation/renewal,
etc.; and
e. Carrying out any other functions required to be
undertaken by the Stakeholders’ Relationship
Committee under applicable law.
B. Composition of the Stakeholders’ Relationship Committee during the Financial Year 2017-18:
TABLE 36
Name of the Committee Member Category Chairman/ Member
Mr. Subramaniam Ramnath Iyer Non-Executive, Independent Director Chairman
Mr. Diwakar Nigam Executive Director Member
Mr. T.S. Varadarajan Executive Director Member
C. Meetings and attendance of the Stakeholders’ Relationship Committee meeting held during the Financial Year 2017-18:
During the Financial Year 2017-18 no meeting of the Committee was held.
D. Details of Investor Complaints received and redressed during the year 2017-18 are as follows:
In view of listing of Company’s equity shares on stock exchanges, during the year i.e. effective January 29, 2018, the communication and / or correspondence received during the aforesaid period were primarily pertaining to the Initial Public Offer of the equity shares of the Company of ` 10 each (“IPO”). These correspondences included queries regarding:
§ non- receipt of refund order; and
§ non-receipt of electronic credit of shares.
During the period from the date of listing till March 31, 2018, the Company received and disposed off 79 investor queries/ complaints. All the grievances were resolved to the satisfaction of shareholders and investors, and as on March 31, 2018, there were no pending issues to be addressed or resolved.
E. Name, Designation and Contact details of Compliance Officer:
Mr. Aman Mourya, Company Secretary & Compliance Officer
Newgen Software Technologies Limited E-44/13, Okhla Phase - II,
New Delhi - 110 020 Phone: 91-11 46533200 E-mail: [email protected]
4. Corporate Social Responsibility Committee (CSR):
The Board has constituted Corporate Social Responsibility Committee on June 12, 2014 and its composition and terms of reference are in compliance with Section 135 of the Companies Act, 2013.
A. The terms of reference of the Corporate Social Responsibility Committee:
§ To formulate and recommend to the Board, a Corporate Social Responsibility Policy of the Company which shall indicate the activities to be undertaken by the Company as specified in Schedule VII of the Companies Act, 2013;
§ To recommend the amount of expenditure to be incurred on activities referred in the law;
§ To monitor the Corporate Social Responsibility Policy of the Company from time to time;
§ To take decisions and to spend the amount in CSR related activities and projects as defined in the CSR Policy of the Company.

64 Newgen Software Technologies Limited
C. Meetings and attendance of the Corporate Social Responsibility Committee meeting held during the Financial Year 2017-18:
During the Financial Year 2017-18 one Corporate Social Responsibility Committee meeting was held as below:
TABLE 38
Name of the Committee
Member
Category Date of the meeting
14.06.2017
Ms. Priyadarshini Nigam Executive Director YES
Mr. Kaushik Dutta Non-Executive, Independent Director YES
Mr. T.S. Varadarajan Executive Director YES
B. Composition of the Corporate Social Responsibility Committee during the Financial Year 2017-18:
TABLE 37
Name of the Committee Member Category Chairman/ Member
Ms. Priyadarshini Nigam Executive Director Chairperson
Mr. Kaushik Dutta Non-Executive, Independent Director Member
Mr. T.S. Varadarajan Executive Director Member
5. Other Committees 5.1. Finance and Operations Committee: The Board has constituted the Finance Committee on January 22, 2008 and it was last reconstituted
and renamed as “Finance and Operations Committee” on March 28, 2018.
A. The terms of reference of the Finance and Operations Committee: 1. To provide the authorisation for applying, negotiating and finalising, with the existing/proposed
Bankers, the sanctioning/renewal of the Temporary / Ad hoc / Regular Working Capital or
Short-Term Finance / Loan requirements, whether fund based or non-fund based (LC/BG),
interchangeable or otherwise in the ordinary course of business;
2. To provide authorisation to open, operate and close the Bank Account(s) of the Company, to
change the Authorised Signatories therein from time to time; and to provide authorisation in
respect of executing/ submitting bank related documents.
3. To provide authorisation to take on lease/rent/or on Leave and license basis any premises in the
ordinary course of business or for the purpose of guest house of the Company and execution
of agreements, papers and other document thereto and to deal with any Government or semi-
government departments/ authorities, local bodies and corporation for registration of such
agreements/documents with Registrar or Sub- Registrar.
4. To act as per the Investment Policy approved by the Board of Directors.
5. To provide authorisation to deal with State, Central Government or Government authorities,
Statutory Corporations, government undertaking, local bodies.
B. Composition of the Finance and Operation Committee during Financial Year 2017-18:
TABLE 39
Name of the Committee Member Category Chairman/ Member
Mr. T.S. Varadarajan Executive Director Chairman
Mr. Diwakar Nigam Executive Director Member
Ms. Priyadarshini Nigam Executive Director Member
Whereas, Mr. Arun Kumar Gupta will be permanent invitee to this Committee.
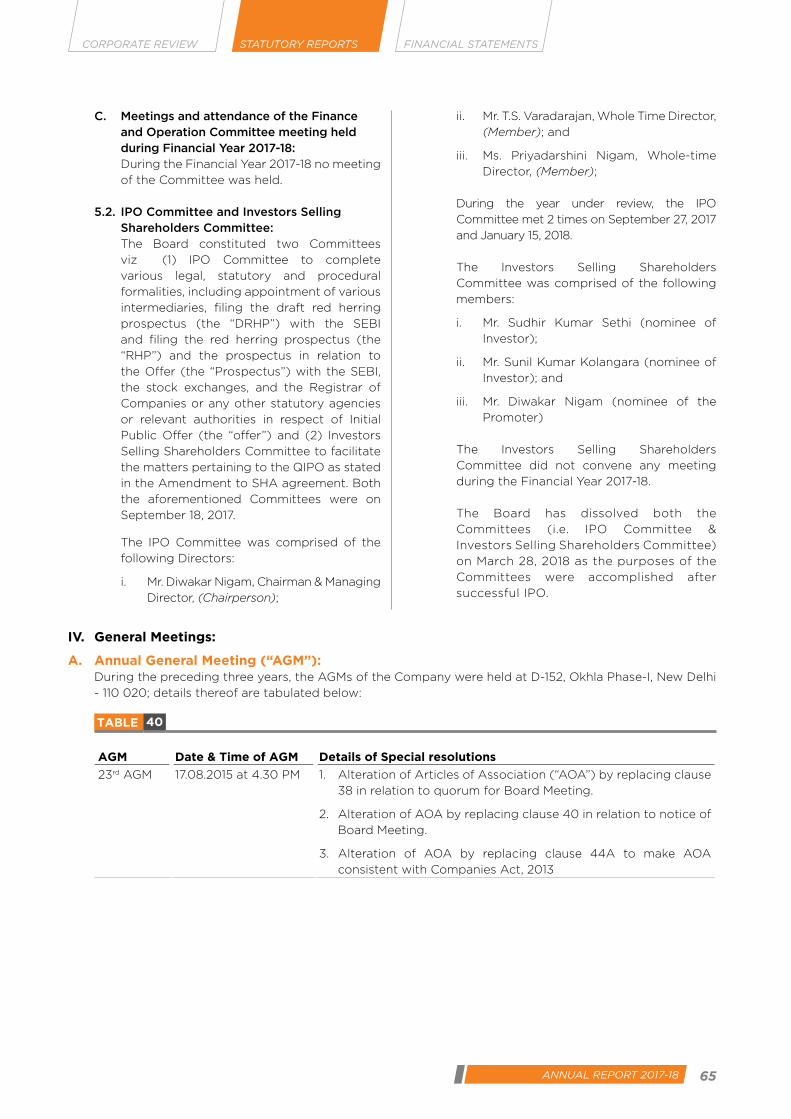
65ANNUAL REPORT 2017-18
CORPORATE REVIEW FINANCIAL STATEMENTSSTATUTORY REPORTS
C. Meetings and attendance of the Finance and Operation Committee meeting held during Financial Year 2017-18:
During the Financial Year 2017-18 no meeting
of the Committee was held.
5.2. IPO Committee and Investors Selling Shareholders Committee:
The Board constituted two Committees
viz (1) IPO Committee to complete
various legal, statutory and procedural
formalities, including appointment of various
intermediaries, filing the draft red herring
prospectus (the “DRHP”) with the SEBI
and filing the red herring prospectus (the
“RHP”) and the prospectus in relation to
the Offer (the “Prospectus”) with the SEBI,
the stock exchanges, and the Registrar of
Companies or any other statutory agencies
or relevant authorities in respect of Initial
Public Offer (the “offer”) and (2) Investors
Selling Shareholders Committee to facilitate
the matters pertaining to the QIPO as stated
in the Amendment to SHA agreement. Both
the aforementioned Committees were on
September 18, 2017.
The IPO Committee was comprised of the
following Directors:
i. Mr. Diwakar Nigam, Chairman & Managing
Director, (Chairperson);
ii. Mr. T.S. Varadarajan, Whole Time Director,
(Member); and
iii. Ms. Priyadarshini Nigam, Whole-time
Director, (Member);
During the year under review, the IPO
Committee met 2 times on September 27, 2017
and January 15, 2018.
The Investors Selling Shareholders
Committee was comprised of the following
members:
i. Mr. Sudhir Kumar Sethi (nominee of
Investor);
ii. Mr. Sunil Kumar Kolangara (nominee of
Investor); and
iii. Mr. Diwakar Nigam (nominee of the
Promoter)
The Investors Selling Shareholders
Committee did not convene any meeting
during the Financial Year 2017-18.
The Board has dissolved both the
Committees (i.e. IPO Committee &
Investors Selling Shareholders Committee)
on March 28, 2018 as the purposes of the
Committees were accomplished after
successful IPO.
IV. General Meetings:
A. Annual General Meeting (“AGM”): During the preceding three years, the AGMs of the Company were held at D-152, Okhla Phase-I, New Delhi
- 110 020; details thereof are tabulated below:
TABLE 40
AGM Date & Time of AGM Details of Special resolutions
23rd AGM 17.08.2015 at 4.30 PM 1. Alteration of Articles of Association (“AOA”) by replacing clause
38 in relation to quorum for Board Meeting.
2. Alteration of AOA by replacing clause 40 in relation to notice of
Board Meeting.
3. Alteration of AOA by replacing clause 44A to make AOA
consistent with Companies Act, 2013
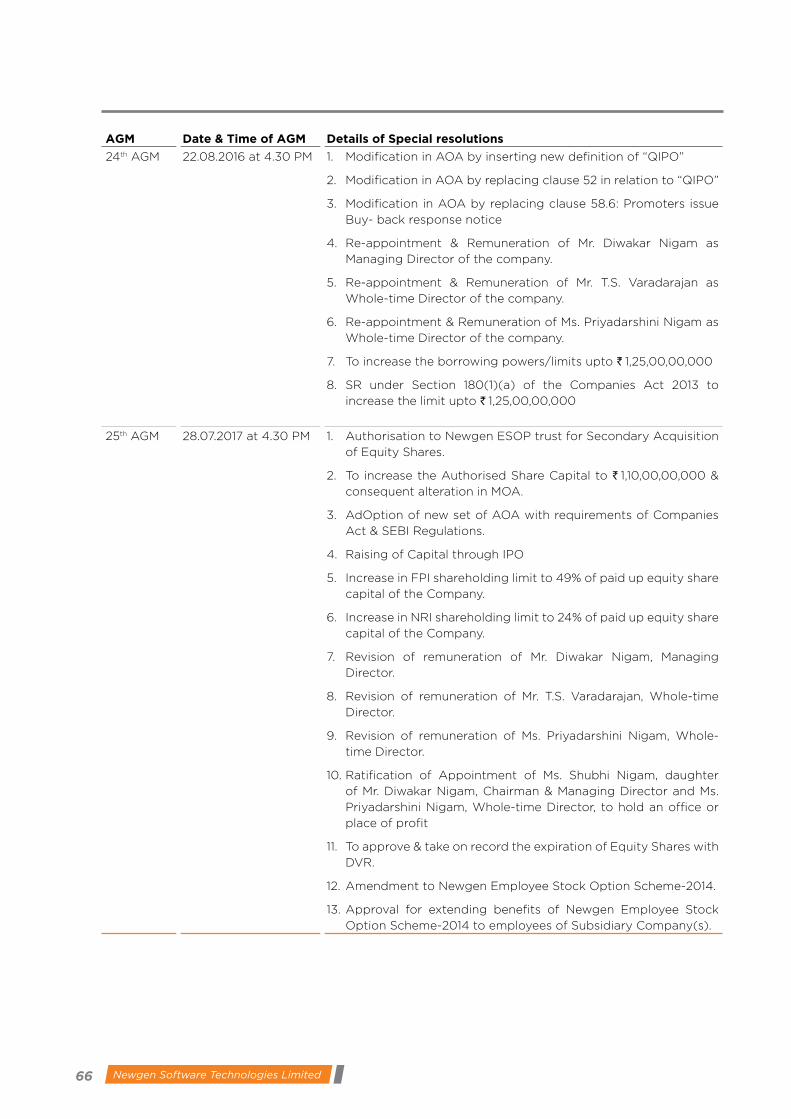
66 Newgen Software Technologies Limited
AGM Date & Time of AGM Details of Special resolutions
24th AGM 22.08.2016 at 4.30 PM 1. Modification in AOA by inserting new definition of “QIPO”
2. Modification in AOA by replacing clause 52 in relation to “QIPO”
3. Modification in AOA by replacing clause 58.6: Promoters issue
Buy- back response notice
4. Re-appointment & Remuneration of Mr. Diwakar Nigam as
Managing Director of the company.
5. Re-appointment & Remuneration of Mr. T.S. Varadarajan as
Whole-time Director of the company.
6. Re-appointment & Remuneration of Ms. Priyadarshini Nigam as
Whole-time Director of the company.
7. To increase the borrowing powers/limits upto ` 1,25,00,00,000
8. SR under Section 180(1)(a) of the Companies Act 2013 to
increase the limit upto ` 1,25,00,00,000
25th AGM 28.07.2017 at 4.30 PM 1. Authorisation to Newgen ESOP trust for Secondary Acquisition
of Equity Shares.
2. To increase the Authorised Share Capital to ` 1,10,00,00,000 &
consequent alteration in MOA.
3. AdOption of new set of AOA with requirements of Companies
Act & SEBI Regulations.
4. Raising of Capital through IPO
5. Increase in FPI shareholding limit to 49% of paid up equity share
capital of the Company.
6. Increase in NRI shareholding limit to 24% of paid up equity share
capital of the Company.
7. Revision of remuneration of Mr. Diwakar Nigam, Managing
Director.
8. Revision of remuneration of Mr. T.S. Varadarajan, Whole-time
Director.
9. Revision of remuneration of Ms. Priyadarshini Nigam, Whole-
time Director.
10. Ratification of Appointment of Ms. Shubhi Nigam, daughter
of Mr. Diwakar Nigam, Chairman & Managing Director and Ms.
Priyadarshini Nigam, Whole-time Director, to hold an office or
place of profit
11. To approve & take on record the expiration of Equity Shares with
DVR.
12. Amendment to Newgen Employee Stock Option Scheme-2014.
13. Approval for extending benefits of Newgen Employee Stock
Option Scheme-2014 to employees of Subsidiary Company(s).
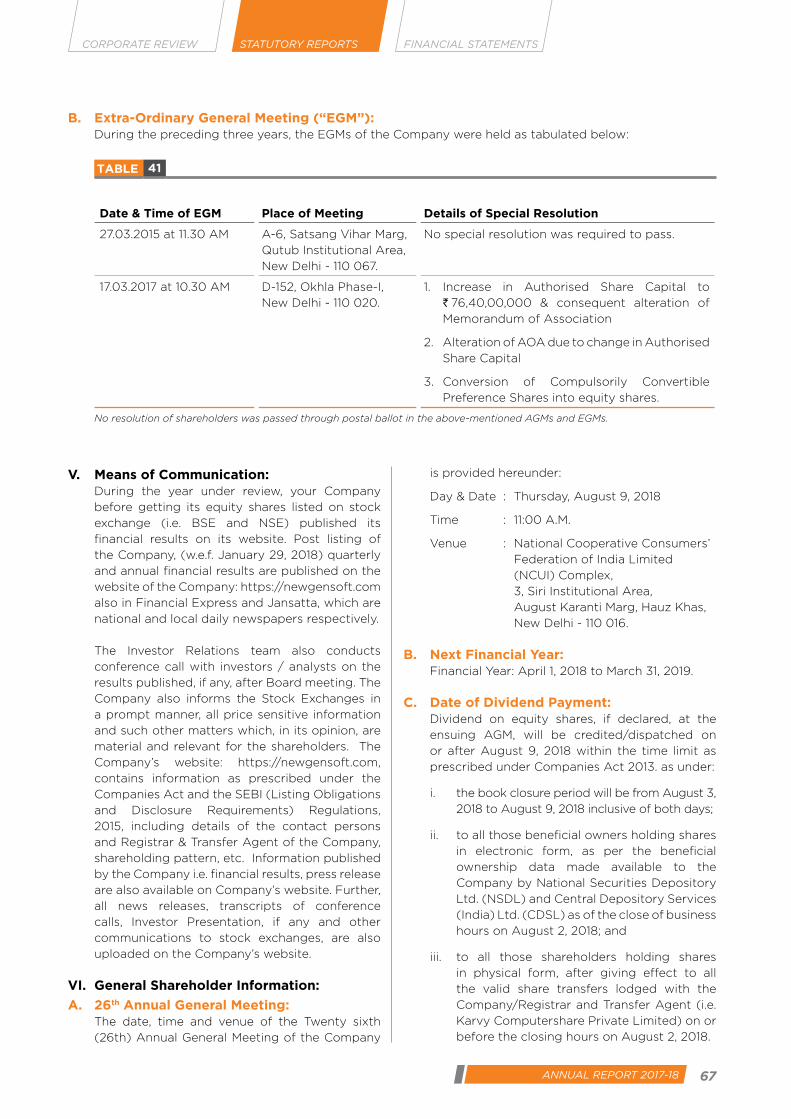
67ANNUAL REPORT 2017-18
CORPORATE REVIEW FINANCIAL STATEMENTSSTATUTORY REPORTS
B. Extra-Ordinary General Meeting (“EGM”): During the preceding three years, the EGMs of the Company were held as tabulated below:
TABLE 41
Date & Time of EGM Place of Meeting Details of Special Resolution
27.03.2015 at 11.30 AM A-6, Satsang Vihar Marg,
Qutub Institutional Area,
New Delhi - 110 067.
No special resolution was required to pass.
17.03.2017 at 10.30 AM D-152, Okhla Phase-I,
New Delhi - 110 020.
1. Increase in Authorised Share Capital to
` 76,40,00,000 & consequent alteration of
Memorandum of Association
2. Alteration of AOA due to change in Authorised
Share Capital
3. Conversion of Compulsorily Convertible
Preference Shares into equity shares.
No resolution of shareholders was passed through postal ballot in the above-mentioned AGMs and EGMs.
V. Means of Communication: During the year under review, your Company
before getting its equity shares listed on stock
exchange (i.e. BSE and NSE) published its
financial results on its website. Post listing of
the Company, (w.e.f. January 29, 2018) quarterly
and annual financial results are published on the
website of the Company: https://newgensoft.com
also in Financial Express and Jansatta, which are
national and local daily newspapers respectively.
The Investor Relations team also conducts
conference call with investors / analysts on the
results published, if any, after Board meeting. The
Company also informs the Stock Exchanges in
a prompt manner, all price sensitive information
and such other matters which, in its opinion, are
material and relevant for the shareholders. The
Company’s website: https://newgensoft.com,
contains information as prescribed under the
Companies Act and the SEBI (Listing Obligations
and Disclosure Requirements) Regulations,
2015, including details of the contact persons
and Registrar & Transfer Agent of the Company,
shareholding pattern, etc. Information published
by the Company i.e. financial results, press release
are also available on Company’s website. Further,
all news releases, transcripts of conference
calls, Investor Presentation, if any and other
communications to stock exchanges, are also
uploaded on the Company’s website.
VI. General Shareholder Information:
A. 26th Annual General Meeting: The date, time and venue of the Twenty sixth
(26th) Annual General Meeting of the Company
is provided hereunder:
Day & Date : Thursday, August 9, 2018
Time : 11:00 A.M.
Venue : National Cooperative Consumers’
Federation of India Limited
(NCUI) Complex,
3, Siri Institutional Area,
August Karanti Marg, Hauz Khas,
New Delhi - 110 016.
B. Next Financial Year: Financial Year: April 1, 2018 to March 31, 2019.
C. Date of Dividend Payment: Dividend on equity shares, if declared, at the
ensuing AGM, will be credited/dispatched on
or after August 9, 2018 within the time limit as
prescribed under Companies Act 2013. as under:
i. the book closure period will be from August 3,
2018 to August 9, 2018 inclusive of both days;
ii. to all those beneficial owners holding shares
in electronic form, as per the beneficial
ownership data made available to the
Company by National Securities Depository
Ltd. (NSDL) and Central Depository Services
(India) Ltd. (CDSL) as of the close of business
hours on August 2, 2018; and
iii. to all those shareholders holding shares
in physical form, after giving effect to all
the valid share transfers lodged with the
Company/Registrar and Transfer Agent (i.e.
Karvy Computershare Private Limited) on or
before the closing hours on August 2, 2018.
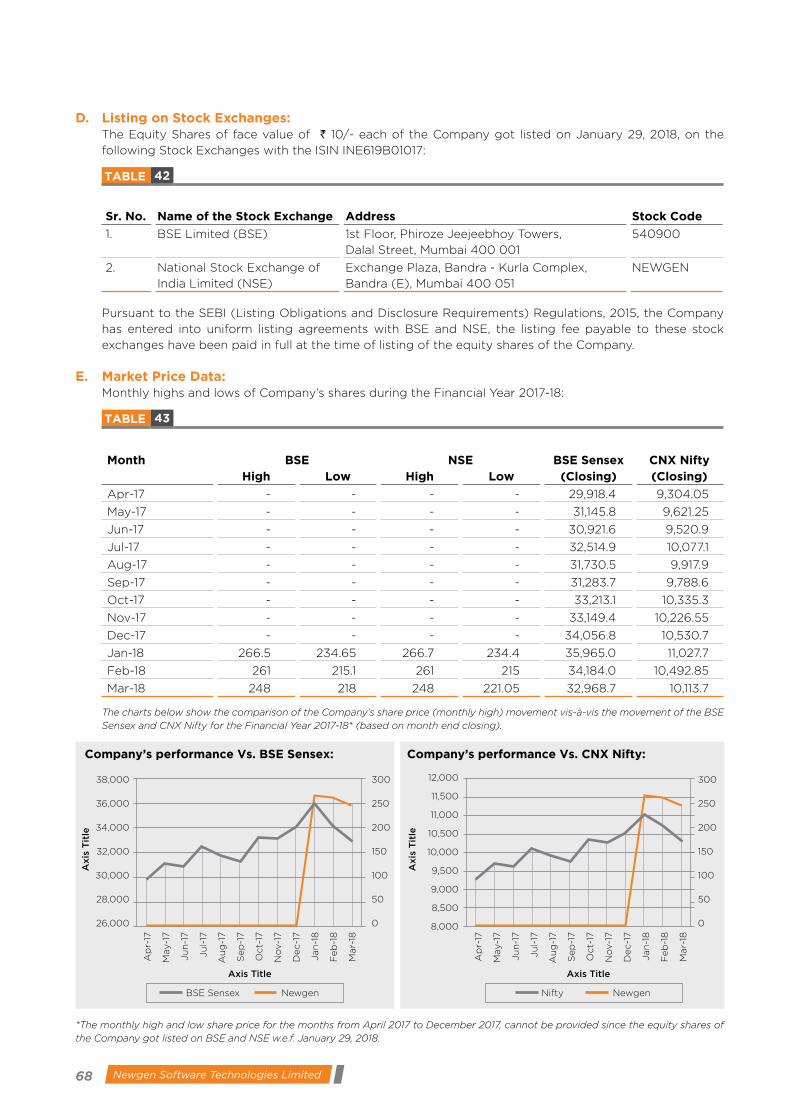
68 Newgen Software Technologies Limited
D. Listing on Stock Exchanges: The Equity Shares of face value of ` 10/- each of the Company got listed on January 29, 2018, on the
following Stock Exchanges with the ISIN INE619B01017:
TABLE 42
Sr. No. Name of the Stock Exchange Address Stock Code
1. BSE Limited (BSE) 1st Floor, Phiroze Jeejeebhoy Towers,
Dalal Street, Mumbai 400 001
540900
2. National Stock Exchange of
India Limited (NSE)
Exchange Plaza, Bandra - Kurla Complex,
Bandra (E), Mumbai 400 051
NEWGEN
Pursuant to the SEBI (Listing Obligations and Disclosure Requirements) Regulations, 2015, the Company
has entered into uniform listing agreements with BSE and NSE, the listing fee payable to these stock
exchanges have been paid in full at the time of listing of the equity shares of the Company.
E. Market Price Data:Monthly highs and lows of Company’s shares during the Financial Year 2017-18:
TABLE 43
Month BSE NSE BSE Sensex CNX Nifty High Low High Low (Closing) (Closing)
Apr-17 - - - - 29,918.4 9,304.05
May-17 - - - - 31,145.8 9,621.25
Jun-17 - - - - 30,921.6 9,520.9
Jul-17 - - - - 32,514.9 10,077.1
Aug-17 - - - - 31,730.5 9,917.9
Sep-17 - - - - 31,283.7 9,788.6
Oct-17 - - - - 33,213.1 10,335.3
Nov-17 - - - - 33,149.4 10,226.55
Dec-17 - - - - 34,056.8 10,530.7
Jan-18 266.5 234.65 266.7 234.4 35,965.0 11,027.7
Feb-18 261 215.1 261 215 34,184.0 10,492.85
Mar-18 248 218 248 221.05 32,968.7 10,113.7
The charts below show the comparison of the Company’s share price (monthly high) movement vis-à-vis the movement of the BSE Sensex and CNX Nifty for the Financial Year 2017-18* (based on month end closing).
*The monthly high and low share price for the months from April 2017 to December 2017, cannot be provided since the equity shares of the Company got listed on BSE and NSE w.e.f. January 29, 2018.
Company’s performance Vs. BSE Sensex:
38,000
36,000
34,000
32,000
30,000
28,000
26,000
300
250
200
150
100
50
0
Ap
r-17
May-1
7
Ju
n-1
7
Ju
l-17
Au
g-1
7
Sep
-17
Oct-
17
No
v-1
7
Dec-1
7
Jan
-18
Feb
-18
Mar-
18
Axis
Tit
le
Axis Title
BSE Sensex Newgen
Company’s performance Vs. CNX Nifty:
12,000
11,500
11,000
10,500
10,000
9,500
9,000
8,500
8,000
300
250
200
150
100
50
0
Ap
r-17
May-1
7
Ju
n-1
7
Ju
l-17
Au
g-1
7
Sep
-17
Oct-
17
No
v-1
7
Dec-1
7
Jan
-18
Feb
-18
Mar-
18
Axis
Tit
le
Axis Title
Nifty Newgen

69ANNUAL REPORT 2017-18
CORPORATE REVIEW FINANCIAL STATEMENTSSTATUTORY REPORTS
F. Registrar to an Issue and Share Transfer Agent: Karvy Computershare Private Limited*
Karvy Selenium Tower B, Plot No 31-32 Gachibowli, Financial District, Nanakramguda Hyderabad-500 032
Tel: +91 40 67162222
Facsimile: 91 40 23431551
Email: [email protected]
Contact Person: Mr. M Murali Krishna
*The Board has appointed the above agency on June 14, 2017, to act as its Registrar and Share Transfer Agent (“RTA”). The RTA is, inter alia, responsible for processing of requests pertaining to share transfers/ transmission/ dematerialisation/ rematerialisation and other activities related thereto for both electronic and physical shareholdings. Further, RTA also handles corporate actions such as data requirements for conduct of AGMs, dividends etc. The RTA corresponds with the depositories viz. National Securities Depository Limited (NSDL) and Central Depository Services (India) Limited (CDSL) in this regard.
G. Share Transfer System: Requests for transfer of equity shares held in physical form, received by the RTA/Company shall be
registered within 21 days from the date of receipt, provided the documents are complete in all respects. As
on March 31, 2018, the Company had only 14 shareholders who holds shares in physical form. During the
year 2017-18, there were no requests received by the RTA/Company for transfer of physical shares.
H. Distribution of Shareholding: The below two tables provide details about the pattern of shareholding among various categories and
number of shares held, as on March 31, 2018.
TABLE 44
March 31, 2018
Categories Number of Shares Percentage
Promoter & promoter group 4,59,28,988 66.34%
Resident Individuals 71,81,621 10.37%
Others 9,56,050 1.38%
Bodies Corporate/ Foreign Corporate Bodies 17,73,834 2.56%
Trust 13,51,584 1.95%
Alternate Investment Funds/ Foreign Portfolio Investors/ Mutual
Funds
1,20,43,624 17.40%
Total 6,92,35,701 100.00%
Promoter & promoter group
66%
Resident Individuals 10%
Others1%
Bodies Corporate/ Foreign Corporate Bodies
3%
Alternate Investment Funds/ Foreign Portfolio Investors/
Mutual Funds 17%
Trust2%
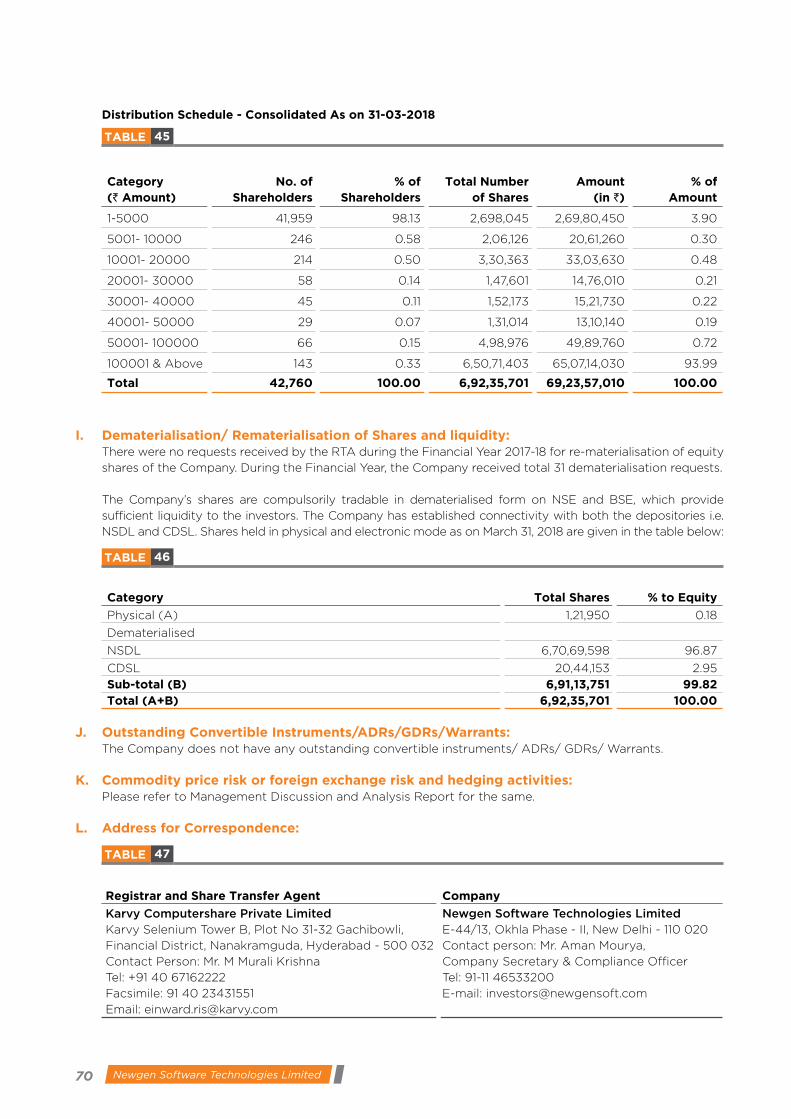
70 Newgen Software Technologies Limited
Distribution Schedule - Consolidated As on 31-03-2018
TABLE 45
Category (` Amount)
No. of Shareholders
% of Shareholders
Total Number of Shares
Amount (in `)
% of Amount
1-5000 41,959 98.13 2,698,045 2,69,80,450 3.90
5001- 10000 246 0.58 2,06,126 20,61,260 0.30
10001- 20000 214 0.50 3,30,363 33,03,630 0.48
20001- 30000 58 0.14 1,47,601 14,76,010 0.21
30001- 40000 45 0.11 1,52,173 15,21,730 0.22
40001- 50000 29 0.07 1,31,014 13,10,140 0.19
50001- 100000 66 0.15 4,98,976 49,89,760 0.72
100001 & Above 143 0.33 6,50,71,403 65,07,14,030 93.99
Total 42,760 100.00 6,92,35,701 69,23,57,010 100.00
I. Dematerialisation/ Rematerialisation of Shares and liquidity: There were no requests received by the RTA during the Financial Year 2017-18 for re-materialisation of equity
shares of the Company. During the Financial Year, the Company received total 31 dematerialisation requests.
The Company’s shares are compulsorily tradable in dematerialised form on NSE and BSE, which provide
sufficient liquidity to the investors. The Company has established connectivity with both the depositories i.e.
NSDL and CDSL. Shares held in physical and electronic mode as on March 31, 2018 are given in the table below:
TABLE 46
Category Total Shares % to Equity
Physical (A) 1,21,950 0.18
Dematerialised
NSDL 6,70,69,598 96.87
CDSL 20,44,153 2.95
Sub-total (B) 6,91,13,751 99.82Total (A+B) 6,92,35,701 100.00
J. Outstanding Convertible Instruments/ADRs/GDRs/Warrants: The Company does not have any outstanding convertible instruments/ ADRs/ GDRs/ Warrants.
K. Commodity price risk or foreign exchange risk and hedging activities: Please refer to Management Discussion and Analysis Report for the same.
L. Address for Correspondence:
TABLE 47
Registrar and Share Transfer Agent Company
Karvy Computershare Private Limited Karvy Selenium Tower B, Plot No 31-32 Gachibowli,
Financial District, Nanakramguda, Hyderabad - 500 032
Contact Person: Mr. M Murali Krishna
Tel: +91 40 67162222
Facsimile: 91 40 23431551
Email: [email protected]
Newgen Software Technologies LimitedE-44/13, Okhla Phase - II, New Delhi - 110 020
Contact person: Mr. Aman Mourya,
Company Secretary & Compliance Officer
Tel: 91-11 46533200
E-mail: [email protected]
71ANNUAL REPORT 2017-18
CORPORATE REVIEW FINANCIAL STATEMENTSSTATUTORY REPORTS
VII. Other Disclosures:
A. Related Party Transactions: In Compliance with requirement of SEBI (Listing
Obligations and Disclosure Requirements)
Regulations, 2015, the Board of Directors has
adopted a policy on materiality of Related Party
Transactions and also on dealing with Related
Party Transactions between the Company
and its Related Parties to ensure the proper
approval and reporting of such transactions. A
copy of the said Policy on dealing with Related
Party Transactions is available on the website
of the Company at https://newgensoft.com.
There are no material significant related party
transactions that may have potential conflict
with the interests of Company at large. Details of
related party transactions i.e. transactions of the
Company with the Company, with its promoter,
Directors, Key Managerial Personnel, subsidiaries
or relatives etc., are present under note 46 to
the annual account (Standalone & Consolidated
Financial Statements) of the Annual Report.
During the year under review, the shareholders of
the Company in its 25th Annual General Meeting
held on July 28, 2017, ratified the appointments
of Ms. Shubhi Nigam daughter of Mr. Diwakar
Nigam, Managing Director and Ms. Priyadarshini
Nigam, Whole-time director, of the Company,
as “Manager - Product & Solution” in Newgen
Software Inc. (“NSI”), a wholly owned subsidiary
of the Company, incorporated in USA.
B. Details of Capital Market Non-Compliance, if any:
The equity shares of the Company were listed
on BSE and NSE with effect from January 29,
2018. There has been no non-compliance by the
Company of any legal requirements; nor has
there been any penalty/stricture imposed on the
Company by any stock exchange, SEBI or any
other statutory authority on any matter related
to capital markets.
C. Whistle Blower Policy/ Vigil Mechanism: Pursuant to Section 177(9) of the Act, the Board
at its meeting held on June 14, 2017, adopted
the Whistle Blower Policy and revised by the
Board in its meeting held on March 28, 2018. The
Whistle Blower Policy includes vigil mechanism
as mandated under the Listing Regulations and
provides a mechanism for director/employee
to report violations, any unethical behaviour,
suspected or actual fraud, violation of the Code
of Conduct etc. which could be detrimental to the
organisation’s interest. The mechanism protects
whistle blower from any kind of discrimination,
harassment, victimisation or any other unfair
employment practice. The Company affirms
that no employee has been denied access to
the Audit Committee in this respect. The said
Policy is placed on the Company’s website at
https://newgensoft.com.
D. Code of Conduct for all Board members and Senior Management Personnel:
The Board has laid down a code of Conduct
for all Board members and Senior Management
Personnel of the Company. The Code is
displayed on the website of the Company
https://newgensoft.com. All Board members and
Senior Management personnel have affirmed
compliance requirement under the Code. A
declaration signed by the Managing Director to
this effect is enclosed at the end of this report.
E. Disclosure of material transactions: In terms of Regulation 26(5) of the Listing
Regulations, Senior Management has made
disclosure to the Board relating to all material
financial and commercial transactions, if any,
where they had personal interest or that might
have been in potential conflict with the interest
of the Company. Based on disclosures received
none of the officials in senior management of the
Company have personal interest in any financial
or commercial transactions within the Company.
F. Compliance of Mandatory and Non-Mandatory requirements:
§ Mandatory: The Company has complied with the mandatory
requirements of the SEBI (LODR) Regulations
and there was no non-compliance in respect of
Corporate Governance Report.
§ Discretionary: The Company has adopted voluntary
requirement relating to:
i. Modified opinion(s) in audit report: The
Company confirms that its financial
statements for the year under review are
with unmodified audit opinion.
ii. Reporting of Internal Auditor: The Internal
Auditor reports directly to the Audit
Committee.
G. Subsidiary Companies: The Company has five wholly owned subsidiaries
(WOS). There are no associate companies or joint
venture companies within the meaning of section
2(6) of the Companies Act, 2013 (“Act”). There
has been no material change in the nature of the
business of the subsidiaries.
1. Newgen Software Inc. USA, incorporated in
USA
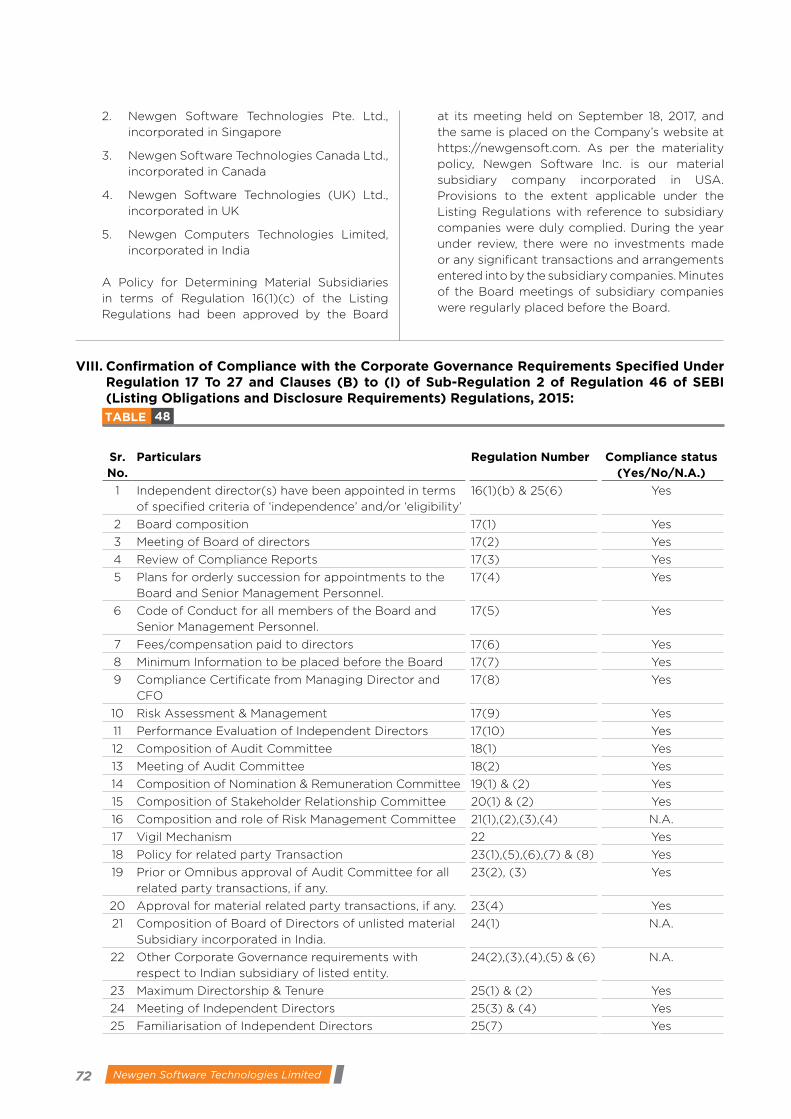
72 Newgen Software Technologies Limited
2. Newgen Software Technologies Pte. Ltd.,
incorporated in Singapore
3. Newgen Software Technologies Canada Ltd.,
incorporated in Canada
4. Newgen Software Technologies (UK) Ltd.,
incorporated in UK
5. Newgen Computers Technologies Limited,
incorporated in India
A Policy for Determining Material Subsidiaries
in terms of Regulation 16(1)(c) of the Listing
Regulations had been approved by the Board
at its meeting held on September 18, 2017, and
the same is placed on the Company’s website at
https://newgensoft.com. As per the materiality
policy, Newgen Software Inc. is our material
subsidiary company incorporated in USA.
Provisions to the extent applicable under the
Listing Regulations with reference to subsidiary
companies were duly complied. During the year
under review, there were no investments made
or any significant transactions and arrangements
entered into by the subsidiary companies. Minutes
of the Board meetings of subsidiary companies
were regularly placed before the Board.
VIII. Confirmation of Compliance with the Corporate Governance Requirements Specified Under Regulation 17 To 27 and Clauses (B) to (I) of Sub-Regulation 2 of Regulation 46 of SEBI (Listing Obligations and Disclosure Requirements) Regulations, 2015:
TABLE 48
Sr. No.
Particulars Regulation Number Compliance status (Yes/No/N.A.)
1 Independent director(s) have been appointed in terms
of specified criteria of ‘independence’ and/or ‘eligibility’
16(1)(b) & 25(6) Yes
2 Board composition 17(1) Yes
3 Meeting of Board of directors 17(2) Yes
4 Review of Compliance Reports 17(3) Yes
5 Plans for orderly succession for appointments to the
Board and Senior Management Personnel.
17(4) Yes
6 Code of Conduct for all members of the Board and
Senior Management Personnel.
17(5) Yes
7 Fees/compensation paid to directors 17(6) Yes
8 Minimum Information to be placed before the Board 17(7) Yes
9 Compliance Certificate from Managing Director and
CFO
17(8) Yes
10 Risk Assessment & Management 17(9) Yes
11 Performance Evaluation of Independent Directors 17(10) Yes
12 Composition of Audit Committee 18(1) Yes
13 Meeting of Audit Committee 18(2) Yes
14 Composition of Nomination & Remuneration Committee 19(1) & (2) Yes
15 Composition of Stakeholder Relationship Committee 20(1) & (2) Yes
16 Composition and role of Risk Management Committee 21(1),(2),(3),(4) N.A.
17 Vigil Mechanism 22 Yes
18 Policy for related party Transaction 23(1),(5),(6),(7) & (8) Yes
19 Prior or Omnibus approval of Audit Committee for all
related party transactions, if any.
23(2), (3) Yes
20 Approval for material related party transactions, if any. 23(4) Yes
21 Composition of Board of Directors of unlisted material
Subsidiary incorporated in India.
24(1) N.A.
22 Other Corporate Governance requirements with
respect to Indian subsidiary of listed entity.
24(2),(3),(4),(5) & (6) N.A.
23 Maximum Directorship & Tenure 25(1) & (2) Yes
24 Meeting of Independent Directors 25(3) & (4) Yes
25 Familiarisation of Independent Directors 25(7) Yes

73ANNUAL REPORT 2017-18
CORPORATE REVIEW FINANCIAL STATEMENTSSTATUTORY REPORTS
Sr. No.
Particulars Regulation Number Compliance status (Yes/No/N.A.)
26 Memberships in Committees 26(1) Yes
27 Affirmation with compliance to code of conduct
from members of Board of Directors and Senior
management personnel
26(3) Yes
28 Disclosure of Shareholding by Non-Executive Directors 26(4) Yes
29 Policy with respect to Obligations of directors and
senior management.
26(2) & 26(5) Yes
30 Disclosure on the website of the Company 46(2) Yes
IX. Certificate from Practicing Company Secretary on Compliance of Corporate Governance Under SEBI (Listing Obligations and Disclosure Requirements) Regulations, 2015:
The Company has obtained a certificate from a M/s Aijaz & Associates, Practicing Company Secretaries
regarding compliance with the provisions relating to Corporate Governance laid down in Part E of Schedule
V to the SEBI (Listing Obligations and Disclosure Requirements) Regulations, 2015. This certificate is
annexed to the Board’s Report and will be sent to the Stock Exchanges, along with the Annual Report to
be filed by the Company.
X. Disclosure with Respect to Demat Suspese Account/ Unclaimed Suspense Account: In accordance with the requirement of Regulation 34(3) and Part F of Schedule V to the SEBI Listing
Regulations, the Company reports the following details in respect of equity shares lying in the suspense
account which were issued in dematerialised form pursuant to the public issue of the Company.
TABLE 49
Particulars Number of Equity Shareholders
Number of Equity Shares
Aggregate number of shareholders and the outstanding shares in
the suspense account lying w.e.f January 29, 2018*
5 305
Shareholders who approached the Company for transfer of shares
from suspense account during the year.
3 183
Number of shareholders to whom shares were transferred from
suspense account during the year.
2 122
Aggregate number of shareholders and the outstanding shares in
the suspense account lying as on March 31, 2018
3 183
*The date when the Equity Shares of face value of ` 10/- of the Company got listed on BSE Limited (BSE) and National Stock Exchange of India Limited (NSE).
The voting rights on the shares outstanding in the suspense account as on March 31, 2018 shall remain frozen till the rightful owner of such shares claims the shares.
74 Newgen Software Technologies Limited
XI. CEO and CFO Certification: To comply with the Regulation 17(8) of SEBI
(LODR) Regulations, the Chief Executive Officer
(CEO) or Managing Director and the Chief
Financial Officer (CFO) of the Company have
given Compliance Certificate stating therein
matters prescribed under Part B of Schedule II of
the said Regulations.
To comply with of Regulation 33(2) (a) of SEBI
(LODR) Regulations, the Managing Director and
CFO have certified the quarterly financial results
while placing the financial results before the
Board.
XII. CEO and CFO Certification: Information on Deviation from Accounting
Standards, if any, the Company has adopted
Indian Accounting Standards (Ind ASs) in
preparation of annual accounts for the Financial
Year 2017-18.
XIII. Disclosure of Compliance with Corporate Governance Requirements Specified in Regulation 17 To 27 and Regulation 46 of SEBI (LODR) Regulations:
The Company has complied with the applicable
provisions of SEBI (LODR) Regulations
including Regulation 17 to 27 and Regulation
46 of SEBI (LODR) Regulations. The Company
submits a quarterly compliance report on
Corporate Governance signed by Compliance
Officer to the Stock Exchange within 15 (fifteen)
days from the close of every quarter. Such
quarterly compliance reports on Corporate
Governance are also posted on the website of
the Company. Compliance of the Conditions of
Corporate Governance has also been audited
by an Independent Firm of Practising Company
Secretaries. After being satisfied of the above
compliances, they have issued a compliance
certificate in this respect. The said certificate is
attached to this report.
For and on behalf of the Board of Directors
Diwakar NigamDate: May 17, 2018 Chairman & Managing Director
Place: New Delhi DIN: 00263222
DECLARATION TO COMPLIANCE OF CODE OF CONDUCT
This is to certify that the Company has laid down its Code of Conduct for all the Board Members and Senior
Management of the Company and the copy of the same has been uploaded on the website of the Company.
https://newgensoft.com.
I hereby declared that all the Directors and Senior Managerial Personnel have affirmed the compliance with
the Code of Conduct and have given a confirmation thereto in this regard, in respect of Financial Year ended
March 31, 2018.
Date: May 04, 2018 Diwakar NigamPlace: New Delhi Chairman & Managing Director
DIN: 00263222
75ANNUAL REPORT 2017-18
CORPORATE REVIEW FINANCIAL STATEMENTSSTATUTORY REPORTS
To
The Board of Director
Newgen Software Technologies Limited
New Delhi
Sub: Certification by Managing Director & Chief Financial Officer, pursuant to Regulation 17(8) of SEBI (Listing Obligations and Disclosure Requirements) Regulations, 2015
We, Diwakar Nigam, Chairman & Managing Director and Arun Kumar Gupta, Chief Financial Officer of Newgen
Software Technologies Limited, hereby certify that: -
a) We have reviewed financial statements and cash flow statement for the year ended on March 31, 2018 and
that to the best of our knowledge and belief:
i. these statements do not contain any materially untrue statement or omit any material fact or contain
statements that might be misleading;
ii. these statements together present a true and fair view of the Company’s affairs and are incompliance
with existing accounting standards, applicable laws and regulations.
b) There are, to the best of our knowledge and belief, no transactions entered into by the Company during the
year which are fraudulent, illegal or violative of the Company’s code of conduct.
c) We accept responsibility for establishing and maintaining internal controls for financial reporting and that
we have evaluated the effectiveness of internal control systems of the Company pertaining to financial
reporting and we have disclosed to the auditors and the Audit Committee, deficiencies in the design or
operation of such internal controls, if any, of which we are aware and the steps we have taken or propose
to take to rectify these deficiencies.
d) We have indicated to the auditors and the Audit Committee: -
i. Significant changes in internal control, if any, over financial reporting during the year;
ii. Significant changes in accounting policies during the year and that the same have been disclosed in
the notes to the financial statements; and
iii. Instances of significant fraud of which we have become aware and the involvement therein, if any, of
the management or an employee having a significant role in the Company’s internal control system
over financial reporting.
Date: May 14, 2018 Diwakar Nigam Arun Kumar GuptaPlace: New Delhi Chairman & Managing Director Chief Financial Officer
DIN: 00263222 PAN: ADTPG6017D
76 Newgen Software Technologies Limited
CERTIFICATE ON COMPLIANCE OF CONDITIONS OF CORPORATE GOVERNANCE
To
The Members,
Newgen Software Technologies Limited,
We have examined the compliance of conditions of Corporate Governance by Newgen Software Technologies
Limited (“the Company”), for the Financial Year ended March 31, 2018 as stipulated under regulations 17 to 27
and clauses (b) to (i) of regulation 46(2) and Para C, D and E of Schedule V to the SEBI (Listing Obligations and
Disclosure Requirements) Regulations, 2015 (“Listing Regulations”).
The compliance of conditions of Corporate Governance is the responsibility of the management of the Company.
Our examination was limited to procedures and implementation thereof, adopted by the Company for ensuring
the compliance of the conditions of Corporate Governance. It is neither an audit nor an expression of opinion
on the financial statements of the Company.
In our opinion and to the best of our information and according to the explanations given to us, we certify that
the Company has substantially complied with the conditions of Corporate Governance as stipulated under
regulations 17 to 27 and clauses (b) to (i) of regulation 46(2) and Para C, D and E of Schedule V to the Listing
Regulations, the compliances of which needs to be further strengthened.
We further state that such compliance is neither an assurance as to the future viability of the Company nor the
efficiency or effectiveness with which the management has conducted the affairs of the Company
For Aijaz & Associates
Sd/-
M. AijazPracticing Company Secretary
CP No: 7040
M. No.: 6563
Place: New Delhi
Date: May 04, 2018
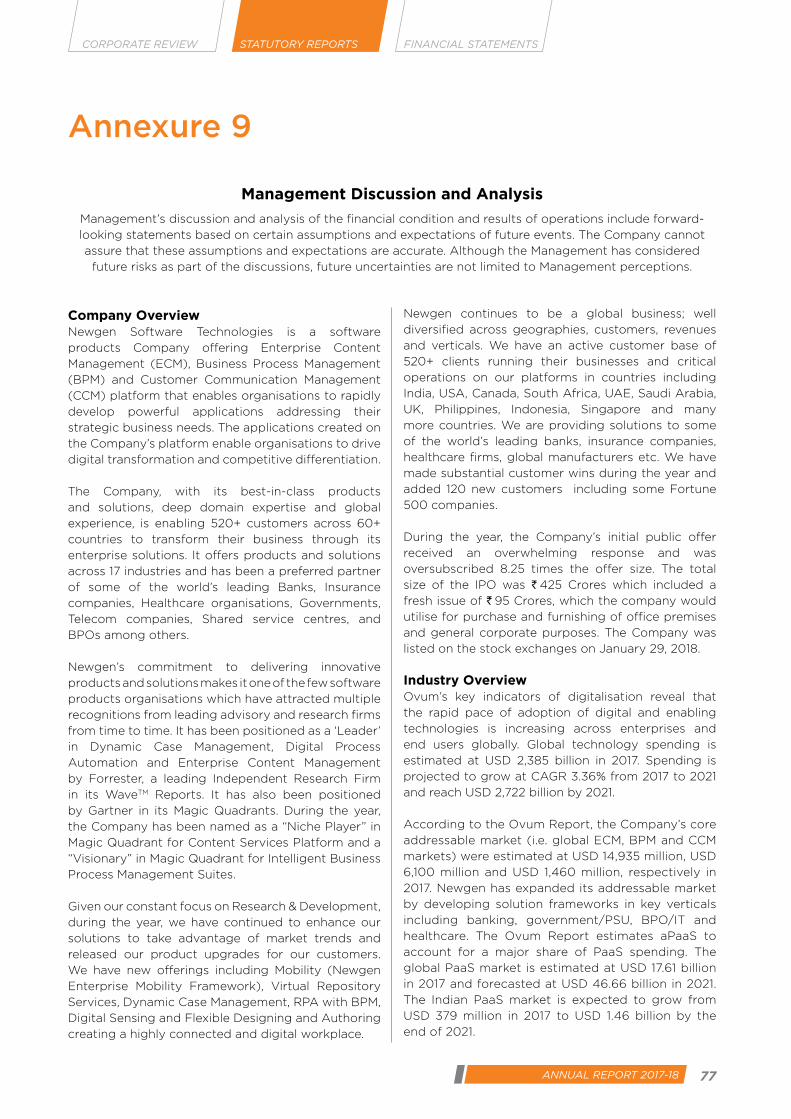
77ANNUAL REPORT 2017-18
CORPORATE REVIEW FINANCIAL STATEMENTSSTATUTORY REPORTS
Annexure 9
Management Discussion and Analysis
Management’s discussion and analysis of the financial condition and results of operations include forward-
looking statements based on certain assumptions and expectations of future events. The Company cannot
assure that these assumptions and expectations are accurate. Although the Management has considered
future risks as part of the discussions, future uncertainties are not limited to Management perceptions.
Company OverviewNewgen Software Technologies is a software
products Company offering Enterprise Content
Management (ECM), Business Process Management
(BPM) and Customer Communication Management
(CCM) platform that enables organisations to rapidly
develop powerful applications addressing their
strategic business needs. The applications created on
the Company’s platform enable organisations to drive
digital transformation and competitive differentiation.
The Company, with its best-in-class products
and solutions, deep domain expertise and global
experience, is enabling 520+ customers across 60+
countries to transform their business through its
enterprise solutions. It offers products and solutions
across 17 industries and has been a preferred partner
of some of the world’s leading Banks, Insurance
companies, Healthcare organisations, Governments,
Telecom companies, Shared service centres, and
BPOs among others.
Newgen’s commitment to delivering innovative
products and solutions makes it one of the few software
products organisations which have attracted multiple
recognitions from leading advisory and research firms
from time to time. It has been positioned as a ‘Leader’
in Dynamic Case Management, Digital Process
Automation and Enterprise Content Management
by Forrester, a leading Independent Research Firm
in its WaveTM Reports. It has also been positioned
by Gartner in its Magic Quadrants. During the year,
the Company has been named as a “Niche Player” in
Magic Quadrant for Content Services Platform and a
“Visionary” in Magic Quadrant for Intelligent Business
Process Management Suites.
Given our constant focus on Research & Development,
during the year, we have continued to enhance our
solutions to take advantage of market trends and
released our product upgrades for our customers.
We have new offerings including Mobility (Newgen
Enterprise Mobility Framework), Virtual Repository
Services, Dynamic Case Management, RPA with BPM,
Digital Sensing and Flexible Designing and Authoring
creating a highly connected and digital workplace.
Newgen continues to be a global business; well
diversified across geographies, customers, revenues
and verticals. We have an active customer base of
520+ clients running their businesses and critical
operations on our platforms in countries including
India, USA, Canada, South Africa, UAE, Saudi Arabia,
UK, Philippines, Indonesia, Singapore and many
more countries. We are providing solutions to some
of the world’s leading banks, insurance companies,
healthcare firms, global manufacturers etc. We have
made substantial customer wins during the year and
added 120 new customers including some Fortune
500 companies.
During the year, the Company’s initial public offer
received an overwhelming response and was
oversubscribed 8.25 times the offer size. The total
size of the IPO was ` 425 Crores which included a
fresh issue of ` 95 Crores, which the company would
utilise for purchase and furnishing of office premises
and general corporate purposes. The Company was
listed on the stock exchanges on January 29, 2018.
Industry OverviewOvum’s key indicators of digitalisation reveal that
the rapid pace of adoption of digital and enabling
technologies is increasing across enterprises and
end users globally. Global technology spending is
estimated at USD 2,385 billion in 2017. Spending is
projected to grow at CAGR 3.36% from 2017 to 2021
and reach USD 2,722 billion by 2021.
According to the Ovum Report, the Company’s core
addressable market (i.e. global ECM, BPM and CCM
markets) were estimated at USD 14,935 million, USD
6,100 million and USD 1,460 million, respectively in
2017. Newgen has expanded its addressable market
by developing solution frameworks in key verticals
including banking, government/PSU, BPO/IT and
healthcare. The Ovum Report estimates aPaaS to
account for a major share of PaaS spending. The
global PaaS market is estimated at USD 17.61 billion
in 2017 and forecasted at USD 46.66 billion in 2021.
The Indian PaaS market is expected to grow from
USD 379 million in 2017 to USD 1.46 billion by the
end of 2021.

78 Newgen Software Technologies Limited
Ovum Reports forecasts that while ECM will grow at a CAGR of 7.13%, BPM and CCM will grow at a CAGR of
8.39% and 9.99%, respectively between 2017 and 2021. This reflects the fact that ECM is a very mature market
and that there are fewer opportunities, while CCM will enjoy new market opportunities afforded by the adoption
of the technology as a marketing tool to support the customer journey.
Financial Performance
Consolidated Financials in ` Lakhs
TABLE 50
(All amounts in ` Lakhs, except per share data and unless otherwise stated) FY 2018 FY 2017 Revenue
Revenue from operations 51,242.78 42,709.80
Other income 760.98 826.78 Total revenue 52,003.76 43,536.58 Expenses
Employee benefits 24,887.78 21,004.64
Finance costs 520.68 525.60
Depreciation and amortisation 580.67 491.82
Other expenses 16,601.38 14,682.49 Total expenses 42,590.51 36,704.55 Profit before tax 9,413.25 6,832.03 Profit after tax for the year 7,288.68 5,133.01 Other comprehensive income/(loss) for the year, net of income tax 82.31 -37.18 Total comprehensive income for the year 7,370.99 5,095.83
Revenue from OperationsThe Company’s business has multiple revenue streams including from:
§ Sale of software products: one-time upfront license fees in relation to the platform deployed on-premise
§ Annuity based revenue: recurring fees/charges from the following:
SaaS: subscription fees for licenses in relation to platform deployed on cloud
ATS/AMC: charges for annual technical support and maintenance (including updates) of licences, and installation
Support: charges for support and development services
§ Sale of services: milestone-based charges for implementation and development, and charges for scanning services
During the year, we delivered broad based growth across geographies through expanding our sales distribution, both direct and indirect, with an emphasis on expanding our recurring revenues and operating cash flows.
It is important to note that we have adopted Ind AS accounting standards in this Financial Year. On a consolidated basis, the Company’s revenue from operations stood at ` 51,242.78 Lakhs reflecting an increase of 20% in FY 2018 as against ` 42,709.80 Lakhs in FY 2017. Over last 5 Financial Years, the
Company has been able to maintain 20% compounded annualised growth in its revenues.
Newgen’s License revenues were `13,695.06 Lakhs and witnessed a 17% growth YoY. The Company witnessed strong growth momentum in our annuity revenues which grew by 25% during the year. The SaaS revenues specifically (though smaller in base) grew 3 times.
We have made substantial customer wins during the year and added 120 new customers (including some Fortune 500 companies) and currently have an active customer base of 520+ clients.
Geographically, India comprising 35% of the revenues, EMEA comprised 33%, USA comprised 23% and APAC (excluding India) comprised 9% of revenues. EMEA and APAC were two strong growth centres for Newgen. In USA, the business is focussed on SaaS/ Cloud and thus the upfront revenues are in line with the business model, but these are better quality revenue streams.
Newgen continues to strengthen its horizontal product platform with vertical service accelerators to enhance the overall portfolio. During the year under review, 54% revenues came from the BFSI. Moreover, the contribution of IT / BPO and government/PSU orders to the topline was 8% and 14% respectively.
Profits and MarginsThe Company witnessed substantial improvements in the operational performance, which reflect in the
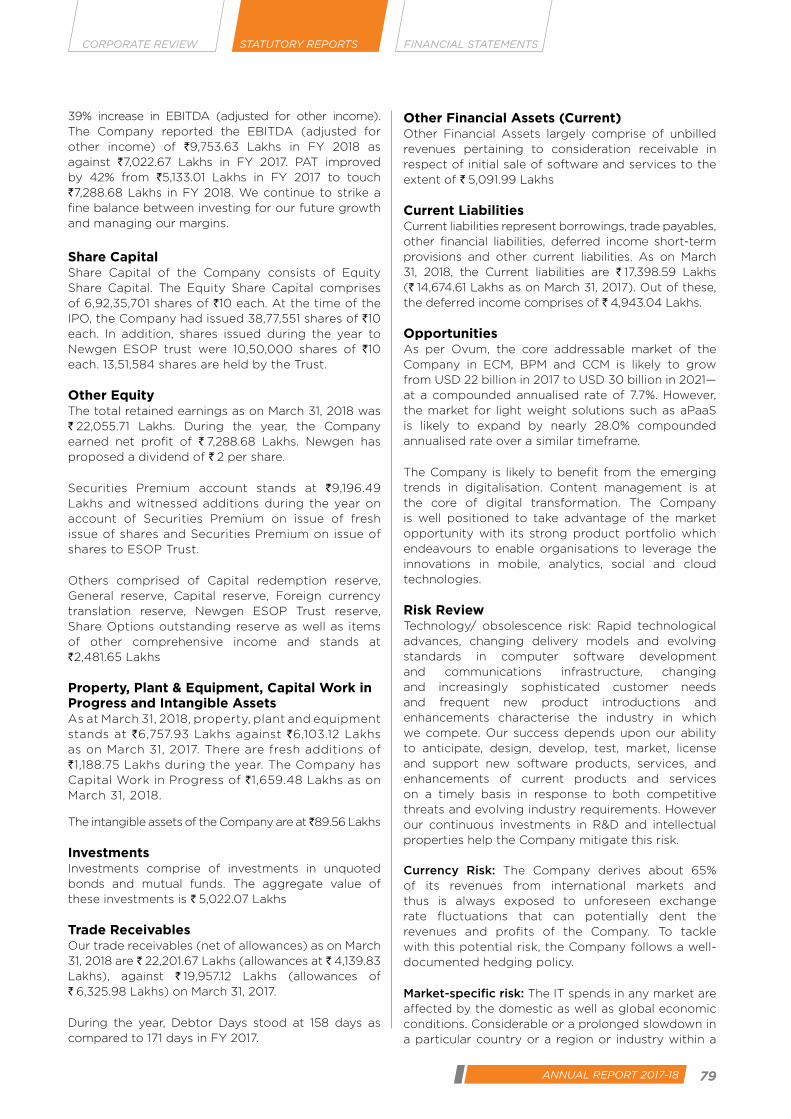
79ANNUAL REPORT 2017-18
CORPORATE REVIEW FINANCIAL STATEMENTSSTATUTORY REPORTS
39% increase in EBITDA (adjusted for other income). The Company reported the EBITDA (adjusted for other income) of `9,753.63 Lakhs in FY 2018 as against `7,022.67 Lakhs in FY 2017. PAT improved by 42% from `5,133.01 Lakhs in FY 2017 to touch `7,288.68 Lakhs in FY 2018. We continue to strike a fine balance between investing for our future growth and managing our margins.
Share CapitalShare Capital of the Company consists of Equity Share Capital. The Equity Share Capital comprises of 6,92,35,701 shares of `10 each. At the time of the IPO, the Company had issued 38,77,551 shares of `10 each. In addition, shares issued during the year to Newgen ESOP trust were 10,50,000 shares of `10 each. 13,51,584 shares are held by the Trust.
Other Equity The total retained earnings as on March 31, 2018 was ` 22,055.71 Lakhs. During the year, the Company earned net profit of ` 7,288.68 Lakhs. Newgen has proposed a dividend of ` 2 per share.
Securities Premium account stands at `9,196.49 Lakhs and witnessed additions during the year on account of Securities Premium on issue of fresh issue of shares and Securities Premium on issue of shares to ESOP Trust.
Others comprised of Capital redemption reserve, General reserve, Capital reserve, Foreign currency translation reserve, Newgen ESOP Trust reserve, Share Options outstanding reserve as well as items of other comprehensive income and stands at `2,481.65 Lakhs
Property, Plant & Equipment, Capital Work in Progress and Intangible AssetsAs at March 31, 2018, property, plant and equipment stands at `6,757.93 Lakhs against `6,103.12 Lakhs as on March 31, 2017. There are fresh additions of `1,188.75 Lakhs during the year. The Company has Capital Work in Progress of `1,659.48 Lakhs as on March 31, 2018.
The intangible assets of the Company are at ̀ 89.56 Lakhs
InvestmentsInvestments comprise of investments in unquoted bonds and mutual funds. The aggregate value of these investments is ` 5,022.07 Lakhs
Trade ReceivablesOur trade receivables (net of allowances) as on March 31, 2018 are ` 22,201.67 Lakhs (allowances at ` 4,139.83 Lakhs), against ` 19,957.12 Lakhs (allowances of ` 6,325.98 Lakhs) on March 31, 2017.
During the year, Debtor Days stood at 158 days as compared to 171 days in FY 2017.
Other Financial Assets (Current)Other Financial Assets largely comprise of unbilled revenues pertaining to consideration receivable in respect of initial sale of software and services to the extent of ` 5,091.99 Lakhs
Current LiabilitiesCurrent liabilities represent borrowings, trade payables, other financial liabilities, deferred income short-term provisions and other current liabilities. As on March 31, 2018, the Current liabilities are ` 17,398.59 Lakhs (` 14,674.61 Lakhs as on March 31, 2017). Out of these, the deferred income comprises of ` 4,943.04 Lakhs.
OpportunitiesAs per Ovum, the core addressable market of the Company in ECM, BPM and CCM is likely to grow from USD 22 billion in 2017 to USD 30 billion in 2021—at a compounded annualised rate of 7.7%. However, the market for light weight solutions such as aPaaS is likely to expand by nearly 28.0% compounded annualised rate over a similar timeframe.
The Company is likely to benefit from the emerging trends in digitalisation. Content management is at the core of digital transformation. The Company is well positioned to take advantage of the market opportunity with its strong product portfolio which endeavours to enable organisations to leverage the innovations in mobile, analytics, social and cloud technologies.
Risk ReviewTechnology/ obsolescence risk: Rapid technological advances, changing delivery models and evolving standards in computer software development and communications infrastructure, changing and increasingly sophisticated customer needs and frequent new product introductions and enhancements characterise the industry in which we compete. Our success depends upon our ability to anticipate, design, develop, test, market, license and support new software products, services, and enhancements of current products and services on a timely basis in response to both competitive threats and evolving industry requirements. However our continuous investments in R&D and intellectual properties help the Company mitigate this risk.
Currency Risk: The Company derives about 65% of its revenues from international markets and thus is always exposed to unforeseen exchange rate fluctuations that can potentially dent the revenues and profits of the Company. To tackle with this potential risk, the Company follows a well-documented hedging policy.
Market-specific risk: The IT spends in any market are affected by the domestic as well as global economic conditions. Considerable or a prolonged slowdown in a particular country or a region or industry within a

80 Newgen Software Technologies Limited
region severely affects the IT spends. Similarly, policy changes in global markets may also influence IT spending pattern. To deal with such market-specific risks, the Company endeavours to expand its clientele across industries and geographies continuously.
From about 48 countries in FY 2013, the Company increased its presence across 60+ countries in FY 2018. Similarly, the Company now has 520+ active clients in FY 2018, adding 120 new clients during the year. To deal with policy challenges the Company has been giving an emphasis on growing its regional presence and hiring local talent, without compromising on economies of scales and cost.
Our StrategiesNewgen’s strategies are based on addressing the market opportunities in enterprise platforms for ECM, BPM and CCM products, creating domain rich solution frameworks on platform and using low code platform capabilities to create solution frameworks. These include:
Expansion of business and geographical footprintThe Company plans to expand its market share across key geographies and solutions. Its platform is designed to be natively multi-lingual to address challenges in multi-national organisations. Newgen currently operates in over 60 countries and believes that it has a significant opportunity to grow the international footprint. It is investing in direct and indirect sales channels, professional services, customer support and channel partners to expand the geographical footprint. The Company has a regional go-to-market strategy with specific strategies for mature markets such as USA and developing markets such as India and South-East Asia.
The Company plans to grow through its differentiated ‘land and expand’ model. The customers receive the complete set of modules and functionality of the platform with their initial purchase/ subscription and can eventually build a number of applications on the platform due to an effective reduction in the per-user cost of each application and also save substantial costs of switching over to a new platform.
Newgen plans to develop new customer relationships by identifying potential customers that operate within the same verticals and engage in cross-selling of the solutions. It aims to also begin developing new verticals such as telecommunications, retail, manufacturing and education in developing markets. The Company continues to leverage its in-depth industry expertise and is continuously focusing on enhancing its global delivery model with onshore centres in proximity to large customers and offshore centres at strategic locations.
Focus on attractive verticals in select mature marketsNewgen has a strong presence across regions in the banking and healthcare verticals and intends
to continue to expand the customer base in these verticals in select mature markets, including USA and UK. The focus areas in the Caribbean include banking and government/PSUs in partnership with consulting firms. As part of the strategy to increase our customer base in USA, the Company has made infrastructure and operational investments in USA including hiring of senior-level professional in sales and marketing for the USA market in fiscal 2016.
Newgen plans to expand the product portfolio through investments in advanced features and technologies. It is constantly engaged in enhancement of R&D capabilities, particularly with a view to create solutions in emerging technologies that enhance the ability to develop tools for enabling entry into new areas and developing products that address customers in specific industries. Key focus areas include business intelligence and analytics, RPA, digitalisation, blockchain, dev-ops and user experience. Newgen continues to work with customers in mature markets to build capabilities, both in domain and technology, for enhancing the product offering, strengthening the platform and expanding the number of features available to customers.
The Company has built high level domain expertise and created robust frameworks for Retail and Corporate lending in the Banking domain which are successfully operating across banks and geographies
To further strengthen and expand our portfolio we may look at inorganic ways of growth as well.
Expansion of strategic business applications to new verticalsThe Company has used the platform to create vertical domain rich products in several verticals, including banking, government/PSU, BPO/IT, insurance and healthcare. While the platforms are industry-agnostic, investments have been made to enhance the expertise of sales and marketing for key industry verticals. Newgen believes that focusing on the digital transformation needs of organisations within these industry verticals can help drive adoption of the platform. It also plans to target new verticals including education, telecommunications, oil & gas, retail, manufacturing, infrastructure and logistics.
Attract, develop and retain highly-skilled employeesThe Company’s employees are one of its most important assets. It focuses on the quality and level of service that the employees deliver by investing in recruitment, development, retention, maintenance of a culture of innovation and by creating both a challenging and rewarding work environment. Newgen’s talent development strategy focuses on engaging, motivating and developing a high performing workforce and aims to create and sustain a positive workplace culture for employees.
81ANNUAL REPORT 2017-18
CORPORATE REVIEW FINANCIAL STATEMENTSSTATUTORY REPORTS
Internal Controls Systems & their AdequacyThe Company has aligned its current systems of internal financial control with the requirement of Companies Act 2013. The explanation of the term ‘Internal Financial Control’ has been provided only in the context of section 134(5)(e). It includes policies and procedures adopted by the company for ensuring the orderly and efficient conduct of its business, thereby covering not only the controls pertaining to financial statements but also include strategic and operational controls pervasive across the entire business.
Newgen internal controls are commensurate with its size and the nature of its operations. These have been designed to provide reasonable assurance with regard to recording and providing reliable financial and operational information, complying with applicable statutes, safeguarding assets from unauthorised use, executing transactions with proper authorisation and ensuring compliance of corporate policies. In view of the above, and for safeguarding the assets of the company, preventing and detecting fraud or other irregularities and maintaining proper books of account and to ensure adequate internal financial control, the Company is already pursuing various Standard Operating Procedures (SOPs), Vigil Mechanism, audit mechanism (through Internal Audit for Financial Year 2017-18, Secretarial Audit and Statutory Audit). Newgen also undergoes periodic audit by specialised third party consultants and professional for business specific compliances such as quality management, Information Security Management, etc. It has continued its efforts to align all its processes and controls with global best practices. Our management assessed the effectiveness of the Company’s internal control over financial reporting as of March 31, 2018. B S R & Associates, LLP, Chartered Accountant, the statutory auditors of Newgen has audited the financial statements included in this annual report and also reported on our internal control over financial reporting (as defined in section 143 of Companies Act 2013).
The Audit Committee reviews reports submitted by the management and audit reports submitted by M/s Grant Thornton, internal auditors, and B S R & Associates, LLP, statutory auditors. The audit Committee also meets Newgen’s statutory auditors to ascertain, inter alia, their views on the adequacy of internal control systems and keeps the Board of directors informed of its major observations periodically. Based on its evaluation (as defined in section 177 of Companies Act 2013), our audit Committee has concluded that, as of March 31, 2018, our internal financial controls were adequate and operating effectively.
Human ResourcesThe Company follows the philosophy of achieving mutually beneficial and all-inclusive growth and
thus values its human resources as its biggest asset. The employees are provided a fair environment supported by transparent policies to foster their personal growth along with attainment of corporate objectives. It encourages all employees to strike a perfect worklife balance. The Company’s policies are employee centric and aim at keeping its personnel motivated and satisfied. Nonetheless, the Company has formed disciplinary policies and a code of due diligence to ensure smooth functioning of the business.
During the year, critical functions of the organisation were strengthened with assessment of Leadership bandwidth to build a strong team aligned to our fundamentals and culture. Particular emphasis was placed on attracting, developing and retaining talent and fostering a unique performance culture. As a strategic partner, the HR function launched numerous initiatives to ensure a high-performing and engaged workforce.
As on March 31, 2018, we had 2,656 personnel (consolidated) comprising 2,402 employees and 254 contract workers. As a result of its visionary human resource policies, the Company has managed to attract and retain talent.
OutlookDigital Transformation has become a central component for businesses across all industries. It entails leveraging digital tools and technologies to make life easier, bringing increased convenience, enhanced efficiency, improved affordability, and better access to information, goods and services.
Going forward, the Company aims to pursue growth strategies to expand its market share across key geographies and solutions. Newgen’s platform is designed to be natively multi-lingual to address challenges in multi-national organisations. The Company believes that focusing on the digital transformation needs of organisations within key industry verticals can help drive adoption of its platform. As of March 31, 2018, the Company operated in 60+ countries and believes it has a significant opportunity to grow its international footprint. It continues to invest in direct and indirect sales channels, professional services, customer support and channel partners to expand its geographical footprint.
To address the market opportunities arising from digitisation, Newgen seeks to continue to expand its product portfolio and is currently working on several projects including ECM NXT, Virtual Repository Services, Digital Sensing, RPA with BPM, BPM NXT and Corrus.

82 Newgen Software Technologies Limited
Annexure 10
FORM NO. AOC -2
(Pursuant to clause (h) of sub-section (3) of Section 134 of the Act and Rule 8(2)
of the Companies (Accounts) Rules, 2014.)
Form for Disclosure of particulars of contracts/arrangements entered into by the company with related parties
referred to in sub section (1) of Section 188 of the Companies Act, 2013 including certain arms length transaction
under third proviso thereto.
1) Details of contracts or arrangements or transactions not at Arm’s length basis: Newgen Software
Technologies Limited (the “Company”) has not entered into any contract/arrangement/transaction with its
related parties which is not in ordinary course of business or at arm’s length during FY 2017-18. The pricing
of the transactions are with wholly owned subsidiaries are based on the Independent Transfer Pricing
Report given by Price Waterhouse & Co., Chartered Accountants which determined the arms length pricing
and are under ordinary course of business. In addition, the process goes through internal and external
checking, followed by quarterly reporting to the Audit Committee:
TABLE 51
a) Name (s) of the related party & nature of
relationship
Ms. Shubhi Nigam daughter of Mr. Diwakar Nigam, Chairman
and Managing Director and Ms. Priyadarshini Nigam, Whole-
time Director, of the Company
b) Nature of contracts/arrangements/transaction Employment
c) Duration of the contracts/arrangements/
transaction
April 27, 2017 till continuing
d) Salient terms of the contracts or arrangements
or transaction including the value, if any
Appointment of Ms. Shubhi Nigam as Manager - P & S in
Newgen Software Inc., a wholly-owned subsidiary of the
Company (Newgen Software Technologies Limited), on a
total remuneration of USD 1,00,000. She will be also entitled
for basic, additional, fixed and variable remunerations, bonus,
commission, incentives, allowances, benefits, perquisites, etc.
as per rules of her employer. The terms of employment and
remuneration of Ms. Shubhi Nigam may be varied from time
to time by her employer Newgen Software Inc. based on the
industry standards prevailing for similar position in USA and
based on her performance evaluation and its own Remuneration
Policy for similar position
e) Justification for entering into such contracts or
arrangements or transactions’
Appointment on the basis of qualification. Bachelor’s in Applied
Science from University of Pennysylvania.
f) Date of approval by the Board June 14, 2017
g) Amount paid as advances, if any Not Applicable
h) Date on which the special resolution was
passed in General meeting as required under
first proviso to section 188
July 28, 2017

83ANNUAL REPORT 2017-18
CORPORATE REVIEW FINANCIAL STATEMENTSSTATUTORY REPORTS
2) Details of contracts or arrangements or transactions at Arm’s length basis:
TABLE 52
a) Name (s) of the related party & nature of relationship Not Applicable
b) Nature of contracts/arrangements/transaction Not Applicable
c) Duration of the contracts/arrangements/transaction Not Applicable
d) Salient terms of the contracts or arrangements or transaction including the
value, if any
Not Applicable
e) Date of approval by the Board Not Applicable
f) Amount paid as advances, if any Not Applicable
Note: the above disclosure on material transactions are based on the principle that the transactions with wholly owned
subsidiaries are exempt for the purpose of Section 188(1) of the Companies Act, 2013.
For and on behalf of the Board of Directors
Date: May 17, 2018 Diwakar NigamPlace: New Delhi Chairman and Managing Director
DIN: 00263222

84 Newgen Software Technologies Limited 85
Independent Auditor’s Report
ToThe Members of Newgen Software Technologies Limited
Report on the Audit of the Standalone Ind AS Financial StatementsWe have audited the accompanying standalone
Ind AS financial statements of Newgen Software
Technologies Limited (“the Company”), which
comprise the Balance Sheet as at 31 March 2018,
the Statement of Profit and Loss (including other
comprehensive income), the Statement of Changes in
Equity and the Statement of Cash Flows for the year
then ended, and summary of the significant accounting
policies and other explanatory information.
Management’s Responsibility for the Standalone Ind AS Financial StatementsThe Company’s Board of Directors is responsible for
the matters stated in Section 134(5) of the Companies
Act, 2013 (“the Act”) with respect to the preparation
of these standalone Ind AS financial statements that
give a true and fair view of the state of affairs, profit
(including other comprehensive income), changes in
equity and cash flows of the Company in accordance
with the accounting principles generally accepted in
India, including the Indian Accounting Standards (Ind
AS) prescribed under section 133 of the Act.
This responsibility also includes maintenance of
adequate accounting records in accordance with the
provisions of the Act for safeguarding the assets of
the Company and for preventing and detecting frauds
and other irregularities; selection and application of
appropriate accounting policies; making judgments
and estimates that are reasonable and prudent; and
design, implementation and maintenance of adequate
internal financial controls that were operating
effectively for ensuring the accuracy and completeness
of the accounting records, relevant to the preparation
and presentation of the standalone Ind AS financial
statements that give a true and fair view and are free
from material misstatement, whether due to fraud or
error.
In preparing the financial statements, management
is responsible for assessing the Company’s ability to
continue as a going concern, disclosing, as applicable,
matters related to going concern and using the going
concern basis of accounting unless management
either intends to liquidate the Company or to cease
operations, or has no realistic alternative but to do so.
Auditor’s ResponsibilityOur responsibility is to express an opinion on these standalone Ind AS financial statements based on our audit.
We have taken into account the provisions of the Act, the accounting and auditing standards and matters which are required to be included in the audit report under the provisions of the Act and the Rules made thereunder.
We conducted our audit of the standalone Ind AS financial statements in accordance with the Standards on Auditing specified under Section 143(10) of the Act. Those Standards require that we comply with ethical requirements and plan and perform the audit to obtain reasonable assurance about whether the standalone Ind AS financial statements are free from material misstatement.
An audit involves performing procedures to obtain audit evidence about the amounts and the disclosures in the standalone Ind AS financial statements. The procedures selected depend on the auditor’s judgment, including the assessment of the risks of material misstatement of the standalone Ind AS financial statements, whether due to fraud or error. In making those risk assessments, the auditor considers internal financial control relevant to the Company’s preparation of the standalone Ind AS financial statements that give a true and fair view in order to design audit procedures that are appropriate in the circumstances. An audit also includes evaluating the appropriateness of the accounting policies used and the reasonableness of the accounting estimates made by the Company’s Directors, as well as evaluating the overall presentation of the standalone Ind AS financial statements.
We are also responsible to conclude on the appropriateness of management’s use of the going concern basis of accounting and, based on the audit evidence obtained, whether a material uncertainty exists related to events or conditions that may cast significant doubt on the entity’s ability to continue as a going concern. If we conclude that a material uncertainty exists, we are required to draw attention in the auditor’s report to the related disclosures in the financial statements or, if such disclosures are inadequate, to modify the opinion. Our conclusions are based on the audit evidence obtained up to the date of the auditor’s report. However, future events or conditions may cause an entity to cease to continue
as a going concern.
84 Newgen Software Technologies Limited 85ANNUAL REPORT 2017-18
CORPORATE REVIEW FINANCIAL STATEMENTSSTATUTORY REPORTS
We believe that the audit evidence we have obtained
is sufficient and appropriate to provide a basis for
our audit opinion on the standalone Ind AS financial
statements.
OpinionIn our opinion and to the best of our information
and according to the explanations given to us, the
aforesaid standalone Ind AS financial statements give
the information required by the Act in the manner so
required and give a true and fair view in conformity
with the accounting principles generally accepted in
India of the state of affairs of the Company as at 31
March 2018, its profit (including other comprehensive
income), changes in equity and its cash flows for the
year ended on that date.
Report on Other Legal and Regulatory Requirements1. As required by the Companies (Auditor’s Report)
Order, 2016 (“the Order”) issued by the Central
Government in terms of Section 143(11) of the
Act, we give in “Annexure A” a statement on the
matters specified in paragraphs 3 and 4 of the
Order.
2. As required by Section 143(3) of the Act, we
report that:
a) We have sought and obtained all the
information and explanations which to
the best of our knowledge and belief were
necessary for the purposes of our audit.
b) In our opinion, proper books of account
as required by law have been kept by the
Company so far as it appears from our
examination of those books.
c) The Balance Sheet, the Statement of Profit
and Loss (including other comprehensive
income), the Cash Flow Statement and
Statement of Changes in Equity dealt with
by this Report are in agreement with the
books of account.
d) In our opinion, the aforesaid standalone Ind
AS financial statements comply with the
Indian Accounting Standards prescribed
under section 133 of the Act.
e) On the basis of the written representations
received from the directors as on 31 March
2018 taken on record by the Board of
Directors, none of the directors is disqualified
as on 31 March 2018 from being appointed as
a director in terms of Section 164(2) of the
Act.
f) With respect to the adequacy of the
internal financial controls with reference to
financial statements of the Company and
the operating effectiveness of such controls,
refer to our separate Report in “Annexure
B”.
g) With respect to the other matters to
be included in the Auditor’s Report in
accordance with Rule 11 of the Companies
(Audit and Auditors) Rules, 2014, in our
opinion and to the best of our information
and according to the explanations given to
us:
i. The Company does not have any
pending litigations which would impact
its financial position;
ii. The Company did not have any long-
term contracts including derivative
contracts for which there were any
material foreseeable losses;
iii. There were no amounts which were
required to be transferred to the
Investor Education and Protection Fund
by the Company; and
iv. The disclosures in the financial
statements regarding holdings as well
as dealings in specified bank notes
during the period from 8 November
2016 to 30 December 2016 have not
been made since they do not pertain to
the financial year ended 31 March 2018.
However, amounts as appearing in the
audited Standalone financial statements
for the year ended 31 March 2017 have
been disclosed.
For B S R & Associates LLPChartered Accountants
Firm Registration No.:
116231W/ W-100024
Rakesh DewanPlace: Gurugram Partner
Date: 17 May 2018 Membership No.: 092212
86 Newgen Software Technologies Limited 87
Annexure Areferred to in our Independent Auditor’s Report to the members of Newgen Software Technologies Limited on the standalone financial statements for the year ended 31 March 2018, we report that:
(i) (a) The Company has maintained proper records
showing full particulars, including quantitative
details and situation of fixed assets.
(b) The Company has a regular program of
physical verification of its fixed assets
by which all fixed assets are verified in a
phased manner over a period of two years.
In accordance with this programme, fixed
assets at certain locations were verified by the
management during the year. In our opinion,
this periodicity of physical verification is
reasonable having regard to the size of the
Company and the nature of its assets. As
informed to us, no material discrepancies
were noticed on such verification.
(c) According to the information and
explanations given to us and on the basis
of our examination of the records of the
Company, the title deeds and lease deeds
of the immovable properties are held in the
name of the Company.
(ii) The Company is a service company, primarily
engaged in the business of software product
development including designing and delivering
end-to-end software solutions covering the
entire spectrum of software services from
workflow automation to document management
to imaging. Accordingly, it does not hold any
physical inventories at the end of the year. Thus,
paragraph 3(ii) of the Order is not applicable.
(iii) The Company has not granted any loans, secured
or unsecured, to Companies, limited liability
partnerships, firms or other parties covered in
the register required under section 189 of the
Companies Act, 2013. Accordingly, para 3(iii) of
the Order is not applicable.
(iv) According to the information and explanations
given to us, provisions of section 186 of the
Companies Act, 2013 in respect of loan given
have been complied with by the Company.
There are no loans given by the company in
respect of which provisions of Section 185 of the
Companies Act, 2013 are applicable. There are
no investments, guarantees and securities given
in respect of which Section 185 and 186 of the
Companies Act, 2013 are applicable.
(v) As per the information and explanations given to
us, the Company has not accepted any deposits
as mentioned in the directives issued by the
Reserve Bank of India and the provisions of
section 73 to 76 or any other relevant provisions
of the Act and the rules framed there under.
Accordingly paragraph 3(v) of the order is not
applicable.
(vi) The Central Government has not prescribed the
maintenance of cost records under sub section
(1) of section 148 of the Companies Act, 2013 for
any of the activities carried out by the Company.
Accordingly paragraph 3(vi) of the order is not
applicable.
(vii) (a) According to the information and
explanations given to us and on the basis
of our examination of the records of the
Company, amounts deducted/ accrued in the
books of account in respect of undisputed
statutory dues including Provident Fund,
Employees’ State Insurance, Income-tax,
Sales tax, Service tax, Goods and Service
tax, Duty of customs, Value added tax, Cess
and other material statutory dues have been
regularly deposited during the year by the
Company with the appropriate authorities.
As explained to us, the Company does not
have any dues on account of Duty of excise.
According to the information and
explanations given to us, no undisputed
amounts payable in respect of Provident
Fund, Employees’ State Insurance, Income
-tax, Sales tax, Service tax, Goods and
Service tax, Duty of customs, Value added
tax, Cess and other material statutory dues
were in arrears as at 31 March 2018 for a
period of more than six months from the
date they became payable.
(b) According to the information and
explanations given to us, there are no dues
of Income tax, Sales tax, Service tax, Goods
and Service tax, Duty of customs and Value
added tax which have not been deposited
with the appropriate authorities on account
of any dispute. As explained above, the
Company does not have any dues on
account of Duty of excise.
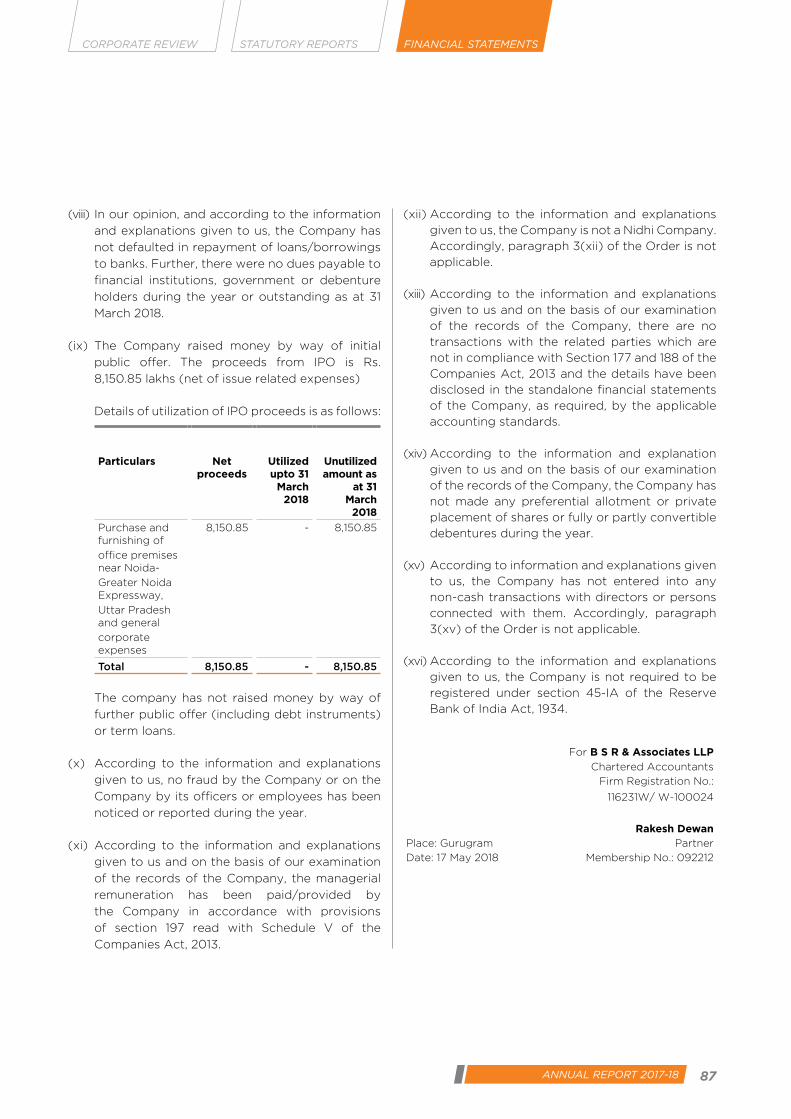
86 Newgen Software Technologies Limited 87ANNUAL REPORT 2017-18
CORPORATE REVIEW FINANCIAL STATEMENTSSTATUTORY REPORTS
(viii) In our opinion, and according to the information
and explanations given to us, the Company has
not defaulted in repayment of loans/borrowings
to banks. Further, there were no dues payable to
financial institutions, government or debenture
holders during the year or outstanding as at 31
March 2018.
(ix) The Company raised money by way of initial
public offer. The proceeds from IPO is Rs.
8,150.85 lakhs (net of issue related expenses)
Details of utilization of IPO proceeds is as follows:
Particulars Net proceeds
Utilized upto 31
March 2018
Unutilized amount as
at 31 March
2018
Purchase and furnishing of
office premises near Noida-
Greater Noida Expressway,
Uttar Pradesh and general
corporate expenses
8,150.85 - 8,150.85
Total 8,150.85 - 8,150.85
The company has not raised money by way of
further public offer (including debt instruments)
or term loans.
(x) According to the information and explanations
given to us, no fraud by the Company or on the
Company by its officers or employees has been
noticed or reported during the year.
(xi) According to the information and explanations
given to us and on the basis of our examination
of the records of the Company, the managerial
remuneration has been paid/provided by
the Company in accordance with provisions
of section 197 read with Schedule V of the
Companies Act, 2013.
(xii) According to the information and explanations
given to us, the Company is not a Nidhi Company.
Accordingly, paragraph 3(xii) of the Order is not
applicable.
(xiii) According to the information and explanations
given to us and on the basis of our examination
of the records of the Company, there are no
transactions with the related parties which are
not in compliance with Section 177 and 188 of the
Companies Act, 2013 and the details have been
disclosed in the standalone financial statements
of the Company, as required, by the applicable
accounting standards.
(xiv) According to the information and explanation
given to us and on the basis of our examination
of the records of the Company, the Company has
not made any preferential allotment or private
placement of shares or fully or partly convertible
debentures during the year.
(xv) According to information and explanations given
to us, the Company has not entered into any
non-cash transactions with directors or persons
connected with them. Accordingly, paragraph
3(xv) of the Order is not applicable.
(xvi) According to the information and explanations
given to us, the Company is not required to be
registered under section 45-IA of the Reserve
Bank of India Act, 1934.
For B S R & Associates LLPChartered Accountants
Firm Registration No.:
116231W/ W-100024
Rakesh DewanPlace: Gurugram Partner
Date: 17 May 2018 Membership No.: 092212

88 Newgen Software Technologies Limited 89
Annexure Bto the Independent Auditor’s Report of even date on the standalone financial statements of Newgen Software Technologies Limited for the year ended 31 March 2018
Report on the Internal Financial Controls under Clause (i) of Sub-section 3 of Section 143 of the Companies Act, 2013 (“the Act”)We have audited the internal financial controls with
reference to financial statements of Newgen Software
Technologies Limited (“the Company”) as of 31 March
2018 in conjunction with our audit of the standalone
Ind AS financial statements of the Company for the
year ended on that date.
Management’s Responsibility for Internal Financial ControlsThe Company’s management is responsible for
establishing and maintaining internal financial
controls based on the internal control with reference
to financial statements criteria established by the
Company considering the essential components of
internal control stated in the Guidance Note on Audit
of Internal Financial Controls over Financial Reporting,
issued by the Institute of Chartered Accountants of
India (‘ICAI’). These responsibilities include the design,
implementation and maintenance of adequate internal
financial controls that were operating effectively
for ensuring the orderly and efficient conduct of its
business, including adherence to Company’s policies,
the safeguarding of its assets, the prevention and
detection of frauds and errors, the accuracy and
completeness of the accounting records, and the
timely preparation of reliable financial information, as
required under the Companies Act, 2013.
Auditors’ ResponsibilityOur responsibility is to express an opinion on the
Company’s internal financial controls with reference
to financial statements based on our audit. We
conducted our audit in accordance with the Guidance
Note on Audit of Internal Financial Controls Over
Financial Reporting (the “Guidance Note”) and the
Standards on Auditing, issued by ICAI and deemed to
be prescribed under section 143(10) of the Companies
Act, 2013, to the extent applicable to an audit of
internal financial controls, both applicable to an audit
of Internal Financial Controls and, both issued by
the ICAI. Those Standards and the Guidance Note
require that we comply with ethical requirements
and plan and perform the audit to obtain reasonable
assurance about whether adequate internal financial
controls with reference to financial statements was
established and maintained and if such controls
operated effectively in all material respects.
Our audit involves performing procedures to obtain
audit evidence about the adequacy of the internal
financial controls system with reference to financial
statements and their operating effectiveness. Our
audit of internal financial controls with reference
to financial statements included obtaining an
understanding of internal financial controls with
reference to financial statements, assessing the risk
that a material weakness exists, and testing and
evaluating the design and operating effectiveness
of internal control based on the assessed risk.
The procedures selected depend on the auditor’s
judgement, including the assessment of the risks of
material misstatement of the financial statements,
whether due to fraud or error.
We believe that the audit evidence we have obtained
is sufficient and appropriate to provide a basis
for our audit opinion on the Company’s internal
financial controls system with reference to financial
statements.
Meaning of Internal Financial Controls with reference to financial statementsA Company’s internal financial control with reference
to financial statements is a process designed to
provide reasonable assurance regarding the reliability
of financial reporting and the preparation of financial
statements for external purposes in accordance
with generally accepted accounting principles. A
Company’s internal financial control with reference
to financial statements includes those policies and
procedures that pertain to the maintenance of
records that, in reasonable detail, accurately and fairly
reflect the transactions and dispositions of the assets
of the Company; (2) provide reasonable assurance
that transactions are recorded as necessary to permit
preparation of financial statements in accordance
with generally accepted accounting principles, and
that receipts and expenditures of the Company are
being made only in accordance with authorisations of
management and directors of the Company; and (3)
provide reasonable assurance regarding prevention
or timely detection of unauthorised acquisition, use,
or disposition of the Company’s assets that could
have a material effect on the financial statements.
Inherent Limitations of Internal Financial Controls with reference to financial statementsBecause of the inherent limitations of internal
financial controls with reference to financial
statements, including the possibility of collusion or
improper management override of controls, material

88 Newgen Software Technologies Limited 89ANNUAL REPORT 2017-18
CORPORATE REVIEW FINANCIAL STATEMENTSSTATUTORY REPORTS
misstatements due to error or fraud may occur and
not be detected. Also, projections of any evaluation
of the internal financial controls with reference to
financial statements to future periods are subject
to the risk that the internal financial control with
reference to financial statements may become
inadequate because of changes in conditions, or
that the degree of compliance with the policies or
procedures may deteriorate.
OpinionIn our opinion, the Company has, in all material
respects, an adequate internal financial controls
system with reference to financial statements and such
internal financial controls with reference to financial
statements were operating effectively as at 31 March
2018, based on the internal control with reference
to financial statements criteria established by the
Company considering the essential components of
internal control stated in the Guidance Note on
Audit of Internal Financial Controls Over Financial
Reporting, issued by the ICAI.
For B S R & Associates LLPChartered Accountants
Firm Registration No.:
116231W/ W-100024
Rakesh DewanPlace: Gurugram Partner
Date: 17 May 2018 Membership No.: 092212
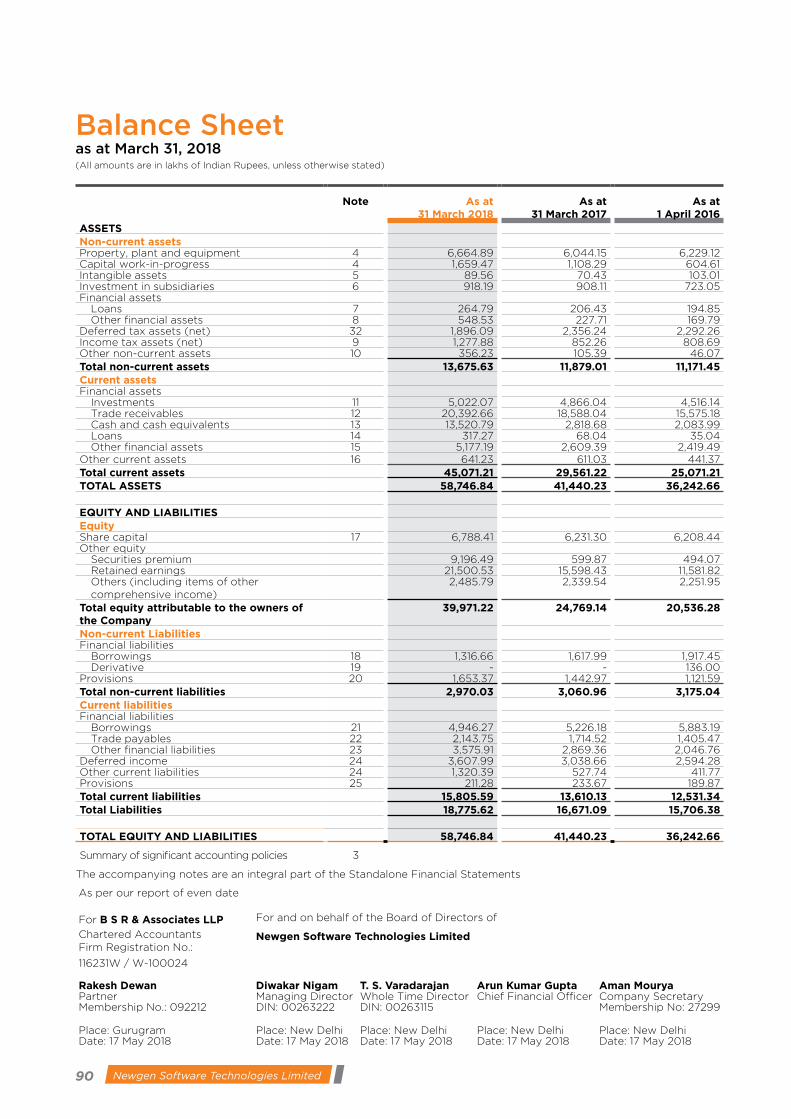
90 Newgen Software Technologies Limited 91
As per our report of even date
For B S R & Associates LLP For and on behalf of the Board of Directors of
Chartered Accountants Newgen Software Technologies LimitedFirm Registration No.:
116231W / W-100024
Rakesh Dewan Diwakar Nigam T. S. Varadarajan Arun Kumar Gupta Aman MouryaPartner Managing Director Whole Time Director Chief Financial Officer Company SecretaryMembership No.: 092212 DIN: 00263222 DIN: 00263115 Membership No: 27299
Place: Gurugram Place: New Delhi Place: New Delhi Place: New Delhi Place: New DelhiDate: 17 May 2018 Date: 17 May 2018 Date: 17 May 2018 Date: 17 May 2018 Date: 17 May 2018
Balance Sheet as at March 31, 2018(All amounts are in lakhs of Indian Rupees, unless otherwise stated)
Note As at 31 March 2018
As at 31 March 2017
As at 1 April 2016
ASSETSNon-current assetsProperty, plant and equipment 4 6,664.89 6,044.15 6,229.12Capital work-in-progress 4 1,659.47 1,108.29 604.61Intangible assets 5 89.56 70.43 103.01Investment in subsidiaries 6 918.19 908.11 723.05Financial assets Loans 7 264.79 206.43 194.85 Other financial assets 8 548.53 227.71 169.79Deferred tax assets (net) 32 1,896.09 2,356.24 2,292.26Income tax assets (net) 9 1,277.88 852.26 808.69Other non-current assets 10 356.23 105.39 46.07Total non-current assets 13,675.63 11,879.01 11,171.45Current assetsFinancial assets Investments 11 5,022.07 4,866.04 4,516.14 Trade receivables 12 20,392.66 18,588.04 15,575.18 Cash and cash equivalents 13 13,520.79 2,818.68 2,083.99 Loans 14 317.27 68.04 35.04 Other financial assets 15 5,177.19 2,609.39 2,419.49Other current assets 16 641.23 611.03 441.37Total current assets 45,071.21 29,561.22 25,071.21TOTAL ASSETS 58,746.84 41,440.23 36,242.66
EQUITY AND LIABILITIESEquityShare capital 17 6,788.41 6,231.30 6,208.44Other equity Securities premium 9,196.49 599.87 494.07 Retained earnings 21,500.53 15,598.43 11,581.82 Others (including items of other
comprehensive income) 2,485.79 2,339.54 2,251.95
Total equity attributable to the owners of the Company
39,971.22 24,769.14 20,536.28
Non-current LiabilitiesFinancial liabilities Borrowings 18 1,316.66 1,617.99 1,917.45 Derivative 19 - - 136.00Provisions 20 1,653.37 1,442.97 1,121.59Total non-current liabilities 2,970.03 3,060.96 3,175.04Current liabilitiesFinancial liabilities Borrowings 21 4,946.27 5,226.18 5,883.19 Trade payables 22 2,143.75 1,714.52 1,405.47 Other financial liabilities 23 3,575.91 2,869.36 2,046.76Deferred income 24 3,607.99 3,038.66 2,594.28Other current liabilities 24 1,320.39 527.74 411.77Provisions 25 211.28 233.67 189.87Total current liabilities 15,805.59 13,610.13 12,531.34Total Liabilities 18,775.62 16,671.09 15,706.38
TOTAL EQUITY AND LIABILITIES 58,746.84 41,440.23 36,242.66
Summary of significant accounting policies 3
The accompanying notes are an integral part of the Standalone Financial Statements

90 Newgen Software Technologies Limited 91ANNUAL REPORT 2017-18
CORPORATE REVIEW FINANCIAL STATEMENTSSTATUTORY REPORTS
As per our report of even date attached.
For B S R & Associates LLP For and on behalf of the Board of Directors of
Chartered Accountants Newgen Software Technologies LimitedFirm Registration No.:
116231W / W-100024
Rakesh Dewan Diwakar Nigam T. S. Varadarajan Arun Kumar Gupta Aman MouryaPartner Managing Director Whole Time Director Chief Financial Officer Company SecretaryMembership No.: 092212 DIN: 00263222 DIN: 00263115 Membership No: 27299
Place: Gurugram Place: New Delhi Place: New Delhi Place: New Delhi Place: New DelhiDate: 17 May 2018 Date: 17 May 2018 Date: 17 May 2018 Date: 17 May 2018 Date: 17 May 2018
Statement of Profit and Loss for the year ended March 31, 2018(All amounts are in lakhs of Indian Rupees, unless otherwise stated)
Note For the year ended 31 March 2018
For the year ended 31 March 2017
IncomeRevenue from operations 26 45,952.36 38,311.41Other income 27 758.19 826.61Total income 46,710.55 39,138.02ExpensesEmployee benefits expense 28 22,285.86 18,633.19Finance costs 29 520.68 525.60Depreciation and amortisation expense 30 567.68 481.87Other expenses 31 14,243.15 13,172.00Total expenses 37,617.37 32,812.66Profit before tax 9,093.18 6,325.36Tax expense 32Current tax 1,549.01 1,540.62Less: MAT entitlement (86.97) -Tax expense for earlier years 64.50 126.24Deferred tax (credit) 503.55 (133.89)Income tax expense 2,030.09 1,532.97Profit for the year 7,063.09 4,792.39Other comprehensive income/(loss)Items that will not be reclassified subsequently to profit or lossRemeasurement of defined benefit liability (asset) 126.35 (82.88)Income tax relating to items that will not be reclassified to profit or loss
(43.73) 28.31
Net other comprehensive income/(loss) not to be reclassified subsequently to profit or loss
82.62 (54.57)
Items that will be reclassified subsequently to profit or lossDebt instruments through other comprehensive income - net change in fair value
(0.47) 26.59
Income tax relating to items that will be reclassified to profit or loss 0.16 (9.20)Net other comprehensive (loss)/income to be reclassified subsequently to profit or loss
(0.31) 17.39
Other comprehensive income/(loss) for the year, net of income tax
82.31 (37.18)
Total comprehensive income for the year 7,145.40 4,755.21Profit attributable to:Owners of the company 7,063.09 4,792.39Profit for the year 7,063.09 4,792.39Other comprehensive income/(loss) attributable to:Owners of the company 82.31 (37.18)Other comprehensive income/(loss) for the year 82.31 (37.18)Total comprehensive income attributable to:Owners of the company 7,145.40 4,755.21Total comprehensive income for the year 7,145.40 4,755.21Earnings per equity shareNominal value of share INR 10 (31 March 2017: INR 10, 1 April 2016: INR 10)Basic earning per share 11.09 7.72Diluted earning per share 10.81 7.55
Summary of significant accounting policies 3
The accompanying notes are an integral part of the Standalone Financial Statements
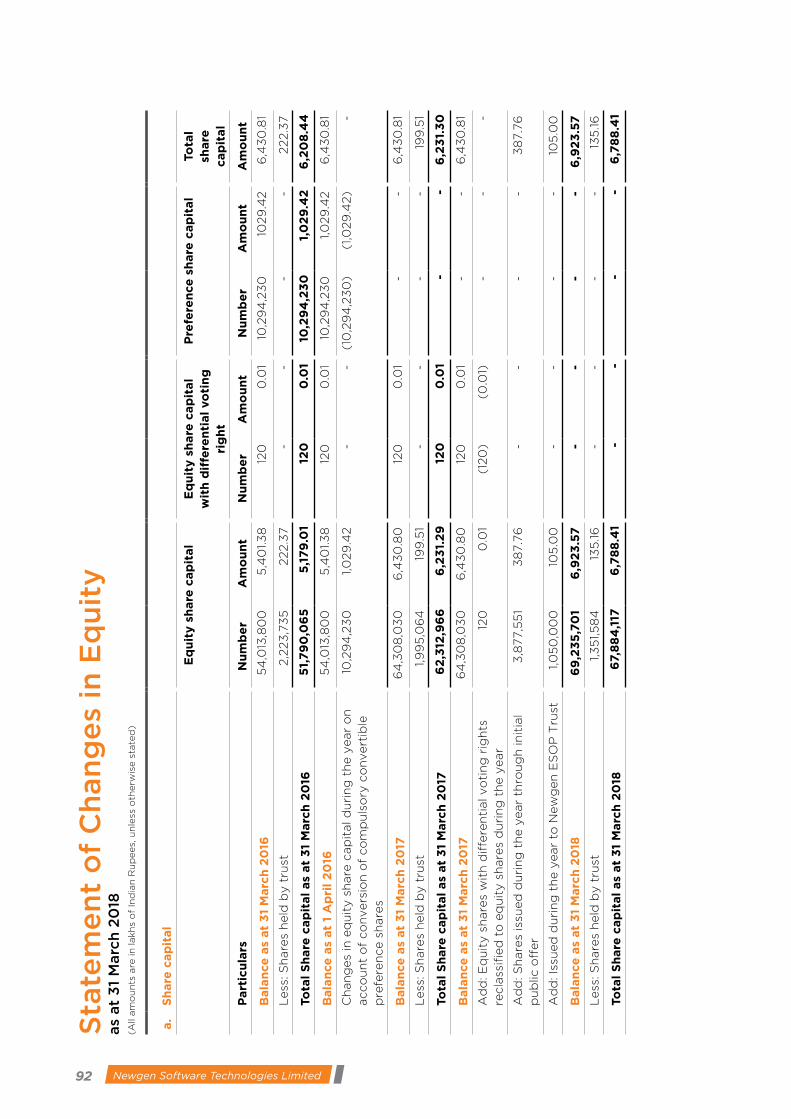
92 Newgen Software Technologies Limited 93
Sta
tem
en
t o
f C
han
ge
s in
Eq
uit
yas
at
31
Marc
h 2
018
(All
am
ou
nts
are
in
lakh
s o
f In
dia
n R
up
ees,
un
less
oth
erw
ise s
tate
d)
a.
Sh
are
cap
ital
Eq
uit
y s
hare
cap
ital
Eq
uit
y s
hare
cap
ital
wit
h d
iffe
ren
tial
vo
tin
g
rig
ht
Pre
fere
nce
sh
are
cap
ital
Tota
l sh
are
cap
ital
Part
icu
lars
Nu
mb
er
Am
ou
nt
Nu
mb
er
Am
ou
nt
Nu
mb
er
Am
ou
nt
Am
ou
nt
Bala
nce
as
at
31
Marc
h 2
016
54
,013
,80
0
5,4
01.3
8
120
0
.01
10,2
94
,23
0
1029
.42
6,4
30
.81
Less
: S
hare
s h
eld
by t
rust
2,2
23
,73
5
222.3
7
- -
- -
222.3
7
Tota
l S
hare
cap
ital
as
at
31
Marc
h 2
016
51,
79
0,0
65
5
,17
9.0
1 12
0
0.0
1 10
,29
4,2
30
1,
02
9.4
2
6,2
08
.44
Bala
nce
as
at
1 A
pri
l 2
016
54
,013
,80
0
5,4
01.3
8
120
0
.01
10,2
94
,23
0
1,0
29
.42
6,4
30
.81
Ch
an
ges
in e
qu
ity s
hare
cap
ital d
uri
ng
th
e y
ear
on
acco
un
t o
f co
nvers
ion
of
co
mp
uls
ory
co
nvert
ible
pre
fere
nce s
hare
s
10,2
94
,23
0
1,0
29
.42
- -
(10
,29
4,2
30
)(1
,029
.42)
-
Bala
nce
as
at
31
Marc
h 2
017
64
,30
8,0
30
6
,43
0.8
0
120
0
.01
- -
6,4
30
.81
Less
: S
hare
s h
eld
by t
rust
1,9
95
,06
4
199
.51
- -
- -
199
.51
Tota
l S
hare
cap
ital
as
at
31
Marc
h 2
017
62
,312
,96
6
6,2
31.
29
12
0
0.0
1 -
- 6
,23
1.3
0
Bala
nce
as
at
31
Marc
h 2
017
64
,30
8,0
30
6
,43
0.8
0
120
0
.01
- -
6,4
30
.81
Ad
d: E
qu
ity s
hare
s w
ith
dif
fere
nti
al vo
tin
g r
igh
ts
recla
ssifi
ed
to
eq
uit
y s
hare
s d
uri
ng
th
e y
ear
120
0
.01
(120
)(0
.01)
- -
-
Ad
d: S
hare
s is
sued
du
rin
g t
he y
ear
thro
ug
h in
itia
l
pu
blic
off
er
3,8
77,5
51
38
7.7
6
- -
- -
38
7.7
6
Ad
d: Is
sued
du
rin
g t
he y
ear
to N
ew
gen
ES
OP
Tru
st
1,0
50
,00
0
105
.00
-
- -
- 10
5.0
0
Bala
nce
as
at
31
Marc
h 2
018
69
,23
5,7
01
6,9
23
.57
-
- -
- 6
,92
3.5
7
Less
: S
hare
s h
eld
by t
rust
1,3
51,5
84
13
5.16
-
- -
- 13
5.16
Tota
l S
hare
cap
ital
as
at
31
Marc
h 2
018
67,
88
4,1
17
6,7
88
.41
- -
- -
6,7
88
.41
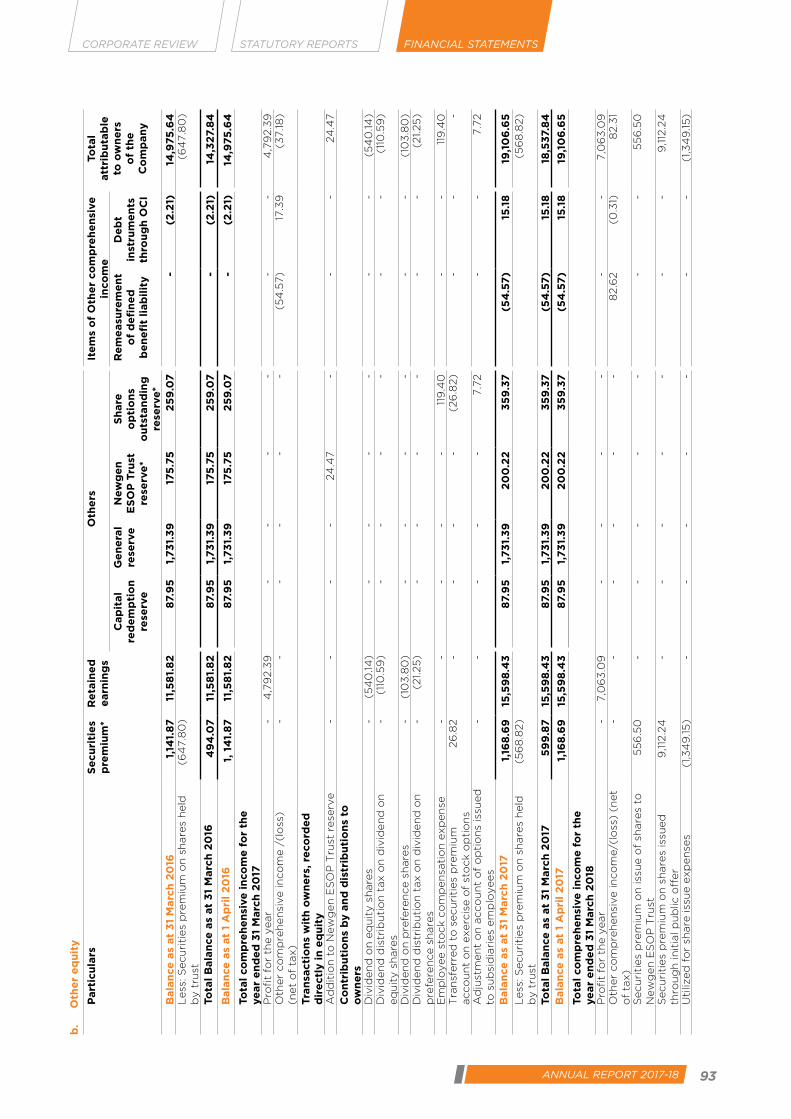
92 Newgen Software Technologies Limited 93ANNUAL REPORT 2017-18
CORPORATE REVIEW FINANCIAL STATEMENTSSTATUTORY REPORTS
b.
Oth
er
eq
uit
y
Part
icu
lars
Se
cu
riti
es
pre
miu
m*
Re
tain
ed
e
arn
ing
sO
the
rsIt
em
s o
f O
the
r co
mp
reh
en
sive
in
co
me
Tota
l att
rib
uta
ble
to
ow
ne
rs
of
the
C
om
pan
y
Cap
ital
red
em
pti
on
re
serv
e
Ge
ne
ral
rese
rve
New
ge
n
ES
OP
Tru
st
rese
rve*
Sh
are
o
pti
on
s o
uts
tan
din
g
rese
rve*
Re
me
asu
rem
en
t o
f d
efi
ne
d
be
ne
fit
liab
ilit
y
De
bt
inst
rum
en
ts
thro
ug
h O
CI
Bala
nce
as
at
31
Marc
h 2
016
1,
141.
87
11
,58
1.8
2
87.
95
1,
73
1.3
9
175
.75
2
59
.07
-
(2.2
1)14
,975
.64
Less
: S
ecu
riti
es
pre
miu
m o
n s
hare
s h
eld
b
y t
rust
(6
47.8
0)
(64
7.8
0)
Tota
l B
ala
nce
as
at
31
Marc
h 2
016
4
94
.07
11
,58
1.8
2
87.
95
1,
73
1.3
9
175
.75
2
59
.07
-
(2.2
1)14
,32
7.8
4
Bala
nce
as
at
1 A
pri
l 2
016
1,
14
1.8
7
11,5
81.
82
8
7.9
5
1,73
1.3
9
175
.75
2
59
.07
-
(2.2
1)14
,975
.64
Tota
l co
mp
reh
en
sive
in
co
me
fo
r th
e
ye
ar
en
de
d 3
1 M
arc
h 2
017
Pro
fit
for
the y
ear
- 4
,79
2.3
9
- -
- -
- -
4,7
92.3
9O
ther
co
mp
reh
en
sive in
co
me /
(lo
ss)
(net
of
tax)
- -
- -
- -
(54
.57)
17.3
9
(37.18
)
Tra
nsa
cti
on
s w
ith
ow
ne
rs, re
co
rde
d
dir
ectl
y i
n e
qu
ity
Ad
dit
ion
to
New
gen
ES
OP
Tru
st r
ese
rve
- -
- -
24
.47
- -
- 24
.47
Co
ntr
ibu
tio
ns
by
an
d d
istr
ibu
tio
ns
to
ow
ne
rsD
ivid
en
d o
n e
qu
ity s
hare
s -
(54
0.14
)-
- -
- -
- (5
40
.14
)D
ivid
en
d d
istr
ibu
tio
n t
ax o
n d
ivid
en
d o
n
eq
uit
y s
hare
s -
(110
.59
)-
- -
- -
- (1
10.5
9)
Div
iden
d o
n p
refe
ren
ce s
hare
s -
(10
3.8
0)
- -
- -
- -
(10
3.8
0)
Div
iden
d d
istr
ibu
tio
n t
ax o
n d
ivid
en
d o
n
pre
fere
nce s
hare
s -
(21.25
)-
- -
- -
- (2
1.25
)
Em
plo
yee s
tock c
om
pen
sati
on
exp
en
se
- -
- -
- 11
9.4
0
- -
119
.40
Tra
nsf
err
ed
to
secu
riti
es
pre
miu
m
acco
un
t o
n e
xerc
ise o
f st
ock o
pti
on
s 26
.82
- -
- -
(26
.82)
- -
-
Ad
just
men
t o
n a
cco
un
t o
f o
pti
on
s is
sued
to
su
bsi
dia
ries
em
plo
yees
- -
- -
- 7.7
2
- -
7.7
2
Bala
nce
as
at
31
Marc
h 2
017
1,
168
.69
15
,59
8.4
3
87.
95
1,
73
1.3
9
20
0.2
2
35
9.3
7
(54
.57
)15
.18
19
,10
6.6
5L
ess
: S
ecu
riti
es
pre
miu
m o
n s
hare
s h
eld
b
y t
rust
(5
68
.82)
(56
8.8
2)
Tota
l B
ala
nce
as
at
31
Marc
h 2
017
5
99
.87
15
,59
8.4
3
87.
95
1,
73
1.3
9
20
0.2
2
35
9.3
7
(54
.57
)15
.18
18
,53
7.8
4B
ala
nce
as
at
1 A
pri
l 2
017
1,
168
.69
15
,59
8.4
3
87.
95
1,
73
1.3
9
20
0.2
2
35
9.3
7
(54
.57
)15
.18
19
,10
6.6
5
Tota
l co
mp
reh
en
sive
in
co
me
fo
r th
e
ye
ar
en
de
d 3
1 M
arc
h 2
018
Pro
fit
for
the y
ear
- 7,0
63
.09
-
- -
- -
- 7,0
63
.09
Oth
er
co
mp
reh
en
sive in
co
me/(
loss
) (n
et
of
tax)
- -
- -
- -
82.6
2
(0.3
1)8
2.3
1
Secu
riti
es
pre
miu
m o
n iss
ue o
f sh
are
s to
N
ew
gen
ES
OP
Tru
st
55
6.5
0
- -
- -
- -
- 5
56
.50
Secu
riti
es
pre
miu
m o
n s
hare
s is
sued
th
rou
gh
in
itia
l p
ub
lic o
ffer
9,112
.24
-
- -
- -
- -
9,112
.24
Uti
lized
fo
r sh
are
iss
ue e
xp
en
ses
(1,3
49
.15
)-
- -
- -
- -
(1,3
49
.15
)
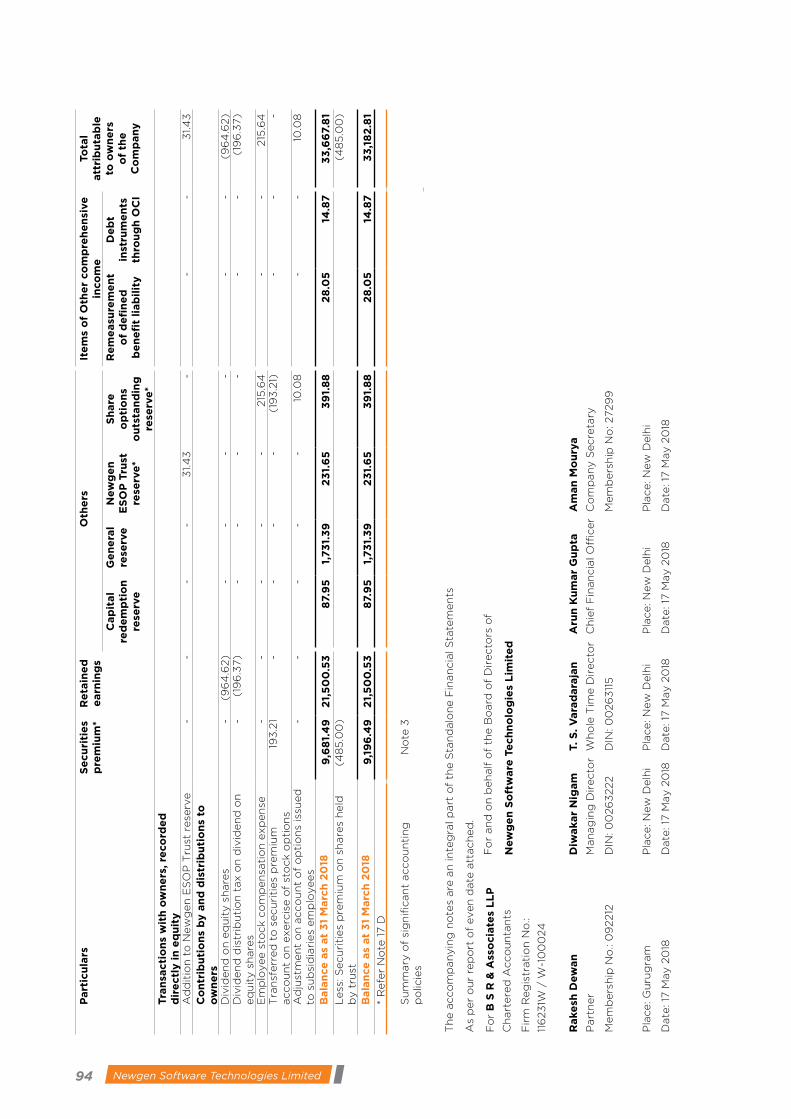
94 Newgen Software Technologies Limited 95
Part
icu
lars
Se
cu
riti
es
pre
miu
m*
Re
tain
ed
e
arn
ing
sO
the
rsIt
em
s o
f O
the
r co
mp
reh
en
sive
in
co
me
Tota
l att
rib
uta
ble
to
ow
ne
rs
of
the
C
om
pan
y
Cap
ital
red
em
pti
on
re
serv
e
Ge
ne
ral
rese
rve
New
ge
n
ES
OP
Tru
st
rese
rve*
Sh
are
o
pti
on
s o
uts
tan
din
g
rese
rve*
Re
me
asu
rem
en
t o
f d
efi
ne
d
be
ne
fit
liab
ilit
y
De
bt
inst
rum
en
ts
thro
ug
h O
CI
Tra
nsa
cti
on
s w
ith
ow
ne
rs, re
co
rde
d
dir
ectl
y i
n e
qu
ity
Ad
dit
ion
to
New
gen
ES
OP
Tru
st r
ese
rve
- -
- -
31.4
3
- -
- 3
1.4
3C
on
trib
uti
on
s b
y a
nd
dis
trib
uti
on
s to
o
wn
ers
Div
iden
d o
n e
qu
ity s
hare
s -
(96
4.6
2)
- -
- -
- -
(96
4.6
2)
Div
iden
d d
istr
ibu
tio
n t
ax o
n d
ivid
en
d o
n
eq
uit
y s
hare
s -
(19
6.3
7)
- -
- -
- -
(19
6.3
7)
Em
plo
yee s
tock c
om
pen
sati
on
exp
en
se
- -
- -
- 215
.64
-
- 215
.64
Tra
nsf
err
ed
to
secu
riti
es
pre
miu
m
acco
un
t o
n e
xerc
ise o
f st
ock o
pti
on
s 19
3.2
1 -
- -
- (1
93
.21)
- -
-
Ad
just
men
t o
n a
cco
un
t o
f o
pti
on
s is
sued
to
su
bsi
dia
ries
em
plo
yees
- -
- -
- 10
.08
-
- 10
.08
Bala
nce
as
at
31
Marc
h 2
018
9
,68
1.4
9
21,
50
0.5
3
87.
95
1,
73
1.3
9
23
1.6
5
39
1.8
8
28
.05
14
.87
3
3,6
67.
81
Less
: S
ecu
riti
es
pre
miu
m o
n s
hare
s h
eld
b
y t
rust
(4
85
.00
)(4
85
.00
)
Bala
nce
as
at
31
Marc
h 2
018
9
,19
6.4
9
21,
50
0.5
3
87.
95
1,
73
1.3
9
23
1.6
5
39
1.8
8
28
.05
14
.87
3
3,1
82
.81
* R
efe
r N
ote
17 D
Su
mm
ary
of
sig
nifi
can
t acco
un
tin
g
po
licie
s N
ote
3
Th
e a
cco
mp
an
yin
g n
ote
s are
an
in
teg
ral p
art
of
the S
tan
dalo
ne F
inan
cia
l S
tate
men
ts
As
per
ou
r re
po
rt o
f even
date
att
ach
ed
.
Fo
r B
S R
& A
sso
cia
tes
LL
PF
or
an
d o
n b
eh
alf
of
the B
oard
of
Dir
ecto
rs o
f
Ch
art
ere
d A
cco
un
tan
tsN
ew
ge
n S
oft
ware
Te
ch
no
log
ies
Lim
ite
d
Fir
m R
eg
istr
ati
on
No
.:
116
23
1W /
W-1
00
024
Rake
sh D
ew
an
Diw
akar
Nig
am
T. S
. V
ara
dara
jan
Aru
n K
um
ar
Gu
pta
Am
an
Mo
ury
a
Part
ner
Man
ag
ing
Dir
ecto
rW
ho
le T
ime D
irecto
rC
hie
f F
inan
cia
l O
fficer
Co
mp
an
y S
ecre
tary
Mem
bers
hip
No
.: 0
92212
DIN
: 0
026
3222
DIN
: 0
026
311
5
Mem
bers
hip
No
: 2729
9
Pla
ce: G
uru
gra
mP
lace: N
ew
Delh
iP
lace: N
ew
Delh
iP
lace: N
ew
Delh
iP
lace: N
ew
Delh
i
Date
: 17
May 2
018
Date
: 17
May 2
018
Date
: 17
May 2
018
Date
: 17
May 2
018
Date
: 17
May 2
018

94 Newgen Software Technologies Limited 95ANNUAL REPORT 2017-18
CORPORATE REVIEW FINANCIAL STATEMENTSSTATUTORY REPORTS
Statement of Cash Flowsfor the year ended March 31, 2018(All amounts are in lakhs of Indian Rupees, unless otherwise stated
For the year ended 31 March 2018
For the year ended 31 March 2017
A. Cash flows from operating activities
Net profit before tax 9,093.18 6,325.36
Adjustments for:
Depreciation and amortisation 567.68 481.88
Loss on sale of property, plant and equipment 3.15 0.12
Property, plant and equipment written off - 0.59
Interest income on security deposits at amortised cost (31.21) (24.16)
Impairment loss on trade receivables 462.52 1,353.40
Liability no longer required written back (229.75) -
Impairment loss on financial assets - 6.55
Fair value changes of financial assets at FVTPL (25.48) 5.57
Unrealised foreign exchange loss/(gain) (49.10) 95.01
Share based payment - equity settled 215.64 119.40
Reversal of derivative liability - (136.00)
Finance costs 520.68 525.60
Dividend income from mutual funds at FVTPL (87.86) (1.75)
Interest income from government and other bonds at FVOCI (131.56) (35.11)
Profit on sale of mutual funds (net) at FVTPL (60.73) (589.89)
Interest income from bank deposits and others (159.32) (24.18)
Operating cash flow before working capital changes 10,087.84 8,102.39
Increase in trade receivables (2,238.17) (4,487.85)
Increase in loans (276.38) (20.42)
Increase in other financial assets (2,686.55) (302.06)
Increase in other assets (45.31) (185.66)
Increase in provisions 314.36 282.31
Increase in other financial liabilities 1,140.88 1,153.82
Increase in other liabilities 792.65 115.97
Increase in trade payables 659.00 302.53
Cash generated from operations 7,748.32 4,961.03
Income taxes paid (net) (2,039.14) (1,621.43)
Net cash generated from operating activities (A) 5,709.18 3,339.60
B. Cash flows from investing activities
Purchase or construction of fixed assets (tangible and intangible fixed assets and capital work-in-progress) and capital advances
(1,869.57) (701.17)
Proceeds from sale of fixed assets 6.96 2.29
Investment in subsidiary company - (177.34)
Purchase of mutual funds and government bonds (1,683.12) (8,680.24)
Proceeds from sale of mutual funds 1,699.60 8,942.99
Interest income from government bonds 86.21 28.06
Interest received on Bank deposit 73.57 32.19
Investment in bank deposits (net) (70.94) 24.08
Net cash used in investing activities (B) (1,757.29) (529.14)

96 Newgen Software Technologies Limited 97
For the year ended 31 March 2018
For the year ended 31 March 2017
C. Cash flows from financing activities
Repayment of from short-term borrowings (net) (259.79) (657.01)
Repayment of finance lease obligation (301.33) (299.46)
Proceed from issue of shares through initial public offer 9,500.00 -
Expenses paid for Initial Public Offer (1,349.15) -
Proceeds from issue of equity shares under ESOP scheme 169.35 22.87
Securities premium on issue of shared under ESOP scheme 640.31 78.98
Dividend paid (including corporate dividend distribution tax) - Equity
(1,140.21) (628.63)
Dividend paid (including corporate dividend distribution tax) - Preference
- (125.05)
Finance cost (519.60) (469.82)
Gain on transfer of equity shares by Newgen ESOP trust 10.64 2.37
Net cash generated from financing activities (C) 6,750.22 (2,075.77)
Net increase in cash and cash equivalents (A + B + C) 10,702.11 734.69
Cash and cash equivalents at the beginning of the year 2,818.68 2,083.99
Cash and cash equivalents at the end of the year 13,520.79 2,818.68
Components of cash and cash equivalents:
Cash in hand 4.52 6.26
Cheques and drafts on hand
Balances with banks:
- in current accounts 5,116.27 2,012.42
- on deposit accounts with original maturity upto 3 months 8,400.00 800.00
13,520.79 2,818.68
Notes:1. The cash flow statement has been prepared under the indirect method as set out in the Ind AS 7 “Statement
of Cash Flows”.2. Effective 1 April 2017, the Company adopted the amendment to Ind AS7, which require the entities to
provide disclosures that enable users of financial statements to evaluate changes in liabilities arising from financing activities, including both changes arising from cash flows and non-cash changes, suggesting inclusion of a reconciliation between the opening and closing balances in the Balance Sheet for liabilities arising from financing activities, to meet the disclosure requirement. The adoption of amendment did not have any material impact on the financial statements.
The accompanying notes are an integral part of the Standalone Financial Statements
Cash Flow Statementfor the year ended March 31, 2018(All amounts are in lakhs of Indian Rupees, unless otherwise stated)
As per our report of even date attached
For B S R & Associates LLP For and on behalf of the Board of Directors of
Chartered Accountants Newgen Software Technologies LimitedFirm Registration No.:
116231W / W-100024
Rakesh Dewan Diwakar Nigam T. S. Varadarajan Arun Kumar Gupta Aman MouryaPartner Managing Director Whole Time Director Chief Financial Officer Company SecretaryMembership No.: 092212 DIN: 00263222 DIN: 00263115 Membership No: 27299
Place: Gurugram Place: New Delhi Place: New Delhi Place: New Delhi Place: New DelhiDate: 17 May 2018 Date: 17 May 2018 Date: 17 May 2018 Date: 17 May 2018 Date: 17 May 2018

96 Newgen Software Technologies Limited 97ANNUAL REPORT 2017-18
CORPORATE REVIEW FINANCIAL STATEMENTSSTATUTORY REPORTS
Notesto standalone financial statements for the year ended March 31, 2018(All amounts are in lakhs of Indian Rupees, unless otherwise stated)
NOTE 1 Background
Newgen Software Technologies Limited (‘Newgen’ or ‘the Company’) is a public company domiciled and incorporated under the provisions of the Companies Act applicable in India. The registered office of the Company is situated at A-6, Satsang Vihar Marg, Qutab Institutional Area, New Delhi - 110067. The Company raised money by way of initial public offer during the year ended 31 March 2018 and its shares are listed on the National Stock Exchange (NSE) and Bombay Stock Exchange (BSE) of India.
The Company is a global software Company and is engaged in the business of software product development including designing and delivering end-to-end software solutions covering the entire spectrum of software services from workflow automation to Document management to imaging. Newgen provides a complete range of software that helps automate business processes. Newgen’s solutions enable document intensive organizations/ industries such as Finance and Banking, Insurance and government departments to improve productivity through better document management and workflow implementation.
NOTE 2 Basis of Preparation
A. Statement of compliance
The financial statements of the Company have been prepared in accordance with Indian Accounting Standards (“Ind AS”) notified under the Companies (Indian Accounting Standards) Rules, 2015 and Companies (Indian Accounting Standards) Amendment Rules, 2016. These financial statements for the year ended 31 March 2018 are the first financial statements that the Company has prepared in accordance with Ind AS.
Accordingly, the Company has followed the provisions of Ind AS 101, ‘First Time Adoption of Indian Accounting Standards’, in preparing its opening Ind AS Balance Sheet as of the date of transition, i.e. 1 April 2016. Certain of the Company’s Ind AS accounting policies used in the opening balance sheet differed from its Indian GAAP policies applied as at 31 March 2016, and accordingly adjustments were made to restate the opening balances as per Ind AS. The resulting adjustments arose from events and transactions before the date of transition to Ind AS. Therefore, as required by Ind AS 101, those
adjustments were recognized directly through retained earnings as at 1 April 2016.
Refer note 50 for the effect of transition to Ind AS on the reported financial position, financial performance and cash flows of the Company.
The financial statements were authorised for issue by the Company’s Board of Directors on 17 May 2018.
Details of the Company’s accounting policies are included in Note 3.
B. Functional and presentation currency
These financial statements are presented in Indian Rupees (INR), which is also the Company’s functional currency. All amounts have been rounded-off to the nearest lakhs, unless otherwise
indicated.
C. Basis of measurement
The financial statements have been prepared on
the historical cost basis except for the following
items:
Items Measurement basisCertain financial assets and liabilities
Fair value
Net defined benefit (asset)/ liability
Fair value of plan assets less present value of defined benefit obligations
E. Use of estimates and judgements
The preparation of financial statements in
conformity with Ind AS requires management
to make judgments, estimates and assumptions
that affect the application of accounting policies
and the reported amounts of assets, liabilities,
income and expenses and the accompanying
disclosures. Uncertainty about the assumptions
and estimates could result in outcomes that may
require material adjustment to the carrying value
of assets or liabilities affected in future periods.
Estimates and underlying assumptions are
reviewed on an ongoing basis. Revisions to
accounting estimates are recognized in the
period in which the estimates are revised and in
any future periods affected.

98 Newgen Software Technologies Limited 99
Judgements Information about judgements made in applying
accounting policies that have the most significant
effects on the amounts recognised in the financial
statements is included in the following notes:
• Note 35 – lease classification: classification
of leases under finance lease or operating
lease;
Assumptions and estimation uncertainties
Information about assumptions and estimation
uncertainties that have a significant risk of
resulting in a material adjustment in the year
ending 31 March 2018 is included in the following
notes:
• Note 3(c)(iii) –Estimation of Useful lives of
intangible and depreciable assets
• Note 28 – Measurement of defined benefit
obligations: key actuarial assumptions;
• Note 32 – Recognition of deferred tax
assets: availability of future taxable profit
against which tax losses carried forward can
be used;
• Note 34 –Fair value of share based payments
• Note 41 – Impairment of trade receivables
and financial assets.
E. Current and non-current classification
The Company presents assets and liabilities in
the balance sheet based on current / non-current
classification.
An asset is classified as current when it satisfies
any of the following criteria:
- it is expected to be realized in, or is intended
for sale or consumption in, the Company’s
normal operating cycle.
- it is held primarily for the purpose of being
traded;
- it is expected to be realized within 12 months
after the reporting date; or
- it is cash or cash equivalent unless it is
restricted from being exchanged or used to
settle a liability for at least 12 months after
the reporting date.
A liability is classified as current when it satisfies
any of the following criteria:
- it is expected to be settled in the Company’s normal operating cycle;
- it is held primarily for the purpose of being traded;
- it is due to be settled within 12 months after the reporting date; or
- the Company does not have an unconditional right to defer settlement of the liability for at least 12 months after the reporting date. Terms of a liability that could, at the option of the counterparty, result in its settlement by the issue of equity instruments do not affect its classification.
Current assets/liabilities include current portion of non-current financial assets/liabilities respectively. All other assets/ liabilities are classified as non-current. Deferred tax assets and liabilities (if any) are classified as non-current assets and liabilities.
Operating cycle
Based on the nature of the operations and the time between the acquisition of assets for processing and their realization in cash or cash equivalents, the Company has ascertained its operating cycle as twelve months for the purpose of current/non-current classification of assets and liabilities.
F. Measurement of fair values
A number of the Company’s accounting policies and disclosures require the measurement of fair values, for both financial and non-financial assets and liabilities. The Company has an established control framework with respect to the measurement of fair values. The finance team has overall responsibility for overseeing all significant fair value measurements, including Level 3 fair values, and reports directly to the chief financial officer. The Company regularly reviews significant unobservable inputs and valuation adjustments. If third party information, such as broker quotes or pricing services, is used to measure fair values, then the Company assesses the evidence obtained from the third parties to support the conclusion that these valuations meet the requirements of Ind AS, including the level in the fair value hierarchy in which the valuations should be classified.
Significant valuation issues are reported to the
Company’s audit committee.

98 Newgen Software Technologies Limited 99ANNUAL REPORT 2017-18
CORPORATE REVIEW FINANCIAL STATEMENTSSTATUTORY REPORTS
Fair values are categorised into different levels in a fair value hierarchy based on the inputs used in the valuation techniques as follows.
• Level 1: quoted prices (unadjusted) in active markets for identical assets or liabilities.
• Level 2: inputs other than quoted prices included in Level 1 that are observable for the asset or liability, either directly (i.e. as prices) or indirectly (i.e. derived from prices).
• Level 3: inputs for the asset or liability that are not based on observable market data (Unobservable inputs).
When measuring the fair value of an asset or a liability, the Company uses observable market data as far as possible. If the inputs used to measure the fair value of an asset or a liability fall into different levels of the fair value hierarchy, then the fair value measurement is categorised in its entirety in the same level of the fair value hierarchy as the lowest level input that is significant to the entire measurement.
The Company recognises transfers between levels of the fair value hierarchy at the end of the reporting period during which the change has occurred.
Further information about the assumptions made in measuring fair values is included in the following notes:
Note 34 – Share-based payment arrangements; and
Note 41 – Financial instruments.
NOTE 3 Significant Accounting Policies
a. Foreign currency
i. Functional currency
The Company’s financial statements are presented in INR, which is also the company’s functional currency.
ii. Foreign currency transactions
Transactions in foreign currencies are translated into INR, the functional currency of the Company, at the exchange rates at the dates of the transactions or an average rate if the average rate approximates the
actual rate at the date of the transaction.
Monetary assets and liabilities denominated
in foreign currencies are translated into the
functional currency at the exchange rate at
the reporting date. Non-monetary assets
and liabilities that are measured at fair value
in a foreign currency are translated into
the functional currency at the exchange
rate when the fair value was determined.
Non-monetary assets and liabilities that
are measured based on historical cost in
a foreign currency are translated at the
exchange rate at the date of the transaction.
b. Financial instruments
i. Recognition and initial measurement
Trade receivables and debt securities
issued are initially recognised when they
are originated. All other financial assets and
financial liabilities are initially recognised
when the Company becomes a party to the
contractual provisions of the instrument.
A financial asset or financial liability is
initially measured at fair value plus, for an
item not at fair value through profit and loss
(FVTPL), transaction costs that are directly
attributable to its acquisition or issue.
ii. Classification and subsequent measurement
Financial assets:
On initial recognition, a financial asset is
classified as measured at
- Amortised cost;
- Fair value through Other Comprehensive
Income (FVOCI) – debt investment;
- Fair Value through Other Comprehensive
Income (FVOCI) – equity investment; or
- FVTPL
Financial assets are not reclassified
subsequent to their initial recognition,
except if and in the period the Company
changes its business model for managing
financial assets.
A financial asset is measured at amortised
cost if it meets both of the following
conditions and is not designated as FVTPL:

100 Newgen Software Technologies Limited 101
• the asset is held within a business
model whose objective is to hold assets
to collect contractual cash flows; and
• the contractual terms of the financial
asset give rise on specified dates to
cash flows that are solely payments of
principal and interest on the principal
amount outstanding.
A debt investment is measured at FVOCI if it
meets both of the following conditions and
is not designated as FVTPL:
• the asset is held within a business model
whose objective is achieved by both
collecting contractual cash flows and
selling financial assets; and
• the contractual terms of the financial
asset give rise on specified dates to
cash flows that are solely payments of
principal and interest on the principal
amount outstanding.
All financial assets not classified as measured
at amortised cost or FVOCI as described
above are measured at FVTPL. On initial
recognition, the Company may irrevocably
designate a financial asset that otherwise
meets the requirements to be measured at
amortised cost or at FVOCI as at FVTPL if
doing so eliminates or significantly reduces
an accounting mismatch that would
otherwise arise.
Financial assets: Business model assessment
The Company makes an assessment of the
objective of the business model in which
a financial asset is held at a portfolio level
because this best reflects the way the
business is managed and information is
provided to management, for instance
the stated policies and objectives for the portfolio, frequency, volume and timing of sales of financial assets in prior periods, the reasons for such sales and expectations about future sales activity.
Transfers of financial assets to third parties in transactions that do not qualify for derecognition are not considered sales for
this purpose, consistent with the Company’s continuing recognition of the assets.
Financial assets that are held for trading or are managed and whose performance is evaluated on a fair value basis are measured at FVTPL.
Financial assets: Assessment whether contractual cash flows are solely payments of principal and Interest.
For the purposes of this assessment, ‘principal’ is defined as the fair value of the financial asset on initial recognition. ‘Interest’ is defined as consideration for the time value of money and for the credit risk associated with the principal amount outstanding during a particular period of time and for other basic lending risks and costs (e.g. liquidity risk and administrative costs), as well as a profit margin.
In assessing whether the contractual cash flows are solely payments of principal and interest, the Company considers the contractual terms of the instrument. This includes assessing whether the financial asset contains a contractual term that could change the timing or amount of contractual cash flows such that it would not meet this condition. In making this assessment, the Company considers:
• contingent events that would change the amount or timing of cash flows;
• terms that may adjust the contractual coupon rate, including variable interest rate features;
• prepayment and extension features; and
Basis the above classification criteria, Company’s investments are classified as
below:-
- Investments in government and other
bonds have been classified as FVOCI.
- Investments in Mutual funds have been
classified as FVTPL.
Financial assets: Subsequent measurement
and gains and losses
100 Newgen Software Technologies Limited 101ANNUAL REPORT 2017-18
CORPORATE REVIEW FINANCIAL STATEMENTSSTATUTORY REPORTS
Financial assets at FVTPL
These assets are subsequently measured at fair value. Net gains and losses, including any interest or dividend income, are recognised in profit or loss.
Financial assets at amortised cost
These assets are subsequently measured at amortised cost using the effective interest method. The amortised cost is reduced by impairment losses. Interest income, foreign exchange gains and losses and impairment are recognised in profit or loss. Any gain or loss on derecognition is recognised in profit or loss.
Debt investments at FVOCI
These assets are subsequently measured at fair value. Interest income under the effective interest method, foreign exchange gains and losses and impairment are recognised in profit or loss. Other net gains and losses are recognised in OCI. On derecognition, gains and losses accumulated in OCI are reclassified to profit or loss.
Equity investments at FVOCI
These assets are subsequently measured at fair value. Dividends are recognized as income in profit or loss unless the dividend clearly represents a recovery of part of the cost of the investment. Other net gains and losses are recognised in OCI and are not reclassified to profit or loss.
Financial liabilities: Classification, subsequent measurement and gains and losses
Financial liabilities are classified as measured at amortised cost or FVTPL. A financial liability is classified as at FVTPL if it is classified as held-for-trading, or it is a derivative or it is designated as such on initial recognition. Financial liabilities at FVTPL are measured at fair value and net gains and losses, including any interest expense, are recognised in profit or loss. Other financial liabilities are subsequently measured at amortised cost using the effective interest method. Interest expense and foreign exchange gains and losses are recognised in profit or loss. Any gain or loss on derecognition is also recognised in profit
or loss.
iii. Derecognition
Financial assets
The Company derecognises a financial asset when the contractual rights to the cash flows from the financial asset expire, or it transfers the rights to receive the contractual cash flows in a transaction in which substantially all of the risks and rewards of ownership of the financial asset are transferred or in which the Company neither transfers nor retains substantially all of the risks and rewards of ownership and does not retain control of the financial asset.
If the Company enters into transactions whereby it transfers assets recognised on its balance sheet, but retains either all or substantially all of the risks and rewards of the transferred assets, the transferred assets are not derecognised.
Financial liabilities
The Company derecognises a financial liability when its contractual obligations are discharged or cancelled, or expire.
The Company also derecognises a financial liability when its terms are modified and the cash flows under the modified terms are substantially different. In this case, a new financial liability based on the modified terms is recognised at fair value. The difference between the carrying amount of the financial liability extinguished and the new financial liability with modified terms is recognised in profit or loss.
iv. Offsetting
Financial assets and financial liabilities are offset and the net amount presented in the balance sheet when, and only when, the Company currently has a legally enforceable right to set off the amounts and it intends either to settle them on a net basis or to realise the asset and settle the liability simultaneously.
v. Derivatives and Embedded derivatives
Derivatives are initially measured at fair value. Subsequent to initial recognition, derivatives are measured at fair value, and changes therein are generally recognised in profit or loss.
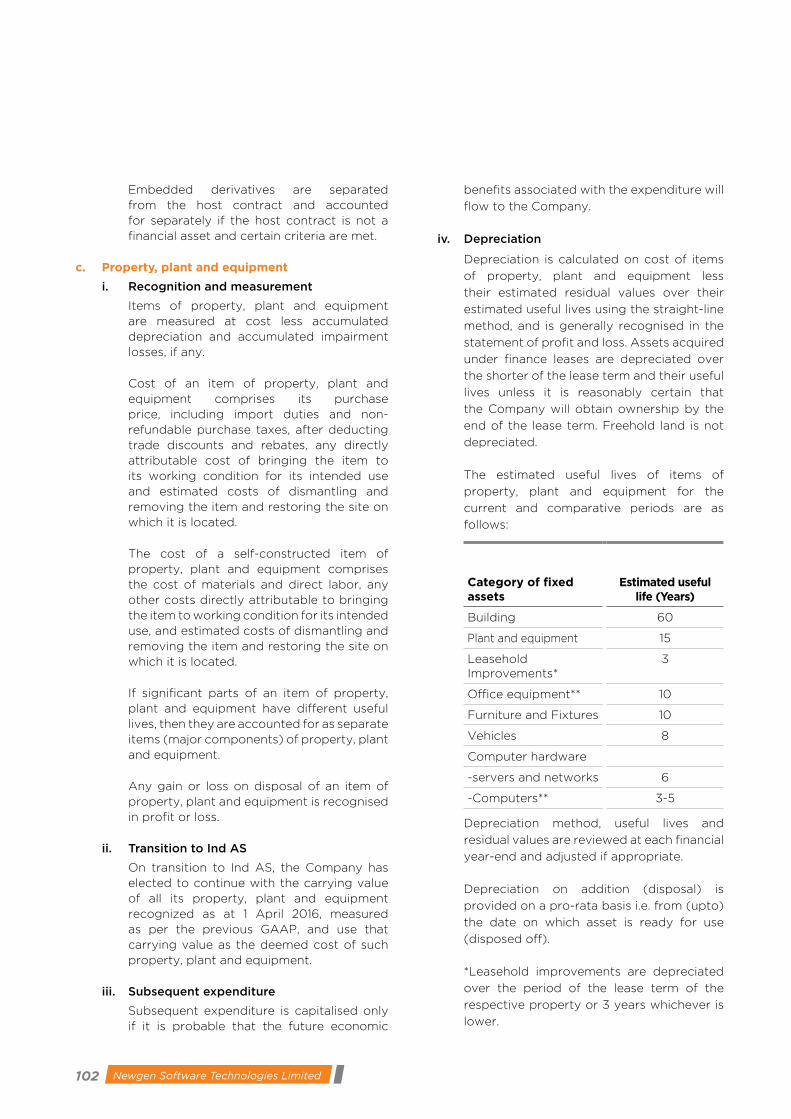
102 Newgen Software Technologies Limited 103
Embedded derivatives are separated from the host contract and accounted for separately if the host contract is not a financial asset and certain criteria are met.
c. Property, plant and equipment
i. Recognition and measurement
Items of property, plant and equipment are measured at cost less accumulated depreciation and accumulated impairment losses, if any.
Cost of an item of property, plant and equipment comprises its purchase price, including import duties and non-refundable purchase taxes, after deducting trade discounts and rebates, any directly attributable cost of bringing the item to its working condition for its intended use and estimated costs of dismantling and removing the item and restoring the site on which it is located.
The cost of a self-constructed item of property, plant and equipment comprises the cost of materials and direct labor, any other costs directly attributable to bringing the item to working condition for its intended use, and estimated costs of dismantling and removing the item and restoring the site on which it is located.
If significant parts of an item of property, plant and equipment have different useful lives, then they are accounted for as separate items (major components) of property, plant and equipment.
Any gain or loss on disposal of an item of property, plant and equipment is recognised in profit or loss.
ii. Transition to Ind AS
On transition to Ind AS, the Company has elected to continue with the carrying value of all its property, plant and equipment recognized as at 1 April 2016, measured as per the previous GAAP, and use that carrying value as the deemed cost of such property, plant and equipment.
iii. Subsequent expenditure
Subsequent expenditure is capitalised only if it is probable that the future economic
benefits associated with the expenditure will
flow to the Company.
iv. Depreciation
Depreciation is calculated on cost of items
of property, plant and equipment less
their estimated residual values over their
estimated useful lives using the straight-line
method, and is generally recognised in the
statement of profit and loss. Assets acquired
under finance leases are depreciated over
the shorter of the lease term and their useful
lives unless it is reasonably certain that
the Company will obtain ownership by the
end of the lease term. Freehold land is not
depreciated.
The estimated useful lives of items of
property, plant and equipment for the
current and comparative periods are as
follows:
Category of fixed assets
Estimated useful life (Years)
Building 60
Plant and equipment 15
Leasehold Improvements*
3
Office equipment** 10
Furniture and Fixtures 10
Vehicles 8
Computer hardware
-servers and networks 6
-Computers** 3-5
Depreciation method, useful lives and
residual values are reviewed at each financial
year-end and adjusted if appropriate.
Depreciation on addition (disposal) is
provided on a pro-rata basis i.e. from (upto)
the date on which asset is ready for use
(disposed off).
*Leasehold improvements are depreciated
over the period of the lease term of the
respective property or 3 years whichever is
lower.
102 Newgen Software Technologies Limited 103ANNUAL REPORT 2017-18
CORPORATE REVIEW FINANCIAL STATEMENTSSTATUTORY REPORTS
Leasehold land is amortised over the lease
period of 90 years.
**Based on an internal technical assessment,
the management believes that the useful
lives as given above best represents the
period over which management expects to
use its assets. Hence, the useful life of plant
and equipment is different from the useful
life as prescribed under Part C of Schedule II
of Companies Act, 2013.
d. Intangible assets
Recognition and measurement
Intangible assets that are acquired by the
Company are measured initially at cost. After
initial recognition, an intangible asset is carried
at its cost less accumulated amortisation and
accumulated impairment loss, if any.
Subsequent expenditure
Subsequent expenditure is capitalised only when
it increases the future economic benefits from
the specific asset to which it relates.
Transition to Ind AS
On transition to Ind AS, the Company has
elected to continue with the carrying value of all
its intangible assets recognized as at 1 April 2016,
measured as per the previous GAAP, and use
that carrying value as the deemed cost of such
intangible assets.
Amortisation
Intangible assets of the Company represents
computer software and are amortized using the
straight-line method over the estimated useful
life (at present 3-4 years) or the tenure of the
respective software license, whichever is lower.
The amortization period and the amortization
method are reviewed at least at each financial
year end. If the expected useful life of the asset
is significantly different from previous estimates,
the amortization period is changed accordingly.
Gains or losses arising from derecognition
of an intangible asset are measured as the
difference between the net disposal proceeds
and the carrying amount of the asset and are
recognized in the profit or loss when the asset is
derecognized.
e. Impairment
i. Impairment of financial instruments
The Company recognises loss allowances for expected credit losses on:
- financial assets measured at amortised cost; and
- financial assets measured at FVOCI- debt investments.
At each reporting date, the Company assesses whether financial assets carried at amortised cost and debt securities at FVOCI are credit-impaired. A financial asset is ‘credit- impaired’ when one or more events that have a detrimental impact on the estimated future cash flows of the financial asset have occurred.
The Company measures loss allowances at an amount equal to lifetime expected credit losses.
Loss allowances for trade receivables are always measured at an amount equal to lifetime expected credit losses. Lifetime expected credit losses are the expected credit losses that result from all possible default events over the expected life of a financial instrument.
12-month expected credit losses are the portion of expected credit losses that result from default events that are possible within 12 months after the reporting date (or a shorter period if the expected life of the instrument is less than 12 months).
In all cases, the maximum period considered when estimating expected credit losses is the maximum contractual period over which the Company is exposed to credit risk.
The Company assumes that the credit risk on a financial asset has increased significantly if it is more than 30 days past due.
The Company considers a financial asset to be in default when:
- the borrower is unlikely to pay its credit obligations to the Company in full, without recourse by the Company to actions such as realising security (if any is held); or

104 Newgen Software Technologies Limited 105
- the financial asset is 90 days or more
past due.
The Company considers a debt security
to have low credit risk when its credit risk
rating is equivalent to ‘investment grade’
e.g. BBB or higher as per renowned rating
agencies.
Measurement of expected credit losses
Expected credit losses are a probability-
weighted estimate of credit losses. Credit
losses are measured as the present value of
all cash shortfalls (i.e. the difference between
the cash flows due to the Company in
accordance with the contract and the cash
flows that the Company expects to receive).
As a practical expedient, the Company uses
a provision matrix to determine impairment
loss allowance on portfolio of its trade
receivables. The provision matrix is based on
its historically observed default rates over
the expected life of the trade receivables and
is adjusted for forward‐looking estimates. At
every reporting date, the historical observed
default rates are updated and changes in the
forward‐looking estimates are analysed.
Presentation of allowance for expected
credit losses in the balance sheet
Loss allowances for financial assets
measured at amortised cost are deducted
from the gross carrying amount of the
assets.
For debt securities at FVOCI, the loss
allowance is charged to profit or loss.
Write-off
The gross carrying amount of a financial
asset is written off (either partially or in
full) to the extent that there is no realistic
prospect of recovery. This is generally the
case when the Company determines that
the debtor does not have assets or sources
of income that could generate sufficient
cash flows to repay the amounts subject
to the write off. However, financial assets
that are written off could still be subject to
enforcement activities in order to comply
with the Company’s procedures for recovery
of amounts due.
ii. Impairment of Non-financial assets
The carrying amounts of assets are
reviewed at each reporting date if there
is any indication of impairment based on
internal/external factors. An impairment loss
is recognized wherever the carrying amount
of an asset (or cash generating unit) exceeds
its recoverable amount. The recoverable
amount is the greater of the asset’s (or cash
generating unit’s) net selling price and value
in use. In assessing value in use, the estimated
future cash flows are discounted to their
present value using a pre-tax discount rate
that reflects current market assessments of
the time value of money and risks specific to
the asset (or cash generating unit).
An impairment loss is reversed if there
has been a change in the estimates used
to determine the recoverable amount. An
impairment loss is reversed only to the
extent that the asset’s carrying amount does
not exceed the carrying amount that would
have been determined net of depreciation
or amortisation, if no impairment loss had
been recognised
f. Employee benefits
i. Short-term employee benefits
Short-term employee benefit obligations are
measured on an undiscounted basis and are
expensed as the related service is provided.
A liability is recognised for the amount
expected to be paid, if the Company has a
present legal or constructive obligation to
pay this amount as a result of past service
provided by the employee, and the amount
of obligation can be estimated reliably.
ii. Share-based payment transactions
The grant date fair value of equity
settled share-based payment awards
granted to employees of the Company
and subsidiaries of the Company is
recognised as an employee expense and
deemed investment, with a corresponding
increase in equity, over the period that the
employees unconditionally become entitled
to the awards. The amount recognised as
104 Newgen Software Technologies Limited 105ANNUAL REPORT 2017-18
CORPORATE REVIEW FINANCIAL STATEMENTSSTATUTORY REPORTS
expense/deemed investment is based on
the estimate of the number of awards for
which the related service and non-market
vesting conditions are expected to be met,
such that the amount ultimately recognised
as an expense/dement investment is based
on the number of awards that do meet the
related service and non-market vesting
conditions at the vesting date. For share-
based payment awards with non-vesting
conditions, the grant date fair value of the
share-based payment is measured to reflect
such conditions and there is no true-up for
differences between expected and actual
outcomes.
iii. Defined contribution plans
A defined contribution plan is a post-
employment benefit plan under which
an entity pays fixed contributions into
a separate entity and will have no legal
or constructive obligation to pay further
amounts. The Company makes specified
monthly contributions towards Government
administered provident fund scheme.
Obligations for contributions to defined
contribution plans are recognized as an
employee benefit expense in profit or loss in
the periods during which the related services
are rendered by employees.
Prepaid contributions are recognised as an
asset to the extent that a cash refund or a
reduction in future payments is available.
iv. Defined benefit plans
A defined benefit plan is a post-employment
benefit plan other than a defined contribution
plan. The Company’s gratuity scheme is a
defined benefit plan. The present value of
obligations under such defined benefit plans
are determined based on actuarial valuation
carried out by an independent actuary
using the Projected Unit Credit Method,
which recognizes each period of service as
giving rise to an additional unit of employee
benefit entitlement and measures each unit
separately to build up the final obligation.
The obligation is measured at the present
value of estimated future cash flows. The
discount rates used for determining the
present value of obligation under defined
benefit plans, are based on the market
yields on government securities as at the
balance sheet date, having maturity period
approximating to the terms of related
obligations
Remeasurement gains and losses arising
from experience adjustments and changes
in actuarial assumptions are recognized
in the period in which they occur, directly
in other comprehensive income and are
never reclassified to profit or loss. Changes
in the present value of the defined benefit
obligation resulting from plan amendments
or curtailments are recognized immediately
in the profit or loss as past service cost.
v. Other long-term employee benefits
The Company’s net obligation in respect
of long-term employee benefits other than
post-employment benefits is the amount of
future benefit that employees have earned
in return for their service in the current and
prior periods; that benefit is discounted to
determine its present value, and the fair
value of any related assets is deducted.
The employees can carry-forward a portion
of the unutilized accrued compensated
absences and utilize it in future service
periods or receive cash compensation
on termination of employment. Since the
compensated absences do not fall due
wholly within twelve months after the end
of the period in which the employees render
the related service and are also not expected
to be utilized wholly within twelve months
after the end of such period, the benefit is
classified as a long-term employee benefit.
The Company records an obligation for
such compensated absences in the period
in which the employee renders the services
that increase this entitlement. The obligation
is measured on the basis of independent
actuarial valuation using the projected unit
credit method. Re measurements as a result
of experience adjustments and changes in
actuarial assumptions are recognized in the
profit or loss
g. Provisions (other than for employee benefits)
A provision is recognised if, as a result of a
past event, the Company has a present legal or
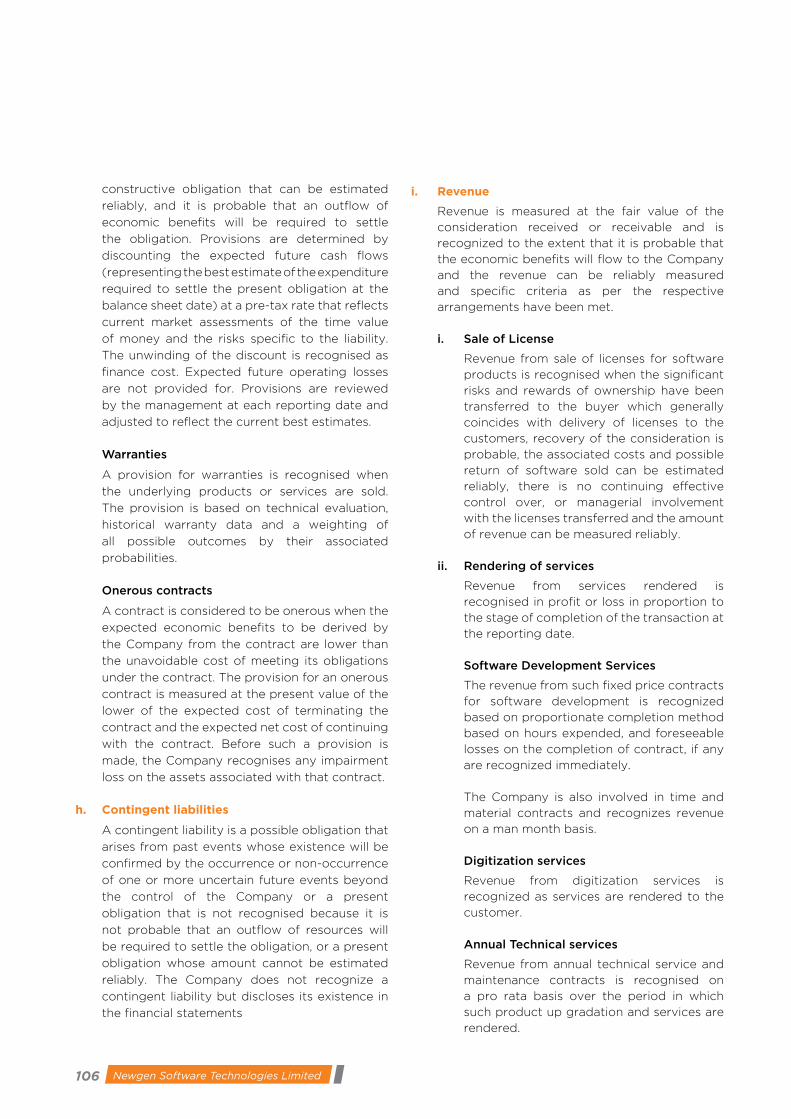
106 Newgen Software Technologies Limited 107
constructive obligation that can be estimated
reliably, and it is probable that an outflow of
economic benefits will be required to settle
the obligation. Provisions are determined by
discounting the expected future cash flows
(representing the best estimate of the expenditure
required to settle the present obligation at the
balance sheet date) at a pre-tax rate that reflects
current market assessments of the time value
of money and the risks specific to the liability.
The unwinding of the discount is recognised as
finance cost. Expected future operating losses
are not provided for. Provisions are reviewed
by the management at each reporting date and
adjusted to reflect the current best estimates.
Warranties
A provision for warranties is recognised when
the underlying products or services are sold.
The provision is based on technical evaluation,
historical warranty data and a weighting of
all possible outcomes by their associated
probabilities.
Onerous contracts
A contract is considered to be onerous when the
expected economic benefits to be derived by
the Company from the contract are lower than
the unavoidable cost of meeting its obligations
under the contract. The provision for an onerous
contract is measured at the present value of the
lower of the expected cost of terminating the
contract and the expected net cost of continuing
with the contract. Before such a provision is
made, the Company recognises any impairment
loss on the assets associated with that contract.
h. Contingent liabilities
A contingent liability is a possible obligation that
arises from past events whose existence will be
confirmed by the occurrence or non-occurrence
of one or more uncertain future events beyond
the control of the Company or a present
obligation that is not recognised because it is
not probable that an outflow of resources will
be required to settle the obligation, or a present
obligation whose amount cannot be estimated
reliably. The Company does not recognize a
contingent liability but discloses its existence in
the financial statements
i. Revenue
Revenue is measured at the fair value of the
consideration received or receivable and is
recognized to the extent that it is probable that
the economic benefits will flow to the Company
and the revenue can be reliably measured
and specific criteria as per the respective
arrangements have been met.
i. Sale of License
Revenue from sale of licenses for software
products is recognised when the significant
risks and rewards of ownership have been
transferred to the buyer which generally
coincides with delivery of licenses to the
customers, recovery of the consideration is
probable, the associated costs and possible
return of software sold can be estimated
reliably, there is no continuing effective
control over, or managerial involvement
with the licenses transferred and the amount
of revenue can be measured reliably.
ii. Rendering of services
Revenue from services rendered is
recognised in profit or loss in proportion to
the stage of completion of the transaction at
the reporting date.
Software Development Services
The revenue from such fixed price contracts
for software development is recognized
based on proportionate completion method
based on hours expended, and foreseeable
losses on the completion of contract, if any
are recognized immediately.
The Company is also involved in time and
material contracts and recognizes revenue
on a man month basis.
Digitization services
Revenue from digitization services is
recognized as services are rendered to the
customer.
Annual Technical services
Revenue from annual technical service and
maintenance contracts is recognised on
a pro rata basis over the period in which
such product up gradation and services are
rendered.

106 Newgen Software Technologies Limited 107ANNUAL REPORT 2017-18
CORPORATE REVIEW FINANCIAL STATEMENTSSTATUTORY REPORTS
iii. Sale of right to use software
Software-as-a-service, that is, a right to use software functionality in a cloud-based-infrastructure provided by the Company. Revenue is recognized monthly/periodically based on the number of users right given to customers.
Revenue is recognised, net of returns, trade discounts and volume rebates. This inter alia involves discounting of the consideration due to the present value if payment extends beyond normal credit terms. Reimbursements of out-of-pocket expenses received from customers have been netted off with expense.
Amounts received or billed in advance of services to be performed are recorded as advance from customers/unearned revenue. Unbilled revenue represents amounts recognized based on services performed in advance of billing in accordance with contract terms.
iv. Multiple deliverable arrangements
When two or more revenue generating activities or deliverables are provided under a single arrangement, each deliverable that is considered to be a separate unit of account is accounted for separately. The allocation of consideration from a revenue arrangement to its separate units of account is based on the relative fair value of each unit. If the fair value of the delivered item is not reliably measurable, then revenue is allocated based on the difference between the total arrangement consideration and the fair value of the undelivered item.
j. Recognition of dividend income, interest income or expense
Dividend income is recognised in profit or loss on the date on which the Company’s right to receive payment is established.
Interest income or expense is recognised using the effective interest method.
The ‘effective interest rate’ is the rate that exactly discounts estimated future cash payments or receipts through the expected life of the financial instrument to:
- the gross carrying amount of the financial
asset; or
- the amortised cost of the financial liability.
In calculating interest income and expense, the
effective interest rate is applied to the gross
carrying amount of the asset (when the asset
is not credit-impaired) or to the amortised cost
of the liability. However, for financial assets that
have become credit-impaired subsequent to
initial recognition, interest income is calculated
by applying the effective interest rate to the
amortised cost of the financial asset. If the asset
is no longer credit-impaired, then the calculation
of interest income reverts to the gross basis.
k. Sale of investments
Profit on sale of investments is recorded on
transfer of title from the Company and is
determined as the difference between the sales
price and the carrying value of the investment.
l. Leases
i. Determining whether an arrangement contains a lease
At inception of an arrangement, it is
determined whether the arrangement
is or contains a lease. At inception or
on reassessment of the arrangement
that contains a lease, the payments and
other consideration required by such an
arrangement are separated into those for
the lease and those for other elements on
the basis of their relative fair values. If it
is concluded for a finance lease that it is
impracticable to separate the payments
reliably, then an asset and a liability are
recognised at an amount equal to the fair
value of the underlying asset. The liability
is reduced as payments are made and
an imputed finance cost on the liability is
recognised using the incremental borrowing
rate.
ii. Assets held under leases
Leases of property, plant and equipment
that transfer to the Company substantially
all the risks and rewards of ownership are
classified as finance leases. The leased
assets are measured initially at an amount
equal to the lower of their fair value and

108 Newgen Software Technologies Limited 109
the present value of the minimum lease
payments. Subsequent to initial recognition,
the assets are accounted for in accordance
with the accounting policy applicable to
similar owned assets.
Assets held under leases that do not transfer
to the Company substantially all the risks
and rewards of ownership (i.e. operating
leases) are not recognised in the Company’s
Balance Sheet.
iii. Lease payments
Payments made under operating leases are
generally recognised in profit or loss on
a straight-line basis over the term of the
lease unless such payments are structured
to increase in line with expected general
inflation to compensate for the lessor’s
expected inflationary cost increases.
Lease incentives received are recognised as
an integral part of the total lease expense
over the term of the lease.
Minimum lease payments made under
finance leases are apportioned between
the finance charge and the reduction of the
outstanding liability. The finance charge is
allocated to each period during the lease
term so as to produce a constant periodic
rate of interest on the remaining balance of
the liability.
m. Income tax
Income tax comprises current and deferred tax. It
is recognised in profit or loss except to the extent
that it relates to an item recognised directly in
equity or in other comprehensive income.
i. Current tax
Current tax comprises the expected tax
payable or receivable on the taxable income
or loss for the year and any adjustment to
the tax payable or receivable in respect of
previous years. The amount of current tax
reflects the best estimate of the tax amount
expected to be paid or received after
considering the uncertainty, if any, related to
income taxes. It is measured using tax rates
(and tax laws) enacted or substantively
enacted by the reporting date.
Current tax assets and current tax liabilities
are offset only if there is a legally enforceable
right to set off the recognised amounts, and
it is intended to realise the asset and settle
the liability on a net basis or simultaneously.
ii. Deferred tax
Deferred tax is recognised in respect of
temporary differences between the carrying
amounts of assets and liabilities for financial
reporting purposes and the corresponding
amounts used for taxation purposes.
Deferred tax is also recognised in respect of
carried forward tax losses and tax credits.
Deferred tax is not recognised for:
- temporary differences arising on the
initial recognition of assets or liabilities
in a transaction that is not a business
combination and that affects neither
accounting nor taxable profit or loss at
the time of the transaction;
Deferred tax assets are recognised to the
extent that it is probable that future taxable
profits will be available against which
they can be used. Deferred tax assets –
unrecognised or recognised, are reviewed
at each reporting date and are recognised/
reduced to the extent that it is probable/ no
longer probable respectively that the related
tax benefit will be realized.
Deferred tax is measured at the tax rates
that are expected to apply to the period
when the asset is realised or the liability is
settled, based on the laws that have been
enacted or substantively enacted by the
reporting date.
The measurement of deferred tax reflects
the tax consequences that would follow
from the manner in which the Company
expects, at the reporting date, to recover or
settle the carrying amount of its assets and
liabilities.
Deferred tax assets and liabilities are offset
if there is a legally enforceable right to offset
current tax liabilities and assets, and they
relate to income taxes levied by the same
tax authority on the same taxable entity, or
on different tax entities, but they intend to

108 Newgen Software Technologies Limited 109ANNUAL REPORT 2017-18
CORPORATE REVIEW FINANCIAL STATEMENTSSTATUTORY REPORTS
settle current tax liabilities and assets on a
net basis or their tax assets and liabilities will
be realised simultaneously.
Minimum Alternative Tax (‘MAT’) under the
provisions of the Income-tax Act, 1961 is
recognised as current tax in the Statement
of Profit and Loss. The credit available under
the Act in respect of MAT paid is recognised
as an asset only when and to the extent there
is convincing evidence that the company
will pay normal income tax during the period
for which the MAT credit can be carried
forward for set-off against the normal tax
liability. MAT credit recognised as an asset
is reviewed at each balance sheet date and
written down to the extent the aforesaid
convincing evidence no longer exists.
n. Cash and Cash Equivalents
Cash and short-term deposits in the Balance
Sheet comprise cash at banks and cash in hand
and short-term deposits with an original maturity
of three months or less, which are subject to
insignificant risk of changes in value.
o. Earnings per share (“EPS”)
Basic earnings per share is calculated by dividing
the profit attributable to the owners of the
Company by the weighted average number of
equity shares outstanding during the year.
Diluted earnings per share is computed using
the net profit or loss for the year attributable to
equity shareholders and the weighted average
number of common and dilutive common
equivalent shares outstanding during the year but
including share options, compulsory convertible
preference shares except where the result would
be anti-dilutive.
p. Share Capital
Equity Shares
Equity shares are classified as equity. Incremental
costs directly attributable to the issuance of new
equity shares are recognized as a deduction
from equity.
Compulsorily convertible preference shares
The embedded derivative liability on initial
recognition has been separated from the
underlying equity instrument and recorded at
fair value. The difference between the fair value
of the combined CCPS instrument and the fair
value of the embedded derivative liability has
been recorded as the value of the equity host
contract. The embedded derivative has been
fair valued through profit or loss at each balance
sheet date.
Upon conversion of CCPS into equity shares the
resultant gain/loss on the down-round derivative
is recognised in profit or loss. The original equity
component remains as equity/is transferred
within equity.
Dividends
The final dividend on shares is recorded as
a liability on the date of approval by the
shareholders, and interim dividend are recorded
as a liability on the date of declaration by the
Company’s Board of Directors.
q. Segment
Segment reporting
Operating segments are reported in a manner
consistent with the internal reporting provided
to the chief operating decision maker (CODM).
Identification of segments:
All operating segments’ results are reviewed
regularly by the Board of Directors, who have
been identified as the CODM, to allocate resources
to the segments and assess their performance.
Refer note 49 for segment information.
r. ESOP Trust
The ESOP trust has been treated as an extension
of the Company and accordingly shares held by
ESOP Trust are netted off from the total share
capital. Consequently, all the assets, liabilities,
income and expenses of the trust are accounted
for as assets and liabilities of the Company,
except for profit / loss on issue of shares to the
employees and dividend received by trust which
are directly adjusted in the Newgen ESOP Trust
reserve.
s. Rounding of amounts
All amounts disclosed in the financial statements
and notes have been rounded off to the nearest
lakhs as per the requirement of Schedule III,
unless otherwise stated.
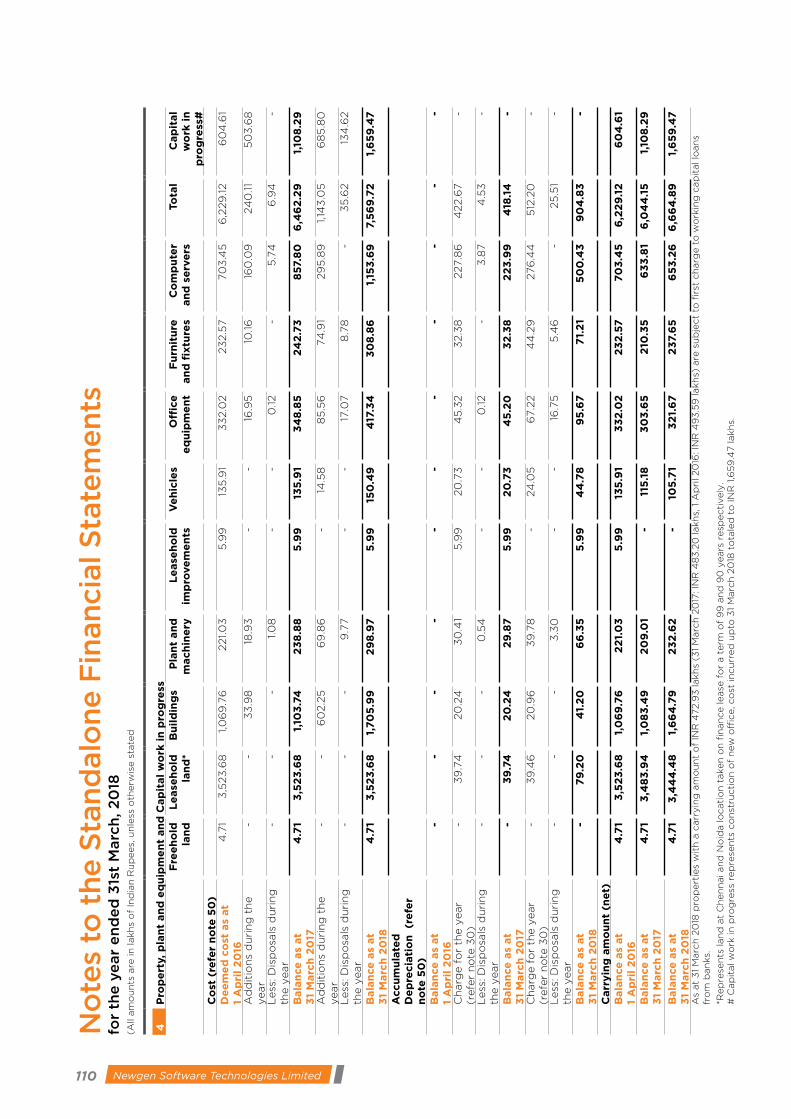
110 Newgen Software Technologies Limited 111
4P
rop
ert
y, p
lan
t an
d e
qu
ipm
en
t an
d C
ap
ital
wo
rk i
n p
rog
ress
Fre
eh
old
la
nd
Le
ase
ho
ld
lan
d*
Bu
ild
ing
sP
lan
t an
d
mach
ine
ryL
ease
ho
ld
imp
rove
me
nts
Ve
hic
les
Off
ice
e
qu
ipm
en
tF
urn
itu
re
an
d f
ixtu
res
Co
mp
ute
r an
d s
erv
ers
Tota
l C
ap
ital
wo
rk i
n
pro
gre
ss#
Co
st (
refe
r n
ote
50
)D
ee
me
d c
ost
as
at
1 A
pri
l 2
016
4.7
1 3
,523
.68
1,0
69
.76
221.0
3
5.9
9
135
.91
33
2.0
2
23
2.5
7
70
3.4
5
6,2
29
.12
60
4.6
1
Ad
dit
ion
s d
uri
ng
th
e
year
- -
33
.98
18
.93
-
- 16
.95
10
.16
16
0.0
9
24
0.11
50
3.6
8
Less
: D
isp
osa
ls d
uri
ng
th
e y
ear
- -
- 1.0
8
- -
0.12
- 5
.74
6
.94
-
Bala
nce
as
at
31
Marc
h 2
017
4.7
1 3
,52
3.6
8
1,10
3.7
4
23
8.8
8
5.9
9
135
.91
34
8.8
5
24
2.7
3
857.
80
6
,46
2.2
9
1,10
8.2
9
Ad
dit
ion
s d
uri
ng
th
e
year
- -
60
2.2
5
69
.86
-
14.5
8
85
.56
74
.91
29
5.8
9
1,14
3.0
5
68
5.8
0
Less
: D
isp
osa
ls d
uri
ng
th
e y
ear
- -
- 9
.77
- -
17.0
7
8.7
8
- 3
5.6
2
134
.62
Bala
nce
as
at
31
Marc
h 2
018
4.7
1 3
,52
3.6
8
1,70
5.9
9
29
8.9
7
5.9
9
150
.49
4
17.3
4
30
8.8
6
1,15
3.6
9
7,5
69
.72
1,
65
9.4
7
Accu
mu
late
d
De
pre
cia
tio
n (r
efe
r n
ote
50
)B
ala
nce
as
at
1 A
pri
l 2
016
- -
- -
- -
- -
- -
-
Ch
arg
e f
or
the y
ear
(refe
r n
ote
30
)-
39
.74
20
.24
3
0.4
1 5
.99
20
.73
4
5.3
2
32.3
8
227.8
6
422.6
7
-
Less
: D
isp
osa
ls d
uri
ng
th
e y
ear
- -
- 0
.54
-
- 0
.12
- 3
.87
4.5
3
-
Bala
nce
as
at
31
Marc
h 2
017
- 3
9.7
4
20
.24
2
9.8
7
5.9
9
20
.73
4
5.2
0
32
.38
2
23
.99
4
18.1
4
-
Ch
arg
e f
or
the y
ear
(refe
r n
ote
30
)-
39
.46
20
.96
3
9.7
8
- 24
.05
6
7.2
2
44
.29
276
.44
5
12.2
0
-
Less
: D
isp
osa
ls d
uri
ng
th
e y
ear
- -
- 3
.30
-
- 16
.75
5
.46
-
25
.51
-
Bala
nce
as
at
31
Marc
h 2
018
- 7
9.2
0
41.
20
6
6.3
5
5.9
9
44
.78
9
5.6
7
71.
21
50
0.4
3
90
4.8
3
-
Carr
yin
g a
mo
un
t (n
et)
Bala
nce
as
at
1 A
pri
l 2
016
4.7
1 3
,52
3.6
8
1,0
69
.76
2
21.
03
5
.99
13
5.9
1 3
32
.02
2
32
.57
70
3.4
5
6,2
29
.12
6
04
.61
Bala
nce
as
at
31
Marc
h 2
017
4.7
1 3
,48
3.9
4
1,0
83
.49
2
09
.01
- 11
5.1
8
30
3.6
5
210
.35
6
33
.81
6,0
44
.15
1,
108
.29
Bala
nce
as
at
31
Marc
h 2
018
4.7
1 3
,44
4.4
8
1,6
64
.79
2
32
.62
-
105
.71
32
1.6
7
23
7.6
5
65
3.2
6
6,6
64
.89
1,
65
9.4
7
As
at
31
Marc
h 2
018
pro
pert
ies
wit
h a
carr
yin
g a
mo
un
t o
f IN
R 4
72.9
3 lakh
s (3
1 M
arc
h 2
017
: IN
R 4
83
.20
lakh
s, 1
Ap
ril 20
16: IN
R 4
93
.59
lakh
s) a
re s
ub
ject
to fi
rst
ch
arg
e t
o w
ork
ing
cap
ital lo
an
s fr
om
ban
ks.
*Rep
rese
nts
lan
d a
t C
hen
nai an
d N
oid
a lo
cati
on
taken
on
fin
an
ce lease
fo
r a t
erm
of
99
an
d 9
0 y
ears
resp
ecti
vely
.#
Cap
ital w
ork
in
pro
gre
ss r
ep
rese
nts
co
nst
ructi
on
of
new
offi
ce, c
ost
in
cu
rred
up
to 3
1 M
arc
h 2
018
to
tale
d t
o IN
R 1
,65
9.4
7 lakh
s.
No
tes
to t
he S
tand
alo
ne F
inan
cia
l S
tate
men
ts
for
the
ye
ar
en
de
d 3
1st
Marc
h, 2
018
(All
am
ou
nts
are
in
lakh
s o
f In
dia
n R
up
ees,
un
less
oth
erw
ise s
tate
d
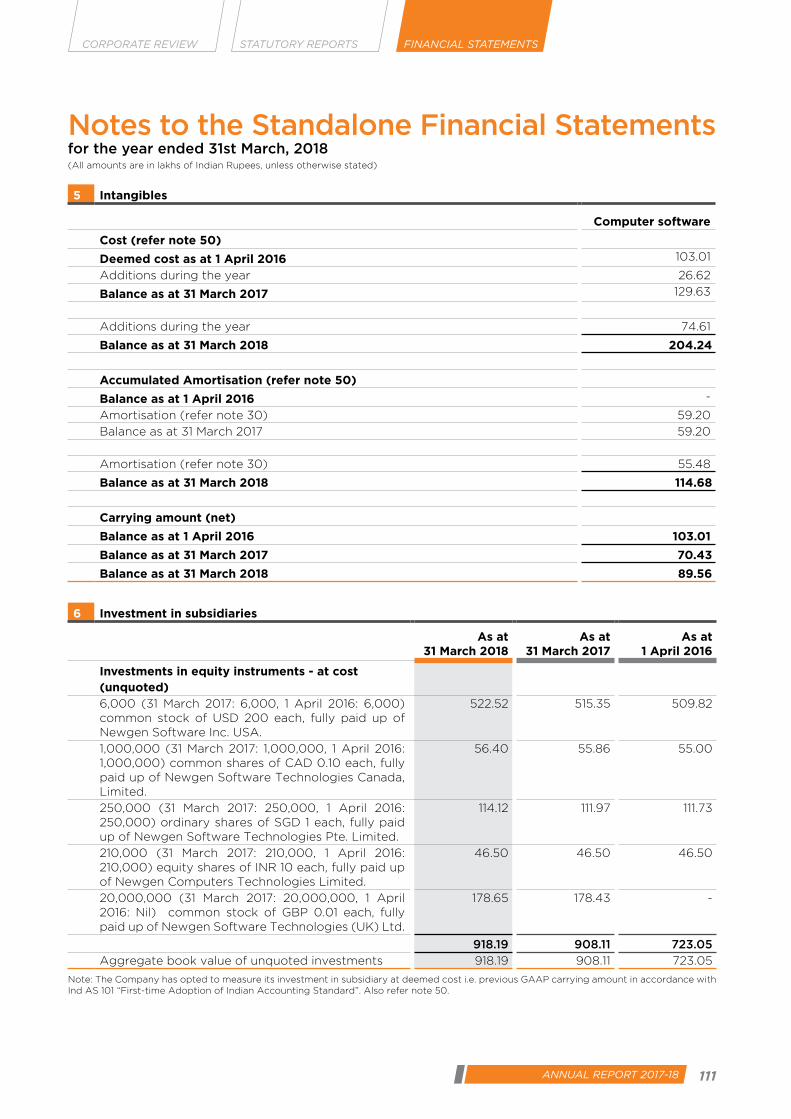
110 Newgen Software Technologies Limited 111ANNUAL REPORT 2017-18
CORPORATE REVIEW FINANCIAL STATEMENTSSTATUTORY REPORTS
Notes to the Standalone Financial Statements for the year ended 31st March, 2018(All amounts are in lakhs of Indian Rupees, unless otherwise stated)
5 Intangibles
Computer software
Cost (refer note 50)
Deemed cost as at 1 April 2016 103.01
Additions during the year 26.62
Balance as at 31 March 2017 129.63
Additions during the year 74.61
Balance as at 31 March 2018 204.24
Accumulated Amortisation (refer note 50)
Balance as at 1 April 2016 -
Amortisation (refer note 30) 59.20
Balance as at 31 March 2017 59.20
Amortisation (refer note 30) 55.48
Balance as at 31 March 2018 114.68
Carrying amount (net)
Balance as at 1 April 2016 103.01
Balance as at 31 March 2017 70.43
Balance as at 31 March 2018 89.56
6 Investment in subsidiaries
As at 31 March 2018
As at 31 March 2017
As at 1 April 2016
Investments in equity instruments - at cost (unquoted)6,000 (31 March 2017: 6,000, 1 April 2016: 6,000) common stock of USD 200 each, fully paid up of Newgen Software Inc. USA.
522.52 515.35 509.82
1,000,000 (31 March 2017: 1,000,000, 1 April 2016: 1,000,000) common shares of CAD 0.10 each, fully paid up of Newgen Software Technologies Canada, Limited.
56.40 55.86 55.00
250,000 (31 March 2017: 250,000, 1 April 2016: 250,000) ordinary shares of SGD 1 each, fully paid up of Newgen Software Technologies Pte. Limited.
114.12 111.97 111.73
210,000 (31 March 2017: 210,000, 1 April 2016: 210,000) equity shares of INR 10 each, fully paid up of Newgen Computers Technologies Limited.
46.50 46.50 46.50
20,000,000 (31 March 2017: 20,000,000, 1 April 2016: Nil) common stock of GBP 0.01 each, fully paid up of Newgen Software Technologies (UK) Ltd.
178.65 178.43 -
918.19 908.11 723.05
Aggregate book value of unquoted investments 918.19 908.11 723.05
Note: The Company has opted to measure its investment in subsidiary at deemed cost i.e. previous GAAP carrying amount in accordance with Ind AS 101 “First-time Adoption of Indian Accounting Standard”. Also refer note 50.
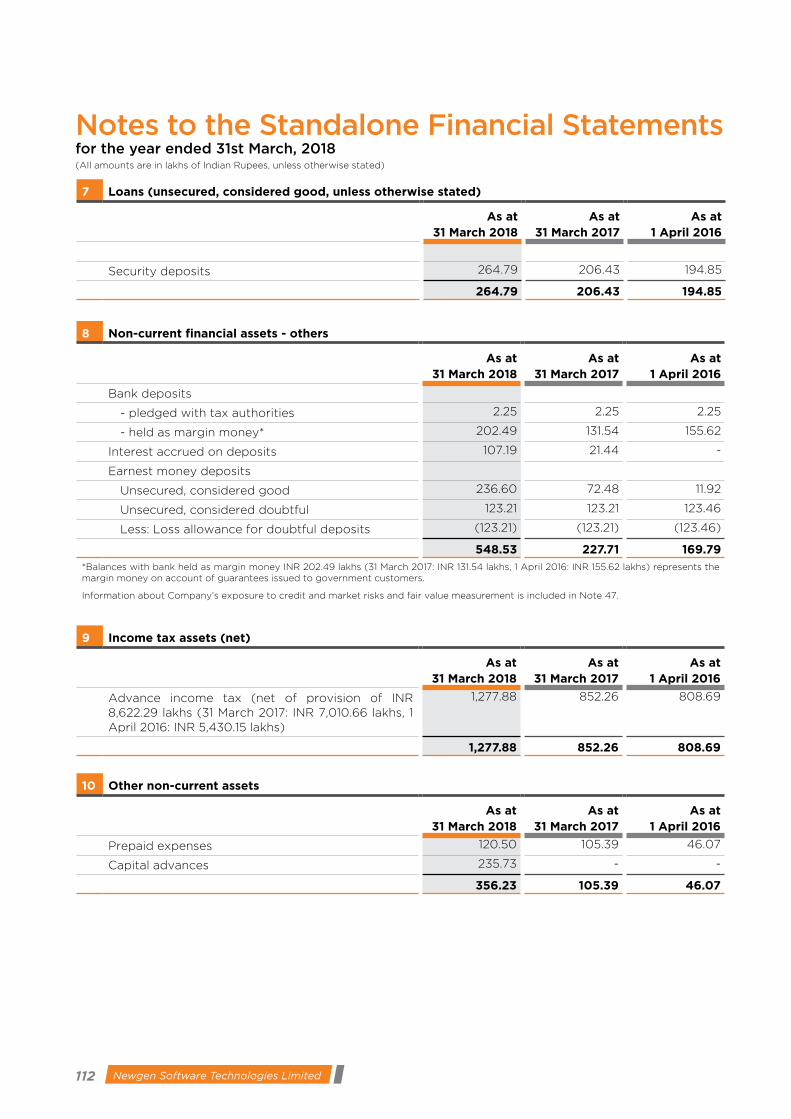
112 Newgen Software Technologies Limited 113
Notes to the Standalone Financial Statements for the year ended 31st March, 2018(All amounts are in lakhs of Indian Rupees, unless otherwise stated)
7 Loans (unsecured, considered good, unless otherwise stated)
As at 31 March 2018
As at 31 March 2017
As at 1 April 2016
Security deposits 264.79 206.43 194.85
264.79 206.43 194.85
8 Non-current financial assets - others
As at 31 March 2018
As at 31 March 2017
As at 1 April 2016
Bank deposits
- pledged with tax authorities 2.25 2.25 2.25
- held as margin money* 202.49 131.54 155.62
Interest accrued on deposits 107.19 21.44 -
Earnest money deposits
Unsecured, considered good 236.60 72.48 11.92
Unsecured, considered doubtful 123.21 123.21 123.46
Less: Loss allowance for doubtful deposits (123.21) (123.21) (123.46)
548.53 227.71 169.79
*Balances with bank held as margin money INR 202.49 lakhs (31 March 2017: INR 131.54 lakhs, 1 April 2016: INR 155.62 lakhs) represents the margin money on account of guarantees issued to government customers.
Information about Company’s exposure to credit and market risks and fair value measurement is included in Note 47.
9 Income tax assets (net)
As at 31 March 2018
As at 31 March 2017
As at 1 April 2016
Advance income tax (net of provision of INR 8,622.29 lakhs (31 March 2017: INR 7,010.66 lakhs, 1 April 2016: INR 5,430.15 lakhs)
1,277.88 852.26 808.69
1,277.88 852.26 808.69
10 Other non-current assets
As at 31 March 2018
As at 31 March 2017
As at 1 April 2016
Prepaid expenses 120.50 105.39 46.07
Capital advances 235.73 - -
356.23 105.39 46.07

112 Newgen Software Technologies Limited 113ANNUAL REPORT 2017-18
CORPORATE REVIEW FINANCIAL STATEMENTSSTATUTORY REPORTS
11 Investments
As at 31 March 2018
As at 31 March 2017
As at 1 April 2016
Investments in bonds (unquoted)Bonds at FVOCI Investment in government bonds 959.03 971.10 445.20 Investment in other bonds 726.46 711.69 -
1,685.49 1,682.79 445.20
Investments in mutual funds (unquoted)Mutual Funds at FVTPL Investment in arbitrage funds - - 2,367.13 Investment in debt mutual funds 3,336.58 3,183.25 1,703.81
3,336.58 3,183.25 4,070.94
5,022.07 4,866.04 4,516.14
Aggregate book value of unquoted investments 5,022.07 4,866.04 4,516.14 Aggregate market value of unquoted investments 5,022.07 4,866.04 4,516.14
Investments in bonds measured at FVOCI have stated interest rates of 7.35% to 10.40%. Information about Company’s exposure to credit and market risks and fair value measurement is included in Note 47
12 Trade receivables
As at 31 March 2018
As at 31 March 2017
As at 1 April 2016
Unsecured*
- Considered good 20,392.66 18,588.04 15,575.18
- Considered doubtful 4,000.87 5,976.64 5,566.26
24,393.53 24,564.68 21,141.44 Less: Loss allowance for trade receivables
- unsecured, considered doubtful (4,000.87) (5,976.64) (5,566.26)
20,392.66 18,588.04 15,575.18 *Includes balance receivables from related parties. For Details refer note 46
The Company’s exposure to credit and currency risks and loss allowances related to trade receivables are discussed in note 47.
13 Cash and cash equivalents
As at 31 March 2018
As at 31 March 2017
As at 1 April 2016
Cash on hand 4.52 6.26 4.32
Balances with banks
- in current accounts*# 5,116.27 2,012.42 2,079.67
Balances with scheduled banks in deposit accounts with original maturity of less than 3 months#
8,400.00 800.00 -
13,520.79 2,818.68 2,083.99
*Current account balances with banks include INR 112.24 lakhs (31 March 2017: INR 36.69 lakhs, 1 April 2016: INR 41.11 lakhs) held at a foreign branch.
# Balance with banks and deposits includes INR 58.80 lakhs and INR 8,400 lakhs respectively as unutilized amounts of the IPO proceeds.
Notes to the Standalone Financial Statements for the year ended 31st March, 2018(All amounts are in lakhs of Indian Rupees, unless otherwise stated)

114 Newgen Software Technologies Limited 115
Notes to the Standalone Financial Statements for the year ended 31st March, 2018(All amounts are in lakhs of Indian Rupees, unless otherwise stated)
14 Current financial assets - Loans
As at 31 March 2018
As at 31 March 2017
As at 1 April 2016
Loans to employees* 20.03 26.64 35.04
Security deposits 297.24 41.40 -
317.27 68.04 35.04
*These are interest bearing loans - repayable within one year given to employees, chargeable at the rate of 12% p.a.
15 Current financial assets - Others
As at 31 March 2018
As at 31 March 2017
As at 1 April 2016
(unsecured considered good, unless otherwise stated)
Interest accrued on deposits 0.67 0.67 30.12
Interest accrued but not due on government bonds 84.53 39.18 32.13
Unbilled revenue*
- other than related parties 5,079.43 2,500.35 2,274.31
- related parties 12.56 68.63 68.63
Earnest money deposits - - 14.30
Receivable from employees for issue of shares - 0.56 -
5,177.19 2,609.39 2,419.49
*Unbilled revenue pertains to consideration receivable in respect of initial sale of software and services.
16 Other current assets
As at 31 March 2018
As at 31 March 2017
As at 1 April 2016
Advances to vendors 11.04 17.90 8.88
Balances with government authorities* 137.47 191.92 152.80
Advance to employees 207.91 117.41 35.05
Prepaid expenses 284.81 283.80 244.64
641.23 611.03 441.37
*Balances with government authorities comprises of Goods and Service tax/ service tax / vat credit receivable.

114 Newgen Software Technologies Limited 115ANNUAL REPORT 2017-18
CORPORATE REVIEW FINANCIAL STATEMENTSSTATUTORY REPORTS
Notes to the Standalone Financial Statements for the year ended 31st March, 2018(All amounts are in lakhs of Indian Rupees, unless otherwise stated)
17 Share capital
As at 31 March 2018 As at 31 March 2017 As at 1 April 2016
Number of shares
Amount Number of shares
Amount Number of shares
Amount
Authorised share capitalEquity shares of INR 10 each
98,000,000 9,800.00 64,400,000 6,440.00 63,050,000 6,305.00
Equity share capital with differential voting rights of INR 10 each
200 0.02 200 0.02 200 0.02
0.01% Compulsory convertible preference shares of INR 10 each
11,999,800 1,199.98 11,999,800 1,199.98 11,999,800 1,199.98
110,000,000 11,000.00 76,400,000 7,640.00 75,050,000 7,505.00
As at 31 March 2018 As at 31 March 2017 As at 1 April 2016
Issued, subscribed and paid up
Number of shares
Amount Number of shares
Amount Number of shares
Amount
Equity share capital of INR 10 each, fully paid up
69,235,701 6,923.57 64,308,030 6,430.80 54,013,800 5,401.38
Equity share capital with differential voting rights (DVR) of INR 10 each, fully paid up
- - 120 0.01 120 0.01
0.01% Compulsory convertible preference shares of Rs. 10 each, fully paid up
- - - - 10,294,230 1,029.42
Balance 69,235,701 6,923.57 64,308,150 6,430.81 64,308,150 6,430.81Less : Shares held by Trust
1,351,584 135.16 1,995,064 199.51 2,223,735 222.37
Total Share capital 67,884,117 6,788.41 62,313,086 6,231.30 62,084,415 6,208.44
Reconciliation of shares outstanding at the beginning and at the end at the reporting year
As at 31 March 2018 As at 31 March 2017
Equity share capital of INR 10 each, fully paid up
Number of shares
Amount Number of shares
Amount
At the beginning of the year 64,308,030 6,430.80 54,013,800 5,401.38
Add: Shares issued on conversion of preference shares
- - 10,294,230 1,029.42
Add: Equity shares with differential voting rights reclassified to equity shares during the year
120 0.01 - -
Add: Equity shares issued during the year through initial public offer*
3,877,551 387.76 - -
Add: Issued during the year to Newgen ESOP Trust
1,050,000 105.00 - -
At the end of the year 69,235,701 6,923.57 64,308,030 6,430.80Less: Shares held by trust 1,351,584 135.16 1,995,064 199.51
Total equity share capital 67,884,117 6,788.41 62,312,966 6,231.29

116 Newgen Software Technologies Limited 117
Notes to the Standalone Financial Statements for the year ended 31st March, 2018(All amounts are in lakhs of Indian Rupees, unless otherwise stated)
During the year ended 31 March 2018, the Company has completed the initial public offer (IPO), pursuant to which
17,331,483 equity shares of INR 10 each were allotted/allocated, at an issue price of INR 245 each, consisting of
fresh issue of 3,877,551 equity shares and an offer for sale of 13,453,932 equity shares by selling shareholders.
The equity shares of the Company were listed on National Stock Exchange of India Limited (NSE) via ID
NEWGEN and BSE Limited (BSE) via ID 540900 on 29 January 2018.”
Terms/rights attached to equity sharesIn case of equity shares, each equity shareholder is eligible for one vote per share held. The dividend proposed
by the Board of Directors is subject to the approval of the shareholders in the ensuing annual general meeting,
except in case of interim dividend, if any. In the event of liquidation, the equity shareholders are eligible to
receive the remaining assets of the Company after distribution of all preferential amounts, in proportion to their
respective shareholding.
As at 31 March 2018 As at 31 March 2017
Equity share capital with differential voting rights (DVR) of INR 10 each, fully paid up
Number of shares
Amount Number of shares
Amount
At the beginning of the year 120 0.01 120 0.01
Less: Re-classification to equity shares
during the year
(120) (0.01) - -
At the end of the year - - 120 0.01
Equity shares with differential voting rights :Each of the shareholder with differential voting rights shall, at all times up to the conversion of Compulsory
convertible preference shares into equity shares thereof, were entitled to a fixed preferential and cumulative
dividend of one-hundredth percent (0.01%) of the investment amount and resolved to be so distributed as
such dividend in respect of each financial year or other accounting period of the Company, in accordance with
applicable law. In addition, the Ascent DVR and the IDGVI DVR shall be entitled to participate in any distribution
of the profits of the Company (including, as regards any dividends declared) on a pro-rata share and as-if-
converted basis vis-à-vis the other shareholders.
Expiration of differential rights:Pursuant to the shareholder subscription agreement dated 31 October 2013, each Ascent DVR
and an IDGVI DVR shall be compulsorily converted at no cost to the Investors, into equity shares
in the ratio of 1:1 at any time as may be determined by the investors in their sole discretion. Upon
conversion of the Ascent DVR and the IDGVI DVR , such differential voting and dividend rights,
as mentioned above, on the shares held by each of the investors have automatically expired.
During the year ended 31 March 2018 each equity share with DVR has been re-classified into equity shares.
As at 31 March 2018 As at 31 March 2017
0.01% Compulsory convertible
preference shares of INR 10 each, fully
paid up
Number of shares
Amount Number of shares
Amount
At the beginning of the year - - 10,294,230 1,029.42
Less: Preference shares conversion to
equity shares during the year
- - 10,294,230 1,029.42
At the end of the year - - - -
Terms/rights attached to preference sharesDuring the years ended 31 March 2008 and 31 March 2009, the Company had issued 1,014,785 compulsorily
convertible preference shares (hereinafter referred to as “CCPS”) of Rs. 10 each fully paid up to HAV2 (Mauritius)
Limited and 360,250 CCPS of INR 10 each fully paid up to SAPV (Mauritius). During the financial year 2013-
14, HAV2 (Mauritius) Limited, exited from the Company and two new investors namely Unit Trust of India
Investment Advisory Services Limited, A/C Ascent India Fund II (“Ascent”) and IDG Ventures India Fund II LLC
(“IDGVI”) made investment in the Company. During the year ended 31 March 2014, all the CCPS held by HAV2

116 Newgen Software Technologies Limited 117ANNUAL REPORT 2017-18
CORPORATE REVIEW FINANCIAL STATEMENTSSTATUTORY REPORTS
(Mauritius) Limited, were acquired by Ascent (670,790 CCPS) and IDGVI (343,995 CCPS). Further, during the
year ended 2014-15, the Company has also allotted 225,192 number of CCPS to Ascent and 115,478 number of
CCPS to IDGVI.
Pursuant to Shareholders agreement executed on 31 October 2013, between Newgen Software Technologies
Ltd and Ascent, IDGVI, SAPV (Mauritius) (individually referred as investor and together referred to as investor
group), Newgen Employees Trust and Mr. Diwakar Nigam, Mr. T.S. Varadarajan, Mrs. Priyadarshini Nigam and
Mrs. Usha Varadarajan, and Share purchase cum Subscription agreement dated 31 October 2013, between
Newgen Software Technologies Ltd, Ascent, IDGVI, SAPV (Mauritius), Mr. Diwakar Nigam, Mr. T.S. Varadarajan,
Mrs. Priyadarshini Nigam and Mrs. Usha Varadarajan, the investor group were entitled to receive dividends in
preference to any dividends on the equity shares of the Company at the rate of 0.01% (Zero point Zero One
Per cent) per annum on the investors subscription consideration, pro rata on a fully diluted basis. However, all
the preferential dividend and differential voting rights have already been expired due to conversion of CCPS
into Equity.
During the year 2014-15, IDGVI transferred 606,540 shares (adjusted for bonus issue) to Pandara Trust Scheme - I
Each CCPS shall be compulsorily converted at no cost to the Investor, into Equity Shares in the ratio of 1:1 at any
time as may be determined by the Investor at their sole discretion. Subject to applicable Law, the conversion
of the Shares and the HAV2 (Mauritius) Limited Sale of Shares will take place within the maximum time period
prescribed under applicable Law for such conversion.
Conversion of Compulsory convertible preference shares into equityPursuant to the Shareholders Agreement, during the year ended 31 March 2017, all issued 10,294,230 CCPS
of Rs.10/- each have been converted into 10,294,230 equity shares of Rs.10/- each in the ratio of 1:1, at no cost
to the investors. Equity shares of the Company allotted upon conversion of the CCPS, rank pari passu in all
respects including as to dividend, voting rights, with the existing fully paid up equity shares of face value of Re.
10/- each of the Company.
17 A Details of shareholders holding more than 5% shares in the Company
Equity shares of INR10 each, fully paid up held by:
As at 31 March 2018 31 March 2017 1 April 2016
Number % Holding Number % Holding Number % Holding
- Mr. Diwakar Nigam 18,422,406 28.65% 18,422,406 28.65% 18,422,406 34.11%
- Mr. T.S. Varadarajan 15,009,306 23.34% 15,009,306 23.34% 15,009,306 27.79%
- Mrs. Priyadarshini
Nigam
7,968,906 12.39% 7,968,906 12.39% 7,968,906 14.75%
- Mrs. Usha Varadarajan 4,528,320 7.04% 4,528,320 7.04% 4,528,320 8.38%
- Unit Trust of India
Investment Advisory
Services Limited, A/C
Ascent India Fund III
- - 7,464,510 11.61% - -
Equity shares with Differential voting Rights of INR 10 each, fully paid up held by:As at 31 March 2018 31 March 2017 1 April 2016
Number % Holding Number % Holding Number % HoldingUnit Trust of India
Investment Advisory
Services Limited, A/C
Ascent India Fund III
- - 60 50.00% 60 50.00%
IDG Ventures India
Fund II LLC
- - 60 50.00% 60 50.00%
Notes to the Standalone Financial Statements for the year ended 31st March, 2018(All amounts are in lakhs of Indian Rupees, unless otherwise stated)
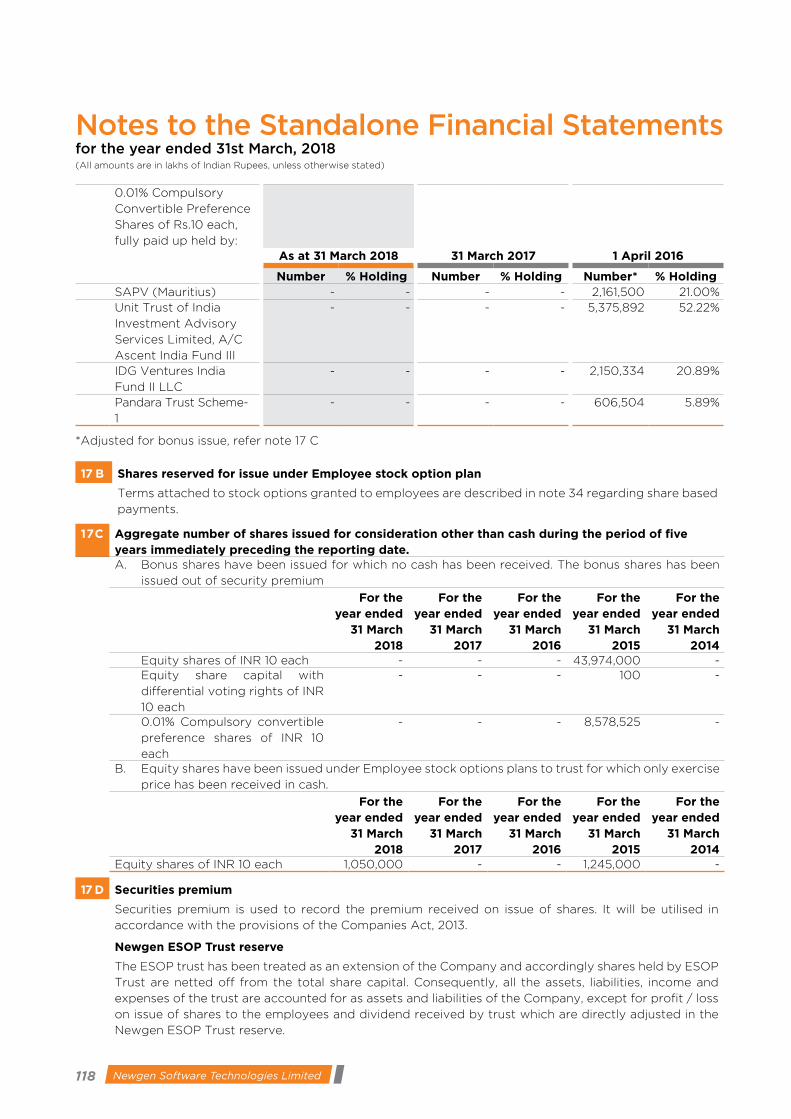
118 Newgen Software Technologies Limited 119
0.01% Compulsory
Convertible Preference
Shares of Rs.10 each,
fully paid up held by:As at 31 March 2018 31 March 2017 1 April 2016
Number % Holding Number % Holding Number* % HoldingSAPV (Mauritius) - - - - 2,161,500 21.00%Unit Trust of India
Investment Advisory
Services Limited, A/C
Ascent India Fund III
- - - - 5,375,892 52.22%
IDG Ventures India
Fund II LLC
- - - - 2,150,334 20.89%
Pandara Trust Scheme-
1
- - - - 606,504 5.89%
*Adjusted for bonus issue, refer note 17 C
17 B Shares reserved for issue under Employee stock option plan
Terms attached to stock options granted to employees are described in note 34 regarding share based
payments.
1 7 C Aggregate number of shares issued for consideration other than cash during the period of five years immediately preceding the reporting date.A. Bonus shares have been issued for which no cash has been received. The bonus shares has been
issued out of security premium
For the year ended
31 March 2018
For the year ended
31 March 2017
For the year ended
31 March 2016
For the year ended
31 March 2015
For the year ended
31 March 2014
Equity shares of INR 10 each - - - 43,974,000 - Equity share capital with
differential voting rights of INR
10 each
- - - 100 -
0.01% Compulsory convertible
preference shares of INR 10
each
- - - 8,578,525 -
B. Equity shares have been issued under Employee stock options plans to trust for which only exercise
price has been received in cash.
For the year ended
31 March 2018
For the year ended
31 March 2017
For the year ended
31 March 2016
For the year ended
31 March 2015
For the year ended
31 March 2014
Equity shares of INR 10 each 1,050,000 - - 1,245,000 -
17 D Securities premium
Securities premium is used to record the premium received on issue of shares. It will be utilised in
accordance with the provisions of the Companies Act, 2013.
Newgen ESOP Trust reserve
The ESOP trust has been treated as an extension of the Company and accordingly shares held by ESOP
Trust are netted off from the total share capital. Consequently, all the assets, liabilities, income and
expenses of the trust are accounted for as assets and liabilities of the Company, except for profit / loss
on issue of shares to the employees and dividend received by trust which are directly adjusted in the
Newgen ESOP Trust reserve.
Notes to the Standalone Financial Statements for the year ended 31st March, 2018(All amounts are in lakhs of Indian Rupees, unless otherwise stated)

118 Newgen Software Technologies Limited 119ANNUAL REPORT 2017-18
CORPORATE REVIEW FINANCIAL STATEMENTSSTATUTORY REPORTS
Share options outstanding reserve
The Company has established various equity-settled share-based payment plans for certain employees
of the Company. Refer to note 34 for further details on these plans.
18 Non-current financial liabilities - Borrowings
As at 31 March 2018
As at 31 March 2017
As at 1 April 2016
Non-current maturities of finance lease obligations
(secured)*
1,316.66 1,617.99 1,917.45
1,316.66 1,617.99 1,917.45
* Finance lease obligationsThe company had obtained leasehold land from ‘Yamuna Expressway Industrial Development Authority
(YEIDA)’ during the year ended 31 March 2016. The lease term of leasehold land is 90 years with equated
monthly payment beginning from the month subsequent to the commencement of lease.
Finance lease obligations are payable as follows:
Particulars As at 1 April 2016
Future minimum
lease payments
Interest Present value of minimum
lease payments
Less than one year 315.25 240.16 555.40
Between one and five years 1,204.62 615.64 1,820.26
More than five years 712.83 4,973.29 5,686.12
Particulars As at 31 March 2017
Less than one year 302.25 205.49 507.74
Between one and five years 1,051.96 481.51 1,533.47
More than five years 566.03 4,901.93 5,467.97
Particulars As at 31 March 2018
Less than one year 302.25 170.37 472.62
Between one and five years 684.42 442.27 1,126.69
More than five years 566.40 4,832.93 5,399.33
Effective interest rate on above borrowings is 11.68%.
19 Derivative
As at 31 March 2018
As at 31 March 2017
As at 1 April 2016
Derivative liability - - 136.00
- - 136.00
20 Non-current provisions
As at 31 March 2018
As at 31 March 2017
As at 1 April 2016
Provision for employee benefits (refer note 28)
- provision for gratuity 1,266.07 1,113.20 865.24
- provision for compensated absences 387.30 329.77 256.35
1,653.37 1,442.97 1,121.59
Notes to the Standalone Financial Statements for the year ended 31st March, 2018(All amounts are in lakhs of Indian Rupees, unless otherwise stated)
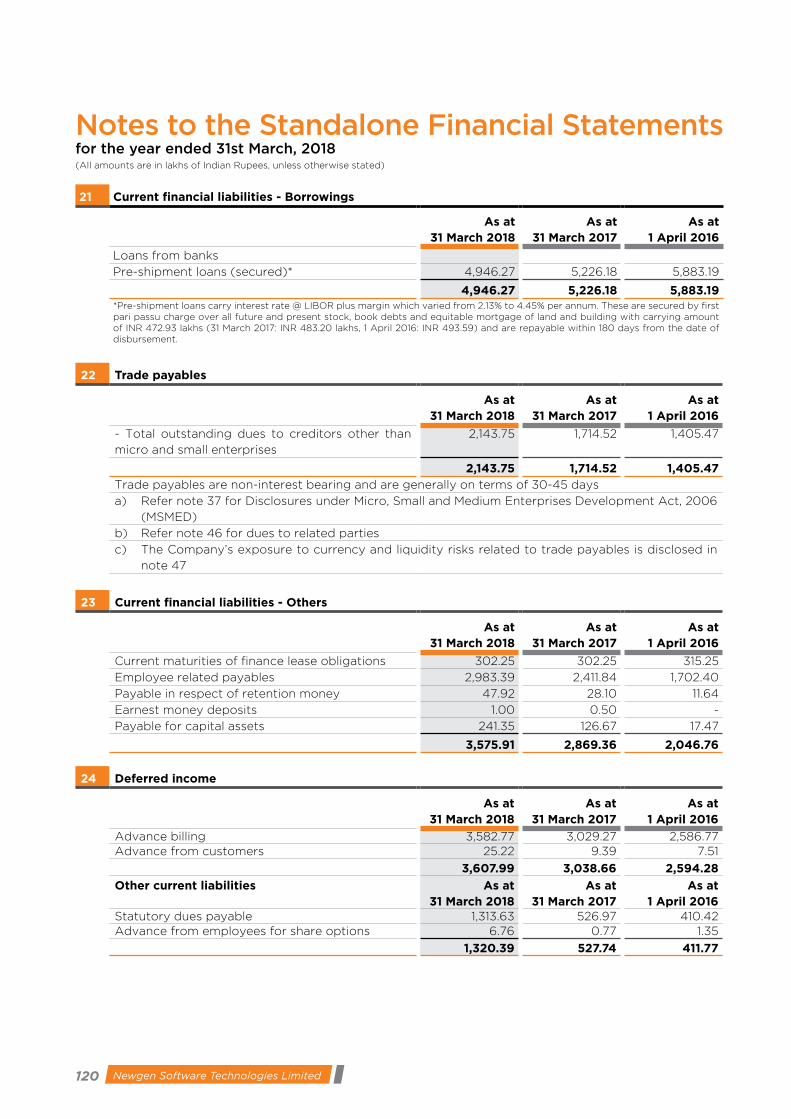
120 Newgen Software Technologies Limited 121
Notes to the Standalone Financial Statements for the year ended 31st March, 2018(All amounts are in lakhs of Indian Rupees, unless otherwise stated)
21 Current financial liabilities - Borrowings
As at 31 March 2018
As at 31 March 2017
As at 1 April 2016
Loans from banks
Pre-shipment loans (secured)* 4,946.27 5,226.18 5,883.19
4,946.27 5,226.18 5,883.19*Pre-shipment loans carry interest rate @ LIBOR plus margin which varied from 2.13% to 4.45% per annum. These are secured by first pari passu charge over all future and present stock, book debts and equitable mortgage of land and building with carrying amount of INR 472.93 lakhs (31 March 2017: INR 483.20 lakhs, 1 April 2016: INR 493.59) and are repayable within 180 days from the date of disbursement.
22 Trade payables
As at 31 March 2018
As at 31 March 2017
As at 1 April 2016
- Total outstanding dues to creditors other than
micro and small enterprises
2,143.75 1,714.52 1,405.47
2,143.75 1,714.52 1,405.47Trade payables are non-interest bearing and are generally on terms of 30-45 days
a) Refer note 37 for Disclosures under Micro, Small and Medium Enterprises Development Act, 2006
(MSMED)
b) Refer note 46 for dues to related parties
c) The Company’s exposure to currency and liquidity risks related to trade payables is disclosed in
note 47
23 Current financial liabilities - Others
As at 31 March 2018
As at 31 March 2017
As at 1 April 2016
Current maturities of finance lease obligations 302.25 302.25 315.25
Employee related payables 2,983.39 2,411.84 1,702.40
Payable in respect of retention money 47.92 28.10 11.64
Earnest money deposits 1.00 0.50 -
Payable for capital assets 241.35 126.67 17.47
3,575.91 2,869.36 2,046.76
24 Deferred income
As at 31 March 2018
As at 31 March 2017
As at 1 April 2016
Advance billing 3,582.77 3,029.27 2,586.77Advance from customers 25.22 9.39 7.51
3,607.99 3,038.66 2,594.28
Other current liabilities As at 31 March 2018
As at 31 March 2017
As at 1 April 2016
Statutory dues payable 1,313.63 526.97 410.42Advance from employees for share options 6.76 0.77 1.35
1,320.39 527.74 411.77

120 Newgen Software Technologies Limited 121ANNUAL REPORT 2017-18
CORPORATE REVIEW FINANCIAL STATEMENTSSTATUTORY REPORTS
25 Current provisions
As at 31 March 2018
As at 31 March 2017
As at 1 April 2016
Provision for employee benefits (refer note 28)- provision for gratuity 141.39 165.27 134.70- provision for compensated absences 69.89 68.40 55.17
211.28 233.67 189.87
26 Revenue from operations
For the year ended
31 March 2018
For the year ended
31 March 2017
Sale of products - softwares 12,996.88 10,946.89 Sale of services- Implementation 11,768.53 10,381.22- Scanning 1,950.01 1,698.67- AMC/ATS 7,934.91 7,060.67- Support 10,268.75 8,026.60- SaaS revenue 1,033.28 197.36
45,952.36 38,311.41
27 Other income
For the year ended
31 March 2018
For the year ended
31 March 2017
Interest income under the effective interest rate method:- on security deposits at amortised cost 31.21 24.16- government and other bonds at FVOCI 131.56 35.11Interest income on fixed deposits 159.32 22.16Other interest income 1.10 2.02Profit on sale of mutual funds (net) at FVTPL 60.73 589.89Dividend income from mutual funds at FVTPL 87.86 1.75Fair value changes of financial assets at FVTPL 25.48 -Provision no longer required written back 229.75 -Reversal of derivative liability - 136.00Miscellaneous income 31.18 15.52
758.19 826.61
28 Employee benefits expense
For the year ended
31 March 2018
For the year ended
31 March 2017
Salaries, wages and bonus 20,434.76 17,060.34Contribution to provident and other funds (refer note i below) 672.31 609.44Expenses related to compensated absences (refer note ii below) 244.17 228.20Share based payment - equity settled 215.64 119.40Expense related to defined benefit plan (refer note iii below) 272.39 242.81Staff welfare expenses 446.59 373.00
22,285.86 18,633.19
Notes to the Standalone Financial Statements for the year ended 31st March, 2018(All amounts are in lakhs of Indian Rupees, unless otherwise stated)
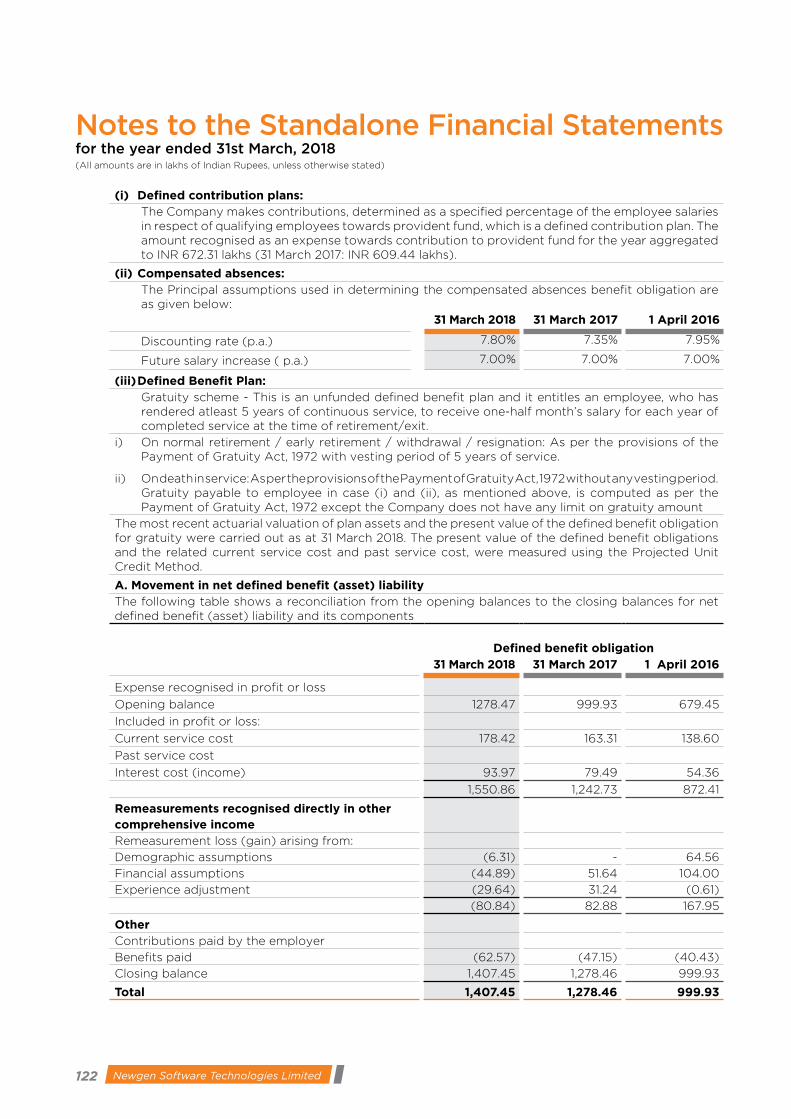
122 Newgen Software Technologies Limited 123
(i) Defined contribution plans: The Company makes contributions, determined as a specified percentage of the employee salaries
in respect of qualifying employees towards provident fund, which is a defined contribution plan. The amount recognised as an expense towards contribution to provident fund for the year aggregated to INR 672.31 lakhs (31 March 2017: INR 609.44 lakhs).
(ii) Compensated absences: The Principal assumptions used in determining the compensated absences benefit obligation are
as given below:31 March 2018 31 March 2017 1 April 2016
Discounting rate (p.a.) 7.80% 7.35% 7.95%
Future salary increase ( p.a.) 7.00% 7.00% 7.00%
(iii) Defined Benefit Plan: Gratuity scheme - This is an unfunded defined benefit plan and it entitles an employee, who has
rendered atleast 5 years of continuous service, to receive one-half month’s salary for each year of completed service at the time of retirement/exit.
i) On normal retirement / early retirement / withdrawal / resignation: As per the provisions of the Payment of Gratuity Act, 1972 with vesting period of 5 years of service.
ii) On death in service: As per the provisions of the Payment of Gratuity Act, 1972 without any vesting period. Gratuity payable to employee in case (i) and (ii), as mentioned above, is computed as per the Payment of Gratuity Act, 1972 except the Company does not have any limit on gratuity amount
The most recent actuarial valuation of plan assets and the present value of the defined benefit obligation for gratuity were carried out as at 31 March 2018. The present value of the defined benefit obligations and the related current service cost and past service cost, were measured using the Projected Unit Credit Method.
A. Movement in net defined benefit (asset) liabilityThe following table shows a reconciliation from the opening balances to the closing balances for net defined benefit (asset) liability and its components
Defined benefit obligation31 March 2018 31 March 2017 1 April 2016
Expense recognised in profit or loss
Opening balance 1278.47 999.93 679.45
Included in profit or loss:
Current service cost 178.42 163.31 138.60
Past service cost
Interest cost (income) 93.97 79.49 54.36
1,550.86 1,242.73 872.41
Remeasurements recognised directly in other comprehensive incomeRemeasurement loss (gain) arising from:
Demographic assumptions (6.31) - 64.56
Financial assumptions (44.89) 51.64 104.00
Experience adjustment (29.64) 31.24 (0.61)
(80.84) 82.88 167.95
OtherContributions paid by the employer
Benefits paid (62.57) (47.15) (40.43)
Closing balance 1,407.45 1,278.46 999.93
Total 1,407.45 1,278.46 999.93
Notes to the Standalone Financial Statements for the year ended 31st March, 2018(All amounts are in lakhs of Indian Rupees, unless otherwise stated)

122 Newgen Software Technologies Limited 123ANNUAL REPORT 2017-18
CORPORATE REVIEW FINANCIAL STATEMENTSSTATUTORY REPORTS
Defined benefit obligation31 March 2018 31 March 2017 1 April 2016
B. Defined benefit obligations
i. Actuarial assumptionsThe following were the principal actuarial assumptions at the reporting date (expressed as weighted averages).
Discount rate 7.80 7.35 7.95
Salary escalation rate 7.00 7.00 7.00
Mortality rate 100% of IALM (2006 - 08)
100% of IALM (2006 - 08)
100% of IALM (2006 - 08)
ii. Sensitivity analysis
Reasonably possible changes at the reporting date to one of the relevant actuarial assumptions, holding other assumptions constant, would have affected the defined benefit obligation by the amounts shown below.
31 March 2018 31 March 2017
Increase Decrease Increase Decrease
Discount rate (0.50% movement) (63.05) 68.33 43.70 46.77
Future salary growth (0.50% movement)
68.53 (63.79) 46.70 44.04
Attrition rate (0.50% movement)
Sensitivities due to mortality & withdrawals are not material & hence impact of change not calculated. Sensitivities as to rate of inflation, rate of increase of pensions in payment, rate of increase of pensions before retirement & life expectancy are not applicable being a lump sum benefit on retirement.
Although the analysis does not take account of the full distribution of cash flows expected under the plan, it does provide an approximation of the sensitivity of the assumptions shown.
Based on the actuarial valuation obtained in this respect, the following table sets out the status of the gratuity plan and the amounts recognised in the Company’s financial statements as at balance sheet date:
31 March 2018 31 March 2017 1 April 2016
Net defined benefit asset - -
Total employee benefit asset - - -
Net defined benefit liability
Liability for Gratuity 1407.46 1,278.47 999.93
Liability for Compensated absences 457.19 398.17 311.52
Total employee benefit liabilities 1,864.65 1,676.64 1,311.45Non-current:
Gratuity 1,266.07 1,113.20 865.23
Compensated absences 387.30 329.77 256.35
Current:
Gratuity 141.39 165.27 134.70
Compensated absences 69.89 68.40 55.17
Notes to the Standalone Financial Statements for the year ended 31st March, 2018(All amounts are in lakhs of Indian Rupees, unless otherwise stated)

124 Newgen Software Technologies Limited 125
29 Finance costs
For the year ended
31 March 2018
For the year ended
31 March 2017
Finance cost on finance lease obligations 205.49 240.16
Interest expense on packing credit 160.88 156.81
Other finance costs 79.03 128.63
Net loss on foreign currency transactions and translation* 75.28 -
520.68 525.60*To the extent considered as an adjustment to finance cost
30 Depreciation and amortization expense
For the year ended
31 March 2018
For the year ended
31 March 2017
Depreciation of property, plant and equipment (refer note 4) 1,514.62 1,204.80
Amortisation of intangible assets (refer note 5) 55.48 59.20
567.68 481.87
31 Other expenses
For the year ended
31 March 2018
For the year ended
31 March 2017
Rent 1,514.62 1,204.80
Repairs and maintenance 308.81 296.82
Rates and taxes 144.77 219.32
Travelling and conveyance 5,462.40 4,404.37
Legal and professional fees 1,846.20 1,378.72
Payment to auditors* 61.18 35.00
Electricity and water 329.93 307.78
Advertising and sales promotion 358.19 435.77
Membership and subscription fee 505.67 375.20
Brokerage and commission 605.53 483.41
Communication costs 365.95 324.12
Software and license maintenance 305.58 370.35
Expenditure on corporate social responsibility 107.31 105.09
Donation 32.00 28.20
Operation and maintenance 490.77 454.39
Printing and stationery 632.06 585.50
Loss on sale of property, plant and equipment 3.15 0.12
Property, plant and equipment written off - 0.59
Loss allowance on trade receivables 462.52 1,353.40
Loss allowance on other financial assets - 6.55
Security charges 200.79 156.24
Net foreign exchange fluctuation loss 1.95 189.47
Fair value changes of financial assets at FVTPL - 5.57
Miscellaneous expenses 503.77 451.22
14,243.15 13,172.00
Notes to the Standalone Financial Statements for the year ended 31st March, 2018(All amounts are in lakhs of Indian Rupees, unless otherwise stated)
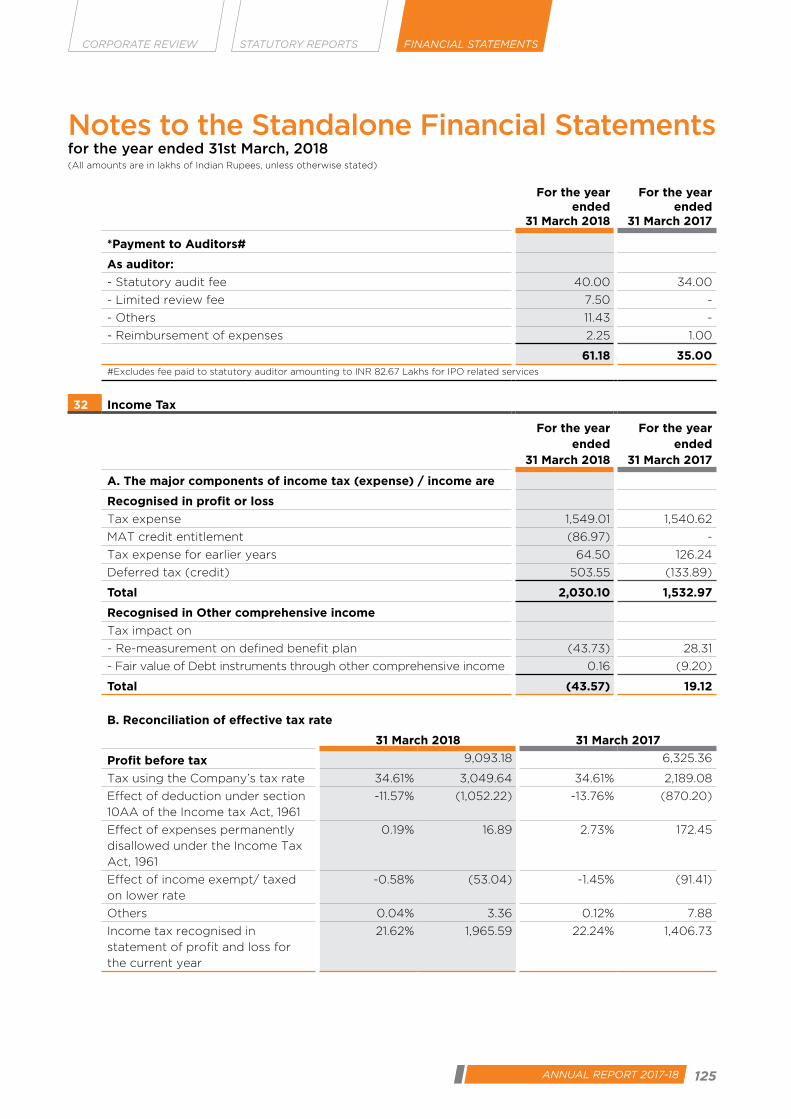
124 Newgen Software Technologies Limited 125ANNUAL REPORT 2017-18
CORPORATE REVIEW FINANCIAL STATEMENTSSTATUTORY REPORTS
For the year ended
31 March 2018
For the year ended
31 March 2017
*Payment to Auditors#
As auditor:
- Statutory audit fee 40.00 34.00
- Limited review fee 7.50 -
- Others 11.43 -
- Reimbursement of expenses 2.25 1.00
61.18 35.00#Excludes fee paid to statutory auditor amounting to INR 82.67 Lakhs for IPO related services
32 Income Tax
For the year ended
31 March 2018
For the year ended
31 March 2017
A. The major components of income tax (expense) / income are
Recognised in profit or loss
Tax expense 1,549.01 1,540.62
MAT credit entitlement (86.97) -
Tax expense for earlier years 64.50 126.24
Deferred tax (credit) 503.55 (133.89)
Total 2,030.10 1,532.97
Recognised in Other comprehensive income
Tax impact on
- Re-measurement on defined benefit plan (43.73) 28.31
- Fair value of Debt instruments through other comprehensive income 0.16 (9.20)
Total (43.57) 19.12
B. Reconciliation of effective tax rate
31 March 2018 31 March 2017
Profit before tax 9,093.18 6,325.36
Tax using the Company’s tax rate 34.61% 3,049.64 34.61% 2,189.08
Effect of deduction under section
10AA of the Income tax Act, 1961
-11.57% (1,052.22) -13.76% (870.20)
Effect of expenses permanently
disallowed under the Income Tax
Act, 1961
0.19% 16.89 2.73% 172.45
Effect of income exempt/ taxed
on lower rate
-0.58% (53.04) -1.45% (91.41)
Others 0.04% 3.36 0.12% 7.88
Income tax recognised in
statement of profit and loss for
the current year
21.62% 1,965.59 22.24% 1,406.73
Notes to the Standalone Financial Statements for the year ended 31st March, 2018(All amounts are in lakhs of Indian Rupees, unless otherwise stated)

126 Newgen Software Technologies Limited 127
C. Deferred tax assets (net)
Deferred tax relates to the following: As at 31 March 2018
As at 31 March 2017
As at 1 April 2016
Deferred tax related to items recognised in OCI:
Deferred tax assets (gross)Investments at fair value through OCI - - 1.17 Remeasurement of defined benefit liability (asset)
- 28.31 -
(a) - 28.31 1.17
Deferred tax liabilitiesInvestments at fair value through OCI 7.87 8.03 - Remeasurement of defined benefit liability (asset)
15.42 - -
(b) 23.29 8.03 - Deferred tax related to items recognised in statement of profit and loss:
Deferred tax liabilities (gross)Property, plant and equipment 251.36 314.72 300.22 Others 11.11 -
(c) 262.47 314.72 300.22
Deferred tax assets (gross)Others - 8.87 14.74 Loss allowance on other financial assets
42.63 42.64 42.73
Loss allowance on trade receivables 1,384.62 2,068.39 1,926.37 Derivative - - 46.00 Provision for employee benefits 667.62 530.78 472.45
(d) 2,094.87 2,650.68 2,502.29
(e) = (d) - (c)
1,832.40 2,335.96 2,202.07
Deferred tax assets (net) (a) + (e) - (b)
1,809.12 2,356.24 2,203.24
MAT credit entitlement 86.97 - 89.02
Total Deferred tax assets (net) 1,896.09 2,356.24 2,292.26
D. Movement in temporary differences
31 March 2018
Particulars Balance as at 1 April 2017
Recognised in profit or loss
during FY 2017-18
Recognised in OCI during FY 2017-18
Balance as at 31 March 2018
Investments at fair value through OCI
(8.03) - (0.16) (7.87)
Remeasurement of defined benefit liability (asset)
28.31 - 43.73 (15.42)
Property, plant and equipment (314.72) (63.36) - (251.36)Loss allowance on other financial assets
42.64 0.01 - 42.63
Loss allowance on trade receivables
2,068.39 683.77 - 1,384.62
Provision for employee benefits 530.78 (136.84) - 667.62 Others 8.87 19.97 - (11.11)
Total 2,356.24 503.55 43.57 1,809.12
Notes to the Standalone Financial Statements for the year ended 31st March, 2018(All amounts are in lakhs of Indian Rupees, unless otherwise stated)

126 Newgen Software Technologies Limited 127ANNUAL REPORT 2017-18
CORPORATE REVIEW FINANCIAL STATEMENTSSTATUTORY REPORTS
31 March 2017
Particulars Balance as at 1 April 2016
Recognised in profit or loss
during FY 2016-17
Recognised in OCI during FY 2016-17
Balance as at 31 March 2017
Investments at fair value through OCI
1.17 - (9.20) (8.03)
Remeasurement of defined benefit liability (asset)
- - 28.31 28.31
Derivative 46.00 (46.00) - Property, plant and equipment (300.22) (14.50) - (314.72)Loss allowance on other financial assets
42.73 (0.09) - 42.64
Loss allowance on trade receivables
1,926.37 142.02 - 2,068.39
Provision for employee benefits 472.45 58.33 - 530.78 Others 14.74 (5.87) - 8.87
Total 2,203.24 133.89 19.11 2,356.24
33 Earnings per share (EPS)
Basic EPS amounts are calculated by dividing the profit for the year attributable to equity holders
of the company by the weighted average number of equity shares outstanding during the year.
Diluted EPS amounts are calculated by dividing the profit attributable to equity holders of the company
by the weighted average number of equity shares outstanding during the year plus the weighted
average number of Equity shares that would be issued on conversion of all the dilutive potential equity
shares into equity shares.
i. Profit attributable to Equity holders of the Company
31 March 2018 31 March 2017
INR INR
Profit attributable to equity holders of the company 7,063.09 4,792.39
Profit attributable to equity holders of the company for basic and diluted earnings
7,063.09 4,792.39
ii. Weighted average number of ordinary shares
31 March 2018 31 March 2017
INR INR
Opening balance of equity’s shares 62,313,086 51,790,185
Conversion of convertible preference shares into equity shares - 10,294,230
Effect of equity shares issued through initial public offer 658,652 -
Effect of share options exercised 739,355 28,037
Weighted average number of shares for basic EPS 63,711,093 62,112,452
Effect of dilution:
Add: Equity shares held by Newgen ESOP Trust with respect to
options not exercised by employees but outstanding
1,633,736 1,337,237
Weighted average number of shares for diluted EPS 65,344,829 63,449,689
Basic and Diluted earnings per share
Notes to the Standalone Financial Statements for the year ended 31st March, 2018(All amounts are in lakhs of Indian Rupees, unless otherwise stated)
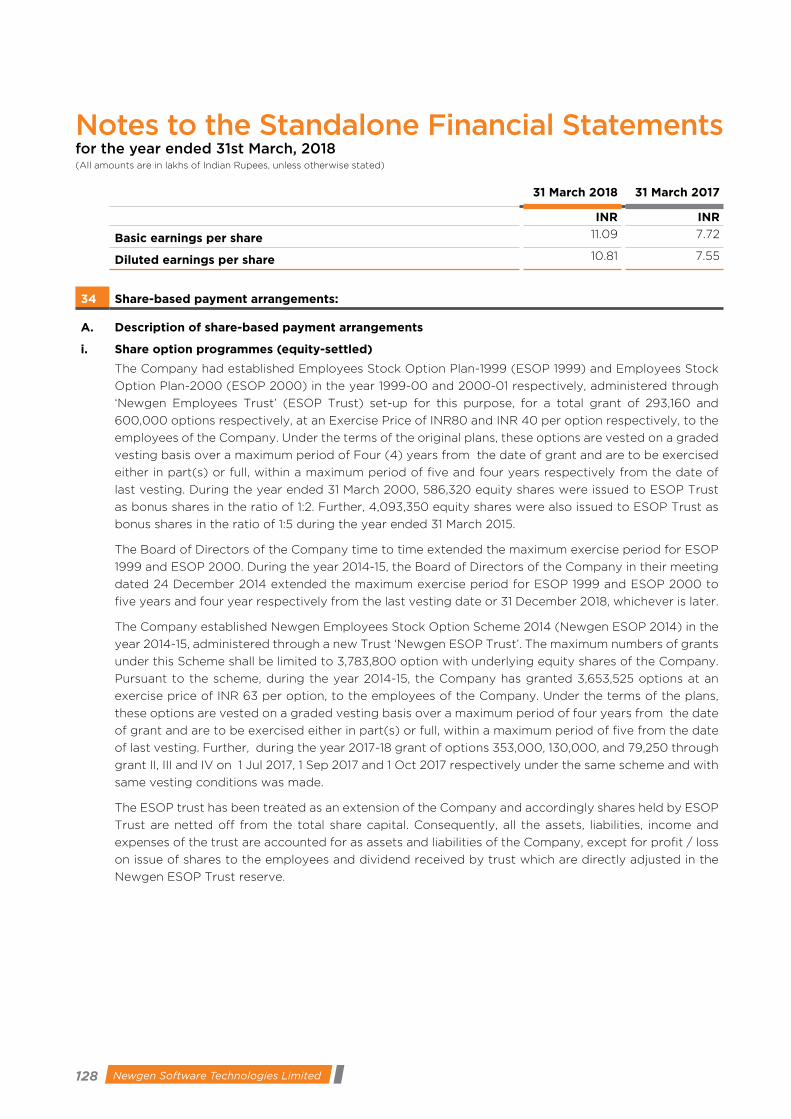
128 Newgen Software Technologies Limited 129
31 March 2018 31 March 2017
INR INR
Basic earnings per share 11.09 7.72
Diluted earnings per share 10.81 7.55
34 Share-based payment arrangements:
A. Description of share-based payment arrangements
i. Share option programmes (equity-settled)
The Company had established Employees Stock Option Plan-1999 (ESOP 1999) and Employees Stock
Option Plan-2000 (ESOP 2000) in the year 1999-00 and 2000-01 respectively, administered through
‘Newgen Employees Trust’ (ESOP Trust) set-up for this purpose, for a total grant of 293,160 and
600,000 options respectively, at an Exercise Price of INR80 and INR 40 per option respectively, to the
employees of the Company. Under the terms of the original plans, these options are vested on a graded
vesting basis over a maximum period of Four (4) years from the date of grant and are to be exercised
either in part(s) or full, within a maximum period of five and four years respectively from the date of
last vesting. During the year ended 31 March 2000, 586,320 equity shares were issued to ESOP Trust
as bonus shares in the ratio of 1:2. Further, 4,093,350 equity shares were also issued to ESOP Trust as
bonus shares in the ratio of 1:5 during the year ended 31 March 2015.
The Board of Directors of the Company time to time extended the maximum exercise period for ESOP
1999 and ESOP 2000. During the year 2014-15, the Board of Directors of the Company in their meeting
dated 24 December 2014 extended the maximum exercise period for ESOP 1999 and ESOP 2000 to
five years and four year respectively from the last vesting date or 31 December 2018, whichever is later.
The Company established Newgen Employees Stock Option Scheme 2014 (Newgen ESOP 2014) in the
year 2014-15, administered through a new Trust ‘Newgen ESOP Trust’. The maximum numbers of grants
under this Scheme shall be limited to 3,783,800 option with underlying equity shares of the Company.
Pursuant to the scheme, during the year 2014-15, the Company has granted 3,653,525 options at an
exercise price of INR 63 per option, to the employees of the Company. Under the terms of the plans,
these options are vested on a graded vesting basis over a maximum period of four years from the date
of grant and are to be exercised either in part(s) or full, within a maximum period of five from the date
of last vesting. Further, during the year 2017-18 grant of options 353,000, 130,000, and 79,250 through
grant II, III and IV on 1 Jul 2017, 1 Sep 2017 and 1 Oct 2017 respectively under the same scheme and with
same vesting conditions was made.
The ESOP trust has been treated as an extension of the Company and accordingly shares held by ESOP
Trust are netted off from the total share capital. Consequently, all the assets, liabilities, income and
expenses of the trust are accounted for as assets and liabilities of the Company, except for profit / loss
on issue of shares to the employees and dividend received by trust which are directly adjusted in the
Newgen ESOP Trust reserve.
Notes to the Standalone Financial Statements for the year ended 31st March, 2018(All amounts are in lakhs of Indian Rupees, unless otherwise stated)
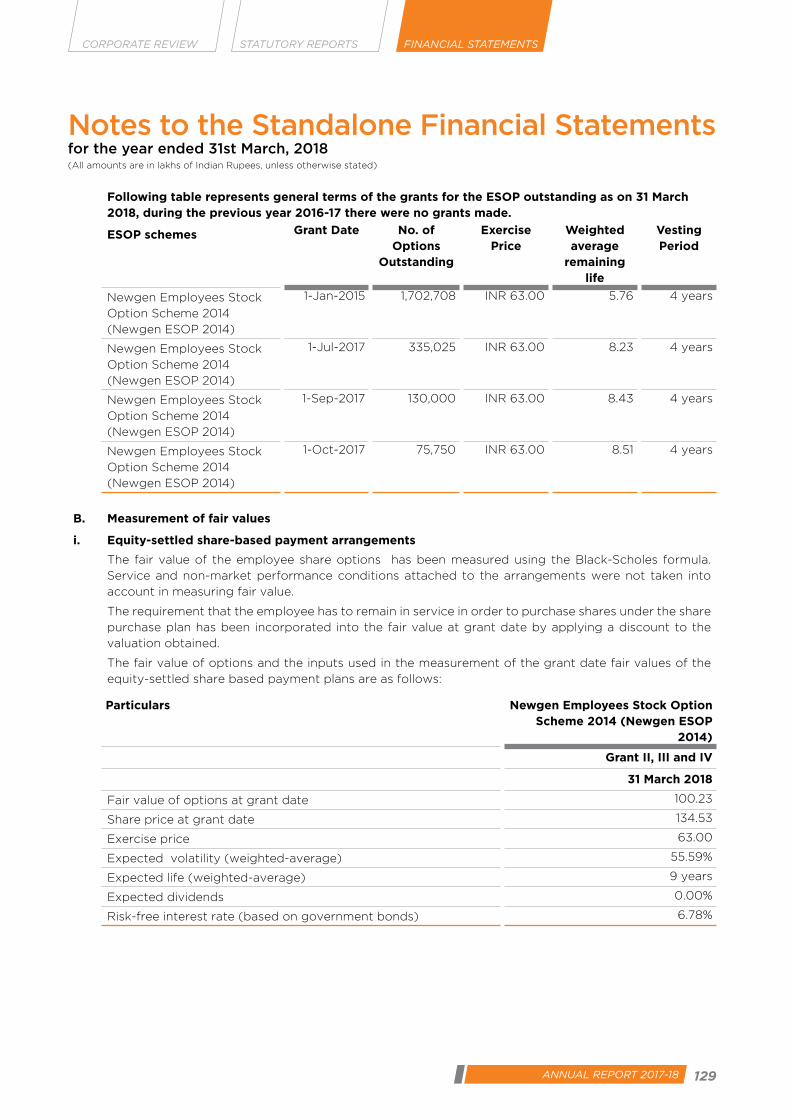
128 Newgen Software Technologies Limited 129ANNUAL REPORT 2017-18
CORPORATE REVIEW FINANCIAL STATEMENTSSTATUTORY REPORTS
Following table represents general terms of the grants for the ESOP outstanding as on 31 March 2018, during the previous year 2016-17 there were no grants made.
ESOP schemes Grant Date No. of Options
Outstanding
Exercise Price
Weighted average
remaining life
Vesting Period
Newgen Employees Stock
Option Scheme 2014
(Newgen ESOP 2014)
1-Jan-2015 1,702,708 INR 63.00 5.76 4 years
Newgen Employees Stock
Option Scheme 2014
(Newgen ESOP 2014)
1-Jul-2017 335,025 INR 63.00 8.23 4 years
Newgen Employees Stock
Option Scheme 2014
(Newgen ESOP 2014)
1-Sep-2017 130,000 INR 63.00 8.43 4 years
Newgen Employees Stock
Option Scheme 2014
(Newgen ESOP 2014)
1-Oct-2017 75,750 INR 63.00 8.51 4 years
B. Measurement of fair values
i. Equity-settled share-based payment arrangements
The fair value of the employee share options has been measured using the Black-Scholes formula.
Service and non-market performance conditions attached to the arrangements were not taken into
account in measuring fair value.
The requirement that the employee has to remain in service in order to purchase shares under the share
purchase plan has been incorporated into the fair value at grant date by applying a discount to the
valuation obtained.
The fair value of options and the inputs used in the measurement of the grant date fair values of the
equity-settled share based payment plans are as follows:
Particulars Newgen Employees Stock Option Scheme 2014 (Newgen ESOP
2014)
Grant II, III and IV
31 March 2018
Fair value of options at grant date 100.23
Share price at grant date 134.53
Exercise price 63.00
Expected volatility (weighted-average) 55.59%
Expected life (weighted-average) 9 years
Expected dividends 0.00%
Risk-free interest rate (based on government bonds) 6.78%
Notes to the Standalone Financial Statements for the year ended 31st March, 2018(All amounts are in lakhs of Indian Rupees, unless otherwise stated)

130 Newgen Software Technologies Limited 131
Notes to the Standalone Financial Statements for the year ended 31st March, 2018(All amounts are in lakhs of Indian Rupees, unless otherwise stated)
C. Reconciliation of outstanding share options
The number and weighted-average exercise prices of share options under the share option programmes
were as follows.
Employees Stock Option Plan-1999 (ESOP 1999)
Number of options
Weighted average exercise
price
Number of options
Weighted average exercise
price
Number of options
Weighted average exercise
price31 March
201831 March
201831 March
201731 March
20171 April 2016
1 April 2016
Options outstanding as
at the beginning of the
year
52,600 INR 4.45 57,600 INR 4.45 57,600 INR 4.45
Add: Options granted
during the year
- - - - - -
Less: Options lapsed
during the year
- - - - - -
Less: Options exercised
during the year
52,600 INR 4.45 5,000 INR 4.45 - -
Options outstanding as
at the year end
- INR 4.45 52,600 INR 4.45 57,600 INR 4.45
Exercisable as at year
end
- 52,600 57,600
Weighted - average
contractual life
- 1.75 Years 2.75 Years
Employees Stock Option Plan-2000 (ESOP 2000)
Number of options
Weighted average exercise
price
Number of options
Weighted average exercise
price
Number of options
Weighted average exercise
price31 March
201831 March
201831 March
201731 March
20171 April 2016
1 April 2016
Options outstanding as
at the beginning of the
year
386,700 INR 6.67 483,800 INR 6.67 678,180 INR 6.67
Add: Options granted
during the year
- - - - - -
Less: Options lapsed
during the year
- - 30,000 INR 6.67 9,600 INR 6.67
Less: Options exercised
during the year
386,700 INR 6.67 67,100 INR 6.67 184,780 INR 6.67
Options outstanding as
at the year end
- INR 6.67 386,700 INR 6.67 483,800 INR 6.67
Exercisable as at year
end
- 386,700 483,800
Weighted - average
contractual life
- 2.09 years 3.11 years

130 Newgen Software Technologies Limited 131ANNUAL REPORT 2017-18
CORPORATE REVIEW FINANCIAL STATEMENTSSTATUTORY REPORTS
Newgen Employees Stock Option Scheme 2014 (Newgen ESOP 2014)
Number of options
Weighted average exercise
price
Number of options
Weighted average exercise
price
Number of options
Weighted average exercise
price31 March
201831 March
201831 March
201731 March
20171 April 2016
1 April 2016
Options outstanding as
at the beginning of the
year
3,061,209 INR 63.00 3,384,305 INR 63.00 3,653,525 INR 63.00
Add: Options granted
during the year
562,550 INR 63.00 - - - -
Less: Options lapsed
during the year
126,096 INR 63.00 166,525 INR 63.00 213,175 INR 63.00
Less: Options exercised
during the year
1,254,180 INR 63.00 156,571 INR 63.00 56,045 INR 63.00
Options outstanding as
at the year end
2,243,483 INR 63.00 3,061,209 INR 63.00 3,384,305 INR 63.00
Exercisable as at year
end
445,616 777,170 288,188
Weighted - average
contractual life
6.38 years 6.76 years 7.76 years
C. Expense recognised in statement of profit and loss For details on the employee benefits expense, refer note 28
35 Operating leases
A. Leases as lessee
a) The Company has taken various cancellable and non-cancellable leases for office premises and
residential accommodation for some of its employees. The amount recognised in prefit and loss and
future minimum lease payments and payment profile of non-cancellable operating leases are as under:
i. Future minimum lease payments
The future minimum lease payments under non-cancellable leases were receivable as follows.
31 March 2018 31 March 2017 1 April 2016
Less than one year 1,150.13 1,024.35 934.97
Between one and five years 1,732.52 2,113.83 2,236.27
More than five years - - -
2,882.65 3,138.17 3,171.24
ii. Amounts recognised in profit or loss
31 March 2018 31 March 2017
Lease expense 1,514.62 1,204.80
1,514.62 1,204.80
Notes to the Standalone Financial Statements for the year ended 31st March, 2018(All amounts are in lakhs of Indian Rupees, unless otherwise stated)

132 Newgen Software Technologies Limited 133
36 Contingent liabilities and commitments (to the extent not provided for)
31 March 2018 31 March 2017 1 April 2016
a. Estimated amount of contracts remaining to be
executed on capital account and not provided for
net of advances, tangible assets
759.70 1,733.00 574.98
1. For other commitments – Non-cancellable operating, and finance leases, refer Note 35 and 18
respectively
2. The Company is committed to operationally, technically and financially support the operations of its
certain subsidiary companies.
37 Details of dues to Micro, Small and Medium Enterprises as defined under the MSMED Act, 2006
The Ministry of Micro, Small and Medium Enterprises has issued an Office Memorandum dated 26 August
2008 which recommends that the Micro and Small Enterprises should mention in their correspondence
with its customers the Entrepreneurs Memorandum Number as allocated after filing of the Memorandum.
Accordingly, the disclosure in respect of the amounts payable to such enterprises as on 28 February
2018 and 31 March 2017 has been made in the financial statements based on information received and
available with the Company. Based on the information currently available with the Company, there are
no dues payable to Micro and Small Suppliers as defined in the Micro, Small and Medium Enterprises
Development Act, 2006.
38 After the reporting date the following dividend were proposed by the Board of Directors, subject to
the approval of shareholders at Annual General Meeting; Accordingly, the dividends have not been
recognised as liabilities. Dividends would attract corporate dividend tax when declared.
Particulars For the year ended
31 March 2018
For the year ended
31 March 2017
Final dividend of INR 2.00 per share (31 March 2017: INR 1.5/-) 1,384.71 964.62
Corporate dividend tax 283.94 196.37
39 Utilization of CSR expenses
As per Section 135 of the Companies Act 2013, the following is the detail of corporate social responsibility
expenses incurred by the Company: Gross amount to be spent by the Company during the year ended
31 March 2018 is INR 106.13 lakhs (previous year INR. 97.05 lakhs). Amount spent during the year ended
31 March 2018:
Particulars Paid Liability yet to be paid
Total
i) For purpose mentioned as under 104.31 3.00 107.31
The areas for CSR activities are promoting education, health care, sanitation, digital literacy and
livelihood enhancement and participation on SOS Children’s Village Projects in Faridabad. The funds
were primarily utilized through the year on the following activities which are specified in Schedule VII
of the Companies Act, 2013.
Notes to the Standalone Financial Statements for the year ended 31st March, 2018(All amounts are in lakhs of Indian Rupees, unless otherwise stated)

132 Newgen Software Technologies Limited 133ANNUAL REPORT 2017-18
CORPORATE REVIEW FINANCIAL STATEMENTSSTATUTORY REPORTS
40 The Company has established a comprehensive system of maintenance of information and documents
as required by the transfer pricing legislation under sections 92-92F of the Income-tax Act, 1961. Since
the law requires existence of such information and documentation to be contemporaneous in nature,
the Company has got the updated documentation for the international transactions entered into with
the associated enterprises during the financial year. Accordingly, the management believes that there
has been no change in the nature of its international transactions with the associated enterprises during
the year ended 31 March 2018 and 31 March 2017. Further, the management is of the opinion that its
international transactions are at arm’s length so that the aforesaid legislation will not have any impact
on the financial statements, particularly on the amount of tax expense and that of provision for taxation.
41 During the year ended 31 March 2018, the Company completed the initial public offer (IPO), pursuant to
which 17,331,483 equity shares of INR 10 each were allotted/allocated, at an issue price of INR 245 each,
consisting of fresh issue of 3,877,551 equity shares and an offer for sale of 13,453,932 equity shares by
selling shareholders. The equity shares of the Company were listed on National Stock Exchange of India
Limited (NSE) via ID NEWGEN and BSE Limited (BSE) via ID 540900 on 29 January 2018.
42 Expenses incurred by the Company aggregating to INR 2,627.44 Lakhs in connection with the IPO
have been partly adjusted towards the securities premium account and partly recovered from the
selling shareholders. The IPO expenses amounting to INR 1,646.71 (excluding certain expenses which are
directly attributable to the Company such as legal counsel cost, auditor fee, listing fee, advertisement
& marketing expenses and depository fees amounting to INR 980.73 Lakhs), have been allocated
between the Company and each of the selling shareholders in proportion to the equity shares allotted
to the public as fresh issue by the Company and under offer for sale by the existing shareholders and
the total amount charged in securities premium is INR 1,349.15 Lakhs.
43 During the year ended 31 March 2018, the Company has completed the Initial Public offer, pursuant to
which 17,331,483 equity shares having a face value of Rs. 10 each were allotted/allocated, at an issue
price of Rs. 245 per equity share, consisting of fresh issue of 3,877,551 equity shares and an offer for sale
of 13,453,932 equity shares by selling shareholders. The gross proceeds of fresh issue of equity shares
from IPO amounts to Rs. 9,500.00 lakhs. The Company’s share of fresh issue related expenses is Rs
1,349.15 lakhs, which has been adjusted against Securities Premium. As at 31 March 2018, the proceeds
are unutilised and have been temporarily invested/ deposited in cash and cash equivalents including
fixed deposits and bank account (Refer note 13).
44 Dividend remittances in foreign currency:
Particulars For the year ended
31 March 2018
For the year ended
31 March 2017
Year to which the dividend relates 2016-17 2015-16
Amount remitted during the year (INR in lakhs) 77.21 51.78
Number of non-resident shareholders 2 2
Number of shares on which dividend was due 5,147,340 5,147,340
Notes to the Standalone Financial Statements for the year ended 31st March, 2018(All amounts are in lakhs of Indian Rupees, unless otherwise stated)

134 Newgen Software Technologies Limited 135
45 Details of current Investments (refer note 11)
Particulars Number of Units as at Amount in Lakhs as at31 March
201831 March
20171 April 2016
31 March 2018
31 March 2017
1 April 2016
Investment in debt mutual funds
Reliance Short Term
Fund- Direct Growth
Plan
634,842 - - 213.85 - -
ICICI Prudential Short
Term Plan
860,077 - - 322.56 - -
IIFL Dynamic Bond
Fund
1,442,783 - - 200.83 - -
Franklin Templeton MF 11,122 - - 425.20 - -
Aditya BSL MF 3,202,906 - - 426.14 - -
ICICI Prudential MF 2,185,596 - - 425.63 - -
UTI Income
Opportunities Fund -
Direct Plan-Growth
2,617,879 - - 442.00 - -
Kotak Income
Opportunities Fund-
Monthly Growth
2,194,751 - - 440.56 - -
L&T Income
Opportunities Fund
Direct Plan-Growth
2,157,674 - - 439.81 - -
Tata Short Term Fund - 1,273,800 - - 401.05 -
Reliance Short Term
Fund
- 634,842 - - 200.61 -
UTI Short Term Income
Fund
- 1,974,451 - - 401.27 -
ICICI Prudential Short
Term Plan
- 860,077 - - 301.29 -
UTI Income
Opportunities Fund
- 3,748,856 - - 420.28 -
Kotak Income
Opportunities Fund
- 3,948,263 - - 419.36 -
BNP Paribas Medium
Term Income Fund
- 4,137,952 - - 413.80 -
L&T Income
Opportunities Fund
Direct Plan
- 3,734,193 - - 419.20 -
IIFL Cash Opportunities
Fund
- 1,817,389 - - 206.40 -
HSBC Income Fund -
Short Term Plan
- - 784,326 - - 200.42
BNP Paribas Flexi Debt
Fund
- - 770,208 - - 200.57
Notes to the Standalone Financial Statements for the year ended 31st March, 2018(All amounts are in lakhs of Indian Rupees, unless otherwise stated)

134 Newgen Software Technologies Limited 135ANNUAL REPORT 2017-18
CORPORATE REVIEW FINANCIAL STATEMENTSSTATUTORY REPORTS
Particulars Number of Units as at Amount in Lakhs as at31 March
201831 March
20171 April 2016
31 March 2018
31 March 2017
1 April 2016
Birla Sun Life Dynamic
Bond Fund
- - 1,694,757 - - 450.55
Reliance Regular
Savings Fund
- - 970,116 - - 200.33
Kotak Bond Fund-
Growth
- - 465,943 - - 200.46
UTI Bond Fund -Growth - - 441,319 - - 200.60
IDFC Dynamic Bond
Fund
- - 1,366,352 - - 250.88
Investment in arbitrage funds
HDFC Balanced Fund - - 413,056 - - 439.23
Tata Balanced Fund - - 259,035 - - 423.85
DSP BR Balanced Fund - - 413,307 - - 440.03
ICICI Prudential Equity
Income Fund
- - 3,417,969 - - 355.13
ICICI Prudential
Balanced Advantage
Fund
- - 1,374,705 - - 352.47
JPMorgan India Equity
Income Fund
- - 3,285,737 - - 356.43
Investment in government bonds
8.40% Indian Railway
Finance Corporation
Limited
40,000 40,000 40,000 466.42 468.74 445.20
7.35% NHAI 2031 (Int
Pyt date 1Apr)
45,000 45,000 492.61 502.36
Investment in Other Bonds
IIFL SUB DEBT 9.25% 20 220.42
IIFL Perpetual Debt
Product
200 204.95
11% Bank of India
Perpetual Bond
10 10 99.83 104.62
10.40% Vijaya Bank
Perpetual Bond (int pyt
date 31Mar)
40 40 406.21 402.12
5,022.07 4,866.04 4,516.14
Notes to the Standalone Financial Statements for the year ended 31st March, 2018(All amounts are in lakhs of Indian Rupees, unless otherwise stated)

136 Newgen Software Technologies Limited 137
46 Related party transactions
A. List of subsidiaries
Set out below is the list of subsidiaries:
Name of the company Country of incorporation
Ownership interest
31 March 2018 31 March 2017 1 April 2016
Newgen Software Inc. United States
of America
100% 100% 100%
Newgen Software Technologies
Pte Ltd.
Singapore 100% 100% 100%
Newgen Software Canada Ltd. Canada 100% 100% 100%Newgen Software Technologies
(UK) Ltd.
United
Kingdom
100% 100% -
Newgen Computers
Technologies Limited
India 100% 100% 100%
The principal place of business of all the entities listed above is the same as the respective country of
incorporation.
B. Transactions with Key Management Personnel
A number of key management personnel, or their related parties hold positions in other entities that
result in them having control or significant influence over those entities.
Compensation of the Company’s key managerial personnel includes salaries, non-cash benefits and
contributions to post - employment defined benefit plan(see note 28)
Executive officers also participate in the Company’s share option plan as per the conditions laid down
in that scheme (see note 28 and note 34).
List of key management personnel and their relativesDiwakar Nigam - Managing Director
T.S. Varadarajan - Whole Time Director
Priyadarshini Nigam - Whole Time Director
Arun Kumar Gupta - Chief Financial Officer
Virender Jeet - Senior Vice President (Sales and Marketing/Product)
Surender Jeet Raj - Senior Vice President (HR/Operations)
Tarun Nandwani - Vice President (Customer Relations/Delivery)
Usha Varadarajan - Relative of Whole Time Director - T.S. Varadarajan
Shubhi Nigam - Relative of Managing Director
Key management personnel compensation
Transaction value Balance payableFor the year
ended 31 March 2018
For the year ended 31
March 2017
31 March 2018 31 March 2017 1 April 2016
Salaries, wages and
bonus*
758.51 475.71 261.39 23.64 17.53
Diwakar Nigam 160.35 85.37 8.24 5.02 6.07T.S. Varadarajan 76.32 42.33 4.53 2.37 2.82Priyadarshini Nigam 39.28 30.64 2.79 1.79 2.16Arun Kumar Gupta 75.88 53.46 26.93 2.20 0.54Virender Jeet 150.19 91.01 82.59 4.39 2.78Surender Jeet Raj 134.22 85.84 70.59 4.14 3.09Tarun Nandwani 121.41 74.59 65.72 3.73 0.07Shubhi Nigam 0.87 12.47 - - -
Notes to the Standalone Financial Statements for the year ended 31st March, 2018(All amounts are in lakhs of Indian Rupees, unless otherwise stated)
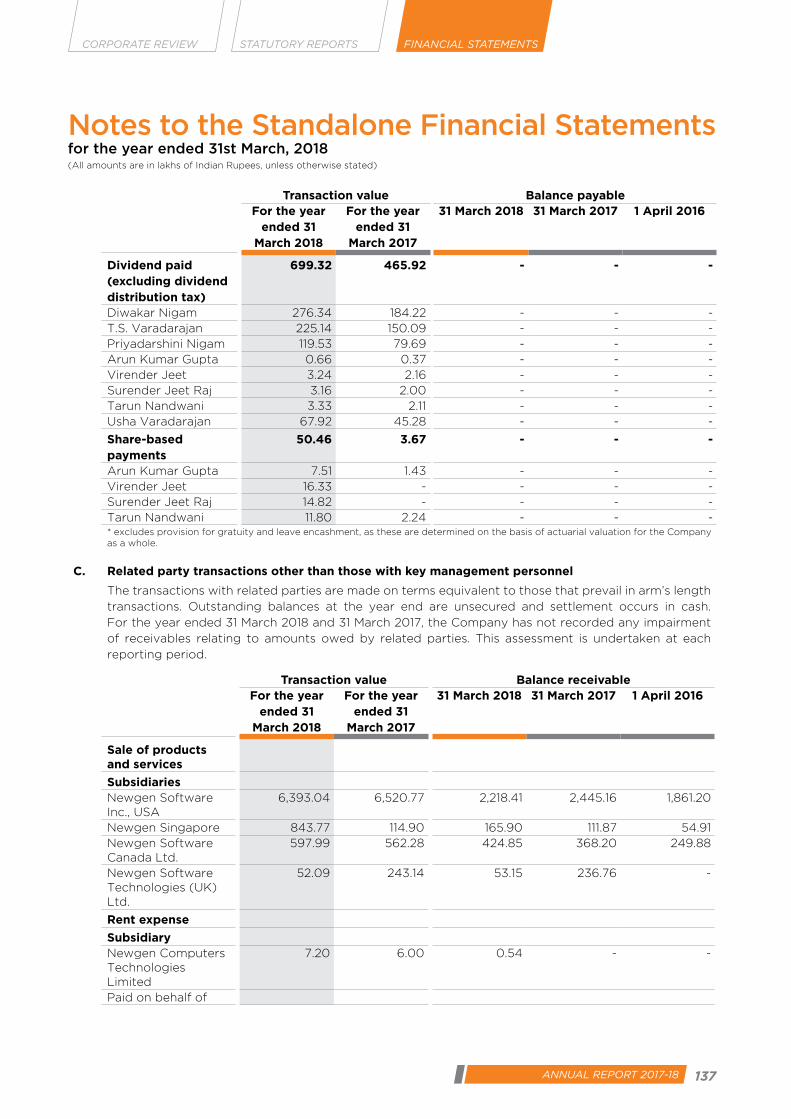
136 Newgen Software Technologies Limited 137ANNUAL REPORT 2017-18
CORPORATE REVIEW FINANCIAL STATEMENTSSTATUTORY REPORTS
Transaction value Balance payableFor the year
ended 31 March 2018
For the year ended 31
March 2017
31 March 2018 31 March 2017 1 April 2016
Dividend paid (excluding dividend distribution tax)
699.32 465.92 - - -
Diwakar Nigam 276.34 184.22 - - -T.S. Varadarajan 225.14 150.09 - - -Priyadarshini Nigam 119.53 79.69 - - -Arun Kumar Gupta 0.66 0.37 - - -Virender Jeet 3.24 2.16 - - -Surender Jeet Raj 3.16 2.00 - - -Tarun Nandwani 3.33 2.11 - - -Usha Varadarajan 67.92 45.28 - - -
Share-based payments
50.46 3.67 - - -
Arun Kumar Gupta 7.51 1.43 - - -Virender Jeet 16.33 - - - -Surender Jeet Raj 14.82 - - - -Tarun Nandwani 11.80 2.24 - - -* excludes provision for gratuity and leave encashment, as these are determined on the basis of actuarial valuation for the Company as a whole.
C. Related party transactions other than those with key management personnel
The transactions with related parties are made on terms equivalent to those that prevail in arm’s length
transactions. Outstanding balances at the year end are unsecured and settlement occurs in cash.
For the year ended 31 March 2018 and 31 March 2017, the Company has not recorded any impairment
of receivables relating to amounts owed by related parties. This assessment is undertaken at each
reporting period.
Transaction value Balance receivableFor the year
ended 31 March 2018
For the year ended 31
March 2017
31 March 2018 31 March 2017 1 April 2016
Sale of products and services
SubsidiariesNewgen Software Inc., USA
6,393.04 6,520.77 2,218.41 2,445.16 1,861.20
Newgen Singapore 843.77 114.90 165.90 111.87 54.91Newgen Software Canada Ltd.
597.99 562.28 424.85 368.20 249.88
Newgen Software Technologies (UK) Ltd.
52.09 243.14 53.15 236.76 -
Rent expense
SubsidiaryNewgen Computers Technologies Limited
7.20 6.00 0.54 - -
Paid on behalf of
Notes to the Standalone Financial Statements for the year ended 31st March, 2018(All amounts are in lakhs of Indian Rupees, unless otherwise stated)

138 Newgen Software Technologies Limited 139
Transaction value Balance receivableFor the year
ended 31 March 2018
For the year ended 31
March 2017
31 March 2018 31 March 2017 1 April 2016
SubsidiaryNewgen Computers Technologies Limited
0.65 0.63 - - -
Recovered from
SubsidiaryNewgen Computers Technologies Limited
0.65 0.63 - - -
Investment in subsidiaries - share based paymentNewgen Software Inc., USA
7.17 6.25 - - -
Newgen Singapore 2.15 0.24 - - -Newgen Software Canada Ltd.
0.54 0.86 - - -
Newgen Software Technologies (UK) Ltd.
0.23 0.36 - - -
D. Investment in subsidiaries
Subsidiary Company 31 March 2018 31 March 2017 1 April 2016
Newgen Software Inc. USA 522.52 515.35 509.82
Newgen Software Technologies Canada, Ltd. 56.40 55.86 55.00
Newgen Software Technologies Pte. Ltd. 114.12 111.97 111.73
Newgen Computers Technologies Limited 46.50 46.50 46.50
Newgen Software Technologies (UK) Ltd. 178.65 178.43 -
918.19 908.11 723.05
47 Financial instruments – Fair values and risk management
i. Accounting classification and fair valuesThe following table shows the carrying amounts and fair value of financial assets and financial liabilities, including their levels in the fair value hirarchy.
31 March 2018 Note Carrying amount Fair value
FVTPL FVTOCI Amortised Cost
Total Level 1 Level 2 Level 3 Total
Financial assets
Financial assets measured at fair valueInvestments in debt mutual funds
11 3,336.58 - - 3,336.58 3,336.58 - - 3,336.58
Investments in bonds 11 - 1,685.49 - 1,685.49 1,685.49 - - 1,685.49
Financial assets not measured at fair valueOther non-current financial asset
8 - - 548.53 548.53 - - - -
Trade receivables 12 - - 20,392.66 20,392.66 - - - -Cash and cash equivalents 13 - - 13,520.79 13,520.79 - - - -Loans 7 and
14- - 582.06 582.06 - - - -
Notes to the Standalone Financial Statements for the year ended 31st March, 2018(All amounts are in lakhs of Indian Rupees, unless otherwise stated)

138 Newgen Software Technologies Limited 139ANNUAL REPORT 2017-18
CORPORATE REVIEW FINANCIAL STATEMENTSSTATUTORY REPORTS
31 March 2018 Note Carrying amount Fair value
FVTPL FVTOCI Amortised Cost
Total Level 1 Level 2 Level 3 Total
Other financial assets 15 - - 5,177.19 5,177.19 - - - -
3,336.58 1,685.49 40,221.23 45,243.30 5,022.07 - - 5,022.07
Financial liabilities
Financial laibilities not measured at fair valueLong-term maturities of finance lease obligations (secured)
19 - - 1,316.66 1,316.66 - 1,316.66 - 1,316.66
Short term borrowings 21 - - 4,946.27 4,946.27 - 4,946.27 - 4,946.27Trade payables 22 - - 2,143.75 2,143.75 - - - -Other financial liabilities 23 - - 3,575.91 3,575.91 - 302.25 - 302.25
- - 11,982.59 11,982.59 - 6,565.18 - 6,565.18
Carrying amount Fair value
31 March 2017 Note FVTPL FVTOCI Amortised Cost
Total Level 1 Level 2 Level 3 Total
Financial assets
Financial assets measured at fair valueInvestments in debt mutual funds
11 3,183.25 - - 3,183.25 3,183.25 - - 3,183.25
Investments in bonds
11 - 1,682.79 - 1,682.79 1,682.79 - - 1,682.79
Financial assets not measured at fair valueOther non-current financial asset
8 - - 227.71 227.71 - - - -
Trade receivables 12 - - 18,588.04 18,588.04 - - - -Cash and cash equivalents
13 - - 2,818.68 2,818.68 - - - -
Loans 7 and 14
- - 295.75 295.75 - - - -
Other financial assets
15 - - 2,609.39 2,609.39 - - - -
3,183.25 1,682.79 24,539.57 29,405.61 4,866.04 - - 4,866.04
Carrying amount Fair value
31 March 2017 Note FVTPL FVTOCI Amotised
Cost
Total Level 1 Level 2 Level 3 Total
Financial liabilities
Financial liabilities not
measured at fair value
- -
Long-term maturities of finance
lease obligations (secured)
18 - - 1,617.99 1,617.99 - 1,617.99 1,617.99
Short term borrowings 21 - - 5,226.18 5,226.18 - 5,226.18 - 5,226.18
Trade payables 22 - - 1,714.52 1,714.52 - - - -
Other financial liabilities 23 - - 2,869.36 2,869.36 - 302.25 - 302.25
- - 11,428.05 11,428.05 - 7,146.42 - 7,146.42
Notes to the Standalone Financial Statements for the year ended 31st March, 2018(All amounts are in lakhs of Indian Rupees, unless otherwise stated)

140 Newgen Software Technologies Limited 141
Carrying amount Fair value
1 April 2016 FVTPL FVTOCI Amortised Cost
Total Level 1 Level 2 Level 3 Total
Financial assets
Financial assets measured at fair value
Investments in debt mutual funds
11 1,703.81 - - 1,703.81 1,703.81 - - 1,703.81
Investments in arbitrage funds
11 2,367.13 - - 2,367.13 2,367.13 - - 2,367.13
Investments in bonds 11 - 445.20 - 445.20 445.20 - - 445.20
Financial assets not measured at fair value
Other Non-current financial asset
169.79 169.79 - - - -
Trade receivables 12 - - 15,575.18 15,575.18 - - - -
Cash and cash equivalent
13 - - 2,083.99 2,083.99 - - - -
Loans 7 and 14 - - 229.89 229.89 - - - -
Other financial assets 15 - - 2,419.49 2,419.49 - - - -
4,070.94 445.20 20,478.34 24,994.48 4,516.14 - - 4,516.14
Financial liabilities
Financial liabilities measured at fair value
Derivative liability 19 136.00 - - 136.00 - - 136.00 136.00
Financial liabilities not measured at fair value
Long-term maturities of finance lease obligations (secured)
18 - - 1,917.45 1,917.45 - 1,917.45 - 1,917.45
Short term borrowings 21 - - 5,883.19 5,883.19 - 5,883.19 - 5,883.19
Trade payables 22 - - 1,405.47 1,405.47 - - - -
Other financial liabilities
23 - - 2,046.76 2,046.76 - 315.25 - 315.25
136.00 - 11,252.88 11,388.88 - 8,115.89 136.00 8,251.89
The fair value of trade receivables, cash and cash equivalents, other bank balances, other current financial
assets, current borrowings, trade payables and other current financial liabilities approximate their carrying
amounts, due to their short-term nature. Fair value of bank deposits included in non-current other financial
assets are equivalent to their carrying amount, as the interest rate on them is equivalent to market rate.
ii) Measurement of fair values
All assets and liabilities for which fair value is measured or disclosed in the financial statements are
categorised within the fair value hierarchy, described as follows, based on the lowest level input that is
significant to the fair value measurement as a whole:
Level 1 — Quoted (unadjusted) market prices in active markets for identical assets or liabilities
Level 2 — Valuation techniques for which the lowest level input that is significant to the fair value measurement is
directly or indirectly observable inputs
Level 3 — Valuation techniques for which the lowest level input that is significant to the fair value
measurement is unobservable
Notes to the Standalone Financial Statements for the year ended 31st March, 2018(All amounts are in lakhs of Indian Rupees, unless otherwise stated)
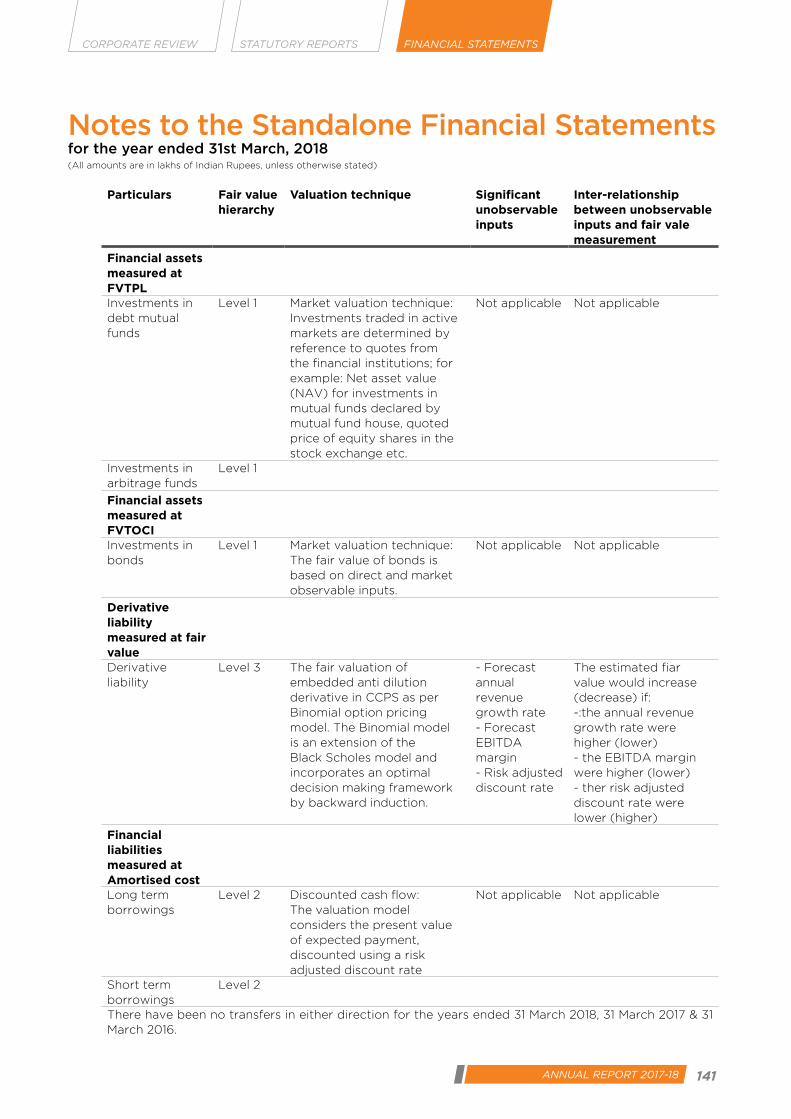
140 Newgen Software Technologies Limited 141ANNUAL REPORT 2017-18
CORPORATE REVIEW FINANCIAL STATEMENTSSTATUTORY REPORTS
Particulars Fair value hierarchy
Valuation technique Significant unobservable inputs
Inter-relationship between unobservable inputs and fair vale measurement
Financial assets measured at FVTPLInvestments in debt mutual funds
Level 1 Market valuation technique: Investments traded in active markets are determined by reference to quotes from the financial institutions; for example: Net asset value (NAV) for investments in mutual funds declared by mutual fund house, quoted price of equity shares in the stock exchange etc.
Not applicable Not applicable
Investments in arbitrage funds
Level 1
Financial assets measured at FVTOCIInvestments in bonds
Level 1 Market valuation technique: The fair value of bonds is based on direct and market observable inputs.
Not applicable Not applicable
Derivative liability measured at fair valueDerivative liability
Level 3 The fair valuation of embedded anti dilution derivative in CCPS as per Binomial option pricing model. The Binomial model is an extension of the Black Scholes model and incorporates an optimal decision making framework by backward induction.
- Forecast annual revenue growth rate - Forecast EBITDA margin - Risk adjusted discount rate
The estimated fiar value would increase (decrease) if: -:the annual revenue growth rate were higher (lower) - the EBITDA margin were higher (lower) - ther risk adjusted discount rate were lower (higher)
Financial liabilities measured at Amortised costLong term borrowings
Level 2 Discounted cash flow: The valuation model considers the present value of expected payment, discounted using a risk adjusted discount rate
Not applicable Not applicable
Short term borrowings
Level 2
There have been no transfers in either direction for the years ended 31 March 2018, 31 March 2017 & 31 March 2016.
Notes to the Standalone Financial Statements for the year ended 31st March, 2018(All amounts are in lakhs of Indian Rupees, unless otherwise stated)
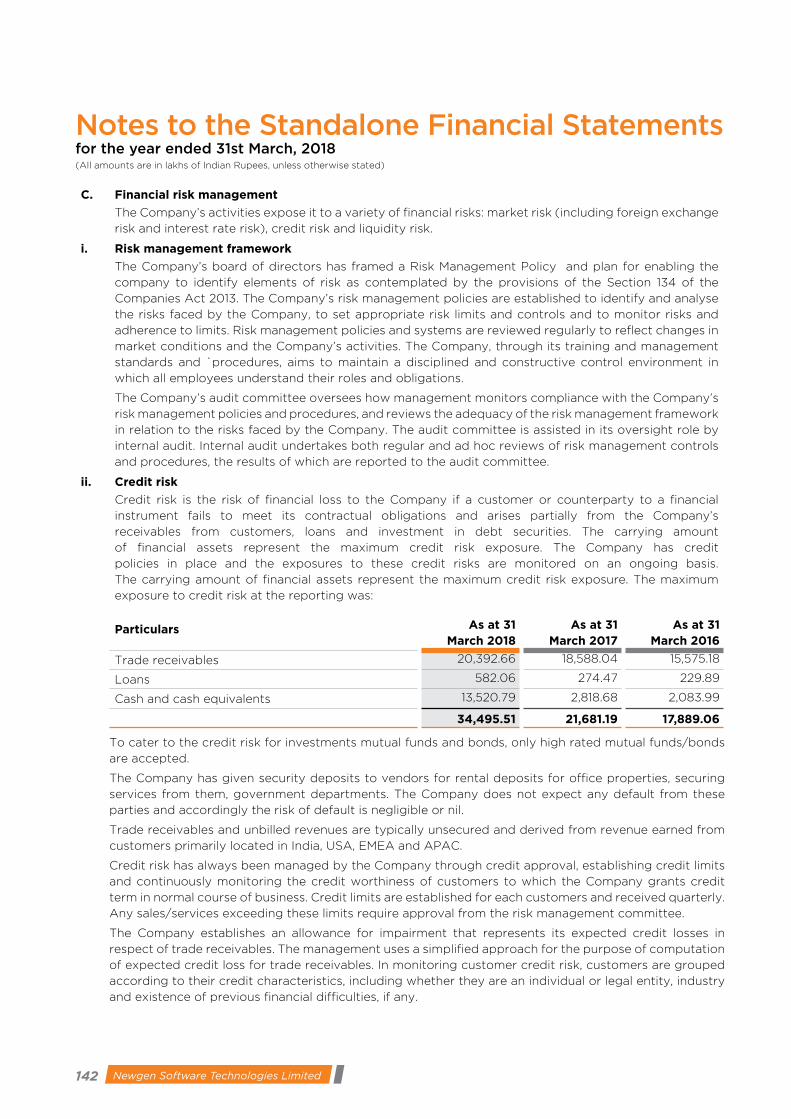
142 Newgen Software Technologies Limited 143
C. Financial risk management
The Company’s activities expose it to a variety of financial risks: market risk (including foreign exchange
risk and interest rate risk), credit risk and liquidity risk.
i. Risk management framework
The Company’s board of directors has framed a Risk Management Policy and plan for enabling the
company to identify elements of risk as contemplated by the provisions of the Section 134 of the
Companies Act 2013. The Company’s risk management policies are established to identify and analyse
the risks faced by the Company, to set appropriate risk limits and controls and to monitor risks and
adherence to limits. Risk management policies and systems are reviewed regularly to reflect changes in
market conditions and the Company’s activities. The Company, through its training and management
standards and `procedures, aims to maintain a disciplined and constructive control environment in
which all employees understand their roles and obligations.
The Company’s audit committee oversees how management monitors compliance with the Company’s
risk management policies and procedures, and reviews the adequacy of the risk management framework
in relation to the risks faced by the Company. The audit committee is assisted in its oversight role by
internal audit. Internal audit undertakes both regular and ad hoc reviews of risk management controls
and procedures, the results of which are reported to the audit committee.
ii. Credit risk
Credit risk is the risk of financial loss to the Company if a customer or counterparty to a financial
instrument fails to meet its contractual obligations and arises partially from the Company’s
receivables from customers, loans and investment in debt securities. The carrying amount
of financial assets represent the maximum credit risk exposure. The Company has credit
policies in place and the exposures to these credit risks are monitored on an ongoing basis.
The carrying amount of financial assets represent the maximum credit risk exposure. The maximum
exposure to credit risk at the reporting was:
Particulars As at 31 March 2018
As at 31 March 2017
As at 31 March 2016
Trade receivables 20,392.66 18,588.04 15,575.18
Loans 582.06 274.47 229.89
Cash and cash equivalents 13,520.79 2,818.68 2,083.99
34,495.51 21,681.19 17,889.06
To cater to the credit risk for investments mutual funds and bonds, only high rated mutual funds/bonds
are accepted.
The Company has given security deposits to vendors for rental deposits for office properties, securing
services from them, government departments. The Company does not expect any default from these
parties and accordingly the risk of default is negligible or nil.
Trade receivables and unbilled revenues are typically unsecured and derived from revenue earned from
customers primarily located in India, USA, EMEA and APAC.
Credit risk has always been managed by the Company through credit approval, establishing credit limits
and continuously monitoring the credit worthiness of customers to which the Company grants credit
term in normal course of business. Credit limits are established for each customers and received quarterly.
Any sales/services exceeding these limits require approval from the risk management committee.
The Company establishes an allowance for impairment that represents its expected credit losses in
respect of trade receivables. The management uses a simplified approach for the purpose of computation
of expected credit loss for trade receivables. In monitoring customer credit risk, customers are grouped
according to their credit characteristics, including whether they are an individual or legal entity, industry
and existence of previous financial difficulties, if any.
Notes to the Standalone Financial Statements for the year ended 31st March, 2018(All amounts are in lakhs of Indian Rupees, unless otherwise stated)
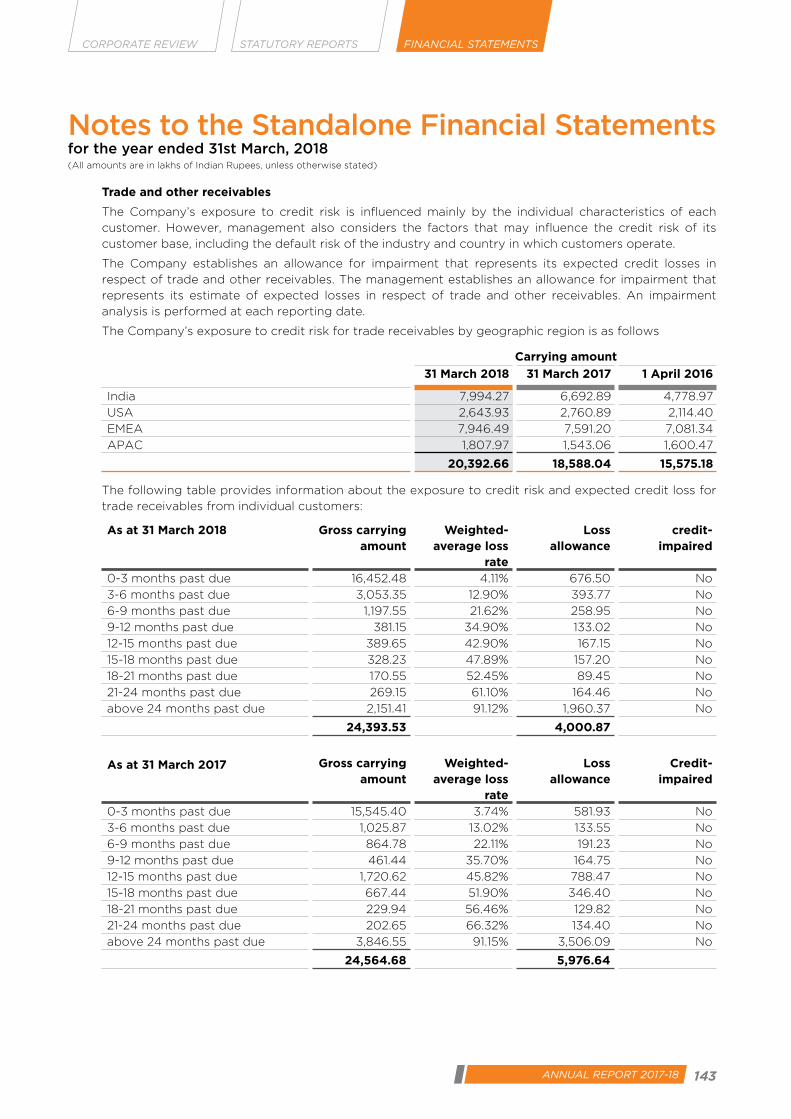
142 Newgen Software Technologies Limited 143ANNUAL REPORT 2017-18
CORPORATE REVIEW FINANCIAL STATEMENTSSTATUTORY REPORTS
Trade and other receivables
The Company’s exposure to credit risk is influenced mainly by the individual characteristics of each
customer. However, management also considers the factors that may influence the credit risk of its
customer base, including the default risk of the industry and country in which customers operate.
The Company establishes an allowance for impairment that represents its expected credit losses in
respect of trade and other receivables. The management establishes an allowance for impairment that
represents its estimate of expected losses in respect of trade and other receivables. An impairment
analysis is performed at each reporting date.
The Company’s exposure to credit risk for trade receivables by geographic region is as follows
Carrying amount
31 March 2018 31 March 2017 1 April 2016
India 7,994.27 6,692.89 4,778.97
USA 2,643.93 2,760.89 2,114.40
EMEA 7,946.49 7,591.20 7,081.34
APAC 1,807.97 1,543.06 1,600.47
20,392.66 18,588.04 15,575.18
The following table provides information about the exposure to credit risk and expected credit loss for
trade receivables from individual customers:
As at 31 March 2018 Gross carrying amount
Weighted- average loss
rate
Loss allowance
credit-impaired
0-3 months past due 16,452.48 4.11% 676.50 No
3-6 months past due 3,053.35 12.90% 393.77 No
6-9 months past due 1,197.55 21.62% 258.95 No
9-12 months past due 381.15 34.90% 133.02 No
12-15 months past due 389.65 42.90% 167.15 No
15-18 months past due 328.23 47.89% 157.20 No
18-21 months past due 170.55 52.45% 89.45 No
21-24 months past due 269.15 61.10% 164.46 No
above 24 months past due 2,151.41 91.12% 1,960.37 No
24,393.53 4,000.87
As at 31 March 2017 Gross carrying amount
Weighted- average loss
rate
Loss allowance
Credit-impaired
0-3 months past due 15,545.40 3.74% 581.93 No
3-6 months past due 1,025.87 13.02% 133.55 No
6-9 months past due 864.78 22.11% 191.23 No
9-12 months past due 461.44 35.70% 164.75 No
12-15 months past due 1,720.62 45.82% 788.47 No
15-18 months past due 667.44 51.90% 346.40 No
18-21 months past due 229.94 56.46% 129.82 No
21-24 months past due 202.65 66.32% 134.40 No
above 24 months past due 3,846.55 91.15% 3,506.09 No
24,564.68 5,976.64
Notes to the Standalone Financial Statements for the year ended 31st March, 2018(All amounts are in lakhs of Indian Rupees, unless otherwise stated)
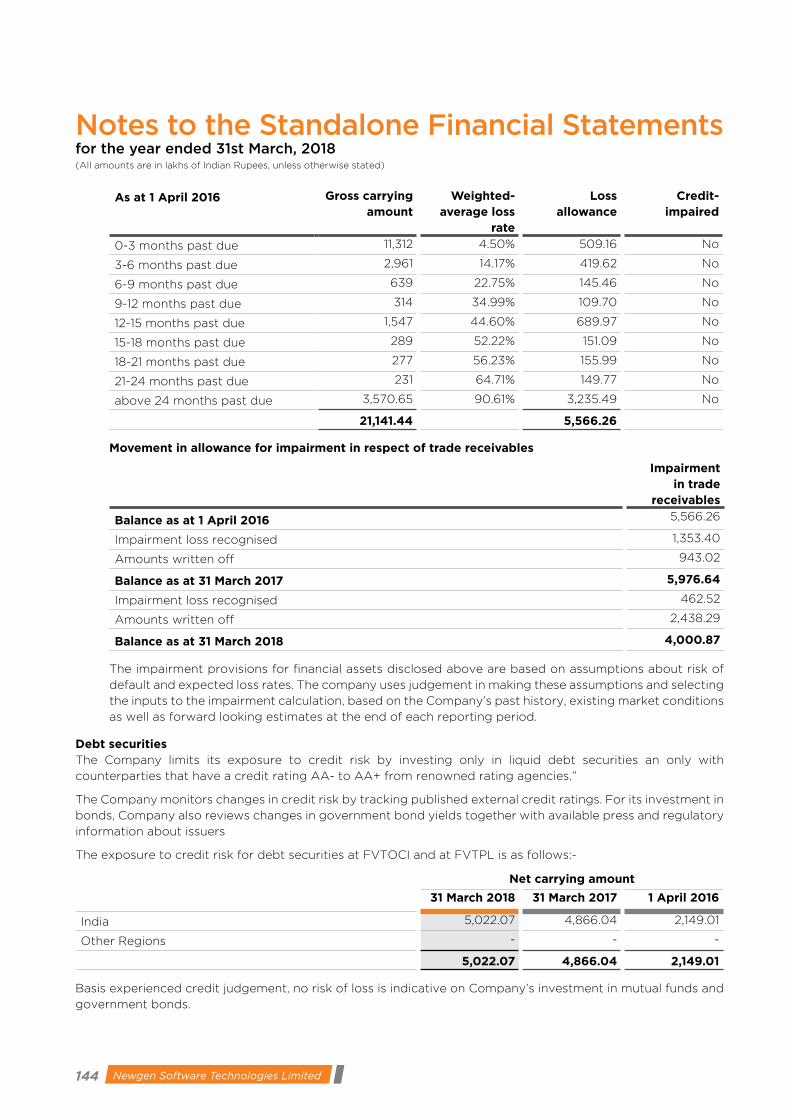
144 Newgen Software Technologies Limited 145
Notes to the Standalone Financial Statements for the year ended 31st March, 2018(All amounts are in lakhs of Indian Rupees, unless otherwise stated)
As at 1 April 2016 Gross carrying amount
Weighted- average loss
rate
Loss allowance
Credit-impaired
0-3 months past due 11,312 4.50% 509.16 No
3-6 months past due 2,961 14.17% 419.62 No
6-9 months past due 639 22.75% 145.46 No
9-12 months past due 314 34.99% 109.70 No
12-15 months past due 1,547 44.60% 689.97 No
15-18 months past due 289 52.22% 151.09 No
18-21 months past due 277 56.23% 155.99 No
21-24 months past due 231 64.71% 149.77 No
above 24 months past due 3,570.65 90.61% 3,235.49 No
21,141.44 5,566.26
Movement in allowance for impairment in respect of trade receivables
Impairment in trade
receivables
Balance as at 1 April 2016 5,566.26
Impairment loss recognised 1,353.40
Amounts written off 943.02
Balance as at 31 March 2017 5,976.64
Impairment loss recognised 462.52
Amounts written off 2,438.29
Balance as at 31 March 2018 4,000.87
The impairment provisions for financial assets disclosed above are based on assumptions about risk of
default and expected loss rates. The company uses judgement in making these assumptions and selecting
the inputs to the impairment calculation, based on the Company’s past history, existing market conditions
as well as forward looking estimates at the end of each reporting period.
Debt securitiesThe Company limits its exposure to credit risk by investing only in liquid debt securities an only with
counterparties that have a credit rating AA- to AA+ from renowned rating agencies.”
The Company monitors changes in credit risk by tracking published external credit ratings. For its investment in
bonds, Company also reviews changes in government bond yields together with available press and regulatory
information about issuers
The exposure to credit risk for debt securities at FVTOCI and at FVTPL is as follows:-
Net carrying amount
31 March 2018 31 March 2017 1 April 2016
India 5,022.07 4,866.04 2,149.01
Other Regions - - -
5,022.07 4,866.04 2,149.01
Basis experienced credit judgement, no risk of loss is indicative on Company’s investment in mutual funds and
government bonds.
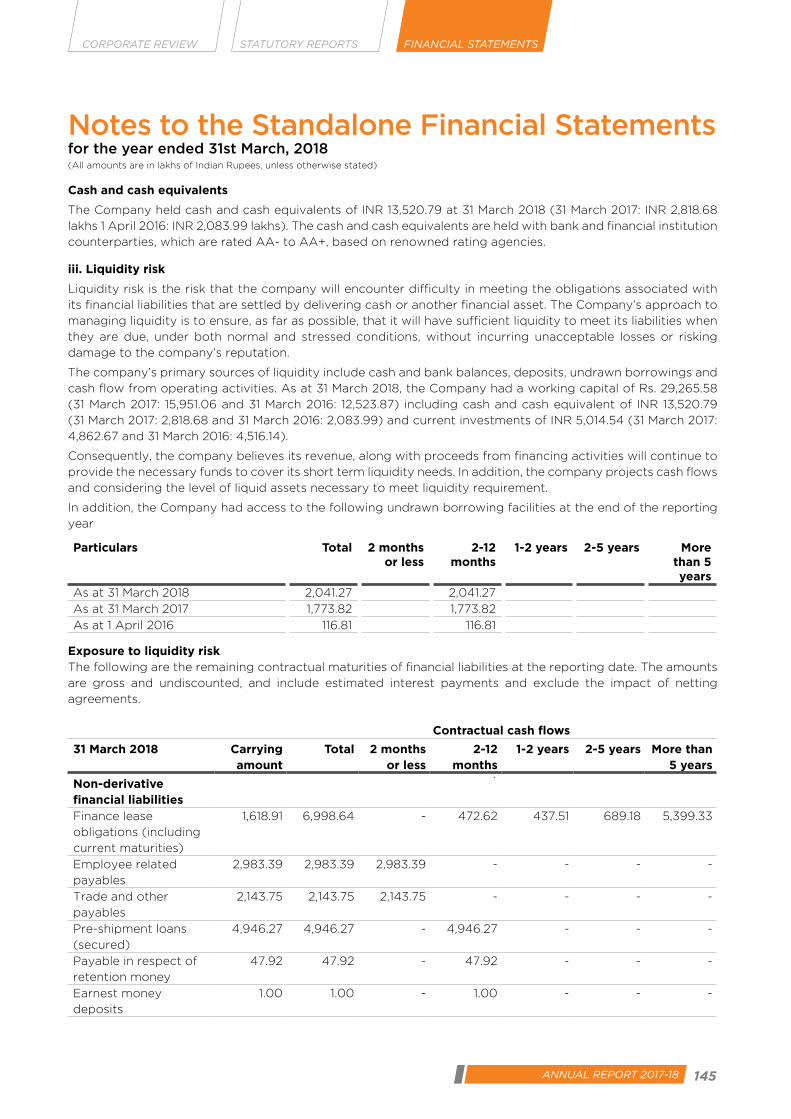
144 Newgen Software Technologies Limited 145ANNUAL REPORT 2017-18
CORPORATE REVIEW FINANCIAL STATEMENTSSTATUTORY REPORTS
Cash and cash equivalents
The Company held cash and cash equivalents of INR 13,520.79 at 31 March 2018 (31 March 2017: INR 2,818.68
lakhs 1 April 2016: INR 2,083.99 lakhs). The cash and cash equivalents are held with bank and financial institution
counterparties, which are rated AA- to AA+, based on renowned rating agencies.
iii. Liquidity risk
Liquidity risk is the risk that the company will encounter difficulty in meeting the obligations associated with
its financial liabilities that are settled by delivering cash or another financial asset. The Company’s approach to
managing liquidity is to ensure, as far as possible, that it will have sufficient liquidity to meet its liabilities when
they are due, under both normal and stressed conditions, without incurring unacceptable losses or risking
damage to the company’s reputation.
The company’s primary sources of liquidity include cash and bank balances, deposits, undrawn borrowings and
cash flow from operating activities. As at 31 March 2018, the Company had a working capital of Rs. 29,265.58
(31 March 2017: 15,951.06 and 31 March 2016: 12,523.87) including cash and cash equivalent of INR 13,520.79
(31 March 2017: 2,818.68 and 31 March 2016: 2,083.99) and current investments of INR 5,014.54 (31 March 2017:
4,862.67 and 31 March 2016: 4,516.14).
Consequently, the company believes its revenue, along with proceeds from financing activities will continue to
provide the necessary funds to cover its short term liquidity needs. In addition, the company projects cash flows
and considering the level of liquid assets necessary to meet liquidity requirement.
In addition, the Company had access to the following undrawn borrowing facilities at the end of the reporting
year
Particulars Total 2 months or less
2-12 months
1-2 years 2-5 years More than 5 years
As at 31 March 2018 2,041.27 2,041.27
As at 31 March 2017 1,773.82 1,773.82
As at 1 April 2016 116.81 116.81
Exposure to liquidity riskThe following are the remaining contractual maturities of financial liabilities at the reporting date. The amounts
are gross and undiscounted, and include estimated interest payments and exclude the impact of netting
agreements.
Contractual cash flows
31 March 2018 Carrying amount
Total 2 months or less
2-12 months
1-2 years 2-5 years More than 5 years
Non-derivative financial liabilities
`
Finance lease
obligations (including
current maturities)
1,618.91 6,998.64 - 472.62 437.51 689.18 5,399.33
Employee related
payables
2,983.39 2,983.39 2,983.39 - - - -
Trade and other
payables
2,143.75 2,143.75 2,143.75 - - - -
Pre-shipment loans
(secured)
4,946.27 4,946.27 - 4,946.27 - - -
Payable in respect of
retention money
47.92 47.92 - 47.92 - - -
Earnest money
deposits
1.00 1.00 - 1.00 - - -
Notes to the Standalone Financial Statements for the year ended 31st March, 2018(All amounts are in lakhs of Indian Rupees, unless otherwise stated)
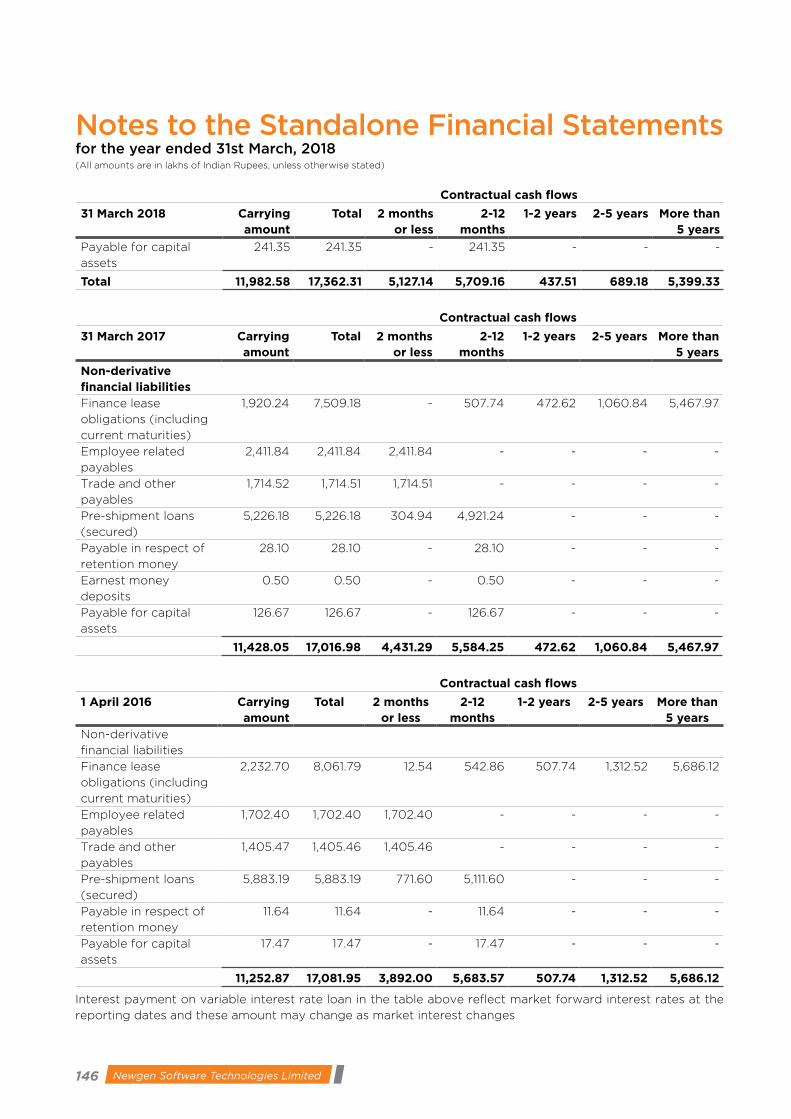
146 Newgen Software Technologies Limited 147
Contractual cash flows
31 March 2018 Carrying amount
Total 2 months or less
2-12 months
1-2 years 2-5 years More than 5 years
Payable for capital
assets
241.35 241.35 - 241.35 - - -
Total 11,982.58 17,362.31 5,127.14 5,709.16 437.51 689.18 5,399.33
Contractual cash flows
31 March 2017 Carrying amount
Total 2 months or less
2-12 months
1-2 years 2-5 years More than 5 years
Non-derivative financial liabilitiesFinance lease
obligations (including
current maturities)
1,920.24 7,509.18 - 507.74 472.62 1,060.84 5,467.97
Employee related
payables
2,411.84 2,411.84 2,411.84 - - - -
Trade and other
payables
1,714.52 1,714.51 1,714.51 - - - -
Pre-shipment loans
(secured)
5,226.18 5,226.18 304.94 4,921.24 - - -
Payable in respect of
retention money
28.10 28.10 - 28.10 - - -
Earnest money
deposits
0.50 0.50 - 0.50 - - -
Payable for capital
assets
126.67 126.67 - 126.67 - - -
11,428.05 17,016.98 4,431.29 5,584.25 472.62 1,060.84 5,467.97
Contractual cash flows
1 April 2016 Carrying amount
Total 2 months or less
2-12 months
1-2 years 2-5 years More than 5 years
Non-derivative
financial liabilities
Finance lease
obligations (including
current maturities)
2,232.70 8,061.79 12.54 542.86 507.74 1,312.52 5,686.12
Employee related
payables
1,702.40 1,702.40 1,702.40 - - - -
Trade and other
payables
1,405.47 1,405.46 1,405.46 - - - -
Pre-shipment loans
(secured)
5,883.19 5,883.19 771.60 5,111.60 - - -
Payable in respect of
retention money
11.64 11.64 - 11.64 - - -
Payable for capital
assets
17.47 17.47 - 17.47 - - -
11,252.87 17,081.95 3,892.00 5,683.57 507.74 1,312.52 5,686.12
Interest payment on variable interest rate loan in the table above reflect market forward interest rates at the
reporting dates and these amount may change as market interest changes
Notes to the Standalone Financial Statements for the year ended 31st March, 2018(All amounts are in lakhs of Indian Rupees, unless otherwise stated)

146 Newgen Software Technologies Limited 147ANNUAL REPORT 2017-18
CORPORATE REVIEW FINANCIAL STATEMENTSSTATUTORY REPORTS
iv. Market risk
Market risk is the risk that changes in market prices – such as foreign exchange rates, interest rates and equity prices – will affect the company’s income or the value of its holdings of financial instruments.Market risk is attributable to all market risk sensitive financial instruments including foreign currency receivables and payables and long term debt. We are exposed to market risk primarily related to foreign exchange rate risk, interest rate risk and the market value of our investments. Thus, our exposure to market risk is a function of investing and borrowing activities and revenue generating and operating activities in foreign currency. The objective of market risk management is to avoid excessive exposure in our foreign currency revenues and costs.
Currency risk
Foreign currency risk is the risk that the fair value or future cash flows of an exposure will fluctuate because of changes in foreign exchange rates. The company is exposed to currency risk on account of its borrowings, receivables and other payables in foreign currency. The functional currency of the company is Indian Rupee. The foreign currency exchange management policy is to minimize economic and transactional exposures arising from currency movements against the US dollar, Euro, GBP, Canadian dolar, Abar Emirates Dhiram, Saudi Riyal, Singapore dollar and Japanese Yen. The company manages the risk by netting off naturally occurring opposite exposures wherever possible, and then dealing with any material residual foreign currency exchange risks if any.”
Exposure to currency risk
The currency profile of financial assets and financial liabilities as at March 31, 2017, March 31, 2017 and April 1,
2016 are as below:
PARTICULARS Currency 31 March 2018 31 March 2017 1 April 2016
Amount in foreign currency
(lakhs)
Amount in local
currency (lakhs)
Amount in foreign currency
(lakhs)
Amount in local
currency (lakhs)
Amount in foreign currency
(lakhs)
Amount in local
currency (lakhs)
Financial assetsTrade and other
receivables* USD 207.57 13,500.77 219.19 14,210.08 204.70 13,578.21 AED 5.22 92.64 3.54 62.51 0.52 9.40 CAD 8.41 424.85 7.56 368.19 4.90 249.88 EUR 1.55 125.00 1.87 129.74 2.06 154.65 GBP 0.69 63.71 3.71 300.34 1.56 148.15 SAR 7.41 128.63 7.41 128.04 8.48 149.64 SGD 3.34 165.90 2.41 111.86 1.12 54.91
Bank balance-Dubai AED 6.28 111.39 2.07 36.69 2.28 41.11Travelling Advance to
employees
USD 2.12 136.97 1.58 104.65 0.53 34.03
AED 1.45 25.75 0.61 10.98 0.11 2.89 CAD 0.07 3.85 0.02 0.92 0.04 1.88 GBP 0.02 2.13 - - 0.01 0.74 SGD 0.07 3.38 - - 0.03 1.70
EURO 0.10 8.53 0.03 1.98 0.04 3.24
Financial liabilitiesTrade and other
payables USD (3.82) (246.02) (1.63) (107.66) (1.29) (86.93) GBP - - (0.03) (2.45) -
EURO (0.01) (0.64) (0.03) (2.32) -Short term borrowings USD (76.05) (4,946.27) (80.60) (5,226.18) (5,883.23)
* gross of loss allowance
Notes to the Standalone Financial Statements for the year ended 31st March, 2018(All amounts are in lakhs of Indian Rupees, unless otherwise stated)

148 Newgen Software Technologies Limited 149
Notes to the Standalone Financial Statements for the year ended 31st March, 2018(All amounts are in lakhs of Indian Rupees, unless otherwise stated)
Sensitivity analysis
A reasonably possible strengthening (weakening) of the Indian Rupee against US dollar, Euro, GBP, Canadian
dolar, Abar Emirates Dhiram, Saudi Riyal, Singapore dollar and Japanese Yen at reporting date would have
affected the measurement of financial instruments denominated in foreign currencies and affected equity and
profit or loss by the amounts shown below. This analysis assumes that all other variables, in particular interest
rates, remain constant and ignores any impact of forecast sales and purchases.
For the year ended 31 March 2018
For the year ended 31 March 2017
Effect in thousands of INR Strengthening Weakening Strengthening Weakening
1% movement
USD 84.43 (84.43) 89.82 (89.82)
EUR1 1.32 (1.32) 1.29 (1.29)
GBP1 0.66 (0.66) 2.98 (2.98)
CAD1 4.28 (4.28) 3.68 (3.68)
SGD1 1.69 (1.69) 1.12 (1.12)
AED1 1.37 (1.37) 1.10 (1.10)
SAR1 1.29 (1.29) 1.28 (1.28)
95.05 (95.05) 101.26 (101.26)
Interest rate risk
Interest rate risk can be either fair value interest rate risk or cash flow interest rate risk. Fair value interest
rate risk is the risk of changes in fair values of fixed interest bearing investments because of fluctuations in
the interest rates. Cash flow interest rate risk is the risk that the future cash flows of floating interest bearing
investments will fluctuate because of fluctuations in the interest rates.
a) Exposure to interest rate risk
The Company is exposed to both fair value interest rate risk as well as cash flow interest rate risk arising both
on short-term and long-term floating rate instruments.
The interest rate profile of the Company’s interest-bearing financial instruments is as follows:
Nominal amount in INR31 March 2018 31 March 2017 1 April 2016
Fixed-rate instrumentsFinancial assets 10,607.50 2,684.62 638.11
Financial liabilities (1,618.91) (1,920.24) (2,232.70)
8,988.59 764.38 (1,594.59)
Variable-rate instruments `
Financial assets - - -
Financial liabilities (4,946.27) (5,226.18) (5,883.19)
(4,946.27) (5,226.18) (5,883.19)
Total 4,042.32 (4,461.79) (7,477.78)
b) Sensitivity analysis
Fair value sensitivity analysis for fixed-rate instruments
The company accounts for investments in government and other bonds as fair value through other
comprehensive income. Therefore, a change in interest rate at the reporting date would have impact on equity.
A reasonably possible change of 100 basis points in interest rates at the reporting date would have increased
(decreased) equity by INR 12.27 lakhs after tax (31 March 2017: INR 17.53 lakhs)

148 Newgen Software Technologies Limited 149ANNUAL REPORT 2017-18
CORPORATE REVIEW FINANCIAL STATEMENTSSTATUTORY REPORTS
Cash flow sensitivity analysis for variable-rate instruments
A reasonably possible change of 100 basis points in interest rates at the reporting date would have increased
(decreased) profit or loss by the amounts shown below. This analysis assumes that all other variables, in
particular foreign currency exchange rates, remain constant.
Profit or loss
100 bp increase
100 bp decrease
31 March 2018
Variable-rate instruments (63.72) 63.72
Cash flow sensitivity (net) (63.72) 63.72
31 March 2017
Variable-rate instruments (52.26) 52.26
Cash flow sensitivity (net) (52.26) 52.26
Market price risk
a) Exposure
The company’s exposure to mutual funds and bonds price risk arises from investments held by the company
and classified in the balance sheet as fair value through profit and loss and at fair value through other
comprehensive income respectively.
To manage its price risk arising from investments, the company diversifies its portfolio. Diversification of
the portfolio is done in accordances with the limits set by the company.
b) Sensitivity analysis
Company is having investment in mutual funds, government bonds, other bonds and investment in subsidiaries.
For such investments classified at Fair value through other comprehensive income, a 2% increase in their
fair value at the reporting date would have increased equity by INR 0.32 lakhs after tax (31 March, 2017: INR
21.96 lakhs ). An equal change in the opposite direction would have decreased equity by INR 0.32 lakhs
after tax (31 March, 2017: INR (21.96) lakhs)
For such investments classified at Fair value through profit or loss, the impact of a 2% increase in their fair
value at the reporting date on profit or loss would have been an increase of INR 65.26 after tax (31 March,
2017: INR 41.63 lakhs ). An equal change in the opposite direction would have decreased profit or loss by
INR 65.26 after tax (31 March, 2017: INR (41.63) lakhs)
48 Capital Management
The company’s policy is to maintain a strong capital base so as to maintain investor, creditor and
market confidence and to sustain future development of the business. Management monitors the return
on capital as well as the level of dividends to ordinary shareholders.
The company manages its capital structure and makes adjustments to it as and when required. To
maintain or adjust the capital structure, the company may pay dividend or repay debts, raise new debt
or issue new shares. No major changes were made in the objectives, policies or processes for managing
capital during the year ended 31 March 2018, 31 March 2017 and 1 April 2016.
The Company monitors capital using a ratio of ‘adjusted net debt’ to ‘adjusted equity’. For this purpose,
adjusted net debt is defined as total liabilities comprising interest bearing loans and borrowings
and obligations under finance leases, less cash and cash equivalents. Adjusted equity comprises all
components of equity
Notes to the Standalone Financial Statements for the year ended 31st March, 2018(All amounts are in lakhs of Indian Rupees, unless otherwise stated)
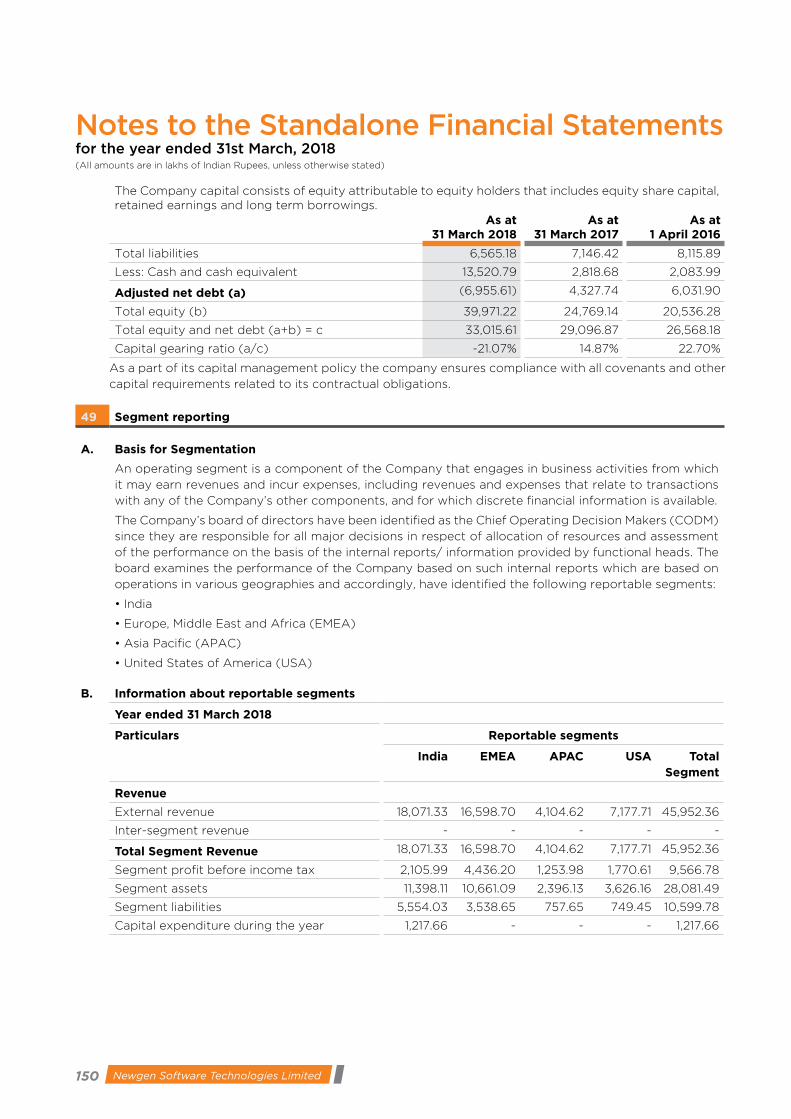
150 Newgen Software Technologies Limited 151
The Company capital consists of equity attributable to equity holders that includes equity share capital, retained earnings and long term borrowings.
As at 31 March 2018
As at 31 March 2017
As at 1 April 2016
Total liabilities 6,565.18 7,146.42 8,115.89
Less: Cash and cash equivalent 13,520.79 2,818.68 2,083.99
Adjusted net debt (a) (6,955.61) 4,327.74 6,031.90
Total equity (b) 39,971.22 24,769.14 20,536.28
Total equity and net debt (a+b) = c 33,015.61 29,096.87 26,568.18
Capital gearing ratio (a/c) -21.07% 14.87% 22.70%
As a part of its capital management policy the company ensures compliance with all covenants and other
capital requirements related to its contractual obligations.
49 Segment reporting
A. Basis for Segmentation
An operating segment is a component of the Company that engages in business activities from which
it may earn revenues and incur expenses, including revenues and expenses that relate to transactions
with any of the Company’s other components, and for which discrete financial information is available.
The Company’s board of directors have been identified as the Chief Operating Decision Makers (CODM)
since they are responsible for all major decisions in respect of allocation of resources and assessment
of the performance on the basis of the internal reports/ information provided by functional heads. The
board examines the performance of the Company based on such internal reports which are based on
operations in various geographies and accordingly, have identified the following reportable segments:
• India
• Europe, Middle East and Africa (EMEA)
• Asia Pacific (APAC)
• United States of America (USA)
B. Information about reportable segments
Year ended 31 March 2018
Particulars Reportable segments
India EMEA APAC USA Total Segment
Revenue
External revenue 18,071.33 16,598.70 4,104.62 7,177.71 45,952.36
Inter-segment revenue - - - - -
Total Segment Revenue 18,071.33 16,598.70 4,104.62 7,177.71 45,952.36
Segment profit before income tax 2,105.99 4,436.20 1,253.98 1,770.61 9,566.78
Segment assets 11,398.11 10,661.09 2,396.13 3,626.16 28,081.49
Segment liabilities 5,554.03 3,538.65 757.65 749.45 10,599.78
Capital expenditure during the year 1,217.66 - - - 1,217.66
Notes to the Standalone Financial Statements for the year ended 31st March, 2018(All amounts are in lakhs of Indian Rupees, unless otherwise stated)

150 Newgen Software Technologies Limited 151ANNUAL REPORT 2017-18
CORPORATE REVIEW FINANCIAL STATEMENTSSTATUTORY REPORTS
Year ended 31 March 2017
Particulars Reportable segments
India EMEA APAC USA Total Segment
RevenueExternal revenue 16,922.79 11,480.51 2,728.47 7,179.63 38,311.41
Inter-segment revenue - - - - -
Total Segment Revenue 16,922.79 11,480.51 2,728.47 7,179.63 38,311.41
Segment profit before income tax 3,026.45 1,877.39 416.51 1,367.68 6,688.02
Segment assets 8,337.96 9,044.35 1,903.52 3,650.74 22,936.57
Segment liabilities 4,330.14 3,102.91 553.87 854.80 8,841.72
Capital expenditure during the year 279.28 - - - 279.28
C. Reconciliations of information on reportable segments to Ind AS
Particulars Note For the year ended 31 March 2018
For the year ended 31 March 2017
(a) RevenueTotal revenue for reportable segments 45,952.36 38,311.41Elimination of inter-segment revenue -
Total revenue 45,952.36 38,311.41
(b) Profit / (loss) before taxTotal profit before tax for reportable
segments
9,566.78 6,688.02
Unallocated amounts:- Unallocated income 758.20 826.63- Other corporate expenses 1,231.79 1,189.28
Total profit before tax from operations 9,093.18 6,325.36
(c) AssetsTotal assets for reportable segments 28,081.49 22,936.57Other unallocated amounts 30,665.35 18,503.66
Total assets 58,746.84 41,440.23
(d) LiabilitiesTotal liabilities for reportable segments 10,599.78 8,841.72Other unallocated amounts 8,175.84 7,829.37
Total liabilities 18,775.62 16,671.09
C. Information about major customersNo customer individually accounted for more than 10% of the revenues in the year ended 31 March 2018
and 31 March 2017.
50 First Time Adoption of Ind AS
These are the Company’s first financial statements prepared in accordance with Ind AS. The accounting policies set out in note 3 have been applied in preparing the financial statements for the year ended 31 March 2018, the comparative information presented in these financial statements for the year ended 31 March 2017 and in the preparation of an opening Ind AS balance sheet at 1 April 2016 (the company’s date of transition).
In preparing its opening Ind AS balance sheet, the company has adjusted the amounts reported previously in financial statements prepared in accordance with the accounting standards notified under Companies (Accounting Standards) Rules, 2006 (as amended) and other relevant provisions of the Act (‘previous GAAP’ or ‘Indian GAAP’).
An explanation of how the transition from previous GAAP to Ind AS has affected the Company’s financial position, financial performance and cash flows is set out in the following tables and notes.
Notes to the Standalone Financial Statements for the year ended 31st March, 2018(All amounts are in lakhs of Indian Rupees, unless otherwise stated)
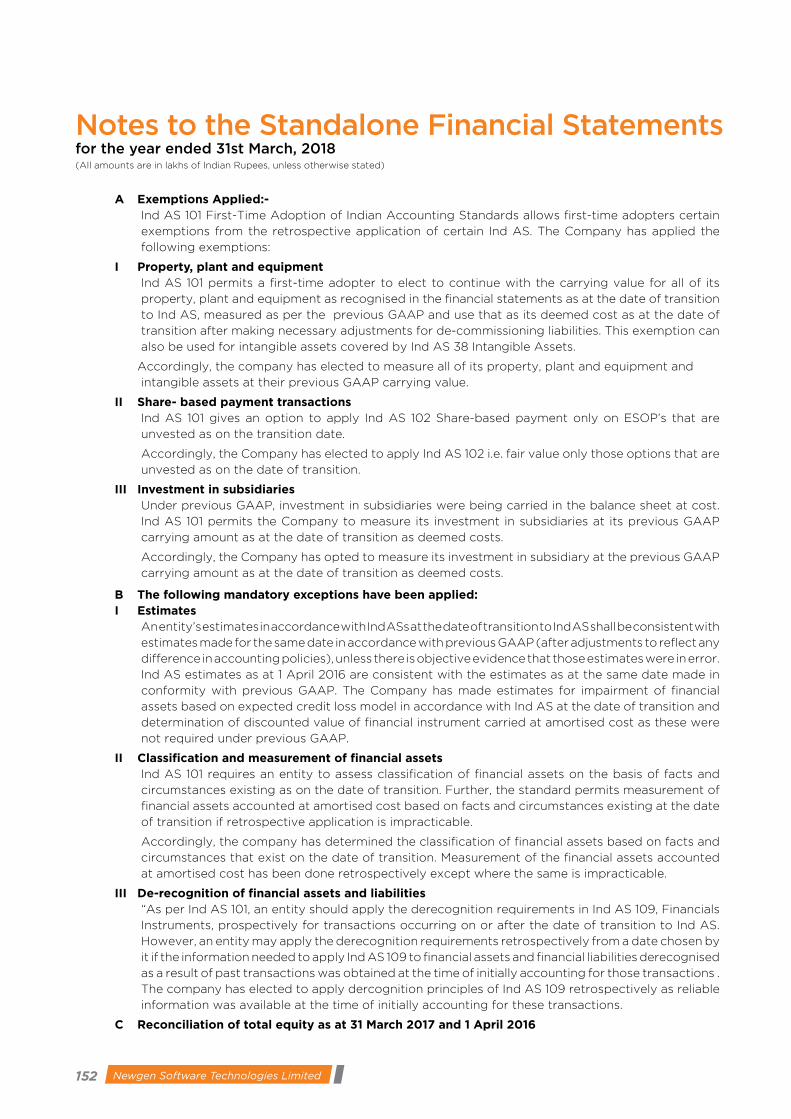
152 Newgen Software Technologies Limited 153
A Exemptions Applied:- Ind AS 101 First-Time Adoption of Indian Accounting Standards allows first-time adopters certain
exemptions from the retrospective application of certain Ind AS. The Company has applied the
following exemptions:
I Property, plant and equipment Ind AS 101 permits a first-time adopter to elect to continue with the carrying value for all of its
property, plant and equipment as recognised in the financial statements as at the date of transition
to Ind AS, measured as per the previous GAAP and use that as its deemed cost as at the date of
transition after making necessary adjustments for de-commissioning liabilities. This exemption can
also be used for intangible assets covered by Ind AS 38 Intangible Assets.
Accordingly, the company has elected to measure all of its property, plant and equipment and
intangible assets at their previous GAAP carrying value.
II Share- based payment transactions Ind AS 101 gives an option to apply Ind AS 102 Share-based payment only on ESOP’s that are
unvested as on the transition date.
Accordingly, the Company has elected to apply Ind AS 102 i.e. fair value only those options that are
unvested as on the date of transition.
III Investment in subsidiaries Under previous GAAP, investment in subsidiaries were being carried in the balance sheet at cost.
Ind AS 101 permits the Company to measure its investment in subsidiaries at its previous GAAP
carrying amount as at the date of transition as deemed costs.
Accordingly, the Company has opted to measure its investment in subsidiary at the previous GAAP
carrying amount as at the date of transition as deemed costs.
B The following mandatory exceptions have been applied:I Estimates An entity’s estimates in accordance with Ind ASs at the date of transition to Ind AS shall be consistent with
estimates made for the same date in accordance with previous GAAP (after adjustments to reflect any
difference in accounting policies), unless there is objective evidence that those estimates were in error.
Ind AS estimates as at 1 April 2016 are consistent with the estimates as at the same date made in
conformity with previous GAAP. The Company has made estimates for impairment of financial
assets based on expected credit loss model in accordance with Ind AS at the date of transition and
determination of discounted value of financial instrument carried at amortised cost as these were
not required under previous GAAP.
II Classification and measurement of financial assets Ind AS 101 requires an entity to assess classification of financial assets on the basis of facts and
circumstances existing as on the date of transition. Further, the standard permits measurement of
financial assets accounted at amortised cost based on facts and circumstances existing at the date
of transition if retrospective application is impracticable.
Accordingly, the company has determined the classification of financial assets based on facts and
circumstances that exist on the date of transition. Measurement of the financial assets accounted
at amortised cost has been done retrospectively except where the same is impracticable.
III De-recognition of financial assets and liabilities “As per Ind AS 101, an entity should apply the derecognition requirements in Ind AS 109, Financials
Instruments, prospectively for transactions occurring on or after the date of transition to Ind AS.
However, an entity may apply the derecognition requirements retrospectively from a date chosen by
it if the information needed to apply Ind AS 109 to financial assets and financial liabilities derecognised
as a result of past transactions was obtained at the time of initially accounting for those transactions .
The company has elected to apply dercognition principles of Ind AS 109 retrospectively as reliable
information was available at the time of initially accounting for these transactions.
C Reconciliation of total equity as at 31 March 2017 and 1 April 2016
Notes to the Standalone Financial Statements for the year ended 31st March, 2018(All amounts are in lakhs of Indian Rupees, unless otherwise stated)

152 Newgen Software Technologies Limited 153ANNUAL REPORT 2017-18
CORPORATE REVIEW FINANCIAL STATEMENTSSTATUTORY REPORTS
No
tes
to t
he S
tand
alo
ne F
inan
cia
l S
tate
men
ts
for
the
ye
ar
en
de
d 3
1st
Marc
h, 2
018
(All
am
ou
nts
are
in
lakh
s o
f In
dia
n R
up
ees,
un
less
oth
erw
ise s
tate
d)
Part
icul
ars
Not
es t
o fir
st t
ime
adop
tion
Shar
e ca
pita
lR
etai
ned
earn
ings
New
gen
ESO
P re
serv
e
Oth
er
com
preh
ensi
ve
inco
me
Secu
riti
es
Prem
ium
Cap
ital
re
dem
ptio
n re
serv
e
Shar
e op
tion
s ou
tsta
ndin
g re
serv
e
Gen
eral
re
serv
e To
tal
Bal
ance
as
at 1
Apr
il 20
16 a
s pe
r pr
evio
us G
AA
P
6,3
09.
41
13,5
91.19
-
-
4
89.7
9 8
7.95
16
.48
1,73
1.39
22,
226.
21
Der
ivat
ive
D.1
-
(13
6.0
0)
-
-
-
-
-
-
(13
6.0
0)
Exp
ecte
d cr
edit
loss
D.2
-
(3,
863.
17)
-
-
-
-
-
-
(3,
863.
17)
Adj
ustm
ent
on a
ccou
nt o
f co
nsol
idat
ion
of t
rust
D.3
(10
0.9
7) -
17
5.75
-
(
4.35
) -
-
-
7
0.4
3
Em
ploy
ee s
tock
com
pens
atio
n ex
pens
eD
.4 -
(
235.
97)
-
-
8.6
3 -
2
42.5
9 -
15
.25
Gai
n/(l
oss)
aris
ing
from
fair
valu
atio
n of
inve
stm
ents
D.5
-
17.8
4 -
(
3.37
) -
-
-
-
14
.46
Gai
n on
dis
coun
ting
of lo
ng t
erm
fin
anci
al a
sset
s an
d lia
bilit
ies,
net
D.6
-
92.
36
-
-
-
-
-
-
92.
36
Mea
sure
men
t of
sec
urity
dep
osits
at
am
ortis
ed c
osts
D.7
-
(7.
63)
-
-
-
-
-
-
(7.
63)
Adj
ustm
ent
for
divi
dend
D.8
-
775
.78
-
-
-
-
-
-
775
.78
Def
erre
d ta
x on
abo
ve
adju
stm
ents
D.10
-
1,34
7.41
-
1.
17
-
-
-
-
1,34
8.58
Bal
ance
as
at 1
Apr
il 20
16 a
s pe
r In
d A
S6,
208.
44
11,
581.
82
175
.75
(2.
21)
494
.07
87.
95
259
.07
1,7
31.3
9 2
0,5
36.2
8
Bal
ance
as
at 3
1 M
arch
20
17 a
s pe
r pr
evio
us G
AA
P
6,3
38.3
1 18
,391
.14
-
-
645
.69
87.
95
13.0
9 1,
732.
08
27,
208.
26
Exp
ecte
d cr
edit
loss
D.2
-
(3,
938.
27)
-
-
-
-
-
-
(3,
938.
27)
Adj
ustm
ent
on a
ccou
nt o
f co
nsol
idat
ion
of t
rust
D.3
(10
7.0
1) -
2
00
.22
-
(78
.57)
-
-
-
14.6
5
Em
ploy
ee s
tock
com
pens
atio
n ex
pens
eD
.4 -
(
355.
37)
-
-
32.
75
-
346
.27
(0
.69)
22.
97
Gai
n/(l
oss)
ar
isin
g fr
om
fair
valu
atio
n of
inve
stm
ents
D.5
-
18.5
4 -
2
3.21
-
-
-
-
4
1.75
Gai
n on
dis
coun
ting
of l
ong
term
fin
anci
al a
sset
s an
d lia
bilit
ies,
net
D.6
-
85.
59
-
-
-
-
-
-
85.
59
Mea
sure
men
t of
sec
urity
dep
osits
at
am
ortis
ed c
osts
D.7
-
(9.
52)
-
-
-
-
-
-
(9.
52)
Rem
easu
rem
ents
of
gain
/(lo
ss)
on
defin
ed b
enefi
t ob
ligat
ions
D.9
-
82.
88
-
(82
.88)
-
-
-
-
-
Def
erre
d ta
x on
abo
ve a
djus
tmen
tsD
.10 -
1,
323.
44
-
20
.28
-
-
-
-
1,34
3.72
Bal
ance
as
at 3
1 M
arch
20
18 a
s pe
r In
d A
S 6
,231
.30
1
5,59
8.43
2
00
.22
(39
.39)
599
.87
87.
95
359
.37
1,7
31.3
9 2
4,76
9.14

154 Newgen Software Technologies Limited 155
Notes to the Standalone Financial Statements for the year ended 31st March, 2018(All amounts are in lakhs of Indian Rupees, unless otherwise stated)
D Notes to first time adoption
D.1 Measurement of financial liabilities at amortised cost
The Company had issued certain compulsory convertible preference shares. Under previous GAAP
these were being classified under Equity. Under Ind AS, the embedded derivative liability on initial
recognition has been separated from the underlying equity instrument and recorded at fair value.
The difference between the fair value of the combined CCPS instrument and the fair value of the
embedded derivative liability has been recorded as the value of the equity host contract. The
embedded derivative has been fair valued through profit or loss at each balance sheet date.
Upon conversion of CCPS into equity shares the resultant gain/loss on the down-round derivative is
recognised in profit or loss. The original equity component remains as equity. The impact arising from
the change is summarised below:
Standalone statement of profit and loss For the year ended
31 March 2017
Reversal of derivative liability 136.00
Adjustment before income tax 136.00
Standalone balance sheet As at 31 March 2017
As at 1 April 2016
Derivative liability - 136.00
Adjustment to retained earnings - 136.00
D.2 Expected credit loss
As per Ind AS 109, the Company is required to apply expected credit loss model for recognising the
allowance for doubtful debts. The impact arising from the change is summarised below:
Standalone statement of profit and loss For the year ended
31 March 2017
Loss allowance on trade receivables 75.10
Adjustment before income tax 75.10
Standalone balance sheet As at 31 March 2017
As at 1 April 2016
Trade receivables (3,938.27) (3,863.17)
Adjustment to retained earnings (3,938.27) (3,863.17)
D.3 Newgen ESOP Trust consolidation
In previous GAAP, the Newgen ESOP Trust has been considered as a separate legal entity and loan
given to trust has been disclosed as a reduction from share capital and securities premium. However
under Ind AS, the ESOP trust has been treated as an extension of the Company and accordingly shares
held by Newgen ESOP Trust are netted off from the total share capital. Consequently, all the assets
and liabilities of the trust are accounted as assets and liabilities of the Company, except for profit / loss
on issue of shares to the employees and dividend received by trust which are directly adjusted in the
Newgen ESOP Trust reserve. The impact arising from the change is summarised below:

154 Newgen Software Technologies Limited 155ANNUAL REPORT 2017-18
CORPORATE REVIEW FINANCIAL STATEMENTSSTATUTORY REPORTS
Notes to the Standalone Financial Statements for the year ended 31st March, 2018(All amounts are in lakhs of Indian Rupees, unless otherwise stated)
Standalone balance sheet As at 31 March 2017
As at 1 April 2016
Cash and cash equivalents 17.01 74.03
Loans (2.00) (2.00)
Current financial assets 0.56 -
Trade payables 0.17 0.25
Share capital (107.01) (100.97)
Newgen ESOP reserve 200.22 175.75
Securities premium (78.57) (4.36)
Other current liabilities 0.77 1.35
Adjustment to retained earnings - -
D.4 Share - based payments measurement
Under the previous GAAP, the cost of equity-settled employee share-based plan were recognised using
the intrinsic value method. Under Ind AS, the cost of equity settled share-based plan is recognised
based on the fair value of the options as at the grant date. The impact arising from the change is
summarised below:
Standalone statement of profit and loss For the year ended
31 March 2017
Share based payment - equity settled 119.40
Adjustment before income tax 119.40
Standalone balance sheet As at 31 March 2017
As at 1 April 2016
Share options outstanding reserve 346.27 242.59
Securities premium 32.75 8.63
General reserve (0.69) -
Investment in subsidiary 22.97 15.25
Adjustment to retained earnings 355.37 235.97
D.5 Fair valuation of investments
Under the previous GAAP, investments in government bonds and mutual funds were classified as
long-term investments or current investments based on the intended holding period and realisability.
Long-term investments were carried at cost less provision for other than temporary decline in
the value of such investments. Current investments were carried at lower of cost and fair value.
Under Ind AS, these investments are required to be measured at fair value. The resulting fair value
changes of these investments (other than equity instruments designated as at FVOCI) have been
recognised in retained earnings as at the date of transition and subsequently in the profit or loss for the
year ended 31 March 2017. The impact arising from the change is summarised below:
Standalone statement of profit and loss For the year ended
31 March 2017
Fair value changes of financial assets at FVTPL - other expenses (0.71)
Adjustment before income tax (0.71)

156 Newgen Software Technologies Limited 157
Notes to the Standalone Financial Statements for the year ended 31st March, 2018(All amounts are in lakhs of Indian Rupees, unless otherwise stated)
Standalone other comprehensive income For the year ended
31 March 2017
Fair value changes of financial assets at FVOCI 26.59
Adjustment before income tax 26.59
Standalone balance sheet As at 31 March 2017
As at 1 April 2016
Current investment 41.75 14.46
Adjustment to retained earnings 41.75 14.46
D.6 Finance lease
Under the previous GAAP, leasehold land is capitalized at the amount of upfront premium paid and
annual rentals paid are charged to profit or loss.
Under Ind AS, the finance lease obligations are required to be measured at amortised costs. Accordingly,
the Company has recorded its lease obligations (premium and rentals) at amortised costs. The impact
arising from the change is summarised below:
Standalone statement of profit and loss For the year ended
31 March 2017
Interest expense 64.57
Depreciation on leasehold land 8.07
Rent expenses (65.85)
Adjustment before income tax 6.80
Standalone balance sheet As at 31 March 2017
As at 1 April 2016
Leasehold liability 593.73 600.54
Leasehold land 679.61 700.14
Prepayments (32.92) (32.92)
Interest accrued but not due (32.69) (25.69)
Adjustment to retained earnings 85.59 92.36
D.7 Measurement of security deposits at amortised costs
Under the previous GAAP, interest free lease security deposits are recorded at their transaction value.
Under Ind AS, all financial assets are required to be recognised at fair value. Accordingly, the Company
has fair valued these security deposits through amortised costs under Ind AS. Difference between the
fair value and transaction value of the security deposit has been recognised as prepaid rent. The impact
arising from the change is summarised below:
Standalone statement of profit and loss For the year ended
31 March 2017
Interest income 24.16
Rent expenses 25.91
Adjustment before income tax (1.75)

156 Newgen Software Technologies Limited 157ANNUAL REPORT 2017-18
CORPORATE REVIEW FINANCIAL STATEMENTSSTATUTORY REPORTS
Notes to the Standalone Financial Statements for the year ended 31st March, 2018(All amounts are in lakhs of Indian Rupees, unless otherwise stated)
Standalone balance sheet As at 31 March 2017
As at 1 April 2016
Loans (89.49) (69.71)
Prepayments 80.48 62.07
Adjustment to retained earnings (9.52) (7.63)
D.8 Proposed dividend
“Under the previous GAAP, dividends proposed by the board of directors after the balance sheet date
but before the approval of the financial statements were considered as adjusting events. Accordingly,
provision for proposed dividend (along with related dividend distribution tax) was recognised as a liability.
Under Ind AS, such dividends are recognised when the same is approved by the shareholders in the
general meeting. The impact arising from the change is summarised below: “
Standalone Balance sheet As at 31 March 2017
As at 1 April 2016
Short term provision (775.78)
Adjustment to retained earnings 775.78
D.9 Remeasurements of post-employment benefit obligations
Under Ind AS, re-measurements i.e. actuarial gains and losses are directly recognized in equity through
other comprehensive income. Under the previous GAAP such gains and losses were recognized in profit
or loss. As a result of this change, the profit for the year ended 31 March 2017 has increased by INR 82.88
lakhs. There is no impact on the total equity.
Standalone statement of profit and loss For the year ended
31 March 2017
Employee benefit expenses (82.88)
Adjustment before income tax (82.88)
Standalone Other Comprehensive Income For the year ended
31 March 2017
Re-measurement gain/(loss) on defined benefit obligations 82.88
Adjustment before income tax 82.88
Standalone balance sheet As at 31 March 2017
As at 1 April 2016
Other comprehensive income 82.88 -
Adjustment to retained earnings 82.88 -
D.10 Deferred tax adjustment
Previous GAAP requires deferred tax accounting using the income statement approach, which focuses
on differences between taxable profits and accounting profits for the period. Ind-AS 12 Income Taxes
requires entities to account for deferred taxes using the balance sheet approach, which focuses on
temporary differences between the carrying amount of an asset or liability in the balance sheet and its
tax base. The impact arising from the change is summarised below:

158 Newgen Software Technologies Limited 159
Standalone statement of profit and loss For the year ended
31 March 2017
Deferred tax charge 24.05
Adjustment before income tax 24.05
Standalone Other Comprehensive Income For the year ended
31 March 2017
Tax impact (19.12)
Adjustment before income tax (19.12)
Standalone balance sheet As at 31 March 2017
As at 1 April 2016
Deferred tax assets 1,343.72 1,348.58
Adjustment to retained earnings 1,343.72 1,348.58
Reconciliation of Equity as at 1 April 2016
Note As at 31 March 2016
(IGAAP)
Adjustment As at 1 April 2016
(IND AS)
ASSETS
Non-current assets
Property, plant and equipment D.6 5,528.98 700.14 6,229.12
Capital work-in-progress 604.61 - 604.61
Intangible assets 103.01 - 103.01
Investment in subsidiaries D.4 707.80 15.25 723.05
Financial assets
Loans D.7 & D.3 266.56 (71.71) 194.85
Other financial assets 169.79 - 169.79
Deferred tax assets (net) D.10 943.67 1,348.58 2,292.25
Income tax assets (net) 808.69 - 808.69
Other non-current assets D.7 - 46.07 46.07
Total non-current assets 9,133.11 2,038.33 11,171.45
Current assets
Financial assets
Investments D.5 4,501.68 14.46 4,516.14
Trade receivables D.2 19,438.35 (3,863.17) 15,575.18
Cash and cash equivalents D.3 2,009.96 74.03 2,083.99
Loans 35.04 - 35.04
Others 2,419.49 - 2,419.49
Other current assets D.6 & D.7 458.29 (16.92) 441.37
Total current assets 28,862.81 (3,791.59) 25,071.21
TOTAL ASSETS 37,995.92 (1,753.26) 36,242.66
EQUITY AND LIABILITIES
Equity
Equity share capital 50C 6,309.41 (100.97) 6,208.44
Other equity
Securities premium 50C 489.79 4.28 494.07
Retained earnings 50C 13,591.19 (2,009.37) 11,581.82
Notes to the Standalone Financial Statements for the year ended 31st March, 2018(All amounts are in lakhs of Indian Rupees, unless otherwise stated)

158 Newgen Software Technologies Limited 159ANNUAL REPORT 2017-18
CORPORATE REVIEW FINANCIAL STATEMENTSSTATUTORY REPORTS
Note As at 31 March 2016
(IGAAP)
Adjustment As at 1 April 2016
(IND AS)
Others (including items of other comprehensive income)
50C 1,835.82 416.13 2,251.95
Total Equity attributable to the owners of the Company
22,226.21 (1,689.93) 20,536.28
Non-current Liabilities
Financial liabilities
Borrowings D.6 1,316.91 600.54 1,917.45
Derivative D.1 - 136.00 136.00
Long-Term Provisions 1,121.59 - 1,121.59
Total non-current liabilities 2,438.50 736.54 3,175.04
Current liabilities
Financial liabilities
Borrowings 5,883.19 - 5,883.19
Trade payables D.3 1,405.22 0.25 1,405.47
Other financial liabilities D.6 2,072.45 (25.69) 2,046.76
Deferred Income 2,594.28 - 2,594.28
Other current liabilities D.3 410.42 1.35 411.77
Short term Provisions D.8 965.65 (775.78) 189.87
Total current liabilities 13,331.21 (799.87) 12,531.34
Total Liabilities 15,769.71 (63.33) 15,706.38
TOTAL EQUITY AND LIABILITIES 37,995.92 (1,753.26) 36,242.66
Reconciliation of Equity as at 31 March 2017
Note As at 31 March 2017
(IGAAP)
Adjustments As at 31 March 2017
(IND AS)
ASSETS
Non-current assets
Property, plant and equipment D.6 5,364.54 679.61 6,044.15
Capital work-in-progress 1,108.29 - 1,108.29
Intangible assets 70.43 - 70.43
Investment in subsidiaries D.4 885.14 22.97 908.11
Loans D.7 & D.3 322.64 (116.21) 206.43
Other financial assets 227.71 - 227.71
Deferred tax assets (net) D.10 1,012.52 1,343.72 2,356.24
Income tax assets (net) 852.26 - 852.26
Other non-current assets D.7 24.91 80.48 105.39
Total non-current assets 9,868.44 2,010.56 11,879.01
Current assets
Financial assets
Investments D.5 4,824.29 41.75 4,866.04
Trade receivables D.2 22,526.31 (3,938.27) 18,588.04
Notes to the Standalone Financial Statements for the year ended 31st March, 2018(All amounts are in lakhs of Indian Rupees, unless otherwise stated)

160 Newgen Software Technologies Limited 161
Notes to the Standalone Financial Statements for the year ended 31st March, 2018(All amounts are in lakhs of Indian Rupees, unless otherwise stated)
Note As at 31 March 2017
(IGAAP)
Adjustments As at 31 March 2017
(IND AS)
Cash and cash equivalents D.3 2,801.67 17.01 2,818.68
Loans D.7 & D.3 43.32 24.72 68.04
Others 2,609.39 - 2,609.39
Other current assets D.6 643.96 (32.92) 611.03
Total current assets 33,448.94 (3,887.70) 29,561.22
TOTAL ASSETS 43,317.38 (1,877.14) 41,440.23
EQUITY AND LIABILITIES
Equity
Equity share capital 50C 6,338.31 (107.01) 6,231.30
Other equity
Securities premium 50C 645.69 (45.82) 599.87
Retained earnings 50C 18,391.14 (2,792.71) 15,598.43
Others (including items of other comprehensive
income)
50C 1,833.12 506.42 2,339.54
Total equity attributable to the owners of the
Company
27,208.26 (2,439.12) 24,769.14
Non-current Liabilities
Financial liabilities
Borrowings D.6 1,024.26 593.73 1,617.99
Provisions 1,442.97 - 1,442.97
Total non-current liabilities 2,467.23 593.73 3,060.96
Current liabilities
Financial liabilities
Borrowings 5,226.18 - 5,226.18
Trade payables D.3 1,714.35 0.17 1,714.52
Other financial liabilities D.6 2,902.05 (32.69) 2,869.36
Deferred Income 3,038.66 - 3,038.66
Other current liabilities D.3 526.97 0.77 527.74
Short term Provisions 233.67 - 233.67
Total current liabilities 13,641.88 (31.75) 13,610.13
Total Liabilities 16,109.11 561.98 16,671.09
TOTAL EQUITY AND LIABILITIES 43,317.38 (1,877.14) 41,440.23
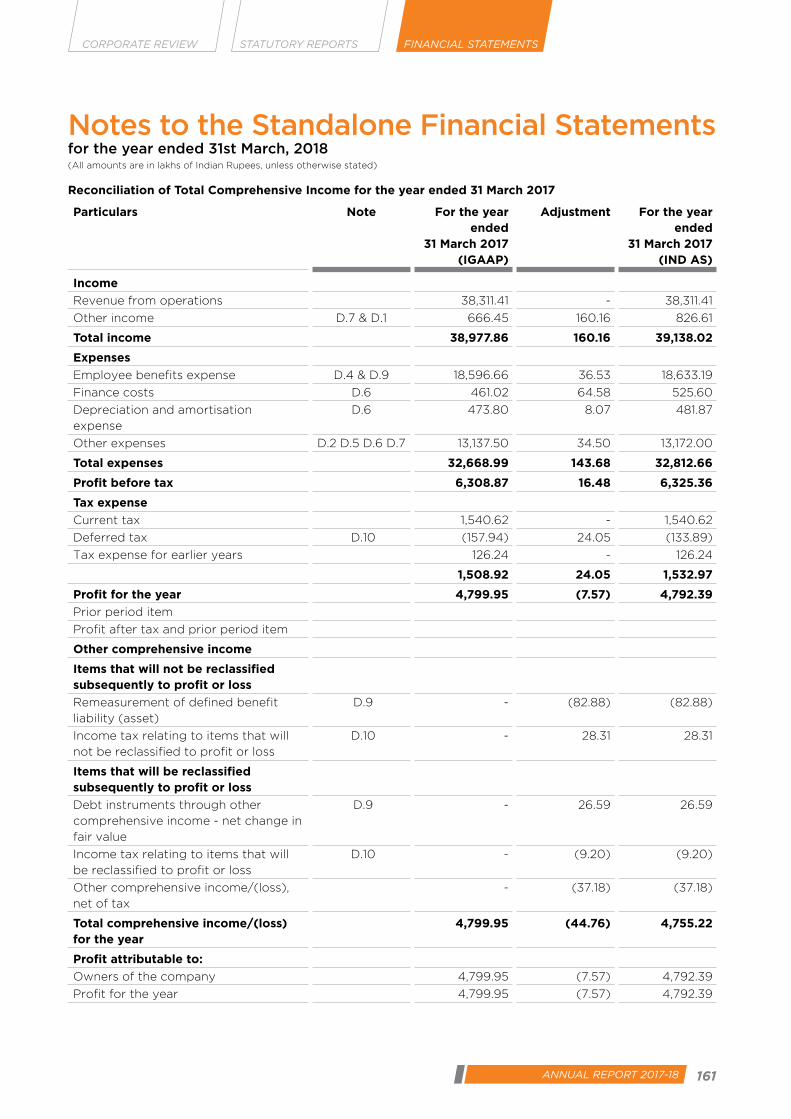
160 Newgen Software Technologies Limited 161ANNUAL REPORT 2017-18
CORPORATE REVIEW FINANCIAL STATEMENTSSTATUTORY REPORTS
Notes to the Standalone Financial Statements for the year ended 31st March, 2018(All amounts are in lakhs of Indian Rupees, unless otherwise stated)
Reconciliation of Total Comprehensive Income for the year ended 31 March 2017
Particulars Note For the year ended
31 March 2017 (IGAAP)
Adjustment For the year ended
31 March 2017 (IND AS)
Income
Revenue from operations 38,311.41 - 38,311.41
Other income D.7 & D.1 666.45 160.16 826.61
Total income 38,977.86 160.16 39,138.02
Expenses
Employee benefits expense D.4 & D.9 18,596.66 36.53 18,633.19
Finance costs D.6 461.02 64.58 525.60
Depreciation and amortisation
expense
D.6 473.80 8.07 481.87
Other expenses D.2 D.5 D.6 D.7 13,137.50 34.50 13,172.00
Total expenses 32,668.99 143.68 32,812.66
Profit before tax 6,308.87 16.48 6,325.36
Tax expense
Current tax 1,540.62 - 1,540.62
Deferred tax D.10 (157.94) 24.05 (133.89)
Tax expense for earlier years 126.24 - 126.24
1,508.92 24.05 1,532.97
Profit for the year 4,799.95 (7.57) 4,792.39
Prior period item
Profit after tax and prior period item
Other comprehensive income
Items that will not be reclassified subsequently to profit or loss
Remeasurement of defined benefit
liability (asset)
D.9 - (82.88) (82.88)
Income tax relating to items that will
not be reclassified to profit or loss
D.10 - 28.31 28.31
Items that will be reclassified subsequently to profit or loss
Debt instruments through other
comprehensive income - net change in
fair value
D.9 - 26.59 26.59
Income tax relating to items that will
be reclassified to profit or loss
D.10 - (9.20) (9.20)
Other comprehensive income/(loss),
net of tax
- (37.18) (37.18)
Total comprehensive income/(loss) for the year
4,799.95 (44.76) 4,755.22
Profit attributable to:
Owners of the company 4,799.95 (7.57) 4,792.39
Profit for the year 4,799.95 (7.57) 4,792.39

162 Newgen Software Technologies Limited 163
Particulars Note For the year ended
31 March 2017 (IGAAP)
Adjustment For the year ended
31 March 2017 (IND AS)
Other comprehensive income attributable to:
Owners of the company - (37.18) (37.18)
Other comprehensive income/(loss)
for the year
- (37.18) (37.18)
Total comprehensive income attributable to:Owners of the company 4,799.95 (44.76) 4,755.21
Total comprehensive income/(loss) for
the year
4,799.95 (44.76) 4,755.21
51 Standards issued but not yet effective
A Amendment to Ind AS 21:
Appendix B to Ind AS 21, Foreign currency transactions and advance consideration: On March 28, 2018,
MCA has notified the Companies (Indian Accounting Standards) Amendment Rules, 2018 containing
Appendix B to Ind AS 21, Foreign currency transactions and advance consideration which clarifies the
date of the transaction for the purpose of determining the exchange rate to use on initial recognition
of the related asset, expense or income, when an entity has received or paid advance consideration in a
foreign currency. This amendment will come into force from April 1, 2018. The Company has evaluated
the effect of this on the standalone financial statements and the impact is not material.
B Amendment to Ind AS 115:
Ind AS 115- Revenue from Contracts with Customers: On 28 March 2018, Ministry of Corporate Affairs
(“MCA”) has notified the Ind AS 115, Revenue from Contract with Customers. The core principle of the
new standard is that an entity should recognise revenue to depict the transfer of promised goods or
services to customers in an amount that reflects the consideration to which the entity expects to be
entitled in exchange for those goods or services.
Under Ind AS 115, an entity recognises revenue when (or as) a performance obligation is satisfied, i.e.
when ‘control’ of the goods or services underlying the particular performance obligation is transferred
to the customer.
Moreover, the new standard requires enhanced disclosures about the nature, amount, timing and
uncertainty of revenue and cash flows arising from the entity’s contracts with customers. The standard
permits two possible methods of transition:
• Retrospective approach-Under this approach the standard will be applied retrospectively to each
prior reporting period presented in accordance with Ind AS 8-Accounting Policies, Changes in
Accounting Estimates and Errors
• Retrospectively with cumulative effect of initially applying the standard recognized at the date of
initial application (Cumulative catch - up approach)The effective date for adoption of Ind AS 115 is
financial periods beginning on or after April 1, 2018.
The Company will adopt the standard on April 1, 2018 by using the cumulative catch-up transition method and
accordingly comparatives for the year ending or ended March 31, 2018 will not be retrospectively adjusted.
While, the Company is in the process of implementing Ind AS 115 on financial statement, it is of the view
that the accounting policy for certain streams of revenue and related expenses may undergo a change
primarily on account of estimating and recognizing extended warranty and unspecified free upgrades
in certain contracts and adjusting cost of acquisition of customer.
Notes to the Standalone Financial Statements for the year ended 31st March, 2018(All amounts are in lakhs of Indian Rupees, unless otherwise stated)

162 Newgen Software Technologies Limited 163ANNUAL REPORT 2017-18
CORPORATE REVIEW FINANCIAL STATEMENTSSTATUTORY REPORTS
52 Disclosure on Specified Bank Notes
The disclosures regarding details of specified bank notes held and transacted during 8 November 2016 to 30 December 2016 has not been made since the requirement does not pertain to financial year ended 31 March 2018. Corresponding amounts as appearing in the audited financial statements for the year ended 31 March 2017 have been disclosed as given below;
Particulars Specified Bank Notes*
Other denomination
notes
Total
Closing cash in hand as on 8 November 2016 3.96 1.25 5.21
Add: Withdrawal from bank account - 3.80 3.80
Add: Permitted receipts transactions - 1.24 1.24
Less: Permitted payments transactions - 3.60 3.60
Less: Amount deposited in banks accounts 3.96 - 3.96
Closing cash in hand as on 30 December 2016 - 2.69 2.69
For the purposes of this clause, the term ‘Specified Bank Notes’ shall have the same meaning provided
in the notification of the Government of India, in the Ministry of Finance, Department of Economic
Affairs number S.O. 3407(E), dated 8th November 2016.
53 As at 31 March 2018, the Company has gross foreign currency receivables amounting to Rs. 15,310.75 lakhs (previous year Rs.14,344.84 lakhs). Out of these receivables, Rs.4,253.83 lakhs (previous year Rs.3,754.91 lakhs) is outstanding for more than 9 months. As per Foreign Exchange Management (Current Account) Rules, 2000 read with Master Circular No. 14/ 2014-15 dated 1 July 2014, receipt for export goods should be realized within a period of 9 months from the date of export. In case of receivables not being realised within 15 months from the date of export, prior approval from Reserve Bank of India (RBI) is required. As per the requirements of Foreign Exchange Management Act, in one calendar year, the Company is allowed to seek extension for an amount equivalent to 10% of the average collection of the last 3 years only and pursuant to the same, the Company has filed the extension for foreign currency receivables amounting to Rs. 1,414.58 lakhs during the year. For remaining receivables, the Company is in the process of applying for approval to seek extension of time beyond 9 months from export date. The management is of the view that the Company will be able to obtain approvals from the authorities for realising such funds beyond the stipulated timeline without levy of any penalties as it had bonafide reasons that caused the delays in realization.
Notes to the Standalone Financial Statements for the year ended 31st March, 2018(All amounts are in lakhs of Indian Rupees, unless otherwise stated)
As per our report of even date attached
For B S R & Associates LLP For and on behalf of the Board of Directors of
Chartered Accountants Newgen Software Technologies LimitedFirm Registration No.:
116231W / W-100024
Rakesh Dewan Diwakar Nigam T. S. Varadarajan Arun Kumar Gupta Aman MouryaPartner Managing Director Whole Time Director Chief Financial Officer Company SecretaryMembership No.: 092212 DIN: 00263222 DIN: 00263115 Membership No: 27299
Place: Gurugram Place: New Delhi Place: New Delhi Place: New Delhi Place: New DelhiDate: 17 May 2018 Date: 17 May 2018 Date: 17 May 2018 Date: 17 May 2018 Date: 17 May 2018

164 Newgen Software Technologies Limited
Independent Auditor’s Report
To the Members of Newgen Software Technologies Limited
Report on the Audit of Consolidated Ind AS Financial StatementsWe have audited the accompanying consolidated
Ind AS financial statements of Newgen Software
Technologies Limited (hereinafter referred to as “the
Holding Company”) and its subsidiaries (the Holding
Company and its subsidiaries together referred to
as “the Group”), which comprise the Consolidated
Balance Sheet as at 31 March 2018, the Consolidated
Statement of Profit and Loss (including other
comprehensive income), Consolidated Statement of
Changes in Equity and the Consolidated Cash Flow
Statement, for the year then ended, including a
summary of significant accounting policies and other
explanatory information (hereinafter referred to as
“the consolidated Ind AS financial statements”).
Management’s Responsibility for the Consolidated Ind AS Financial StatementsThe Holding Company’s Board of Directors is
responsible for the preparation of these consolidated
financial statements in terms of the requirements
of the Companies Act, 2013 (hereinafter referred
to as “the Act”) that give a true and fair view of
the consolidated state of affairs, consolidated
profit (including other comprehensive income),
consolidated statement of changes in equity and
consolidated cash flows of the Group in accordance
with the accounting principles generally accepted
in India, including the Indian Accounting Standards
(Ind AS) specified under section 133 of the Act.
The respective Board of Directors of the companies
included in the Group are responsible for maintenance
of adequate accounting records in accordance with
the provisions of the Act for safeguarding the assets
of the Group and for preventing and detecting frauds
and other irregularities; the selection and application
of appropriate accounting policies; making judgments
and estimates that are reasonable and prudent;
and the design, implementation and maintenance
of adequate internal financial controls that were
operating effectively for ensuring the accuracy and
completeness of the accounting records, relevant to
the preparation and presentation of the consolidated
financial statements that give a true and fair view
and are free from material misstatement, whether
due to fraud or error, which have been used for the
purpose of preparation of the consolidated financial
statements by the Directors of the Holding Company,
as aforesaid.
In preparing the consolidated financial statements,
the respective Board of Directors of the companies
included in the Group are responsible for assessing
the ability of the Group to continue as a going
concern, disclosing, as applicable, matters related
to going concern and using the going concern basis
of accounting unless management either intends to
liquidate the Group or to cease operations, or has no
realistic alternative but to do so.
Auditor’s ResponsibilityOur responsibility is to express an opinion on these
consolidated financial statements based on our
audit. While conducting the audit, we have taken into
account the provisions of the Act, the accounting and
auditing standards and matters which are required to
be included in the audit report under the provisions of
the Act and the Rules made thereunder.
We conducted our audit in accordance with the
Standards on Auditing specified under Section 143
(10) of the Act. Those Standards require that we
comply with ethical requirements and plan and
perform the audit to obtain reasonable assurance
about whether the consolidated financial statements
are free from material misstatement.
An audit involves performing procedures to
obtain audit evidence about the amounts and the
disclosures in the consolidated financial statements.
The procedures selected depend on the auditor’s
judgment, including the assessment of the risks of
material misstatement of the consolidated financial
statements, whether due to fraud or error. In making
those risk assessments, the auditor considers
internal financial control relevant to the Holding
Company’s preparation of the consolidated financial
statements that give a true and fair view in order to
design audit procedures that are appropriate in the
circumstances. An audit also includes evaluating
the appropriateness of the accounting policies used
and the reasonableness of the accounting estimates
made, as well as evaluating the overall presentation of
the consolidated financial statements.
We are also responsible to conclude on the
appropriateness of management’s use of the going
concern basis of accounting and, based on the audit
evidence obtained, whether a material uncertainty
exists related to events or conditions that may cast

165ANNUAL REPORT 2017-18
CORPORATE REVIEW FINANCIAL STATEMENTSSTATUTORY REPORTS
significant doubt on the ability of Group to continue
as a going concern. If we conclude that a material
uncertainty exists, we are required to draw attention
in the auditor’s report to the related disclosures
in the consolidated financial statements or, if such
disclosures are inadequate, to modify our opinion. Our
conclusions are based on the audit evidence obtained
up to the date of our auditor’s report. However, future
events or conditions may cause Group to cease to
continue as a going concern.
We believe that the audit evidence obtained by us
and the audit evidence obtained by the other auditors
in terms of their reports referred to in sub-paragraph 1
(a) of the Other Matters paragraph below, is sufficient
and appropriate to provide a basis for our audit
opinion on the consolidated financial statements.
OpinionIn our opinion and to the best of our information
and according to the explanations given to us and
based on the consideration of reports of other
auditors on separate financial statements and on
the other financial information of the subsidiaries,
the aforesaid consolidated financial statements give
the information required by the Act in the manner so
required and give a true and fair view in conformity
with the accounting principles generally accepted
in India, of the consolidated state of affairs of the
Group as at 31 March 2018, and their consolidated
profit (including other comprehensive income),
consolidated statement of changes in equity and
consolidated cash flows for the year ended on that
date.
Other Matters1. (a) We did not audit the financial statements of
five subsidiaries, whose financial statements
reflect total assets of INR 1,520 lakhs and net
assets of Rs. 559.13 lakhs as at 31 March 2018,
total revenues of INR 2,418 lakhs and net
cash inflows amounting to INR 300 lakhs for
the year ended on that date, as considered in
the consolidated financial statements. These
financial statements have been audited by
other auditors whose reports have been
furnished to us by the Management and
our opinion on the consolidated financial
statements, in so far as it relates to the
amounts and disclosures included in respect
of these subsidiaries and our report in terms
of sub-section (3) of Section 143 of the
Act, insofar as it relates to the aforesaid
subsidiaries is based solely on the reports of
the other auditors.
Certain of these subsidiaries are located
outside India whose financial statements
have been prepared in accordance with
accounting principles generally accepted
in their respective countries and which
have been audited by other auditors under
generally accepted auditing standards
applicable in their respective countries. The
Company’s management has converted the
financial statements of such subsidiaries
located outside India from accounting
principles generally accepted in their
respective countries to accounting principles
generally accepted in India. We have audited
these conversion adjustments made by the
Company’s management. Our opinion in so
far as it relates to the balances and affairs
of such subsidiaries located outside India is
based on the report of other auditors and
the conversion adjustments prepared by the
management of the Company and audited
by us.
Our opinion above on the consolidated
financial statements, and our report on
Other Legal and Regulatory Requirements
below, is not modified in respect of the
above matters with respect to our reliance
on the work done and the reports of the
other auditors.
Report on Other Legal and Regulatory Requirements1. As required by Section 143(3) of the Act, based
on our audit and on the consideration of report
of the other auditors on separate financial
statements of subsidiaries, as noted in the ‘Other
Matters’ paragraph, we report, to the extent
applicable, that:
a) We have sought and obtained all the
information and explanations which to
the best of our knowledge and belief were
necessary for the purposes of our audit of the
aforesaid consolidated financial statements.
b) In our opinion, proper books of account as
required by law relating to preparation of the
aforesaid consolidated financial statements
have been kept so far as it appears from our
examination of those books and the reports
of the other auditors.
166 Newgen Software Technologies Limited
c) The Consolidated Balance Sheet, the
Consolidated Statement of Profit and Loss
(including other comprehensive income),
the Consolidated Cash Flow Statement
and Consolidated Statement of Changes
in Equity dealt with by this Report are
in agreement with the relevant books of
account maintained for the purpose of
preparation of the consolidated financial
statements.
d) In our opinion, the aforesaid consolidated
financial statements comply with the Indian
Accounting Standards specified under
section 133 of the Act.
e) On the basis of the written representations
received from the directors of the Holding
Company as on 31 March 2018 taken on
record by the Board of Directors of the
Holding Company and the reports of the
statutory auditor of its subsidiary company
incorporated in India, none of the directors
of the Group company incorporated in India
is disqualified as on 31 March 2018 from
being appointed as a director in terms of
Section 164(2) of the Act.
f) With respect to the adequacy of the internal
financial controls with reference to financial
statements of the Holding Company and its
subsidiary company incorporated in India
and the operating effectiveness of such
controls, refer to our separate Report in
“Annexure A”.
g) With respect to the other matters to
be included in the Auditor’s Report in
accordance with Rule 11 of the Companies
(Audit and Auditor’s) Rules, 2014, in our
opinion and to the best of our information
and according to the explanations given to
us and based on the consideration of the
report of the other auditors on separate
financial statements of the subsidiaries, as
noted in the ‘Other Matters’ paragraph:
i. There were no pending litigations as at
31 March 2018 which would impact the
consolidated financial position of the
Group;
ii. The Group did not have any material
foreseeable losses on long-term
contracts including derivative contracts
during the year ended 31 March 2018;
iii. There are no amounts which are
required to be transferred to the Investor
Education and Protection Fund by the
Holding Company and its subsidiary
company incorporated in India during
the year ended 31 March 2018; and
iv. The disclosures in the consolidated
financial statements regarding holdings
as well as dealings in specified bank notes
during the period from 8 November
2016 to 30 December 2016 have not
been made since they do not pertain
to the financial year ended 31 March
2018. However, amounts as appearing
in the audited consolidated financial
statements for the period ended 31
March 2017 have been disclosed.
For B S R & Associates LLP
Chartered Accountants
Firm Registration No.:
116231W/ W-100024
Rakesh Dewan
Place: Gurugram Partner
Date: 17 May 2018 Membership No.: 092212

167ANNUAL REPORT 2017-18
CORPORATE REVIEW FINANCIAL STATEMENTSSTATUTORY REPORTS
Annexure AAnnexure A referred in paragraph 6(i)(f) of the Independent Auditor’s Report of even date on the Consolidated Financial Statements of Newgen Software Technologies Limited for the year ended 31 March 2018
Report on the Internal Financial Controls under Clause (i) of Sub-section 3 of Section 143 of the Companies Act, 2013 (“the Act”)In conjunction with our audit of the consolidated
financial statements of the Group as of and for the
year ending 31 March 2018, we have audited the
internal financial controls with reference to financial
statements of the Holding Company and its subsidiary
company incorporated in India as of that date.
Management’s Responsibility for Internal Financial ControlsThe respective Board of Directors of the Holding
Company and its subsidiary company incorporated in
India, are responsible for establishing and maintaining
internal financial controls based on the internal
control with reference to financial statements criteria
established by the Holding Company and its subsidiary
company considering the essential components of
internal control stated in the Guidance Note on Audit
of Internal Financial Controls over Financial Reporting
issued by the Institute of Chartered Accountants
of India (‘ICAI’). These responsibilities include the
design, implementation and maintenance of adequate
internal financial controls that were operating
effectively for ensuring the orderly and efficient
conduct of its business, including adherence to the
respective Company’s policies, the safeguarding of
its assets, the prevention and detection of frauds
and errors, the accuracy and completeness of the
accounting records, and the timely preparation of
reliable financial information, as required under the
Companies Act, 2013.
Auditors’ ResponsibilityOur responsibility is to express an opinion on the
Holding Company’s and its subsidiary company’s
incorporated in India, internal financial controls with
reference to financial statements based on our audit.
We conducted our audit in accordance with the
Guidance Note on Audit of Internal Financial Controls
Over Financial Reporting (the “Guidance Note”)
and the Standards on Auditing, issued by ICAI and
deemed to be prescribed under section 143(10) of
the Companies Act, 2013, to the extent applicable
to an audit of internal financial controls, both issued
by the Institute of Chartered Accountants of India.
Those Standards and the Guidance Note require that
we comply with ethical requirements and plan and
perform the audit to obtain reasonable assurance
about whether adequate internal financial controls
with reference to financial statements was established
and maintained and if such controls operated
effectively in all material respects.
Our audit involves performing procedures to obtain
audit evidence about the adequacy of the internal
financial controls system with reference to financial
statements and their operating effectiveness. Our audit
of internal financial controls with reference to financial
statements included obtaining an understanding of
internal financial controls with reference to financial
statements, assessing the risk that a material weakness
exists, and testing and evaluating the design and
operating effectiveness of internal control based on
the assessed risk. The procedures selected depend on
the auditor’s judgement, including the assessment of
the risks of material misstatement of the consolidated
financial statements, whether due to fraud or error.
We believe that the audit evidence we have obtained
and audit evidence obtained by other auditor in terms
of their report referred to in Other Matters Paragraph
below, is sufficient and appropriate to provide a basis
for our audit opinion on the Holding Company’s and
subsidiary company incorporated in India, internal
financial controls system with reference to financial
statements.
Meaning of Internal Financial Controls with reference to financial statementsA Company’s internal financial control with reference
to financial statements is a process designed
to provide reasonable assurance regarding the
reliability of financial reporting and the preparation
of consolidated financial statements for external
purposes in accordance with generally accepted
accounting principles. A Company’s internal financial
control with reference to financial statements includes
those policies and procedures that (1) pertain to the
maintenance of records that, in reasonable detail,
accurately and fairly reflect the transactions and
dispositions of the assets of the company; (2) provide
reasonable assurance that transactions are recorded
as necessary to permit preparation of consolidated
financial statements in accordance with generally
accepted accounting principles, and that receipts and
expenditures of the company are being made only in
accordance with authorisations of management and
directors of the Company; and (3) provide reasonable
assurance regarding prevention or timely detection
of unauthorised acquisition, use, or disposition of the
company’s assets that could have a material effect on

168 Newgen Software Technologies Limited
the consolidated financial statements.
Inherent Limitations of Internal Financial Controls with reference to financial statementsBecause of the inherent limitations of internal
financial controls with reference to financial
statements, including the possibility of collusion or
improper management override of controls, material
misstatements due to error or fraud may occur and not
be detected. Also, projections of any evaluation of the
internal financial controls with reference to financial
statements to future periods are subject to the risk
that the internal financial control with reference
to financial statements may become inadequate
because of changes in conditions, or that the degree
of compliance with the policies or procedures may
deteriorate.
OpinionIn our opinion, the Holding Company and its
subsidiary company incorporated in India, has in
all material respects, an adequate internal financial
controls system with reference to financial statements
and such internal financial controls with reference to
financial statements were operating effectively as
at 31 March 2018, based on the internal control with
reference to financial statements criteria established
by the Holding Company considering the essential
components of internal control stated in the Guidance
Note on Audit of Internal Financial Controls Over
Financial Reporting, issued by the ICAI.
Other MattersOur aforesaid report under Section 143(3)(i) of the
Act on the adequacy and operating effectiveness
of the internal financial controls with reference to
financial statements in so far as it relates to Newgen
Computer Technologies Limited (subsidiary company
incorporated in India) is based on the corresponding
report of the auditor of the subsidiary.
For B S R & Associates LLP
Chartered Accountants
Firm Registration No.:
116231W/ W-100024
Rakesh Dewan
Place: Gurugram Partner
Date: 17 May 2018 Membership No.: 092212

169ANNUAL REPORT 2017-18
CORPORATE REVIEW FINANCIAL STATEMENTSSTATUTORY REPORTS
As per our report of even date attached
For B S R & Associates LLP For and of behalf of the Board of Directors of
Chartered Accountants Newgen Software Technologies LimitedFirm Registration No.:
116231W / W-100024
Rakesh Dewan Diwakar Nigam T. S. Varadarajan Arun Kumar Gupta Aman MouryaPartner Managing Director Whole Time Director Chief Financial Officer Company SecretaryMembership No.: 092212 DIN: 00263222 DIN: 00263115 Membership No: 27299
Place: Gurugram Place: New Delhi Place: New Delhi Place: New Delhi Place: New DelhiDate: 17 May 2018 Date: 17 May 2018 Date: 17 May 2018 Date: 17 May 2018 Date: 17 May 2018
Consolidated Balance Sheet as at March 31, 2018(All amounts are in lakhs of Indian Rupees, unless otherwise stated)
Note As at 31 March 2018
As at 31 March 2017
As at 1 April 2016
ASSETSNon-current assetsProperty, plant and equipment 4 6,757.93 6,103.12 6,292.96Capital work-in-progress 4 1,659.48 1,108.29 604.61Intangible assets 5 89.56 70.43 103.01Financial assets
Loans 6 295.70 226.68 210.99Other financial assets 7 554.77 233.46 174.36
Deferred tax assets (net) 32 1,893.13 2,370.39 2,380.31Income tax assets (net) 8 1,281.29 852.41 808.71Other non-current assets 9 356.23 105.39 62.07Total non-current assets 12,888.09 11,070.17 10,637.02Current assetsFinancial assets
Investments 10 5,022.07 4,866.04 4,516.14Trade receivables 11 22,201.67 19,957.12 16,435.80Cash and cash equivalents 12 14,548.34 3,491.88 2,431.78Loans 13 317.27 72.70 81.31Other financial assets 14 5,177.19 2,541.04 2,451.06
Other current assets 15 747.53 746.19 520.89Total current assets 48,014.07 31,674.97 26,436.98TOTAL ASSETS 60,902.16 42,745.14 37,074.00EQUITY AND LIABILITIESEquityShare capital 16 6,788.41 6,231.30 6,208.44Other equity
Securities premium 9,196.49 599.87 494.07Retained earnings 22,055.71 15,928.02 11,570.79Others (including items of other comprehensive income) 2,481.65 2,235.19 2,252.15
Total equity 40,522.26 24,994.38 20,525.45Non-current LiabilitiesFinancial liabilities
Borrowings 17 1,316.66 1,617.99 1,917.45Derivative 18 - - 136.00
Deferred tax liabilities 32 11.28 15.19 24.64Provisions 19 1,653.37 1,442.97 1,121.58Total non-current liabilities 2,981.31 3,076.15 3,199.67Current liabilitiesFinancial liabilities
Borrowings 20 4,946.27 5,226.18 5,883.19Trade payables 21 2,292.10 1,804.95 1,473.16Other financial liabilities 22 3,624.48 2,903.21 2,058.16
Deferred income 23 4,943.04 3,865.50 3,271.60Other current liabilities 24 1,372.04 546.00 414.53Provisions 25 220.66 328.77 248.24Total current liabilities 17,398.59 14,674.61 13,348.88Total Liabilities 20,379.90 17,750.76 16,548.55TOTAL EQUITY AND LIABILITIES 60,902.16 42,745.14 37,074.00Summary of significant accounting policies 3
The accompanying notes are an integral part of the Consolidated Financial Statements
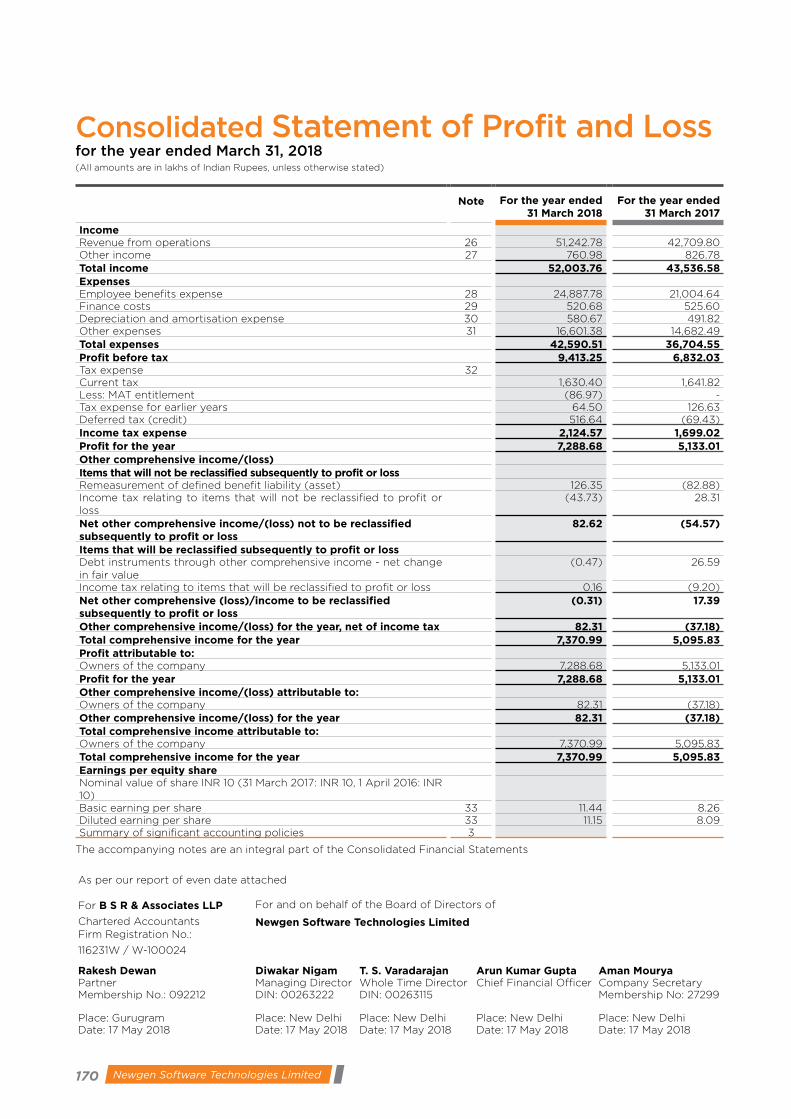
170 Newgen Software Technologies Limited
As per our report of even date attached
For B S R & Associates LLP For and on behalf of the Board of Directors of
Chartered Accountants Newgen Software Technologies LimitedFirm Registration No.:
116231W / W-100024
Rakesh Dewan Diwakar Nigam T. S. Varadarajan Arun Kumar Gupta Aman MouryaPartner Managing Director Whole Time Director Chief Financial Officer Company SecretaryMembership No.: 092212 DIN: 00263222 DIN: 00263115 Membership No: 27299
Place: Gurugram Place: New Delhi Place: New Delhi Place: New Delhi Place: New DelhiDate: 17 May 2018 Date: 17 May 2018 Date: 17 May 2018 Date: 17 May 2018 Date: 17 May 2018
Consolidated Statement of Profit and Loss for the year ended March 31, 2018(All amounts are in lakhs of Indian Rupees, unless otherwise stated)
Note For the year ended 31 March 2018
For the year ended 31 March 2017
IncomeRevenue from operations 26 51,242.78 42,709.80Other income 27 760.98 826.78Total income 52,003.76 43,536.58ExpensesEmployee benefits expense 28 24,887.78 21,004.64Finance costs 29 520.68 525.60Depreciation and amortisation expense 30 580.67 491.82Other expenses 31 16,601.38 14,682.49Total expenses 42,590.51 36,704.55Profit before tax 9,413.25 6,832.03Tax expense 32Current tax 1,630.40 1,641.82Less: MAT entitlement (86.97) -Tax expense for earlier years 64.50 126.63Deferred tax (credit) 516.64 (69.43)Income tax expense 2,124.57 1,699.02Profit for the year 7,288.68 5,133.01Other comprehensive income/(loss)Items that will not be reclassified subsequently to profit or lossRemeasurement of defined benefit liability (asset) 126.35 (82.88)Income tax relating to items that will not be reclassified to profit or loss
(43.73) 28.31
Net other comprehensive income/(loss) not to be reclassified subsequently to profit or loss
82.62 (54.57)
Items that will be reclassified subsequently to profit or lossDebt instruments through other comprehensive income - net change in fair value
(0.47) 26.59
Income tax relating to items that will be reclassified to profit or loss 0.16 (9.20)Net other comprehensive (loss)/income to be reclassified subsequently to profit or loss
(0.31) 17.39
Other comprehensive income/(loss) for the year, net of income tax 82.31 (37.18)Total comprehensive income for the year 7,370.99 5,095.83Profit attributable to:Owners of the company 7,288.68 5,133.01Profit for the year 7,288.68 5,133.01Other comprehensive income/(loss) attributable to:Owners of the company 82.31 (37.18)Other comprehensive income/(loss) for the year 82.31 (37.18)Total comprehensive income attributable to:Owners of the company 7,370.99 5,095.83Total comprehensive income for the year 7,370.99 5,095.83Earnings per equity shareNominal value of share INR 10 (31 March 2017: INR 10, 1 April 2016: INR 10)Basic earning per share 33 11.44 8.26Diluted earning per share 33 11.15 8.09Summary of significant accounting policies 3
The accompanying notes are an integral part of the Consolidated Financial Statements

171ANNUAL REPORT 2017-18
CORPORATE REVIEW FINANCIAL STATEMENTSSTATUTORY REPORTS
Co
nso
lid
ate
d S
tate
me
nt
of
Ch
an
ge
s in
Eq
uit
yas
at
31
Marc
h 2
018
(All a
mo
un
ts a
re in
lakh
s o
f In
dia
n R
up
ee
s, u
nle
ss o
the
rwis
e s
tate
d)
a.
Sh
are
cap
ital
Eq
uit
y s
hare
cap
ital
Eq
uit
y s
hare
cap
ital
wit
h d
iffe
ren
tial
vo
tin
g
rig
ht
Pre
fere
nce
sh
are
cap
ital
Tota
l sh
are
cap
ital
Part
icu
lars
Nu
mb
er
Am
ou
nt
Nu
mb
er
Am
ou
nt
Nu
mb
er
Am
ou
nt
Am
ou
nt
Bala
nce
as
at
31
Marc
h 2
016
54
,013
,80
0
5,4
01.3
8
120
0
.01
10
,29
4,2
30
10
29
.42
6,4
30
.81
Less
: S
hare
s h
eld
by t
rust
2,2
23
,73
5
222.3
7
-
-
-
-
222.3
7
Tota
l S
hare
cap
ital
as
at
31
Marc
h 2
016
51,
79
0,0
65
5
,17
9.0
1 1
20
0
.01
10
,29
4,2
30
1
,02
9.4
2
6,2
08
.44
Bala
nce
as
at
1 A
pri
l 2
016
54
,013
,80
0
5,4
01.3
8
120
0
.01
10
,29
4,2
30
1
,029
.42
6,4
30
.81
Ch
an
ges
in e
qu
ity s
hare
cap
ital d
uri
ng
th
e y
ear
on
acco
un
t o
f co
nvers
ion
of
co
mp
uls
ory
co
nvert
ible
pre
fere
nce s
hare
s
10
,29
4,2
30
1
,029
.42
(10
,29
4,2
30
) (
1,0
29
.42)
-
Bala
nce
as
at
31
Marc
h 2
017
64
,30
8,0
30
6
,43
0.8
0
120
0
.01
-
-
6,4
30
.81
Less
: S
hare
s h
eld
by t
rust
1,9
95
,06
4
19
9.5
1 -
-
-
-
1
99
.51
Tota
l S
hare
cap
ital
as
at
31
Marc
h 2
017
62
,312
,96
6
6,2
31.
29
1
20
0
.01
-
-
6,2
31.
30
Bala
nce a
s at
31
Marc
h 2
017
64
,30
8,0
30
6
,43
0.8
0
120
0
.01
-
-
6,4
30
.81
Ad
d: E
qu
ity s
hare
s w
ith
dif
fere
nti
al vo
tin
g r
igh
ts
recla
ssif
ied
to
eq
uit
y s
hare
s d
uri
ng
th
e y
ear
120
0
.01
(12
0)
(0
.01)
-
-
-
Ad
d: F
resh
iss
ue d
uri
ng
th
e y
ear
3,8
77,
55
1 3
87.
76
-
-
-
-
3
87.
76
Ad
d: Is
sued
du
rin
g t
he y
ear
to N
ew
gen
ES
OP
Tru
st
1,0
50
,00
0
10
5.0
0
-
-
-
-
10
5.0
0
Bala
nce
as
at
31
Marc
h 2
018
69
,23
5,7
01
6,9
23
.57
-
-
-
-
6
,92
3.5
7
Less
: S
hare
s h
eld
by t
rust
1,3
51,5
84
1
35
.16
-
-
-
-
13
5.16
Tota
l S
hare
cap
ital
as
at
31
Marc
h 2
018
67,
88
4,1
17
6,7
88
.41
-
-
-
-
6,7
88
.41

172 Newgen Software Technologies Limited
b.
Oth
er
eq
uit
y
Part
icu
lars
Se
curi
tie
s p
rem
ium
*R
eta
ine
d
earn
ing
sO
the
rsIt
em
s o
f O
the
r co
mp
reh
en
sive
in
com
eTo
tal
att
rib
uta
ble
to
ow
ne
rs
of
the
C
om
pan
y
Cap
ital
red
em
pti
on
re
serv
e
Ge
ne
ral
rese
rve
Cap
ital
rese
rve
Fo
reig
n
curr
en
cy
tran
slati
on
re
serv
e*
New
ge
n
ES
OP
Tru
st
rese
rve*
Sh
are
o
pti
on
s o
uts
tan
din
g
rese
rve*
Re
me
asu
rem
en
t o
f d
efi
ne
d
be
ne
fit
liab
ilit
y
De
bt
inst
rum
en
ts
thro
ug
h
OC
I
Bala
nce
as
at
31
Marc
h 2
016
1,
141.
87
11
,570
.79
8
7.9
5
1,73
1.3
9
0.2
1 -
175
.75
2
59
.07
-
(2.2
1)14
,96
4.8
2
Less
: Secu
riti
es
pre
miu
m o
n s
hare
s h
eld
by t
rust
(6
47.
80
)(6
47.
80
)
Tota
l B
ala
nce
as
at
31
Marc
h 2
016
4
94
.07
11
,570
.79
8
7.9
5
1,73
1.3
9
0.2
1 -
175
.75
2
59
.07
-
(2.2
1)14
,317
.02
Bala
nce
as
at
1 A
pri
l 2
016
1,
141.
87
11
,570
.79
8
7.9
5
1,73
1.3
9
0.2
1 -
175
.75
2
59
.07
-
(2.2
1)14
,96
4.8
2
Tota
l co
mp
reh
en
sive
in
com
e f
or
the
ye
ar
en
de
d 3
1 M
arc
h 2
017
P
rofi
t fo
r th
e y
ear
- 5
,133
.01
- -
- -
- -
- -
5,1
33
.01
Fo
reig
n c
urr
en
cy t
ran
slati
on
rese
rve
- -
- -
- (1
04
.54
)-
- -
- (1
04
.54
)O
the
r co
mp
reh
en
sive
in
com
e (
ne
t o
f ta
x)
- -
- -
- -
(54
.57)
17.3
8
(37.
19)
Tran
sacti
on
s w
ith
ow
ners
, reco
rded
d
irectl
y in
eq
uit
y
Ad
dit
ion
to
New
gen
ES
OP
Tru
st
rese
rve
- -
- -
- -
24
.47
- -
- 2
4.4
7
Co
ntr
ibu
tio
ns
by a
nd
dis
trib
uti
on
s to
o
wn
ers
Div
iden
d o
n e
qu
ity s
hare
s -
(54
0.14
)-
- -
- -
- -
- (5
40
.14
)D
ivid
en
d d
istr
ibu
tio
n t
ax o
n d
ivid
en
d
on
eq
uit
y s
hare
s -
(110
.59
)-
- -
- -
- -
- (1
10.5
9)
Div
iden
d o
n p
refe
ren
ce s
hare
s -
(10
3.8
0)
- -
- -
- -
- -
(10
3.8
0)
Div
iden
d d
istr
ibu
tio
n t
ax o
n d
ivid
en
d
on
pre
fere
nce
sh
are
s -
(21.25
)-
- -
- -
- -
- (2
1.2
5)
Div
iden
d r
ece
ived
on
eq
uit
y s
hare
s h
eld
by t
rust
- -
- -
- -
- -
- -
-
Em
plo
yee s
tock c
om
pen
sati
on
ex
pen
se
- -
- -
- -
- 12
7.11
-
- 12
7.11
Tran
sferr
ed
to
secu
riti
es
pre
miu
m
acc
ou
nt
on
exe
rcis
e o
f st
ock o
pti
on
s 26
.82
- -
- -
- -
(26
.82)
- -
-
Bala
nce
as
at
31
Marc
h 2
017
1,
168
.69
15
,92
8.0
2
87.
95
1,
73
1.3
9
0.2
1 (1
04
.54
)2
00
.22
3
59
.36
(5
4.5
7)
15.1
7
19,3
31.
90
L
ess
: Secu
riti
es
pre
miu
m o
n s
hare
s h
eld
by t
rust
(5
68
.82)
(56
8.8
2)
Tota
l B
ala
nce
as
at
31
Marc
h 2
017
5
99
.87
15
,92
8.0
2
87.
95
1,
73
1.3
9
0.2
1 (1
04
.54
)2
00
.22
3
59
.36
(5
4.5
7)
15.1
7
18,7
63
.08
Bala
nce
as
at
1 A
pri
l 2
017
1,
168
.69
15
,92
8.0
2
87.
95
1,
73
1.3
9
0.2
1 (1
04
.54
)2
00
.22
3
59
.36
(5
4.5
7)
15.1
7
19,3
31.
90
Tota
l co
mp
reh
en
sive
in
com
e f
or
the
ye
ar
en
de
d 3
1 M
arc
h 2
018
P
rofi
t fo
r th
e y
ear
- 7,
28
8.6
8
- -
- -
- -
- -
7,2
88
.68
F
ore
ign
cu
rren
cy t
ran
slati
on
rese
rve
- -
- -
- 10
0.2
0
- -
- -
100
.20
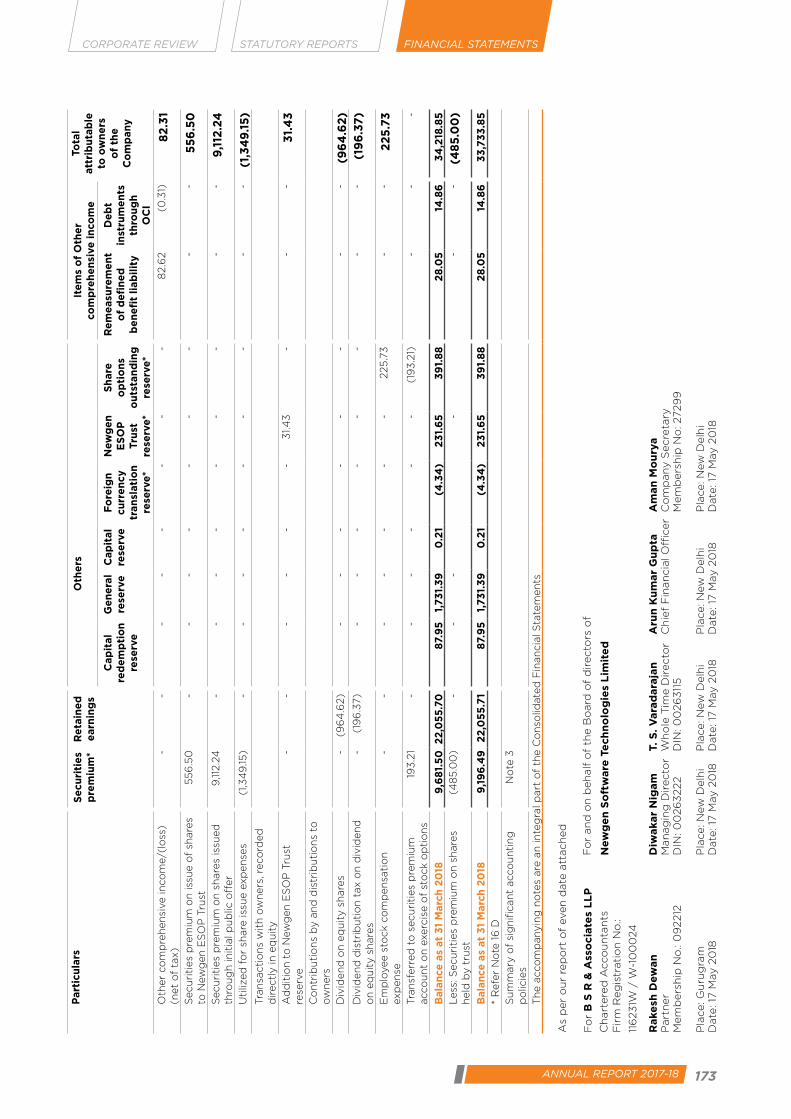
173ANNUAL REPORT 2017-18
CORPORATE REVIEW FINANCIAL STATEMENTSSTATUTORY REPORTS
Part
icu
lars
Se
curi
tie
s p
rem
ium
*R
eta
ine
d
earn
ing
sO
the
rsIt
em
s o
f O
the
r co
mp
reh
en
sive
in
com
eTo
tal
att
rib
uta
ble
to
ow
ne
rs
of
the
C
om
pan
y
Cap
ital
red
em
pti
on
re
serv
e
Ge
ne
ral
rese
rve
Cap
ital
rese
rve
Fo
reig
n
curr
en
cy
tran
slati
on
re
serv
e*
New
ge
n
ES
OP
Tru
st
rese
rve*
Sh
are
o
pti
on
s o
uts
tan
din
g
rese
rve*
Re
me
asu
rem
en
t o
f d
efi
ne
d
be
ne
fit
liab
ilit
y
De
bt
inst
rum
en
ts
thro
ug
h
OC
I
Oth
er
com
pre
hen
sive
inco
me/(
loss
) (n
et
of
tax)
- -
- -
- -
- -
82.6
2
(0.3
1)8
2.3
1
Secu
riti
es
pre
miu
m o
n is
sue o
f sh
are
s to
New
gen
ES
OP
Tru
st
55
6.5
0
- -
- -
- -
- -
- 5
56
.50
Secu
riti
es
pre
miu
m o
n s
hare
s is
sued
th
rou
gh
init
ial p
ub
lic o
ffer
9,11
2.2
4
- -
- -
- -
- -
- 9
,112
.24
Uti
lized
fo
r sh
are
issu
e e
xp
en
ses
(1,3
49
.15)
- -
- -
- -
- -
- (1
,34
9.1
5)
Tran
sacti
on
s w
ith
ow
ners
, reco
rded
d
irectl
y in
eq
uit
y
Ad
dit
ion
to
New
gen
ES
OP
Tru
st
rese
rve
- -
- -
- -
31.4
3
- -
- 3
1.4
3
Co
ntr
ibu
tio
ns
by a
nd
dis
trib
uti
on
s to
o
wn
ers
Div
iden
d o
n e
qu
ity s
hare
s -
(96
4.6
2)
- -
- -
- -
- -
(96
4.6
2)
Div
iden
d d
istr
ibu
tio
n t
ax o
n d
ivid
en
d
on
eq
uit
y s
hare
s -
(19
6.3
7)
- -
- -
- -
- -
(19
6.3
7)
Em
plo
yee s
tock c
om
pen
sati
on
ex
pen
se
- -
- -
- -
- 225
.73
-
- 2
25
.73
Tran
sferr
ed
to
secu
riti
es
pre
miu
m
acc
ou
nt
on
exe
rcis
e o
f st
ock o
pti
on
s 19
3.2
1 -
- -
- -
- (1
93
.21)
- -
-
Bala
nce
as
at
31
Marc
h 2
018
9
,68
1.5
0
22
,05
5.7
0
87.
95
1,
73
1.3
9
0.2
1 (4
.34
)2
31.
65
3
91.
88
2
8.0
5
14.8
6
34
,218
.85
L
ess
: Secu
riti
es
pre
miu
m o
n s
hare
s h
eld
by t
rust
(4
85
.00
)-
- -
- -
- (4
85
.00
)
Bala
nce
as
at
31
Marc
h 2
018
9
,19
6.4
9
22
,05
5.7
1 8
7.9
5
1,73
1.3
9
0.2
1 (4
.34
)2
31.
65
3
91.
88
2
8.0
5
14.8
6
33
,73
3.8
5
* R
efe
r N
ote
16
D
Su
mm
ary
of
sig
nif
ican
t acc
ou
nti
ng
p
olic
ies
No
te 3
Th
e a
cco
mp
anyin
g n
ote
s are
an
inte
gra
l part
of
the C
on
solid
ate
d F
inan
cia
l Sta
tem
en
ts
As
per
ou
r re
po
rt o
f even
date
att
ach
ed
Fo
r B
S R
& A
sso
cia
tes
LL
PF
or
an
d o
n b
eh
alf
of
the B
oard
of
dir
ecto
rs o
f
Ch
art
ere
d A
cco
un
tan
tsN
ew
ge
n S
oft
ware
Te
ch
no
log
ies
Lim
ite
dF
irm
Reg
istr
ati
on
No
.:
116
23
1W /
W-1
00
024
Rake
sh D
ew
an
Diw
akar
Nig
am
T.
S. V
ara
dara
jan
Aru
n K
um
ar
Gu
pta
Am
an
Mo
ury
aP
art
ner
Man
ag
ing
Dir
ecto
rW
ho
le T
ime D
irecto
rC
hie
f F
inan
cia
l O
ffic
er
Co
mp
any S
ecre
tary
Mem
bers
hip
No
.: 0
92212
DIN
: 0
026
3222
DIN
: 0
026
311
5
Mem
bers
hip
No
: 2729
9
Pla
ce: G
uru
gra
mP
lace: N
ew
Delh
iP
lace: N
ew
Delh
iP
lace: N
ew
Delh
iP
lace: N
ew
Delh
iD
ate
: 17
May 2
018
Date
: 17
May 2
018
Date
: 17
May 2
018
Date
: 17
May 2
018
Date
: 17
May 2
018

174 Newgen Software Technologies Limited
Consolidated Statement of Cash Flowsfor the year ended March 31, 2018(All amounts are in lakhs of Indian Rupees, unless otherwise stated
For the year ended 31 March 2018
For the year ended 31 March 2017
A. Cash flows from operating activities
Net profit before tax 9,413.25 6,832.03
Adjustments for:
Depreciation and amortisation 580.67 491.82
Loss on sale of property, plant and equipment 3.15 0.12
Property, plant and equipment written off - 0.59
Interest income on security deposits at amortised cost (31.21) (24.16)
Loss allowance on trade receivables 659.26 1,353.50
Loss allowance on other financial assets - 6.55
Provision no longer required write back (229.75) -
Fair value changes of financial assets at FVTPL (25.48) 5.57
Unrealised foreign exchange loss/(gain) (49.10) 95.01
Share based payment - equity settled 225.73 127.12
Reversal of derivative liability - (136.00)
Finance costs 520.68 525.60
Dividend income from mutual funds at FVTPL (87.86) (1.75)
Interest income from government and other bonds at FVOCI (131.56) (35.11)
Profit on sale of mutual funds (net) at FVTPL (60.73) (589.89)
Interest income from bank deposits and others (159.32) (24.62)
Operating cash flow before working capital changes 10,627.73 8,626.38
Increase in trade receivables (2,503.86) (6,130.91)
Increase in loans (278.74) (20.42)
Increase in other financial assets (2,627.21) (163.06)
Increase in other assets (33.32) (83.35)
Increase in provisions 314.36 282.31
Increase in other financial liabilities 1,616.27 1,179.03
Increase in other liabilities 844.50 180.88
Increase in trade payables 270.37 1,403.47
Cash generated from operations 8,230.10 5,274.33
Income taxes paid (net) (2,205.62) (1,683.38)
Net cash generated from operating activities (A) 6,024.48 3,590.95
B. Cash flows from investing activities
Purchase or construction of fixed assets (tangible and intangible fixed assets and capital work-in-progress) and capital advances
(1,914.11) (700.58)
Proceeds from sale of fixed assets 6.96 (3.39)
Purchase of mutual funds and government bonds (1,683.12) (8,680.24)
Proceeds from sale of mutual funds 1,699.60 8,942.99
Interest income from government bonds 86.21 28.06
Interest received on Bank deposit 73.57 33.63
Investment in bank deposits (net) (70.95) 22.90
Net cash used in investing activities (B) (1,801.84) (356.63)
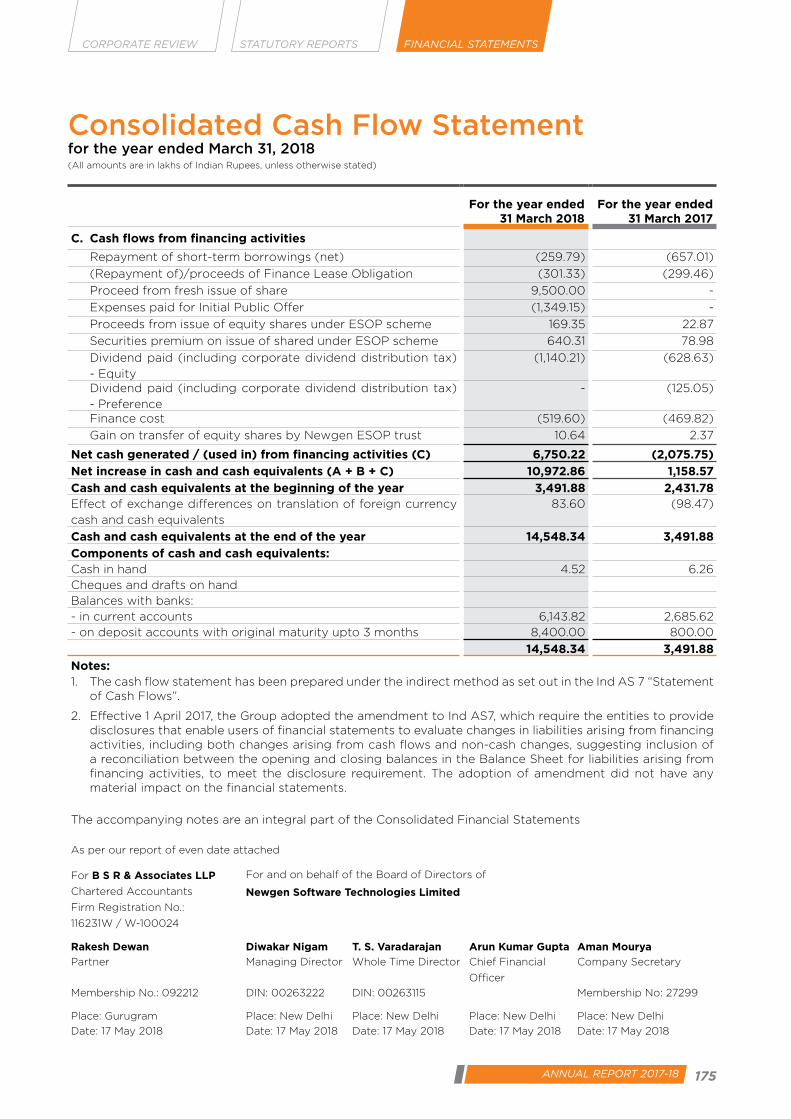
175ANNUAL REPORT 2017-18
CORPORATE REVIEW FINANCIAL STATEMENTSSTATUTORY REPORTS
For the year ended 31 March 2018
For the year ended 31 March 2017
C. Cash flows from financing activities
Repayment of short-term borrowings (net) (259.79) (657.01)
(Repayment of)/proceeds of Finance Lease Obligation (301.33) (299.46)
Proceed from fresh issue of share 9,500.00 -
Expenses paid for Initial Public Offer (1,349.15) -
Proceeds from issue of equity shares under ESOP scheme 169.35 22.87
Securities premium on issue of shared under ESOP scheme 640.31 78.98
Dividend paid (including corporate dividend distribution tax)
- Equity
(1,140.21) (628.63)
Dividend paid (including corporate dividend distribution tax)
- Preference
- (125.05)
Finance cost (519.60) (469.82)
Gain on transfer of equity shares by Newgen ESOP trust 10.64 2.37
Net cash generated / (used in) from financing activities (C) 6,750.22 (2,075.75)
Net increase in cash and cash equivalents (A + B + C) 10,972.86 1,158.57
Cash and cash equivalents at the beginning of the year 3,491.88 2,431.78 Effect of exchange differences on translation of foreign currency
cash and cash equivalents
83.60 (98.47)
Cash and cash equivalents at the end of the year 14,548.34 3,491.88
Components of cash and cash equivalents:Cash in hand 4.52 6.26Cheques and drafts on handBalances with banks:- in current accounts 6,143.82 2,685.62 - on deposit accounts with original maturity upto 3 months 8,400.00 800.00
14,548.34 3,491.88
Notes:1. The cash flow statement has been prepared under the indirect method as set out in the Ind AS 7 “Statement
of Cash Flows”.
2. Effective 1 April 2017, the Group adopted the amendment to Ind AS7, which require the entities to provide disclosures that enable users of financial statements to evaluate changes in liabilities arising from financing activities, including both changes arising from cash flows and non-cash changes, suggesting inclusion of a reconciliation between the opening and closing balances in the Balance Sheet for liabilities arising from financing activities, to meet the disclosure requirement. The adoption of amendment did not have any material impact on the financial statements.
The accompanying notes are an integral part of the Consolidated Financial Statements
As per our report of even date attached
For B S R & Associates LLP For and on behalf of the Board of Directors of
Chartered Accountants Newgen Software Technologies Limited
Firm Registration No.:
116231W / W-100024
Rakesh Dewan Diwakar Nigam T. S. Varadarajan Arun Kumar Gupta Aman Mourya
Partner Managing Director Whole Time Director Chief Financial
Officer
Company Secretary
Membership No.: 092212 DIN: 00263222 DIN: 00263115 Membership No: 27299
Place: Gurugram Place: New Delhi Place: New Delhi Place: New Delhi Place: New Delhi
Date: 17 May 2018 Date: 17 May 2018 Date: 17 May 2018 Date: 17 May 2018 Date: 17 May 2018
Consolidated Cash Flow Statementfor the year ended March 31, 2018(All amounts are in lakhs of Indian Rupees, unless otherwise stated)

176 Newgen Software Technologies Limited
Notes to the consolidated financial statementsfor the year ended 31st March, 2018(All amounts are in lakhs of Indian Rupees, unless otherwise stated)
NOTE 1 Background
Newgen Software Technologies Limited (‘Newgen’ or ‘the Company’ or ‘the holding Company’) and its subsidiaries (the Holding Company and its subsidiaries together referred to as ‘the Group’) is a public company domiciled and incorporated under the provisions of the Companies Act applicable in India. The registered office of the Company is situated at A-6, Satsang Vihar Marg, Qutab Institutional Area, New Delhi - 110067. The Company raised money by way of initial public offer during the year ended 31 March 2018 and its shares are listed on the National Stock Exchange (NSE) and Bombay Stock Exchange (BSE) of India.
The Company is a global software Company and is engaged in the business of software product development including designing and delivering end-to-end software solutions covering the entire spectrum of software services from workflow automation to Document management to imaging. Newgen provides a complete range of software that helps automate business processes. Newgen’s solutions enable document intensive organizations/ industries such as Finance and Banking, Insurance and government departments to improve productivity through better document management and workflow implementation.
NOTE 2 Basis of Preparation
A. Statement of compliance
The consolidated financial statements have been prepared in accordance with Indian Accounting Standards (“Ind AS”) notified under the Companies (Indian Accounting Standards) Rules, 2015 and Companies (Indian Accounting Standards) Amendment Rules, 2016. These consolidated financial statements for the year ended 31 March 2018 are the first consolidated financial statements that the group has prepared in accordance with Ind AS.
Accordingly, the group has followed the provisions of Ind AS 101, ‘First Time Adoption of Indian Accounting Standards’, in preparing its opening Ind AS Balance Sheet as of the date of transition, i.e. 1 April 2016. Certain of the Group’s Ind AS accounting policies used in the opening balance sheet differed from its Indian GAAP policies applied as at 31 March 2016, and accordingly adjustments were made to restate the opening balances as per Ind AS. The resulting adjustments arose from events and transactions before the date of transition to Ind AS. Therefore,
as required by Ind AS 101, those adjustments were recognized directly through retained earnings as at 1 April 2016.
Refer note 50 for the effect of transition to Ind AS on the reported consolidated financial position, consolidated financial performance and consolidated cash flows of the Group.
The consolidated financial statements were authorised for issue by the Company’s Board of Directors on 17 May 2018.
Details of the Group’s accounting policies are included in Note 3.
B. Basis of Consolidation
The consolidated financial statements have been prepared in accordance with Ind AS notified under the Companies (Indian Accounting Standards) Rules, 2015 and Companies (Indian Accounting Standards) Amendment Rules, 2016
Name of Subsidiaries Country of Incorporation
Effective Shareholding (%)
Newgen Software Inc. U.S.A 100
Newgen Software Technologies Canada Limited
Canada 100
Newgen Software Technologies PTE Limited
Singapore 100
Newgen Software Technologies (UK) Limited
United
Kingdom
100
Newgen Computer Technologies Limited
India 100
The consolidated financial statements have been prepared on the following basis:
The financial statements of the Holding Company and its subsidiary companies are combined on a line-by-line basis by adding the book values of like items of assets, liabilities, income and expenses after eliminating intra-group balances/transactions and unrealized profits in full in accordance with Ind AS 110 – “Consolidated Financial Statements”. The amounts shown in respect of reserves comprise the amount of the relevant reserves as per the balance sheet of the parent company and its share in the post-acquisition increase/decrease in the reserves of the consolidated
entities.
177ANNUAL REPORT 2017-18
CORPORATE REVIEW FINANCIAL STATEMENTSSTATUTORY REPORTS
The excess/deficit of cost to the parent company
of its investment over its portion of net worth in the
consolidated entities at the respective dates on which
investment in such entities was made is recognized in
the consolidated financial statements as goodwill/capital
reserve. The parent company’s portion of net worth in
such entities is determined on the basis of book values of
assets and liabilities as per the financial statements of the
entities as on the date of investment and if not available,
the financial statements for the immediately preceding
period adjusted for the effects of significant changes.
The financial statements of the foreign non integral
subsidiaries (collectively referred to as the ‘foreign
non integral operations’) are translated into Indian
rupees as follows:-
i. Share capital and opening reserves and surplus
are carried at historical cost.
ii. All assets and liabilities, both monetary and
non-monetary, (excluding share capital, opening
reserves and surplus) are translated using the
year-end rates.
iii. Profit and loss items are translated at the
respective weighted average rates or the
exchange rate that approximates the actual
exchange rate on date of specific transactions.
iv. The resulting net exchange difference is credited
or debited to the foreign currency translation
reserve.
C. Functional and presentation currency
These financial statements are presented in
Indian Rupees (INR), which is also the Company’s
functional currency. All amounts have been
rounded-off to the nearest lakhs, unless otherwise
indicated.
D. Basis of measurement
The financial statements have been prepared on
the historical cost basis except for the following
items:
Items Measurement basis
Certain financial assets and liabilities
Fair value
Net defined benefit (asset)/ liability
Fair value of plan assets less present value of defined benefit obligations
E. Use of estimates and judgements
The preparation of financial statements in
conformity with Ind AS requires management
to make judgments, estimates and assumptions
that affect the application of accounting policies
and the reported amounts of assets, liabilities,
income and expenses and the accompanying
disclosures. Uncertainty about the assumptions
and estimates could result in outcomes that may
require material adjustment to the carrying value
of assets or liabilities affected in future periods.
Estimates and underlying assumptions are
reviewed on an ongoing basis. Revisions to
accounting estimates are recognized in the
period in which the estimates are revised and in
any future periods affected.
Judgements Information about judgements made in applying
accounting policies that have the most significant
effects on the amounts recognised in the financial
statements is included in the following notes:
• Note 35 – lease classification: classification
of leases under finance lease or operating
lease;
Assumptions and estimation uncertainties
Information about assumptions and estimation
uncertainties that have a significant risk of resulting
in a material adjustment in the year ending 31 March
2018 is included in the following notes:
• Note 3(c)(iii) –Estimation ofUseful lives of
intangible and depreciable assets
• Note 28 –Measurement of definedbenefit
obligations: key actuarial assumptions;
• Note32–Recognitionofdeferredtaxassets:
availability of future taxable profit against
which tax losses carried forward can be
used;
• Note34–Fairvalueofsharebasedpayments
• Note 41 – Impairment of trade receivables
and financial assets.
F. Current and non-current classification
The Group presents assets and liabilities in the
balance sheet based on current / non-current
classification.
Notes to the consolidated financial statementsfor the year ended 31st March, 2018(All amounts are in lakhs of Indian Rupees, unless otherwise stated)
178 Newgen Software Technologies Limited
An asset is classified as current when it satisfies
any of the following criteria:
- it is expected to be realized in, or is intended
for sale or consumption in, the Group’s
normal operating cycle.
- it is held primarily for the purpose of being
traded;
- it is expected to be realized within 12 months
after the reporting date; or
- it is cash or cash equivalent unless it is
restricted from being exchanged or used to
settle a liability for at least 12 months after
the reporting date.
A liability is classified as current when it satisfies
any of the following criteria:
- it is expected to be settled in the Group’s
normal operating cycle;
- it is held primarily for the purpose of being
traded;
- it is due to be settled within 12 months after
the reporting date; or
- the Group does not have an unconditional
right to defer settlement of the liability for
at least 12 months after the reporting date.
Terms of a liability that could, at the option
of the counterparty, result in its settlement
by the issue of equity instruments do not
affect its classification.
Current assets/liabilities include current portion
of non-current financial assets/liabilities
respectively. All other assets/ liabilities are
classified as non-current. Deferred tax assets and
liabilities (if any) are classified as non-current
assets and liabilities.
Operating cycle
Based on the nature of the operations and the time
between the acquisition of assets for processing
and their realization in cash or cash equivalents,
the Group has ascertained its operating cycle as
twelve months for the purpose of current/non-
current classification of assets and liabilities.
G. Measurement of fair values
A number of the Group’s accounting policies
and disclosures require the measurement
of fair values, for both financial and non-
financial assets and liabilities. The Group has
an established control framework with respect
to the measurement of fair values. The finance
team has overall responsibility for overseeing
all significant fair value measurements,
including Level 3 fair values, and reports
directly to the chief financial officer. The Group
regularly reviews significant unobservable
inputs and valuation adjustments. If third
party information, such as broker quotes
or pricing services, is used to measure fair
values, then the Group assesses the evidence
obtained from the third parties to support
the conclusion that these valuations meet the
requirements of Ind AS, including the level in
the fair value hierarchy in which the valuations
should be classified.
Significant valuation issues are reported to the
Company’s audit committee.
Fair values are categorised into different levels in
a fair value hierarchy based on the inputs used in
the valuation techniques as follows.
• Level1:quotedprices(unadjusted)inactive
markets for identical assets or liabilities.
• Level 2: inputs other than quoted prices
included in Level 1 that are observable for
the asset or liability, either directly (i.e. as
prices) or indirectly (i.e. derived from prices).
• Level3: inputsfortheassetor liabilitythat
are not based on observable market data
(Unobservable inputs).
When measuring the fair value of an asset or a
liability, the Group uses observable market data as
far as possible. If the inputs used to measure the
fair value of an asset or a liability fall into different
levels of the fair value hierarchy, then the fair
value measurement is categorised in its entirety
in the same level of the fair value hierarchy as the
lowest level input that is significant to the entire
measurement.
The Group recognises transfers between levels of
the fair value hierarchy at the end of the reporting
period during which the change has occurred.
Further information about the assumptions
made in measuring fair values is included in the
following notes:
Notes to the consolidated financial statementsfor the year ended 31st March, 2018(All amounts are in lakhs of Indian Rupees, unless otherwise stated)

179ANNUAL REPORT 2017-18
CORPORATE REVIEW FINANCIAL STATEMENTSSTATUTORY REPORTS
Note 34 – Share-based payment arrangements;
and
Note 41 – Financial instruments.
NOTE 3 Significant Accounting Policies
a. Foreign currency
i. Functional currency
The Group’s financial statements are
presented in INR, which is also the Group’s
functional currency.
ii. Foreign currency transactions
Transactions in foreign currencies are
translated into INR, the functional
currency of the Company, at the exchange
rates at the dates of the transactions
or an average rate if the average rate
approximates the actual rate at the date
of the transaction.
Monetary assets and liabilities denominated
in foreign currencies are translated into
the functional currency at the exchange
rate at the reporting date. Non-monetary
assets and liabilities that are measured
at fair value in a foreign currency are
translated into the functional currency
at the exchange rate when the fair value
was determined. Non-monetary assets
and liabilities that are measured based on
historical cost in a foreign currency are
translated at the exchange rate at the date
of the transaction.
b. Financial instruments
i. Recognition and initial measurement
Trade receivables and debt securities
issued are initially recognised when they
are originated. All other financial assets and
financial liabilities are initially recognised
when the Group becomes a party to the
contractual provisions of the instrument.
A financial asset or financial liability is
initially measured at fair value plus, for an
item not at fair value through profit and loss
(FVTPL), transaction costs that are directly
attributable to its acquisition or issue.
ii. Classification and subsequent measurement
Financial assets:
On initial recognition, a financial asset is
classified as measured at
- Amortised cost;
- Fair value through Other Comprehensive
Income (FVOCI) – debt investment;
- Fair Value through Other Comprehensive
Income (FVOCI) – equity investment; or
- FVTPL
Financial assets are not reclassified
subsequent to their initial recognition, except
if and in the period the Group changes its
business model for managing financial
assets.
A financial asset is measured at amortised
cost if it meets both of the following
conditions and is not designated as FVTPL:
• theassetisheldwithinabusinessmodel
whose objective is to hold assets to
collect contractual cash flows; and
• the contractual terms of the financial
asset give rise on specified dates to
cash flows that are solely payments of
principal and interest on the principal
amount outstanding.
A debt investment is measured at FVOCI if it
meets both of the following conditions and
is not designated as FVTPL:
• theassetisheldwithinabusinessmodel
whose objective is achieved by both
collecting contractual cash flows and
selling financial assets; and
• the contractual terms of the financial
asset give rise on specified dates to
cash flows that are solely payments of
principal and interest on the principal
amount outstanding.
All financial assets not classified as measured
at amortised cost or FVOCI as described
above are measured at FVTPL. On initial
recognition, the Group may irrevocably
designate a financial asset that otherwise
meets the requirements to be measured at
amortised cost or at FVOCI as at FVTPL if
Notes to the consolidated financial statementsfor the year ended 31st March, 2018(All amounts are in lakhs of Indian Rupees, unless otherwise stated)
180 Newgen Software Technologies Limited
doing so eliminates or significantly reduces
an accounting mismatch that would
otherwise arise.
Financial assets: Business model assessment
The Group makes an assessment of the
objective of the business model in which
a financial asset is held at a portfolio level
because this best reflects the way the
business is managed and information is
provided to management, for instance
the stated policies and objectives for the
portfolio, frequency, volume and timing of
sales of financial assets in prior periods, the
reasons for such sales and expectations
about future sales activity.
Transfers of financial assets to third
parties in transactions that do not qualify
for derecognition are not considered
sales for this purpose, consistent with
the Group’s continuing recognition of the
assets.
Financial assets that are held for trading
or are managed and whose performance is
evaluated on a fair value basis are measured
at FVTPL.
Financial assets: Assessment whether
contractual cash flows are solely payments
of principal and Interest.
For the purposes of this assessment,
‘principal’ is defined as the fair value of
the financial asset on initial recognition.
‘Interest’ is defined as consideration for
the time value of money and for the
credit risk associated with the principal
amount outstanding during a particular
period of time and for other basic lending
risks and costs (e.g. liquidity risk and
administrative costs), as well as a profit
margin.
In assessing whether the contractual cash
flows are solely payments of principal
and interest, the Group considers the
contractual terms of the instrument. This
includes assessing whether the financial
asset contains a contractual term that could
change the timing or amount of contractual
cash flows such that it would not meet this
condition. In making this assessment, the
Group considers:
• contingent events that would change
the amount or timing of cash flows;
• terms thatmay adjust the contractual
coupon rate, including variable interest
rate features;
• prepayment and extension features;
and
Basis the above classification criteria,
Group’s investments are classified as
below:-
- Investments in government and other
bonds have been classified as FVOCI.
- Investments in Mutual funds have been
classified as FVTPL.
Financial assets: Subsequent measurement and gains and losses
Financial assets at FVTPL
These assets are subsequently measured at
fair value. Net gains and losses, including any
interest or dividend income, are recognised
in profit or loss.
Financial assets at amortised cost
These assets are subsequently measured at
amortised cost using the effective interest
method. The amortised cost is reduced by
impairment losses. Interest income, foreign
exchange gains and losses and impairment
are recognised in profit or loss. Any gain or
loss on derecognition is recognised in profit
or loss.
Debt investments at FVOCI
These assets are subsequently measured
at fair value. Interest income under
the effective interest method, foreign
exchange gains and losses and impairment
are recognised in profit or loss. Other
net gains and losses are recognised in
OCI. On derecognition, gains and losses
accumulated in OCI are reclassified to
profit or loss.
Notes to the consolidated financial statementsfor the year ended 31st March, 2018(All amounts are in lakhs of Indian Rupees, unless otherwise stated)
181ANNUAL REPORT 2017-18
CORPORATE REVIEW FINANCIAL STATEMENTSSTATUTORY REPORTS
Equity investments at FVOCI
These assets are subsequently measured
at fair value. Dividends are recognized as
income in profit or loss unless the dividend
clearly represents a recovery of part of the
cost of the investment. Other net gains and
losses are recognised in OCI and are not
reclassified to profit or loss.
Financial liabilities: Classification, subsequent measurement and gains and losses
Financial liabilities are classified as measured
at amortised cost or FVTPL. A financial liability
is classified as at FVTPL if it is classified as
held-for-trading, or it is a derivative or it is
designated as such on initial recognition.
Financial liabilities at FVTPL are measured at
fair value and net gains and losses, including
any interest expense, are recognised in
profit or loss. Other financial liabilities are
subsequently measured at amortised cost
using the effective interest method. Interest
expense and foreign exchange gains and
losses are recognised in profit or loss. Any gain
or loss on derecognition is also recognised in
profit or loss.
iii. Derecognition
Financial assets
The Group derecognises a financial asset
when the contractual rights to the cash flows
from the financial asset expire, or it transfers
the rights to receive the contractual cash
flows in a transaction in which substantially
all of the risks and rewards of ownership
of the financial asset are transferred or
in which the Group neither transfers nor
retains substantially all of the risks and
rewards of ownership and does not retain
control of the financial asset.
If the Group enters into transactions
whereby it transfers assets recognised on
its balance sheet, but retains either all or
substantially all of the risks and rewards
of the transferred assets, the transferred
assets are not derecognised.
Financial liabilities
The Group derecognises a financial liability when its contractual obligations are discharged or cancelled, or expire.
The Group also derecognises a financial liability when its terms are modified and the cash flows under the modified terms are substantially different. In this case, a new financial liability based on the modified terms is recognised at fair value. The difference between the carrying amount of the financial liability extinguished and the new financial liability with modified terms is recognised in profit or loss.
iv. Offsetting
Financial assets and financial liabilities are offset and the net amount presented in the balance sheet when, and only when, the Group currently has a legally enforceable right to set off the amounts and it intends either to settle them on a net basis or to realise the asset and settle the liability simultaneously.
v. Derivatives and Embedded derivatives
Derivatives are initially measured at fair value. Subsequent to initial recognition, derivatives are measured at fair value, and changes therein are generally recognised in profit or loss.
Embedded derivatives are separated from the host contract and accounted for separately if the host contract is not a financial asset and certain criteria are met.
c. Property, plant and equipment
i. Recognition and measurement
Items of property, plant and equipment are measured at cost less accumulated depreciation and accumulated impairment losses, if any.
Cost of an item of property, plant and equipment comprises its purchase price, including import duties and non-refundable purchase taxes, after deducting trade discounts and rebates, any directly attributable cost of bringing the item to its working condition for its intended use and estimated costs of dismantling and removing the item and restoring the site on which it
is located.
Notes to the consolidated financial statementsfor the year ended 31st March, 2018(All amounts are in lakhs of Indian Rupees, unless otherwise stated)

182 Newgen Software Technologies Limited
The cost of a self-constructed item of
property, plant and equipment comprises
the cost of materials and direct labor, any
other costs directly attributable to bringing
the item to working condition for its intended
use, and estimated costs of dismantling and
removing the item and restoring the site on
which it is located.
If significant parts of an item of property,
plant and equipment have different useful
lives, then they are accounted for as separate
items (major components) of property, plant
and equipment.
Any gain or loss on disposal of an item of
property, plant and equipment is recognised
in profit or loss.
ii. Transition to Ind AS
On transition to Ind AS, the Group has
elected to continue with the carrying value
of all its property, plant and equipment
recognized as at 1 April 2016, measured as
per the previous GAAP, and use that carrying
value as the deemed cost of such property,
plant and equipment.
iii. Subsequent expenditure
Subsequent expenditure is capitalised only
if it is probable that the future economic
benefits associated with the expenditure will
flow to the Group.
iv. Depreciation
Depreciation is calculated on cost of items
of property, plant and equipment less
their estimated residual values over their
estimated useful lives using the straight-line
method, and is generally recognised in the
statement of profit and loss. Assets acquired
under finance leases are depreciated over
the shorter of the lease term and their
useful lives unless it is reasonably certain
that the Group will obtain ownership by the
end of the lease term. Freehold land is not
depreciated.
The estimated useful lives of items of
property, plant and equipment for the
current and comparative periods are as
follows:
Category of fixed assets
Estimated useful life (Years)
Building 60
Plant and equipment 15
Leasehold Improvements*
3
Office equipment** 10
Furniture and Fixtures 10
Vehicles 8
Computer hardware
-servers and networks 6
-Computers** 3-5
Depreciation method, useful lives and
residual values are reviewed at each financial
year-end and adjusted if appropriate.
Depreciation on addition (disposal) is
provided on a pro-rata basis i.e. from (upto)
the date on which asset is ready for use
(disposed off).
*Leasehold improvements are depreciated
over the period of the lease term of the
respective property or 3 years whichever is
lower.
Leasehold land is amortised over the lease
period of 90 years.
**Based on an internal technical assessment,
the management believes that the useful
lives as given above best represents the
period over which management expects to
use its assets. Hence, the useful life of plant
and equipment is different from the useful
life as prescribed under Part C of Schedule II
of Companies Act, 2013.
d. Intangible assets
Recognition and measurement
Intangible assets that are acquired by the
Group are measured initially at cost. After
initial recognition, an intangible asset is carried
at its cost less accumulated amortisation and
accumulated impairment loss, if any.
Subsequent expenditure
Subsequent expenditure is capitalised only when
it increases the future economic benefits from
Notes to the consolidated financial statementsfor the year ended 31st March, 2018(All amounts are in lakhs of Indian Rupees, unless otherwise stated)

183ANNUAL REPORT 2017-18
CORPORATE REVIEW FINANCIAL STATEMENTSSTATUTORY REPORTS
the specific asset to which it relates.
Transition to Ind AS
On transition to Ind AS, the Group has elected
to continue with the carrying value of all its
intangible assets recognized as at 1 April 2016,
measured as per the previous GAAP, and use
that carrying value as the deemed cost of such
intangible assets.
Amortisation
Intangible assets of the Group represents
computer software and are amortized using the
straight-line method over the estimated useful
life (at present 3-4 years) or the tenure of the
respective software license, whichever is lower.
The amortization period and the amortization
method are reviewed at least at each financial
year end. If the expected useful life of the asset
is significantly different from previous estimates,
the amortization period is changed accordingly.
Gains or losses arising from derecognition
of an intangible asset are measured as the
difference between the net disposal proceeds
and the carrying amount of the asset and are
recognized in the profit or loss when the asset is
derecognized.
e. Impairment
i. Impairment of financial instruments
The Group recognises loss allowances for
expected credit losses on:
- financial assets measured at amortised
cost; and
- financial assets measured at FVOCI-
debt investments.
At each reporting date, the Group assesses
whether financial assets carried at amortised
cost and debt securities at FVOCI are
credit-impaired. A financial asset is ‘credit-
impaired’ when one or more events that
have a detrimental impact on the estimated
future cash flows of the financial asset have
occurred.
The Group measures loss allowances at an
amount equal to lifetime expected credit
losses.
Loss allowances for trade receivables are
always measured at an amount equal to
lifetime expected credit losses. Lifetime
expected credit losses are the expected
credit losses that result from all possible
default events over the expected life of a
financial instrument.
12-month expected credit losses are the
portion of expected credit losses that result
from default events that are possible within
12 months after the reporting date (or a
shorter period if the expected life of the
instrument is less than 12 months).
In all cases, the maximum period considered
when estimating expected credit losses is
the maximum contractual period over which
the Group is exposed to credit risk.
The Group assumes that the credit risk on a
financial asset has increased significantly if it
is more than 30 days past due.
The Group considers a financial asset to be
in default when:
- the borrower is unlikely to pay its credit
obligations to the Group in full, without
recourse by the Group to actions such
as realising security (if any is held); or
- the financial asset is 90 days or more
past due.
The Group considers a debt security to have
low credit risk when its credit risk rating is
equivalent to ‘investment grade’ e.g. BBB or
higher as per renowned rating agencies.
Measurement of expected credit losses
Expected credit losses are a probability-
weighted estimate of credit losses. Credit
losses are measured as the present value
of all cash shortfalls (i.e. the difference
between the cash flows due to the Group in
accordance with the contract and the cash
flows that the Group expects to receive).
As a practical expedient, the Group uses a
provision matrix to determine impairment
loss allowance on portfolio of its trade
receivables. The provision matrix is based on
its historically observed default rates over
the expected life of the trade receivables and
Notes to the consolidated financial statementsfor the year ended 31st March, 2018(All amounts are in lakhs of Indian Rupees, unless otherwise stated)
184 Newgen Software Technologies Limited
is adjusted for forward‐looking estimates. At
every reporting date, the historical observed default rates are updated and changes in the forward‐looking estimates are analysed.
Presentation of allowance for expected credit losses in the balance sheet
Loss allowances for financial assets measured at amortised cost are deducted from the gross carrying amount of the assets.
For debt securities at FVOCI, the loss allowance is charged to profit or loss.
Write-off
The gross carrying amount of a financial asset is written off (either partially or in full) to the extent that there is no realistic prospect of recovery. This is generally the case when the Group determines that the debtor does not have assets or sources of income that could generate sufficient cash flows to repay the amounts subject to the write off. However, financial assets that are written off could still be subject to enforcement activities in order to comply with the Group’s procedures for recovery of amounts due.
ii. Impairment of Non-financial assets
The carrying amounts of assets are reviewed at each reporting date if there is any indication of impairment based on internal/external factors. An impairment loss is recognized wherever the carrying amount of an asset (or cash generating unit) exceeds its recoverable amount. The recoverable amount is the greater of the asset’s (or cash generating unit’s) net selling price and value in use. In assessing value in use, the estimated future cash flows are discounted to their present value using a pre-tax discount rate that reflects current market assessments of the time value of money and risks specific to the asset (or cash generating unit).
An impairment loss is reversed if there has been a change in the estimates used to determine the recoverable amount. An impairment loss is reversed only to the extent that the asset’s carrying amount does not exceed the carrying amount that would have been determined net of depreciation or
amortisation, if no impairment loss had been
recognised
f. Employee benefits
i. Short-term employee benefits
Short-term employee benefit obligations are measured on an undiscounted basis and are expensed as the related service is provided. A liability is recognised for the amount expected to be paid, if the Group has a present legal or constructive obligation to pay this amount as a result of past service provided by the employee, and the amount of obligation can be estimated reliably.
ii. Share-based payment transactions
The grant date fair value of equity settled share-based payment awards granted to employees of the Group is recognised as an employee expense, with a corresponding increase in equity, over the period that the employees unconditionally become entitled to the awards. The amount recognised as expense is based on the estimate of the number of awards for which the related service and non-market vesting conditions are expected to be met, such that the amount ultimately recognised as an expense is based on the number of awards that do meet the related service and non-market vesting conditions at the vesting date. For share-based payment awards with non-vesting conditions, the grant date fair value of the share-based payment is measured to reflect such conditions and there is no true-up for differences between expected and actual outcomes.
iii. Defined contribution plans
A defined contribution plan is a post-employment benefit plan under which an entity pays fixed contributions into a separate entity and will have no legal or constructive obligation to pay further amounts. The Group makes specified monthly contributions towards Government administered provident fund scheme. Obligations for contributions to defined contribution plans are recognized as an employee benefit expense in profit or loss in the periods during which the related services are rendered by employees.
Prepaid contributions are recognised as an
Notes to the consolidated financial statementsfor the year ended 31st March, 2018(All amounts are in lakhs of Indian Rupees, unless otherwise stated)

185ANNUAL REPORT 2017-18
CORPORATE REVIEW FINANCIAL STATEMENTSSTATUTORY REPORTS
asset to the extent that a cash refund or a
reduction in future payments is available.
iv. Defined benefit plans
A defined benefit plan is a post-employment
benefit plan other than a defined contribution
plan. The Group’s gratuity scheme is a
defined benefit plan. The present value of
obligations under such defined benefit plans
are determined based on actuarial valuation
carried out by an independent actuary
using the Projected Unit Credit Method,
which recognizes each period of service as
giving rise to an additional unit of employee
benefit entitlement and measures each unit
separately to build up the final obligation.
The obligation is measured at the present
value of estimated future cash flows. The
discount rates used for determining the
present value of obligation under defined
benefit plans, are based on the market
yields on government securities as at the
balance sheet date, having maturity period
approximating to the terms of related
obligations
Remeasurement gains and losses arising
from experience adjustments and changes
in actuarial assumptions are recognized
in the period in which they occur, directly
in other comprehensive income and are
never reclassified to profit or loss. Changes
in the present value of the defined benefit
obligation resulting from plan amendments
or curtailments are recognized immediately
in the profit or loss as past service cost.
v. Other long-term employee benefits
The Group’s net obligation in respect of
long-term employee benefits other than
post-employment benefits is the amount of
future benefit that employees have earned
in return for their service in the current and
prior periods; that benefit is discounted to
determine its present value, and the fair
value of any related assets is deducted.
The employees can carry-forward a portion
of the unutilized accrued compensated
absences and utilize it in future service
periods or receive cash compensation
on termination of employment. Since the
compensated absences do not fall due
wholly within twelve months after the end
of the period in which the employees render the related service and are also not expected to be utilized wholly within twelve months after the end of such period, the benefit is classified as a long-term employee benefit. The Group records an obligation for such compensated absences in the period in which the employee renders the services that increase this entitlement. The obligation is measured on the basis of independent actuarial valuation using the projected unit credit method. Re measurements as a result of experience adjustments and changes in actuarial assumptions are recognized in the profit or loss
g. Provisions (other than for employee benefits)
A provision is recognised if, as a result of a past event, the Group has a present legal or constructive obligation that can be estimated reliably, and it is probable that an outflow of economic benefits will be required to settle the obligation. Provisions are determined by discounting the expected future cash flows (representing the best estimate of the expenditure required to settle the present obligation at the balance sheet date) at a pre-tax rate that reflects current market assessments of the time value of money and the risks specific to the liability. The unwinding of the discount is recognised as finance cost. Expected future operating losses are not provided for. Provisions are reviewed by the management at each reporting date and adjusted to reflect the current best estimates.
Warranties
A provision for warranties is recognised when the underlying products or services are sold. The provision is based on technical evaluation, historical warranty data and a weighting of all possible outcomes by their associated probabilities.
Onerous contracts
A contract is considered to be onerous when the expected economic benefits to be derived by the Group from the contract are lower than the unavoidable cost of meeting its obligations under the contract. The provision for an onerous contract is measured at the present value of the lower of the expected cost of terminating the contract and the expected net cost of continuing
Notes to the consolidated financial statementsfor the year ended 31st March, 2018(All amounts are in lakhs of Indian Rupees, unless otherwise stated)
186 Newgen Software Technologies Limited
with the contract. Before such a provision is made, the Group recognises any impairment loss
on the assets associated with that contract.
h. Contingent liabilities
A contingent liability is a possible obligation that
arises from past events whose existence will be
confirmed by the occurrence or non-occurrence
of one or more uncertain future events beyond
the control of the Group or a present obligation
that is not recognised because it is not probable
that an outflow of resources will be required
to settle the obligation, or a present obligation
whose amount cannot be estimated reliably.
The Group does not recognize a contingent
liability but discloses its existence in the financial
statements
i. Revenue
Revenue is measured at the fair value of the
consideration received or receivable and is
recognized to the extent that it is probable that
the economic benefits will flow to the Group and
the revenue can be reliably measured and specific
criteria as per the respective arrangements have
been met.
i. Sale of License
Revenue from sale of licenses for software
products is recognised when the significant
risks and rewards of ownership have been
transferred to the buyer which generally
coincides with delivery of licenses to the
customers, recovery of the consideration is
probable, the associated costs and possible
return of software sold can be estimated
reliably, there is no continuing effective
control over, or managerial involvement with
the licenses transferred and the amount of
revenue can be measured reliably.
ii. Rendering of services
Revenue from services rendered is
recognised in profit or loss in proportion to
the stage of completion of the transaction at
the reporting date.
Software Development Services
The revenue from such fixed price contracts
for software development is recognized
based on proportionate completion method
based on hours expended, and foreseeable
losses on the completion of contract, if any
are recognized immediately.
The Group is also involved in time and
material contracts and recognizes revenue
on a man month basis.
Digitization services
Revenue from digitization services is
recognized as services are rendered to the
customer.
Annual Technical services
Revenue from annual technical service and
maintenance contracts is recognised on
a pro rata basis over the period in which
such product up gradation and services are
rendered.
iii. Sale of right to use software
Software-as-a-service, that is, a right to use
software functionality in a cloud-based-
infrastructure provided by the Group.
Revenue is recognized monthly/periodically
based on the number of users right given to
customers.
Revenue is recognised, net of returns, trade
discounts and volume rebates. This inter alia
involves discounting of the consideration
due to the present value if payment
extends beyond normal credit terms.
Reimbursements of out-of-pocket expenses
received from customers have been netted
off with expense.
Amounts received or billed in advance of
services to be performed are recorded as
advance from customers/unearned revenue.
Unbilled revenue represents amounts
recognized based on services performed
in advance of billing in accordance with
contract terms.
iv. Multiple deliverable arrangements
When two or more revenue generating
activities or deliverables are provided under
a single arrangement, each deliverable
that is considered to be a separate unit of
account is accounted for separately. The
Notes to the consolidated financial statementsfor the year ended 31st March, 2018(All amounts are in lakhs of Indian Rupees, unless otherwise stated)
187ANNUAL REPORT 2017-18
CORPORATE REVIEW FINANCIAL STATEMENTSSTATUTORY REPORTS
allocation of consideration from a revenue
arrangement to its separate units of account
is based on the relative fair value of each
unit. If the fair value of the delivered item
is not reliably measurable, then revenue is
allocated based on the difference between
the total arrangement consideration and the
fair value of the undelivered item.
j. Recognition of dividend income, interest income or expense
Dividend income is recognised in profit or loss
on the date on which the Group’s right to receive
payment is established.
Interest income or expense is recognised using
the effective interest method.
The ‘effective interest rate’ is the rate that exactly
discounts estimated future cash payments or
receipts through the expected life of the financial
instrument to:
- the gross carrying amount of the financial
asset; or
- the amortised cost of the financial liability.
In calculating interest income and expense, the
effective interest rate is applied to the gross
carrying amount of the asset (when the asset
is not credit-impaired) or to the amortised cost
of the liability. However, for financial assets that
have become credit-impaired subsequent to
initial recognition, interest income is calculated
by applying the effective interest rate to the
amortised cost of the financial asset. If the asset
is no longer credit-impaired, then the calculation
of interest income reverts to the gross basis.
k. Sale of investments
Profit on sale of investments is recorded on
transfer of title from the Group and is determined
as the difference between the sales price and the
carrying value of the investment.
l. Leases
i. Determining whether an arrangement contains a lease
At inception of an arrangement, it is
determined whether the arrangement
is or contains a lease. At inception or
on reassessment of the arrangement
that contains a lease, the payments and
other consideration required by such an
arrangement are separated into those for
the lease and those for other elements on
the basis of their relative fair values. If it
is concluded for a finance lease that it is
impracticable to separate the payments
reliably, then an asset and a liability are
recognised at an amount equal to the fair
value of the underlying asset. The liability
is reduced as payments are made and
an imputed finance cost on the liability is
recognised using the incremental borrowing
rate.
ii. Assets held under leases
Leases of property, plant and equipment
that transfer to the Group substantially
all the risks and rewards of ownership are
classified as finance leases. The leased
assets are measured initially at an amount
equal to the lower of their fair value and
the present value of the minimum lease
payments. Subsequent to initial recognition,
the assets are accounted for in accordance
with the accounting policy applicable to
similar owned assets.
Assets held under leases that do not transfer
to the Group substantially all the risks and
rewards of ownership (i.e. operating leases)
are not recognised in the Group’s Balance
Sheet.
iii. Lease payments
Payments made under operating leases
are generally recognised in profit or loss
on a straight-line basis over the term of the
lease unless such payments are structured
to increase in line with expected general
inflation to compensate for the lessor’s
expected inflationary cost increases.
Lease incentives received are recognised as
an integral part of the total lease expense
over the term of the lease.
Minimum lease payments made under finance
leases are apportioned between the finance
charge and the reduction of the outstanding
liability. The finance charge is allocated to
each period during the lease term so as to
Notes to the consolidated financial statementsfor the year ended 31st March, 2018(All amounts are in lakhs of Indian Rupees, unless otherwise stated)
188 Newgen Software Technologies Limited
produce a constant periodic rate of interest
on the remaining balance of the liability.
m. Income tax
Income tax comprises current and deferred tax. It
is recognised in profit or loss except to the extent
that it relates to an item recognised directly in
equity or in other comprehensive income.
i. Current tax
Current tax comprises the expected tax
payable or receivable on the taxable income
or loss for the year and any adjustment to
the tax payable or receivable in respect of
previous years. The amount of current tax
reflects the best estimate of the tax amount
expected to be paid or received after
considering the uncertainty, if any, related
to income taxes. It is measured using tax
rates (and tax laws) enacted or substantively
enacted by the reporting date.
Current tax assets and current tax liabilities
are offset only if there is a legally enforceable
right to set off the recognised amounts, and
it is intended to realise the asset and settle
the liability on a net basis or simultaneously.
ii. Deferred tax
Deferred tax is recognised in respect of
temporary differences between the carrying
amounts of assets and liabilities for financial
reporting purposes and the corresponding
amounts used for taxation purposes.
Deferred tax is also recognised in respect of
carried forward tax losses and tax credits.
Deferred tax is not recognised for:
- temporary differences arising on the
initial recognition of assets or liabilities
in a transaction that is not a business
combination and that affects neither
accounting nor taxable profit or loss at
the time of the transaction;
Deferred tax assets are recognised to the
extent that it is probable that future taxable
profits will be available against which
they can be used. Deferred tax assets –
unrecognised or recognised, are reviewed
at each reporting date and are recognised/
reduced to the extent that it is probable/ no
longer probable respectively that the related
tax benefit will be realized.
Deferred tax is measured at the tax rates that
are expected to apply to the period when
the asset is realised or the liability is settled,
based on the laws that have been enacted or
substantively enacted by the reporting date.
The measurement of deferred tax reflects
the tax consequences that would follow from
the manner in which the Group expects, at
the reporting date, to recover or settle the
carrying amount of its assets and liabilities.
Deferred tax assets and liabilities are offset
if there is a legally enforceable right to offset
current tax liabilities and assets, and they
relate to income taxes levied by the same
tax authority on the same taxable entity, or
on different tax entities, but they intend to
settle current tax liabilities and assets on a
net basis or their tax assets and liabilities will
be realised simultaneously.
Minimum Alternative Tax (‘MAT’) under the
provisions of the Income-tax Act, 1961 is
recognised as current tax in the Statement
of Profit and Loss. The credit available under
the Act in respect of MAT paid is recognised
as an asset only when and to the extent there
is convincing evidence that the company will
pay normal income tax during the period
for which the MAT credit can be carried
forward for set-off against the normal tax
liability. MAT credit recognised as an asset
is reviewed at each balance sheet date and
written down to the extent the aforesaid
convincing evidence no longer exists.
n. Cash and Cash Equivalents
Cash and short-term deposits in the Balance
Sheet comprise cash at banks and cash in hand
and short-term deposits with an original maturity
of three months or less, which are subject to
insignificant risk of changes in value.
o. Earnings per share (“EPS”)
Basic earnings per share is calculated by dividing
the profit attributable to the owners of the Group
by the weighted average number of equity shares
outstanding during the year.
Notes to the consolidated financial statementsfor the year ended 31st March, 2018(All amounts are in lakhs of Indian Rupees, unless otherwise stated)

189ANNUAL REPORT 2017-18
CORPORATE REVIEW FINANCIAL STATEMENTSSTATUTORY REPORTS
Diluted earnings per share is computed using
the net profit or loss for the year attributable to
equity shareholders and the weighted average
number of common and dilutive common
equivalent shares outstanding during the year but
including share options, compulsory convertible
preference shares except where the result would
be anti-dilutive.
p. Share Capital
Equity Shares
Equity shares are classified as equity. Incremental
costs directly attributable to the issuance of new
equity shares are recognized as a deduction
from equity.
Compulsorily convertible preference shares
The embedded derivative liability on initial
recognition has been separated from the
underlying equity instrument and recorded at
fair value. The difference between the fair value
of the combined CCPS instrument and the fair
value of the embedded derivative liability has
been recorded as the value of the equity host
contract. The embedded derivative has been
fair valued through profit or loss at each balance
sheet date.
Upon conversion of CCPS into equity shares the
resultant gain/loss on the down-round derivative
is recognised in profit or loss. The original equity
component remains as equity/is transferred
within equity.
Dividends
The final dividend on shares is recorded as
a liability on the date of approval by the
shareholders, and interim dividend are recorded
as a liability on the date of declaration by the
Company’s Board of Directors.
q. Segment
Segment reporting
Operating segments are reported in a
manner consistent with the internal reporting
provided to the chief operating decision
maker (CODM).
Identification of segments:
All operating segments’ results are reviewed
regularly by the Board of Directors, who have
been identified as the CODM, to allocate
resources to the segments and assess their
performance. Refer note 49 for segment
information.
r. ESOP Trust
The ESOP trust has been treated as an
extension of the Company and accordingly
shares held by ESOP Trust are netted off from
the total share capital. Consequently, all the
assets, liabilities, income and expenses of the
trust are accounted for as assets, liabilities,
income and expenses of the Company, except
for profit / loss on issue of shares to the
employees and dividend received by trust
which are directly adjusted in the Newgen
ESOP Trust reserve.
s. Rounding of amounts
All amounts disclosed in the financial statements
and notes have been rounded off to the nearest
lakhs as per the requirement of Schedule III,
unless otherwise stated.
Notes to the consolidated financial statementsfor the year ended 31st March, 2018(All amounts are in lakhs of Indian Rupees, unless otherwise stated)
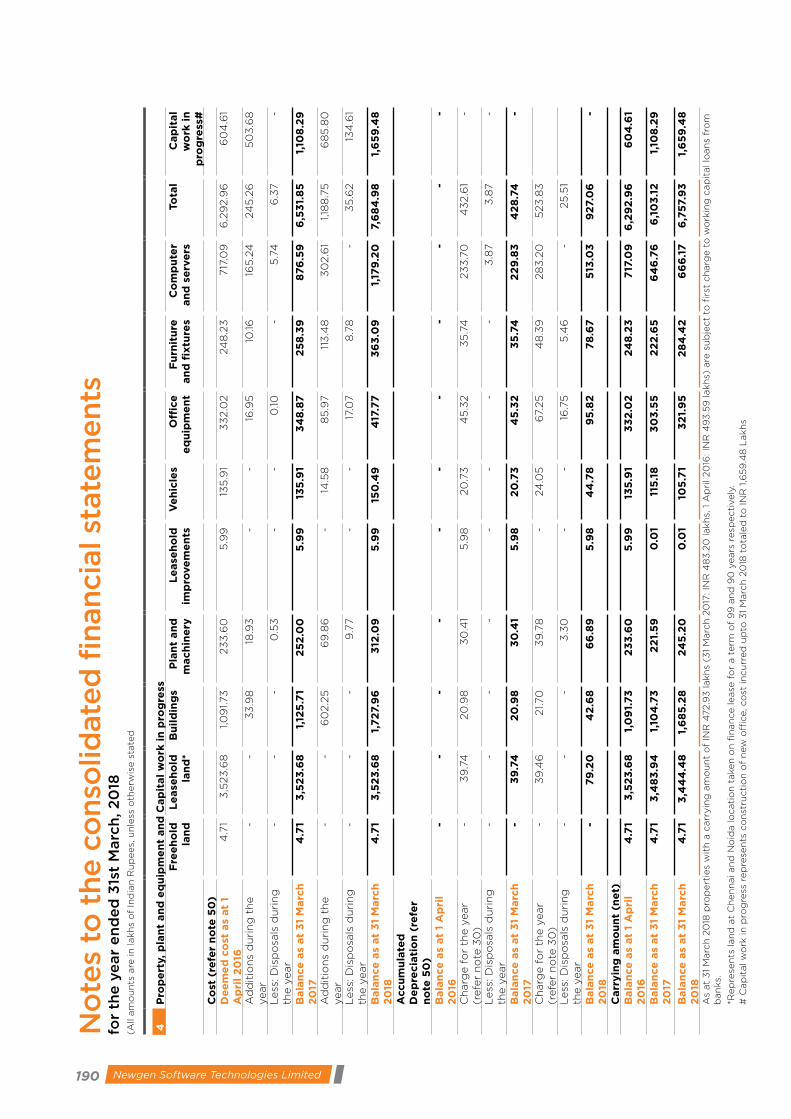
190 Newgen Software Technologies Limited
4P
rop
ert
y, p
lan
t an
d e
qu
ipm
en
t an
d C
ap
ital
wo
rk i
n p
rog
ress
Fre
eh
old
la
nd
Le
ase
ho
ld
lan
d*
Bu
ild
ing
sP
lan
t an
d
mach
ine
ryL
ease
ho
ld
imp
rove
me
nts
Ve
hic
les
Off
ice
e
qu
ipm
en
tF
urn
itu
re
an
d f
ixtu
res
Co
mp
ute
r an
d s
erv
ers
Tota
l C
ap
ital
wo
rk i
n
pro
gre
ss#
Co
st (
refe
r n
ote
50
)D
ee
me
d c
ost
as
at
1 A
pri
l 2
016
4.7
1 3
,523
.68
1,0
91.73
23
3.6
0
5.9
9
135
.91
33
2.0
2
24
8.2
3
717
.09
6
,29
2.9
6
60
4.6
1
Ad
dit
ion
s d
uri
ng
th
e
year
- -
33
.98
18
.93
-
- 16
.95
10
.16
165
.24
24
5.2
6
50
3.6
8
Less
: D
isp
osa
ls d
uri
ng
th
e y
ear
- -
- 0
.53
-
- 0
.10
- 5
.74
6
.37
-
Bala
nce
as
at
31
Marc
h
20
174
.71
3,5
23
.68
1,
125
.71
25
2.0
0
5.9
9
135
.91
34
8.8
7
25
8.3
9
876
.59
6
,53
1.8
5
1,10
8.2
9
Ad
dit
ion
s d
uri
ng
th
e
year
- -
60
2.2
5
69
.86
-
14.5
8
85
.97
113
.48
3
02.6
1 1,1
88
.75
6
85
.80
Less
: D
isp
osa
ls d
uri
ng
th
e y
ear
- -
- 9
.77
- -
17.0
7
8.7
8
- 3
5.6
2
134
.61
Bala
nce
as
at
31
Marc
h
20
184
.71
3,5
23
.68
1,
72
7.9
6
312
.09
5
.99
15
0.4
9
417
.77
3
63
.09
1,
179
.20
7,
68
4.9
8
1,6
59
.48
Accu
mu
late
d
De
pre
cia
tio
n (
refe
r n
ote
50
)B
ala
nce
as
at
1 A
pri
l 2
016
- -
- -
- -
- -
- -
-
Ch
arg
e f
or
the y
ear
(refe
r n
ote
30
)-
39
.74
20
.98
3
0.4
1 5
.98
20
.73
4
5.3
2
35
.74
23
3.7
0
43
2.6
1 -
Less
: D
isp
osa
ls d
uri
ng
th
e y
ear
- -
- -
- -
- -
3.8
7
3.8
7
-
Bala
nce
as
at
31
Marc
h
20
17-
39
.74
2
0.9
8
30
.41
5.9
8
20
.73
4
5.3
2
35
.74
2
29
.83
4
28
.74
-
Ch
arg
e f
or
the y
ear
(refe
r n
ote
30
)-
39
.46
21.70
3
9.7
8
- 24
.05
6
7.25
4
8.3
9
28
3.2
0
523
.83
Less
: D
isp
osa
ls d
uri
ng
th
e y
ear
- -
- 3
.30
-
- 16
.75
5
.46
-
25
.51
Bala
nce
as
at
31
Marc
h
20
18-
79
.20
4
2.6
8
66
.89
5
.98
4
4.7
8
95
.82
7
8.6
7
513
.03
9
27.
06
-
Carr
yin
g a
mo
un
t (n
et)
Bala
nce
as
at
1 A
pri
l 2
016
4.7
1 3
,52
3.6
8
1,0
91.
73
2
33
.60
5
.99
13
5.9
1 3
32
.02
2
48
.23
7
17.0
9
6,2
92
.96
6
04
.61
Bala
nce
as
at
31
Marc
h
20
174
.71
3,4
83
.94
1,
104
.73
2
21.
59
0
.01
115
.18
3
03
.55
2
22
.65
6
46
.76
6
,10
3.1
2
1,10
8.2
9
Bala
nce
as
at
31
Marc
h
20
184
.71
3,4
44
.48
1,
68
5.2
8
24
5.2
0
0.0
1 10
5.7
1 3
21.
95
2
84
.42
6
66
.17
6
,757.
93
1,
65
9.4
8
As
at
31
Marc
h 2
018
pro
pert
ies
wit
h a
carr
yin
g a
mo
un
t o
f IN
R 4
72.9
3 lakh
s (3
1 M
arc
h 2
017
: IN
R 4
83
.20
lakh
s, 1
Ap
ril 20
16: IN
R 4
93
.59
lakh
s) a
re s
ub
ject
to f
irst
ch
arg
e t
o w
ork
ing
cap
ital lo
an
s fr
om
b
an
ks.
*Rep
rese
nts
lan
d a
t C
hen
nai an
d N
oid
a lo
cati
on
taken
on
fin
an
ce lease
fo
r a t
erm
of
99
an
d 9
0 y
ears
resp
ecti
vely
.#
Cap
ital w
ork
in
pro
gre
ss r
ep
rese
nts
co
nst
ructi
on
of
new
off
ice, c
ost
in
cu
rred
up
to 3
1 M
arc
h 2
018
to
tale
d t
o IN
R 1
,659
.48
Lakh
s
No
tes
to t
he c
onso
lidate
d f
inan
cia
l st
ate
men
ts
for
the
ye
ar
en
de
d 3
1st
Marc
h, 2
018
(All
am
ou
nts
are
in
lakh
s o
f In
dia
n R
up
ees,
un
less
oth
erw
ise s
tate
d
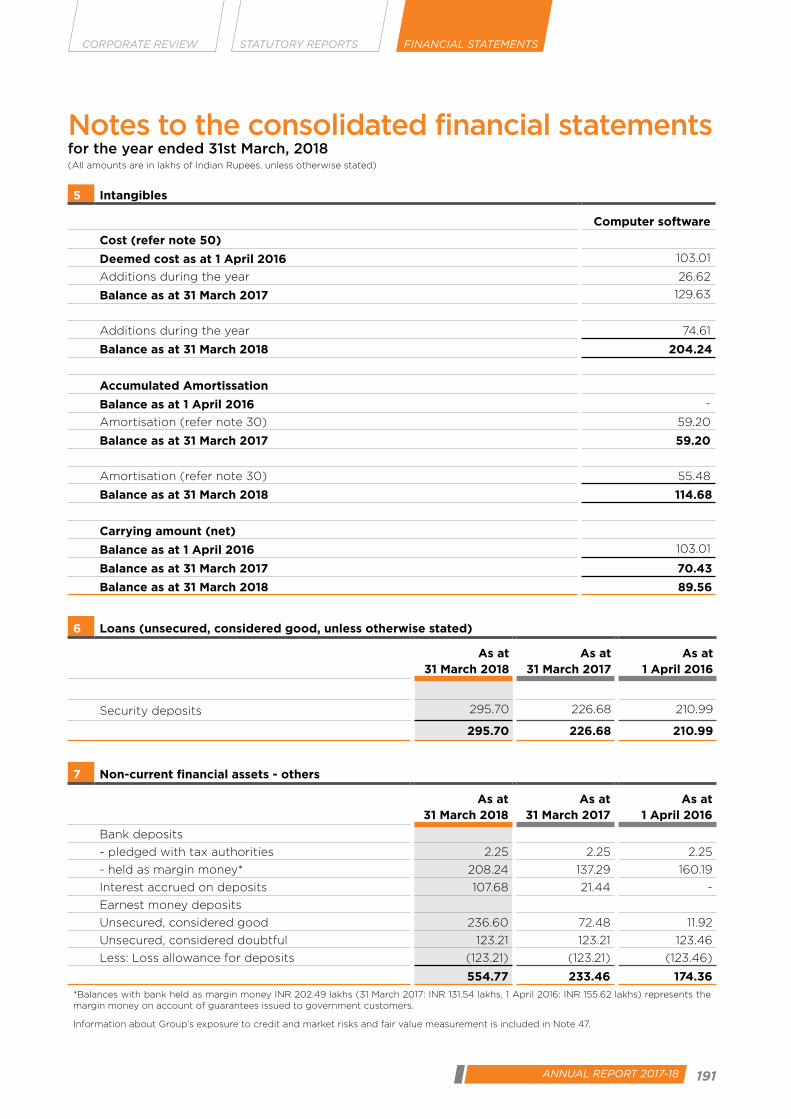
191ANNUAL REPORT 2017-18
CORPORATE REVIEW FINANCIAL STATEMENTSSTATUTORY REPORTS
Notes to the consolidated financial statementsfor the year ended 31st March, 2018(All amounts are in lakhs of Indian Rupees, unless otherwise stated)
5 Intangibles
Computer software
Cost (refer note 50)
Deemed cost as at 1 April 2016 103.01
Additions during the year 26.62
Balance as at 31 March 2017 129.63
Additions during the year 74.61
Balance as at 31 March 2018 204.24
Accumulated Amortissation
Balance as at 1 April 2016 -
Amortisation (refer note 30) 59.20
Balance as at 31 March 2017 59.20
Amortisation (refer note 30) 55.48
Balance as at 31 March 2018 114.68
Carrying amount (net)
Balance as at 1 April 2016 103.01
Balance as at 31 March 2017 70.43
Balance as at 31 March 2018 89.56
6 Loans (unsecured, considered good, unless otherwise stated)
As at 31 March 2018
As at 31 March 2017
As at 1 April 2016
Security deposits 295.70 226.68 210.99
295.70 226.68 210.99
7 Non-current financial assets - others
As at 31 March 2018
As at 31 March 2017
As at 1 April 2016
Bank deposits
- pledged with tax authorities 2.25 2.25 2.25
- held as margin money* 208.24 137.29 160.19
Interest accrued on deposits 107.68 21.44 -
Earnest money deposits
Unsecured, considered good 236.60 72.48 11.92
Unsecured, considered doubtful 123.21 123.21 123.46
Less: Loss allowance for deposits (123.21) (123.21) (123.46)
554.77 233.46 174.36
*Balances with bank held as margin money INR 202.49 lakhs (31 March 2017: INR 131.54 lakhs, 1 April 2016: INR 155.62 lakhs) represents the margin money on account of guarantees issued to government customers.
Information about Group’s exposure to credit and market risks and fair value measurement is included in Note 47.
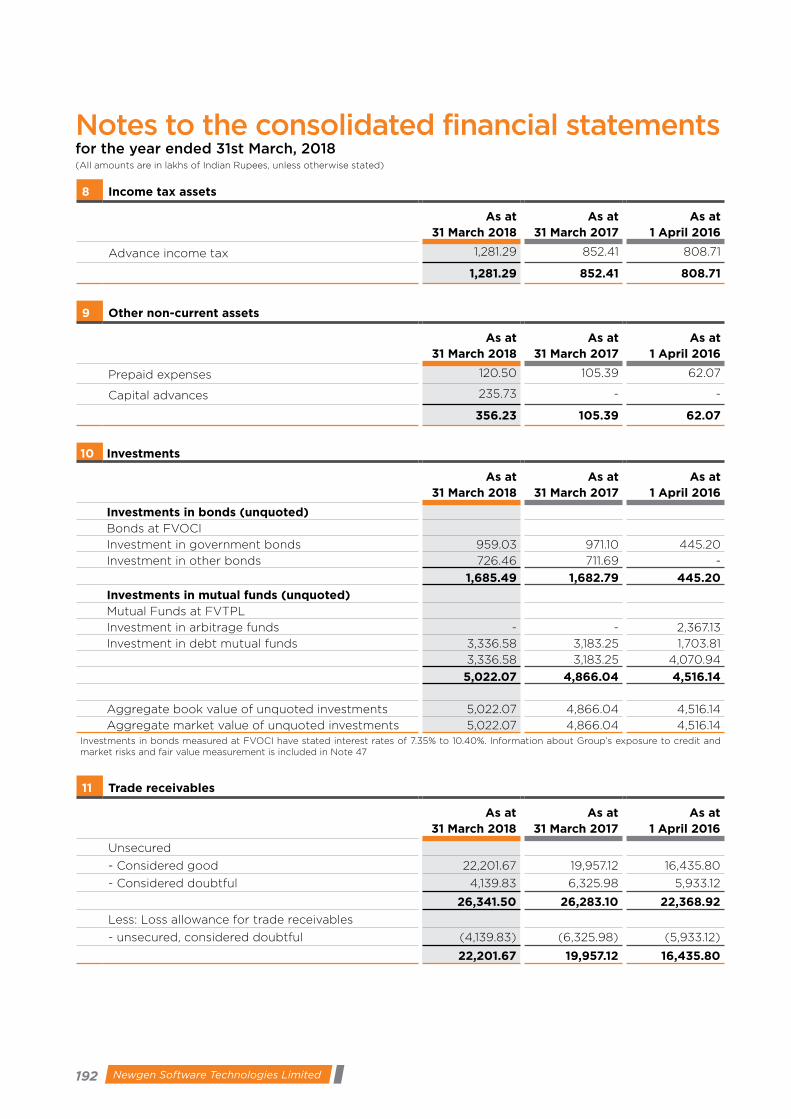
192 Newgen Software Technologies Limited
Notes to the consolidated financial statementsfor the year ended 31st March, 2018(All amounts are in lakhs of Indian Rupees, unless otherwise stated)
8 Income tax assets
As at 31 March 2018
As at 31 March 2017
As at 1 April 2016
Advance income tax 1,281.29 852.41 808.71
1,281.29 852.41 808.71
9 Other non-current assets
As at 31 March 2018
As at 31 March 2017
As at 1 April 2016
Prepaid expenses 120.50 105.39 62.07
Capital advances 235.73 - -
356.23 105.39 62.07
10 Investments
As at 31 March 2018
As at 31 March 2017
As at 1 April 2016
Investments in bonds (unquoted)Bonds at FVOCI
Investment in government bonds 959.03 971.10 445.20
Investment in other bonds 726.46 711.69 -
1,685.49 1,682.79 445.20
Investments in mutual funds (unquoted)Mutual Funds at FVTPL
Investment in arbitrage funds - - 2,367.13
Investment in debt mutual funds 3,336.58 3,183.25 1,703.81
3,336.58 3,183.25 4,070.94
5,022.07 4,866.04 4,516.14
Aggregate book value of unquoted investments 5,022.07 4,866.04 4,516.14
Aggregate market value of unquoted investments 5,022.07 4,866.04 4,516.14 Investments in bonds measured at FVOCI have stated interest rates of 7.35% to 10.40%. Information about Group’s exposure to credit and market risks and fair value measurement is included in Note 47
11 Trade receivables
As at 31 March 2018
As at 31 March 2017
As at 1 April 2016
Unsecured
- Considered good 22,201.67 19,957.12 16,435.80
- Considered doubtful 4,139.83 6,325.98 5,933.12
26,341.50 26,283.10 22,368.92
Less: Loss allowance for trade receivables
- unsecured, considered doubtful (4,139.83) (6,325.98) (5,933.12)
22,201.67 19,957.12 16,435.80
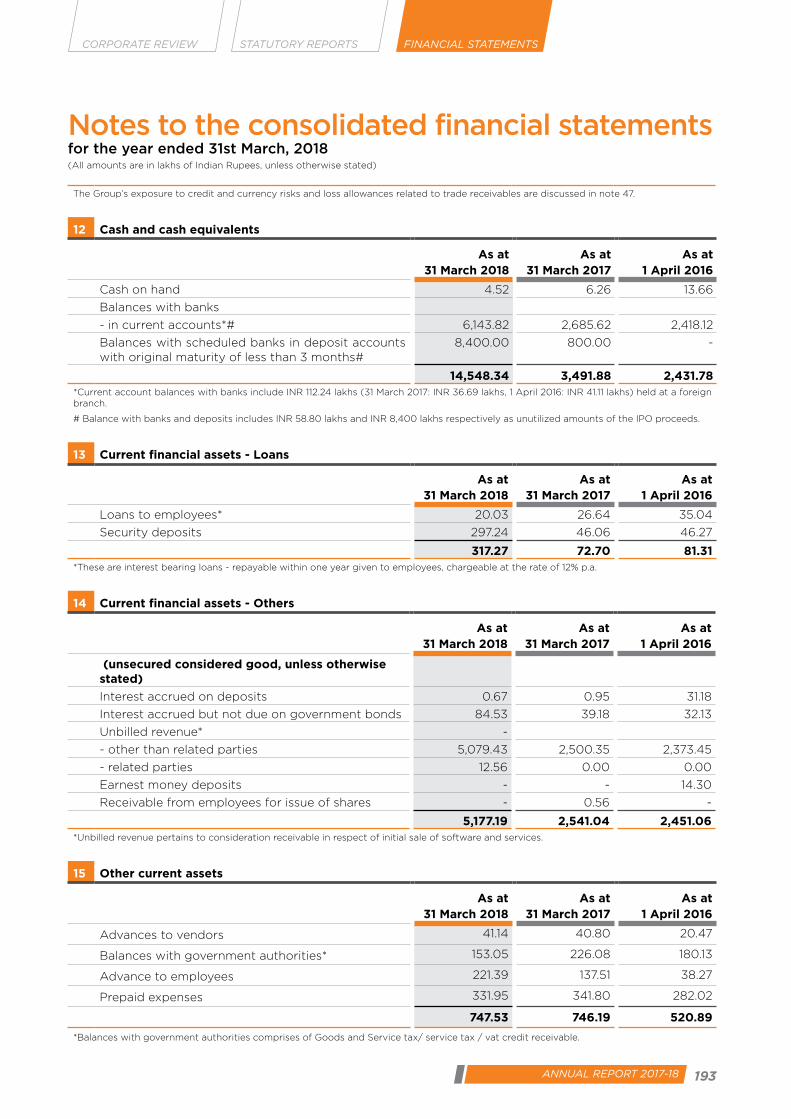
193ANNUAL REPORT 2017-18
CORPORATE REVIEW FINANCIAL STATEMENTSSTATUTORY REPORTS
The Group’s exposure to credit and currency risks and loss allowances related to trade receivables are discussed in note 47.
12 Cash and cash equivalents
As at 31 March 2018
As at 31 March 2017
As at 1 April 2016
Cash on hand 4.52 6.26 13.66
Balances with banks
- in current accounts*# 6,143.82 2,685.62 2,418.12
Balances with scheduled banks in deposit accounts with original maturity of less than 3 months#
8,400.00 800.00 -
14,548.34 3,491.88 2,431.78 *Current account balances with banks include INR 112.24 lakhs (31 March 2017: INR 36.69 lakhs, 1 April 2016: INR 41.11 lakhs) held at a foreign branch.
# Balance with banks and deposits includes INR 58.80 lakhs and INR 8,400 lakhs respectively as unutilized amounts of the IPO proceeds.
13 Current financial assets - Loans
As at 31 March 2018
As at 31 March 2017
As at 1 April 2016
Loans to employees* 20.03 26.64 35.04
Security deposits 297.24 46.06 46.27
317.27 72.70 81.31 *These are interest bearing loans - repayable within one year given to employees, chargeable at the rate of 12% p.a.
14 Current financial assets - Others
As at 31 March 2018
As at 31 March 2017
As at 1 April 2016
(unsecured considered good, unless otherwise stated)
Interest accrued on deposits 0.67 0.95 31.18
Interest accrued but not due on government bonds 84.53 39.18 32.13
Unbilled revenue* -
- other than related parties 5,079.43 2,500.35 2,373.45
- related parties 12.56 0.00 0.00
Earnest money deposits - - 14.30
Receivable from employees for issue of shares - 0.56 -
5,177.19 2,541.04 2,451.06 *Unbilled revenue pertains to consideration receivable in respect of initial sale of software and services.
15 Other current assets
As at 31 March 2018
As at 31 March 2017
As at 1 April 2016
Advances to vendors 41.14 40.80 20.47
Balances with government authorities* 153.05 226.08 180.13
Advance to employees 221.39 137.51 38.27
Prepaid expenses 331.95 341.80 282.02
747.53 746.19 520.89
*Balances with government authorities comprises of Goods and Service tax/ service tax / vat credit receivable.
Notes to the consolidated financial statementsfor the year ended 31st March, 2018(All amounts are in lakhs of Indian Rupees, unless otherwise stated)

194 Newgen Software Technologies Limited
16 Share capital
As at 31 March 2018 As at 31 March 2017 As at 1 April 2016
Number of shares
Amount Number of shares
Amount Number of shares
Amount
Authorised share capital
Equity shares of INR 10 each
98,000,000 9,800.00 64,400,000 6,440.00 63,050,000 6,305.00
Equity share capital with differential voting rights of INR 10 each
200 0.02 200 0.02 200 0.02
0.01% Compulsory convertible preference shares of INR 10 each
11,999,800 1,199.98 11,999,800 1,199.98 11,999,800 1,199.98
110,000,000 11,000.00 76,400,000 7,640.00 75,050,000 7,505
As at 31 March 2018 As at 31 March 2017 As at 1 April 2016
Issued, subscribed and paid up
Number of shares
Amount Number of shares
Amount Number of shares
Amount
Equity share capital of INR 10 each, fully paid up
67,884,117 6,788.41 62,312,966 6,231.29 51,790,065 5,179.01
Equity share capital with differential voting rights (DVR) of INR 10 each, fully paid up
- - 120 0.01 120 0.01
0.01% Compulsory convertible preference shares of Rs. 10 each, fully paid up
- - - - 10,294,230 1,029.42
Total Share capital 67,884,117 6,788.41 62,313,086 6,231.30 62,084,415 6,208.44
Reconciliation of shares outstanding at the beginning and at the end at the reporting year
As at 31 March 2018 As at 31 March 2017
Equity share capital of INR 10 each, fully paid up
Number of shares
Amount Number of shares
Amount
At the beginning of the year 64,308,030 6,430.80 54,013,800 5,401.38
Add: Shares issued on conversion of preference shares
- - 10,294,230 1,029.42
Add: Equity shares with differential voting rights reclassified to equity shares during the year
120 0.01 120 0.01
Add: Equity shares issued during the year through initial public offer
3,877,551 387.76 - -
Add: Issued during the year to Newgen ESOP Trust
1,050,000 105.00 - -
At the end of the year 69,235,701 6,923.57 64,308,150 6,430.81
Less: Shares held by trust 1,351,584 135.16 1,995,064 199.51
Total equity share capital 67,884,117 6,788.41 62,313,086 6,231.30
During the year ended 31 March 2018, the Company has completed the initial public offer (IPO), pursuant to which
17,331,483 equity shares of INR 10 each were allotted/allocated, at an issue price of INR 245 each, consisting of
fresh issue of 3,877,551 equity shares and an offer for sale of 13,453,932 equity shares by selling shareholders.
The equity shares of the Company were listed on National Stock Exchange of India Limited (NSE) via ID
Notes to the consolidated financial statementsfor the year ended 31st March, 2018(All amounts are in lakhs of Indian Rupees, unless otherwise stated)

195ANNUAL REPORT 2017-18
CORPORATE REVIEW FINANCIAL STATEMENTSSTATUTORY REPORTS
NEWGEN and BSE Limited (BSE) via ID 540900 on 29 January 2018.
Terms/rights attached to equity shares
In case of equity shares, each equity shareholder is eligible for one vote per share held. The dividend proposed
by the Board of Directors is subject to the approval of the shareholders in the ensuing annual general meeting,
except in case of interim dividend, if any. In the event of liquidation, the equity shareholders are eligible to
receive the remaining assets of the Company after distribution of all preferential amounts, in proportion to their
respective shareholding. shareholding.
As at 31 March 2018 As at 31 March 2017
Equity share capital with differential voting rights (DVR) of INR 10 each, fully paid up
Number of shares
Amount Number of shares
Amount
At the beginning of the year 120 0.01 120 0.01
Less: Reclassification to equity shares
during the year
(120) (0.01) - -
At the end of the year - - 120 0.01
Equity shares with differential voting rights :
Each of the shareholder with differential voting rights shall, at all times up to the conversion of Compulsory
convertible preference shares into equity shares thereof, were entitled to a fixed preferential and cumulative
dividend of one-hundredth percent (0.01%) of the investment amount and resolved to be so distributed as
such dividend in respect of each financial year or other accounting period of the Company, in accordance with
applicable law. In addition, the Ascent DVR and the IDGVI DVR shall be entitled to participate in any distribution
of the profits of the Company (including, as regards any dividends declared) on a pro-rata share and as-if-
converted basis vis-à-vis the other shareholders.
Expiration of differential rights:
Pursuant to the shareholder subscription agreement dated 31 October 2013, each Ascent DVR
and an IDGVI DVR shall be compulsorily converted at no cost to the Investors, into equity shares
in the ratio of 1:1 at any time as may be determined by the investors in their sole discretion. Upon
conversion of the Ascent DVR and the IDGVI DVR , such differential voting and dividend rights,
as mentioned above, on the shares held by each of the investors have automatically expired.
During the year ended 31 March 2018 each equity share with DVR has been re-classified into equity shares.
As at 31 March 2018 As at 31 March 2017
0.01% Compulsory convertible preference shares of Rs. 10 each, fully paid up
Number of shares
Amount Number of shares
Amount
At the beginning of the year - - 10,294,230 1,029.42
Less: Preference shares conversion to
equity shares during the year
- - 10,294,230 1,029.42
At the end of the year - - - -
Terms/rights attached to preference shares
During the years ended 31 March 2008 and 31 March 2009, the Company had issued 1,014,785 compulsorily
convertible preference shares (hereinafter referred to as “CCPS”) of Rs. 10 each fully paid up to HAV2 (Mauritius)
Limited and 360,250 CCPS of Rs. 10 each fully paid up to SAPV (Mauritius). During the financial year 2013-
14, HAV2 (Mauritius) Limited, exited from the Company and two new investors namely Unit Trust of India
Investment Advisory Services Limited, A/C Ascent India Fund II (“Ascent”) and IDG Ventures India Fund II LLC
(“IDGVI”) made investment in the Company. During the year ended 31 March 2014, all the CCPS held by HAV2
(Mauritius) Limited, were acquired by Ascent (670,790 CCPS) and IDGVI (343,995 CCPS). Further, during the
Notes to the consolidated financial statementsfor the year ended 31st March, 2018(All amounts are in lakhs of Indian Rupees, unless otherwise stated)

196 Newgen Software Technologies Limited
year ended 2014-15, the Company has also allotted 225,192 number of CCPS to Ascent and 115,478 number of
CCPS to IDGVI.
Pursuant to Shareholders agreement executed on 31 October 2013, between Newgen Software Technologies
Ltd and Ascent, IDGVI, SAPV (Mauritius) (individually referred as investor and together referred to as investor
group), Newgen Employees Trust and Mr. Diwakar Nigam, Mr. T.S. Varadarajan, Mrs. Priyadarshini Nigam and
Mrs. Usha Varadarajan, and Share purchase cum Subscription agreement dated 31 October 2013, between
Newgen Software Technologies Ltd, Ascent, IDGVI, SAPV (Mauritius), Mr. Diwakar Nigam, Mr. T.S. Varadarajan,
Mrs. Priyadarshini Nigam and Mrs. Usha Varadarajan, the investor group were entitled to receive dividends in
preference to any dividends on the equity shares of the Company at the rate of 0.01% (Zero point Zero One Per
cent) per annum on the investors subscription consideration, pro rata on a fully diluted basis. However, all the
preferential dividend and differential voting rights have already been expired due to conversion of CCPS into
Equity.
During the year 2014-15, IDGVI transferred 606,540 shares (adjusted for bonus issue) to Pandara Trust Scheme - I
Each CCPS shall be compulsorily converted at no cost to the Investor, into Equity Shares in the ratio of 1:1 at any time
as may be determined by the Investor at their sole discretion. Subject to applicable Law, the conversion of the Shares
and the HAV2 (Mauritius) Limited Sale of Shares will take place within the maximum time period prescribed under
applicable Law for such conversion.
Conversion of Compulsory convertible preference shares into equity
Pursuant to the Shareholders Agreement, during the year ended 31 March 2017, all issued 10,294,230 CCPS of
Rs.10/- each have been converted into 10,294,230 equity shares of Rs.10/- each in the ratio of 1:1, at no cost
to the investors. Equity shares of the Company allotted upon conversion of the CCPS, rank pari passu in all
respects including as to dividend, voting rights, with the existing fully paid up equity shares of face value of Re.
10/- each of the Company.
16 A Details of shareholders holding more than 5% shares in the Company
Equity shares of INR10 each, fully paid up held by:
As at 31 March 2018 31 March 2017 1 April 2016
Number % Holding Number % Holding Number % Holding
- Mr. Diwakar Nigam 18,422,406 28.65% 18,422,406 28.65% 18,422,406 34.11%
- Mr. T.S. Varadarajan 15,009,306 23.34% 15,009,306 23.34% 15,009,306 27.79%
- Mrs. Priyadarshini
Nigam
7,968,906 12.39% 7,968,906 12.39% 7,968,906 14.75%
- Mrs. Usha Varadarajan 4,528,320 7.04% 4,528,320 7.04% 4,528,320 8.38%
- Unit Trust of India
Investment Advisory
Services Limited, A/C
Ascent India Fund III
- - 7,464,510 11.61% - -
Equity shares with Differential voting Rights of INR 10 each, fully paid up held by: As at 31 March 2018 31 March 2017 1 April 2016
Number % Holding Number % Holding Number % Holding
Unit Trust of India
Investment Advisory
Services Limited, A/C
Ascent India Fund III
- - 60 50.00% 60 50.00%
IDG Ventures India
Fund II LLC
- - 60 50.00% 60 50.00%
Notes to the consolidated financial statementsfor the year ended 31st March, 2018(All amounts are in lakhs of Indian Rupees, unless otherwise stated)
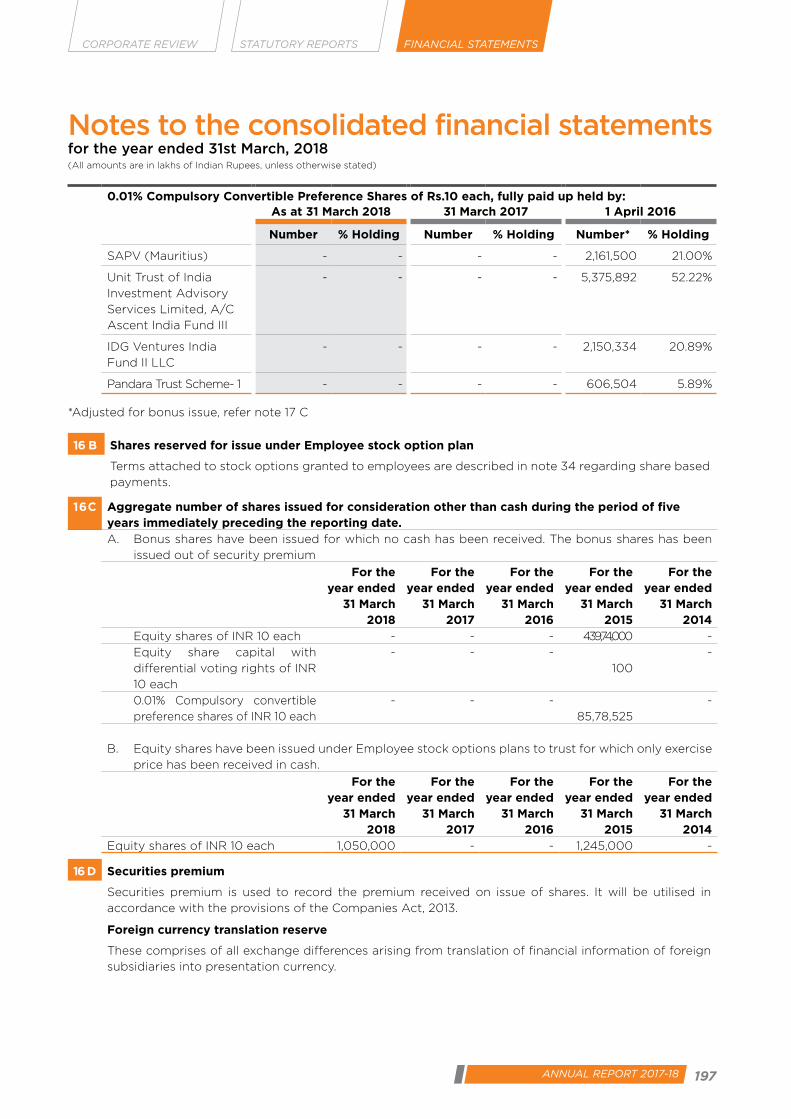
197ANNUAL REPORT 2017-18
CORPORATE REVIEW FINANCIAL STATEMENTSSTATUTORY REPORTS
0.01% Compulsory Convertible Preference Shares of Rs.10 each, fully paid up held by:As at 31 March 2018 31 March 2017 1 April 2016
Number % Holding Number % Holding Number* % Holding
SAPV (Mauritius) - - - - 2,161,500 21.00%
Unit Trust of India
Investment Advisory
Services Limited, A/C
Ascent India Fund III
- - - - 5,375,892 52.22%
IDG Ventures India
Fund II LLC
- - - - 2,150,334 20.89%
Pandara Trust Scheme- 1 - - - - 606,504 5.89%
*Adjusted for bonus issue, refer note 17 C
16 B Shares reserved for issue under Employee stock option plan
Terms attached to stock options granted to employees are described in note 34 regarding share based
payments.
1 6 C Aggregate number of shares issued for consideration other than cash during the period of five years immediately preceding the reporting date.A. Bonus shares have been issued for which no cash has been received. The bonus shares has been
issued out of security premium
For the year ended
31 March 2018
For the year ended
31 March 2017
For the year ended
31 March 2016
For the year ended
31 March 2015
For the year ended
31 March 2014
Equity shares of INR 10 each - - - 439,74,000 -
Equity share capital with
differential voting rights of INR
10 each
- - -
100
-
0.01% Compulsory convertible
preference shares of INR 10 each
- - -
85,78,525
-
B. Equity shares have been issued under Employee stock options plans to trust for which only exercise
price has been received in cash.
For the year ended
31 March 2018
For the year ended
31 March 2017
For the year ended
31 March 2016
For the year ended
31 March 2015
For the year ended
31 March 2014
Equity shares of INR 10 each 1,050,000 - - 1,245,000 -
16 D Securities premium
Securities premium is used to record the premium received on issue of shares. It will be utilised in
accordance with the provisions of the Companies Act, 2013.
Foreign currency translation reserve
These comprises of all exchange differences arising from translation of financial information of foreign
subsidiaries into presentation currency.
Notes to the consolidated financial statementsfor the year ended 31st March, 2018(All amounts are in lakhs of Indian Rupees, unless otherwise stated)

198 Newgen Software Technologies Limited
Newgen ESOP Trust reserve
The ESOP trust has been treated as an extension of the Company and accordingly shares held by ESOP
Trust are netted off from the total share capital. Consequently, all the assets, liabilities, income and
expenses of the trust are accounted for by the Company, except for profit / loss on issue of shares to
the employees and dividend received by trust which are directly adjusted in the Newgen ESOP Trust
reserve.
Share options outstanding reserve
The Group has established various equity-settled share-based payment plans for certain employees of
the Group. Refer to note 34 for further details on these plans.
17 Non-current financial liabilities - Borrowings
As at 31 March 2018
As at 31 March 2017
As at 1 April 2016
Non-current maturities of finance lease obligations
(secured)*
1,316.66 1,617.99 1,917.45
1,316.66 1,617.99 1,917.45
* Finance lease obligations
This Group had obtained leasehold land from ‘Yamuna Expressway Industrial Development Authority
(YEIDA)’ during the year ended 31 March 2016. The lease term of leasehold land is 90 years with equated
monthly payment beginning from the month subsequent to the commencement of lease.
Finance lease obligations are payable as follows:
Particulars As at 1 April 2016
Future minimum
lease payments
Interest Present value of minimum
lease payments
Less than one year 315.25 240.16 555.40
Between one and five years 1,204.62 615.64 1,820.26
More than five years 712.83 4,973.29 5,686.12
Particulars As at 31 March 2017
Less than one year 302.25 205.49 507.74
Between one and five years 1,051.96 481.51 1,533.47
More than five years 566.03 4,901.93 5,467.97
Particulars As at 31 March 2018
Less than one year 302.25 170.37 472.62
Between one and five years 684.42 442.27 1,126.69
More than five years 566.40 4,832.93 5,399.33
Effective interest rate on above borrowings is 11.68%.
18 Derivative
As at 31 March 2018
As at 31 March 2017
As at 1 April 2016
Derivative liability - - 136.00
- - 136.00
Notes to the consolidated financial statementsfor the year ended 31st March, 2018(All amounts are in lakhs of Indian Rupees, unless otherwise stated)

199ANNUAL REPORT 2017-18
CORPORATE REVIEW FINANCIAL STATEMENTSSTATUTORY REPORTS
19 Non-current provisions
As at 31 March 2018
As at 31 March 2017
As at 1 April 2016
Provision for employee benefits (refer note 27)
- provision for gratuity 1,266.07 1,113.20 865.23
- provision for compensated absences 387.30 329.77 256.35
1,653.37 1,442.97 1,121.58
20 Current financial liabilities - Borrowings
As at 31 March 2018
As at 31 March 2017
As at 1 April 2016
Loans from banks
Pre-shipment loans (secured)* 4,946.27 5,226.18 5,883.19
4,946.27 5,226.18 5,883.19 *Pre-shipment loans carry interest rate @ LIBOR plus margin which varied from 2.13% to 4.45% per annum. These are secured by first pari passu charge over all future and present stock, book debts and equitable mortgage of land and building with carrying amount of INR 472.93 lakhs (31 March 2017: INR 483.20 lakhs, 1 April 2016: INR 493.59) and are repayable within 180 days from the date of disbursement.
21 Trade payables
As at 31 March 2018
As at 31 March 2017
As at 1 April 2016
- Total outstanding dues to creditors other than
micro and small enterprises
2,292.10 1,804.95 1,473.16
2,292.10 1,804.95 1,473.16
Trade payables are non-interest bearing and are generally on terms of 30-45 days
a) Refer note 37 for Disclosures under Micro, Small and Medium Enterprises Development Act, 2006
(MSMED)
b) The Group's exposure to currency and liquidity risks related to trade payables is disclosed in note 47
22 Current financial liabilities - Others
As at 31 March 2018
As at 31 March 2017
As at 1 April 2016
Current maturities of finance lease obligations 302.25 302.25 315.25
Employee related payables 3,031.96 2,445.69 1,713.80
Payable in respect of retention money 47.92 28.10 11.64
Earnest money deposits 1.00 0.50 -
Payable for capital assets 241.35 126.67 17.47
3,624.48 2,903.21 2,058.16
23 Deferred income
As at 31 March 2018
As at 31 March 2017
As at 1 April 2016
Advance billing 4,917.82 3,856.11 3,264.09
Advance from customers 25.22 9.39 7.51
4,943.04 3,865.50 3,271.60
Notes to the consolidated financial statementsfor the year ended 31st March, 2018(All amounts are in lakhs of Indian Rupees, unless otherwise stated)
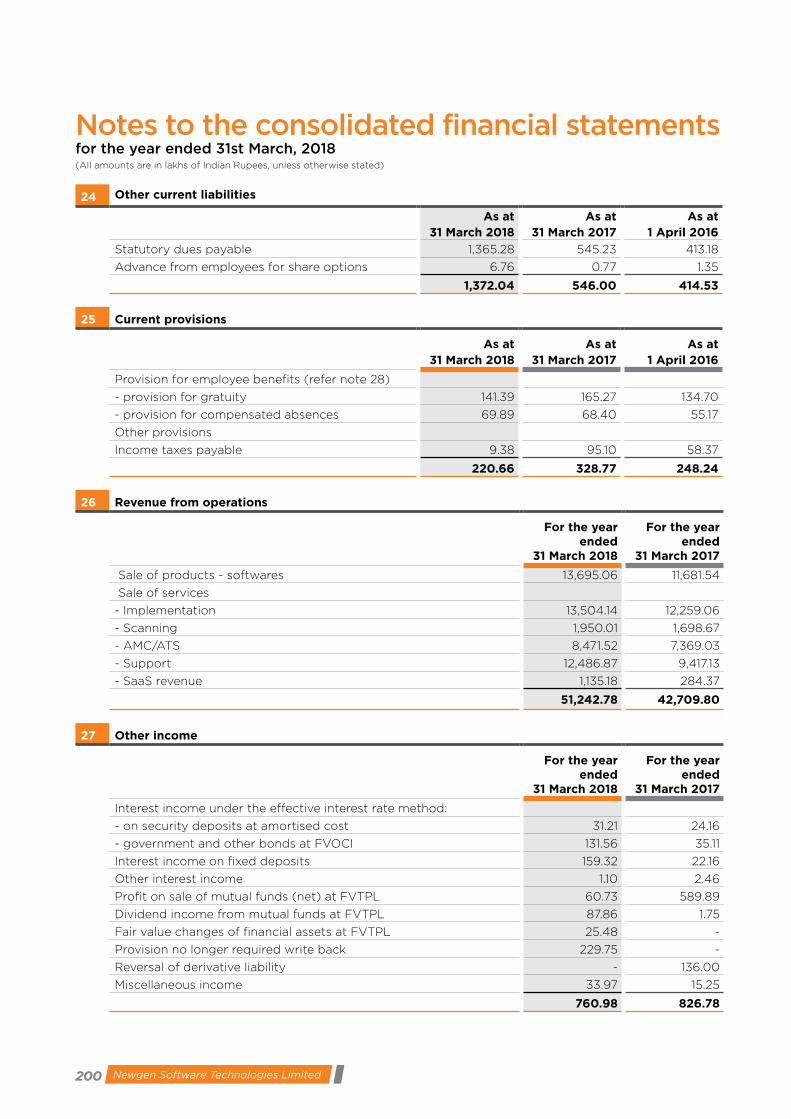
200 Newgen Software Technologies Limited
24 Other current liabilities
As at 31 March 2018
As at 31 March 2017
As at 1 April 2016
Statutory dues payable 1,365.28 545.23 413.18
Advance from employees for share options 6.76 0.77 1.35
1,372.04 546.00 414.53
25 Current provisions
As at 31 March 2018
As at 31 March 2017
As at 1 April 2016
Provision for employee benefits (refer note 28)
- provision for gratuity 141.39 165.27 134.70
- provision for compensated absences 69.89 68.40 55.17
Other provisions
Income taxes payable 9.38 95.10 58.37
220.66 328.77 248.24
26 Revenue from operations
For the year ended
31 March 2018
For the year ended
31 March 2017
Sale of products - softwares 13,695.06 11,681.54
Sale of services
- Implementation 13,504.14 12,259.06
- Scanning 1,950.01 1,698.67
- AMC/ATS 8,471.52 7,369.03
- Support 12,486.87 9,417.13
- SaaS revenue 1,135.18 284.37
51,242.78 42,709.80
27 Other income
For the year ended
31 March 2018
For the year ended
31 March 2017
Interest income under the effective interest rate method:
- on security deposits at amortised cost 31.21 24.16
- government and other bonds at FVOCI 131.56 35.11
Interest income on fixed deposits 159.32 22.16
Other interest income 1.10 2.46
Profit on sale of mutual funds (net) at FVTPL 60.73 589.89
Dividend income from mutual funds at FVTPL 87.86 1.75
Fair value changes of financial assets at FVTPL 25.48 -
Provision no longer required write back 229.75 -
Reversal of derivative liability - 136.00
Miscellaneous income 33.97 15.25
760.98 826.78
Notes to the consolidated financial statementsfor the year ended 31st March, 2018(All amounts are in lakhs of Indian Rupees, unless otherwise stated)

201ANNUAL REPORT 2017-18
CORPORATE REVIEW FINANCIAL STATEMENTSSTATUTORY REPORTS
28 Employee benefits expense
For the year ended
31 March 2018
For the year ended
31 March 2017 Salaries, wages and bonus 23,026.60 19274.47Contribution to provident and other funds (refer note i below) 672.31 759.04Expenses related to compensated absences (refer note ii below) 244.17 228.20Share based payment - equity settled 225.72 127.12Expense related to post employment defined benefit plan (refer note iii below)
272.39 242.81
Staff welfare expenses 446.59 373.00 24,887.78 21,004.64
(i) Defined contribution plans:
The Group makes contributions, determined as a specified percentage of the employee salaries in respect of qualifying employees towards provident fund, which is a defined contribution plan. The amount recognised as an expense towards contribution to provident fund for the year aggregated to INR 672.31 lakhs (31 March 2017: INR 609.44 lakhs).
(ii) Compensated absences:
The Principal assumptions used in determining the compensated absences benefit obligation are as given below:
31 March 2018 31 March 2017 1 April 2016
Discounting rate (p.a.) 7.80% 7.35% 7.95%
Future salary increase ( p.a.) 7.00% 7.00% 7.00%
(iii) Defined Benefit Plan: Gratuity scheme - This is an unfunded defined benefit plan and it entitles an employee, who has
rendered atleast 5 years of continuous service, to receive one-half month’s salary for each year of completed service at the time of retirement/exit.
i) On normal retirement / early retirement / withdrawal / resignation: As per the provisions of the Payment of Gratuity Act, 1972 with vesting period of 5 years of service.
ii) On death in service: As per the provisions of the Payment of Gratuity Act, 1972 without any vesting period.Gratuity payable to employee in case (i) and (ii), as mentioned above, is computed as per the Payment of Gratuity Act, 1972 except the Company does not have any limit on gratuity amount. The most recent actuarial valuation of plan assets and the present value of the defined benefit obligation for gratuity were carried out as at 31 March 2018. The present value of the defined benefit obligations and the related current service cost and past service cost, were measured using the Projected Unit Credit Method.
A. Movement in net defined benefit (asset) liabilityThe following table shows a reconciliation from the opening balances to the closing balances for net defined benefit (asset) liability and its components
Defined benefit obligation
31 March 2018 31 March 2017 1 April 2016
Expense recognised in profit or loss
Opening balance 1278.47 999.93 679.45
Included in profit or loss:
Current service cost 178.42 163.31 138.60
Past service cost
Interest cost (income) 93.97 79.49 54.36
1,550.86 1,242.73 872.41
Remeasurements recognised directly in other comprehensive income
Notes to the consolidated financial statementsfor the year ended 31st March, 2018(All amounts are in lakhs of Indian Rupees, unless otherwise stated)

202 Newgen Software Technologies Limited
Defined benefit obligation
31 March 2018 31 March 2017 1 April 2016
Remeasurement loss (gain) arising from:
Demographic assumptions (6.31) - 64.56
Financial assumptions (44.89) 51.64 104.00
Experience adjustment (29.64) 31.24 (0.61)
(80.84) 82.88 167.95 OtherContributions paid by the employer
Benefits paid (62.57) (47.15) (40.43)
Closing balance 1,407.44 1,278.47 999.93
Total 1,407.44 1,278.47 999.93 B. Defined benefit obligationsi. Actuarial assumptionsThe following were the principal actuarial assumptions at the reporting date (expressed as weighted averages).Discount rate 7.80 7.35 7.95
Salary escalation rate 7.00 7.00 7.00
Mortality rate 100% of IALM (2006 - 08)
"100% of IALM (2006 - 08)"
100% of IALM (2006 - 08)
ii. Sensitivity analysis
Reasonably possible changes at the reporting date to one of the relevant actuarial assumptions, holding other assumptions constant, would have affected the defined benefit obligation by the amounts shown below.
31 March 2018 31 March 2017
Increase Decrease Increase Decrease
Discount rate (0.50% movement) (63.05) 68.33 43.70 46.77
Future salary growth (0.50% movement)
68.53 (63.79) 46.70 44.04
Attrition rate (0.50% movement)
Sensitivities due to mortality & withdrawals are not material & hence impact of change not calculated. Sensitivities as to rate of inflation, rate of increase of pensions in payment, rate of increase of pensions before retirement & life expectancy are not applicable being a lump sum benefit on retirement.
Although the analysis does not take account of the full distribution of cash flows expected under the plan, it does provide an approximation of the sensitivity of the assumptions shown.
Based on the actuarial valuation obtained in this respect, the following table sets out the status of the gratuity plan and the amounts recognised in the Comapany’s financial statements as at balance sheet date:
31 March 2018 31 March 2017 1 April 2016
Net defined benefit asset - -
Total employee benefit asset - - -
Net defined benefit liability
Liability for Gratuity 1407.46 1,278.47 999.93
Liability for Compensated absences 457.19 398.17 311.52
Total employee benefit liabilities 1,864.65 1,676.64 1,311.45 Non-current:Gratuity 1,266.07 1,113.20 865.23
Compensated absences 387.30 329.77 256.35
Current:
Gratuity 141.39 165.27 134.70
Compensated absences 69.89 68.40 55.17
Notes to the consolidated financial statementsfor the year ended 31st March, 2018(All amounts are in lakhs of Indian Rupees, unless otherwise stated)
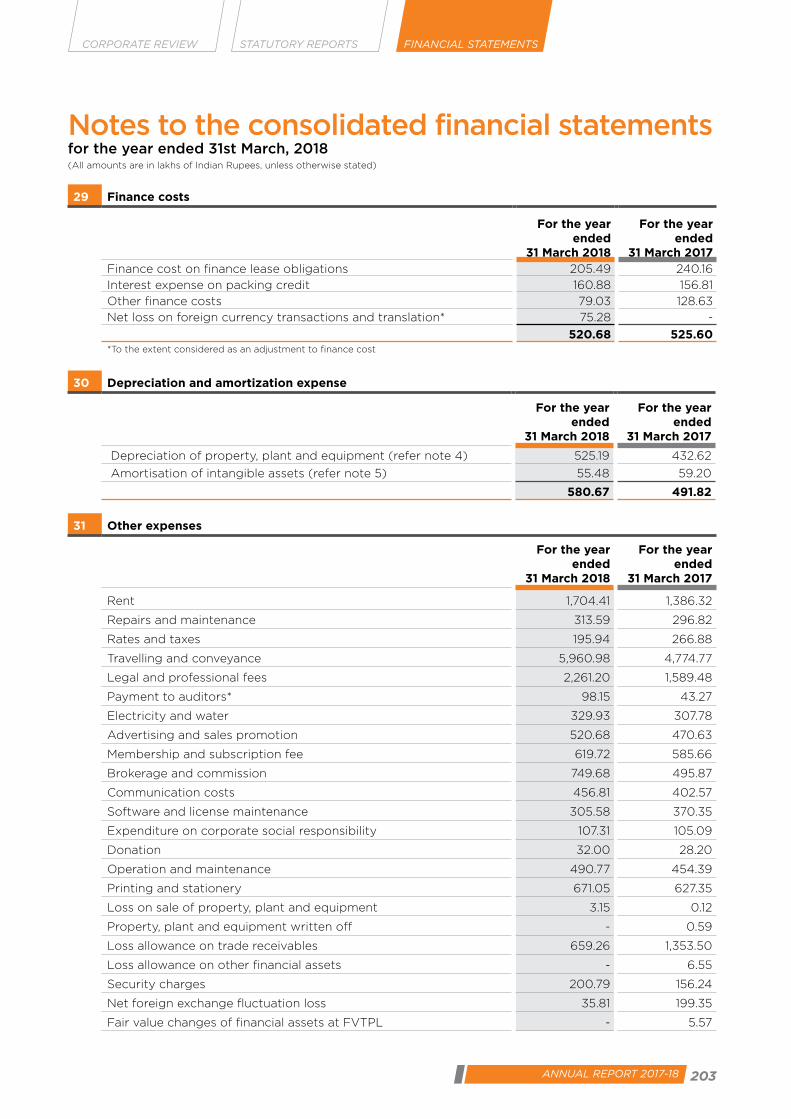
203ANNUAL REPORT 2017-18
CORPORATE REVIEW FINANCIAL STATEMENTSSTATUTORY REPORTS
29 Finance costs
For the year ended
31 March 2018
For the year ended
31 March 2017 Finance cost on finance lease obligations 205.49 240.16
Interest expense on packing credit 160.88 156.81
Other finance costs 79.03 128.63
Net loss on foreign currency transactions and translation* 75.28 -
520.68 525.60 *To the extent considered as an adjustment to finance cost
30 Depreciation and amortization expense
For the year ended
31 March 2018
For the year ended
31 March 2017
Depreciation of property, plant and equipment (refer note 4) 525.19 432.62
Amortisation of intangible assets (refer note 5) 55.48 59.20
580.67 491.82
31 Other expenses
For the year ended
31 March 2018
For the year ended
31 March 2017
Rent 1,704.41 1,386.32
Repairs and maintenance 313.59 296.82
Rates and taxes 195.94 266.88
Travelling and conveyance 5,960.98 4,774.77
Legal and professional fees 2,261.20 1,589.48
Payment to auditors* 98.15 43.27
Electricity and water 329.93 307.78
Advertising and sales promotion 520.68 470.63
Membership and subscription fee 619.72 585.66
Brokerage and commission 749.68 495.87
Communication costs 456.81 402.57
Software and license maintenance 305.58 370.35
Expenditure on corporate social responsibility 107.31 105.09
Donation 32.00 28.20
Operation and maintenance 490.77 454.39
Printing and stationery 671.05 627.35
Loss on sale of property, plant and equipment 3.15 0.12
Property, plant and equipment written off - 0.59
Loss allowance on trade receivables 659.26 1,353.50
Loss allowance on other financial assets - 6.55
Security charges 200.79 156.24
Net foreign exchange fluctuation loss 35.81 199.35
Fair value changes of financial assets at FVTPL - 5.57
Notes to the consolidated financial statementsfor the year ended 31st March, 2018(All amounts are in lakhs of Indian Rupees, unless otherwise stated)

204 Newgen Software Technologies Limited
For the year ended
31 March 2018
For the year ended
31 March 2017
Miscellaneous expenses 884.57 755.14
16,601.38 14,682.49
*Payment to Auditors#
As auditor:
- Statutory audit fee 40.00 34.00
- Limited review fee 7.50 -
- Others 11.43 -
- Reimbursement of expenses 2.25 1.00
61.18 35.00 #Excludes fee paid to statutory auditor amounting to INR 82.67 Lakhs for IPO related services
32 Income Tax
For the year ended
31 March 2018
For the year ended
31 March 2017
A. The major components of income tax (expense) / income are
Recognised in profit or loss
Tax expense 1,630.40 1,641.82
MAT credit entitlement (86.97) -
Tax expense for earlier years 64.50 126.63
Deferred tax (credit) 516.64 (69.43)
Total 2,124.57 1,699.02
Recognised in Other comprehensive income
Tax impact on
- Re-measurement on defined benefit plan (43.73) 28.31
- Fair value of Debt instruments through other comprehensive income 0.16 (9.20)
Total (43.57) 19.11
B. Reconciliation of effective tax rate31 March 2018 31 March 2017
Profit before tax 9,413.25 6,832.03
Tax using the Company's tax rate 34.61% 3,257.74 34.61% 2,364.43
Impact of different rate in each
jurisdiction
-1.20% (112.66) -0.16% (10.76)
Effect of deduction under section
10A of the Income tax Act, 1961
-11.18% (1,052.22) -12.74% (870.20)
Effect of expenses permanently
disallowed under the Income Tax
Act, 1961
0.18% 16.89 2.52% 172.45
Effect of income exempt/ taxed
on lower rate
-0.56% (53.04) -1.34% (91.41)
Others 0.04% 3.36 0.12% 7.88
Notes to the consolidated financial statementsfor the year ended 31st March, 2018(All amounts are in lakhs of Indian Rupees, unless otherwise stated)
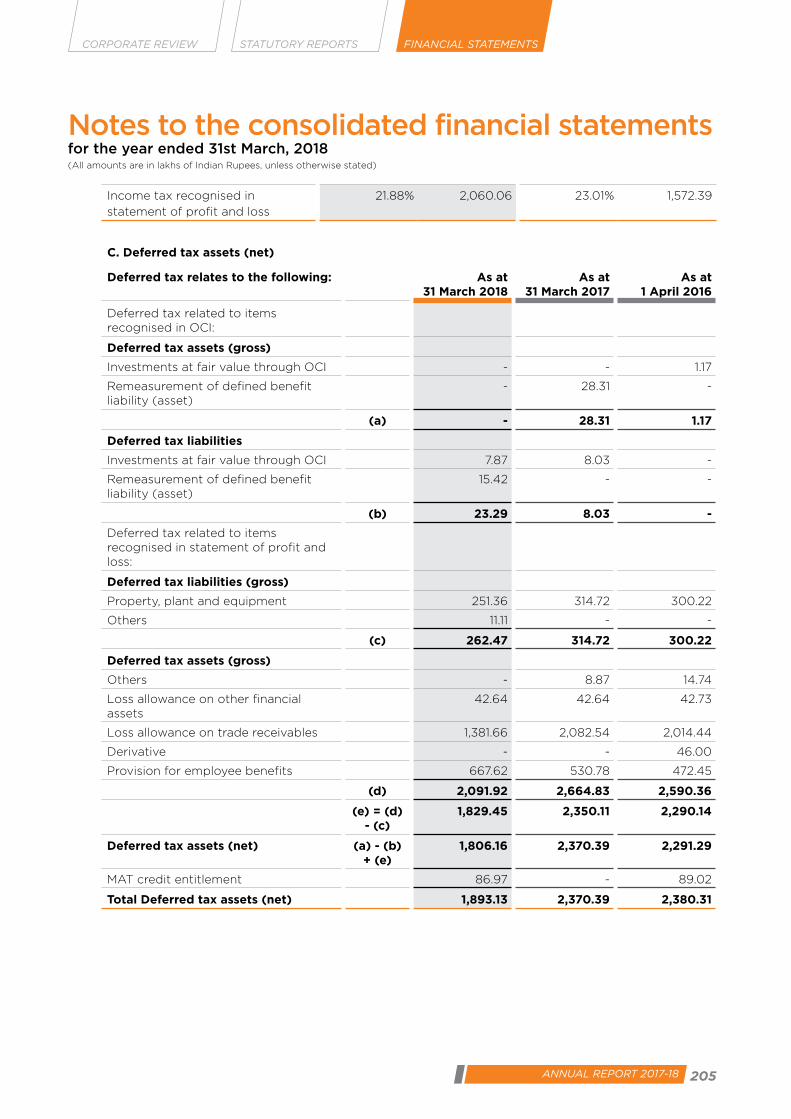
205ANNUAL REPORT 2017-18
CORPORATE REVIEW FINANCIAL STATEMENTSSTATUTORY REPORTS
Income tax recognised in
statement of profit and loss
21.88% 2,060.06 23.01% 1,572.39
C. Deferred tax assets (net)
Deferred tax relates to the following: As at 31 March 2018
As at 31 March 2017
As at 1 April 2016
Deferred tax related to items recognised in OCI:
Deferred tax assets (gross)
Investments at fair value through OCI - - 1.17
Remeasurement of defined benefit liability (asset)
- 28.31 -
(a) - 28.31 1.17
Deferred tax liabilities
Investments at fair value through OCI 7.87 8.03 -
Remeasurement of defined benefit liability (asset)
15.42 - -
(b) 23.29 8.03 -
Deferred tax related to items recognised in statement of profit and loss:
Deferred tax liabilities (gross)
Property, plant and equipment 251.36 314.72 300.22
Others 11.11 - -
(c) 262.47 314.72 300.22
Deferred tax assets (gross)
Others - 8.87 14.74
Loss allowance on other financial assets
42.64 42.64 42.73
Loss allowance on trade receivables 1,381.66 2,082.54 2,014.44
Derivative - - 46.00
Provision for employee benefits 667.62 530.78 472.45
(d) 2,091.92 2,664.83 2,590.36
(e) = (d) - (c)
1,829.45 2,350.11 2,290.14
Deferred tax assets (net) (a) - (b) + (e)
1,806.16 2,370.39 2,291.29
MAT credit entitlement 86.97 - 89.02
Total Deferred tax assets (net) 1,893.13 2,370.39 2,380.31
Notes to the consolidated financial statementsfor the year ended 31st March, 2018(All amounts are in lakhs of Indian Rupees, unless otherwise stated)

206 Newgen Software Technologies Limited
D. Deferred tax liability (net)
Deferred tax relates to the following: As at 31 March 2018
As at 31 March 2017
As at 1 April 2016
Deferred tax liabilities (gross)
Property, plant and equipment 11.28 15.19 24.64
Total Deferred tax liability (net) 11.28 15.19 24.64
E. Movement in temporary differences
31 March 2018
Particulars Balance as at 1 April 2017
Recognised in profit or
loss during FY 2017-18
Recognised in OCI during FY 2017-18
Balance as at 31 March 2018
Deferred tax liabilities (net)
Property, plant and equipment (15.19) 3.91 - (11.28)
Total (15.19) 3.91 - (11.28)
Deferred tax assets (net)
Investments at fair value through OCI
(8.03) - 0.16 (7.87)
Remeasurement of defined benefit liability (asset)
28.31 - (43.73) (15.42)
Property, plant and equipment (314.72) 63.36 - (251.36)
Loss allowance on other financial assets
42.64 - - 42.64
Loss allowance on trade receivables
2,082.54 (700.87) - 1,381.66
Provision for employee benefits 530.78 136.84 - 667.62
Others 8.87 (19.88) - (11.11)
Total 2,340.01 (512.72) (43.57) 1,783.60
31 March 2017
Particulars Balance as at 1 April 2016
Recognised in profit or
loss during FY 2016-17
Recognised in OCI during FY 2016-17
Balance as at 31 March 2017
Deferred tax liabilities (net)
Property, plant and equipment (24.64) 9.45 - (15.19)
Total (24.64) 9.45 - (15.19)
Deferred tax assets (net)
Investments at fair value through OCI
1.17 - (9.20) (8.03)
Remeasurement of defined benefit liability (asset)
- - 28.31 28.31
Property, plant and equipment (300.22) (14.50) - (314.72)
Derivative liability 46.00 (46.00) - -
Notes to the consolidated financial statementsfor the year ended 31st March, 2018(All amounts are in lakhs of Indian Rupees, unless otherwise stated)
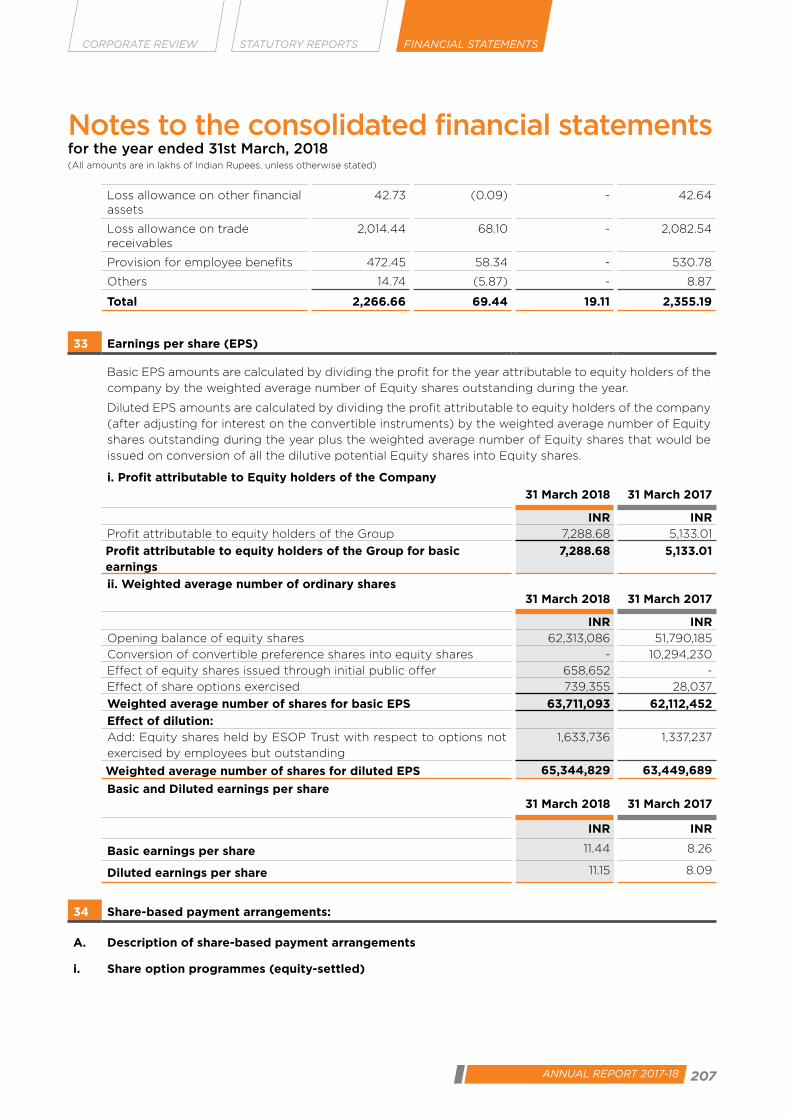
207ANNUAL REPORT 2017-18
CORPORATE REVIEW FINANCIAL STATEMENTSSTATUTORY REPORTS
Loss allowance on other financial assets
42.73 (0.09) - 42.64
Loss allowance on trade receivables
2,014.44 68.10 - 2,082.54
Provision for employee benefits 472.45 58.34 - 530.78
Others 14.74 (5.87) - 8.87
Total 2,266.66 69.44 19.11 2,355.19
33 Earnings per share (EPS)
Basic EPS amounts are calculated by dividing the profit for the year attributable to equity holders of the
company by the weighted average number of Equity shares outstanding during the year.
Diluted EPS amounts are calculated by dividing the profit attributable to equity holders of the company
(after adjusting for interest on the convertible instruments) by the weighted average number of Equity
shares outstanding during the year plus the weighted average number of Equity shares that would be
issued on conversion of all the dilutive potential Equity shares into Equity shares.
i. Profit attributable to Equity holders of the Company
31 March 2018 31 March 2017
INR INRProfit attributable to equity holders of the Group 7,288.68 5,133.01
Profit attributable to equity holders of the Group for basic earnings
7,288.68 5,133.01
ii. Weighted average number of ordinary shares31 March 2018 31 March 2017
INR INROpening balance of equity shares 62,313,086 51,790,185
Conversion of convertible preference shares into equity shares - 10,294,230
Effect of equity shares issued through initial public offer 658,652 -
Effect of share options exercised 739,355 28,037
Weighted average number of shares for basic EPS 63,711,093 62,112,452
Effect of dilution:Add: Equity shares held by ESOP Trust with respect to options not
exercised by employees but outstanding
1,633,736 1,337,237
Weighted average number of shares for diluted EPS 65,344,829 63,449,689
Basic and Diluted earnings per share31 March 2018 31 March 2017
INR INR
Basic earnings per share 11.44 8.26
Diluted earnings per share 11.15 8.09
34 Share-based payment arrangements:
A. Description of share-based payment arrangements
i. Share option programmes (equity-settled)
Notes to the consolidated financial statementsfor the year ended 31st March, 2018(All amounts are in lakhs of Indian Rupees, unless otherwise stated)
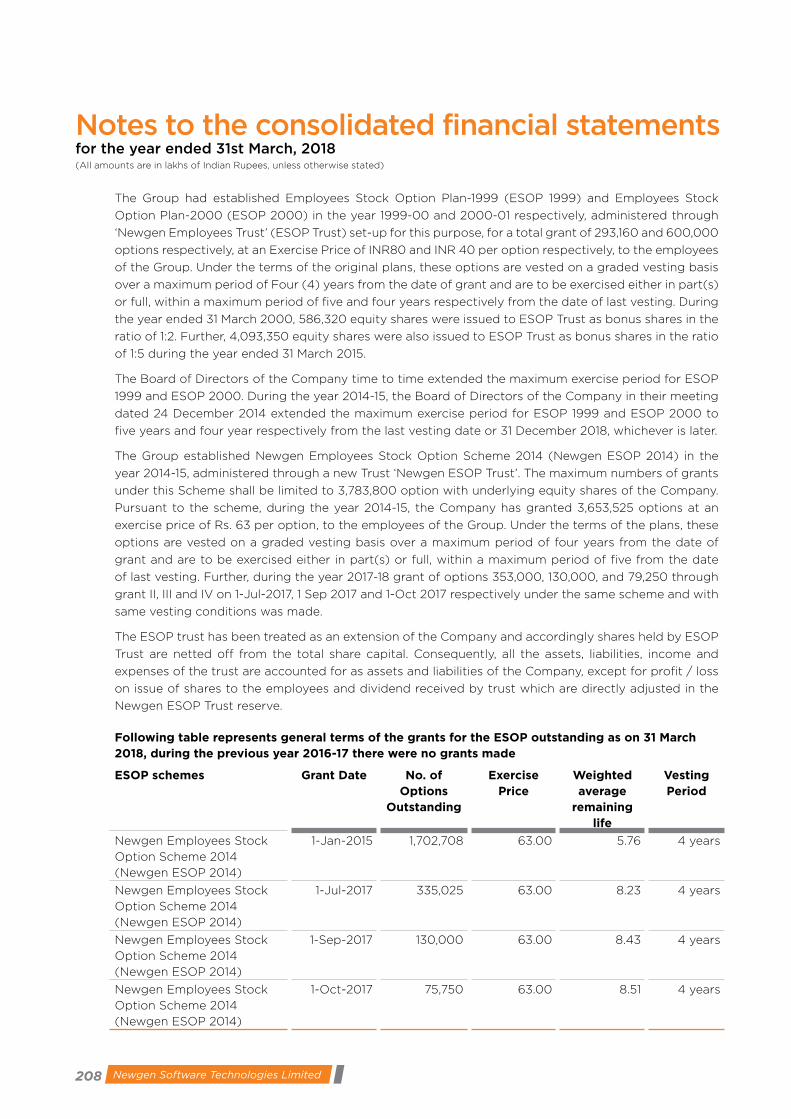
208 Newgen Software Technologies Limited
The Group had established Employees Stock Option Plan-1999 (ESOP 1999) and Employees Stock
Option Plan-2000 (ESOP 2000) in the year 1999-00 and 2000-01 respectively, administered through
‘Newgen Employees Trust’ (ESOP Trust) set-up for this purpose, for a total grant of 293,160 and 600,000
options respectively, at an Exercise Price of INR80 and INR 40 per option respectively, to the employees
of the Group. Under the terms of the original plans, these options are vested on a graded vesting basis
over a maximum period of Four (4) years from the date of grant and are to be exercised either in part(s)
or full, within a maximum period of five and four years respectively from the date of last vesting. During
the year ended 31 March 2000, 586,320 equity shares were issued to ESOP Trust as bonus shares in the
ratio of 1:2. Further, 4,093,350 equity shares were also issued to ESOP Trust as bonus shares in the ratio
of 1:5 during the year ended 31 March 2015.
The Board of Directors of the Company time to time extended the maximum exercise period for ESOP
1999 and ESOP 2000. During the year 2014-15, the Board of Directors of the Company in their meeting
dated 24 December 2014 extended the maximum exercise period for ESOP 1999 and ESOP 2000 to
five years and four year respectively from the last vesting date or 31 December 2018, whichever is later.
The Group established Newgen Employees Stock Option Scheme 2014 (Newgen ESOP 2014) in the
year 2014-15, administered through a new Trust ‘Newgen ESOP Trust’. The maximum numbers of grants
under this Scheme shall be limited to 3,783,800 option with underlying equity shares of the Company.
Pursuant to the scheme, during the year 2014-15, the Company has granted 3,653,525 options at an
exercise price of Rs. 63 per option, to the employees of the Group. Under the terms of the plans, these
options are vested on a graded vesting basis over a maximum period of four years from the date of
grant and are to be exercised either in part(s) or full, within a maximum period of five from the date
of last vesting. Further, during the year 2017-18 grant of options 353,000, 130,000, and 79,250 through
grant II, III and IV on 1-Jul-2017, 1 Sep 2017 and 1-Oct 2017 respectively under the same scheme and with
same vesting conditions was made.
The ESOP trust has been treated as an extension of the Company and accordingly shares held by ESOP
Trust are netted off from the total share capital. Consequently, all the assets, liabilities, income and
expenses of the trust are accounted for as assets and liabilities of the Company, except for profit / loss
on issue of shares to the employees and dividend received by trust which are directly adjusted in the
Newgen ESOP Trust reserve.
Following table represents general terms of the grants for the ESOP outstanding as on 31 March 2018, during the previous year 2016-17 there were no grants made
ESOP schemes Grant Date No. of Options
Outstanding
Exercise Price
Weighted average
remaining life
Vesting Period
Newgen Employees Stock
Option Scheme 2014
(Newgen ESOP 2014)
1-Jan-2015 1,702,708 63.00 5.76 4 years
Newgen Employees Stock
Option Scheme 2014
(Newgen ESOP 2014)
1-Jul-2017 335,025 63.00 8.23 4 years
Newgen Employees Stock
Option Scheme 2014
(Newgen ESOP 2014)
1-Sep-2017 130,000 63.00 8.43 4 years
Newgen Employees Stock
Option Scheme 2014
(Newgen ESOP 2014)
1-Oct-2017 75,750 63.00 8.51 4 years
Notes to the consolidated financial statementsfor the year ended 31st March, 2018(All amounts are in lakhs of Indian Rupees, unless otherwise stated)
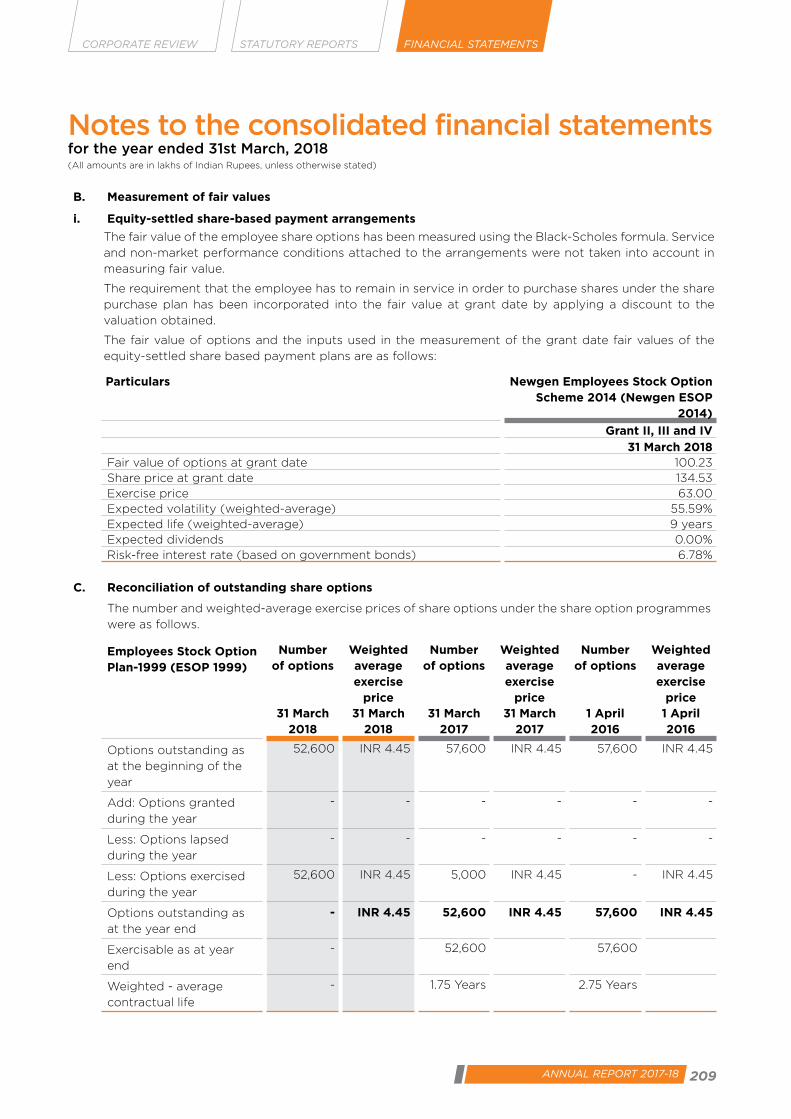
209ANNUAL REPORT 2017-18
CORPORATE REVIEW FINANCIAL STATEMENTSSTATUTORY REPORTS
B. Measurement of fair values
i. Equity-settled share-based payment arrangements
The fair value of the employee share options has been measured using the Black-Scholes formula. Service
and non-market performance conditions attached to the arrangements were not taken into account in
measuring fair value.
The requirement that the employee has to remain in service in order to purchase shares under the share
purchase plan has been incorporated into the fair value at grant date by applying a discount to the
valuation obtained.
The fair value of options and the inputs used in the measurement of the grant date fair values of the
equity-settled share based payment plans are as follows:
Particulars Newgen Employees Stock Option Scheme 2014 (Newgen ESOP
2014)
Grant II, III and IV31 March 2018
Fair value of options at grant date 100.23 Share price at grant date 134.53 Exercise price 63.00 Expected volatility (weighted-average) 55.59%Expected life (weighted-average) 9 yearsExpected dividends 0.00%Risk-free interest rate (based on government bonds) 6.78%
C. Reconciliation of outstanding share options
The number and weighted-average exercise prices of share options under the share option programmes
were as follows.
Employees Stock Option Plan-1999 (ESOP 1999)
Number of options
Weighted average exercise
price
Number of options
Weighted average exercise
price
Number of options
Weighted average exercise
price31 March
201831 March
201831 March
201731 March
20171 April 2016
1 April 2016
Options outstanding as
at the beginning of the
year
52,600 INR 4.45 57,600 INR 4.45 57,600 INR 4.45
Add: Options granted
during the year
- - - - - -
Less: Options lapsed
during the year
- - - - - -
Less: Options exercised
during the year
52,600 INR 4.45 5,000 INR 4.45 - INR 4.45
Options outstanding as
at the year end
- INR 4.45 52,600 INR 4.45 57,600 INR 4.45
Exercisable as at year
end
- 52,600 57,600
Weighted - average
contractual life
- 1.75 Years 2.75 Years
Notes to the consolidated financial statementsfor the year ended 31st March, 2018(All amounts are in lakhs of Indian Rupees, unless otherwise stated)

210 Newgen Software Technologies Limited
Employees Stock Option Plan-2000 (ESOP 2000)
Number of options
Weighted average exercise
price
Number of options
Weighted average exercise
price
Number of options
Weighted average exercise
price31 March
201831 March
201831 March
201731 March
20171 April 2016
1 April 2016
Options outstanding as
at the beginning of the
year
386,700 INR 6.67 483,800 INR 6.67 678,180 INR 6.67
Add: Options granted
during the year
- - - - - -
Less: Options lapsed
during the year
- - 30,000 INR 6.67 9,600 INR 6.67
Less: Options exercised
during the year
386,700 INR 6.67 67,100 INR 6.67 184,780 INR 6.67
Options outstanding as
at the year end
- INR 6.67 386,700 INR 6.67 483,800 INR 6.67
Exercisable as at year
end
- 386,700 483,800
Weighted - average
contractual life
- 2.09 years 3.11 years
Newgen Employees Stock Option Scheme 2014 (Newgen ESOP 2014)
Number of options
Weighted average exercise
price
Number of options
Weighted average exercise
price
Number of options
Weighted average exercise
price31 March
201831 March
201831 March
201731 March
20171 April 2016
1 April 2016
Options outstanding as
at the beginning of the
year
3,061,209 INR 63.00 3,384,305 INR 63.00 3,653,525 INR 63.00
Add: Options granted
during the year
562,550 INR 63.00 - - - -
Less: Options lapsed
during the year
126,096 INR 63.00 166,525 INR 63.00 213,175 INR 63.00
Less: Options exercised
during the year
1,254,180 INR 63.00 156,571 INR 63.00 56,045 INR 63.00
Options outstanding as
at the year end
2,243,483 INR 63.00 3,061,209 INR 63.00 3,384,305 INR 63.00
Exercisable as at year
end
445,616 777,170 288,188
Weighted - average
contractual life
6.38 years 6.76 years 7.76 years
C. Expense recognised in statement of profit and loss For details on the employee benefits expense, refer note 28
Notes to the consolidated financial statementsfor the year ended 31st March, 2018(All amounts are in lakhs of Indian Rupees, unless otherwise stated)

211ANNUAL REPORT 2017-18
CORPORATE REVIEW FINANCIAL STATEMENTSSTATUTORY REPORTS
35 Operating leases
A. Leases as lessee
a) The Group has taken various cancellable and non-cancellable leases for office premises and residential
accommodation for some of its employees. The amount recognised in profit and loss and future minimum
lease payments and payment profile of non-cancellable operating leases are as under:
i. Future minimum lease payments
At 31 March 2018, the future minimum lease payments under non-cancellable leases were receivable as
follows.
31 March 2018 31 March 2017 1 April 2016
Less than one year 1,334.90 1,024.35 934.97
Between one and five years 2,152.94 2,113.83 2,236.27
More than five years - - -
3,487.84 3,138.18 3,171.24
ii. Amounts recognised in profit or loss
31 March 2018 31 March 2017
Lease expense 1,704.41 1,386.32
1,704.41 1,386.32
36 Contingent liabilities and commitments (to the extent not provided for)
31 March 2018 31 March 2017 1 April 2016
a. Estimated amount of contracts remaining to be
executed on capital account and not provided for
net of advances, tangible assets
759.70 1,733.00 574.98
1. For other commitments – Non-cancellable operating, and finance leases, refer Note 35 and 17
respectively
37 Details of dues to Micro, Small and Medium Enterprises as defined under the MSMED Act, 2006
The Ministry of Micro, Small and Medium Enterprises has issued an Office Memorandum dated 26 August
2008 which recommends that the Micro and Small Enterprises should mention in their correspondence
with its customers the Entrepreneurs Memorandum Number as allocated after filing of the Memorandum.
Accordingly, the disclosure in respect of the amounts payable to such enterprises as on 28 February
2018 and 31 March 2017 has been made in the financial statements based on information received and
available with the Company. Based on the information currently available with the Company, there are
no dues payable to Micro and Small Suppliers as defined in the Micro, Small and Medium Enterprises
Development Act, 2006.
38 After the reporting date the following dividend were proposed by the Board of Directors, subject to
the approval of shareholders at Annual General Meeting; Accordingly, the dividends have not been
recognised as liabilities. Dividends would attract corporate dividend tax when declared.
Particulars For the year ended
31 March 2018
For the year ended
31 March 2017
Final dividend of INR 2.00 per share (31 March 2017: INR 1.5/-) 1,384.71 964.62
Corporate dividend tax 283.94 196.37
Notes to the consolidated financial statementsfor the year ended 31st March, 2018(All amounts are in lakhs of Indian Rupees, unless otherwise stated)

212 Newgen Software Technologies Limited
39 Utilization of CSR expenses
As per Section 135 of the Companies Act 2013, the following is the detail of Corporate social responsibility
expenses incurred by the Company: Gross amount to be spent by the Company during the year ended
31 March 2018 is INR 106.13 lakhs (previous year INR. 97.05 lakhs). Amount spent during the year ended
31 March 2018:
Particulars Paid Liability yet to be paid
Total
i) For purpose mentioned as under 104.31 3.00 107.31
The areas for CSR activities are promoting education, health care, sanitation, digital literacy and
livelihood enhancement and participation on SOS Children’s Village Projects in Faridabad. The funds
were primarily utilized through the year on the following activities which are specified in Schedule VII of
the Companies Act, 2013.
40 The Group has established a comprehensive system of maintenance of information and documents as
required by the transfer pricing legislation under sections 92-92F of the Income-tax Act, 1961. Since the
law requires existence of such information and documentation to be contemporaneous in nature, the
Company has got the updated documentation for the international transactions entered into with the
associated enterprises during the financial year. Accordingly, the management believes that there has
been no change in the nature of its international transactions with the associated enterprises during
the year ended 31 March 2018 and 31 March 2017. Further, the management is of the opinion that its
international transactions are at arm’s length so that the aforesaid legislation will not have any impact
on the financial statements, particularly on the amount of tax expense and that of provision for taxation.
41 During the year ended 31 March 2018, the Company completed the initial public offer (IPO), pursuant to
which 17,331,483 equity shares of INR 10 each were allotted/allocated, at an issue price of INR 245 each,
consisting of fresh issue of 3,877,551 equity shares and an offer for sale of 13,453,932 equity shares by
selling shareholders. The equity shares of the Company were listed on National Stock Exchange of India
Limited (NSE) via ID NEWGEN and BSE Limited (BSE) via ID 540900 on 29 January 2018.
42 Expenses incurred by the Company aggregating to INR 2,627.44 Lakhs in connection with the IPO
have been partly adjusted towards the securities premium account and partly recovered from the
selling shareholders. The IPO expenses amounting to INR 1,646.71 (excluding certain expenses which are
directly attributable to the Company such as legal counsel cost, auditor fee, listing fee, advertisement &
marketing expenses and depository fees amounting to INR 980.73 Lakhs), have been allocated between
the Company and each of the selling shareholders in proportion to the equity shares allotted to the
public as fresh issue by the Company and under offer for sale by the existing shareholders and the total
amount charged in securities premium is INR 1,349.15 Lakhs.
43 During the year ended 31 March 2018, the Company has completed the Initial Public offer, pursuant to
which 17,331,483 equity shares having a face value of Rs. 10 each were allotted/allocated, at an issue
price of Rs. 245 per equity share, consisting of fresh issue of 3,877,551 equity shares and an offer for sale
of 13,453,932 equity shares by selling shareholders. The gross proceeds of fresh issue of equity shares
from IPO amounts to Rs. 9,500.00 lakhs. The Company’s share of fresh issue related expenses is Rs
1,349.15 lakhs, which has been adjusted against Securities Premium. As at 31 March 2018, the proceeds
are unutilised and have been temporarily invested/ deposited in cash and cash equivalents including
fixed deposits and bank account (Refer note 12).
Notes to the consolidated financial statementsfor the year ended 31st March, 2018(All amounts are in lakhs of Indian Rupees, unless otherwise stated)

213ANNUAL REPORT 2017-18
CORPORATE REVIEW FINANCIAL STATEMENTSSTATUTORY REPORTS
44 Dividend remittances in foreign currency:
Particulars For the year ended
31 March 2018
For the year ended
31 March 2017
Year to which the dividend relates 2016-17 2015-16
Amount remitted during the year (INR in lakhs) 77.21 51.78
Number of non-resident shareholders 2 2
Number of shares on which dividend was due 5,147,340 5,147,340
45 Details of current Investments (refer note 10)
Particulars Number of Units as at Amount in Lakhs as at31 March
201831 March
20171 April 2016
31 March 2018
31 March 2017
1 April 2016
Investment in debt mutual funds
Reliance Short Term Fund- Direct Growth Plan
634,842 - - 213.85 - -
ICICI Prudential Short Term Plan
860,077 - - 322.56 - -
IIFL Dynamic Bond Fund
1,442,783 - - 200.83 - -
Franklin Templeton MF 11,122 - - 425.20 - -
Aditya BSL MF 3,202,906 - - 426.14 - -
ICICI Prudential MF 2,185,596 - - 425.63 - -
UTI Income Opportunities Fund - Direct Plan-Growth
2,617,879 - - 442.00 - -
Kotak Income Opportunities Fund- Monthly Growth
2,194,751 - - 440.56 - -
L&T Income Opportunities Fund Direct Plan-Growth
2,157,674 - - 439.81 - -
Tata Short Term Fund - 1,273,800 - - 401.05 -
Reliance Short Term Fund
- 634,842 - - 200.61 -
UTI Short Term Income Fund
- 1,974,451 - - 401.27 -
ICICI Prudential Short Term Plan
- 860,077 - - 301.29 -
UTI Income Opportunities Fund
- 3,748,856 - - 420.28 -
Kotak Income Opportunities Fund
- 3,948,263 - - 419.36 -
BNP Paribas Medium Term Income Fund
- 4,137,952 - - 413.80 -
Notes to the consolidated financial statementsfor the year ended 31st March, 2018(All amounts are in lakhs of Indian Rupees, unless otherwise stated)

214 Newgen Software Technologies Limited
Particulars Number of Units as at Amount in Lakhs as at31 March
201831 March
20171 April 2016
31 March 2018
31 March 2017
1 April 2016
L&T Income Opportunities Fund Direct Plan
- 3,734,193 - - 419.20 -
IIFL Cash Opportunities Fund
- 1,817,389 - - 206.40 -
HSBC Income Fund - Short Term Plan
- - 784,326 - - 200.42
BNP Paribas Flexi Debt Fund
- - 770,208 - - 200.57
Birla Sun Life Dynamic Bond Fund
- - 1,694,757 - - 450.55
Reliance Regular Savings Fund
- - 970,116 - - 200.33
Kotak Bond Fund- Growth - - 465,943 - - 200.46
UTI Bond Fund -Growth - - 441,319 - - 200.60
IDFC Dynamic Bond Fund
- - 1,366,352 - - 250.88
Investment in arbitrage funds
HDFC Balanced Fund - - 413,056 - - 439.23
Tata Balanced Fund - - 259,035 - - 423.85
DSP BR Balanced Fund - - 413,307 - - 440.03
ICICI Prudential Equity Income Fund
- - 3,417,969 - - 355.13
ICICI Prudential Balanced Advantage Fund
- - 1,374,705 - - 352.47
JPMorgan India Equity Income Fund
- - 3,285,737 - - 356.43
Investment in government bonds
8.40% Indian Railway Finance Corporation Limited
40,000 40,000 40,000 466.42 468.74 445.20
7.35% NHAI 2031 (Int Pyt date 1Apr)
45,000 45,000 492.61 502.36
Investment in Other Bonds
IIFL SUB DEBT 9.25% 20 220.42
IIFL Perpetual Debt Product
200 204.95
11% Bank of India Perpetual Bond
10 10 99.83 104.62
10.40% Vijaya Bank Perpetual Bond (int pyt date 31Mar)
40 40 406.21 402.12
5,022.07 4,866.05 4,516.15
Notes to the consolidated financial statementsfor the year ended 31st March, 2018(All amounts are in lakhs of Indian Rupees, unless otherwise stated)

215ANNUAL REPORT 2017-18
CORPORATE REVIEW FINANCIAL STATEMENTSSTATUTORY REPORTS
46 Related party transactions
A. Transactions with Key Management Personnel
A number of key management personnel, or their related parties hold positions in other entities that result in them having control or significant influence over those entities.
Compensation of the Group’s key managerial personnel includes salaries, non-cash benefits and contributions to post - employment defined benefit plan(see note 27)
Executive officers also participate in the Group’s share option plan as per the conditions laid down in that scheme (see note 28 and note 34).
List of key management personnel and their relativesDiwakar Nigam - Managing DirectorT.S. Varadarajan - Whole Time DirectorPriyadarshini Nigam - Whole Time DirectorArun Kumar Gupta - Chief Financial OfficerVirender Jeet - Senior Vice President (Sales and Marketing/Product)Surender Jeet Raj - Senior Vice President (HR/Operations)Tarun Nandwani - Vice President (Customer Relations/Delivery)Usha Varadarajan - Relative of Whole Time Director - T.S. VaradarajanShubhi Nigam - Relative of Managing Director
Key management personnel compensation
Transaction value Balance payableFor the year
ended 31 March 2018
For the year ended 31
March 2017
31 March 2018
31 March 2017
1 April 2016
Salaries, wages and bonus*
885.28 565.74 42.50 11.38 11.59
Diwakar Nigam 160.35 85.37 8.24 5.02 6.07 T.S. Varadarajan 76.32 42.33 4.53 2.37 2.82 Priyadarshini Nigam 39.28 30.64 2.79 1.79 2.16 Arun Kumar Gupta 75.88 53.46 26.93 2.20 0.54 Virender Jeet 150.19 91.01 82.59 4.39 2.78 Surender Jeet Raj 134.22 85.84 70.59 4.14 3.09 Tarun Nandwani 121.41 74.59 65.72 3.73 0.07 Shubhi Nigam 59.38 12.47 - - - Sonali Nigam 68.26 90.02 - - -
Dividend paid (excluding dividend distribution tax)
699.32 465.92 - - -
Diwakar Nigam 276.34 184.22 - - - T.S. Varadarajan 225.14 150.09 - - - Priyadarshini Nigam 119.53 79.69 - - - Arun Kumar Gupta 0.66 0.37 - - - Virender Jeet 3.24 2.16 - - - Surender Jeet Raj 3.16 2.00 - - - Tarun Nandwani 3.33 2.11 - - - Usha Varadarajan 67.92 45.28 - - -
Share-based payments 50.46 3.67 - - - Arun Kumar Gupta 7.51 1.43 - - - Virender Jeet 16.33 - - - - Surender Jeet Raj 14.82 - - - - Tarun Nandwani 11.80 2.24 - - - * excludes provision for gratuity and leave encashment, as these are determined on the basis of actuarial valuation for the Group as a whole.
Notes to the consolidated financial statementsfor the year ended 31st March, 2018(All amounts are in lakhs of Indian Rupees, unless otherwise stated)

216 Newgen Software Technologies Limited
47 Financial instruments – Fair values and risk management
i. Accounting classification and fair values
The following table shows the carrying amounts and fair value of financial assets and financial liabilities, including their levels in the fair value hierarchy.
31 March 2018 Note Carrying amount Fair value
FVTPL FVTOCI Amortised Cost
Total Level 1 Level 2 Level 3 Total
Financial assets
Financial assets measured at fair value
Investments in debt mutual funds
10 3,336.58 - - 3,336.58 3,336.58 - - 3,336.58
Investments in bonds 10 - 1,685.49 - 1,685.49 1,685.49 - - 1,685.49
Financial assets not measured at fair value
Other non-current financial asset
7 - - 554.77 554.77 - - - -
Trade receivables 11 - - 22,201.67 22,201.67 - - - -
Cash and cash equivalents 12 - - 14,548.34 14,548.34 - - - -
Loans 6 and 13
- - 612.97 612.97 - - - -
Other financial assets 14 - - 5,177.19 5,177.19 - - - -
3,336.58 1,685.49 43,094.94 48,117.00 5,022.07 - - 5,022.07
Financial liabilities `
Long-term maturities of finance lease obligations (secured)
17 - - 1,316.66 1,316.66 - 1,316.66 - 1,316.66
Short term borrowings 20 - - 4,946.27 4,946.27 - 4,946.27 - 4,946.27
Trade and other payables 21 - - 2,292.10 2,292.10 - - - -
Other financial liabilities 22 - - 3,624.48 3,624.48 - 302.25 - 302.25
- - 12,179.51 12,179.51 - 6,565.18 - 6,565.18
Carrying amount Fair value
31 March 2017 Note FVTPL FVTOCI Amortised Cost
Total Level 1 Level 2 Level 3 Total
Financial assets
Financial assets measured at fair value
Investments in debt mutual funds
10 3,183.25 - - 3,183.25 3,183.25 - - 3,183.25
Investments in bonds 10 - 1,682.79 - 1,682.79 1,682.79 - - 1,682.79
Financial assets not measured at fair value
Other non-current financial asset
7 - - 233.46 233.46 - - - -
Trade receivables 11 - - 19,957.12 19,957.12 - - - -
Cash and cash equivalents 12 - - 3,491.88 3,491.88 - - - -
Loans 6 and 13
- - 299.38 299.38 - - - -
Other financial assets 14 - - 2,541.04 2,541.04 - - - -
3,183.25 1,682.79 26,522.88 31,388.92 4,866.04 - - 4,866.04
Notes to the consolidated financial statementsfor the year ended 31st March, 2018(All amounts are in lakhs of Indian Rupees, unless otherwise stated)

217ANNUAL REPORT 2017-18
CORPORATE REVIEW FINANCIAL STATEMENTSSTATUTORY REPORTS
Carrying amount Fair value
31 March 2017 Note FVTPL FVTOCI Amortised Cost
Total Level 1 Level 2 Level 3 Total
Financial liabilities
Financial liabilities not measured at fair value
-
Long-term maturities of finance lease obligations (secured)
17 - - 1,617.99 1,617.99 - 1,617.99 - 1,617.99
Short term borrowings 20 - - 5,226.18 5,226.18 - 5,226.18 - 5,226.18
Trade and other payables 21 - - 1,804.95 1,804.95 - - - -
Other financial liabilities 22 - - 2,903.21 2,903.21 - 302.25 - 302.25
- - 11,552.33 11,552.33 - 7,146.42 - 7,146.42
Carrying amount Fair value
1 April 2016 FVTPL FVTOCI Amortised Cost
Total Level 1 Level 2 Level 3 Total
Financial assets
Financial assets measured at fair value
Investments in debt mutual funds
10 1,703.81 - - 1,703.81 1,703.81 - - 1,703.81
Investments in arbitrage funds
10 2,367.13 - - 2,367.13 2,367.13 - - 2,367.13
Investments in bonds 10 - 445.20 445.20 445.20 - - 445.20
Financial assets not measured at fair value
Other Non-current financial asset
7 - - 174.36 174.36 -
Trade receivables 11 - - 16,435.80 16,435.80 - - - -
Cash and cash equivalent 12 - - 2,431.78 2,431.78 - - - -
Loans 6 and 13
- - 255.67 255.67 - - - -
Other financial assets 14 - - 2,451.06 2,451.06 - - - -
4,070.94 445.20 21,748.68 26,264.82 4,516.14 - - 4,516.14
Financial liabilities
Financial liabilities measured at fair value
Derivative liability 19 136.00 - - 136.00 - - 136.00 136.00
Financial liabilities
Financial liabilities not measured at fair value
Long-term maturities of finance lease obligations (secured)
17 - - 1,917.45 1,917.45 - 1,917.45 - 1,917.45
Short term borrowings 20 - - 5,883.19 5,883.19 - 5,883.19 - 5,883.19
Trade and other payables 21 - - 1,473.16 1,473.16 - - - -
Other financial liabilities 22 - - 2,058.16 2,058.16 - 315.25 - 315.25
- - 11,331.96 11,331.96 - 8,115.89 - 8,115.89
The fair value of trade receivables, cash and cash equivalents, other bank balances, other current financial
assets, current borrowings, trade payables and other current financial liabilities approximate their carrying
amounts, due to their short-term nature. Fair value of bank deposits included in non-current other financial
assets are equivalent to their carrying amount, as the interest rate on them is equivalent to market rate.
Notes to the consolidated financial statementsfor the year ended 31st March, 2018(All amounts are in lakhs of Indian Rupees, unless otherwise stated)
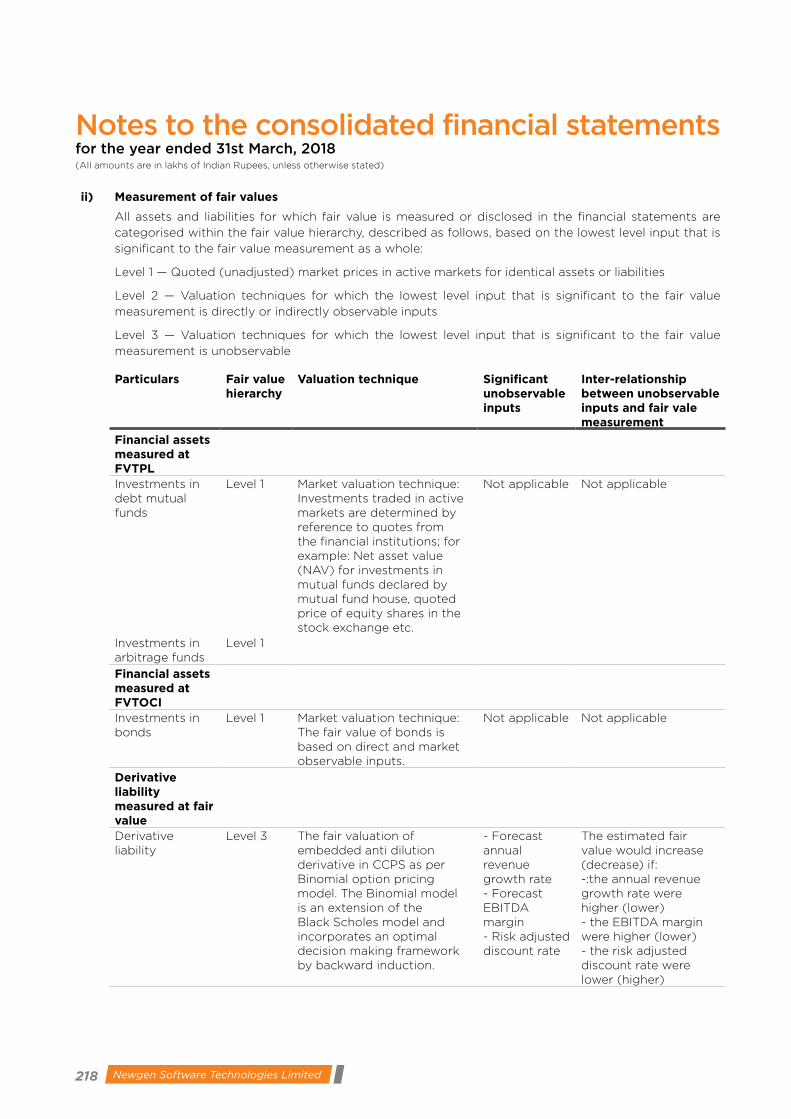
218 Newgen Software Technologies Limited
ii) Measurement of fair values
All assets and liabilities for which fair value is measured or disclosed in the financial statements are
categorised within the fair value hierarchy, described as follows, based on the lowest level input that is
significant to the fair value measurement as a whole:
Level 1 — Quoted (unadjusted) market prices in active markets for identical assets or liabilities
Level 2 — Valuation techniques for which the lowest level input that is significant to the fair value
measurement is directly or indirectly observable inputs
Level 3 — Valuation techniques for which the lowest level input that is significant to the fair value
measurement is unobservable
Particulars Fair value hierarchy
Valuation technique Significant unobservable inputs
Inter-relationship between unobservable inputs and fair vale measurement
Financial assets measured at FVTPLInvestments in debt mutual funds
Level 1 Market valuation technique: Investments traded in active markets are determined by reference to quotes from the financial institutions; for example: Net asset value (NAV) for investments in mutual funds declared by mutual fund house, quoted price of equity shares in the stock exchange etc.
Not applicable Not applicable
Investments in arbitrage funds
Level 1
Financial assets measured at FVTOCIInvestments in bonds
Level 1 Market valuation technique: The fair value of bonds is based on direct and market observable inputs.
Not applicable Not applicable
Derivative liability measured at fair valueDerivative liability
Level 3 The fair valuation of embedded anti dilution derivative in CCPS as per Binomial option pricing model. The Binomial model is an extension of the Black Scholes model and incorporates an optimal decision making framework by backward induction.
- Forecast annual revenue growth rate - Forecast EBITDA margin - Risk adjusted discount rate
The estimated fair value would increase (decrease) if: -:the annual revenue growth rate were higher (lower) - the EBITDA margin were higher (lower) - the risk adjusted discount rate were lower (higher)
Notes to the consolidated financial statementsfor the year ended 31st March, 2018(All amounts are in lakhs of Indian Rupees, unless otherwise stated)

219ANNUAL REPORT 2017-18
CORPORATE REVIEW FINANCIAL STATEMENTSSTATUTORY REPORTS
Particulars Fair value hierarchy
Valuation technique Significant unobservable inputs
Inter-relationship between unobservable inputs and fair vale measurement
Financial liabilities measured at Amortised costLong term borrowings
Level 2 Discounted cash flow: The valuation model considers the present value of expected payment, discounted using a risk adjusted discount rate.
Not applicable Not applicable
Short term borrowings
Level 2
There have been no valuation under Level 2. Further, there have been no transfers in either direction for the years ended 31 March 2018, 31 March 2017 & 31 March 2016.
The Group’s policy is to recognise transfers into and transfers out of fair value hierarchy levels as at the end of the reporting period.
C. Financial risk management
The Company’s activities expose it to a variety of financial risks: market risk (including foreign exchange
risk and interest rate risk), credit risk and liquidity risk.
i. Risk management framework
The Company’s board of directors has framed a Risk Management Policy and plan for enabling the
company to identify elements of risk as contemplated by the provisions of the Section 134 of the
Companies Act 2013. The Company’s risk management policies are established to identify and analyse
the risks faced by the Group, to set appropriate risk limits and controls and to monitor risks and adherence
to limits. Risk management policies and systems are reviewed regularly to reflect changes in market
conditions and the Group’s activities. The Group, through its training and management standards and
`procedures, aims to maintain a disciplined and constructive control environment in which all employees
understand their roles and obligations.
The Company’s audit committee oversees how management monitors compliance with the Company’s
risk management policies and procedures, and reviews the adequacy of the risk management framework
in relation to the risks faced by the Group. The audit committee is assisted in its oversight role by internal
audit. Internal audit undertakes both regular and ad hoc reviews of risk management controls and
procedures, the results of which are reported to the audit committee.
ii. Credit risk
Credit risk is the risk of financial loss to the Group if a customer or counterparty to a financial
instrument fails to meet its contractual obligations and arises partially from the Company’s
receivables from customers, loan and investment in debt securities. The carrying amount
of financial assets represent the maximum credit risk exposure. The Company has credit
policies in place and the exposures to these credit risks are monitored on an ongoing basis.
The carrying amount of financial assets represent the maximum credit risk exposure. The maximum
exposure to credit risk at the reporting was:
Particulars As at 31 March 2018
As at 31 March 2017
As at 31 March 2016
Trade receivables 22,201.67 19,957.12 16,435.80
Loans 612.97 299.38 292.29
Cash and cash equivalents 14,548.34 3,491.88 2,431.78
37,362.98 23,748.38 19,159.87
Notes to the consolidated financial statementsfor the year ended 31st March, 2018(All amounts are in lakhs of Indian Rupees, unless otherwise stated)

220 Newgen Software Technologies Limited
To cater to the credit risk for investments mutual funds and bonds, only high rated mutual funds/bonds are accepted.
The Group has given security deposits to vendors for rental deposits for office properties, securing services from them, government departments. The Company does not expect any default from these parties and accordingly the risk of default is negligible or nil.
Trade receivables and unbilled revenues are typically unsecured and derived from revenue earned from customers primarily located in India, USA, EMEA and APAC.
Credit risk has always been managed by the Group through credit approval, establishing credit limits and continuously monitoring the credit worthiness of customers to which the Company grants credit term in normal course of business. Credit limits are established for each customers and received quarterly. Any sales/services exceeding these limits require approval from the risk management committee.
The Group establishes an allowance for impairment that represents its expected credit losses in respect of trade receivables. The management uses a simplified approach for the purpose of computation of expected credit loss for trade receivables. In monitoring customer credit risk, customers are grouped according to their credit characteristics, including whether they are an individual or legal entity, industry and existence of previous financial difficulties, if any.
Trade and other receivables
The Group’s exposure to credit risk is influenced mainly by the individual characteristics of each customer. However, management also considers the factors that may influence the credit risk of its customer base, including the default risk of the industry and country in which customers operate.
The Group establishes an allowance for impairment that represents its expected credit losses in respect of trade and other receivables. The management establishes an allowance for impairment that represents its estimate of expected losses in respect of trade and other receivables. An impairment analysis is performed at each reporting date.
The Group’s exposure to credit risk for trade receivables by geographic region is as follows
Carrying amount
31 March 2018 31 March 2017 1 April 2016
India 7,994.27 6,692.89 4,778.97
USA 4,219.37 3,994.73 2,844.12
EMEA 7,967.17 7,626.81 7,081.34
APAC 2,020.86 1,642.69 1,731.37
22,201.67 19,957.12 16,435.80
The following table provides information about the exposure to credit risk and expected credit loss for
trade receivables from individual customers:
As at 31 March 2018 Gross carrying amount
Weighted- average loss
rate
Loss allowance
credit-impaired
0-3 months past due 17,111.83 4.03% 690.01 No
3-6 months past due 3,555.53 11.37% 404.32 No
6-9 months past due 1,300.53 20.34% 264.53 No
9-12 months past due 444.07 31.38% 139.34 No
12-15 months past due 534.59 35.89% 191.85 No
15-18 months past due 427.32 41.70% 178.19 No
18-21 months past due 238.08 44.49% 105.93 No
21-24 months past due 306.07 57.04% 174.59 No
above 24 months past due 2,423.47 82.16% 1,991.07 No
26,341.49 4,139.83
Notes to the consolidated financial statementsfor the year ended 31st March, 2018(All amounts are in lakhs of Indian Rupees, unless otherwise stated)
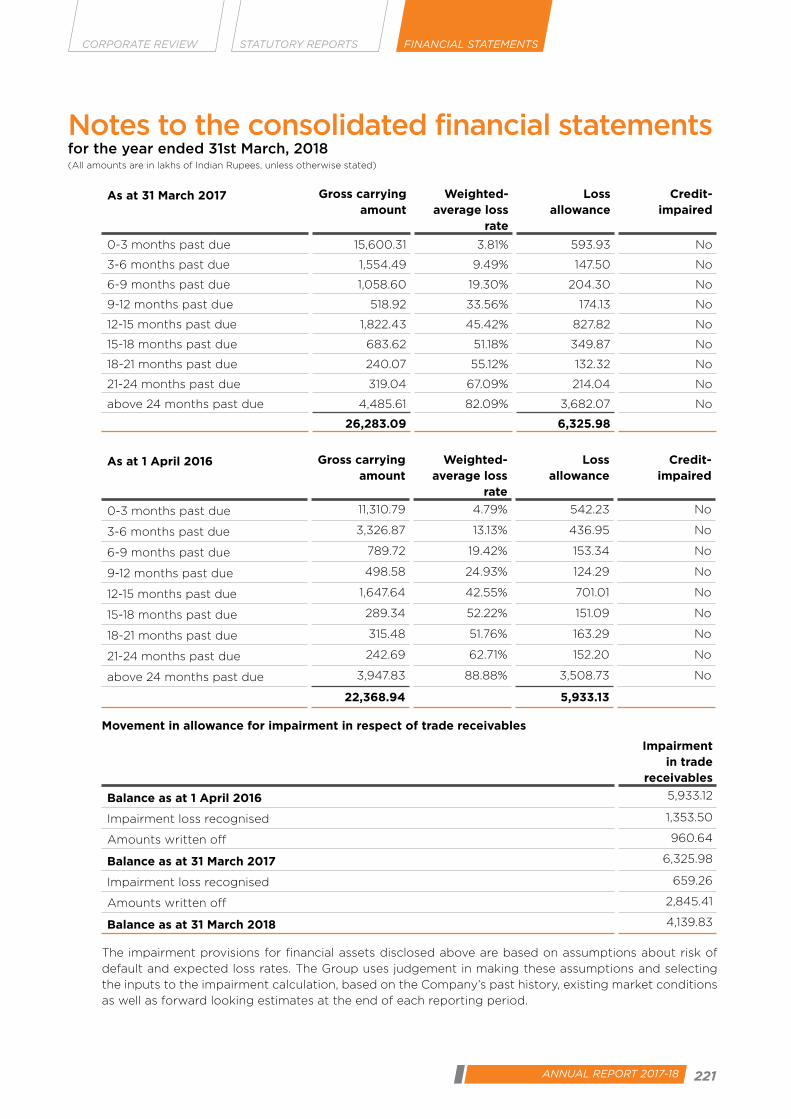
221ANNUAL REPORT 2017-18
CORPORATE REVIEW FINANCIAL STATEMENTSSTATUTORY REPORTS
As at 31 March 2017 Gross carrying amount
Weighted- average loss
rate
Loss allowance
Credit-impaired
0-3 months past due 15,600.31 3.81% 593.93 No
3-6 months past due 1,554.49 9.49% 147.50 No
6-9 months past due 1,058.60 19.30% 204.30 No
9-12 months past due 518.92 33.56% 174.13 No
12-15 months past due 1,822.43 45.42% 827.82 No
15-18 months past due 683.62 51.18% 349.87 No
18-21 months past due 240.07 55.12% 132.32 No
21-24 months past due 319.04 67.09% 214.04 No
above 24 months past due 4,485.61 82.09% 3,682.07 No
26,283.09 6,325.98
As at 1 April 2016 Gross carrying amount
Weighted- average loss
rate
Loss allowance
Credit-impaired
0-3 months past due 11,310.79 4.79% 542.23 No
3-6 months past due 3,326.87 13.13% 436.95 No
6-9 months past due 789.72 19.42% 153.34 No
9-12 months past due 498.58 24.93% 124.29 No
12-15 months past due 1,647.64 42.55% 701.01 No
15-18 months past due 289.34 52.22% 151.09 No
18-21 months past due 315.48 51.76% 163.29 No
21-24 months past due 242.69 62.71% 152.20 No
above 24 months past due 3,947.83 88.88% 3,508.73 No
22,368.94 5,933.13
Movement in allowance for impairment in respect of trade receivables
Impairment in trade
receivables
Balance as at 1 April 2016 5,933.12
Impairment loss recognised 1,353.50
Amounts written off 960.64
Balance as at 31 March 2017 6,325.98
Impairment loss recognised 659.26
Amounts written off 2,845.41
Balance as at 31 March 2018 4,139.83
The impairment provisions for financial assets disclosed above are based on assumptions about risk of
default and expected loss rates. The Group uses judgement in making these assumptions and selecting
the inputs to the impairment calculation, based on the Company’s past history, existing market conditions
as well as forward looking estimates at the end of each reporting period.
Notes to the consolidated financial statementsfor the year ended 31st March, 2018(All amounts are in lakhs of Indian Rupees, unless otherwise stated)

222 Newgen Software Technologies Limited
Debt securitiesThe Group limits its exposure to credit risk by investing only in liquid debt securities an only with counterparties
that have a credit rating AA- to AA+ from renowned rating agencies.
The Company monitors changes in credit risk by tracking published external credit ratings. For its investment in
bonds, Company also reviews changes in government bond yields together with available press and regulatory
information about issuers
The exposure to credit risk for debt securities at FVTOCI and at FVTPL is as follows:-
Net carrying amount
31 March 2018 31 March 2017 1 April 2016
India 5,022.07 4,866.04 2,149.01
Other Regions - - -
5,022.07 4,866.04 2,149.01
Basis experienced credit judgement, no risk of loss is indicative on Group’s investment in mutual funds and
government bonds.
Cash and cash equivalents
The Group held cash and cash equivalents of INR 14,548.34 at 31 March 2018 (31 March 2017: INR 3,491.88 lakhs
1 April 2016: INR 2,431.78 lakhs). The cash and cash equivalents are held with bank and financial institution
counterparties, which are rated AA- to AA+, based on renowned rating agencies.
iii. Liquidity risk
Liquidity risk is the risk that the Group will encounter difficulty in meeting the obligations associated with
its financial liabilities that are settled by delivering cash or another financial asset. The Group’s approach to
managing liquidity is to ensure, as far as possible, that it will have sufficient liquidity to meet its liabilities when
they are due, under both normal and stressed conditions, without incurring unacceptable losses or risking
damage to the Group’s reputation.
“The Group’ s primary sources of liquidity include cash and bank balances, deposits, undrawn borrowings and cash
flow from operating activities. As at 31 March 2018, the Group had a working capital of Rs. 30,615.47 (31 March 2017:
17,000.36 and 31 March 2016: 13,088.09) including cash and cash equivalent of INR 14,548.34 (31 March 2017: 3,491.88 and
31 March 2016: 2,431.78) and current investments of INR 5,022.07 (31 March 2017: 4,866.04 and 31 March 2016: 4,516.14).
Consequently, the Group believes its revenue, along with proceeds from financing activities will continue to provide the
necessary funds to cover its short term liquidity needs. In addition, the group projects cash flows and considering the level
of liquid assets necessary to meet liquidity requirement.”
In addition, the Group had access to the following undrawn borrowing facilities at the end of the reporting year
Particulars Total 2 months or less
2-12 months
1-2 years
2-5 years
More than 5 years
As at 31 March 2018 2,041.27 2,041.27 - - -
As at 31 March 2017 1,773.82 1,773.82 - - -
As at 1 April 2016 116.81 116.81 - - -
Exposure to liquidity riskThe following are the remaining contractual maturities of financial liabilities at the reporting date. The amounts
are gross and undiscounted, and include estimated interest payments and exclude the impact of netting
agreements.
Notes to the consolidated financial statementsfor the year ended 31st March, 2018(All amounts are in lakhs of Indian Rupees, unless otherwise stated)
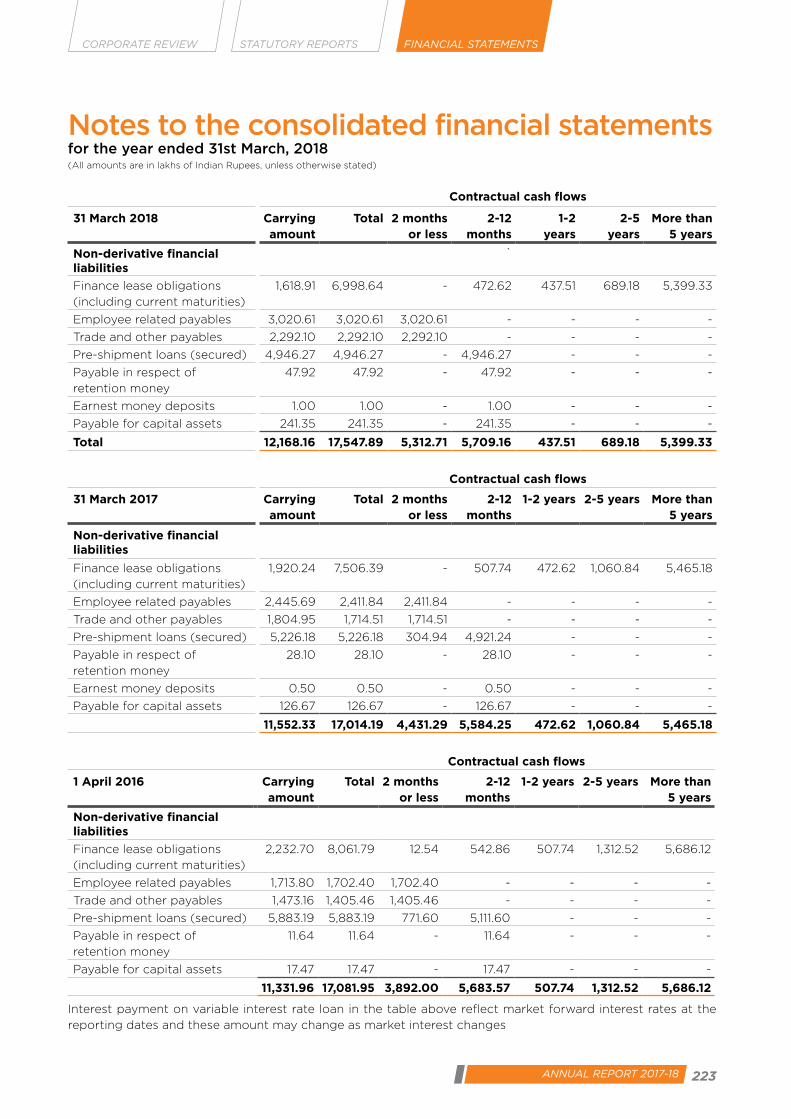
223ANNUAL REPORT 2017-18
CORPORATE REVIEW FINANCIAL STATEMENTSSTATUTORY REPORTS
Contractual cash flows
31 March 2018 Carrying amount
Total 2 months or less
2-12 months
1-2 years
2-5 years
More than 5 years
Non-derivative financial liabilities
`
Finance lease obligations
(including current maturities)
1,618.91 6,998.64 - 472.62 437.51 689.18 5,399.33
Employee related payables 3,020.61 3,020.61 3,020.61 - - - -
Trade and other payables 2,292.10 2,292.10 2,292.10 - - - -
Pre-shipment loans (secured) 4,946.27 4,946.27 - 4,946.27 - - -
Payable in respect of
retention money
47.92 47.92 - 47.92 - - -
Earnest money deposits 1.00 1.00 - 1.00 - - -
Payable for capital assets 241.35 241.35 - 241.35 - - -
Total 12,168.16 17,547.89 5,312.71 5,709.16 437.51 689.18 5,399.33
Contractual cash flows
31 March 2017 Carrying amount
Total 2 months or less
2-12 months
1-2 years 2-5 years More than 5 years
Non-derivative financial liabilities
Finance lease obligations
(including current maturities)
1,920.24 7,506.39 - 507.74 472.62 1,060.84 5,465.18
Employee related payables 2,445.69 2,411.84 2,411.84 - - - -
Trade and other payables 1,804.95 1,714.51 1,714.51 - - - -
Pre-shipment loans (secured) 5,226.18 5,226.18 304.94 4,921.24 - - -
Payable in respect of
retention money
28.10 28.10 - 28.10 - - -
Earnest money deposits 0.50 0.50 - 0.50 - - -
Payable for capital assets 126.67 126.67 - 126.67 - - -
11,552.33 17,014.19 4,431.29 5,584.25 472.62 1,060.84 5,465.18
Contractual cash flows
1 April 2016 Carrying amount
Total 2 months or less
2-12 months
1-2 years 2-5 years More than 5 years
Non-derivative financial liabilities
Finance lease obligations
(including current maturities)
2,232.70 8,061.79 12.54 542.86 507.74 1,312.52 5,686.12
Employee related payables 1,713.80 1,702.40 1,702.40 - - - -
Trade and other payables 1,473.16 1,405.46 1,405.46 - - - -
Pre-shipment loans (secured) 5,883.19 5,883.19 771.60 5,111.60 - - -
Payable in respect of
retention money
11.64 11.64 - 11.64 - - -
Payable for capital assets 17.47 17.47 - 17.47 - - -
11,331.96 17,081.95 3,892.00 5,683.57 507.74 1,312.52 5,686.12
Interest payment on variable interest rate loan in the table above reflect market forward interest rates at the
reporting dates and these amount may change as market interest changes
Notes to the consolidated financial statementsfor the year ended 31st March, 2018(All amounts are in lakhs of Indian Rupees, unless otherwise stated)
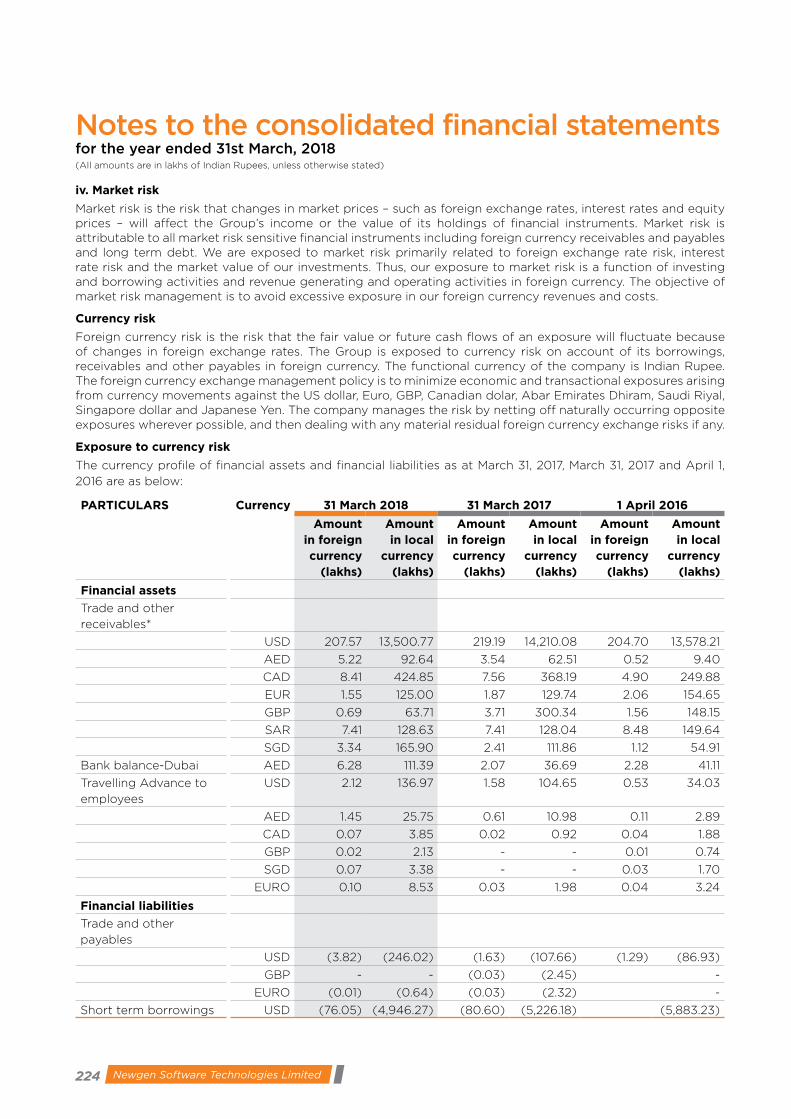
224 Newgen Software Technologies Limited
iv. Market risk
Market risk is the risk that changes in market prices – such as foreign exchange rates, interest rates and equity prices – will affect the Group’s income or the value of its holdings of financial instruments. Market risk is attributable to all market risk sensitive financial instruments including foreign currency receivables and payables and long term debt. We are exposed to market risk primarily related to foreign exchange rate risk, interest rate risk and the market value of our investments. Thus, our exposure to market risk is a function of investing and borrowing activities and revenue generating and operating activities in foreign currency. The objective of market risk management is to avoid excessive exposure in our foreign currency revenues and costs.
Currency risk
Foreign currency risk is the risk that the fair value or future cash flows of an exposure will fluctuate because of changes in foreign exchange rates. The Group is exposed to currency risk on account of its borrowings, receivables and other payables in foreign currency. The functional currency of the company is Indian Rupee. The foreign currency exchange management policy is to minimize economic and transactional exposures arising from currency movements against the US dollar, Euro, GBP, Canadian dolar, Abar Emirates Dhiram, Saudi Riyal, Singapore dollar and Japanese Yen. The company manages the risk by netting off naturally occurring opposite exposures wherever possible, and then dealing with any material residual foreign currency exchange risks if any.
Exposure to currency risk
The currency profile of financial assets and financial liabilities as at March 31, 2017, March 31, 2017 and April 1,
2016 are as below:
PARTICULARS Currency 31 March 2018 31 March 2017 1 April 2016
Amount in foreign currency
(lakhs)
Amount in local
currency (lakhs)
Amount in foreign currency
(lakhs)
Amount in local
currency (lakhs)
Amount in foreign currency
(lakhs)
Amount in local
currency (lakhs)
Financial assets
Trade and other
receivables*
USD 207.57 13,500.77 219.19 14,210.08 204.70 13,578.21
AED 5.22 92.64 3.54 62.51 0.52 9.40
CAD 8.41 424.85 7.56 368.19 4.90 249.88
EUR 1.55 125.00 1.87 129.74 2.06 154.65
GBP 0.69 63.71 3.71 300.34 1.56 148.15
SAR 7.41 128.63 7.41 128.04 8.48 149.64
SGD 3.34 165.90 2.41 111.86 1.12 54.91
Bank balance-Dubai AED 6.28 111.39 2.07 36.69 2.28 41.11
Travelling Advance to
employees
USD 2.12 136.97 1.58 104.65 0.53 34.03
AED 1.45 25.75 0.61 10.98 0.11 2.89
CAD 0.07 3.85 0.02 0.92 0.04 1.88
GBP 0.02 2.13 - - 0.01 0.74
SGD 0.07 3.38 - - 0.03 1.70
EURO 0.10 8.53 0.03 1.98 0.04 3.24
Financial liabilities
Trade and other
payables
USD (3.82) (246.02) (1.63) (107.66) (1.29) (86.93)
GBP - - (0.03) (2.45) -
EURO (0.01) (0.64) (0.03) (2.32) -
Short term borrowings USD (76.05) (4,946.27) (80.60) (5,226.18) (5,883.23)
Notes to the consolidated financial statementsfor the year ended 31st March, 2018(All amounts are in lakhs of Indian Rupees, unless otherwise stated)

225ANNUAL REPORT 2017-18
CORPORATE REVIEW FINANCIAL STATEMENTSSTATUTORY REPORTS
* gross of loss allowance
Sensitivity analysis
A reasonably possible strengthening (weakening) of the Indian Rupee against US dollar, Euro, GBP, Canadian
dolar, Abar Emirates Dhiram, Saudi Riyal, Singapore dollar and Japanese Yen at reporting date would have
affected the measurement of financial instruments denominated in foreign currencies and affected equity and
profit or loss by the amounts shown below. This analysis assumes that all other variables, in particular interest
rates, remain constant and ignores any impact of forecast sales and purchases.
For the year ended 31 March 2018
For the year ended 31 March 2017
Effect in thousands of INR Strengthening Weakening Strengthening Weakening
1% movement
USD 84.43 (84.43) 89.82 (89.82)
EUR1 1.32 (1.32) 1.29 (1.29)
GBP1 0.66 (0.66) 2.98 (2.98)
CAD1 4.28 (4.28) 3.68 (3.68)
SGD1 1.69 (1.69) 1.12 (1.12)
AED1 1.37 (1.37) 1.10 (1.10)
SAR1 1.29 (1.29) 1.28 (1.28)
95.05 (95.05) 101.26 (101.26)
Interest rate risk
Interest rate risk can be either fair value interest rate risk or cash flow interest rate risk. Fair value interest rate risk
is the risk of changes in fair values of fixed interest bearing investments because of fluctuations in the interest
rates. Cash flow interest rate risk is the risk that the future cash flows of floating interest bearing investments
will fluctuate because of fluctuations in the interest rates.
a) Exposure to interest rate risk
The Group is exposed to both fair value interest rate risk as well as cash flow interest rate risk arising both on
short-term and long-term floating rate instruments.
The interest rate profile of the Group’s interest-bearing financial instruments is as follows:
Nominal amount in INR31 March 2018 31 March 2017 1 April 2016
Fixed-rate instruments
Financial assets 10,613.25 2,695.03 688.95
Financial liabilities (1,618.91) (1,920.24) (2,232.70)
8,994.34 774.79 (1,543.75)
Variable-rate instruments `
Financial assets - - -
Financial liabilities (4,946.27) (5,226.18) (5,883.19)
(4,946.27) (5,226.18) (5,883.19)
Total 4,048.07 (4,451.39) (7,426.94)
b) Sensitivity analysis
Fair value sensitivity analysis for fixed-rate instruments
The Group accounts for investments in government and other bonds as fair value through other comprehensive
income. Therefore, a change in interest rate at the reporting date would have impact on equity.
Notes to the consolidated financial statementsfor the year ended 31st March, 2018(All amounts are in lakhs of Indian Rupees, unless otherwise stated)
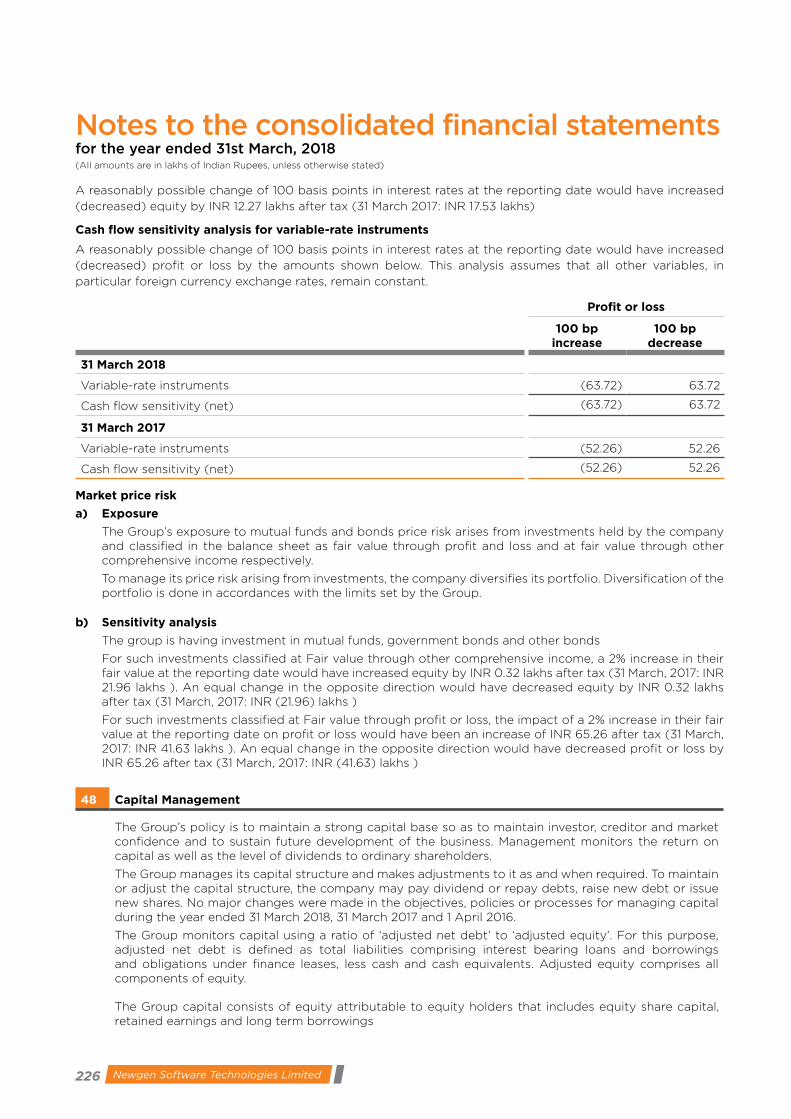
226 Newgen Software Technologies Limited
A reasonably possible change of 100 basis points in interest rates at the reporting date would have increased
(decreased) equity by INR 12.27 lakhs after tax (31 March 2017: INR 17.53 lakhs)
Cash flow sensitivity analysis for variable-rate instruments
A reasonably possible change of 100 basis points in interest rates at the reporting date would have increased
(decreased) profit or loss by the amounts shown below. This analysis assumes that all other variables, in
particular foreign currency exchange rates, remain constant.
Profit or loss
100 bp increase
100 bp decrease
31 March 2018
Variable-rate instruments (63.72) 63.72
Cash flow sensitivity (net) (63.72) 63.72
31 March 2017
Variable-rate instruments (52.26) 52.26
Cash flow sensitivity (net) (52.26) 52.26
Market price risk
a) Exposure
The Group’s exposure to mutual funds and bonds price risk arises from investments held by the company and classified in the balance sheet as fair value through profit and loss and at fair value through other comprehensive income respectively.
To manage its price risk arising from investments, the company diversifies its portfolio. Diversification of the portfolio is done in accordances with the limits set by the Group.
b) Sensitivity analysis
The group is having investment in mutual funds, government bonds and other bonds
For such investments classified at Fair value through other comprehensive income, a 2% increase in their fair value at the reporting date would have increased equity by INR 0.32 lakhs after tax (31 March, 2017: INR 21.96 lakhs ). An equal change in the opposite direction would have decreased equity by INR 0.32 lakhs after tax (31 March, 2017: INR (21.96) lakhs )
For such investments classified at Fair value through profit or loss, the impact of a 2% increase in their fair value at the reporting date on profit or loss would have been an increase of INR 65.26 after tax (31 March, 2017: INR 41.63 lakhs ). An equal change in the opposite direction would have decreased profit or loss by INR 65.26 after tax (31 March, 2017: INR (41.63) lakhs )
48 Capital Management
The Group’s policy is to maintain a strong capital base so as to maintain investor, creditor and market confidence and to sustain future development of the business. Management monitors the return on capital as well as the level of dividends to ordinary shareholders.
The Group manages its capital structure and makes adjustments to it as and when required. To maintain or adjust the capital structure, the company may pay dividend or repay debts, raise new debt or issue new shares. No major changes were made in the objectives, policies or processes for managing capital during the year ended 31 March 2018, 31 March 2017 and 1 April 2016.
The Group monitors capital using a ratio of ‘adjusted net debt’ to ‘adjusted equity’. For this purpose, adjusted net debt is defined as total liabilities comprising interest bearing loans and borrowings and obligations under finance leases, less cash and cash equivalents. Adjusted equity comprises all components of equity.
The Group capital consists of equity attributable to equity holders that includes equity share capital, retained earnings and long term borrowings
Notes to the consolidated financial statementsfor the year ended 31st March, 2018(All amounts are in lakhs of Indian Rupees, unless otherwise stated)
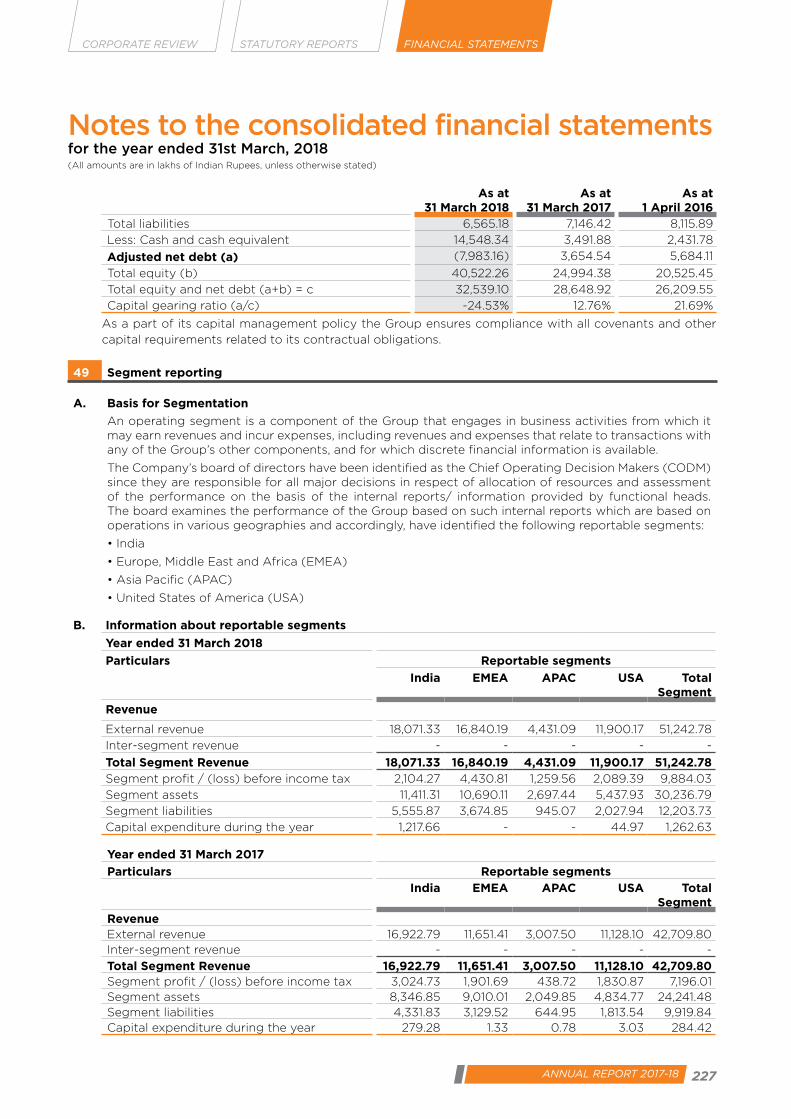
227ANNUAL REPORT 2017-18
CORPORATE REVIEW FINANCIAL STATEMENTSSTATUTORY REPORTS
As at 31 March 2018
As at 31 March 2017
As at 1 April 2016
Total liabilities 6,565.18 7,146.42 8,115.89
Less: Cash and cash equivalent 14,548.34 3,491.88 2,431.78
Adjusted net debt (a) (7,983.16) 3,654.54 5,684.11
Total equity (b) 40,522.26 24,994.38 20,525.45
Total equity and net debt (a+b) = c 32,539.10 28,648.92 26,209.55
Capital gearing ratio (a/c) -24.53% 12.76% 21.69%
As a part of its capital management policy the Group ensures compliance with all covenants and other
capital requirements related to its contractual obligations.
49 Segment reporting
A. Basis for Segmentation
An operating segment is a component of the Group that engages in business activities from which it may earn revenues and incur expenses, including revenues and expenses that relate to transactions with any of the Group’s other components, and for which discrete financial information is available.
The Company’s board of directors have been identified as the Chief Operating Decision Makers (CODM) since they are responsible for all major decisions in respect of allocation of resources and assessment of the performance on the basis of the internal reports/ information provided by functional heads. The board examines the performance of the Group based on such internal reports which are based on operations in various geographies and accordingly, have identified the following reportable segments:
•India
•Europe,MiddleEastandAfrica(EMEA)
•AsiaPacific(APAC)
•UnitedStatesofAmerica(USA)
B. Information about reportable segments
Year ended 31 March 2018
Particulars Reportable segments
India EMEA APAC USA Total Segment
Revenue
External revenue 18,071.33 16,840.19 4,431.09 11,900.17 51,242.78
Inter-segment revenue - - - - -
Total Segment Revenue 18,071.33 16,840.19 4,431.09 11,900.17 51,242.78 Segment profit / (loss) before income tax 2,104.27 4,430.81 1,259.56 2,089.39 9,884.03
Segment assets 11,411.31 10,690.11 2,697.44 5,437.93 30,236.79
Segment liabilities 5,555.87 3,674.85 945.07 2,027.94 12,203.73
Capital expenditure during the year 1,217.66 - - 44.97 1,262.63
Year ended 31 March 2017
Particulars Reportable segmentsIndia EMEA APAC USA Total
SegmentRevenueExternal revenue 16,922.79 11,651.41 3,007.50 11,128.10 42,709.80 Inter-segment revenue - - - - -
Total Segment Revenue 16,922.79 11,651.41 3,007.50 11,128.10 42,709.80 Segment profit / (loss) before income tax 3,024.73 1,901.69 438.72 1,830.87 7,196.01 Segment assets 8,346.85 9,010.01 2,049.85 4,834.77 24,241.48 Segment liabilities 4,331.83 3,129.52 644.95 1,813.54 9,919.84 Capital expenditure during the year 279.28 1.33 0.78 3.03 284.42
Notes to the consolidated financial statementsfor the year ended 31st March, 2018(All amounts are in lakhs of Indian Rupees, unless otherwise stated)
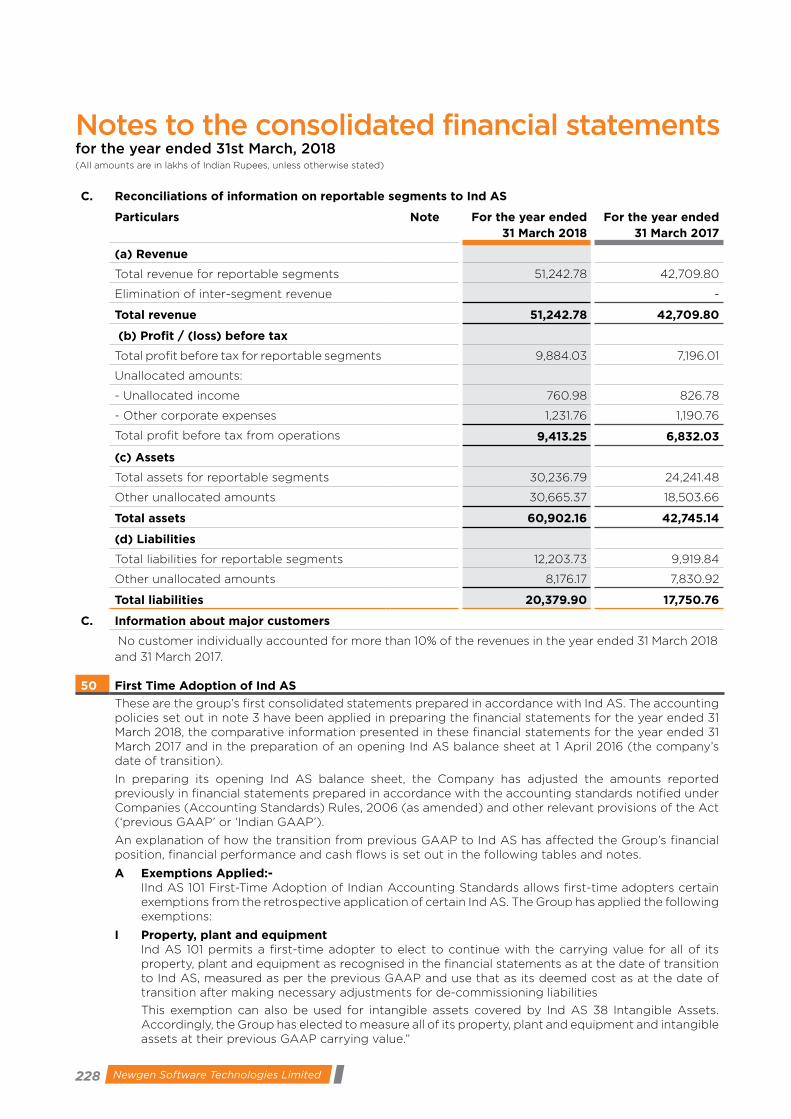
228 Newgen Software Technologies Limited
C. Reconciliations of information on reportable segments to Ind AS
Particulars Note For the year ended 31 March 2018
For the year ended 31 March 2017
(a) Revenue
Total revenue for reportable segments 51,242.78 42,709.80
Elimination of inter-segment revenue -
Total revenue 51,242.78 42,709.80
(b) Profit / (loss) before tax
Total profit before tax for reportable segments 9,884.03 7,196.01
Unallocated amounts:
- Unallocated income 760.98 826.78
- Other corporate expenses 1,231.76 1,190.76
Total profit before tax from operations 9,413.25 6,832.03
(c) Assets
Total assets for reportable segments 30,236.79 24,241.48
Other unallocated amounts 30,665.37 18,503.66
Total assets 60,902.16 42,745.14
(d) Liabilities
Total liabilities for reportable segments 12,203.73 9,919.84
Other unallocated amounts 8,176.17 7,830.92
Total liabilities 20,379.90 17,750.76
C. Information about major customers
No customer individually accounted for more than 10% of the revenues in the year ended 31 March 2018
and 31 March 2017.
50 First Time Adoption of Ind AS
These are the group’s first consolidated statements prepared in accordance with Ind AS. The accounting policies set out in note 3 have been applied in preparing the financial statements for the year ended 31 March 2018, the comparative information presented in these financial statements for the year ended 31 March 2017 and in the preparation of an opening Ind AS balance sheet at 1 April 2016 (the company’s date of transition).
In preparing its opening Ind AS balance sheet, the Company has adjusted the amounts reported previously in financial statements prepared in accordance with the accounting standards notified under Companies (Accounting Standards) Rules, 2006 (as amended) and other relevant provisions of the Act (‘previous GAAP’ or ‘Indian GAAP’).
An explanation of how the transition from previous GAAP to Ind AS has affected the Group’s financial position, financial performance and cash flows is set out in the following tables and notes.
A Exemptions Applied:- IInd AS 101 First-Time Adoption of Indian Accounting Standards allows first-time adopters certain
exemptions from the retrospective application of certain Ind AS. The Group has applied the following exemptions:
I Property, plant and equipment Ind AS 101 permits a first-time adopter to elect to continue with the carrying value for all of its
property, plant and equipment as recognised in the financial statements as at the date of transition to Ind AS, measured as per the previous GAAP and use that as its deemed cost as at the date of transition after making necessary adjustments for de-commissioning liabilities
This exemption can also be used for intangible assets covered by Ind AS 38 Intangible Assets. Accordingly, the Group has elected to measure all of its property, plant and equipment and intangible assets at their previous GAAP carrying value.”
Notes to the consolidated financial statementsfor the year ended 31st March, 2018(All amounts are in lakhs of Indian Rupees, unless otherwise stated)
229ANNUAL REPORT 2017-18
CORPORATE REVIEW FINANCIAL STATEMENTSSTATUTORY REPORTS
II Share- based payment transactions Ind AS 101 gives an option to apply Ind AS 102 Share-based payment only on ESOP’s that are
unvested as on the transition date.
Accordingly, the Group has elected to apply Ind AS 102 i.e. fair value only those options that are unvested as on the date of transition.
III Cumulative translation differences As per Ind AS 101, an entity may deem that the cumulative translation differences for all foreign operations
to be zero as at the date of transition by transferring any such cumulative differences to retained earnings. Accordingly, the group has opted to avail the above exemption.
B The following mandatory exceptions have been applied:I Estimates An entity’s estimates in accordance with Ind ASs at the date of transition to Ind AS shall be consistent with
estimates made for the same date in accordance with previous GAAP (after adjustments to reflect any difference in accounting policies), unless there is objective evidence that those estimates were in error. Ind AS estimates as at 1 April 2016 are consistent with the estimates as at the same date made in conformity with previous GAAP. The Group made estimates for impairment of financial assets based on expected credit loss model in accordance with Ind AS at the date of transition and determination of discounted value of financial instrument carried at amortised cost as these were not required under previous GAAP.
II Classification and measurement of financial assets Ind AS 101 requires an entity to assess classification of financial assets on the basis of facts and
circumstances existing as on the date of transition. Further, the standard permits measurement of financial assets accounted at amortised cost based on facts and circumstances existing at the date of transition if retrospective application is impracticable.
Accordingly, the Group has determined the classification of financial assets based on facts and circumstances that exist on the date of transition. Measurement of the financial assets accounted at amortised cost has been done retrospectively except where the same is impracticable.
III De-recognition of financial assets and liabilities Ind AS 101 requires a first-time adopter to apply the de-recognition provisions of Ind AS
109 prospectively for transactions occurring on or after the date of transition to Ind AS. However, Ind AS 101 allows a first-time adopter to apply the de-recognition requirements in Ind AS 109 retrospectively from a date of the entity’s choosing, provided that the information needed to apply Ind AS 109 to financial assets and financial liabilities derecognised as a result of past transactions was obtained at the time of initially accounting for those transactions. The Group has elected to apply the de-recognition provisions of Ind AS 109 prospectively from the date of transition to Ind AS.
Notes to the consolidated financial statementsfor the year ended 31st March, 2018(All amounts are in lakhs of Indian Rupees, unless otherwise stated)

230 Newgen Software Technologies Limited
No
tes
to t
he c
onso
lidate
d f
inanci
al s
tate
ments
for
the
ye
ar
en
de
d 3
1st
Marc
h, 2
018
(All
am
ou
nts
are
in
lakh
s o
f In
dia
n R
up
ees,
un
less
oth
erw
ise s
tate
d)
C
Re
co
ncil
iati
on
of
tota
l e
qu
ity a
s at
31
Marc
h 2
017
an
d 1
Ap
ril
20
16
Part
icul
ars
Not
es t
o fir
st t
ime
adop
tion
Shar
e ca
pita
lR
etai
ned
earn
ings
Fore
ign
curr
ency
tr
ansl
atio
n re
serv
e
New
gen
ESO
P re
serv
e
New
gen
ESO
P tr
ust
rese
rve
Oth
er
com
preh
ensi
ve
inco
me
Secu
riti
es
Prem
ium
Cap
ital
rede
mpt
ion
rese
rve
Shar
e op
tion
s ou
tsta
ndin
g re
serv
e
Gen
eral
re
serv
e To
tal
Bal
ance
as
at 1
Apr
il 20
16 a
s pe
r pr
evio
us G
AA
P 6
,30
9.41
13
,411
.45
327
.34
0
.21
-
-
489
.79
87.
95
16.4
8 1,
731.3
9 2
2,37
4.0
2
Der
ivat
ive
D.1
-
(13
6.0
0)
-
-
-
-
-
-
-
-
(13
6.0
0)
Exp
ecte
d C
redi
t lo
ssD
.2 -
(
4,11
4.7
9) -
-
-
-
-
-
-
-
(
4,11
4.7
9)
Adj
ustm
ent
on a
ccou
nt o
f con
solid
atio
n of
tru
stD
.3 (
100
.97)
-
-
-
175.
75
-
(4
.35)
-
-
-
70
.43
Em
ploy
ee s
tock
com
pens
atio
n ex
pens
eD
.4 -
(
251.2
2) -
-
-
-
8
.63
-
24
2.59
-
-
Gai
n/(l
oss)
aris
ing
from
fair
valu
atio
n of
in
vest
men
tsD
.5 -
17
.84
-
-
-
(
3.37
) -
-
-
-
14
.46
Gai
n on
dis
coun
ting
of lo
ng t
erm
fin
anci
al a
sset
s an
d lia
bilit
ies,
net
D.6
-
92.
36
-
-
-
-
-
-
-
-
92.
36
Mea
sure
men
t of
sec
urity
dep
osits
at
amor
tised
cos
tsD
.7 -
(
7.63
) -
-
-
-
-
-
-
-
(
7.63
)
Adj
ustm
ent
for
divi
dend
D.8
-
775
.78
-
-
-
-
-
-
-
-
775
.78
Leas
e eq
ualis
atio
n re
serv
eD
.10 -
19
.25
-
-
-
-
-
-
-
-
19.2
5
Rec
lass
ifica
tion
of c
urre
ncy
tran
slat
ion
diff
eren
ces
D.11
-
327
.34
(
327.
34)
-
-
-
-
-
-
-
-
Def
erre
d ta
x on
abo
ve a
djus
tmen
tsD
.12 -
1,
436
.41
-
-
-
1.17
-
-
-
-
1,
437
.58
Bal
ance
as
at 1
Apr
il 20
16 a
s pe
r In
d A
S 6
,20
8.44
1
1,57
0.7
9 -
0
.21
175
.75
(2.
21)
494
.07
87.
95
259
.07
1,7
31.3
9 2
0,5
25.4
5
Bal
ance
as
at 3
1 M
arch
20
17 a
s pe
r pr
evio
us G
AA
P 6
,338
.31
18,4
32.15
2
22.8
0
0.2
1 -
-
6
45.
69
87.
95
13.0
9 1,
732.
08
27,
472.
28
Exp
ecte
d C
redi
t lo
ssD
.2 -
(3
,978
.71)
-
-
-
-
-
-
-
-
(3,
978.
71)
Adj
ustm
ent
on a
ccou
nt o
f co
nsol
idat
ion
of t
rust
D.3
(10
7.0
1) -
-
-
2
00
.22
-
(78
.57)
-
-
-
14.6
5
Em
ploy
ee s
tock
com
pens
atio
n ex
pens
eD
.4 -
(
377.
64)
-
-
-
-
32.
75
-
34
6.27
(
0.6
9) 0
.69
Gai
n/(l
oss)
aris
ing
from
fai
r va
luat
ion
of
inve
stm
ents
D.5
-
18.5
5 -
-
-
2
3.21
-
-
-
-
4
1.76
Gai
n on
dis
coun
ting
of lo
ng t
erm
fina
ncia
l as
sets
and
liab
ilitie
s, n
etD
.6 -
8
5.59
-
-
-
-
-
-
-
-
8
5.59
Mea
sure
men
t of
sec
urity
dep
osits
at
amor
tised
cos
tsD
.7 -
(
9.52
) -
-
-
-
-
-
-
-
(
9.52
)
Rem
easu
rem
ents
of
po
st-e
mpl
oym
ent
bene
fit o
blig
atio
nsD
.9 -
8
2.88
-
-
-
(
82.8
8) -
-
-
-
-
Leas
e eq
ualis
atio
n re
serv
eD
.10 -
10
.39
-
-
-
-
-
-
-
-
10.3
9
Rec
lass
ifica
tion
of
curr
ency
tr
ansl
atio
n di
ffer
ence
sD
.11 -
3
27.3
4
(32
7.34
) -
-
-
-
-
-
-
-
Def
erre
d ta
x on
abo
ve a
djus
tmen
tsD
.12 -
1,
336.
97
-
-
-
20
.28
-
-
-
-
1,35
7.25
Bal
ance
as
at 3
1 Mar
ch 2
018
as
per I
nd A
S 6
,231
.30
15
,928
.02
(10
4.54
) 0
.21
20
0.2
2 (
39.4
0)
599
.87
87.
95
359
.36
1,7
31.3
9 2
4,99
4.38
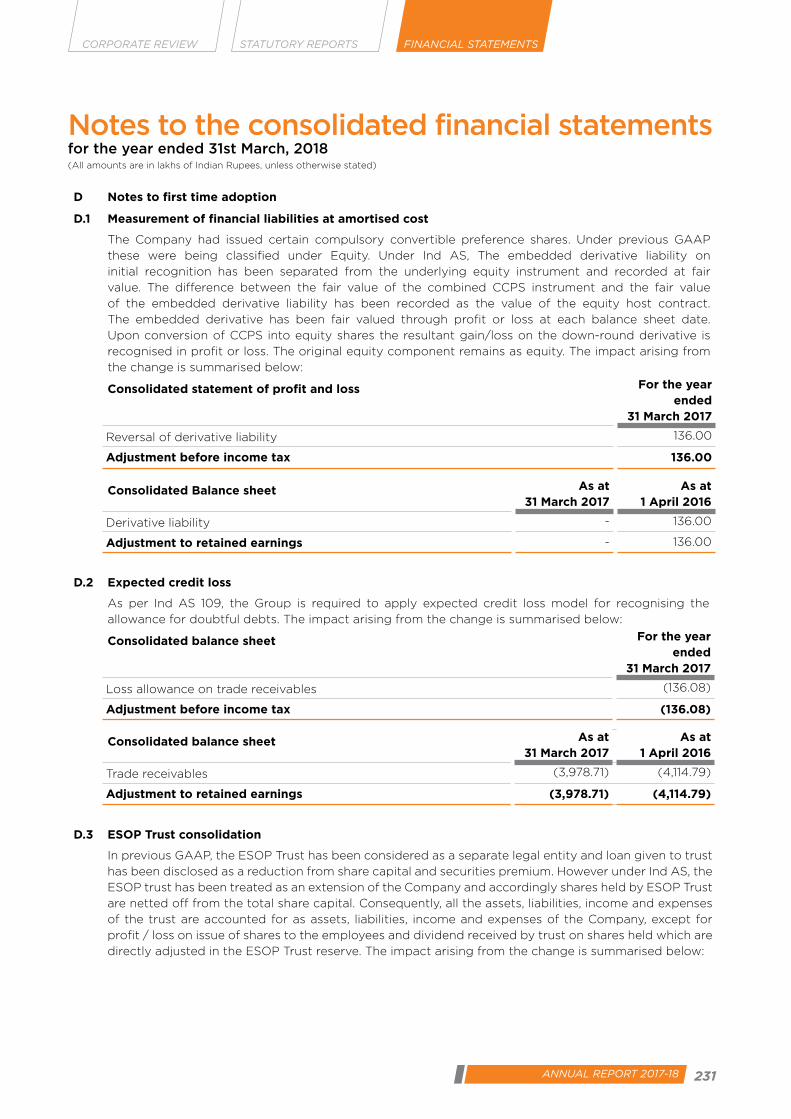
231ANNUAL REPORT 2017-18
CORPORATE REVIEW FINANCIAL STATEMENTSSTATUTORY REPORTS
D Notes to first time adoption
D.1 Measurement of financial liabilities at amortised cost
The Company had issued certain compulsory convertible preference shares. Under previous GAAP
these were being classified under Equity. Under Ind AS, The embedded derivative liability on
initial recognition has been separated from the underlying equity instrument and recorded at fair
value. The difference between the fair value of the combined CCPS instrument and the fair value
of the embedded derivative liability has been recorded as the value of the equity host contract.
The embedded derivative has been fair valued through profit or loss at each balance sheet date.
Upon conversion of CCPS into equity shares the resultant gain/loss on the down-round derivative is
recognised in profit or loss. The original equity component remains as equity. The impact arising from
the change is summarised below:
Consolidated statement of profit and loss For the year ended
31 March 2017
Reversal of derivative liability 136.00
Adjustment before income tax 136.00
Consolidated Balance sheet As at 31 March 2017
As at 1 April 2016
Derivative liability - 136.00
Adjustment to retained earnings - 136.00
D.2 Expected credit loss
As per Ind AS 109, the Group is required to apply expected credit loss model for recognising the
allowance for doubtful debts. The impact arising from the change is summarised below:
Consolidated balance sheet For the year ended
31 March 2017
Loss allowance on trade receivables (136.08)
Adjustment before income tax (136.08)
Consolidated balance sheet As at 31 March 2017
As at 1 April 2016
Trade receivables (3,978.71) (4,114.79)
Adjustment to retained earnings (3,978.71) (4,114.79)
D.3 ESOP Trust consolidation
In previous GAAP, the ESOP Trust has been considered as a separate legal entity and loan given to trust
has been disclosed as a reduction from share capital and securities premium. However under Ind AS, the
ESOP trust has been treated as an extension of the Company and accordingly shares held by ESOP Trust
are netted off from the total share capital. Consequently, all the assets, liabilities, income and expenses
of the trust are accounted for as assets, liabilities, income and expenses of the Company, except for
profit / loss on issue of shares to the employees and dividend received by trust on shares held which are
directly adjusted in the ESOP Trust reserve. The impact arising from the change is summarised below:
Notes to the consolidated financial statementsfor the year ended 31st March, 2018(All amounts are in lakhs of Indian Rupees, unless otherwise stated)

232 Newgen Software Technologies Limited
Consolidated balance sheet As at 31 March 2017
As at 1 April 2016
Cash and cash equivalents 17.01 74.03
Loans - financial assets (2.00) (2.00)
Current financial assets - Others 0.56 -
Trade payables 0.17 0.25
Share capital (107.00) (100.97)
Capital reserve 200.22 175.75
Securities premium (78.57) (4.35)
Other current liabilities 0.77 1.35
Adjustment to retained earnings - -
D.4 Fair valuation of ESOP’s
Under the previous GAAP, the cost of equity-settled employee share-based plan were recognised using
the intrinsic value method. Under Ind AS, the cost of equity settled share-based plan is recognised based
on the fair value of the options as at the grant date. The impact arising from the change is summarised
below:
Consolidated statement of profit and loss For the year ended
31 March 2017
Share based payment - equity settled 127.05
Adjustment before income tax 127.05
Consolidated balance sheet As at 31 March 2017
As at 1 April 2016
Share options outstanding reserve 346.27 242.59
Securities Premium 32.75 8.63
General reserve (0.69) -
Adjustment to retained earnings 377.64 251.22
D.5 Fair valuation of Investments
Under the previous GAAP, investments in government bonds and mutual funds were classified as
long-term investments or current investments based on the intended holding period and realisability.
Long-term investments were carried at cost less provision for other than temporary decline
in the value of such investments. Current investments were carried at lower of cost and fair value.
Under Ind AS, these investments are required to be measured at fair value. The resulting fair value
changes of these investments (other than equity instruments designated as at FVOCI) have been
recognised in retained earnings as at the date of transition and subsequently in the profit or loss for the
year ended 31 March 2017. The impact arising from the change is summarised below:
Consolidated statement of profit and loss For the year ended
31 March 2017
Fair value changes of financial assets at FVTPL - other expenses (0.71)
Adjustment before income tax (0.71)
Notes to the consolidated financial statementsfor the year ended 31st March, 2018(All amounts are in lakhs of Indian Rupees, unless otherwise stated)
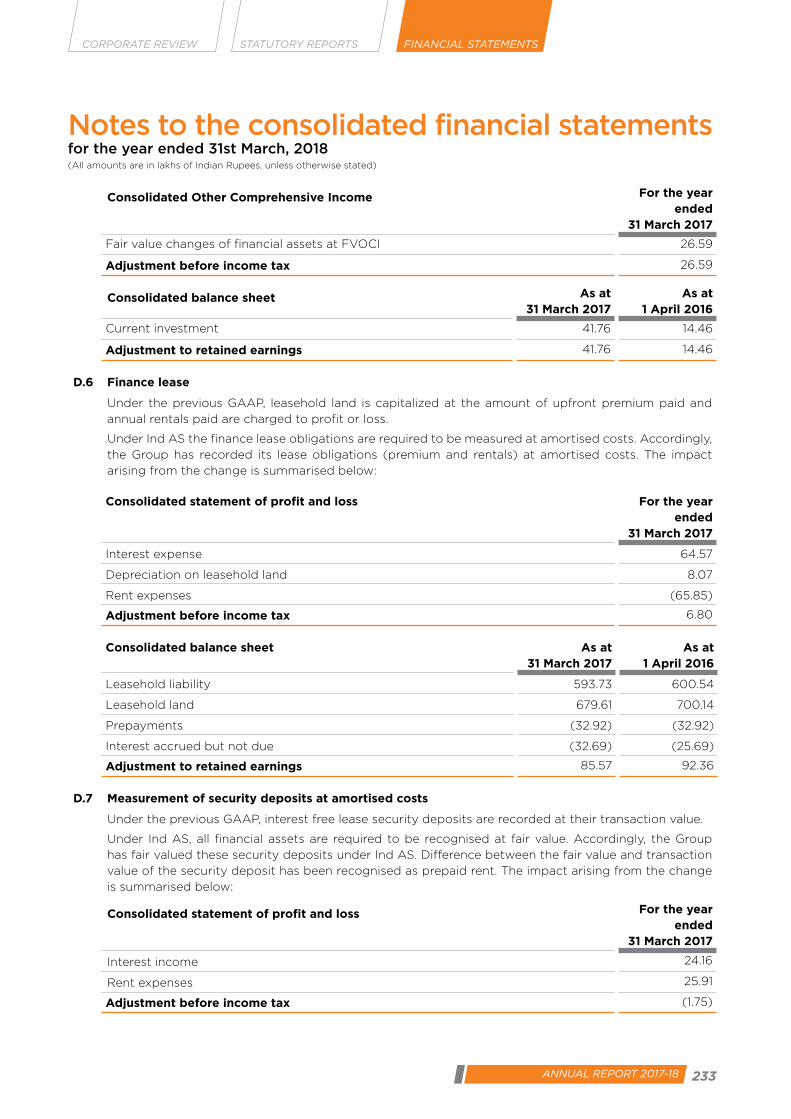
233ANNUAL REPORT 2017-18
CORPORATE REVIEW FINANCIAL STATEMENTSSTATUTORY REPORTS
Consolidated Other Comprehensive Income For the year ended
31 March 2017
Fair value changes of financial assets at FVOCI 26.59
Adjustment before income tax 26.59
Consolidated balance sheet As at 31 March 2017
As at 1 April 2016
Current investment 41.76 14.46
Adjustment to retained earnings 41.76 14.46
D.6 Finance lease
Under the previous GAAP, leasehold land is capitalized at the amount of upfront premium paid and
annual rentals paid are charged to profit or loss.
Under Ind AS the finance lease obligations are required to be measured at amortised costs. Accordingly,
the Group has recorded its lease obligations (premium and rentals) at amortised costs. The impact
arising from the change is summarised below:
Consolidated statement of profit and loss For the year ended
31 March 2017
Interest expense 64.57
Depreciation on leasehold land 8.07
Rent expenses (65.85)
Adjustment before income tax 6.80
Consolidated balance sheet As at 31 March 2017
As at 1 April 2016
Leasehold liability 593.73 600.54
Leasehold land 679.61 700.14
Prepayments (32.92) (32.92)
Interest accrued but not due (32.69) (25.69)
Adjustment to retained earnings 85.57 92.36
D.7 Measurement of security deposits at amortised costs
Under the previous GAAP, interest free lease security deposits are recorded at their transaction value.
Under Ind AS, all financial assets are required to be recognised at fair value. Accordingly, the Group
has fair valued these security deposits under Ind AS. Difference between the fair value and transaction
value of the security deposit has been recognised as prepaid rent. The impact arising from the change
is summarised below:
Consolidated statement of profit and loss For the year ended
31 March 2017
Interest income 24.16
Rent expenses 25.91
Adjustment before income tax (1.75)
Notes to the consolidated financial statementsfor the year ended 31st March, 2018(All amounts are in lakhs of Indian Rupees, unless otherwise stated)

234 Newgen Software Technologies Limited
Consolidated balance sheet As at 31 March 2017
As at 1 April 2016
Loans (89.49) (69.71)
Prepayments 80.48 62.07
Adjustment to retained earnings (9.52) (7.63)
D.8 Proposed dividend
Under the previous GAAP, dividends proposed by the board of directors after the balance sheet date
but before the approval of the financial statements were considered as adjusting events. Accordingly,
provision for proposed dividend (along with related dividend distribution tax) was recognised as a liability.
Under Ind AS, such dividends are recognised when the same is approved by the shareholders in the
general meeting. The impact arising from the change is summarised below:
Consolidated balance sheet As at 31 March 2017
As at 1 April 2016
Short term provision (775.78)
Adjustment to retained earnings 775.78
D.9 Remeasurements of post-employment benefit obligations
Under Ind AS, re-measurements i.e. actuarial gains and losses are directly recognized in equity through other
comprehensive income. Under the previous GAAP such gains and losses were recognized in profit or loss.
The impact arising from the change is summarised below:
Consolidated statement of profit and loss For the year ended
31 March 2017
Employee benefit expenses (82.88)
Adjustment before income tax (82.88)
Consolidated Other Comprehensive Income For the year ended
31 March 2017
Re-measurement gain/(loss) on defined benefit obligations 82.88
Adjustment before income tax 82.88
Consolidated balance sheet As at 31 March 2017
As at 1 April 2016
Other comprehensive income 82.88 -
Adjustment to retained earnings 82.88 -
D.10 Lease equalisation reserve
Under previous GAAP the Group equalise the escalation impact over the lease term. However under Ind AS,
if the escalation on lease rentals is line with inflation the straight lining of escalation impact is not required.
The impact arising from the change is summarised below:
Consolidated statement of profit and loss For the year ended
31 March 2017
Rent expenses 8.88
Adjustment before income tax 8.88
Notes to the consolidated financial statementsfor the year ended 31st March, 2018(All amounts are in lakhs of Indian Rupees, unless otherwise stated)

235ANNUAL REPORT 2017-18
CORPORATE REVIEW FINANCIAL STATEMENTSSTATUTORY REPORTS
Consolidated balance sheet As at 31 March 2017
As at 1 April 2016
Other current liabilities (10.39) (19.25)
Adjustment to retained earnings (10.39) (19.25)
D.11 Currency translation differences
As per Ind AS 101, an entity may deem that the cumulative translation differences for all foreign operations
to be zero as at the date of transition by transferring any such cumulative differences to retained earnings.
Accordingly, the group has opted to avail the above exemption. The impact arising from the change is
summarised below:
Consolidated balance sheet As at 31 March 2017
As at 1 April 2016
Foreign currency translation reserve - (327.34)
Adjustment to retained earnings - 327.34
D.12 Deferred tax adjustment
Previous GAAP requires deferred tax accounting using the income statement approach, which focuses
on differences between taxable profits and accounting profits for the period. Ind-AS 12 Income Taxes
requires entities to account for deferred taxes using the balance sheet approach, which focuses on
temporary differences between the carrying amount of an asset or liability in the balance sheet and its
tax base. The impact arising from the change is summarised below:
Consolidated statement of profit and loss For the year ended
31 March 2017
Deferred tax expense 98.94
Adjustment before income tax 98.94
Consolidated other comprehensive income For the year ended
31 March 2017
Tax impact (19.11)
Adjustment before income tax (19.11)
Consolidated balance sheet As at 31 March 2017
As at 1 April 2016
Deferred tax assets 1,357.25 1,437.58
Adjustment to retained earnings 1,357.25 1,437.58
Reconciliation of Equity as at 1 April 2016
Note As at 31 March 2016
(IGAAP)
Adjustment As at 1 April 2016
(IND AS)
ASSETSNon-current assetsProperty, plant and equipment D.6 5,592.82 700.14 6,292.96 Capital work-in-progress 604.61 - 604.61 Intangible assets 103.01 - 103.01
Financial assets
Loans D.7 & D.3 282.68 (71.71) 210.99
Notes to the consolidated financial statementsfor the year ended 31st March, 2018(All amounts are in lakhs of Indian Rupees, unless otherwise stated)
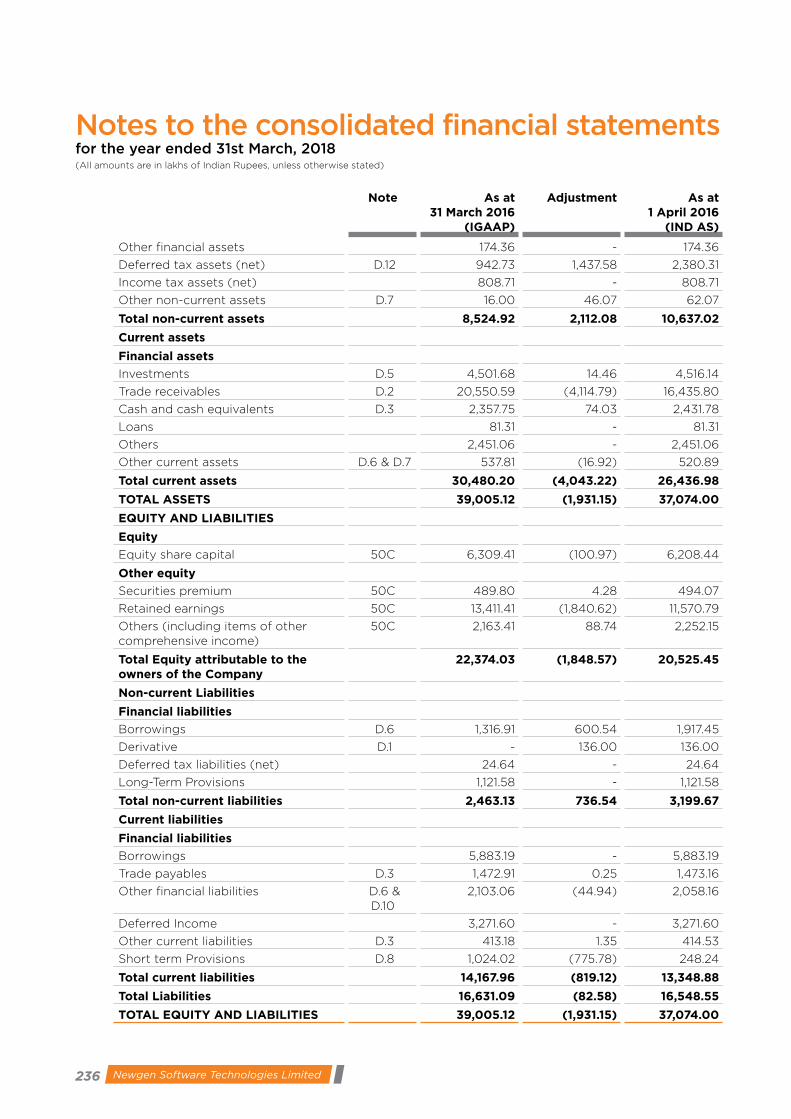
236 Newgen Software Technologies Limited
Note As at 31 March 2016
(IGAAP)
Adjustment As at 1 April 2016
(IND AS)
Other financial assets 174.36 - 174.36
Deferred tax assets (net) D.12 942.73 1,437.58 2,380.31
Income tax assets (net) 808.71 - 808.71
Other non-current assets D.7 16.00 46.07 62.07
Total non-current assets 8,524.92 2,112.08 10,637.02
Current assets
Financial assets
Investments D.5 4,501.68 14.46 4,516.14
Trade receivables D.2 20,550.59 (4,114.79) 16,435.80
Cash and cash equivalents D.3 2,357.75 74.03 2,431.78
Loans 81.31 - 81.31
Others 2,451.06 - 2,451.06
Other current assets D.6 & D.7 537.81 (16.92) 520.89
Total current assets 30,480.20 (4,043.22) 26,436.98
TOTAL ASSETS 39,005.12 (1,931.15) 37,074.00
EQUITY AND LIABILITIES
Equity
Equity share capital 50C 6,309.41 (100.97) 6,208.44
Other equity
Securities premium 50C 489.80 4.28 494.07
Retained earnings 50C 13,411.41 (1,840.62) 11,570.79
Others (including items of other comprehensive income)
50C 2,163.41 88.74 2,252.15
Total Equity attributable to the owners of the Company
22,374.03 (1,848.57) 20,525.45
Non-current Liabilities
Financial liabilities
Borrowings D.6 1,316.91 600.54 1,917.45
Derivative D.1 - 136.00 136.00
Deferred tax liabilities (net) 24.64 - 24.64
Long-Term Provisions 1,121.58 - 1,121.58
Total non-current liabilities 2,463.13 736.54 3,199.67
Current liabilities
Financial liabilities
Borrowings 5,883.19 - 5,883.19
Trade payables D.3 1,472.91 0.25 1,473.16
Other financial liabilities D.6 & D.10
2,103.06 (44.94) 2,058.16
Deferred Income 3,271.60 - 3,271.60
Other current liabilities D.3 413.18 1.35 414.53
Short term Provisions D.8 1,024.02 (775.78) 248.24
Total current liabilities 14,167.96 (819.12) 13,348.88
Total Liabilities 16,631.09 (82.58) 16,548.55
TOTAL EQUITY AND LIABILITIES 39,005.12 (1,931.15) 37,074.00
Notes to the consolidated financial statementsfor the year ended 31st March, 2018(All amounts are in lakhs of Indian Rupees, unless otherwise stated)
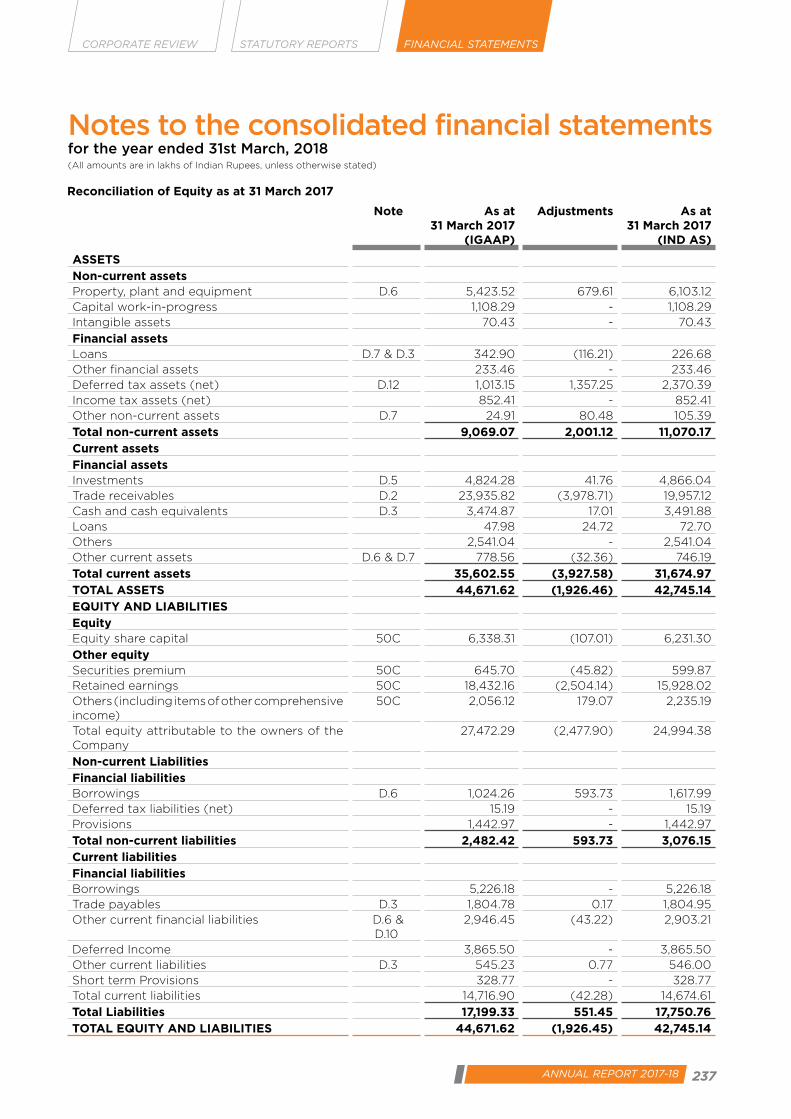
237ANNUAL REPORT 2017-18
CORPORATE REVIEW FINANCIAL STATEMENTSSTATUTORY REPORTS
Reconciliation of Equity as at 31 March 2017
Note As at 31 March 2017
(IGAAP)
Adjustments As at 31 March 2017
(IND AS)
ASSETSNon-current assetsProperty, plant and equipment D.6 5,423.52 679.61 6,103.12 Capital work-in-progress 1,108.29 - 1,108.29 Intangible assets 70.43 - 70.43
Financial assetsLoans D.7 & D.3 342.90 (116.21) 226.68 Other financial assets 233.46 - 233.46 Deferred tax assets (net) D.12 1,013.15 1,357.25 2,370.39 Income tax assets (net) 852.41 - 852.41 Other non-current assets D.7 24.91 80.48 105.39
Total non-current assets 9,069.07 2,001.12 11,070.17 Current assetsFinancial assetsInvestments D.5 4,824.28 41.76 4,866.04 Trade receivables D.2 23,935.82 (3,978.71) 19,957.12 Cash and cash equivalents D.3 3,474.87 17.01 3,491.88 Loans 47.98 24.72 72.70 Others 2,541.04 - 2,541.04 Other current assets D.6 & D.7 778.56 (32.36) 746.19
Total current assets 35,602.55 (3,927.58) 31,674.97 TOTAL ASSETS 44,671.62 (1,926.46) 42,745.14 EQUITY AND LIABILITIESEquity Equity share capital 50C 6,338.31 (107.01) 6,231.30
Other equitySecurities premium 50C 645.70 (45.82) 599.87 Retained earnings 50C 18,432.16 (2,504.14) 15,928.02 Others (including items of other comprehensive income)
50C 2,056.12 179.07 2,235.19
Total equity attributable to the owners of the Company
27,472.29 (2,477.90) 24,994.38
Non-current LiabilitiesFinancial liabilitiesBorrowings D.6 1,024.26 593.73 1,617.99 Deferred tax liabilities (net) 15.19 - 15.19 Provisions 1,442.97 - 1,442.97
Total non-current liabilities 2,482.42 593.73 3,076.15 Current liabilitiesFinancial liabilitiesBorrowings 5,226.18 - 5,226.18 Trade payables D.3 1,804.78 0.17 1,804.95 Other current financial liabilities D.6 &
D.10 2,946.45 (43.22) 2,903.21
Deferred Income 3,865.50 - 3,865.50 Other current liabilities D.3 545.23 0.77 546.00 Short term Provisions 328.77 - 328.77 Total current liabilities 14,716.90 (42.28) 14,674.61
Total Liabilities 17,199.33 551.45 17,750.76 TOTAL EQUITY AND LIABILITIES 44,671.62 (1,926.45) 42,745.14
Notes to the consolidated financial statementsfor the year ended 31st March, 2018(All amounts are in lakhs of Indian Rupees, unless otherwise stated)
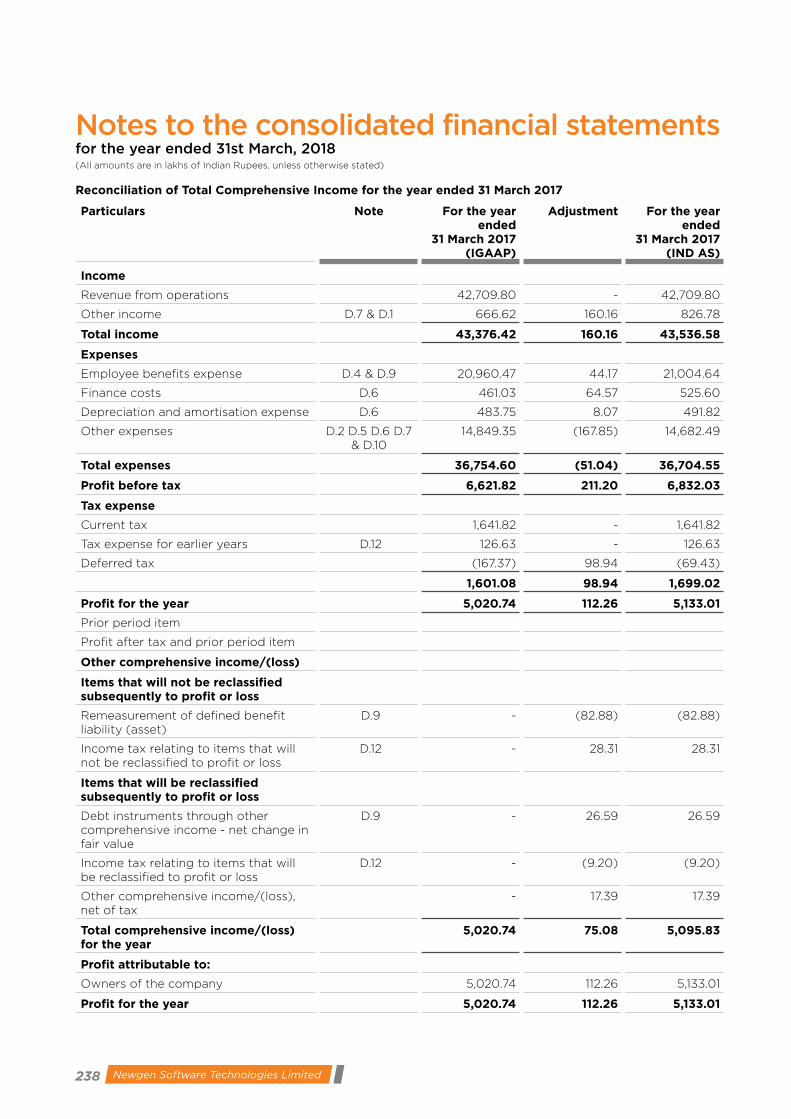
238 Newgen Software Technologies Limited
Reconciliation of Total Comprehensive Income for the year ended 31 March 2017
Particulars Note For the year ended
31 March 2017 (IGAAP)
Adjustment For the year ended
31 March 2017 (IND AS)
Income
Revenue from operations 42,709.80 - 42,709.80
Other income D.7 & D.1 666.62 160.16 826.78
Total income 43,376.42 160.16 43,536.58
Expenses
Employee benefits expense D.4 & D.9 20,960.47 44.17 21,004.64
Finance costs D.6 461.03 64.57 525.60
Depreciation and amortisation expense D.6 483.75 8.07 491.82
Other expenses D.2 D.5 D.6 D.7 & D.10
14,849.35 (167.85) 14,682.49
Total expenses 36,754.60 (51.04) 36,704.55
Profit before tax 6,621.82 211.20 6,832.03
Tax expense
Current tax 1,641.82 - 1,641.82
Tax expense for earlier years D.12 126.63 - 126.63
Deferred tax (167.37) 98.94 (69.43)
1,601.08 98.94 1,699.02
Profit for the year 5,020.74 112.26 5,133.01
Prior period item
Profit after tax and prior period item
Other comprehensive income/(loss)
Items that will not be reclassified subsequently to profit or loss
Remeasurement of defined benefit liability (asset)
D.9 - (82.88) (82.88)
Income tax relating to items that will not be reclassified to profit or loss
D.12 - 28.31 28.31
Items that will be reclassified subsequently to profit or loss
Debt instruments through other comprehensive income - net change in fair value
D.9 - 26.59 26.59
Income tax relating to items that will be reclassified to profit or loss
D.12 - (9.20) (9.20)
Other comprehensive income/(loss), net of tax
- 17.39 17.39
Total comprehensive income/(loss) for the year
5,020.74 75.08 5,095.83
Profit attributable to:
Owners of the company 5,020.74 112.26 5,133.01
Profit for the year 5,020.74 112.26 5,133.01
Notes to the consolidated financial statementsfor the year ended 31st March, 2018(All amounts are in lakhs of Indian Rupees, unless otherwise stated)
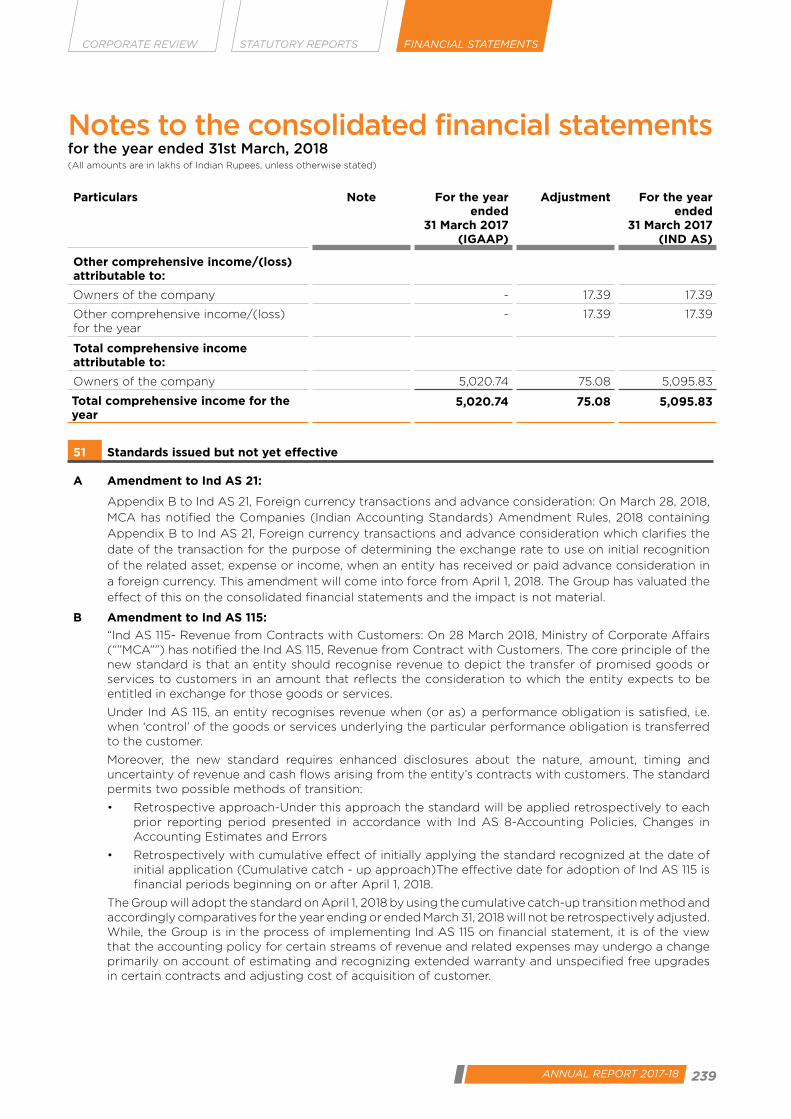
239ANNUAL REPORT 2017-18
CORPORATE REVIEW FINANCIAL STATEMENTSSTATUTORY REPORTS
Particulars Note For the year ended
31 March 2017 (IGAAP)
Adjustment For the year ended
31 March 2017 (IND AS)
Other comprehensive income/(loss) attributable to:
Owners of the company - 17.39 17.39
Other comprehensive income/(loss) for the year
- 17.39 17.39
Total comprehensive income attributable to:
Owners of the company 5,020.74 75.08 5,095.83
Total comprehensive income for the year
5,020.74 75.08 5,095.83
51 Standards issued but not yet effective
A Amendment to Ind AS 21:
Appendix B to Ind AS 21, Foreign currency transactions and advance consideration: On March 28, 2018,
MCA has notified the Companies (Indian Accounting Standards) Amendment Rules, 2018 containing
Appendix B to Ind AS 21, Foreign currency transactions and advance consideration which clarifies the
date of the transaction for the purpose of determining the exchange rate to use on initial recognition
of the related asset, expense or income, when an entity has received or paid advance consideration in
a foreign currency. This amendment will come into force from April 1, 2018. The Group has valuated the
effect of this on the consolidated financial statements and the impact is not material.
B Amendment to Ind AS 115:
“Ind AS 115- Revenue from Contracts with Customers: On 28 March 2018, Ministry of Corporate Affairs (“”MCA””) has notified the Ind AS 115, Revenue from Contract with Customers. The core principle of the new standard is that an entity should recognise revenue to depict the transfer of promised goods or services to customers in an amount that reflects the consideration to which the entity expects to be entitled in exchange for those goods or services.
Under Ind AS 115, an entity recognises revenue when (or as) a performance obligation is satisfied, i.e. when ‘control’ of the goods or services underlying the particular performance obligation is transferred to the customer.
Moreover, the new standard requires enhanced disclosures about the nature, amount, timing and uncertainty of revenue and cash flows arising from the entity’s contracts with customers. The standard permits two possible methods of transition:
• Retrospectiveapproach-Underthisapproachthestandardwillbeappliedretrospectivelytoeachprior reporting period presented in accordance with Ind AS 8-Accounting Policies, Changes in Accounting Estimates and Errors
• Retrospectivelywithcumulativeeffectofinitiallyapplyingthestandardrecognizedatthedateofinitial application (Cumulative catch - up approach)The effective date for adoption of Ind AS 115 is financial periods beginning on or after April 1, 2018.
The Group will adopt the standard on April 1, 2018 by using the cumulative catch-up transition method and accordingly comparatives for the year ending or ended March 31, 2018 will not be retrospectively adjusted. While, the Group is in the process of implementing Ind AS 115 on financial statement, it is of the view that the accounting policy for certain streams of revenue and related expenses may undergo a change primarily on account of estimating and recognizing extended warranty and unspecified free upgrades in certain contracts and adjusting cost of acquisition of customer.
Notes to the consolidated financial statementsfor the year ended 31st March, 2018(All amounts are in lakhs of Indian Rupees, unless otherwise stated)

240 Newgen Software Technologies Limited
52 Disclosure on Specified Bank Notes
The disclosures regarding details of specified bank notes held and transacted during 8 November 2016 to 30 December 2016 has not been made since the requirement does not pertain to financial year ended 31 March 2018. Corresponding amounts as appearing in the audited financial statements for the year ended 31 March 2017 have been disclosed as given below;
Particulars Specified Bank Notes*
Other denomination
notes
Total
Closing cash in hand as on 8 November 2016 3.96 1.25 5.21
Add: Withdrawal from bank account - 3.80 3.80
Add: Permitted receipts transactions - 1.24 1.24
Less: Permitted payments transactions - 3.60 3.60
Less: Amount deposited in banks accounts 3.96 - 3.96
Closing cash in hand as on 30 December 2016 - 2.69 2.69
For the purposes of this clause, the term ‘Specified Bank Notes’ shall have the same meaning provided in the notification of the Government of India, in the Ministry of Finance, Department of Economic Affairs number S.O. 3407(E), dated 8th November 2016.
53 As at 31 March 2018, the Company has gross foreign currency receivables amounting to Rs. 15,310.75 lakhs
(previous year Rs.14,344.84 lakhs). Out of these receivables, Rs.4,253.83 lakhs (previous year Rs.3,754.91
lakhs) is outstanding for more than 9 months. As per Foreign Exchange Management (Current Account)
Rules, 2000 read with Master Circular No. 14/ 2014-15 dated 1 July 2014, receipt for export goods should
be realized within a period of 9 months from the date of export. In case of receivables not being realised
within 15 months from the date of export, prior approval from Reserve Bank of India (RBI) is required.
As per the requirements of Foreign Exchange Management Act, in one calendar year, the Company is
allowed to seek extension for an amount equivalent to 10% of the average collection of the last 3 years
only and pursuant to the same, the Company has filed the extension for foreign currency receivables
amounting to Rs. 1,414.58 lakhs during the year. For remaining receivables, the Company is in the process
of applying for approval to seek extension of time beyond 9 months from export date. The management
is of the view that the Company will be able to obtain approvals from the authorities for realising such
funds beyond the stipulated timeline without levy of any penalties as it had bonafide reasons that caused
the delays in realization.
54 Additional information pursuant to Para 2 of general instruction for the preparation of consolidated financial statement
31 March 2018 31 March 2017 31 March 2016
As % of consolidated
net assets
Amount As % of consolidated
net assets
Amount As % of consolidated
net assets
Amount
Parent
Newgen Software Technologies Limited
98.64% 39,971.22 99.10% 24,769.14 100.05% 20,536.28
Indian Subsidiary
Newgen Computers Technologies Limited
0.14% 57.91 0.21% 53.68 0.24% 50.27
Notes to the consolidated financial statementsfor the year ended 31st March, 2018(All amounts are in lakhs of Indian Rupees, unless otherwise stated)
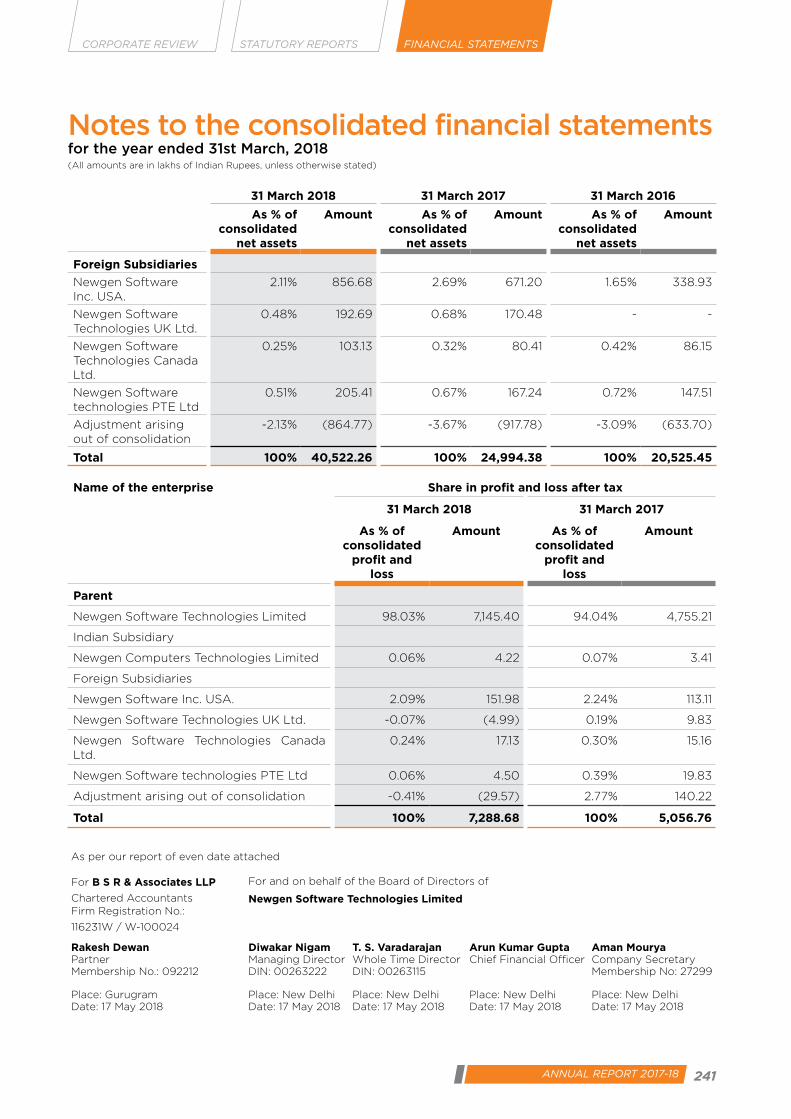
241ANNUAL REPORT 2017-18
CORPORATE REVIEW FINANCIAL STATEMENTSSTATUTORY REPORTS
31 March 2018 31 March 2017 31 March 2016
As % of consolidated
net assets
Amount As % of consolidated
net assets
Amount As % of consolidated
net assets
Amount
Foreign Subsidiaries
Newgen Software Inc. USA.
2.11% 856.68 2.69% 671.20 1.65% 338.93
Newgen Software Technologies UK Ltd.
0.48% 192.69 0.68% 170.48 - -
Newgen Software Technologies Canada Ltd.
0.25% 103.13 0.32% 80.41 0.42% 86.15
Newgen Software technologies PTE Ltd
0.51% 205.41 0.67% 167.24 0.72% 147.51
Adjustment arising out of consolidation
-2.13% (864.77) -3.67% (917.78) -3.09% (633.70)
Total 100% 40,522.26 100% 24,994.38 100% 20,525.45
Name of the enterprise Share in profit and loss after tax
31 March 2018 31 March 2017
As % of consolidated
profit and loss
Amount As % of consolidated
profit and loss
Amount
Parent
Newgen Software Technologies Limited 98.03% 7,145.40 94.04% 4,755.21
Indian Subsidiary
Newgen Computers Technologies Limited 0.06% 4.22 0.07% 3.41
Foreign Subsidiaries
Newgen Software Inc. USA. 2.09% 151.98 2.24% 113.11
Newgen Software Technologies UK Ltd. -0.07% (4.99) 0.19% 9.83
Newgen Software Technologies Canada Ltd.
0.24% 17.13 0.30% 15.16
Newgen Software technologies PTE Ltd 0.06% 4.50 0.39% 19.83
Adjustment arising out of consolidation -0.41% (29.57) 2.77% 140.22
Total 100% 7,288.68 100% 5,056.76
As per our report of even date attached
For B S R & Associates LLP For and on behalf of the Board of Directors of
Chartered Accountants Newgen Software Technologies LimitedFirm Registration No.:
116231W / W-100024
Rakesh Dewan Diwakar Nigam T. S. Varadarajan Arun Kumar Gupta Aman MouryaPartner Managing Director Whole Time Director Chief Financial Officer Company SecretaryMembership No.: 092212 DIN: 00263222 DIN: 00263115 Membership No: 27299
Place: Gurugram Place: New Delhi Place: New Delhi Place: New Delhi Place: New DelhiDate: 17 May 2018 Date: 17 May 2018 Date: 17 May 2018 Date: 17 May 2018 Date: 17 May 2018
Notes to the consolidated financial statementsfor the year ended 31st March, 2018(All amounts are in lakhs of Indian Rupees, unless otherwise stated)

Notes

Notes

Notes


Reinvent YouR WoRkplace
Newgen Software Technologies Limited
2017-18AnnuAl RepoRtNewgen Software Technologies Limited
https://newgensoft.com