newassessmentmethodsandthe characterisationoffutureconditions · pdf...
TRANSCRIPT

2New assessment methods and thecharacterisation of future conditions
Coordinating Lead Authors:Timothy R. Carter (Finland), Roger N. Jones (Australia), Xianfu Lu (UNDP/China)
Lead Authors:Suruchi Bhadwal (India), Cecilia Conde (Mexico), Linda O. Mearns (USA), Brian C. O’Neill (IIASA/USA), Mark D.A. Rounsevell (Belgium),
Monika B. Zurek (FAO/Germany)
Contributing Authors:Jacqueline de Chazal (Belgium), Stéphane Hallegatte (France), Milind Kandlikar (Canada), Malte Meinshausen (USA/Germany),
Robert Nicholls (UK), Michael Oppenheimer (USA), Anthony Patt (IIASA/USA), Sarah Raper (UK), Kimmo Ruosteenoja (Finland),
Claudia Tebaldi (USA), Detlef van Vuuren (The Netherlands)
Review Editors:Hans-Martin Füssel (Germany), Geoff Love (Australia), Roger Street (UK)
This chapter should be cited as:Carter, T.R., R.N. Jones, X. Lu, S. Bhadwal, C. Conde, L.O. Mearns, B.C. O’Neill, M.D.A. Rounsevell and M.B. Zurek, 2007: New
Assessment Methods and the Characterisation of Future Conditions. Climate Change 2007: Impacts, Adaptation and Vulnerability.
Contribution of Working Group II to the Fourth Assessment Report of the Intergovernmental Panel on Climate Change, M.L. Parry, O.F.
Canziani, J.P. Palutikof, P.J. van der Linden and C.E. Hanson, Eds., Cambridge University Press, Cambridge, UK, 133-171.
New assessment methods and the characterisation of future conditions Chapter 2
134
Executive summary.....................................................135
2.1 Introduction ........................................................135
2.2 New developments in approaches .................136
2.2.1 Frameworks for CCIAV assessment.......................136
2.2.2 Advances in impact assessment............................137
2.2.3 Advances in adaptation assessment .....................137
2.2.4 Advances in vulnerability assessment ...................138
2.2.5 Advances in integrated assessment ......................139
2.2.6 Development of risk-management frameworks.....139
2.2.7 Managing uncertainties and confidence levels......141
2.3 Development in methods .................................141
2.3.1 Thresholds and criteria for risk...............................141
2.3.2 Stakeholder involvement........................................141
2.3.3 Defining coping ranges ..........................................142
2.3.4 Communicating uncertainty and risk .....................143
2.3.5 Data needs for assessment....................................144
2.4 Characterising the future ................................144
2.4.1 Why and how do we characterise futureconditions?.............................................................144
2.4.2 Artificial experiments..............................................144
Box 2.1 Definitions of future characterisations .................145
2.4.3 Sensitivity analysis .................................................146
2.4.4 Analogues...............................................................146
2.4.5 Storylines ...............................................................146
2.4.6 Scenarios ...............................................................146
Box 2.2 The SRES global storylines and scenarios ..........147
Box 2.3 SRES-based climate scenarios assumedin this report ...........................................................149
Box 2.4 SRES-based projections of climatevariability and extremes .........................................152
Box 2.5 SRES-based sea-level scenarios.........................153
Box 2.6 SRES-based socio-economiccharacterisations...................................................155
Box 2.7 SRES-based land-use and land-covercharacterisations ..................................................157
Box 2.8 CO2 stabilisation and global meantemperature response ..........................................158
2.4.7 Large-scale singularities.........................................160
2.4.8 Probabilistic futures................................................160
2.5 Key conclusions and future directions .........161
References......................................................................162
Table of Contents
Executive summary
This chapter describes the significant developments in methodsand approaches for climate change impact, adaptation andvulnerability (CCIAV) assessment since the Third AssessmentReport (TAR). It also introduces some of the scenarios andapproaches to scenario construction that are used to characterisefuture conditions in the studies reported in this volume.
The growth of different approaches to assessing CCIAV hasbeen driven by the need for improved decision analysis.The recognition that a changing climate must be adapted to hasincreased the demand for policy-relevant information. Thestandard climate scenario-driven approach is used in a largeproportion of assessments described in this report, but the use ofother approaches is increasing. They include assessments ofcurrent and future adaptations to climate, adaptive capacity,social vulnerability, multiple stresses, and adaptation in thecontext of sustainable development. [2.2.1]
Risk management is a useful framework for decision-making and its use is expanding rapidly.The advantages of risk-management methods include the use offormalised methods to manage uncertainty, stakeholderinvolvement, use of methods for evaluating policy optionswithout being policy prescriptive, integration of differentdisciplinary approaches, and mainstreaming of climate changeconcerns into the broader decision-making context. [2.2.6]
Stakeholders bring vital inputs into CCIAV assessmentsabout a range of risks and their management.In particular, how a group or system can cope with currentclimate risks provides a solid basis for assessments of futurerisks. An increasing number of assessments involve, or areconducted by, stakeholders. This establishes credibility and helpsto confer ‘ownership’ of the results, which is a prerequisite foreffective risk management. [2.3.2]
The impacts of climate change can be strongly modified bynon-climate factors.Many new studies have applied socio-economic, land-use andtechnology scenarios at a regional scale derived from the globalscenarios developed in the IPCC Special Report on EmissionsScenarios (SRES). Large differences in regional population,income and technological development implied underalternative SRES storylines can produce sharp contrasts inexposure to climate change and in adaptive capacity andvulnerability. Therefore, it is best not to rely on a singlecharacterisation of future conditions. [2.4.6.4, 2.4.6.5]
Scenario information is increasingly being developed at afiner geographical resolution for use in CCIAV studies.A range of downscaling methods have been applied to the SRESstorylines, producing new regional scenarios of socio-economicconditions, land use and land cover, atmospheric composition,
climate and sea level. Regionalisation methods are increasinglybeing used to develop high spatial-resolution climate scenariosbased on coupled atmosphere-ocean general circulation model(AOGCM) projections. [2.4.6.1 to 2.4.6.5]
Characterisations of the future used in CCIAV studies areevolving to include mitigation scenarios, large-scalesingularities, and probabilistic futures.CCIAV studies assuming mitigated or stabilised futures arebeginning to assess the benefits (through impacts amelioratedor avoided) of climate policy decisions. Characterisations oflarge-scale singularities have been used to assess theirpotentially severe biophysical and socio-economicconsequences. Probabilistic characterisations of future socio-economic and climate conditions are increasingly becomingavailable, and probabilities of exceeding predefined thresholdsof impact have been more widely estimated. [2.4.6.8, 2.4.7,2.4.8]
2.1 Introduction
Assessments of climate change impacts, adaptation andvulnerability (CCIAV) are undertaken to inform decision-making in an environment of uncertainty. The demand for suchassessments has grown significantly since the release of theIPCC Third Assessment Report (TAR), motivating researchersto expand the ranges of approaches and methods in use, and ofthe characterisations of future conditions (scenarios and alliedproducts) required by those methods. This chapter describesthese developments as well as illustrating the main approachesused to characterise future conditions in the studies reported inthis volume.
In previous years, IPCC Working Group II1 has devoted aSpecial Report and two chapters to assessment methods (IPCC,1994; Carter et al., 1996; Ahmad et al., 2001). Moreover, theTAR also presented two chapters on the topic of scenarios(Carter et al., 2001; Mearns et al., 2001), which built on earlierdescriptions of climate scenario development (IPCC-TGCIA,1999). These contributions provide detailed descriptions ofassessment methods and scenarios, which are not repeated in thecurrent assessment.
In this chapter, an approach is defined as the overall scopeand direction of an assessment and can accommodate a varietyof different methods. A method is a systematic process ofanalysis. We identify five approaches to CCIAV in this chapter.Four are conventional research approaches: impact assessment,adaptation assessment, vulnerability assessment, and integratedassessment. The fifth approach, risk management, has emergedas CCIAV studies have begun to be taken up in mainstreampolicy-making.
Section 2.2 describes developments in the major approachesto CCIAV assessment, followed in Section 2.3 by discussion ofa range of new and improved methods that have been appliedsince the TAR. The critical issue of data needs for assessment is
Chapter 2 New assessment methods and the characterisation of future conditions
135
1 Hereafter, IPCC Working Groups I, II, and III are referred to as WG I, WG II, and WG III, respectively.

treated at the end of this section. Most CCIAV approaches havea scenario component, so recent advances in methods ofcharacterising future conditions are treated in Section 2.4. Sincemany recent studies evaluated in this volume use scenarios basedon the IPCC Special Report on Emissions Scenarios (SRES;Nakićenović et al., 2000) and derivative studies, boxed examplesare presented to illustrate some of these. Finally, in Section 2.5,we summarise the key new findings in the chapter andrecommend future research directions required to address majorscientific, technical and information deficiencies.
2.2 New developments in approaches
2.2.1 Frameworks for CCIAV assessment
Although the following approaches and methods were alldescribed in the TAR (Ahmad et al., 2001), their range ofapplication in assessments has since been significantly expanded.Factors that distinguish a particular approach include the purposeof an assessment, its focus, the methods available, and howuncertainty is managed. A major aim of CCIAV assessmentapproaches is to manage, rather than overcome, uncertainty(Schneider and Kuntz-Duriseti, 2002), and each approach has itsstrengths and weaknesses in that regard. Another important trendhas been the move from research-driven agendas to assessmentstailored towards decision-making, where decision-makers andstakeholders either participate in or drive the assessment (Wilbyet al., 2004a; UNDP, 2005).
The standard approach to assessment has been the climatescenario-driven ‘impact approach’, developed from the seven-step assessment framework of IPCC (1994).2 This approach,which dominated the CCIAV literature described in previousIPCC reports, aims to evaluate the likely impacts of climatechange under a given scenario and to assess the need foradaptation and/or mitigation to reduce any resultingvulnerability to climate risks. A large number of assessments inthis report also follow that structure.
The other approaches discussed are adaptation- andvulnerability-based approaches, integrated assessment, and riskmanagement. All are well represented in conventionalenvironmental research, but they are increasingly beingincorporated into mainstream approaches to decision-making,requiring a wider range of methods to fulfil objectives such as(SBI, 2001; COP, 2005):
• assessing current vulnerabilities and experience inadaptation,
• stakeholder involvement in dealing with extreme events,• capacity-building needs for future vulnerability and
adaptation assessments,• potential adaptation measures,• prioritisation and costing of adaptation measures,• interrelationships between vulnerability and adaptation
assessments,
• national development priorities and actions to integrateadaptation options into existing or future sustainabledevelopment plans.
The adaptation-based approach focuses on risk management byexamining the adaptive capacity and adaptation measuresrequired to improve the resilience or robustness of a systemexposed to climate change (Smit and Wandel, 2006). In contrast,the vulnerability-based approach focuses on the risks themselvesby concentrating on the propensity to be harmed, then seekingto maximise potential benefits and minimise or reverse potentiallosses (Adger, 2006). However, these approaches areinterrelated, especially with regard to adaptive capacity (O’Brienet al., 2006). Integrated approaches include integratedassessment modelling and other procedures for investigatingCCIAV across disciplines, sectors and scales, and representingkey interactions and feedbacks (e.g., Toth et al., 2003a, b). Risk-management approaches focus directly on decision-making andoffer a useful framework for considering the different researchapproaches and methods described in this chapter as well asconfronting, head on, the treatment of uncertainty, which ispervasive in CCIAV assessment. Risk-management andintegrated assessment approaches can also be linked directly tomitigation analysis (Nakićenović et al., 2007) and to the jointassessment of adaptation and mitigation (see Chapter 18).
Two common terms used to describe assessment types are ‘top-down’ and ‘bottom-up’, which can variously describe theapproach to scale, to subject matter (e.g., from stress to impact toresponse; from physical to socio-economic disciplines) and topolicy (e.g., national versus local); sometimes mixing two or moreof these (Dessai et al., 2004; see also Table 2.1). The standardimpact approach is often described as top-down because itcombines scenarios downscaled from global climate models tothe local scale (see Section 2.4.6) with a sequence of analyticalsteps that begin with the climate system and move throughbiophysical impacts towards socio-economic assessment. Bottom-up approaches are those that commence at the local scale byaddressing socio-economic responses to climate, which tend to belocation-specific (Dessai and Hulme, 2004). Adaptationassessment and vulnerability assessment are usually categorised asbottom-up approaches. However, assessments have becomeincreasingly complex, often combining elements of top-down andbottom-up approaches (e.g., Dessai et al., 2005a) and decision-making will utilise both (Kates and Wilbanks, 2003; McKenzieHedger et al., 2006). The United Nations DevelopmentProgramme’s Adaptation Policy Framework (UNDP APF: seeUNDP, 2005) has also identified a policy-based approach, whichassesses current policy and plans for their effectiveness underclimate change within a risk-management framework.
2.2.2 Advances in impact assessment
Application of the standard IPCC impact approach hasexpanded significantly since the TAR. The importance ofproviding a socio-economic and technological context forcharacterising future climate conditions has been emphasised,
New assessment methods and the characterisation of future conditions Chapter 2
136
2 The seven steps are: 1. Define problem, 2. Select method, 3. Test method/sensitivity, 4. Select scenarios, 5. Assess biophysical/socio-economicimpacts, 6. Assess autonomous adjustments, 7. Evaluate adaptation strategies.

and scenarios assuming no climate policy to restrict greenhousegas (GHG) emissions have been contrasted with those assumingGHG stabilisation (e.g., Parry et al., 2001; see also Sections2.4.6.4 and 2.4.6.8). The use of probabilities in impactassessments, presented as proof-of-concept examples in the TAR(Mearns et al., 2001), is now more firmly established (seeexamples in Section 2.4.8). Some other notable advances inimpact assessment include: a reassessment of bioclimatic niche-based modelling, meta-analyses summarising a range ofassessments, and new dynamic methods of analysing economicdamages. Nevertheless, the climate-sensitive resources of manyregions and sectors, especially in developing countries, have notyet been subject to detailed impact assessments.
Recent observational evidence of climatic warming, alongwith the availability of digital species distribution maps andgreatly extended computer power has emboldened a newgeneration of bioclimatic niche-based modellers to predictchanges in species distribution and prevalence under a warmingclimate using correlative methods (e.g., Bakkenes et al., 2002;Thomas et al., 2004; see also Chapter 4, Section 4.4.11).However, the application of alternative statistical techniques tothe same data sets has also exposed significant variations inmodel performance that have recently been the subject ofintensive debate (Pearson and Dawson, 2003; Thuiller et al.,2004; Luoto et al., 2005; Araújo and Rahbek, 2006) and shouldpromote a more cautious application of these models forprojecting future biodiversity.
A global-scale, meta-analysis of a range of studies fordifferent sectors was conducted by Hitz and Smith (2004) toevaluate the aggregate impacts at different levels of global meantemperature. For some sectors and regions, such as agriculture
and the coastal zone, sufficient information was available tosummarise aggregated sectoral impacts as a function of globalwarming. For other sectors, such as marine biodiversity andenergy, limited information allowed only broad conclusions oflow confidence.
Dynamic methods are superseding statistical methods in someeconomic assessments. Recent studies account, for example, forthe role of world markets in influencing climate change impactson global agriculture (Fischer et al., 2002), the effect on damagefrom sea-level rise when assuming optimal adaptation measures(Neumann et al., 2000; Nicholls and Tol, 2006), the added costsfor adapting to high temperatures due to uncertainties in projectedclimate (Hallegatte et al., 2007), and increasing long-term costs ofnatural disasters when explicitly accounting for altered extremeevent distributions (Hallegatte et al., 2006). The role of economicdynamics has also been emphasised (Fankhauser and Tol, 2005;Hallegatte, 2005; Hallegatte et al., 2006). Some new studiessuggest damage overestimations by previous assessments, whileothers suggest underestimations, leading to the conclusion thatuncertainty is likely to be larger than suggested by the range ofprevious estimates.
2.2.3 Advances in adaptation assessment
Significant advances in adaptation assessment have occurred,shifting its emphasis from a research-driven activity to onewhere stakeholders participate in order to improve decision-making. The key advance is the incorporation of adaptation topast and present climate. This has the advantage of anchoringthe assessment in what is already known, and can be used toexplore adaptation to climate variability and extremes, especially
Chapter 2 New assessment methods and the characterisation of future conditions
137
ApproachImpact Vulnerability Adaptation Integrated
Scientificobjectives
Impacts and risks underfuture climate
Processes affectingvulnerability toclimate change
Processes affectingadaptation andadaptive capacity
Interactions and feedbacks betweenmultiple drivers and impacts
Practical aims Actions to reduce risks Actions to reducevulnerability
Actions to improveadaptation
Global policy options and costs
Researchmethods
Standard approach to CCIAVDrivers-pressure-state-
impact-response (DPSIR)methods
Hazard-driven riskassessment
Vulnerability indicators and profilesPast and present climate risks
Livelihood analysisAgent-based methods
Narrative methodsRisk perception including critical thresholds
Development/sustainability policy performanceRelationship of adaptive capacity to sustainable
development
Integrated assessment modellingCross-sectoral interactionsIntegration of climate with other
driversStakeholder discussions Linking
models across types and scalesCombining assessment
approaches/methods
Spatialdomains
Top-downGlobal -› Local
Bottom-upLocal -› Regional
(macro-economic approaches are top-down)
Linking scalesCommonly global/regionalOften grid-based
Scenario types Exploratory scenarios ofclimate and other factors(e.g., SRES)
Normative scenarios (e.g.,stabilisation)
Socio-economic conditionsScenarios or inverse
methods
Baseline adaptationAdaptation analogues
from history, otherlocations, other activities
Exploratory scenarios: exogenousand often endogenous (includingfeedbacks)
Normative pathways
Motivation Research-driven Research-/stakeholder-driven Stakeholder-/research-driven
Research-/stakeholder-driven
Table 2.1. Some characteristics of different approaches to CCIAV assessment. Note that vulnerability and adaptation-based approaches are highlycomplementary.

if scenarios of future variability are uncertain or unavailable(Mirza, 2003b; UNDP, 2005). As such, adaptation assessmenthas accommodated a wide range of methods used in mainstreampolicy and planning. Chapter 17 of this volume discussesadaptation practices, the processes and determinants of adaptivecapacity, and limits to adaptation, highlighting the difficulty ofestablishing a general methodology for adaptation assessmentdue to the great diversity of analytical methods employed. Theseinclude the following approaches and methods.
• The scenario-based approach (e.g., IPCC, 1994; see alsoSection 2.2.1), where most impact assessments considerfuture adaptation as an output.
• Normative policy frameworks, exploring which adaptationsare socially and environmentally beneficial, and applyingdiverse methods, such as vulnerability analysis, scenarios,cost-benefit analysis, multi-criteria analysis and technologyrisk assessments (UNDP, 2005).
• Indicators, employing models of specific hypothesisedcomponents of adaptive capacity (e.g., Moss et al., 2001;Yohe and Tol, 2002; Brooks et al., 2005; Haddad, 2005).
• Economic modelling, anthropological and sociologicalmethods for identifying learning in individuals andorganisations (Patt and Gwata, 2002; Tompkins, 2005;Berkhout et al., 2006).
• Scenarios and technology assessments, for exploring whatkinds of adaptation are likely in the future (Dessai andHulme, 2004; Dessai et al., 2005a; Klein et al., 2005).
• Risk assessments combining current risks to climatevariability and extremes with projected future changes,utilising cost-benefit analysis to assess adaptation (e.g.,ADB, 2005).
Guidance regarding methods and tools to use in prioritisingadaptation options include the Compendium of Decision Tools(UNFCCC, 2004), the Handbook on Methods for ClimateChange Impact Assessment and Adaptation Strategies (Feenstraet al., 1998), and Costing the Impacts of Climate Change(Metroeconomica, 2004). A range of different methods can alsobe used with stakeholders (see Section 2.3.2).
The financing of adaptation has received minimal attention.Bouwer and Vellinga (2005) suggest applying more structureddecision-making to future disaster management and adaptationto climate change, sharing the risk between private and publicsources. Quiggin and Horowitz (2003) argue that the economiccosts will be dominated by the costs of adaptation, which dependon the rate of climate change, especially the occurrence ofclimate extremes, and that many existing analyses overlookthese costs (see also Section 2.2.2).
2.2.4 Advances in vulnerability assessment
Since the TAR, the IPCC definition of vulnerability3 has beenchallenged, both to account for an expanded remit by includingsocial vulnerability (O’Brien et al., 2004a) and to reconcile itwith risk assessment (Downing and Patwardhan, 2005).
Different states of vulnerability under climate risks include:vulnerability to current climate, vulnerability to climate changein the absence of adaptation and mitigation measures, andresidual vulnerability, where adaptive and mitigative capacitieshave been exhausted (e.g., Jones et al., 2007). A keyvulnerability has the potential for significant adverse affects onboth natural and human systems, as outlined in the UnitedNations Framework Convention on Climate Change(UNFCCC), thus contributing to dangerous anthropogenicinterference with the climate system (see Chapter 19). Füsseland Klein (2006) review and summarise these developments.
Vulnerability is highly dependent on context and scale, andcare should be taken to clearly describe its derivation andmeaning (Downing and Patwardhan, 2005) and to address theuncertainties inherent in vulnerability assessments (Patt et al.,2005). Frameworks should also be able to integrate the socialand biophysical dimensions of vulnerability to climate change(Klein and Nicholls, 1999; Polsky et al., 2003; Turner et al.,2003a). Formal methods for vulnerability assessment have alsobeen proposed (Ionescu et al., 2005; Metzger and Schröter,2006) but are very preliminary.
The methods and frameworks for assessing vulnerabilitymust also address the determinants of adaptive capacity (Turneret al., 2003a; Schröter et al., 2005a; O’Brien and Vogel, 2006;see also Chapter 17, Section 17.3.1) in order to examine thepotential responses of a system to climate variability and change.Many studies endeavour to do this in the context of humandevelopment, by aiming to understand the underlying causes ofvulnerability and to further strengthen adaptive capacities (e.g.,World Bank, 2006). In some quantitative approaches, theindicators used are related to adaptive capacity, such as nationaleconomic capacity, human resources, and environmentalcapacities (Moss et al., 2001; see also Section 2.2.3). Otherstudies include indicators that can provide information related tothe conditions, processes and structures that promote orconstrain adaptive capacity (Eriksen et al., 2005).
Vulnerability assessment offers a framework for policymeasures that focus on social aspects, including povertyreduction, diversification of livelihoods, protection of commonproperty resources and strengthening of collective action(O’Brien et al., 2004b). Such measures enhance the ability torespond to stressors and secure livelihoods under presentconditions, which can also reduce vulnerability to future climatechange. Community-based interactive approaches foridentifying coping potentials provide insights into the underlyingcauses and structures that shape vulnerability (O’Brien et al.,2004b). Other methods employed in recent regionalvulnerability studies include stakeholder elicitation and survey(Eakin et al., 2006; Pulhin et al., 2006), and multi-criteriamodelling (Wehbe et al., 2006).
Traditional knowledge of local communities represents animportant, yet currently largely under-used resource for CCIAVassessment (Huntington and Fox, 2005). Empirical knowledgefrom past experience in dealing with climate-related natural
New assessment methods and the characterisation of future conditions Chapter 2
138
3 The degree to which a system is susceptible to, or unable to cope with, adverse effects of climate change, including climate variability andextremes. Vulnerability is a function of the character, magnitude, and rate of climate variation to which a system is exposed, its sensitivity, andits adaptive capacity (IPCC, 2001b, Glossary).

disasters such as droughts and floods (Osman-Elasha et al.,2006), health crises (Wandiga et al., 2006), as well as longer-term trends in mean conditions (Huntington and Fox, 2005;McCarthy and Long Martello, 2005), can be particularly helpfulin understanding the coping strategies and adaptive capacity ofindigenous and other communities relying on oral traditions.
2.2.5 Advances in integrated assessment
Integrated assessment represents complex interactions acrossspatial and temporal scales, processes and activities. Integratedassessments can involve one or more mathematical models, butmay also represent an integrated process of assessment, linkingdifferent disciplines and groups of people. Managing uncertaintyin integrated assessments can utilise models ranging from simplemodels linking large-scale processes, through models ofintermediate complexity, to the complex, physically explicitrepresentation of Earth systems. This structure is characterisedby trade-offs between realism and flexibility, where simplemodels are more flexible but less detailed, and complex modelsoffer more detail and a greater range of output. No single theorydescribes and explains dynamic behaviour across scales in socio-economic and ecological systems (Rotmans and Rothman,2003), nor can a single model represent all the interactionswithin a single entity, or provide responses to questions in arapid turn-around time (Schellnhuber et al., 2004). Therefore,integration at different scales and across scales is required inorder to comprehensively assess CCIAV. Some specificadvances are outlined here; integration to assess climate policybenefits is considered in Section 2.2.6.
Cross-sectoral integration is required for purposes such asnational assessments, analysis of economic and trade effects,and joint population and climate studies. National assessmentscan utilise nationally integrated models (e.g., Izaurralde et al.,2003; Rosenberg et al., 2003; Hurd et al., 2004), or cansynthesise a number of disparate studies for policy-makers (e.g.,West and Gawith, 2005). Markets and trade can have significanteffects on outcomes. For example, a study assessing the globalimpacts of climate change on forests and forest products showedthat trade can affect efforts to stabilise atmospheric carbondioxide (CO2) and also affected regional welfare, with adverseeffects on those regions with high production costs (Perez-Garcia et al., 2002). New economic assessments of aggregatedclimate change damages have also been produced for multiplesectors (Tol, 2002a, b; Mendelsohn and Williams, 2004;Nordhaus, 2006). These have highlighted potentially largeregional disparities in vulnerability to impacts. Using anintegrated assessment general equilibrium model, Kemfert(2002) found that interactions between sectors acted to amplifythe global costs of climate change, compared with single-sectoranalysis.
Integration yields results that cannot be produced in isolation.For example, the Millennium Ecosystem Assessment assessedthe impact of a broad range of stresses on ecosystem services, ofwhich climate change was only one (Millennium EcosystemAssessment, 2005). Linked impact and vulnerabilityassessments can also benefit from a multiple stressors approach.For instance, the AIR-CLIM Project integrated climate and air
pollution impacts in Europe between 1995 and 2100, concludingthat that while the physical impacts were weakly coupled, thecosts of air pollution and climate change were strongly coupled.The indirect effects of climate policies stimulated cost reductionsin air pollution control of more than 50% (Alcamo et al., 2002).Some of the joint effects of extreme weather and air pollutionevents on human health are described in Chapter 8, Section8.2.6.
Earth system models of intermediate complexity that link theatmosphere, oceans, cryosphere, land system, and biosphere arebeing developed to assess impacts (particularly global-scale,singular events that may be considered dangerous) within a riskand vulnerability framework (Rial et al., 2004; see also Section2.4.7). Global climate models are also moving towards a morecomplete representation of the Earth system. Recent simulationsintegrating the atmosphere with the biosphere via a completecarbon cycle show the potential of the Amazon rainforest tosuffer dieback (Cox et al., 2004), leading to a positive feedbackthat decreases the carbon sink and increases atmospheric CO2concentrations (Friedlingstein et al., 2006; Denman et al., 2007).
2.2.6 Development of risk-managementframeworks
Risk management is defined as the culture, processes andstructures directed towards realising potential opportunitieswhilst managing adverse effects (AS/NZS, 2004). Risk isgenerally measured as a combination of the probability of anevent and its consequences (ISO/IEC, 2002; see also Figure 2.1),with several ways of combining these two factors being possible.There may be more than one event, consequences can rangefrom positive to negative, and risk can be measured qualitativelyor quantitatively.
To date, most CCIAV studies have assessed climate changewithout specific regard to how mitigation policy will influencethose impacts. However, the certainty that some climate changewill occur (and is already occurring – see Chapter 1) is drivingadaptation assessment beyond the limits of what scenario-drivenmethods can provide. The issues to be addressed includeassessing current adaptations to climate variability and extremesbefore assessing adaptive responses to future climate, assessingthe limits of adaptation, linking adaptation to sustainabledevelopment, engaging stakeholders, and decision-makingunder uncertainty. Risk management has been identified as aframework that can deal with all of these issues in a manner thatincorporates existing methodologies and that can alsoaccommodate other sources of risk (Jones, 2001; Willows andConnell, 2003; UNDP, 2005) in a process known asmainstreaming.
The two major forms of climate risk management are themitigation of climate change through the abatement of GHGemissions and GHG sequestration, and adaptation to theconsequences of a changing climate (Figure 2.1). Mitigationreduces the rate and magnitude of changing climate hazards;adaptation reduces the consequences of those hazards (Jones,2004). Mitigation also reduces the upper bounds of the range ofpotential climate change, while adaptation copes with the lowerbounds (Yohe and Toth, 2000). Hence they are complementary
Chapter 2 New assessment methods and the characterisation of future conditions
139

processes, but the benefits will accumulate over different time-scales and, in many cases, they can be assessed and implementedseparately (Klein et al., 2005). These complementarities anddifferences are discussed in Section 18.4 of this volume, whileintegrated assessment methods utilising a risk-managementapproach are summarised by Nakićenović et al. (2007).
Some of the standard elements within the risk-managementprocess that can be adapted to assess CCIAV are as follows.
• A scoping exercise, where the context of the assessment isestablished. This identifies the overall approach to be used.
• Risk identification, where what is at risk, who is at risk, themain climate and non-climate stresses contributing to therisk, and levels of acceptable risk are identified. This stepalso identifies the scenarios required for further assessment.
• Risk analysis, where the consequences and their likelihoodare analysed. This is the most developed area, with a rangeof methods used in mainstream risk assessment and CCIAVassessment being available.
• Risk evaluation, where adaptation and/or mitigationmeasures are prioritised.
• Risk treatment, where selected adaptation and/or mitigationmeasures are applied, with follow-up monitoring and review.
Two overarching activities are communication and consultationwith stakeholders, and monitoring and review. These activities
co-ordinate the management of uncertainty and ensure thatclarity and transparency surround the assumptions and conceptsbeing used. Other essential components of risk managementinclude investment in obtaining improved information andbuilding capacity for decision-making (adaptive governance: seeDietz et al., 2003).
Rather than being research-driven, risk management isoriented towards decision-making; e.g., on policy, planning, andmanagement options. Several frameworks have been developedfor managing risk, which use a variety of approaches as outlinedin Table 2.1. The UNDP Adaptation Policy Framework (UNDP,2005) describes risk-assessment methods that follow both thestandard impact and human development approaches focusingon vulnerability and adaptation (also see Füssel and Klein,2006). National frameworks constructed to deliver nationaladaptation strategies include those of the UK (Willows andConnell, 2003) and Australia (Australian Greenhouse Office,2006). The World Bank is pursuing methods for hazard and riskmanagement that focus on financing adaptation to climatechange (van Aalst, 2006) and mainstreaming climate change intonatural-hazard risk management (Burton and van Aalst, 2004;Mathur et al., 2004; Bettencourt et al., 2006).
Therefore, risk management is an approach that is beingpursued for the management of climate change risks at a range
New assessment methods and the characterisation of future conditions Chapter 2
140
Figure 2.1. Synthesis of risk-management approaches to global warming. The left side shows the projected range of global warming from the TAR(bold lines) with zones of maximum benefit for adaptation and mitigation depicted schematically. The right side shows likelihood based onthreshold exceedance as a function of global warming and the consequences of global warming reaching that particular level based on resultsfrom the TAR. Risk is a function of probability and consequence. The primary time horizons of approaches to CCIAV assessment are also shown(modified from Jones, 2004).

of scales; from the global (mitigation to achieve ‘safe’ levels ofGHG emissions and concentrations, thus avoiding dangerousanthropogenic interference), to the local (adaptation at the scaleof impact), to mainstreaming risk with a multitude of otheractivities.
2.2.7 Managing uncertainties and confidence levels
CCIAV assessments aim to understand and manage as muchof the full range of uncertainty, extending from emissions throughto vulnerability (Ahmad et al., 2001), as is practicable, in orderto improve the decision-making process. At the same time, aprimary aim of scientific investigations is to reduce uncertaintythrough improved knowledge. However, such investigations donot necessarily reduce the uncertainty range as used by CCIAVassessments. A phenomenon or process is usually describedqualitatively before it can be quantified with any confidence;some, such as aspects of socio-economic futures, may never bewell quantified (Morgan and Henrion, 1990). Often a scientificadvance will expand a bounded range of uncertainty as a newprocess is quantified and incorporated into the chain ofconsequences contributing to that range. Examples include anexpanded range of future global warming due to positive CO2feedbacks, from the response of vegetation to climate change (seeSection 2.2.5; WG I SPM), and a widened range of future impactsthat can be incurred by incorporating development futures inintegrated impact assessments, particularly if adaptation isincluded (see Section 2.4.6.4). In such cases, although uncertaintyappears to be expanding, this is largely because the underlyingprocess is becoming better understood.
The variety of different approaches developed and appliedsince the TAR all have their strengths and weaknesses. Theimpact assessment approach is particularly susceptible toballooning uncertainties because of the limits of prediction (e.g.,Jones 2001). Probabilistic methods and the use of thresholds aretwo ways in which these uncertainties are being managed (Jonesand Mearns, 2005; see also Section 2.4.8). Another way tomanage uncertainties is through participatory approaches,resulting in learning-by-observation and learning-by-doing, aparticular strength of vulnerability and adaptation approaches(e.g., Tompkins and Adger, 2005; UNDP, 2005). Stakeholderparticipation establishes credibility and stakeholders are morelikely to ‘own’ the results, increasing the likelihood of successfuladaptation (McKenzie Hedger et al., 2006).
2.3 Development in methods
2.3.1 Thresholds and criteria for risk
The risks of climate change for a given exposure unit can bedefined by criteria that link climate impacts to potentialoutcomes. This allows a risk to be analysed and managementoptions to be evaluated, prioritised, and implemented. Criteriaare usually specified using thresholds that denote some limit oftolerable risk. A threshold marks the point where stress on anexposed system or activity, if exceeded, results in a non-linear
response in that system or activity. Two types of thresholds areused in assessing change (Kenny et al., 2000; Jones 2001; seealso Chapter 19, Section 19.1.2.5):1. a non-linear change in state, where a system shifts from one
identifiable set of conditions to another (systemic threshold);2. a level of change in condition, measured on a linear scale,
regarded as ‘unacceptable’ and inviting some form ofresponse (impact threshold).
Thresholds used to assess risk are commonly value-laden, ornormative. A systemic threshold can often be objectivelymeasured; for example, a range of estimates of global meanwarming is reported in Meehl et al. (2007) defining the point atwhich irreversible melting of the Greenland Ice Sheet wouldcommence. If a policy aim were to avoid its loss, selecting fromthe given range a critical level of warming that is not to beexceeded would require a value judgement. In the case of animpact threshold, the response is the non-linear aspect; forexample, a management threshold (Kenny et al., 2000).Exceeding a management threshold will result in a change oflegal, regulatory, economic, or cultural behaviour. Hence, bothcases introduce critical thresholds (IPCC, 1994; Parry et al.,1996; Pittock and Jones, 2000), where criticality exceeds, inrisk-assessment terms, the level of tolerable risk. Criticalthresholds are used to define the coping range (see Section2.3.3).
Thresholds derived with stakeholders avoid the pitfall ofresearchers ascribing their own values to an assessment (Kennyet al., 2000; Pittock and Jones, 2000; Conde and Lonsdale,2005). Stakeholders thus become responsible for themanagement of the uncertainties associated with that thresholdthrough ownership of the assessment process and its outcomes(Jones, 2001). The probability of threshold exceedance is beingused in risk analyses (Jones, 2001, 2004) on local and globalscales. For example, probabilities of critical thresholds for coralbleaching and mortality for sites in the Great Barrier Reef as afunction of global warming show that catastrophic bleachingwill occur biennially with a warming of about 2°C (Jones, 2004).Further examples are given in Section 2.4.8. At a global scale,the risk of exceeding critical thresholds has been estimatedwithin a Bayesian framework, by expressing global warmingand sea-level rise as cumulative distribution functions that aremuch more likely to be exceeded at lower levels than higherlevels (Jones, 2004; Mastrandrea and Schneider, 2004; Yohe,2004). However, although this may be achieved for key globalvulnerabilities, there is often no straightforward way to integratelocal critical thresholds into a ‘mass’ damage function of manydifferent metrics across a wide range of potential impacts(Jacoby, 2004).
2.3.2 Stakeholder involvement
Stakeholder involvement is crucial to risk, adaptation, andvulnerability assessments because it is the stakeholders who willbe most affected and thus may need to adapt (Burton et al., 2002;Renn, 2004; UNDP, 2005). Stakeholders are characterised asindividuals or groups who have anything of value (bothmonetary and non-monetary) that may be affected by climatechange or by the actions taken to manage anticipated climate
Chapter 2 New assessment methods and the characterisation of future conditions
141

risks. They might be policy-makers, scientists, communities,and/or managers in the sectors and regions most at risk both nowand in the future (Rowe and Frewer, 2000; Conde and Lonsdale,2005).
Individual and institutional knowledge and expertisecomprise the principal resources for adapting to the impacts ofclimate change. Adaptive capacity is developed if people havetime to strengthen networks, knowledge, and resources, and thewillingness to find solutions (Cohen, 1997; Cebon et al., 1999;Ivey et al., 2004). Kasperson (2006) argues that the success ofstakeholder involvement lies not only in informing interestedand affected people, but also in empowering them to act on theenlarged knowledge. Through an ongoing process of negotiationand modification, stakeholders can assess the viability ofadaptive measures by integrating scientific information into theirown social, economic, cultural, and environmental context (vanAsselt and Rotmans, 2002; see also Chapter 18, Section 18.5).However, stakeholder involvement may occur in a context wherepolitical differences, inequalities, or conflicts may be raised;researchers must accept that it is not their role to solve thoseconflicts, unless they want to be part of them (Conde andLonsdale, 2005). Approaches to stakeholder engagement varyfrom passive interactions, where the stakeholders only provideinformation, to a level where the stakeholders themselves initiateand design the process (Figure 2.2).
Current adaptation practices for climate risks are beingdeveloped by communities, governments, Non-GovernmentalOrganisations (NGOs), and other organised stakeholders toincrease their adaptive capacity (Ford and Smit, 2004; Thomallaet al., 2005; Conde et al., 2006). Indigenous knowledge studiesare a valuable source of information for CCIAV assessments,especially where formally collected and recorded data are sparse(Huntington and Fox, 2005). Stakeholders have a part to play in
scenario development (Lorenzoni et al., 2000; Bärlund andCarter, 2002) and participatory modelling (e.g., Welp, 2001; vanAsselt and Rijkens-Klomp, 2002).
Stakeholders are also central in assessing future needs fordeveloping policies and measures to adapt (Nadarajah andRankin, 2005). These needs have been recognised in regionaland national approaches to assessing climate impacts andadaptation, including the UK Climate Impacts Programme(UKCIP) (West and Gawith, 2005), the US National Assessment(National Assessment Synthesis Team 2000; Parson et al., 2003),the Arctic Climate Impact Assessment (ACIA, 2005), theFinnish National Climate Change Adaptation Strategy (Marttilaet al., 2005) and the related FINADAPT research consortium(Kankaanpää et al., 2005), and the Mackenzie Basin ImpactStudy (Cohen, 1997).
2.3.3 Defining coping ranges
The coping range of climate (Hewitt and Burton, 1971) isdescribed in the TAR as the capacity of systems to accommodatevariations in climatic conditions (Smith et al., 2001), and thusserves as a suitable template for understanding the relationshipbetween changing climate hazards and society. The concept ofthe coping range has since been expanded to incorporateconcepts of current and future adaptation, planning and policyhorizons, and likelihood (Yohe and Tol, 2002; Willows andConnell, 2003; UNDP, 2005). It can therefore serve as aconceptual model (Morgan et al., 2001) which can be used tointegrate analytical techniques with a broader understanding ofclimate-society relationships (Jones and Mearns, 2005).
The coping range is used to link the understanding of currentadaptation to climate with adaptation needs under climatechange. It is a useful mental model to use with stakeholders –
New assessment methods and the characterisation of future conditions Chapter 2
142
Figure 2.2. Ladder of stakeholder participation (based on Pretty et al., 1995; Conde and Lonsdale, 2005).

who often have an intuitive understanding of which risks can becoped with and which cannot – that can subsequently bedeveloped into a quantitative model (Jones and Boer, 2005). Itcan be depicted as one or more climatic or climate-relatedvariables upon which socio-economic responses are mapped(Figure 2.3). The core of the coping range contains beneficialoutcomes. Towards one or both edges of the coping range,outcomes become negative but tolerable. Beyond the copingrange, the damages or losses are no longer tolerable and denotea vulnerable state, the limits of tolerance describing a criticalthreshold (left side of Figure 2.3). A coping range is usuallyspecific to an activity, group, and/or sector, although society-wide coping ranges have been proposed (Yohe and Tol, 2002).
Risk is assessed by calculating how often the coping range isexceeded under given conditions. Climate change may increasethe risk of threshold exceedance but adaptation can amelioratethe adverse effects by widening the coping range (right side ofFigure 2.3). For example, Jones (2001) constructed criticalthresholds for the Macquarie River catchment in Australia forirrigation allocation and environmental flows. The probabilityof exceeding these thresholds was a function of both naturalclimate variability and climate change. Yohe and Tol (2002)explored hypothetical upper and lower critical thresholds for theRiver Nile using current and historical streamflow data. Theupper threshold denoted serious flooding, and the lowerthreshold the minimum flow required to supply water demand.Historical frequency of exceedance served as a baseline fromwhich to measure changing risks using a range of climatescenarios.
2.3.4 Communicating uncertainty and risk
Communicating risk and uncertainty is a vital part of helpingpeople respond to climate change. However, people often rely onintuitive decision-making processes, or heuristics, in solvingcomplicated problems of judgement and decision-making(Tversky and Kahneman, 1974). In many cases, these heuristicsare surprisingly successful in leading to successful decisions
under information and time constraints (Gigerenzer, 2000;Muramatsu and Hanich, 2005). In other cases, heuristics canlead to predictable inconsistencies or errors of judgement (Slovicet al., 2004). For example, people consistently overestimate thelikelihood of low-probability events (Kahneman and Tversky,1979; Kammen et al., 1994), resulting in choices that mayincrease their exposure to harm (Thaler and Johnson, 1990).These deficiencies in human judgement in the face ofuncertainty are discussed at length in the TAR (Ahmad et al.,2001).
Participatory approaches establish a dialogue betweenstakeholders and experts, where the experts can explain theuncertainties and the ways they are likely to be misinterpreted,the stakeholders can explain their decision-making criteria, andthe two parties can work together to design a risk-managementstrategy (Fischoff, 1996; Jacobs, 2002; NRC, 2002). Becausestakeholders are often the decision-makers themselves (Kellyand Adger, 2000), the communication of impact, adaptation, andvulnerability assessment has become more important (Jacobs,2002; Dempsey and Fisher, 2005; Füssel and Klein, 2006).Adaptation decisions also depend on changes occurring outsidethe climate change arena (Turner et al., 2003b).
If the factors that give rise to the uncertainties are described(Willows and Connell, 2003), stakeholders may view thatinformation as more credible because they can make their ownjudgements about its quality and accuracy (Funtowicz andRavetz, 1990). People will remember and use uncertaintyassessments when they can mentally link the uncertainty andevents in the world with which they are familiar; assessments ofclimate change uncertainty are more memorable, and hencemore influential, when they fit into people’s pre-existing mentalmaps of experience of climate variability, or when sufficientdetail is provided to help people to form new mental models(Hansen, 2004). This can be aided by the development of visualtools that can communicate impacts, adaptation, andvulnerability to stakeholders while representing uncertainty inan appropriate manner (e.g., Discovery Software, 2003;Aggarwal et al., 2006).
Chapter 2 New assessment methods and the characterisation of future conditions
143
Figure 2.3. Idealised version of a coping range showing the relationship between climate change and threshold exceedance, and how adaptationcan establish a new critical threshold, reducing vulnerability to climate change (modified from Jones and Mearns, 2005).

2.3.5 Data needs for assessment
Although considerable advances have been made in thedevelopment of methods and tools for CCIAV assessment (seeprevious sections), their application has been constrained bylimited availability and access to good-quality data (e.g.,Briassoulis, 2001; UNFCCC, 2005; see also Chapter 3, Section3.8; Chapter 6, Section 6.6; Chapter 7, Section 7.8; Chapter 8,Section, 8.8; Chapter 9, Section 9.5; Chapter 10, Section 10.8;Chapter 12, Section 12.8; Chapter 13, Section 13.5; Chapter 15,Section 15.4; Chapter 16, Section 16.7).
In their initial national communications to the UNFCCC, alarge number of non-Annex I countries reported on the lack ofappropriate institutions and infrastructure to conduct systematicdata collection, and poor co-ordination within and/or betweendifferent government departments and agencies (UNFCCC,2005). Significant gaps exist in the geographical coverage andmanagement of existing global and regional Earth-observingsystems and in the efforts to retrieve the available historical data.These are especially acute in developing-country regions such asAfrica, where lack of funds for modern equipment andinfrastructure, inadequate training of staff, high maintenancecosts, and issues related to political instability and conflict aremajor constraints (IRI, 2006). As a result, in some regions,observation systems have been in decline (e.g., GCOS, 2003;see also Chapter 16, Section 16.7).
Major deficiencies in data provision for socio-economic andhuman systems indicators have been reported as a key barrier toa better understanding of nature-society dynamics in bothdeveloped and developing countries (Wilbanks et al., 2003; butsee Nordhaus, 2006). Recognising the importance of data andinformation for policy decisions and risk management under achanging climate, new programmes and initiatives have been putin place to improve the provision of data across disciplines andscales. Prominent among these, the Global Earth ObservationSystem of Systems (GEOSS) plan (Group on Earth Observations,2005) was launched in 2006, with a mission to help all 61involved countries produce and manage Earth observational data.The Centre for International Earth Science Information Network(CIESIN) provides a wide range of environmental and socio-economic data products.4 In addition, the IPCC Data DistributionCentre (DDC), overseen by the IPCC Task Group on Data andScenario Support for Impact and Climate Analysis (TGICA),hosts various sets of outputs from coupled Atmosphere-OceanGeneral Circulation Models (AOGCMs), along withenvironmental and socio-economic data for CCIAV assessments(Parry, 2002). New sources of data from remote sensing are alsobecoming available (e.g., Justice et al., 2002), which could fill thegaps where no ground-based data are available but which requireresourcing to obtain access. New and updated observational datasets and their deficiencies are also detailed in the WG I report forclimate (Trenberth et al., 2007) and sea level (Bindoff et al., 2007).
Efforts are also being made to record human-environmentinteractions in moderated online databases. For instance, the
DesInventar database5 records climatic disasters of the recentpast in Latin America, documenting not only the adverseclimatic events themselves, but also the consequences of theseevents and the parties affected. Information on local copingstrategies applied by different communities and sectors is beingrecorded by the UNFCCC.6
Many assessments are now obtaining data throughstakeholder elicitation and survey methods. For example, inmany traditional societies a large number of social interactionsmay not be recorded by bureaucratic processes, but knowledgeof how societies adapt to climate change, perceive risk, andmeasure their vulnerability is held by community members (e.g.,Cohen, 1997; ACIA, 2005; see also Section 2.3.2). Even in data-rich situations, it is likely that some additional data fromstakeholders will be required. However, this also requiresadequate resourcing.
2.4 Characterising the future
2.4.1 Why and how do we characterise futureconditions?
Evaluations of future climate change impacts, adaptation, andvulnerability require assumptions, whether explicit or implicit,about how future socio-economic and biophysical conditions willdevelop. The literature on methods of characterising the futurehas grown in tandem with the literature on CCIAV, but thesemethods have not been defined consistently across differentresearch communities. Box 2.1 presents a consistent typology ofcharacterisations that expands on the definitions presented in theTAR (Carter et al., 2001), for the purpose of clarifying the use ofthis terminology in this chapter. Although they may overlap,different types of characterisations of the future can be usefullydistinguished in terms of their plausibility and ascription oflikelihood, on the one hand, and the comprehensiveness of theirrepresentation, on the other (see Box 2.1 for definitions). Sincethe TAR, comprehensiveness has increased and ascriptions oflikelihood have become more common. The following sectionsmake use of the typology in Box 2.1 to address notable advancesin methods of characterising the future.
2.4.2 Artificial experiments
The most significant advance in artificial experiments since theTAR is the development of a new set of commitment runs byAOGCMs. These are climate change projections that assume thatthe radiative forcing at a particular point in time (often the currentforcing) is held constant into the future (Meehl et al., 2007). Theprojections demonstrate the time-lags in the climate response tochanges in radiative forcing (due to the delayed penetration ofheat into the oceans), and of sea level to warming. Recentexperiments estimate a global mean warming commitment
New assessment methods and the characterisation of future conditions Chapter 2
144
4 http://www.ciesin.org/index.html5 http://www.desinventar.org/desinventar.html6 http://maindb.unfccc.int/public/adaptation

Chapter 2 New assessment methods and the characterisation of future conditions
145
Box 2.1. Definitions of future characterisations
Figure 2.4 illustrates the relationships among the categories of future characterisations most commonly used in CCIAV studies.Because definitions vary across different fields, we present a single consistent typology for use in this chapter. Categories aredistinguished according to comprehensiveness and plausibility.
Comprehensiveness indicates the degree to which a characterisation of the future captures the various aspects of the socio-economic/biophysical system it aims to represent. Secondarily, it indicates the detail with which any single element is characterised.
Plausibility is a subjective measure of whether acharacterisation of the future is possible.Implausible futures are assumed to have zero ornegligible likelihood. Plausible futures can befurther distinguished by whether a specificlikelihood is ascribed or not.
Artificial experiment. A characterisation of thefuture constructed without regard to plausibility(and hence often implausible) that follows acoherent logic in order to study a process orcommunicate an insight. Artificial experimentsrange in comprehensiveness from simple thoughtexperiments to detailed integrated modellingstudies.
Sensitivity analysis. Sensitivity analyses employcharacterisations that involve arbitrary orgraduated adjustments of one or severalvariables relative to a reference case. These
adjustments may be plausible (e.g., changes are of a realistic magnitude) or implausible (e.g., interactions between the adjustedvariables are ignored), but the main aim is to explore model sensitivity to inputs, and possibly uncertainty in outputs.
Analogues. Analogues are based on recorded conditions that are considered to adequately represent future conditions in a studyregion.These records can be of past conditions (temporal analogues) or from another region (spatial analogues). Their selection isguided by information from sources such as AOGCMs; they are used to generate detailed scenarios which could not be realisticallyobtained by other means. Analogues are plausible in that they reflect a real situation, but may be implausible because no two placesor periods of time are identical in all respects.
Scenarios. A scenario is a coherent, internally consistent, and plausible description of a possible future state of the world (IPCC, 1994;Nakicenovic et al., 2000; Raskin et al., 2005). Scenarios are not predictions or forecasts (which indicate outcomes considered mostlikely), but are alternative images without ascribed likelihoods of how the future might unfold. They may be qualitative, quantitative,or both. An overarching logic often relates several components of a scenario, for example a storyline and/or projections of particularelements of a system. Exploratory (or descriptive) scenarios describe the future according to known processes of change, or asextrapolations of past trends (Carter et al., 2001). Normative (or prescriptive) scenarios describe a pre-specified future, eitheroptimistic, pessimistic, or neutral (Alcamo, 2001), and a set of actions that might be required to achieve (or avoid) it. Such scenariosare often developed using an inverse modelling approach, by defining constraints and then diagnosing plausible combinations ofthe underlying conditions that satisfy those constraints (see Nakicenovic et al., 2007).
Storylines. Storylines are qualitative, internally consistent narratives of how the future may evolve. They describe the principal trendsin socio-political-economic drivers of change and the relationships between these drivers. Storylines may be stand-alone, but moreoften underpin quantitative projections of future change that, together with the storyline, constitute a scenario.
Projection. A projection is generally regarded as any description of the future and the pathway leading to it. However, here we definea projection as a model-derived estimate of future conditions related to one element of an integrated system (e.g., an emission, aclimate, or an economic growth projection). Projections are generally less comprehensive than scenarios, even if the projectedelement is influenced by other elements. In addition, projections may be probabilistic, while scenarios do not ascribe likelihoods.
Probabilistic futures. Futures with ascribed likelihoods are probabilistic. The degree to which the future is characterised inprobabilistic terms can vary widely. For example, conditional probabilistic futures are subject to specific and stated assumptions abouthow underlying assumptions are to be represented. Assigned probabilities may also be imprecise or qualitative.
Figure 2.4. Characterisations of the future.

associated with radiative forcing in 2000 of about 0.6°C by 2100(Meehl et al., 2007). Sea-level rise due to thermal expansion of theoceans responds much more slowly, on a time-scale of millennia;committed sea-level rise is estimated at between 0.3 and 0.8 mabove present levels by 2300, assuming concentrations stabilisedat A1B levels in 2100 (Meehl et al., 2007). However, thesecommitment runs are unrealistic because the instantaneousstabilisation of radiative forcing is implausible, implying anunrealistic change in emission rates (see Nakićenović et al., 2007).They are therefore only suitable for setting a lower bound onimpacts seen as inevitable (Parry et al., 1998).
2.4.3 Sensitivity analysis
Sensitivity analysis (see Box 2.1) is commonly applied in manymodel-based CCIAV studies to investigate the behaviour of asystem, assuming arbitrary, often regularly spaced, adjustmentsin important driving variables. It has become a standard techniquein assessing sensitivity to climatic variations, enabling theconstruction of impact response surfaces over multi-variateclimate space (e.g., van Minnen et al., 2000; Miller et al., 2003).Response surfaces are increasingly constructed in combinationwith probabilistic representations of future climate to assess riskof impact (see Section 2.4.8). Sensitivity analysis samplinguncertainties in emissions, natural climate variability, climatechange projections, and climate impacts has been used to evaluatethe robustness of proposed adaptation measures for water resourcemanagement by Dessai (2005). Sensitivity analysis has also beenused as a device for studying land-use change, by applyingarbitrary adjustments to areas, such as +10% forest, −10%cropland, where these area changes are either spatially explicit(Shackley and Deanwood, 2003) or not (Ott and Uhlenbrook,2004; van Beek and van Asch, 2004; Vaze et al., 2004).
2.4.4 Analogues
Temporal and spatial analogues are applied in a range ofCCIAV studies. The most common of recently reported temporalanalogues are historical extreme weather events. These types ofevent may recur more frequently under anthropogenic climatechange, requiring some form of adaptation measure. Thesuitability of a given climate condition for use as an analoguerequires specialist judgement of its utility (i.e., how well itrepresents the key weather variables affecting vulnerability) andits meteorological plausibility (i.e., how well it replicatesanticipated future climate conditions). Examples of extremeevents judged likely or very likely by the end of the century (seeTable 2.2) that might serve as analogues include the European2003 heatwave (see Chapter 12, Section 12.6.1) and floodingevents related to intense summer precipitation in Bangladesh(Mirza, 2003a) and Norway (Næss et al., 2005). Other extremeevents suggested as potential analogues, but about which thelikelihood of future changes is poorly known (Christensen et al.,2007a), include El Niño-Southern Oscillation (ENSO)-relatedevents (Glantz, 2001; Heslop-Thomas et al., 2006) and intenseprecipitation and flooding events in central Europe (Kundzewiczet al., 2005). Note also that the suitability of such analogueevents should normally be considered along with information
on accompanying changes in mean climate, which may ease orexacerbate vulnerability to extreme events.
Spatial analogues have also been applied in CCIAV analysis.For example, model-simulated climates for 2071 to 2100 havebeen analysed for selected European cities (Hallegatte et al.,2007). Model grid boxes in Europe showing the closest matchbetween their present-day mean temperatures and seasonalprecipitation and those projected for the cities in the future wereidentified as spatial analogues. These ‘displaced’ cities were thenused as a heuristic device for analysing economic impacts andadaptation needs under a changing climate. A related approach isto seek projected climates (e.g., using climate model simulations)that have no present-day climatic analogues on Earth (‘novel’climates) or regions where present-day climates are no longer tobe found in the future (‘disappearing’ climates: see Ohlemüller etal., 2006; Williams et al., 2007). Results from such studies havebeen linked to risks to ecological systems and biodiversity.
2.4.5 Storylines
Storylines for CCIAV studies (see Box 2.1) are increasinglyadopting a multi-sectoral and multi-stressor approach (Holmanet al., 2005a, b) over multiple scales (Alcamo et al., 2005; Lebelet al., 2005; Kok et al., 2006a; Westhoek et al., 2006b) and areutilising stakeholder elicitation (Kok et al., 2006b). As they havebecome more comprehensive, the increased complexity andrichness of the information they contain has aided theinterpretation of adaptive capacity and vulnerability (Metzger etal., 2006). Storyline development is also subjective, so morecomprehensive storylines can have alternative, but equallyplausible, interpretations (Rounsevell et al., 2006). The conceptof a ‘region’, for example, may be interpreted within a storylinein different ways − as world regions, nation states, or sub-national administrative units. This may have profoundimplications for how storylines are characterised at a local scale,limiting their reproducibility and credibility (Abildtrup et al.,2006). The alternative is to link a locally sourced storyline,regarded as credible at that scale, to a global scenario.
Storylines can be an endpoint in their own right (e.g.,Rotmans et al., 2000), but often provide the basis for quantitativescenarios. In the storyline and simulation (SAS) approach(Alcamo, 2001), quantification is undertaken with models forwhich the input parameters are estimated through interpretationof the qualitative storylines. Parameter estimation is oftensubjective, using expert judgement, although more objectivemethods, such as pairwise comparison, have been used toimprove internal consistency (Abildtrup et al., 2006). Analoguesand stakeholder elicitation have also been used to estimatemodel parameters (e.g., Rotmans et al., 2000; Berger and Bolte,2004; Kok et al., 2006a). Moreover, participatory approachesare important in reconciling long-term scenarios with the short-term, policy-driven requirements of stakeholders (Velázquez etal., 2001; Shackley and Deanwood, 2003; Lebel et al., 2005).
2.4.6 Scenarios
Advances in scenario development since the TAR addressissues of consistency and comparability between global drivers
New assessment methods and the characterisation of future conditions Chapter 2
146

of change, and regional scenarios required for CCIAVassessment (for reviews, see Berkhout et al., 2002; Carter et al.,2004; Parson et al., 2006). Numerous methods of downscalingfrom global to sub-global scale are emerging, some relying onthe narrative storylines underpinning the global scenarios.
At the time of the TAR, most CCIAV studies utilised climatescenarios (many based on the IS92 emissions scenarios), butvery few applied contemporaneous scenarios of socio-economic,land-use, or other environmental changes. Those that did used arange of sources to develop them. The IPCC Special Report onEmissions Scenarios (SRES: see Nakićenović et al., 2000)presented the opportunity to construct a range of mutuallyconsistent climate and non-climatic scenarios. Originallydeveloped to provide scenarios of future GHG emissions, theSRES scenarios are also accompanied by storylines of social,economic, and technological development that can be used inCCIAV studies (Box 2.2).
There has been an increasing uptake of the SRES scenarios sincethe TAR, and a substantial number of the impact studies assessedin this volume that employed future characterisations made use ofthem.7 For this reason, these scenarios are highlighted in a series ofboxed examples throughout Section 2.4. For some other studies,especially empirical analyses of adaptation and vulnerability, thescenarios were of limited relevance and were not adopted.
While the SRES scenarios were specifically developed toaddress climate change, several other major global scenario-
building exercises have been designed to explore uncertainties andrisks related to global environmental change. Recent examplesinclude: the Millennium Ecosystem Assessment scenarios to 2100(MA: see Alcamo et al., 2005), Global Scenarios Group scenariosto 2050 (GSG: see Raskin et al., 2002), and Global EnvironmentOutlook scenarios to 2032 (GEO-3: see UNEP 2002). Theseexercises were reviewed and compared by Raskin et al. (2005) andWesthoek et al. (2006a), who observed that many applied similarassumptions to those used in the SRES scenarios, in some casesemploying the same models to quantify the main drivers andindicators. All the exercises adopted the storyline and simulation(SAS) approach (introduced in Section 2.4.5). Furthermore, allcontain important features that can be useful for CCIAV studies;with some exercises (e.g., MA and GEO-3) going one step furtherthan the original SRES scenarios by not only describing possibleemissions under differing socio-economic pathways but alsoincluding imaginable outcomes for climate variables and theirimpact on ecological and social systems. This helps to illustraterisks and possible response strategies to deal with possible impacts.
Five classes of scenarios relevant to CCIAV analysis weredistinguished in the TAR: climate, socio-economic, land-use andland-cover, other environmental (mainly atmosphericcomposition), and sea-level scenarios (Carter et al., 2001). Thefollowing sections describe recent progress in each of these classesand in four additional categories: technology scenarios, adaptationscenarios, mitigation scenarios, and scenario integration.
Chapter 2 New assessment methods and the characterisation of future conditions
147
7 Of 17 chapters surveyed, SRES-based scenarios were used by the majority of impact studies in 5 chapters, and by a large minority in 11chapters. The most common usage is for climate scenarios, while examples of studies employing SRES-based socio-economic, environmental,or land-use scenarios comprise a small but growing number. The remaining impact studies used either earlier IPCC scenarios (e.g., IS92) orcharacterisations derived from other sources.
Box 2.2. The SRES global storylines and scenarios
SRES presented four narrative storylines, labelled A1, A2, B1, andB2, describing the relationships between the forces driving GHGand aerosol emissions and their evolution during the 21st centuryfor large world regions and globally (Figure 2.5). Each storylinerepresents different demographic, social, economic,technological, and environmental developments that diverge inincreasingly irreversible ways and result in different levels of GHGemissions. The storylines assume that no specific climate policiesare implemented, and thus form a baseline against whichnarratives with specific mitigation and adaptation measures canbe compared.
The SRES storylines formed the basis for the development ofquantitative scenarios using various numerical models that werepresented in the TAR. Emissions scenarios were converted toprojections of atmospheric GHG and aerosol concentrations,radiative forcing of the climate, effects on regional climate, andclimatic effects on global sea level (IPCC, 2001a). However, littleregional detail of these projections and no CCIAV studies thatmade use of them were available for the TAR. Many CCIAVstudies have applied SRES-based scenarios since then, andsome of these are described in Boxes 2.3 to 2.7 to illustratedifferent scenario types.
Figure 2.5. Summary characteristics of the four SRES storylines
(based on Nakicenovic et al., 2000).

2.4.6.1 Climate scenariosThe most recent climate projection methods and results are
extensively discussed in the WG I volume (especiallyChristensen et al., 2007a; Meehl et al., 2007), and most of thesewere not available to the CCIAV studies assessed in thisvolume. Box 2.3 compares recent climate projections fromAtmosphere-Ocean General Circulation Models (AOGCMs)with the earlier projections relied on throughout this volume.While AOGCMs are the most common source of regionalclimate scenarios, other methods and tools are also applied inspecific CCIAV studies. Numerous regionalisation techniques8
have been employed to obtain high-resolution, SRES-basedclimate scenarios, nearly always using low-resolution GeneralCirculation Model (GCM) outputs as a starting point. Some ofthese methods are also used to develop scenarios of extremeweather events.
Scenarios from high-resolution modelsThe development and application of scenarios from high-
resolution regional climate models and global atmosphericmodels (time-slices) since the TAR confirms that improvedresolution allows a more realistic representation of the responseof climate to fine-scale topographic features (e.g., lakes,mountains, coastlines). Impact models will often producedifferent results utilising high-resolution scenarios comparedwith direct GCM outputs (e.g., Arnell et al., 2003; Mearns etal., 2003; Stone et al., 2003; Leung et al., 2004; Wood et al.,2004). However, most regional model experiments still rely ononly one driving AOGCM and scenarios are usually availablefrom only one or two regional climate models (RCMs).
More elaborate and extensive modelling designs havefacilitated the exploration of multiple uncertainties (acrossdifferent RCMs, AOGCMs, and emissions scenarios) and howthose uncertainties affect impacts. The PRUDENCE project inEurope produced multiple RCM simulations based on theECHAM/OPYC AOGCM and HadAM3H AGCM simulationsfor two different emissions scenarios (Christensen et al.,2007b). Uncertainties due to the spatial scale of the scenariosand stemming from the application of different RCMs versusdifferent GCMs (including models not used for regionalisation)were elaborated on in a range of impact studies (e.g., Ekstromet al., 2007; Fronzek and Carter, 2007; Hingray et al., 2007;Graham et al., 2007; Olesen et al., 2007). For example, Olesenet al. (2007) found that the variation in simulated agriculturalimpacts was smaller across scenarios from RCMs nested in asingle GCM than it was across different GCMs or across thedifferent emissions scenarios.
The construction of higher-resolution scenarios (now oftenfiner than 50 km), has encouraged new types of impact studies.For example, studies examining the combined impacts ofincreased heat stress and air pollution are now more feasiblebecause the resolution of regional climate models is convergingwith that of air-quality models (e.g., Hogrefe et al., 2004).Furthermore, scenarios developed from RCMs (e.g., UKMO,
2001) are now being used in many more regions of the world,particularly the developing world (e.g., Arnell et al., 2003; Gaoet al., 2003; Anyah and Semazzi, 2004; Government of India,2004; Rupa Kumar et al., 2006). Results of these regionalmodelling experiments are reported in Christensen et al.(2007a).
Statistical downscaling (SD)Much additional work has been produced since the TAR
using methods of statistical downscaling (SD) for climatescenario generation (Wilby et al., 2004b; also see Christensenet al., 2007a). Various SD techniques have been used indownscaling directly to (physically-based) impacts and to agreater variety of climate variables than previously (e.g., windspeed), including extremes of variables. For example, Wang etal. (2004) and Caires and Sterl (2005) have developed extremevalue models for projecting changes in wave height.
While statistical downscaling has mostly been applied forsingle locations, Hewitson (2003) developed empiricaldownscaling for point-scale precipitation at numerous sites andon a 0.1°-resolution grid over Africa. Finally, the wideravailability of statistical downscaling tools is being reflected inwider application; for example, the Statistical DownscalingModel (SDSM) tool of Wilby et al. (2002), which has been usedto produce scenarios for the River Thames basin (Wilby andHarris, 2006). Statistical downscaling does have somelimitations; for example, it cannot take account of small-scaleprocesses with strong time-scale dependencies (e.g., land-coverchange). See Christensen et al. (2007a) for a completediscussion of the strengths and weaknesses of both statisticaland dynamical downscaling.
Scenarios of extreme weather eventsThe improved availability of high-resolution scenarios has
facilitated new studies of event-driven impacts (e.g., fire risk –Moriondo et al., 2006; low-temperature impacts on borealforests – Jönsson et al., 2004). Projected changes in extremeweather events have been related to projected changes in localmean climate, in the hope that robust relationships could allowthe prediction of extremes on the basis of changes in meanclimate alone. PRUDENCE RCM outputs showed non-linearrelationships between mean maximum temperature and indicesof drought and heatwave (Good et al., 2006), while changes inmaximum 1-day and 5-day precipitation amounts weresystematically enhanced relative to changes in seasonal meanprecipitation across many regions of Europe (Beniston et al.,2007). In a comprehensive review (citing over 200 papers) ofthe options available for developing scenarios of weatherextremes for use in Integrated Assessment Models (IAMs),Goodess et al. (2003) list the advantages and disadvantages ofapplying direct GCM outputs, direct RCM outputs, and SDtechniques. Streams of daily data are the outputs mostcommonly used from these sources, and these may posecomputational difficulties for assessing impacts in IAMs (which
New assessment methods and the characterisation of future conditions Chapter 2
148
8 Defined in the TAR as “techniques developed with the goal of enhancing the regional information provided by coupled AOGCMs andproviding fine-scale climate information” (Giorgi et al., 2001).

Chapter 2 New assessment methods and the characterisation of future conditions
149
Box 2.3. SRES-based climate scenarios assumed in this report
Not all of the impact studies reported in this assessment employed SRES-based climate scenarios. Earlier scenarios aredescribed in previous IPCC reports (IPCC, 1992, 1996; Greco et al., 1994). The remaining discussion focuses on SRES-basedclimate projections, which are applied in most CCIAV studies currently undertaken.
In recent years, many simulations of the global climate response to the SRES emission scenarios have been completed withAOGCMs, also providing regional detail on projected climate. Early AOGCM runs (labelled ‘pre-TAR’) were reported in the TAR(Cubasch et al., 2001) and are available from the IPCC DDC. Many have been adopted in CCIAV studies reported in this volume.A new generation of AOGCMs, some incorporating improved representations of climate system processes and land surfaceforcing, are now utilising the SRES scenarios in addition to other emissions scenarios of relevance for impacts and policy. Thenew models and their projections are evaluated in WG I (Christensen et al., 2007a; Meehl et al., 2007; Randall et al., 2007) andcompared with the pre-TAR results below. Projections of global mean annual temperature change for SRES and CO2-stabilisationprofiles are presented in Box 2.8.
Pre-TAR AOGCM results held at the DDC were included in a model intercomparison across the four SRES emissions scenarios(B1, B2, A2, and A1FI) of seasonal mean temperature and precipitation change for thirty-two world regions (Ruosteenoja et al.,2003).9 The inter-model range of changes by the end of the 21st century is summarised in Figure 2.6 for the A2 scenario,expressed as rates of change per century. Recent A2 projections, reported in WG I, are also shown for the same regions forcomparison.
Almost all model-simulated temperature changes, but fewer precipitation changes, were statistically significant relative to 95%confidence intervals calculated from 1,000-year unforced coupled AOGCM simulations (Ruosteenoja et al., 2003; see also Figure2.6). Modelled surface air temperature increases in all regions and seasons, with most land areas warming more rapidly than theglobal average (Giorgi et al., 2001; Ruosteenoja et al., 2003). Warming is especially pronounced in high northern-latitude regionsin the boreal winter and in southern Europe and parts of central and northern Asia in the boreal summer. Warming is less thanthe global average in southern parts of Asia and South America, Southern Ocean areas (containing many small islands) and theNorth Atlantic (Figure 2.6a).
For precipitation, both positive and negative changes are projected, but a regional precipitation increase is more common thana decrease. All models simulate higher precipitation at high latitudes in both seasons, in northern mid-latitude regions in borealwinter, and enhanced monsoon precipitation for southern and eastern Asia in boreal summer. Models also agree on precipitationdeclines in Central America, southern Africa and southern Europe in certain seasons (Giorgi et al., 2001; Ruosteenoja et al.,2003; see also Figure 2.6b).
Comparing TAR projections to recent projectionsThe WG I report provides an extensive intercomparison of recent regional projections from AOGCMs (Christensen et al., 2007a;Meehl et al., 2007), focusing on those assuming the SRES A1B emissions scenario, for which the greatest number of simulations(21) were available. It also contains numerous maps of projected regional climate change. In summary:
• The basic pattern of projected warming is little changed from previous assessments.• The projected rate of warming by 2030 is insensitive to the choice of SRES scenarios.• Averaged across the AOGCMs analysed, the global mean warming by 2090-2099 relative to 1980-1999 is projected to be
1.8, 2.8, and 3.4°C for the B1, A1B, and A2 scenarios, respectively. Local temperature responses in nearly all regions closelyfollow the ratio of global temperature response.
• Model-average mean local precipitation responses also roughly scale with the global mean temperature response acrossthe emissions scenarios, though not as well as for temperature.
• The inter-model range of seasonal warming for the A2 scenario is smaller than the pre-TAR range at 2100 in most regions,despite the larger number of models (compare the red and blue bars in Figure 2.6a)
• The direction and magnitude of seasonal precipitation changes for the A2 scenario are comparable to the pre-TAR changesin most regions, while inter-model ranges are wider in some regions/seasons and narrower in others (Figure 2.6b).
• Confidence in regional projections is higher than in the TAR for most regions for temperature and for some regions forprecipitation.
9 Scatter diagrams are downloadable at: http://www.ipcc-data.org/sres/scatter_plots/scatterplots_region.html

New assessment methods and the characterisation of future conditions Chapter 2
150

Chapter 2 New assessment methods and the characterisation of future conditions
151
Figure 2.6. AOGCM projections of seasonal changes in (a) mean temperature (previous page) and (b) precipitation up to the end of the21st century for 32 world regions. For each region two ranges between minimum and maximum are shown. Red bar: range from 15recent AOGCM simulations for the A2 emissions scenario (data analysed for Christensen et al., 2007a). Blue bar: range from 7 pre-TAR AOGCMs for the A2 emissions scenario (Ruosteenoja et al., 2003). Seasons: DJF (December–February); MAM (March–May); JJA(June–August); SON (September–November). Regional definitions, plotted on the ECHAM4 model grid (resolution 2.8 × 2.8°), areshown on the inset map (Ruosteenoja et al., 2003). Pre-TAR changes were originally computed for 1961-1990 to 2070-2099 andrecent changes for 1979-1998 to 2079-2098, and are converted here to rates per century for comparison; 95% confidence limits onmodelled 30-year natural variability are also shown based on millennial AOGCM control simulations with HadCM3 (mauve) andCGCM2 (green) for constant forcing (Ruosteenoja et al., 2003). Numbers on precipitation plots show the number of recent A2 runsgiving negative/positive precipitation change. Percentage changes for the SAH region (Sahara) exceed 100% in JJA and SON due tolow present-day precipitation.Key for (a) and (b):

commonly consider only large-scale, period-averaged climate),requiring scenario analysis to be carried out offline.Interpretation of impacts then becomes problematic, requiringa method of relating the large-scale climate change representedin the IAM to the impacts of associated changes in weatherextremes modelled offline. Goodess et al. suggest that a moredirect, but untested, approach could be to construct conditionaldamage functions (cdfs), by identifying the statisticalrelationships between the extreme events themselves (causingdamage) and large-scale predictor variables. Box 2.4 offers aglobal overview of observed and projected changes in extremeweather events.
2.4.6.2 Scenarios of atmospheric compositionProjections of atmospheric composition account for the
concurrent effects of air pollution and climate change, which canbe important for human health, agriculture and ecosystems.Scenarios of CO2 concentration ([CO2]) are needed in someCCIAV studies, as elevated [CO2] can affect the acidity of theoceans (IPCC, 2007; Chapter 6, Section 6.3.2) and both thegrowth and water use of many terrestrial plants (Chapter 4,Section 4.4.1; Chapter 5, Section 5.4.1), with possible feedbackson regional hydrology (Gedney et al., 2006). CO2 is well mixedin the atmosphere, so concentrations at a single observing site willusually suffice to represent global conditions. Observed [CO2] in
New assessment methods and the characterisation of future conditions Chapter 2
152
Box 2.4. SRES-based projections of climate variability and extremes
Possible changes in variability and the frequency/severity of extreme events are critical to undertaking realistic CCIAVassessments. Past trends in extreme weather and climate events, their attribution to human influence, and projected (SRES-forced) changes have been summarised globally by WG I (IPCC, 2007) and are reproduced in Table 2.2.
Table 2.2. Recent trends, assessment of human influence on the trend, and projections for extreme weather events for which there is anobserved late 20th century trend. Source: IPCC, 2007, Table SPM-2.
Notes:a The assessed likelihood, using expert judgement, of an outcome or a result: Virtually certain >99% probability of occurrence, Extremely
likely >95%, Very likely >90%, Likely >66%, More likely than not >50%.b Decreased frequency of cold days and nights (coldest 10%).c Warming of the most extreme days and nights each year.d Increased frequency of hot days and nights (hottest 10%).e Magnitude of anthropogenic contributions not assessed. Attribution for these phenomena based on expert judgement rather than formal
attribution studies.f Extreme high sea level depends on average sea level and on regional weather systems. It is defined here as the highest 1% of hourly values
of observed sea level at a station for a given reference period.g Changes in observed extreme high sea level closely follow the changes in average sea level. It is very likely that anthropogenic activity
contributed to a rise in average sea level.h In all scenarios, the projected global average sea level at 2100 is higher than in the reference period. The effect of changes in regional
weather systems on sea-level extremes has not been assessed.
Phenomenon and direction oftrend
Likelihooda that trend occurredin late 20th century (typically
post-1960)
Likelihooda of a humancontribution to observed trend
Likelihooda of future trendsbased on projections for 21stcentury using SRES scenarios
Warmer and fewer cold days andnights over most land areas
Very likelyb Likelyc Virtually certainc
Warmer and more frequent hotdays and nights over most landareas
Very likelyd Likely (nights)c Virtually certainc
Warm spells/heatwaves.Frequency increases over mostland areas
Likely More likely than note Very likely
Heavy precipitation events.Frequency (or proportion of totalrainfall from heavy falls) increasesover most areas
Likely More likely than note Very likely
Area affected by droughtsincreases
Likely in many regions since1970s
More likely than not Likely
Intense tropical cyclone activityincreases
Likely in some regions since 1970 More likely than note Likely
Increased incidence of extremehigh sea level (excludestsunamis)f
Likely More likely than note,g Likelyh

2005 was about 379 ppm (Forster et al., 2007) and was projectedin the TAR using the Bern-CC model to rise by 2100 to reference,low, and high estimates for the SRES marker scenarios of B1: 540[486 to 681], A1T: 575 [506 to 735], B2: 611[544 to 769], A1B:703 [617 to 918], A2: 836 [735 to 1080], and A1FI: 958 [824 to1248] ppm (Appendix II in IPCC, 2001a). Values similar to thesereference levels are commonly adopted in SRES-based impactstudies; for example, Arnell et al. (2004) employed levels assumedin HadCM3 AOGCM climate simulations, and Schröter et al.(2005b) used levels generated by the IMAGE-2 integratedassessment model. However, recent simulations with coupledcarbon cycle models indicate an enhanced rise in [CO2] for a givenemissions scenario, due to feedbacks from changing climate onthe carbon cycle, suggesting that the TAR reference estimates areconservative (Meehl et al., 2007).
Elevated levels of ground-level ozone (O3) are toxic to manyplants (see Chapter 5, Box 5.2) and are strongly implicated in arange of respiratory diseases (Chapter 8, Section 8.2.6). Increasedatmospheric concentrations of sulphur dioxide are detrimental toplants, and wet and dry deposition of atmospheric sulphur andnitrogen can lead to soil and surface water acidification, whilenitrogen deposition can also serve as a plant fertiliser (Carter et al.,2001; see also Chapter 4, Section 4.4.1; Chapter 5, Section5.4.3.1). Projections with global atmospheric chemistry modelsfor the high-emissions SRES A2 scenario indicate that globalmean tropospheric O3 concentrations could increase by 20 to 25%between 2015 and 2050, and by 40 to 60% by 2100, primarily asa result of emissions of NOx, CH4, CO2, and compounds fromfossil fuel combustion (Meehl et al., 2007). Stricter air pollutionstandards, already being implemented in many regions, wouldreduce, and could even reverse, this projected increase (Meehl etal., 2007). Similarly, the range of recent scenarios of globalsulphur and NOx emissions that account for new abatement
policies has shifted downwards compared with the SRESemissions scenarios (Smith et al., 2005; Nakićenović et al., 2007).
For the purposes of CCIAV assessment, global projections ofpollution are only indicative of local conditions. Levels are highlyvariable in space and time, with the highest values typicallyoccurring over industrial regions and large cities. Althoughprojections are produced routinely for some regions in order tosupport air pollution policy using high-resolution atmospherictransport models (e.g., Syri et al., 2004), few models have beenrun assuming an altered climate, and simulations commonlyassume emissions scenarios developed for air pollution policyrather than climate policy (see Alcamo et al., 2002; Nakićenovićet al., 2007). Exceptions include regionally explicit globalscenarios of nitrogen deposition on a 0.5° latitude × 0.5° longitudegrid for studying biodiversity loss in the Millennium EcosystemAssessment (Alcamo et al., 2005) and simulations based on SRESemissions for sulphur and nitrogen over Europe (Mayerhofer etal., 2002) and Finland (Syri et al., 2004), and for surface ozone inFinland (Laurila et al., 2004).
2.4.6.3 Sea-level scenariosA principal impact projected under global warming is sea-
level rise. Some basic techniques for developing sea-levelscenarios were described in the TAR (Carter et al., 2001). Sincethe TAR, methodological refinements now account moreeffectively for regional and local factors affecting sea level and,in so doing, produce scenarios that are more relevant forplanning purposes. Two main types of scenario are distinguishedhere: regional sea level and storm surges. A third type,characterising abrupt sea-level rise, is described in Section 2.4.7.Analogue approaches have also been reported (e.g., ArenstamGibbons and Nicholls, 2006). More details on sea level and sea-level scenarios can be found in Bindoff et al. (2007), Meehl et
Chapter 2 New assessment methods and the characterisation of future conditions
153
Box 2.5. SRES-based sea-level scenarios
At the global level, simple models representing the expansion of sea water and melting/sliding of land-based ice sheets andglaciers were used in the TAR to obtain estimates of globally averaged mean sea-level rise across the SRES scenarios, yieldinga range of 0.09 to 0.88 m by 2100 relative to 1990 (Church et al., 2001). This range has been reassessed by WG I, yieldingprojections relative to 1980-1999 for the six SRES marker scenarios of B1: 0.18 to 0.38 m, A1T: 0.20 to 0.45 m, B2: 0.20 to0.43 m, A1B: 0.21 to 0.48 m, A2: 0.23 to 0.51 m, and A1FI: 0.26 to 0.59 m (Meehl et al., 2007). Thermal expansion contributesabout 60 to 70% to these estimates. Projections are smaller than given in the TAR, due mainly to improved estimates of oceanheat uptake but also to smaller assessed uncertainties in glacier and ice cap changes. However, uncertainties in carbon cyclefeedbacks, ice flow processes, and recent observed ice discharge rates are not accounted for due to insufficient understanding(Meehl et al., 2007).
A number of studies have made use of the TAR sea-level scenarios. In a global study of coastal flooding and wetland loss,Nicholls (2004) used global mean sea-level rise estimates for the four SRES storylines by 2025, 2055, and 2085. These wereconsistent with climate scenarios used in parallel studies (see Section 2.4.6.4). Two subsidence rates were also applied to obtainrelative sea level rise in countries already experiencing coastal subsidence. The United Kingdom Climate Impacts Programmeadopted the TAR global mean sea-level rise estimates in national scenarios out to the 2080s. Scenarios of high water levels werealso developed by combining mean sea-level changes with estimates of future storminess, using a storm surge model (Hulmeet al., 2002). SRES-based sea-level scenarios accounting for global mean sea level, local land uplift, and estimates of the waterbalance of the Baltic Sea were estimated for the Finnish coast up to 2100 by Johansson et al. (2004), along with calculations ofuncertainties and extreme high water levels.

al. (2007) and Chapter 6 of this volume. Examples of SRES-based sea-level scenarios are provided in Box 2.5.
Regional sea-level scenariosSea level does not change uniformly across the world under a
changing climate, due to variation in ocean density and circulationchanges. Moreover, long-term, non-climate-related trends, usuallyassociated with vertical land movements, may affect relative sealevel. To account for regional variations, Hulme et al. (2002)recommend applying the range of global-mean scenarios ±50%change. Alternative approaches utilise scenario generators. TheDynamic Interactive Vulnerability Assessment (DIVA) modelcomputes relative sea-level rise scenarios using either global-meanor regional patterns of sea-level rise scenarios from CLIMBER-2,a climate model of intermediate complexity (Petoukhov et al.,2000; Ganopolski et al., 2001). CLIMsystems (2005) havedeveloped a software tool that rapidly generates place-based futurescenarios of sea-level change during the 21st century, accountingfor global, regional, and local factors. Spatial patterns of sea-levelrise due to thermal expansion and ocean processes from AOGCMsimulations are combined with global-mean sea-level riseprojections from simple climate models through the pattern-scaling technique (Santer et al., 1990). Users can specify a valuefor the local sea-level trends to account for local land movements.
Storm surge scenariosIn many locations, the risk of extreme sea levels is poorly
characterised even under present-day climatic conditions, due tosparse tide gauge networks and relatively short records of highmeasurement frequency. Where such records do exist, detectabletrends are highly dependent on local conditions (Woodworth andBlackman, 2004). Box 6.2 in Chapter 6 summarises several recentstudies that employ extreme water level scenarios. Two methodswere employed to develop these scenarios, one using acombination of stochastic sampling and dynamic modelling, theother using downscaled regional climate projections from globalclimate models to drive barotropic storm surge models (Lowe andGregory, 2005).
2.4.6.4 Socio-economic scenariosSocio-economic changes are key drivers of projected changes
in future emissions and climate, and are also key determinants ofmost climate change impacts, potential adaptations andvulnerability (Malone and La Rovere, 2005). Furthermore, theyalso influence the policy options available for responding toclimate change. CCIAV studies increasingly include scenarios ofchanging socio-economic conditions, which can substantially alterassessments of the effects of future climate change (Parry, 2004;Goklany, 2005; Hamilton et al., 2005; Schröter et al., 2005b;Alcamo et al., 2006a). Typically these assessments needinformation at the sub-national level, whereas many scenarios aredeveloped at a broader scale, requiring downscaling of aggregatesocio-economic scenario information.
Guidelines for the analysis of current and projected socio-economic conditions are part of the UNDP Adaptation PolicyFramework (Malone and La Rovere, 2005). They advocate the useof indicators to characterise socio-economic conditions andprospects. Five categories of indicators are suggested: demographic,
economic, natural resource use, governance and policy, and cultural.Most recent studies have focused on the first two of these.
The sensitivity of climate change effects to socio-economicconditions was highlighted by a series of multi-sector impactassessments (Parry et al., 1999, 2001; Parry, 2004; see Table2.3). Two of these assessments relied on only a singlerepresentation of future socio-economic conditions (IS92a),comparing effects of mitigated versus unmitigated climatechange (Arnell et al., 2002; Nicholls and Lowe, 2004). The thirdset considered four alternative SRES-based developmentpathways (see Box 2.6), finding that these assumptions are oftena stronger determinant of impacts than climate change itself(Arnell, 2004; Arnell et al., 2004; Levy et al., 2004; Nicholls,2004; Parry et al., 2004; van Lieshout et al., 2004). Furthermore,climate impacts can themselves depend on the developmentpathway, emphasising the limited value of impact assessments ofhuman systems that overlook possible socio-economic changes.
The advantages of being able to link regional socio-economicfutures directly to global scenarios and storylines are now beingrecognised. For example, the SRES scenarios have been used asa basis for developing storylines and quantitative scenarios atnational (Carter et al., 2004, 2005; van Vuuren et al., 2007) andsub-national (Berkhout et al., 2002; Shackley and Deanwood,2003; Solecki and Oliveri, 2004; Heslop-Thomas et al., 2006)scales. In contrast, most regional studies in the AIACC(Assessments of Impacts and Adaptations to Climate Change inMultiple Regions and Sectors) research programme adopted aparticipatory, sometimes ad hoc, approach to socio-economicscenario development, utilising current trends in key socio-economic indicators and stakeholder consultation (e.g.,Heslop-Thomas et al., 2006; Pulhin et al., 2006).
Methods for downscaling quantitative socio-economicinformation have focused on population and gross domesticproduct (GDP). The downscaling of population growth hasevolved beyond simple initial exercises that made the sometimesunrealistic assumption that rates of population change areuniform over an entire world region (Gaffin et al., 2004). Newtechniques account for differing demographic conditions andoutlooks at the national level (Grübler et al., 2006; van Vuurenet al., 2007). New methods of downscaling to the sub-nationallevel include simple rules for preferential growth in coastal areas(Nicholls, 2004), extrapolation of recent trends at the local arealevel (Hachadoorian et al., 2007), and algorithms leading topreferential growth in urban areas (Grübler et al., 2006;Reginster and Rounsevell, 2006).
Downscaling methods for GDP are also evolving. The firstdownscaled SRES GDP assumptions applied regional growthrates uniformly to all countries within the region (Gaffin et al.,2004) without accounting for country-specific differences ininitial conditions and growth expectations. New methods assumevarious degrees of convergence across countries, depending onthe scenario; a technique that avoids implausibly high growthfor rich countries in developing regions (Grübler et al., 2006;van Vuuren et al., 2007). GDP scenarios have also beendownscaled to the sub-national level, either by assumingconstant shares of GDP in each grid cell (Gaffin et al., 2004; vanVuuren et al., 2007) or through algorithms that differentiateincome across urban and rural areas (Grübler et al., 2006).
New assessment methods and the characterisation of future conditions Chapter 2
154

2.4.6.5 Land-use scenariosMany CCIAV studies need to account for future changes in
land use and land cover. This is especially important for regionalstudies of agriculture and water resources (Barlage et al., 2002;Klöcking et al., 2003), forestry (Bhadwal and Singh, 2002), andecosystems (Bennett et al., 2003; Dirnbock et al., 2003; Zebischet al., 2004; Cumming et al., 2005), but also has a large influenceon regional patterns of demography and economic activity(Geurs and van Eck, 2003) and associated problems ofenvironmental degradation (Yang et al., 2003) and pollution(Bathurst et al., 2005). Land-use and land-cover change
scenarios have also been used to analyse feedbacks to theclimate system (DeFries et al., 2002; Leemans et al., 2002;Maynard and Royer, 2004) and sources and sinks of GHGs(Fearnside, 2000; El-Fadel et al., 2002; Sands and Leimbach,2003).
The TAR concluded that the use of Integrated AssessmentModels (IAMs) was the most appropriate method for developingland-use change scenarios, and they continue to be the onlyavailable tool for global-scale studies. Since the TAR, however,a number of new models have emerged that provide freshinsights into regional land-use change. These regional models
Chapter 2 New assessment methods and the characterisation of future conditions
155
Impacts of unmitigated emissions [a] Impacts of stabilisation of CO2concentrations [b]
Impacts of SRES emissions scenarios[c]
Emissionsscenarios
IS92a (1% per increase in CO2-equivalentconcentrations per year from 1990)
Stabilisation at 750 and 550 ppm Four SRES emissions scenarios: A1FI, A2,B1, and B2
Climatescenarios(AOGCM-based)
Derived from four ensemble HadCM2simulations and one HadCM3 simulationforced with IS92a emissions scenarios
Derived from HadCM2 experimentsassuming stabilisation at 550 and750 ppm; comparison with IS92a
Derived from HadCM3 ensembleexperiments (number of runs in brackets):A1FI (1), A2 (3), B1 (1), and B2 (2)
Socio-economicscenarios
IS92a-consistent GDPa and populationprojections
IS92a-consistent GDPa andpopulation projections
SRES-based socio-economic projections
Table 2.3. Key features of scenarios underlying three global-scale, multi-sector assessments: [a] Parry et al. (1999); [b] Arnell et al. (2002); [c] Parry (2004).
a GDP = Gross Domestic Product.
Box 2.6. SRES-based socio-economic characterisations
SRES provides socio-economic information in the form of storylines and quantitative assumptions on population, grossdomestic product (GDP), and rates of technological progress for four large world regions (OECD-1990, Reforming Economies,Africa + Latin America + Middle East, and Asia). Since the TAR, new information on several of the SRES driving forces hasbeen published (see also the discussion in Nakicenovic et al., 2007). For example, the range of global population sizeprojections made by major demographic institutions has reduced by about 1−2 billion since the preparation of SRES (vanVuuren and O’Neill, 2006). Nevertheless, most of the population assumptions used in SRES still lie within the range of currentprojections, with the exception of some regions of the A2 scenario which now lie somewhat above it (van Vuuren and O’Neill,2006). Researchers are now producing alternative interpretations of SRES population assumptions or new projections for usein climate change studies (Hilderink, 2004; O’Neill, 2004; Fisher et al., 2006; Grübler et al., 2006).
SRES GDP growth assumptions for the ALM region (Africa, Latin America and Middle East) are generally higher than thoseof more recent projections, particularly for the A1 and B1 scenarios (van Vuuren and O’Neill, 2006). The SRES GDPassumptions are generally consistent with recent projections for other regions, including fast-growing regions in Asia and,given the small share of the ALM region in global GDP, for the world as a whole.
For international comparison, economic data must be converted into a common unit; the most common choice is US$ basedon market exchange rates (MER). Purchasing-power-parity (PPP) estimates, in which a correction is made for differences inprice levels among countries, are considered a better alternative for comparing income levels across regions and countries.Most models and economic projections, however, use MER-based estimates, partly due to a lack of consistent PPP-baseddata sets. It has been suggested that the use of MER-based data results in inflated economic growth projections (Castlesand Henderson, 2003). In an ongoing debate, some researchers argue that PPP is indeed a better measure and that its usewill, in the context of scenarios of economic convergence, lead to lower economic growth and emissions paths for developingcountries. Others argue that consistent use of either PPP- or MER-based data and projections will lead to, at most, only smallchanges in emissions. This debate is summarised by Nakicenovic et al. (2007), who conclude that the impact on emissionsof the use of alternative GDP metrics is likely to be small, but indicating alternative positions as well (van Vuuren and Alfsen,2006). The use of these alternative measures is also likely to affect CCIAV assessments (Tol, 2006), especially wherevulnerability and adaptive capacity are related to access to locally traded goods and services.

can generate very different land-use change scenarios from thosegenerated by IAMs (Busch, 2006), often with opposingdirections of change. However, the need to define outsideinfluences on land use in regional-scale models, such as globaltrade, remains a challenge (e.g., Sands and Edmonds, 2005;Alcamo et al., 2006b), so IAMs have an important role to playin characterising the global boundary conditions for regionalland-use change assessments (van Meijl et al., 2006).
Regional-scale land-use models often adopt a two-phase(nested scale) approach with an assessment of aggregate quantitiesof land use for the entire region followed by ‘downscaling’procedures to create regional land-use patterns (see Box 2.7 forexamples). Aggregate quantities are often based on IAMs oreconomic models such as General Equilibrium Models (van Meijlet al., 2006) or input-output approaches (Fischer and Sun, 2001).Methods of downscaling vary considerably and includeproportional approaches to estimate regional from globalscenarios (Arnell et al., 2004), regional-scale economic models(Fischer and Sun, 2001), spatial allocation procedures based onrules (Rounsevell et al., 2006), micro-simulation with cellularautomata (de Nijs et al., 2004; Solecki and Oliveri, 2004), linearprogramming models (Holman et al., 2005a, b), and empirical-statistical techniques (de Koning et al., 1999; Verburg et al., 2002,2006). In addressing climate change impacts on land use, Agent-Based Models (ABMs: see Alcamo et al., 2006b) aim to provideinsight into the decision processes and social interactions thatunderpin adaptation and vulnerability assessment (Acosta-Michlikand Rounsevell, 2005).
Most land-use scenario assessments are based on gradualchanges in socio-economic and climatic conditions, althoughresponses to extreme weather events such as Hurricane Mitchin Central America have also been assessed (Kok and Winograd,2002). Probabilistic approaches are rare, with the exceptionbeing the effects of uncertainty in alternative representations ofland-use change for hydrological variables (Eckhardt et al.,2003). Not all land-use scenario exercises have addressed theeffects of climate change even though they consider time-framesover which a changing climate would be important. This mayreflect a perceived lack of sensitivity to climate variables (e.g.,studies on urban land use: see Allen and Lu, 2003; Barredo et al.,2003, 2004; Loukopoulos and Scholz, 2004; Reginster andRounsevell, 2006), or may be an omission from the analysis(Ahn et al., 2002; Berger and Bolte, 2004).
2.4.6.6 Technology scenariosThe importance of technology has been highlighted
specifically for land-use change (Ewert et al., 2005; Rounsevellet al., 2005, 2006; Abildtrup et al., 2006) and for ecosystemservice changes, such as agricultural production, watermanagement, or climate regulation (Easterling et al., 2003;Nelson et al., 2005). Technological change is also a principaldriver of GHG emissions. Since the TAR, scenarios addressingdifferent technology pathways for climate change mitigation andadaptation have increased in number (see Nakićenović et al.,2007). Technological change can be treated as an exogenousfactor to the economic system or be endogenously driventhrough economic and political incentives. Recent modellingexercises have represented theories on technical and institutional
innovation, such as the ‘Induced Innovation Theory’, in scenariodevelopment (Grübler et al., 1999; Grubb et al., 2002), althoughmore work is needed to refine these methods.
For integrated global scenario exercises, the rate andmagnitude of technological development is often based onexpert judgements and mental models. Storyline assumptionsare then used to modify the input parameters of environmentalmodels (e.g., for ecosystems, land use, or climate) prior toconducting model simulations (e.g., Millennium EcosystemAssessment, 2005; Ewert et al., 2005). Such an approach isuseful in demonstrating the relative sensitivity of differentsystems to technological change, but the role of technologyremains a key uncertainty in characterisations of the future, withsome arguing that only simple models should be used inconstructing scenarios (Casman et al., 1999). In particular,questions such as about the rates of uptake and diffusion of newtechnologies deserve greater attention, especially as this affectsadaptation to climate change (Easterling et al., 2003). However,only a few studies have tackled technology, suggesting animbalance in the treatment of environmental change driverswithin many CCIAV scenario studies, which future work shouldseek to redress.
2.4.6.7 Adaptation scenariosLimited attention has been paid to characterising alternative
pathways of future adaptation. Narrative information withinscenarios can assist in characterising potential adaptiveresponses to climate change. For instance, the determinants ofadaptive capacity and their indicators have been identified forEurope through questionnaire survey (Schröter et al., 2005b).Empirical relationships between these indicators and populationand GDP from 1960 to 2000 were also established and appliedto downscaled, SRES-based GDP and population projections inorder to derive scenarios of adaptive capacity (see Section2.4.6.4). The SRES storylines have also been interpreted usingGDP per capita scenarios to estimate, in one study, the exposureof human populations under climate change to coastal flooding,based on future standards of coastal defences (Nicholls, 2004)and, in a second, access to safe water with respect to theincidence of diarrhoea (Hijioka et al., 2002). The rate ofadaptation to climate change was analysed for the agriculturesector using alternative scenarios of innovation uptake(Easterling et al., 2003) by applying different maize yields,representing adaptation scenarios ranging from no adaptationthrough lagged adaptation rates and responses (following alogistic curve) to perfect (clairvoyant) adaptation (Easterling etal., 2003). This work showed the importance of impliedadaptation rates at the farm scale, indicating that clairvoyantapproaches to adaptation (most commonly used in CCIAVstudies) are likely to overestimate the capacity of individuals torespond to climate change.
One adaptation strategy not considered by Easterling et al.(2003) was land-use change, in the form of autonomousadaptation to climate change driven by the decisions ofindividual land users (Berry et al., 2006). The land-use changescenarios reported previously can, therefore, be thought of asadaptation scenarios. Future studies, following consultation withkey stakeholders, are more likely to include adaptation explicitly
New assessment methods and the characterisation of future conditions Chapter 2
156

Chapter 2 New assessment methods and the characterisation of future conditions
157
Box 2.7. SRES-based land-use and land-cover characterisations
Future land use was estimated by most of the IAMs used to characterise the SRES storylines, but estimates for any onestoryline are model-dependent, and therefore vary widely. For example, under the B2 storyline, the change in the global areaof grassland between 1990 and 2050 varies between −49 and +628 million ha (Mha), with the marker scenario giving achange of +167 Mha (Nakicenovic et al., 2000). The IAM used to characterise the A2 marker scenario did not include land-cover change, so changes under the A1 scenario were assumed to apply also to A2. Given the differences in socio-economicdrivers between A1 and A2 that can affect land-use change, this assumption is not appropriate. Nor do the SRES land-coverscenarios include the effect of climate change on future land cover. This lack of internal consistency will especially affect therepresentation of agricultural land use, where changes in crop productivity play an important role (Ewert et al., 2005; Audsleyet al., 2006). A proportional approach to downscaling the SRES land-cover scenarios has been applied to global ecosystemmodelling (Arnell et al., 2004) by assuming uniform rates of change everywhere within an SRES macro-region. In practice,however, land-cover change is likely to be greatest where population and population growth rates are greatest. A mismatchwas also found in some of the SRES storylines, and for some regions, between recent trends and projected trends forcropland and forestry (Arnell et al., 2004).
More sophisticated downscaling of the SRES scenarioshas been undertaken at the regional scale within Europe(Kankaanpää and Carter, 2004; Ewert et al., 2005;Rounsevell et al., 2005, 2006; Abildtrup et al., 2006;Audsley et al., 2006; van Meijl et al., 2006). These analyseshighlighted the potential role of non-climate change driversin future land-use change. Indeed, climate change wasshown in many examples to have a negligible effect onland use compared with socio-economic change (Schröteret al., 2005b). Technology, especially as it affects crop yielddevelopment, is an important determinant of futureagricultural land use (and much more important thanclimate change), contributing to declines in agriculturalareas of both cropland and grassland by as much as 50%by 2080 under the A1FI and A2 scenarios (Rounsevell etal., 2006). Such declines in land use did not occur withinthe B2 scenario, which assumes more extensiveagricultural management, such as ‘organic’ productionsystems, or the widespread substitution of agriculturalfood and fibre production by bioenergy crops. Thishighlights the role of policy decisions in moderating futureland-use change. However, broad-scale changes oftenbelie large potential differences in the spatial distributionof land-use change that can occur at the sub-regionalscale (Schröter et al., 2005b; see also Figure 2.7), andthese spatial patterns may have greater effects on CCIAVthan the overall changes in land-use quantities (Metzger etal., 2006; Reidsma et al., 2006).
Figure 2.7. Percentage change in cropland area (for food production)by 2080, compared with the baseline in 2000 for the four SRESstorylines (A1FI, A2, B1, B2) with climate calculated by the HadCM3AOGCM. From Schröter et al., 2005b. Reprinted with permissionfrom AAAS.

as part of socio-economic scenario development, hence offeringthe possibility of gauging the effectiveness of adaptation optionsin comparison to scenarios without adaptation (Holman et al.,2005b).
2.4.6.8 Mitigation/stabilisation scenariosMitigation scenarios (also known as climate intervention or
climate policy scenarios) are defined in the TAR (Morita et al.,2001), as scenarios that “(1) include explicit policies and/ormeasures, the primary goal of which is to reduce GHG emissions(e.g., carbon taxes) and/or (2) mention no climate policies and/ormeasures, but assume temporal changes in GHG emissionsources or drivers required to achieve particular climate targets(e.g., GHG emission levels, GHG concentration levels, radiativeforcing levels, temperature increase or sea level rise limits).”Stabilisation scenarios are an important subset of inversemitigation scenarios, describing futures in which emissionsreductions are undertaken so that GHG concentrations, radiativeforcing, or global average temperature change do not exceed aprescribed limit.
Although a wide variety of mitigation scenarios have beendeveloped, most focus on economic and technological aspects ofemissions reductions (see Morita et al., 2001; van Vuuren et al.,2006; Nakićenović et al., 2007). The lack of detailed climatechange projections derived from mitigation scenarios hashindered impact assessment. Simple climate models have been
used to explore the implications for global mean temperature(see Box 2.8 and Nakićenović et al., 2007), but few AOGCMruns have been undertaken (see Meehl et al., 2007, for recentexamples), with few direct applications in regional impactassessments (e.g., Parry et al., 2001). An alternative approachuses simple climate model projections of global warming understabilisation to scale AOGCM patterns of climate changeassuming unmitigated emissions, and then uses the resultingscenarios to assess regional impacts (e.g., Bakkenes et al., 2006).
The scarcity of regional socio-economic, land-use and otherdetail commensurate with a mitigated future has also hinderedimpact assessment (see discussion in Arnell et al., 2002).Alternative approaches include using SRES scenarios assurrogates for some stabilisation scenarios (Swart et al., 2002;see Table 2.4), for example to assess impacts on ecosystems(Leemans and Eickhout, 2004) and coastal regions (Nicholls andLowe, 2004), demonstrating that socio-economic assumptionsare a key determinant of vulnerability. Note that WG I reportsAOGCM experiments forced by the SRES A1B and B1emissions pathways up to 2100 followed by stabilisation ofconcentrations at roughly 715 and 550 ppm CO2 (equated to 835and 590 ppm equivalent CO2, accounting for other GHGs: seeMeehl et al., 2007).
A second approach associates impacts with particular levelsor rates of climate change and may also determine the emissionsand concentration paths that would avoid these outcomes.
New assessment methods and the characterisation of future conditions Chapter 2
158
Box 2.8. CO2 stabilisation and global mean temperature response
Global mean annual temperature (GMAT) is the metric most commonly employed by the IPCC and adopted in the internationalpolicy arena to summarise future changes in global climate and their likely impacts (see Chapter 19, Box 19.2). Projections ofglobal mean warming during the 21st century for the six SRES illustrative scenarios are presented by WG I (Meehl et al., 2007)and summarised in Figure 2.8. These are baseline scenarios assuming no explicit climate policy (see Box 2.2). A large numberof impact studies reported by WG II have been conducted for projection periods centred on the 2020s, 2050s and 2080s10,but only best estimates of GMAT change for these periods were available for three SRES scenarios based on AOGCMs(coloured dots in the middle panel of Figure 2.8). Best estimates (red dots) and likely ranges (red bars) for all six SRES scenariosare reported only for the period 2090-2099. Ranges are based on a hierarchy of models, observational constraints and expertjudgement (Meehl et al., 2007).
A more comprehensive set of projections for these earlier time periods as well as the 2090s is presented in the lower panel ofFigure 2.8. These are based on a simple climate model (SCM) and are also reported in WG I (Meehl et al., 2007, Figure 10.26).Although SCM projections for 2090-2099 contributed to the composite information used to construct the likely ranges shownin the middle panel, the projections shown in the middle and lower panels should not be compared directly as they wereconstructed using different approaches. The SCM projections are included to assist the reader in interpreting how the timingand range of uncertainty in projections of warming can vary according to emissions scenario. They indicate that the rate ofwarming in the early 21st century is affected little by different emissions scenarios (brown bars in Figure 2.8), but by mid-century the choice of emissions scenario becomes more important for the magnitude of warming (blue bars). By late century,differences between scenarios are large (e.g. red bars in middle panel; orange and red bars in lower panel), and multi-modelmean warming for the lowest emissions scenario (B1) is more than 2°C lower than for the highest (A1FI).
GHG mitigation is expected to reduce GMAT change relative to baseline emissions, which in turn could avoid some adverseimpacts of climate change. To indicate the projected effect of mitigation on temperature during the 21st century, and in the
10 30-year averaging periods for model projections held at the IPCC Data Distribution Centre.
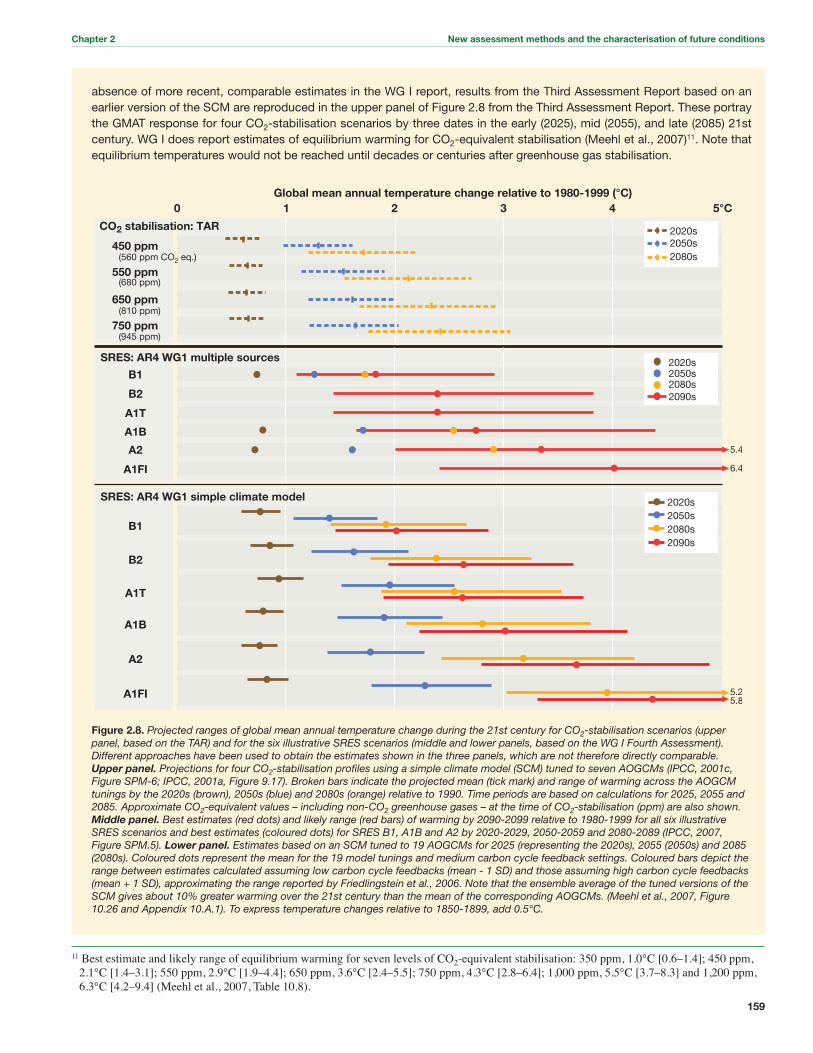
Chapter 2 New assessment methods and the characterisation of future conditions
159
absence of more recent, comparable estimates in the WG I report, results from the Third Assessment Report based on anearlier version of the SCM are reproduced in the upper panel of Figure 2.8 from the Third Assessment Report. These portraythe GMAT response for four CO2-stabilisation scenarios by three dates in the early (2025), mid (2055), and late (2085) 21stcentury. WG I does report estimates of equilibrium warming for CO2-equivalent stabilisation (Meehl et al., 2007)11. Note thatequilibrium temperatures would not be reached until decades or centuries after greenhouse gas stabilisation.
Figure 2.8. Projected ranges of global mean annual temperature change during the 21st century for CO2-stabilisation scenarios (upperpanel, based on the TAR) and for the six illustrative SRES scenarios (middle and lower panels, based on the WG I Fourth Assessment).Different approaches have been used to obtain the estimates shown in the three panels, which are not therefore directly comparable.Upper panel. Projections for four CO2-stabilisation profiles using a simple climate model (SCM) tuned to seven AOGCMs (IPCC, 2001c,Figure SPM-6; IPCC, 2001a, Figure 9.17). Broken bars indicate the projected mean (tick mark) and range of warming across the AOGCMtunings by the 2020s (brown), 2050s (blue) and 2080s (orange) relative to 1990. Time periods are based on calculations for 2025, 2055 and2085. Approximate CO2-equivalent values – including non-CO2 greenhouse gases – at the time of CO2-stabilisation (ppm) are also shown.Middle panel. Best estimates (red dots) and likely range (red bars) of warming by 2090-2099 relative to 1980-1999 for all six illustrativeSRES scenarios and best estimates (coloured dots) for SRES B1, A1B and A2 by 2020-2029, 2050-2059 and 2080-2089 (IPCC, 2007,Figure SPM.5). Lower panel. Estimates based on an SCM tuned to 19 AOGCMs for 2025 (representing the 2020s), 2055 (2050s) and 2085(2080s). Coloured dots represent the mean for the 19 model tunings and medium carbon cycle feedback settings. Coloured bars depict therange between estimates calculated assuming low carbon cycle feedbacks (mean - 1 SD) and those assuming high carbon cycle feedbacks(mean + 1 SD), approximating the range reported by Friedlingstein et al., 2006. Note that the ensemble average of the tuned versions of theSCM gives about 10% greater warming over the 21st century than the mean of the corresponding AOGCMs. (Meehl et al., 2007, Figure10.26 and Appendix 10.A.1). To express temperature changes relative to 1850-1899, add 0.5°C.
11 Best estimate and likely range of equilibrium warming for seven levels of CO2-equivalent stabilisation: 350 ppm, 1.0°C [0.6–1.4]; 450 ppm,2.1°C [1.4–3.1]; 550 ppm, 2.9°C [1.9–4.4]; 650 ppm, 3.6°C [2.4–5.5]; 750 ppm, 4.3°C [2.8–6.4]; 1,000 ppm, 5.5°C [3.7–8.3] and 1,200 ppm,6.3°C [4.2–9.4] (Meehl et al., 2007, Table 10.8).

Climate change and impact outcomes have been identified basedon criteria for dangerous interference with the climate system(Mastrandrea and Schneider, 2004; O’Neill and Oppenheimer,2004; Wigley, 2004; Harvey, 2007) or on meta-analysis of theliterature (Hitz and Smith, 2004). A limitation of these types ofanalyses is that they are not based on consistent assumptionsabout socio-economic conditions, adaptation and sectoralinteractions, and regional climate change.
A third approach constructs a single set of scenarioassumptions by drawing on information from a variety ofdifferent sources. For example, one set of analyses combinesclimate change projections from the HadCM2 model based onthe S750 and S550 CO2-stabilisation scenarios with socio-economic information from the IS92a reference scenario in orderto assess coastal flooding and loss of coastal wetlands from long-term sea level rise (Nicholls, 2004; Hall et al., 2005) and toestimate global impacts on natural vegetation, water resources,crop yield and food security, and malaria (Parry et al., 2001;Arnell et al., 2002).
2.4.6.9 Scenario integrationThe widespread adoption of SRES-based scenarios in studies
described in this report (see Boxes 2.2 to 2.7) acknowledges thedesirability of seeking consistent scenario application acrossdifferent studies and regions. For instance, SRES-baseddownscaled socio-economic projections were used inconjunction with SRES-derived climate scenarios in a set ofglobal impact studies (Arnell et al., 2004; see Section 2.4.6.4).At a regional scale, multiple scenarios for the main globalchange drivers (socio-economic factors, atmospheric CO2concentration, climate factors, land use, and technology), weredeveloped for Europe, based on interpretations of the globalIPCC SRES storylines (Schröter et al., 2005b; see Box 2.7).
Nationally, scenarios of socio-economic development (Kaivo-oja et al., 2004), climate (Jylhä et al., 2004), sea level (Johanssonet al., 2004), surface ozone exposure (Laurila et al., 2004), andsulphur and nitrogen deposition (Syri et al., 2004) were developedfor Finland. Although the SRES driving factors were used as anintegrating framework, consistency between scenario types couldonly be ensured by regional modelling, as simple downscalingfrom the global scenarios ignored important regionaldependencies (e.g., between climate and air pollution and betweenair pressure and sea level: see Carter et al., 2004). Similarexercises have also been conducted in the east (Lorenzoni et al.,2000) and north-west (Holman et al., 2005b) of England.
Integration across scales was emphasised in the scenariosdeveloped for the Millennium Ecosystem Assessment (MA),carried out between 2001 and 2005 to assess the consequences ofecosystem change for human well-being (Millennium EcosystemAssessment, 2005). An SAS approach (see Section 2.4.5) wasfollowed in developing scenarios at scales ranging from regionalthrough national, basin, and local (Lebel et al., 2005). Manydiffered greatly from the set of global MA scenarios that were alsoconstructed (Alcamo et al., 2005). This is due, in part, to differentstakeholders being involved in the development of scenarios ateach scale, but also reflects an absence of feedbacks from the sub-global to global scales (Lebel et al., 2005).
2.4.7 Large-scale singularities
Large-scale singularities are extreme, sometimes irreversible,changes in the Earth system such as abrupt cessation of theAtlantic Meridional Overturning Circulation (MOC) or meltingof ice sheets in Greenland or West Antarctica (see Meehl et al.,2007; Randall et al., 2007; also Chapter 19, Section 19.3.5).With few exceptions, such events are not taken into account insocio-economic assessments of climate change. Shutdown of theMOC is simulated in Earth system models of intermediatecomplexity subject to large, rapid forcing (Meehl et al., 2007;also Chapter 19, Section 19.3.5.3). Artificial ‘hosing’experiments, assuming the injection of large amounts offreshwater into the oceans at high latitudes, also have beenconducted using AOGCMs (e.g., Vellinga and Wood, 2002;Wood et al., 2003) to induce an MOC shutdown. Substantialreduction of greenhouse warming occurs in the NorthernHemisphere, with a net cooling occurring mostly in the NorthAtlantic region (Wood et al., 2003). Such scenarios havesubsequently been applied in impact studies (Higgins andVellinga, 2004; Higgins and Schneider, 2005; also see Chapter19, Section 19.4.2.5)
Complete deglaciation of Greenland and the West AntarcticaIce Sheet (WAIS) would raise sea level by 7 m and about 5 m,respectively (Meehl et al., 2007; also Chapter 19, Section19.3.5.2). One recent study assumed an extreme rate of sea levelrise, 5 m by 2100 (Nicholls et al., 2005), to test the limits ofadaptation and decision-making (Dawson et al., 2005; Tol et al.,2006). A second study employed a scenario of rapid sea levelrise of 2.2 m by 2100 by adding an ice sheet contribution to thehighest TAR projection for the period, with the increasecontinuing unabated after 2100 (Arnell et al., 2005). Both studiesdescribe the potential impacts of such a scenario in Europe,based on expert assessments.
2.4.8 Probabilistic futures
Since the TAR, many studies have produced probabilisticrepresentations of future climate change and socio-economicconditions suitable for use in impact assessment. The choicesfaced in these studies include which components of socio-economic and climate change models to treat probabilisticallyand how to define the input probability density functions (pdfs)for each component. Integrated approaches derive pdfs ofclimate change from input pdfs for emissions and for key
New assessment methods and the characterisation of future conditions Chapter 2
160
SRES illustrativescenario
Description ofemissions
Surrogate stabilisationscenario
A1FI High end of SRES range Does not stabilise
A1B Intermediate case 750 ppm
A1T Intermediate/low case 650 ppm
A2 High case Does not stabilise
B1 Low end of SRES range 550 ppm
B2 Intermediate/low case 650 ppm
Table 2.4. The six SRES illustrative scenarios and the stabilisationscenarios (parts per million CO2) they most resemble (based on Swartet al., 2002).

parameters in models of GHG cycles, radiative forcing, and theclimate system. The models then sample repeatedly from theuncertainty distributions for inputs and model parameters, inorder to produce a pdf of outcomes, e.g., global temperature andprecipitation change. Either simple climate models (e.g., Wigleyand Raper, 2001) or climate models of intermediate complexity(Forest et al., 2002) have been applied.
Alternative methods of developing pdfs for emissions aredescribed in Nakićenović et al. (2007), but they all requiresubjective judgement in the weighting of different futureoutcomes, which is a matter of considerable debate (Parson etal., 2006). Some argue that this should be done by experts,otherwise decision-makers will inevitably assign probabilitiesthemselves without the benefit of established techniques tocontrol well-known biases in subjective judgements (Schneider,2001, 2002; Webster et al., 2002, 2003). Others argue that theclimate change issue is characterised by ‘deep uncertainty’ – i.e.,system models, parameter values, and interactions are unknownor contested – and therefore the elicited probabilities may notaccurately represent the nature of the uncertainties faced(Grübler and Nakićenović, 2001; Lempert et al., 2004).
The most important uncertainties to be represented in pdfs ofregional climate change, the scale of greatest relevance forimpact assessments, are GHG emissions, climate sensitivity, andinter-model differences in climatic variables at the regionalscale. Other important factors include downscaling techniques,and regional forcings such as aerosols and land-cover change(e.g., Dessai, 2005). A rapidly growing literature reporting pdfsof climate sensitivity is providing a significant methodologicaladvance over the long-held IPCC estimate of 1.5°C to 4.5°C forthe (non-probabilistic) range of global mean annual temperaturechange for a doubling of atmospheric CO2 (see Meehl et al.,2007, for a detailed discussion). For regional change, recentmethods of applying different weighting schemes to multi-modelensemble projections of climate are described in Christensen etal. (2007a). Other work has examined the full chain ofuncertainties from emissions to regional climate. For example,Dessai et al. (2005b) tested the sensitivity of probabilisticregional climate changes to a range of uncertainty sourcesincluding climate sensitivity, GCM simulations, and emissionsscenarios. The ENSEMBLES research project is modellingvarious sources of uncertainty to produce regional probabilitiesof climate change and its impacts for Europe (Hewitt andGriggs, 2004).
Methods to translate probabilistic climate changes for use inimpact assessment (e.g., New and Hulme, 2000; Wilby andHarris, 2006; Fowler et al., 2007) include those assessingprobabilities of impact threshold exceedance (e.g., Jones, 2000,2004; Jones et al., 2007). Wilby and Harris (2006) combinedinformation from various sources of uncertainty (emissionsscenarios, GCMs, statistical downscaling, and hydrologicalmodel parameters) to estimate probabilities of low flows in theRiver Thames basin, finding the most important uncertainty tobe the differences between the GCMs, a conclusion supported inwater resources assessments in Australia (Jones and Page, 2001;Jones et al., 2005). Scholze et al. (2006) quantified risks ofchanges in key ecosystem processes on a global scale, bygrouping scenarios according to ranges of global mean
temperature change rather than considering probabilities ofindividual emissions scenarios. Probabilistic impact studiessampling across emissions, climate sensitivity, and regionalclimate change uncertainties have been conducted for wheatyield (Howden and Jones, 2004; Luo et al., 2005), coralbleaching (Jones, 2004; Wooldridge et al., 2005), waterresources (Jones and Page, 2001; Jones et al., 2005), andfreshwater ecology (Preston, 2006).
2.5 Key conclusions and future directions
Climate change impact, adaptation and vulnerability(CCIAV) assessment has now moved far beyond its early statusas a speculative, academic endeavour. As reported elsewhere inthis volume, climate change is already under way, impacts arebeing felt, and some adaptation is occurring. This is propellingCCIAV assessment from being an exclusively research-orientedactivity towards analytical frameworks that are designed forpractical decision-making. These comprise a limited set ofapproaches (described in Section 2.2), within which a largerange of methods can be applied.
The aims of research and decision analysis differ somewhatin their treatment of uncertainty. Research aims to understandand reduce uncertainty, whereas decision analysis seeks tomanage uncertainty in order to prioritise and implement actions.Therefore, while improved scientific understanding may have ledto a narrowing of the range of uncertainty in some cases (e.g.,increased consensus among GCM projections of regional climatechange) and a widening in others (e.g., an expanded range ofestimates of adaptive capacity and vulnerability obtained afteraccounting for alternative pathways of socio-economic andtechnological development), these results are largely amanifestation of advances in methods for treating uncertainty.
Decision makers are increasingly calling upon the researchcommunity to provide:
• good-quality information on what impacts are occurringnow, their location and the groups or systems most affected,
• reliable estimates of the impacts to be expected underprojected climate change,
• early warning of potentially alarming or irreversible impacts,• estimation of different risks and opportunities associated
with a changing climate,• effective approaches for identifying and evaluating both
existing and prospective adaptation measures and strategies,• credible methods of costing different outcomes and response
measures,• an adequate basis to compare and prioritise alternative
response measures, including both adaptation and mitigation.
To meet these demands, future research efforts need to addressa set of methodological, technical and information gaps that callfor certain actions.
• Continued development of risk-management techniques.Methods and tools should be designed both to addressspecific climate change problems and to introduce them intomainstream policy and planning decision-making.
Chapter 2 New assessment methods and the characterisation of future conditions
161

• New methods and tools appropriate for regional and localapplication. An increasing focus on adaptation to climatechange at local scales requires new methods, scenarios, andmodels to address emerging issues. New approaches are alsoreconciling scale issues in scenario development; forexample by improving methods of interpreting andquantifying regional storylines, and through the nesting ofscenarios at different scales.
• Cross-sectoral assessments. Limited by data and technicalcomplexity, most CCIAV assessments have so far focusedon single sectors. However, impacts of climate change onone sector will have implications, directly and/or indirectly,for others – some adverse and some beneficial. To be morepolicy-relevant, future analyses need to account for theinteractions between different sectors, particularly at nationallevel but also through global trade and financial flows.
• Collection of empirical knowledge from past experience.Experience gained in dealing with climate-related naturaldisasters, documented using both modern methods andtraditional knowledge, can assist in understanding the copingstrategies and adaptive capacity of vulnerable communities,and in defining critical thresholds of impact to be avoided.
• Enhanced observation networks and improved access toexisting data. CCIAV studies have increasing requirementsfor data describing present-day environmental and socio-economic conditions. Some regions, especially in developingcountries, have limited access to existing data, and urgentattention is required to arrest the decline of observationnetworks. Integrated monitoring systems are needed forobserving human-environment interactions.
• Consistent approaches in relation to scenarios in otherassessments. Integration of climate-related scenarios withthose widely accepted and used by other international bodiesis desirable (i.e., mainstreaming). The exchange of ideas andinformation between the research and policy communitieswill greatly improve scenario quality, usage, and acceptance.
• Improved scenarios for poorly specified indicators. CCIAVoutcomes are highly sensitive to assumptions about factorssuch as future technology and adaptive capacity that atpresent are poorly understood. For instance, the theories andprocesses of technological innovation and its relationshipwith other indicators such as education, wealth, andgovernance require closer attention, as do studies of theprocesses and costs of adaptation.
• Integrated scenarios. There are shortcomings in howinteractions between key drivers of change are represented inscenarios. Moreover, socio-economic and technologicalscenarios need to account for the costs and other ancillaryeffects of both mitigation and adaptation actions, which atpresent are rarely considered.
• Provision of improved climate predictions for near-termplanning horizons. Many of the most severe impacts ofclimate change are manifest through extreme weather andclimate events. Resource planners increasingly need reliableinformation, years to decades ahead, on the risks of adverseweather events at the scales of river catchments andcommunities.
• Effective communication of the risks and uncertainties ofclimate change. To gain trust and improve decisions,awareness-building and dialogue is necessary between thosestakeholders with knowledge to share (including researchers)and with the wider public.
References
Abildtrup, J., E.Audsley, M. Fekete-Farkas, C. Giupponi, M. Gylling, P. Rosato andM.D.A. Rounsevell, 2006: Socio-economic scenario development for the as-sessment of climate change impacts on agricultural land use: a pairwise compar-ison approach. Environ. Sci. Policy, 9, 101-115.
ACIA, 2005:Arctic Climate Impact Assessment.Cambridge University Press, Cam-bridge, 1042 pp.
Acosta-Michlik, L. and M.D.A. Rounsevell, 2005: From generic indices to adap-tive agents: shifting foci in assessing vulnerability to the combined impacts ofclimate change and globalization. IHDPUpdate: Newsletter of the InternationalHumanDimensions Programme onGlobal Environmental Change, 01/2005, 14-15.
ADB, 2005:Climate Proofing: ARisk-basedApproach to Adaptation. Pacific Stud-ies Series, Pub. Stock No. 030905, Asian Development Bank, Manila, 191 pp.
Adger, W.N., 2006: Vulnerability. Global Environ. Chang., 16, 268-281.Aggarwal, P.K., N. Kalra, S. Chander and H. Pathak, 2006: InfoCrop: a dynamic
simulation model for the assessment of crop yields, losses due to pests and envi-ronmental impact of agro-ecosystems in tropical environments – model descrip-tion. Agr. Syst., 89, 1-25.
Ahmad, Q.K., R.A. Warrick, T.E. Downing, S. Nishioka, K.S. Parikh, C. Parmesan,S.H. Schneider, F. Toth and G. Yohe, 2001: Methods and tools. Climate Change2001: Impacts, Adaptation, and Vulnerability. Contribution ofII to the Third Assessment Report of the Intergovernmental Panel on ClimateChange, J.J. McCarthy, O.F. Canziani, N.A. Leary, D.J. Dokken and K.S. White,Eds., Cambridge University Press, Cambridge, 105-143.
Ahn, S.E., A.J. Plantinga and R.J. Alig, 2002: Determinants and projections of landuse in the South Central United States. South. J. Appl. For., 26, 78-84.
Alcamo, J., 2001: Scenarios as a tool for international environmental assessments.Environmental Issue Report No 24, European Environmental Agency, 31.
Alcamo, J., P. Mayerhofer, R. Guardans, T. van Harmelen, J. van Minnen, J.Onigkeit, M. Posch and B. de Vries, 2002: An integrated assessment of regionalair pollution and climate change in Europe: findings of the AIR-CLIM Project.Environ. Sci. Policy, 4, 257-272.
Alcamo, J., D. van Vuuren, C. Ringler, J. Alder, E. Bennett, D. Lodge, T. Masui, T.Morita, M. Rosegrant, O. Sala, K. Schulze and M. Zurek, 2005: Methodologyfor developing the MAscenarios.Ecosystems andHumanWell-Being: Scenarios:Findings of the Scenarios Working Group (Millennium Ecosystem AssessmentSeries), S.R. Carpenter, P.L. Pingali, E.M. Bennett and M.B. Zurek, Eds., IslandPress, Washington, D.C., 145-172.
Alcamo, J., M. Flörke and M. Märker, 2006a: Changes in Global Water ResourcesDriven by Socio-economic and Climatic Changes. Research Report, Center forEnvironmental Systems Research, University of Kassel, Germany, 34 pp.
Alcamo, J., K. Kok, G. Busch, J. Priess, B. Eickhout, M.D.A. Rounsevell, D. Roth-man and M. Heistermann, 2006b: Searching for the future of land: scenarios fromthe local to global scale. Land Use and Land Cover Change: Local Processes,Global Impacts, E. Lambin and H. Geist, Eds., Global Change IGBP Series,Springer-Verlag, Berlin, 137-156.
Allen, J. and K. Lu, 2003: Modeling and prediction of future urban growth in theCharleston region of South Carolina: a GIS-based integrated approach. Conserv.Ecol., 8, 2. [Accessed 26.02.07: http://www.consecol.org/vol8/iss2/art2.]
Anyah, R. and F. Semazzi, 2004: Simulation of the sensitivity of Lake Victoriabasin climate to lake surface temperatures. Theor. Appl. Climatol., 79, 55-69.
Araújo, M.B. and C. Rahbek, 2006: How does climate change affect biodiversity?Science, 313, 1396-1397.
Arenstam Gibbons, S.J. and R.J. Nicholls, 2006: Island abandonment and sea-levelrise: an historical analog from the Chesapeake Bay, USA. Global Environ.Chang., 16, 40-47.
Arnell, N., D. Hudson and R. Jones, 2003: Climate change scenarios from a re-gional climate model: estimating change in runoff in southernAfrica. J. Geophys.
New assessment methods and the characterisation of future conditions Chapter 2
162

Res.–Atmos., 108(D16), doi:10.1029/2002JD002782.Arnell, N., E. Tompkins, N. Adger and K. Delaney, 2005: Vulnerability to abrupt
climate change in Europe. Technical Report 34, Tyndall Centre for ClimateChange Research, Norwich, 63 pp.
Arnell, N.W., 2004: Climate change and global water resources: SRES emissionsand socio-economic scenarios. Global Environ. Chang., 14, 31-52.
Arnell, N.W., M.G.R. Cannell, M. Hulme, R.S. Kovats, J.F.B. Mitchell, R.J.Nicholls, M.L. Parry, M.T.J. Livermore and A. White, 2002: The consequencesof CO2 stabilisation for the impacts of climate change.Climatic Change, 53, 413-446.
Arnell, N.W., M.J.L. Livermore, S. Kovats, P.E. Levy, R. Nicholls, M.L. Parry andS.R. Gaffin, 2004: Climate and socio-economic scenarios for global-scale cli-mate change impacts assessments: characterising the SRES storylines. GlobalEnviron. Chang., 14, 3-20.
AS/NZS, 2004: Risk Management. Australian/New Zealand Standard for RiskManagement, AS/NZS 4360:2004. 38 pp.
Audsley, E., K.R. Pearn, C. Simota, G. Cojocaru, E. Koutsidou, M.D.A. Rounsev-ell, M. Trnka and V.Alexandrov, 2006: What can scenario modelling tell us aboutfuture European scale agricultural land use and what not? Environ. Sci. Policy, 9,148-162.
Australian Greenhouse Office, 2006: Climate Change Impacts and Risk Manage-ment: AGuide for Business and Government. Prepared for the Australian Green-house Office by Broadleaf Capital International and Marsden Jacob Associates,73 pp.
Bakkenes, M., J. Alkemade, F. Ihle, R. Leemans and J. Latour, 2002: Assessing theeffects of forecasted climate change on the diversity and distribution of Europeanhigher plants for 2050. Glob. Change Biol., 8, 390-407.
Bakkenes, M., B. Eickhout and R.Alkemade, 2006: Impacts of different climate sta-bilisation scenarios on plant species in Europe. Global Environ. Chang., 16, 19-28.
Barlage, M.J., P.L. Richards, P.J. Sousounis and A.J. Brenner, 2002: Impacts of cli-mate change and land use change on runoff from a Great Lakes watershed. J.Great Lakes Res., 28, 568-582.
Bärlund, I. and T.R. Carter, 2002: Integrated global change scenarios: surveyinguser needs in Finland. Global Environ. Chang., 12, 219-229.
Barredo, J.I., M. Kasanko, N. McCormick and C. Lavalle, 2003: Modelling dy-namic spatial processes: simulation of urban future scenarios through cellular au-tomata. Landscape Urban Plan., 64, 145-160.
Barredo, J.I., L. Demicheli, C. Lavalle, M. Kasanko and N. McCormick, 2004:Modelling future urban scenarios in developing countries: an application casestudy in Lagos, Nigeria. Environ. Plann. B, 31, 65-84.
Bathurst, J.C., G. Moretti,A. El-Hames,A. Moaven-Hashemi andA. Burton, 2005:Scenario modelling of basin-scale, shallow landslide sediment yield, Valsassina,Italian Southern Alps. Nat. Hazard. Earth Sys., 5, 189-202.
Beniston, M., D.B. Stephenson, O.B. Christensen, C.A.T. Ferro, C. Frei, S. Goyette,K. Halsnaes, T. Holt, K. Jylhä, B. Koffi, J. Palutikof, R. Schöll, T. Semmler andK. Woth, 2007: Future extreme events in European climate: an exploration of re-gional climate model projections. Climatic Change, 81 (Suppl. 1), 71-95.
Bennett, E.M., S.R. Carpenter, G.D. Peterson, G.S. Cumming, M. Zurek and P. Pin-gali, 2003: Why global scenarios need ecology. Front. Ecol. Environ., 1, 322-329.
Berger, P.A. and J.P. Bolte, 2004: Evaluating the impact of policy options on agri-cultural landscapes: an alternative-futures approach. Ecol. Appl., 14, 342-354.
Berkhout, F., J. Hertin and A. Jordan, 2002: Socio-economic futures in climatechange impact assessment: using scenarios as “learning machines”.Global Env-iron. Chang., 12, 83-95.
Berkhout, F., J. Hertin and D.M. Gann, 2006: Learning to adapt: organisationaladaptation to climate change impacts. Climatic Change, 78, 135-156.
Berry, P.M., M.D.A. Rounsevell, P.A. Harrison and E.Audsley, 2006:Assessing thevulnerability of agricultural land use and species to climate change and the roleof policy in facilitating adaptation. Environ. Sci. Policy, 9, 189-204.
Bettencourt, S., R. Croad, P. Freeman, J. Hay, R. Jones, P. King, P. Lal, A. Mearns,G. Miller, I. Pswarayi-Riddihough, A. Simpson, N. Teuatabo, U. Trotz and M.Van Aalst, 2006:Not If but When: Adapting to Natural Hazards in the Pacific Is-lands Region: A Policy Note.The World Bank, East Asia and Pacific Region, Pa-cific Islands Country Management Unit, Washington, DC, 43 pp.
Bhadwal, S. and R. Singh, 2002: Carbon sequestration estimates for forestry optionsunder different land-use scenarios in India. Curr. Sci. India, 83, 1380-1386.
Bindoff, N., J. Willebrand, V.Artale,A. Cazenave, J. Gregory, S. Gulev, K. Hanawa,C.L. Quéré, S. Levitus, Y. Nojiri, C.K. Shum, L. Talley and A. Unnikrishnan,
2007: Observations: oceanic climate change and sea level.Climate Change 2007:The Physical Science Basis. Working Group I Contribution to the Intergovern-mental Panel on Climate Change Fourth Assessment Report, S. Solomon, D. Qin,M. Manning, Z. Chen, M. Marquis, K. B. Averyt, M. Tignor and H. L. Miller,Eds., Cambridge University Press, Cambridge, 385-432.
Bouwer, L.M. and P. Vellinga, 2005: Some rationales for risk sharing and financ-ing adaptation.Water Sci. Technol., 51, 89-95.
Briassoulis, H., 2001: Policy-oriented integrated analysis of land-use change: ananalysis of data needs. Environ. Manage., 27, 1-11.
Brooks, N., W.N. Adger and P.M. Kelly, 2005: The determinants of vulnerabilityand adaptive capacity at the national level and the implications for adaptation.Global Environ. Chang., 15, 151-163.
Burton, I. and M. van Aalst, 2004: Look Before You Leap: A Risk Management Ap-proach for Incorporating Climate Change Adaptation into World Bank Opera-tions. World Bank, Washington, DC, 47 pp.
Burton, I., S. Huq, B. Lim, O. Pilifosova and E.L. Schipper, 2002: From impactsassessment to adaptation priorities: the shaping of adaptation policy. Clim. Pol-icy, 2, 145-159.
Busch, G., 2006: Future European agricultural landscapes: what can we learn fromexisting quantitative land use scenario studies? Agr. Ecosyst. Environ., 114, 121-140.
Caires, S. and A. Sterl, 2005: 100-year return value estimates for ocean wind speedand significant wave height from the ERA-40 data. J. Climate, 18, 1032-1048.
Carter, T.R., M.L. Parry, S. Nishioka, H. Harasawa, R. Christ, P. Epstein, N.S. Jodha,E. Stakhiv and J. Scheraga, 1996: Technical guidelines for assessing climatechange impacts and adaptations. Climate Change 1995: Impacts, Adaptationsand Mitigation of Climate Change: Scientific-Technical Analyses. Contributionof Working Group II to the Second Assessment Report of the IntergovernmentalPanel on Climate Change, R.T. Watson, M.C. Zinyowera and R.H. Moss, Eds.,Cambridge University Press, Cambridge, 823-833.
Carter, T.R., E.L. La Rovere, R.N. Jones, R. Leemans, L.O. Mearns, N. Nakićen-ović A.B. Pittock, S.M. Semenov and J. Skea, 2001: Developing and applyingscenarios. Climate Change 2001: Impacts, Adaptation, and Vulnerability. Con-tribution of Working Group II to the Third Assessment Report of the Intergov-ernmental Panel on Climate Change, J.J. McCarthy, O.F. Canziani, N.A. Leary,D.J. Dokken and K.S. White, Eds., Cambridge University Press, Cambridge, 145-190.
Carter, T.R., S. Fronzek and I. Bärlund, 2004: FINSKEN: a framework for devel-oping consistent global change scenarios for Finland in the 21st century. BorealEnviron. Res., 9, 91-107.
Carter, T.R., K. Jylhä, A. Perrels, S. Fronzek and S. Kankaanpää, Eds., 2005: FI-NADAPT scenarios for the 21st century: alternative futures for considering adap-tation to climate change in Finland. FINADAPT Working Paper 2, FinnishEnvironment Institute Mimeographs 332, Helsinki, 42 pp. [Accessed 26.02.07:http://www.environment.fi/default.asp?contentid=162966&lan=en]
Casman, E.A., M.G. Morgan and H. Dowlatabadi, 1999: Mixed levels of uncer-tainty in complex policy models. Risk Anal., 19, 33-42.
Castles, I. and D. Henderson, 2003: The IPCC emission scenarios: an economic-sta-tistical critique. Energ. Environ., 14, 159-185.
Cebon, P., U. Dahinden, H.C. Davies, D. Imboden and C.G. Jaeger, 1999: Viewsfrom the Alps: Regional Perspectives on Climate Change. MIT Press, Boston,Massachusetts, 536 pp.
Christensen, J.H., B. Hewitson, A. Busuioc, A. Chen, X. Gao, I. Held, R. Jones,W.-T. Kwon, R. Laprise, V.M. Rueda, L.O. Mearns, C.G. Menéndez, J. Räisä-nen, A. Rinke, R.K. Kolli, A. Sarr and P. Whetton, 2007a: Regional climate pro-jections. Climate Change 2007: The Physical Science Basis. Contribution ofWorking Group I to the Intergovernmental Panel on Climate Change Fourth As-sessment Report, S. Solomon, D. Qin, M. Manning, Z. Chen, M. Marquis, K. B.Averyt, M. Tignor and H. L. Miller, Eds., Cambridge University Press, Cam-bridge, 847-940.
Christensen, J.H., T.R. Carter, M. Rummukainen and G. Amanatidis, 2007b: Eval-uating the performance and utility of regional climate models: the PRUDENCEproject. Climatic Change, 81 (Suppl. 1), 1-6.
Church, J.A., J.M. Gregory, P. Huybrechts, M. Kuhn, K. Lambeck, M.T. Nhuan, D.Qin and P.L. Woodworth, 2001: Changes in sea level.Climate Change 2001: TheScientific Basis. Contribution of Working Group I to the Third Assessment Re-port of the Intergovernmental Panel on Climate Change, J.T. Houghton, Y. Ding,D.J. Griggs, M. Noguer, P.J. van der Linden, X. Dai, K. Maskell and C.A. John-son, Eds., Cambridge University Press, Cambridge, 639-693.
CLIMsystems, 2005: SimCLIM Sea Level Scenario Generator Overview of Meth-
Chapter 2 New assessment methods and the characterisation of future conditions
163

ods, R. Warrick, 5 pp. [Accessed 27.02.07: http://www.climsystems.com/site/downloads/?dl=SSLSG_Methods.pdf.]
Cohen, S.J., 1997: Scientist-stakeholder collaboration in integrated assessment ofclimate change: lessons from a case study of Northwest Canada.Environ. Model.Assess., 2, 281-293.
Conde, C. and K. Lonsdale, 2005: Engaging stakeholders in the adaptation process.Adaptation Policy Frameworks for Climate Change: Developing Strategies, Poli-cies and Measures, B. Lim, E. Spanger-Siegfried, I. Burton, E. Malone and S.Huq, Eds., Cambridge University Press, Cambridge and New York, 47-66.
Conde, C., R. Ferrer and S. Orozco, 2006: Climate change and climate variabilityimpacts on rainfed agricultural activities and possible adaptation measures: aMexican case study. Atmosfera, 19, 181-194.
COP, 2005: Five-year programme of work of the Subsidiary Body for Scientificand Technological Advice on impacts, vulnerability and adaptation to climatechange. Decision -/CP.11,Proceedings of Conference of the Parties to the UnitedNations Framework Convention on Climate Change, Montreal, 5 pp. [Accessed27.02.07: http://unfccc.int/adaptation/sbsta_agenda_item_adaptation/items/2673.php.]
Cox, P.M., R.A. Betts, M. Collins, P.P. Harris, C. Huntingford and C.D. Jones, 2004:Amazonian forest dieback under climate-carbon cycle projections for the 21stcentury. Theor. Appl. Climatol., 78, 137-156.
Cubasch, U., G.A. Meehl, G.J. Boer, R.J. Stouffer, M. Dix, A. Noda, C.A. Senior,S. Raper and K.S. Yap, 2001: Projections of future climate change. ClimateChange 2001: The Scientific Basis. Contribution ofWorking Group I to the ThirdAssessment Report of the Intergovernmental Panel on Climate Change, J.T.Houghton, Y. Ding, D.J. Griggs, M. Noguer, P.J. van der Linden, X. Dai, K.Maskell and C.A. Johnson, Eds., Cambridge University Press, Cambridge, 525-582.
Cumming, G.S., J. Alcamo, O. Sala, R. Swart, E.M. Bennett and M. Zurek, 2005:Are existing global scenarios consistent with ecological feedbacks? Ecosystems,8, 143-152.
Dawson, R.J., J.W. Hall, P.D. Bates and R.J. Nicholls, 2005: Quantified analysis ofthe probability of flooding in the Thames Estuary under imaginable worst-case sealevel rise scenarios. Int. J. Water Resour. D., 21, 577-591.
de Koning, G.H.J., P.H. Verburg, A. Veldkamp and L.O. Fresco, 1999: Multi-scalemodelling of land use change dynamics in Ecuador. Agr. Syst., 61, 77-93.
de Nijs, T.C.M., R. de Niet and L. Crommentuijn, 2004: Constructing land-usemaps of the Netherlands in 2030. J. Environ. Manage., 72, 35-42.
DeFries, R.S., L. Bounoua and G.J. Collatz, 2002: Human modification of the land-scape and surface climate in the next fifty years. Glob. Change Biol., 8, 438-458.
Dempsey, R. and A. Fisher, 2005: Consortium for Atlantic Regional Assessment:information tools for community adapation to changes in climate or land use.Risk Anal., 25, 1495-1509.
Denman, K.L., G. Brasseur, A. Chidthaisong, P. Ciais, P. Cox, R.E. Dickinson, D.Hauglustaine, C. Heinze, E. Holland, D. Jacob, U. Lohmann, S. Ramachandran,P.L. Silva Dias, S.C. Wofsy and X. Zhang, 2007: Couplings between changes inthe climate system and biogeochemistry. Climate Change 2007: The PhysicalScience Basis. Contribution ofWorking Group I to the Fourth Assessment Reportof the Intergovernmental Panel on Climate Change, S. Solomon, D. Qin, M. Man-ning, Z. Chen, M. Marquis, K. B. Averyt, M. Tignor and H. L. Miller, Eds., Cam-bridge University Press, Cambridge, 499-588.
Dessai, S., 2005: Robust adaptation decisions amid climate change uncertainties.PhD thesis, School of Environmental Sciences, University of East Anglia, Nor-wich, 281 pp.
Dessai, S. and M. Hulme, 2004: Does climate adaptation policy need probabili-ties? Clim. Policy, 4, 107-128.
Dessai, S., W.N. Adger, M. Hulme, J.R. Turnpenny, J. Köhler and R. Warren, 2004:Defining and experiencing dangerous climate change. Climatic Change, 64, 11-25.
Dessai, S., X. Lu and J.S. Risbey, 2005a: On the role of climate scenarios for adap-tation planning. Global Environ. Chang., 15, 87-97.
Dessai, S., X. Lu and M. Hulme, 2005b: Limited sensitivity analysis of regional cli-mate change probabilities for the 21st century. J. Geophys. Res.–Atmos., 110,doi:10.1029/2005JD005919.
Dietz, T., E. Ostrom and P.C. Stern, 2003: The struggle to govern the commons. Sci-ence, 302, 1907-1912.
Dirnbock, T., S. Dullinger and G. Grabherr, 2003: A regional impact assessment ofclimate and land-use change on alpine vegetation. J. Biogeogr., 30, 401-417.
Discovery Software, 2003: FloodRanger: Educational FloodManagement Game.[Accessed 27.02.07: http://www.discoverysoftware.co.uk/FloodRanger.htm]
Downing, T.E. and A. Patwardhan, 2005:Assessing vulnerability for climate adap-tation. Adaptation Policy Frameworks for Climate Change: Developing Strate-gies, Policies and Measures, B. Lim, E. Spanger-Siegfried, I. Burton, E. Maloneand S. Huq, Eds., Cambridge University Press, Cambridge and New York, 67-90.
Eakin, H., M. Webhe, C. Ávila, G.S. Torres and L.A. Bojórquez-Tapia, 2006: Acomparison of the social vulnerability of grain farmers in Mexico and Argentina.AIACC Working Paper No. 29, Assessment of Impacts and Adaptation to Cli-mate Change in Multiple Regions and Sectors Program, Washington, DC, 50 pp.
Easterling, W.E., N. Chhetri and X. Niu, 2003: Improving the realism of modelingagronomic adaptation to climate change: simulating technological substitution.Climatic Change, 60, 149-173.
Eckhardt, K., L. Breuer and H.G. Frede, 2003: Parameter uncertainty and the sig-nificance of simulated land use change effects. J. Hydrol., 273, 164-176.
Ekstrom, M., B. Hingray, A. Mezghani and P.D. Jones, 2007: Regional climatemodel data used within the SWURVE project. 2. Addressing uncertainty in re-gional climate model data for five European case study areas.Hydrol. Earth Syst.Sc., 11, 1085-1096.
El-Fadel, M., D. Jamali and D. Khorbotly, 2002: Land use, land use change andforestry related GHG emissions in Lebanon: economic valuation and policy op-tions.Water Air Soil Poll., 137, 287-303.
Eriksen, S.H., K. Brown and P.M. Kelly, 2005: The dynamics of vulnerability: lo-cating coping strategies in Kenya and Tanzania. Geogr. J., 171, 287-305.
Ewert, F., M.D.A. Rounsevell, I. Reginster, M. Metzger and R. Leemans, 2005:Future scenarios of European agricultural land use. I. Estimating changes in cropproductivity. Agr. Ecosyst. Environ., 107, 101-116.
Fankhauser, S. and R.S.J. Tol, 2005: On climate change and economic growth. Re-sour. Energy Econ., 27, 1-17.
Fearnside, P.M., 2000: Global warming and tropical land-use change: greenhousegas emissions from biomass burning, decomposition and soils in forest conver-sion, shifting cultivation and secondary vegetation. Climatic Change, 46, 115-158.
Feenstra, J., I. Burton, J.B. Smith and R.S.J. Tol, Eds., 1998: Handbook on Meth-ods of Climate Change Impacts Assessment and Adaptation Strategies. UnitedNations Environment Programme, Vrije Universiteit Amsterdam, Institute forEnvironmental Studies, Amsterdam, 464 pp.
Fischer, G. and L.X. Sun, 2001: Model based analysis of future land-use develop-ment in China. Agr. Ecosyst. Environ., 85, 163-176.
Fischer, G., M. Shah and H.V. Velthuizen, 2002:Climate Change and AgriculturalVulnerability. International Institute for Applied Systems Analysis, Laxenberg,152 pp.
Fischoff, B., 1996: Public values in risk research. Ann. Am. Acad. Polit. SS., 45,75-84.
Fisher, B.S., G. Jakeman, H.M. Pant, M. Schwoon and R.S.J. Tol, 2006: CHIMP:a simple population model for use in integrated assessment of global environ-mental change. Integrated Assess. J., 6, 1-33.
Ford, J. and B. Smit, 2004: A framework for assessing the vulnerability of com-munities in the Canadian Arctic to risks associated with climate change. Arctic,57, 389-400.
Forest, C.E., P.H. Stone, A.P. Sokolov, M.R. Allen and M.D. Webster, 2002: Quan-tifying uncertainties in climate system properties with the use of recent climate ob-servations. Science, 295, 113-117.
Forster, P., V. Ramaswamy, P. Artaxo, T. Berntsen, R.A. Betts, D.W. Fahey, J. Hay-wood, J. Lean, D.C. Lowe, G. Myhre, J. Nganga, R. Prinn, G. Raga, M. Schulzand R.V. Dorland, 2007: Changes in atmospheric constituents and in radiativeforcing.Climate Change 2007: The Physical Science Basis. Contribution ofWork-ing Group I to the Fourth Assessment Report of the Intergovernmental Panel onClimate Change, S. Solomon, D. Qin, M. Manning, Z. Chen, M. Marquis, K. B.Averyt, M. Tignor and H. L. Miller, Eds., Cambridge University Press, Cam-bridge, 129-234.
Fowler, H.J., S. Blenkinsop and C. Tebaldi, 2007: Linking climate change model-ling to impacts studies: recent advances in downscaling techniques for hydro-logical modelling. Int. J. Climatol., in press.
Friedlingstein, P., P. Cox, R. Betts, L. Bopp, W. von Bloh, V. Brovkin, P. Cadule,S. Doney, M. Eby, I. Fung, G. Bala, J. John, C. Jones, F. Joos, T. Kato, M.Kawamiya, W. Knorr, K. Lindsay, H.D. Matthews, T. Raddatz, P. Rayner, C.Reick, E. Roeckner, K.-G. Schnitzler, R. Schnur, K. Strassmann, A.J. Weaver, C.Yoshikawa and N. Zeng, 2006: Climate-carbon cycle feedback analysis: resultsfrom the C4MIP model intercomparison. J. Climate, 19, 3337-3353.
Fronzek, S. and T.R. Carter, 2007:Assessing uncertainties in climate change impactson resource potential for Europe based on projections from RCMs and GCMs.
New assessment methods and the characterisation of future conditions Chapter 2
164

Climatic Change, 81 (Suppl. 1), 357-371.Funtowicz, S.O. and J.R. Ravetz, 1990:Uncertainty andQuality in Science for Pol-icy. Kluwer, Dordrecht, 229 pp.
Füssel, H.-M. and R.J.T. Klein, 2006: Climate change vulnerability assessments: anevolution of conceptual thinking. Climatic Change, 75, 301-329.
Gaffin, S.R., C. Rosenzweig, X. Xing and G. Yetman, 2004: Downscaling and geo-spatial gridding of socio-economic projections from the IPCC Special Report onEmissions Scenarios (SRES). Global Environ. Chang., 14, 105-123.
Ganopolski, A., V. Petoukhov, S. Rahmstorf, V. Brovkin, M. Claussen, A. Eliseevand C. Kubatzki, 2001: CLIMBER-2: a climate system model of intermediatecomplexity. Part II. Model sensitivity. Clim. Dynam., 17, 735-751.
Gao, X.J., D.L. Li, Z.C. Zhao and F. Giorgi, 2003: Numerical simulation for influ-ence of greenhouse effects on climatic change of Qinghai-Xizang Plateau alongQinghai-Xizang railway [in Chinese with English abstract].PlateauMeteorol., 22,458-463.
GCOS, 2003: The second report on the adequacy of the global observing systemsfor climate in support of the UNFCCC. Global Climate Observing System, GCOS- 82, WMO/TD No. 1143, World Meteorological Organization, Geneva, 74 pp.
Gedney, N., P.M. Cox, R.A. Betts, O. Boucher, C. Huntingford and P.A. Stott, 2006:Detection of a direct carbon dioxide effect in continental river runoff records.Na-ture, 439, 835-838.
Geurs, K.T. and J.R.R. van Eck, 2003: Evaluation of accessibility impacts of land-use scenarios: the implications of job competition, land-use and infrastructure de-velopments for the Netherlands. Environ. Plann. B., 30, 69-87.
Gigerenzer, G., 2000: Adaptive Thinking: Rationality in the Real World. OxfordUniversity Press, Oxford, 360 pp.
Giorgi, F., B.C. Hewitson, J.H. Christensen, M. Hulme, H. von Storch, P.H. Whet-ton, R.G. Jones, L.O. Mearns and C.B. Fu, 2001: Regional climate information:evaluation and projections. Climate Change 2001: The Scientific Basis. Contri-bution of Working Group I to the Third Assessment Report of the Intergovern-mental Panel on Climate Change, J.T. Houghton, Y. Ding, D.J. Griggs, M.Noguer, P.J. van der Linden, X. Dai, K. Maskell and C.A. Johnson, Eds., Cam-bridge University Press, Cambridge, 581-638.
Glantz, M.H., 2001:Once Burned, Twice Shy? Lessons Learned from the 1997-98El Niño. United Nations University Press, Tokyo, 294 pp.
Goklany, I., 2005: Is a richer-but-warmer world better than poorer-but-coolerworlds? 25th Annual North American Conference of the US Association for En-ergy Economics/International Association of Energy Economics, 21-23 Septem-ber, 2005.
Good, P., L. Bärring, C. Giannakopoulos, T. Holt and J. Palutikof, 2006: Non-lin-ear regional relationships between climate extremes and annual mean tempera-tures in model projections for 1961–2099 over Europe. Climate Res., 31, 19-34.
Goodess, C.M., C. Hanson, M. Hulme and T.J. Osborn, 2003: Representing cli-mate and extreme weather events in integrated assessment models: a review of ex-isting methods and options for development. Integrated Assess. J., 4, 145-171.
Government of India, 2004: Vulnerability assessment and adaptation. India’s Ini-tial National Communication to the UNFCCC, Ministry of Environment andForests, New Delhi, 57-132.
Graham, L.P., S. Hagemann, S. Jaun and M. Beniston, 2007: On interpreting hy-drological change from regional climate models.Climatic Change, 81 (Suppl. 1),97-122.
Greco, S., R.H. Moss, D. Viner and R. Jenne, 1994: Climate Scenarios and Socio-Economic Projections for IPCC WG II Assessment. Working Document, Inter-governmental Panel on Climate Change. Working Group II Technical SupportUnit, Washington, DC, 67 pp.
Group on Earth Observations, 2005:Global Earth Observation System of Systems,GEOSS: 10-Year Implementation Plan Reference Document.GEO 1000R / ESASP-1284, ESA Publications Division, Noordwijk, 209 pp. [Accessed 27.02.07:h t t p : / / w w w . e a r t h o b s e r v a t i o n s . o r g / d o c s / 1 0 -Year%20Plan%20Reference%20Document%20(GEO%201000R).pdf]
Grubb, M., J. Köhler and D. Anderson, 2002: Induced technical change in energyand environmental modeling: analytic approaches and policy implications.Annu.Rev. Energ. Env., 27, 271-308.
Grübler, A. and N. Nakićenović, 2001: Identifying dangers in an uncertain climate.Nature, 412, 15.
Grübler,A., N. Nakićenović and D.G. Victor, 1999: Modeling technological change:implications for the global environment. Annu. Rev. Energ. Env., 24, 545-569.
Grübler, A., B. O’Neill, K. Riahi, V. Chirkov, A. Goujon, P. Kolp, I. Prommer, S.Scherbov and E. Slentoe, 2006: Regional, national, and spatially explicit scenar-ios of demographic and economic change based on SRES. Technol. Forecast.
Soc., doi:10.1016/j.techfore.2006.05.023Hachadoorian, L., S.R. Gaffin and R. Engleman, 2007: Projecting a gridded pop-
ulation of the world using ratio methods of trend extrapolation. Human Popula-tion: The Demography and Geography of Homo Sapiens and their Implicationsfor Biological Diversity, R.P. Cincotta, L. Gorenflo and D. Mageean, Eds.,Springer-Verlag, Berlin,in press.
Haddad, B.M., 2005: Ranking the adaptive capacity of nations to climate changewhen socio-political goals are explicit. Global Environ. Chang., 15, 165-176.
Hall, J., T. Reeder, G. Fu, R.J. Nicholls, J. Wicks, J. Lawry, R.J. Dawson and D.Parker, 2005: Tidal flood risk in London under stabilisation scenarios. ExtendedAbstract, Symposium on Avoiding Dangerous Climate Change, Exeter, 1-3 Feb-ruary 2005, 4 pp. [Accessed 27.02.07: http://www.stabilisation2005.com/posters/Hall_Jim.pdf]
Hallegatte, S., 2005: The long timescales of the climate-economy feedback and theclimatic cost of growth. Environ. Model. Assess., 10, 277-289.
Hallegatte, S., J.C. Hourcade and P. Dumas, 2006: Why economic dynamics mat-ter in the assessment of climate change damages: illustration extreme events.Ecol.Econ., doi:10.1016/j.ecolecon.2006.06.006
Hallegatte, S., J.-C. Hourcade and P. Ambrosi, 2007: Using climate analogues forassessing climate change economic impacts in urban areas.Climatic Change, 82,47-60.
Hamilton, J.M., D.J. Maddison and R.S.J. Tol, 2005: Climate change and interna-tional tourism: a simulation study. Global Environ. Chang., 15, 253-266.
Hansen, J., 2004: Defusing the global warming time bomb. Sci. Am., 290, 68-77.Harvey, L.D.D., 2007: Dangerous anthropogenic interference, dangerous climate
change and harmful climatic change: non-trivial distinctions with significant pol-icy implications. Climatic Change, 82, 1-25.
Heslop-Thomas, C., W. Bailey, D.Amarakoon,A. Chen, S. Rawlins, D. Chadee, R.Crosbourne, A. Owino, K. Polson, C. Rhoden, R. Stennett and M. Taylor, 2006:Vulnerability to dengue fever in Jamaica. AIACC Working Paper No. 27, As-sessment of Impacts and Adaptation to Climate Change in Multiple Regions andSectors Program, Washington, DC, 40 pp.
Hewitson, B., 2003: Developing perturbations for climate change impact assess-ments. Eos T. Am. Geophys. Un., 84, 337-348.
Hewitt, C.D. and D.J. Griggs, 2004: Ensemble-based predictions of climate changesand their impacts. Eos, 85, 566.
Hewitt, K. and I. Burton, 1971: The Hazardousness of a Place: A Regional Ecol-ogy of Damaging Events. University of Toronto, Toronto, 154 pp.
Higgins, P.A.T. and M. Vellinga, 2004: Ecosystem responses to abrupt climatechange: teleconnections, scale and the hydrological cycle. Climatic Change, 64,127-142.
Higgins, P.A.T. and S.H. Schneider, 2005: Long-term potential ecosystem responsesto greenhouse gas-induced thermohaline circulation collapse.Glob. Change Biol.,11, 699-709.
Hijioka, Y., K. Takahashi, Y. Matsuoka and H. Harasawa, 2002: Impact of globalwarming on waterborne diseases. J. Jpn. Soc. Water Environ., 25, 647-652.
Hilderink, H., 2004: Population and scenarios: worlds to win? Report550012001/2004, RIVM, Bilthoven, 74 pp.
Hingray, B., N. Mouhous, A. Mezghani, B. Schaefli and A. Musy, 2007: Account-ing for global-mean warming and scaling uncertainties in climate change impactstudies: application to a regulated lake system.Hydrol. Earth Syst. Sc., 11, 1207-1226.
Hitz, S. and J. Smith, 2004: Estimating global impacts from climate change.GlobalEnviron. Chang., 14, 201-218.
Hogrefe, C., B. Lynn, K. Civerolo, J.-Y. Ku, J. Rosenthal, C. Rosenzweig, R. Gold-berg, S. Gaffin, K. Knowlton and P.L. Kinney, 2004: Simulating changes in re-gional air pollution over the eastern United States due to changes in global andregional climate and emissions. J. Geophys. Res., 109,doi:10.1029/2004JD004690.
Holman, I.P., M.D.A. Rounsevell, S. Shackley, P.A. Harrison, R.J. Nicholls, P.M.Berry and E. Audsley, 2005a: A regional, multi-sectoral and integrated assess-ment of the impacts of climate and socio-economic change in the UK. II. Results.Climatic Change, 70, 43-73.
Holman, I.P., M.D.A. Rounsevell, S. Shackley, P.A. Harrison, R.J. Nicholls, P.M.Berry and E. Audsley, 2005b: A regional, multi-sectoral and integrated assess-ment of the impacts of climate and socio-economic change in the UK. I. Method-ology. Climatic Change, 70, 9-41.
Howden, S.M. and R.N. Jones, 2004: Risk assessment of climate change impactson Australia’s wheat industry.NewDirections for a Diverse Planet, Proceedingsof the 4th International Crop Science Congress, Brisbane, Australia, T. Fischer,
Chapter 2 New assessment methods and the characterisation of future conditions
165

Ed. [Accessed 27.02.07: http://www.cropscience.org.au/icsc2004/sym-posia/6/2/1848_howdensm.htm] [Australia and New Zealand, risk]
Hulme, M., G.J. Jenkins, X. Lu, J.R. Turnpenny, T.D. Mitchell, R.G. Jones, J. Lowe,J.M. Murphy, D. Hassell, P. Boorman, R. McDonald and S. Hill, 2002: ClimateChange Scenarios for the United Kingdom: TheUKCIP02 Scientific Report. Tyn-dall Centre for Climate Change Research, University of East Anglia, Norwich,120 pp.
Huntington, H. and S. Fox, 2005: The changing Arctic: indigenous perspectives.Arctic Climate Impact Assessment, Cambridge University Press, Cambridge, 61-98.
Hurd, B.H., M. Callaway, J. Smith and P. Kirshen, 2004: Climatic change and USwater resources: from modeled watershed impacts to national estimates. J. Am.Water Resour. As., 40, 129-148.
Ionescu, C., R.J.T. Klein, J. Hinkel, K.S. Kavi Kumar and R. Klein, 2005: Towardsa formal framework of vulnerability to climate change. NeWater Working Paper2, 24 pp. Accessed from http://www.newater.info.
IPCC, 1992: Climate Change 1992: The Supplementary Report to the IPCC Sci-entific Assessment, J.T. Houghton, B.A. Callander and S.K. Varney, Eds., Cam-bridge University Press, Cambridge, 200 pp.
IPCC, 1994: IPCC Technical guidelines for assessing climate change impacts andadaptations. IPCC Special Report to the First Session of the Conference of theParties to the UN Framework Convention on Climate Change, Working GroupII, Intergovernmental Panel on Climate Change, T.R. Carter, M.L. Parry, S. Nish-ioka and H. Harasawa, Eds., University College London and Center for GlobalEnvironmental Research, National Institute for Environmental Studies, Tsukuba,59 pp.
IPCC, 1996:Climate Change 1995: The Science of Climate Change. Contributionof Working Group I to the Second Assessment Report of the IntergovernmentalPanel on Climate Change, J.T. Houghton, L.G.M. Filho, B.A. Callander, N. Har-ris,A. Kattenberg and K. Maskell, Eds., Cambridge University Press, Cambridge,572 pp.
IPCC, 2001a: Climate Change 2001: The Scientific Basis. Contribution of Work-ing Group I to the Third Assessment Report of the Intergovernmental Panel onClimate Change, J.T. Houghton, Y. Ding, D.J. Griggs, M. Noguer, P.J. van derLinden, X. Dai, K. Maskell and C.A. Johnson, Eds., Cambridge University Press,Cambridge, 881 pp.
IPCC, 2001b:Climate Change 2001: Impacts, Adaptation, and Vulnerability. Con-tribution of Working Group II to the Third Assessment Report of the Intergov-ernmental Panel on Climate Change, J.J. McCarthy, O.F. Canziani, N.A. Leary,D.J. Dokken and K.S. White, Eds., Cambridge University Press, Cambridge, 1032pp.
IPCC, 2001c: Climate Change 2001: Synthesis Report. Contribution of WorkingGroups I, II and III to the ThirdAssessment Report of the Intergovernmental Panelon Climate Change, R.T. Watson and the Core Writing Team, Eds., CambridgeUniversity Press, Cambridge, 398 pp.
IPCC, 2007: Climate Change 2007: The Physical Science Basis. Contribution ofWorkingGroup I to the Fourth Assessment Report of the Intergovernmental Panelon Climate Change, S. Solomon, D. Qin, M. Manning, Z. Chen, M. Marquis, K.B. Averyt, M. Tignor and H. L. Miller, Eds., Cambridge University Press, Cam-bridge, 996 pp.
IPCC-TGCIA, 1999: Guidelines on the Use of Scenario Data for Climate Impactand Adaptation Assessment: Version 1. Prepared by T.R. Carter, M. Hulme andM. Lal, Intergovernmental Panel on Climate Change, Task Group on Scenariosfor Climate ImpactAssessment, Supporting Material, 69 pp. [Accessed 27.07.02:http://www.ipcc-data.org/guidelines/ggm_no1_v1_12-1999.pdf]
IRI, 2006: A Gap Analysis for the Implementation of the Global Climate Observ-ing System Programme in Africa. International Research Institute for Climate andSociety, The Earth Institute at Columbia University, Palisades, New York, 47 pp.
ISO/IEC, 2002: Risk management: vocabulary: guidelines for use in standards, PDISO/IEC Guide 73, International Organization for Standardization/InternationalElectrotechnical Commission, Geneva, 16 pp.
Ivey, J.L., J. Smithers, R.C. de Loë and R.D. Kreutzwiser, 2004: Community ca-pacity for adaptation to climate-induced water shortages: linking institutionalcomplexity and local actors. Environ. Manage., 33, 36-47.
Izaurralde, R.C., N.J. Rosenberg, R.A. Brown andA.M. Thomson, 2003: Integratedassessment of Hadley Centre (HadCM2) climate-change impacts on agriculturalproductivity and irrigation water supply in the conterminous United States. PartII. Regional agricultural production in 2030 and 2095.Agr. Forest Meteorol., 117,97-122.
Jacobs, K., 2002: Connecting Science, Policy and Decision-making: A Handbook
for Researchers and Science Agencies.NOAAOffice of Global Programs, Wash-ington, DC, 30 pp.
Jacoby, H.D., 2004: Informing climate policy given incommensurable benefits es-timates. Global Environ. Chang., 14, 287-297.
Johansson, M.M., K.K. Kahma, H. Boman and J. Launiainen, 2004: Scenarios forsea level on the Finnish coast. Boreal Environ. Res., 9, 153-166.
Jones, R.N., 2000: Managing uncertainty in climate change projections: issues forimpact assessment. Climatic Change, 45, 403-419.
Jones, R.N., 2001: An environmental risk assessment/management framework forclimate change impact assessments. Nat. Hazards, 23, 197-230.
Jones, R.N., 2004: Managing climate change risks. The Benefits of Climate Poli-cies: Analytical and Framework Issues, J. Corfee Morlot and S. Agrawala, Eds.,OECD, Paris, 251-297.
Jones, R.N. and C.M. Page, 2001:Assessing the risk of climate change on the waterresources of the Macquarie River catchment. IntegratingModels for Natural Re-sources Management Across Disciplines, Issues and Scales (Part 2), Modsim2001 International Congress onModelling and Simulation, F. Ghassemi, P. Whet-ton, R. Little and M. Littleboy, Eds., Modelling and Simulation Society of Aus-tralia and New Zealand, Canberra, 673-678.
Jones, R.N. and R. Boer, 2005: Assessing current climate risks. Adaptation PolicyFrameworks for Climate Change: Developing Strategies, Policies andMeasures,B. Lim, E. Spanger-Siegfried, I. Burton, E. Malone and S. Huq, Eds., CambridgeUniversity Press, Cambridge and New York, 91-118.
Jones, R.N. and L.O. Mearns, 2005:Assessing future climate risks.Adaptation Pol-icy Frameworks for Climate Change: Developing Strategies, Policies andMeas-ures, B. Lim, E. Spanger-Siegfried, I. Burton, E. Malone and S. Huq, Eds.,Cambridge University Press, Cambridge and New York, 119-143.
Jones, R.N., P. Durack, C. Page and J. Ricketts, 2005: Climate change impacts onthe water resources of the Fitzroy River Basin. Climate Change in Queenslandunder Enhanced Greenhouse Conditions, W. Cai et al., Eds., Report 2004–05,CSIRO Marine and Atmospheric Research, Melbourne, 19-58.
Jones, R.N., P. Dettmann, G. Park, M. Rogers and T. White, 2007: The relationshipbetween adaptation and mitigation in managing climate change risks: a regionalapproach.Mitig. Adapt. Strat. Glob. Change, 12, 685–712.
Jönsson, A.M., M.-L. Linderson, I. Stjernquist, P. Schlyter and L. Bärring, 2004:Climate change and the effect of temperature backlashes causing frost damage inPicea abies. Global Planet. Change, 44, 195-207.
Justice, C.O., L. Giglio, S. Korontzi, J. Owens, J.T. Morisette, D. Roy, J. Descloitres,S. Alleaume, F. Petitcolin and Y. Kaufman, 2002: The MODIS fire products. Re-mote Sens. Environ., 83, 244-262.
Jylhä, K., H. Tuomenvirta and K. Ruosteenoja, 2004: Climate change projectionsfor Finland during the 21st century. Boreal Environ. Res., 9, 127-152.
Kahneman, D. andA. Tversky, 1979: Prospect theory: an analysis of decision underrisk. Econometrica, 47, 263-291.
Kaivo-oja, J., J. Luukkanen and M. Wilenius, 2004: Defining alternative socio-eco-nomic and technological futures up to 2100: SRES scenarios for the case of Fin-land. Boreal Environ. Res., 9, 109-125.
Kammen, D., A. Shlyakter and R. Wilson, 1994: What is the risk of the impossi-ble? J. Franklin I., 331(A), 97-116.
Kankaanpää, S. and T.R. Carter, 2004: Construction of European forest land use sce-narios for the 21st century. The Finnish Environment 707, Finnish EnvironmentInstitute, Helsinki, 57 pp.
Kankaanpää, S., T.R. Carter and J. Liski, 2005: Stakeholder perceptions of climatechange and the need to adapt. FINADAPT Working Paper 14, Finnish Environ-ment Institute, Mimeographs 344, Helsinki, 36 pp. [Accessed 27.02.07:http://www.environment.fi/default.asp?contentid=165486&lan=en]
Kasperson, R.E., 2006: Rerouting the stakeholder express.Global Environ. Chang.,16, 320-322.
Kates, R.W. and T.J. Wilbanks, 2003: Making the global local: responding to cli-mate change concerns from the ground. Environment, 45, 12-23.
Kelly, P.M. and W.N. Adger, 2000: Theory and practice in assessing vulnerabilityto climate change and facilitating adaptation. Climatic Change, 47, 325-352.
Kemfert, C., 2002:An integrated assessment model of economy-energy-climate: themodel Wiagem. Integrated Assess., 3, 281-298.
Kenny, G.J., R.A. Warrick, B.D. Campbell, G.C. Sims, M. Camilleri, P.D. Jamieson,N.D. Mitchell, H.G. McPherson and M.J. Salinger, 2000: Investigating climatechange impacts and thresholds: an application of the CLIMPACTS integrated as-sessment model for New Zealand agriculture. Climatic Change, 46, 91-113.
Klein, R. and R.J. Nicholls, 1999: Assessment of coastal vulnerability to climatechange. Ambio, 28, 182-187.
New assessment methods and the characterisation of future conditions Chapter 2
166

Klein, R.J.T., E.L.F. Schipper and S. Dessai, 2005: Integrating mitigation and adap-tation into climate and development policy: three research questions. Environ.Sci. Policy, 8, 579-588.
Klöcking, B., B. Strobl, S. Knoblauch, U. Maier, B. Pfutzner andA. Gericke, 2003:Development and allocation of land-use scenarios in agriculture for hydrologicalimpact studies. Phys. Chem. Earth, 28, 1311-1321.
Kok, K. and M. Winograd, 2002: Modeling land-use change for Central America,with special reference to the impact of hurricane Mitch. Ecol. Model., 149, 53-69.
Kok, K., D.S. Rothman and M. Patel, 2006a: Multi-scale narratives from an IAper-spective. Part I. European and Mediterranean scenario development.Futures, 38,261-284.
Kok, K., M. Patel, D.S. Rothman and G. Quaranta, 2006b: Multi-scale narrativesfrom an IA perspective. Part II. Participatory local scenario development. Fu-tures, 38, 285-311.
Kundzewicz, Z.W., U. Ulbrich, T. Brücher, D. Graczyk, A. Krüger, G.C. Lecke-busch, L. Menzel, I. Pińskwar, M. Radziejewski and M. Szwed, 2005: Summerfloods in Central Europe: climate change track? Nat. Hazards, 36, 165-189.
Laurila, T., J.-P. Tuovinen, V. Tarvainen and D. Simpson, 2004: Trends and sce-narios of ground-level ozone concentrations in Finland. Boreal Environ. Res., 9,167-184.
Lebel, L., P. Thongbai, K. Kok, J.B.R. Agard, E. Bennett, R. Biggs, M. Ferreira, C.Filer, Y. Gokhale, W. Mala, C. Rumsey, S.J. Velarde and M. Zurek, 2005: Sub-global scenarios. Ecosystems and Human Well-Being: Multiscale Assessments,Volume 4, Millennium Ecosystem Assessment, S.R. Carpenter, P.L. Pingali, E.M.Bennett and M.B. Zurek, Eds., Island Press, Washington, DC, 229-259.
Leemans, R. and B. Eickhout, 2004: Another reason for concern: regional andglobal impacts on ecosystems for different levels of climate change. Global En-viron. Chang., 14, 219-228.
Leemans, R., B. Eickhout, B. Strengers, L. Bouwman and M. Schaeffer, 2002: Theconsequences of uncertainties in land use, climate and vegetation responses on theterrestrial carbon. Sci. China Ser. C, 45, 126-142.
Lempert, R., N. Nakićenović, D. Sarewitz and M.E. Schlesinger, 2004: Charac-terizing climate change uncertainties for decision-makers. Climatic Change, 65,1-9.
Leung, L.R., Y. Qian, X. Bian, W.M. Washington, J. Han and J.O. Roads, 2004:Mid-century ensemble regional climate change scenarios for the western UnitedStates. Climatic Change, 62, 75-113.
Levy, P.E., M.G.R. Cannell and A.D. Friend, 2004: Modelling the impact of futurechanges in climate, CO2 concentration and land use on natural ecosystems and theterrestrial carbon sink. Global Environ. Chang., 14, 21-52.
Lorenzoni, I.,A. Jordan, M. Hulme, R.K. Turner and T. O’Riordan, 2000:Aco-evo-lutionary approach to climate change impact assessment. Part I. Integrating socio-economic and climate change scenarios. Global Environ. Chang., 10, 57-68.
Loukopoulos, P. and R.W. Scholz, 2004: Sustainable future urban mobility: using‘area development negotiations’for scenario assessment and participatory strate-gic planning. Environ. Plann. A, 36, 2203-2226.
Lowe, J.A. and J.M. Gregory, 2005: The effects of climate change on storm surgesaround the United Kingdom. Philos. T. R. Soc. A, 363, 1313-1328.
Luo, Q., R.N. Jones, M. Williams, B. Bryan and W.D. Bellotti, 2005: Constructionof probabilistic distributions of regional climate change and their application inthe risk analysis of wheat production. Climate Res., 29, 41-52.
Luoto, M., J. Pöyry, R.K. Heikkinen and K. Saarinen, 2005: Uncertainty of biocli-mate envelope models based on the geographical distribution of species. GlobalEcol. Biogeogr., 14, 575-584.
Malone, E.L. and E.L. La Rovere, 2005: Assessing current and changing socio-economic conditions. Adaptation Policy Frameworks for Climate Change: De-veloping Strategies, Strategies, Policies and Measures, B. Lim, E.Spanger-Siegfried, I. Burton, E. Malone and S. Huq, Eds., Cambridge UniversityPress, Cambridge and New York, 145-163.
Marttila, V., H. Granholm, J. Laanikari, T. Yrjölä, A. Aalto, P. Heikinheimo, J.Honkatukia, H. Järvinen, J. Liski, R. Merivirta and M. Paunio, 2005: Finland’sNational Strategy for Adaptation to Climate Change. Publication 1a/2005, Min-istry of Agriculture and Forestry, Helsinki, 280 pp.
Mastrandrea, M.D. and S.H. Schneider, 2004: Probabilistic integrated assessmentof “dangerous” climate change. Science, 304, 571-575.
Mathur, A., I. Burton and M.K. van Aalst, Eds., 2004: An Adaptation Mosaic: ASample of the Emerging World Bank Work in Climate Change Adaptation. TheWorld Bank, Washington, DC, 133 pp.
Mayerhofer, P., B. de Vries, M. den Elzen, D. van Vuuren, J. Onigheit, M. Poschand R. Guardans, 2002: Long-term consistent scenarios of emissions, deposition
and climate change in Europe. Environ. Sci. Policy, 5, 273-305.Maynard, K. and J.F. Royer, 2004: Effects of “realistic” land-cover change on a
greenhouse-warmed African climate. Clim. Dynam., 22, 343-358.McCarthy, J.J. and M. Long Martello, 2005: Climate change in the context of mul-
tiple stressors and resilience.Arctic Climate Impact Assessment, Cambridge Uni-versity Press, Cambridge, 879-922.
McKenzie Hedger, M., R. Connell and P. Bramwell, 2006: Bridging the gap: em-powering adaptation decision-making through the UK Climate Impacts Pro-gramme. Clim. Policy, 6, 201-215.
Mearns, L.O., M. Hulme, T.R. Carter, R. Leemans, M. Lal and P.H. Whetton, 2001:Climate scenario development.Climate Change 2001: The Scientific Basis. Con-tribution of Working Group I to the Third Assessment Report of the Intergovern-mental Panel on Climate Change, J.T. Houghton, Y. Ding, D.J. Griggs, M.Noguer, P.J. van der Linden, X. Dai, K. Maskell and C.A. Johnson, Eds., Cam-bridge University Press, Cambridge, 739-768.
Mearns, L.O., G. Carbone, E. Tsvetsinskaya, R.Adams, B. McCarl and R. Doherty,2003: The uncertainty of spatial scale of climate scenarios in integrated assess-ments: an example from agriculture. Integrated Assess., 4, 225-235.
Meehl, G.A., T.F. Stocker, W. Collins, P. Friedlingstein, A. Gaye, J. Gregory, A.Kitoh, R. Knutti, J. Murphy, A. Noda, S. Raper, I. Watterson, A. Weaver and Z.-C. Zhao, 2007: Global climate projections. Climate Change 2007: The PhysicalScience Basis. Contribution ofWorking Group I to the Fourth Assessment Reportof the Intergovernmental Panel on Climate Change, S. Solomon, D. Qin, M. Man-ning, Z. Chen, M. Marquis, K. B. Averyt, M. Tignor and H. L. Miller, Eds., Cam-bridge University Press, Cambridge, 747-846.
Mendelsohn, R. and L. Williams, 2004: Comparing forecasts of the global impactsof climate change.Mitig. Adapt. Strat. Glob. Change, 9, 315-333.
Metroeconomica, 2004: Costing the Impacts of Climate Change in the UK. UKCIPTechnical Report, United Kingdom Climate Impacts Programme Oxford, 90 pp.
Metzger, M. and D. Schröter, 2006: Towards a spatially explicit and quantitativevulnerability assessment of environmental change in Europe. Reg. Environ.Change, 6, 201-206.
Metzger, M.J., M.D.A. Rounsevell, R. Leemans and D. Schröter, 2006: The vul-nerability of ecosystem services to land use change. Agr. Ecosyst. Environ., 114,69-85.
Millennium EcosystemAssessment, 2005:Ecosystems andHumanWell-being. Vol.2: Scenarios: Findings of the Scenarios Working Group, Millennium EcosystemAssessment, S.R. Carpenter, P.L. Pingali, E.M. Bennett and M.B. Zurek, Eds., Is-land Press, Washington, DC, 560 pp.
Miller, N.L., K.E. Bashford and E. Strem, 2003: Potential impacts of climate changeon California hydrology. J. Am. Water Resour. As., 39, 771-784.
Mirza, M.M.Q., 2003a: Three recent extreme floods in Bangladesh, a hydro-mete-orological analysis. Nat. Hazards, 28, 35-64.
Mirza, M.M.Q., 2003b: Climate change and extreme weather events: can develop-ing countries adapt? Clim. Policy, 3, 233-248.
Morgan, M.G. and M. Henrion, 1990: Uncertainty: A Guide to Dealing with Un-certainty in Quantitative Risk and Policy Analysis. Cambridge University Press,New York, 344 pp.
Morgan, M.G., B. Fischhoff, A. Bostrom and C.J. Atman, 2001: Risk Communica-tion: A Mental Models Approach. Cambridge University Press, Cambridge, 366pp.
Moriondo, M., P. Good, R. Durao, M. Bindi, C. Giannakopoulos and J. Corte-Real,2006: Potential impact of climate change on forest fire risk in the Mediterraneanarea. Climate Res., 31, 85-95.
Morita, T., J. Robinson, A. Adegbulugbe, J. Alcamo, D. Herbert, E.L. La Rovere,N. Nakićenović, H. Pitcher, P. Raskin, K. Riahi, A. Sankovski, V. Sokolov, B. deVries and D. Zhou, 2001: Greenhouse gas emission mitigation scenarios and im-plications.Climate Change 2001:Mitigation. Contribution of Working Group IIIto the Third Assessment Report of the Intergovernmental Panel on ClimateChange, B. Metz, O. Davidson, R. Swart and J. Pan, Eds., Cambridge UniversityPress, Cambridge, 115-166.
Moss, R.H., A.L. Brenkert and E.L. Malone, 2001: Vulnerability to ClimateChange: AQuantitative Approach. Pacific Northwest National Laboratory, Rich-land, Washington.
Muramatsu, R. and Y. Hanich, 2005: Emotions as a mechanism for boundedly ra-tional agents: the fast and frugal way. J. Econ. Psychol., 26, 201-221.
Nadarajah, C. and J.D. Rankin, 2005: European spatial planning: adapting to climateevents.Weather, 60, 190-194.
Næss, L.O., G. Bang, S. Eriksen and J. Vevatne, 2005: Institutional adaptation toclimate change: flood responses at the municipal level in Norway. Global Envi-
Chapter 2 New assessment methods and the characterisation of future conditions
167

ron. Chang., 15, 125-138.Nakićenović, N., J. Alcamo, G. Davis, B. DeVries, J. Fenhann, S. Gaffin, K. Gre-
gory, A. Gruebler, T.Y. Jung, T. Kram, E.L. La Rovere, L. Michaelis, S. Mori, T.Morita, W. Pepper, H. Pitcher, L. Price, K. Riahi, A. Roehrl, H.-H. Rogner, A.Sankovski, M. Schlesinger, P. Shukla, S. Smith, R. Swart, S. VanRooijen, N. Vic-tor and Z. Dadi, 2000: Special Report on Emissions Scenarios: A Special Reportof Working Group III of the Intergovernmental Panel on Climate Change. Cam-bridge University Press, Cambridge, 600 pp.
Nakićenović, N., B. Fisher, K. Alfsen, J. Corfee Morlot, F. de la Chesnaye, J.-C.Hourcade, K. Jiang, M. Kainuma, E.L. La Rovere, A. Rana, K. Riahi, R. Richels,D.P. van Vuuren and R. Warren, 2007: Issues related to mitigation in the long-termcontext. Climate Change 2007: Mitigation of Climate Change. Contribution ofWorking Group III to the Fourth Assessment Report of the IntergovernmentalPanel on Climate Change, B. Metz, O. Davidson, P. Bosch, R. Dave and L.Meyer, Eds., Cambridge University Press, Cambridge, UK.
NationalAssessment Synthesis Team, 2000:Climate Change Impacts on the UnitedStates: The Potential Consequences of Climate Variability and Change, Overview.Cambridge University Press, Cambridge, 154 pp.
Nelson, G.C., E. Bennett, A. Asefaw Berhe, K.G. Cassman, R. DeFries, T. Dietz,A. Dobson, A. Dobermann, A. Janetos, M. Levy, D. Marco, B. O’Neill, N.Nakićenović, R. Norgaard, G. Petschel-Held, D. Ojima, P. Pingali, R. Watson andM. Zurek, 2005: Drivers of change in ecosystem condition and services. Ecosys-tems and Human Well-Being: Scenarios: Findings of the Scenarios WorkingGroup, Millennium Ecosystem Assessment, S.R. Carpenter, P.L. Pingali, E.M.Bennett and M.B. Zurek, Eds., Island Press, Washington, DC, 173-222.
Neumann, J.E., G. Yohe, R. Nicholls and M. Manion, 2000: Sea-level rise andglobal climate change: a review of impacts to U.S. coasts. The Pew Center onGlobal Climate Change, Arlington, Virginia.
New, M. and M. Hulme, 2000: Representing uncertainty in climate change sce-narios: a Monte Carlo approach. Integrated Assess., 1, 203-213.
Nicholls, R.J., 2004: Coastal flooding and wetland loss in the 21st century: changesunder the SRES climate and socio-economic scenarios.Global Environ. Chang.,14, 69-86.
Nicholls, R.J. and J.A. Lowe, 2004: Benefits of mitigation of climate change forcoastal areas. Global Environ. Chang., 14, 229-244.
Nicholls, R.J. and R.S.J. Tol, 2006: Impacts and responses to sea-level rise:Aglobalanalysis of the SRES scenarios over the 21st century.Philos. T. R. Soc., 364, 1073-1095.
Nicholls, R.J., R.S.J. Tol and A.T. Vafeidis, 2005: Global estimates of the impact ofa collapse of the West Antarctic Ice Sheet: an application of FUND. WorkingPaper FNU78, Research Unit on Sustainability and Global Change, HamburgUniversity, and Centre for Marine and Atmospheric Science, Hamburg, 34 pp.
Nordhaus, W.D., 2006: Geography and macroeconomics: new data and new find-ings. P. Natl. Acad. Sci., 103, 3510-3517.
NRC, 2002: Alerting America: Effective Risk Communication: Summary of aForum, October 31, 2002, National Academies Press, Washington, DC, 10 pp.
O’Brien, K. and C.H. Vogel, 2006: Who can eat information? Examining the ef-fectiveness of seasonal climate forecasts and regional climate-risk managementstrategies. Climate Res., 33, 111-122.
O’Brien, K., S. Eriksen, A. Schjolden and L. Nygaard, 2004a: What’s in a word?Conflicting interpretations of vulnerability in climate change research. WorkingPaper 2004:04, Centre for International Climate and Environmental ResearchOslo, University of Oslo, Oslo, 16 pp.
O’Brien, K., R. Leichenko, U. Kelkar, H. Venema, G. Aandahl, H. Tompkins, A.Javed, S. Bhadwal, S. Barg, L. Nygaard and J. West, 2004b: Mapping vulnera-bility to multiple stressors: climate change and globalization in India.Global En-viron. Chang., 14, 303-313.
O’Brien, K., S. Eriksen, L. Sygna and L.O. Naess, 2006: Questioning complacency:climate change impacts, vulnerability and adaptation in Norway. Ambio, 35, 50-56.
O’Neill, B.C., 2004: Conditional probabilistic population projections: an applica-tion to climate change. Int. Stat. Rev., 72, 167-184.
O’Neill, B.C. and M. Oppenheimer, 2004: Climate change impacts are sensitive tothe concentration stabilization path. P. Natl. Acad. Sci., 101, 16311-16416.
Ohlemüller, R., E.S. Gritti, M.T. Sykes and C.D. Thomas, 2006: Towards Euro-pean climate risk surfaces: the extent and distribution of analogous and non-anal-ogous climates 1931-2100. Global Ecol. Biogeogr., 15, 395-405.
Olesen, J.E., T.R. Carter, C.H. Díaz-Ambrona, S. Fronzek, T. Heidmann, T. Hick-ler, T. Holt, M.I. Minguez, P. Morales, J. Palutikof, M. Quemada, M. Ruiz-Ramos,G. Rubæk, F. Sau, B. Smith and M. Sykes, 2007: Uncertainties in projected im-
pacts of climate change on European agriculture and terrestrial ecosystems basedon scenarios from regional climate models.Climatic Change, 81 (Suppl. 1), 123-143.
Osman-Elasha, B., N. Goutbi, E. Spanger-Siegfried, B. Dougherty,A. Hanafi, S. Za-kieldeen, A. Sanjak, H.A. Atti and H.M. Elhassan, 2006: Adaptation strategies toincrease human resilience against climate variability and change: lessons fromthe arid regions of Sudan. AIACC Working Paper No. 42, Assessment of Impactsand Adaptation to Climate Change in Multiple Regions and Sectors Program,Washington, DC, 42 pp.
Ott, B. and S. Uhlenbrook, 2004: Quantifying the impact of land-use changes at theevent and seasonal time scale using a process-oriented catchment model.Hydrol.Earth Syst. Sc., 8, 62-78.
Parry, M., N. Arnell, T. McMichael, R. Nicholls, P. Martens, S. Kovats, M. Liver-more, C. Rosenzweig, A. Iglesias and G. Fischer, 2001: Millions at risk: definingcritical climate change threats and targets. Global Environ. Chang., 11, 181-183.
Parry, M.L., 2002: Scenarios for climate impact and adaptation assessment.GlobalEnviron. Chang., 12, 149-153.
Parry, M.L., 2004: Global impacts of climate change under the SRES scenarios.Global Environ. Chang., 14, 1.
Parry, M.L., T.R. Carter and M. Hulme, 1996: What is dangerous climate change?Global Environ. Chang., 6, 1-6.
Parry, M.L., N. Arnell, M. Hulme, R.J. Nicholls and M. Livermore, 1998: Adapt-ing to the inevitable. Nature, 395, 741.
Parry, M.L., N.W. Arnell, M. Hulme, P. Martens, R.J. Nicholls and A. White, 1999:The global impact of climate change: a new assessment.Global Environ. Chang.,9, S1-S2.
Parry, M.L., C. Rosenzweig, A. Iglesias, M. Livermore and G. Fischer, 2004: Ef-fects of climate change on global food production under SRES emissions andsocio-economic scenarios. Global Environ. Chang., 14, 53-67.
Parson, E.A., R.W. Corell, E.J. Barron, V. Burkett, A. Janetos, L. Joyce, T.R. Karl,M.C. MacCracken, J. Melillo, M.G. Morgan, D.S. Schimel and T. Wilbanks,2003: Understanding climatic impacts, vulnerabilities and adaptation in the UnitedStates: building a capacity for assessment. Climatic Change, 57, 9-42.
Parson, E.A., V. Burkett, K. Fisher-Vanden, D. Keith, L. Mearns, H. Pitcher, C.Rosenzweig and M. Webster, 2006: Global-Change Scenarios: Their Develop-ment and Use, US Climate Change Science Program No. 2.1b (Final draft forpublic comment), Washington, DC, 339 pp.
Patt, A. and C. Gwata, 2002: Effective seasonal climate forecast applications: ex-amining constraints for subsistence farmers in Zimbabwe. Global Environ.Chang., 12, 185-195.
Patt,A.G., R. Klein andA. de la Vega-Leinert, 2005: Taking the uncertainties in cli-mate change vulnerability assessment seriously. C. R. Geosci., 337, 411-424.
Pearson, R. and T. Dawson, 2003: Predicting the impacts of climate change on thedistribution of species: are bioclimatic envelope models useful?Global Ecol. Bio-geogr., 12, 361-371.
Perez-Garcia, J., L.A. Joyce, A.D. McGuire and X.M. Xiao, 2002: Impacts of cli-mate change on the global forest sector. Climatic Change, 54, 439-461.
Petoukhov, V.,A. Ganopolski, V. Brovkin, M. Claussen,A. Eliseev, C. Kubatzki andS. Rahmstorf, 2000: CLIMBER-2: a climate system model of intermediate com-plexity. Part I. Model description and performance for present climate. Clim.Dynam., 16, 1-17.
Pittock, A.B. and R.N. Jones, 2000: Adaptation to what and why? Environ. Monit.Assess., 61, 9-35.
Polsky, C., D. Schöeter, A. Patt, S. Gaffin, M.L. Martello, R. Neff, A. Pulsipher andH. Selin, 2003: Assessing vulnerabilities to the effects of global change: an eight-step approach. Belford Centre for Science and International Affairs WorkingPaper, Environment and Natural Resources Program, John F. Kennedy School ofGovernment, Harvard University, Cambridge, Massachusetts, 31 pp.
Preston, B.L., 2006: Risk-based reanalysis of the effects of climate change on U.S.cold-water habitat. Climatic Change, 76, 91-119.
Pretty, J.N., I. Guijt, J. Thompson and I. Scoones, 1995: Participatory Learningand Action: A Trainer’s Guide. IIED Training Materials Series No. 1. IIED, Lon-don, 268 pp.
Pulhin, J., R.J.J. Peras, R.V.O. Cruz, R.D. Lasco, F. Pulhin and M.A. Tapia, 2006:Vulnerability of communities to climate variability and extremes: the Pantaban-gan-Carranglan watershed in the Philippines.AIACC Working Paper No. 44, As-sessment of Impacts and Adaptation to Climate Change in Multiple Regions andSectors Program, Washington, DC, 56 pp.
Quiggin, J. and J. Horowitz, 2003: Costs of adjustment to climate change. Aust. J.Agr. Resour. Ec., 47, 429-446.
New assessment methods and the characterisation of future conditions Chapter 2
168

Randall, D., R.A. Wood, S. Bony, R. Colman, T. Fichefet, J. Fyfe, V. Kattsov,A. Pit-man, J. Shukla, J. Srinivasan, R.J. Stouffer, A. Sumi and K. Taylor, 2007: Cli-mate models and their evaluation. Climate Change 2007: The Physical ScienceBasis. Contribution of Working Group I to the Fourth Assessment Report of theIntergovernmental Panel on Climate Change, S. Solomon, D. Qin, M. Manning,Z. Chen, M. Marquis, K. B. Averyt, M. Tignor and H. L. Miller, Eds., CambridgeUniversity Press, Cambridge, 589-662.
Raskin, P., T. Banuri, G. Gallopin, P. Gutman,A. Hammond, R. Kates and R. Swart,2002: Great Transition: The Promise and Lure of the Times Ahead. Global Sce-nario Group, Stockholm Environment Institute, Boston, Massachusetts, 99 pp.
Raskin, P., F. Monks, T. Ribeiro, D. van Vuuren and M. Zurek, 2005: Global sce-narios in historical perspective. Ecosystems and Human Well-Being: Scenarios:Findings of the Scenarios Working Group, Millennium Ecosystem Assessment,S.R. Carpenter, P.L. Pingali, E.M. Bennett and M.B. Zurek, Eds., Island Press,Washington, DC, 35-44.
Reginster, I. and M.D.A. Rounsevell, 2006: Future scenarios of urban land use inEurope. Environ. Plan. B, 33, 619-636.
Reidsma, P., T. Tekelenburg, M. van den Berg and R. Alkemade, 2006: Impacts ofland-use change on biodiversity: an assessment of agricultural biodiversity in theEuropean Union. Agr. Ecosyst. Environ., 114, 86-102.
Renn, O., 2004: The challenge of integrating deliberation and expertise: participa-tion and discourse in risk management. Risk Analysis and Society: An Interdisci-plinary Characterization of the Field, T.L. MacDaniels and M.J. Small, Eds.,Cambridge University Press, Cambridge, 289-366.
Rial, J.A., R.A. Pielke, M. Beniston, M. Claussen, J. Canadell, P. Cox, H. Held, N.De Noblet-Ducoudre, R. Prinn, J.F. Reynolds and J.D. Salas, 2004: Nonlineari-ties, feedbacks and critical thresholds within the Earth’s climate system.ClimaticChange, 65, 11-38.
Rosenberg, N.J., R.A. Brown, R.C. Izaurralde andA.M. Thomson, 2003: Integratedassessment of Hadley Centre (HadCM2) climate change projections on agricul-tural productivity and irrigation water supply in the conterminous United States.I. Climate change scenarios and impacts on irrigation water supply simulated withthe HUMUS model. Agr. Forest Meteorol., 117, 73-96.
Rotmans, J. and D. Rothman, Eds., 2003: Scaling Issues in Integrated Assessment.Swets and Zeitlinger, Lisse, 374 pp.
Rotmans, J., M.B.A. Van Asselt, C. Anastasi, S.C.H. Greeuw, J. Mellors, S. Peters,D.S. Rothman and N. Rijkens-Klomp, 2000: Visions for a sustainable Europe.Futures, 32, 809-831.
Rounsevell, M.D.A., F. Ewert, I. Reginster, R. Leemans and T.R. Carter, 2005: Fu-ture scenarios of European agricultural land use. II. Estimating changes in land useand regional allocation. Agr. Ecosyst. Environ., 107, 117-135.
Rounsevell, M.D.A., I. Reginster, M.B. Araújo, T.R. Carter, N. Dendoncker, F.Ewert, J.I. House, S. Kankaanpää, R. Leemans, M.J. Metzger, C. Schmit, P. Smithand G. Tuck, 2006: A coherent set of future land use change scenarios for Eu-rope. Agr. Ecosyst. Environ., 114, 57-68.
Rowe, G. and L. Frewer, 2000: Public participation methods: an evaluative reviewof the literature. Sci. Technol. Hum. Val., 25, 3-29.
Ruosteenoja, K., T.R. Carter, K. Jylhä and H. Tuomenvirta, 2003: Future climate inworld regions: an intercomparison of model-based projections for the new IPCCemissions scenarios. The Finnish Environment 644, Finnish Environment Insti-tute, Helsinki, 83 pp.
Rupa Kumar, K.,A.K. Sahai, K. Krishna Kumar, S.K. Patwardhan, P.K. Mishra, J.V.Revadekar, K. Kamala and G.B. Pant, 2006: High-resolution climate change sce-narios for India for the 21st century. Curr. Sci. India, 90, 334-345.
Sands, R.D. and M. Leimbach, 2003: Modeling agriculture and land use in an in-tegrated assessment framework. Climatic Change, 56, 185-210.
Sands, R.D. and J.A. Edmonds, 2005: Climate change impacts for the conterminousUSA: an integrated assessment. Part 7. Economic analysis of field crops and landuse with climate change. Climatic Change, 69, 127-150.
Santer, B.D., T.M.L. Wigley, M.E. Schlesinger and J.F.B. Mitchell, 1990: Devel-oping climate scenarios from equilibrium GCM results. Report No. 47, Max-Planck-Institut für Meteorologie, Hamburg, 29 pp.
SBI, 2001: National communications from Parties not included in Annex I to theConvention. Report of the Consultative Group of Experts to the Subsidiary Bod-ies. Subsidiary Body for Implementation, Document FCCC/SBI/2001/15, UnitedNations Office, Geneva.
Schellnhuber, H.J., R. Warren, A. Hazeltine and L. Naylor, 2004: Integrated as-sessments of benefits of climate policy. The Benefits of Climate Change Policies:Analytic and Framework Issues, J.C. Morlot and S.Agrawala, Eds., Organisationfor Economic Cooperation and Development (OECD), Paris, 83-110.
Schneider, S.H., 2001: What is ‘dangerous’ climate change? Nature, 411, 17-19.Schneider, S.H., 2002: Can we estimate the likelihood of climatic changes at 2100?Climatic Change, 52, 441-451.
Schneider, S.H. and K. Kuntz-Duriseti, 2002: Uncertainty and climate change pol-icy. Climate Change Policy: A Survey, S.H. Schneider, A. Rosencranz and J.O.Niles, Eds., Island Press, Washington, DC, 53-87.
Scholze, M., W. Knorr, N.W. Arnell and I. Prentice, 2006: A climate-change riskanalysis for world ecosystems. P. Natl. Acad. Sci., 103, 13116-13120.
Schröter, D., C. Polsky andA.G. Patt, 2005a:Assessing vulnerabilities to the effectsof global change: an eight-step approach.Mitig. Adapt. Strat. Glob. Change, 10,573-596.
Schröter, D., W. Cramer, R. Leemans, I.C. Prentice, M.B. Araújo, N.W. Arnell, A.Bondeau, H. Bugmann, T.R. Carter, C.A. Garcia,A.C. de la Vega-Leinert, M. Er-hard, F. Ewert, M. Glendining, J.I. House, S. Kankaanpää, R.J.T. Klein, S. La-vorel, M. Lindner, M.J. Metzger, J. Meyer, T.D. Mitchell, I. Reginster, M.Rounsevell, S. Sabaté, S. Sitch, B. Smith, J. Smith, P. Smith, M.T. Sykes, K.Thonicke, W. Thuiller, G. Tuck, S. Zaehle and B. Zierl, 2005b: Ecosystem serv-ice supply and vulnerability to global change in Europe. Science, 310, 1333-1337
Shackley, S. and R. Deanwood, 2003: Constructing social futures for climate-change impacts and response studies: building qualitative and quantitative sce-narios with the participation of stakeholders. Climate Res., 24, 71-90.
Slovic, P., M.L. Finucane, E. Peters and D.G. MacGregor, 2004: Risk as analysisand risk as feelings: some thoughts about affect, reason, risk and rationality. RiskAnal., 24, 311-322.
Smit, B. and J. Wandel, 2006: Adaptation, adaptive capacity and vulnerability.Global Environ. Chang., 16, 282-292.
Smith, J.B., H.-J. Schellnhuber, M.M.Q. Mirza, S. Fankhauser, R. Leemans, L.Erda, L. Ogallo, B. Pittock, R. Richels, C. Rosenzweig, U. Safriel, R.S.J. Tol, J.Weyant and G. Yohe, 2001: Vulnerability to climate change and reasons for con-cern: a synthesis.Climate Change 2001: Impacts, Adaptation, and Vulnerability.Contribution of Working Group II to the Third Assessment Report of the Inter-governmental Panel on Climate Change, J.J. McCarthy, O.F. Canziani, N.A.Leary, D.J. Dokken and K. S. White, Eds., Cambridge University Press, Cam-bridge, 913-967.
Smith, S.J., H. Pitcher and T.M.L. Wigley, 2005: Future sulfur dioxide emissions.Climatic Change, 73, 267-318.
Solecki, W.D. and C. Oliveri, 2004: Downscaling climate change scenarios in anurban land use change model. J. Environ. Manage., 72, 105-115.
Stone, M.C., R.H. Hotchkiss and L.O. Mearns, 2003: Water yield responses to highand low spatial resolution climate change scenarios in the Missouri River Basin.Geophys. Res. Lett., 30, doi:10.1029/2002GL016122.
Swart, R., J. Mitchell, T. Morita and S. Raper, 2002: Stabilisation scenarios for cli-mate impact assessment. Global Environ. Chang., 12, 155-165.
Syri, S., S. Fronzek, N. Karvosenoja and M. Forsius, 2004: Sulfur and nitrogen ox-ides emissions in Europe and deposition in Finland during the 21st century.BorealEnviron. Res., 9, 185-198.
Thaler, R. and E.J. Johnson, 1990: Gambling with the house money and trying tobreak even: the effects of prior outcomes on risky choice.Manage. Sci., 36, 643-660.
Thomalla, F., T. Cannon, S. Huq, R.J.T. Klein and C. Schaerer, 2005: Mainstream-ing adaptation to climate change in coastal Bangladesh by building civil societyalliances. Proceedings of the Solutions to Coastal Disasters Conference, L. Wal-lendorf, L. Ewing, S. Rogers and C. Jones, Eds., Charleston, South Carolina, 8-11 May 2005, American Society of Civil Engineers, Reston, Virginia, 668-684.
Thomas, C.D., A. Cameron, R.E. Green, M. Bakkenes, L.J. Beaumont, Y.C.Collingham, B.F.N. Erasmus, M. Ferreira de Siqueira,A. Grainger, L. Hannah, L.Hughes, B. Huntley, A.S. Van Jaarsveld, G.F. Midgley, L. Miles, M.A. Ortega-Huerta,A.T. Peterson, O.L. Phillips and S.E. Williams, 2004: Extinction risk fromclimate change. Nature, 427, 145-148.
Thuiller, W., M.B.Araújo, R.G. Pearson, R.J. Whittaker, L. Brotons and S. Lavorel,2004: Uncertainty in predictions of extinction risk. Nature, 430, 34.
Tol, R.S.J., 2002a: New estimates of the damage costs of climate change. Part I.Benchmark estimates. Environ. Resour. Econ., 21, 45-73.
Tol, R.S.J., 2002b: New estimates of the damage costs of climate change. Part II.Dynamic estimates. Environ. Resour. Econ., 21, 135-160.
Tol, R.S.J., 2006: Exchange rates and climate change: an application of FUND.Climatic Change, 75, 59-80.
Tol, R.S.J., M. Bohn, T.E. Downing, M.-L. Guillerminet, E. Hizsnyik, R. Kasper-son, K. Lonsdale, C. Mays, R.J. Nicholls, A.A. Olsthoorn, G. Pfeifle, M.Poumadere, F.L. Toth, A.T. Vafeidis, P.E. van der Werff and I.H. Yetkiner, 2006:
Chapter 2 New assessment methods and the characterisation of future conditions
169

Adaptation to five metres of sea level rise. J. Risk Res., 9, 467-482.Tompkins, E.L., 2005: Planning for climate change in small islands: insights from
national hurricane preparedness in the Cayman Islands.Global Environ. Chang.,15, 139-149.
Tompkins, E.L. and W.N. Adger, 2005: Defining a response capacity for climatechange. Environ. Sci. Policy, 8, 562-571.
Toth, F.L., T. Bruckner, H.-M. Füssel, M. Leimbach and G. Petschel-Held, 2003a:Integrated assessment of long-term climate policies. Part 1. Model presentation.Climatic Change, 56, 37-56.
Toth, F.L., T. Bruckner, H.-M. Füssel, M. Leimbach and G. Petschel-Held, 2003b:Integrated assessment of long-term climate policies. Part 2. Model results anduncertainty analysis. Climatic Change, 56, 57-72.
Trenberth, K.E., P.D. Jones, P.G. Ambenje, R. Bojariu, D.R. Easterling, A.M.G.Klein Tank, D.E. Parker, J.A. Renwick, F. Rahimzadeh, M.M. Rusticucci, B.J.Soden and P.-M. Zhai, 2007: Observations: surface and atmospheric climatechange.Climate Change 2007: The Physical Science Basis. Contribution ofWork-ing Group I to the Fourth Assessment Report of the Intergovernmental Panel onClimate Change, S. Solomon, D. Qin, M. Manning, Z. Chen, M. Marquis, K. B.Averyt, M. Tignor and H. L. Miller, Eds., Cambridge University Press, Cam-bridge, 235-336.
Turner, B.L., II, R.E. Kasperson, P.A. Matson, J.J. McCarthy, R.W. Corell, L. Chris-tensen, N. Eckley, J.X. Kasperson, A. Luers, M.L. Martello, C. Polsky, A. Pul-sipher and A. Schiller, 2003a: A framework for vulnerability analysis insustainability science. P. Natl. Acad. Sci., 100, 8074-8079.
Turner, B.L., II, P.A. Matson, J.J. McCarthy, R.W. Corell, L. Christensen, N. Eck-ley, G.K. Hovelsrud-Broda, J.X. Kasperson, R. Kasperson, A. Luers, M.L.Martello, S. Mathiesen, R. Naylor, C. Polsky, A. Pulsipher, A. Schiller, H. Selinand N. Tyler, 2003b: Illustrating the coupled human-environment system for vul-nerability analysis: three case studies. P. Natl. Acad. Sci., 100, 8080-8085.
Tversky, A. and D. Kahneman, 1974: Judgment under uncertainty: heuristics andbiases. Science, 211, 1124-1131.
UKMO, 2001: The Hadley Centre Regional Climate Modelling System: PRECIS– Providing Regional Climates for Impacts Studies. UK Meteorological Office,Bracknell, 17 pp.
UNDP, 2005: Adaptation Policy Frameworks for Climate Change: DevelopingStrategies, Policies and Measures. B. Lim, E. Spanger-Siegfried, I. Burton, E.Malone and S. Huq, Eds., Cambridge University Press, Cambridge and NewYork, 258 pp.
UNEP, 2002: Global Environment Outlook 3: Past, Present and Future Perspec-tives, Earthscan, London, 416 pp.
UNFCCC, 2004: Compendium of Decision Tools to Evaluate Strategies for Adap-tation to Climate Change. United Nations Framework Convention on ClimateChange, Bonn, 49 pp.
UNFCCC, 2005: Sixth Compilation and Synthesis of Initial National Communica-tions from Parties Not Included in Annex I to the Convention: Executive Sum-mary. FCCC/SBI/2005/18, United Nations Framework Convention on ClimateChange, Bonn, 21 pp. [Accessed 27.02.07: http://unfccc.int/resource/docs/2005/sbi/eng/18.pdf]
van Aalst, M., 2006: Managing Climate Risk: Integrating Adaptation into WorldBank Group Operations. World Bank Global Environment Facility Program,Washington, DC, 42 pp.
van Asselt, M.B.A. and N. Rijkens-Klomp, 2002: A look in the mirror: reflectionon participation in Integrated Assessment from a methodological perspective.Global Environ. Chang., 12, 167-184.
van Asselt, M.B.A. and J. Rotmans, 2002: Uncertainty in integrated assessmentmodelling: from positivism to pluralism. Climatic Change, 54, 75-105.
van Beek, L.P.H. and T.W.J. van Asch, 2004: Regional assessment of the effects ofland-use change on landslide hazard by means of physically based modelling.Nat. Hazards, 31, 289-304.
van Lieshout, M., R.S. Kovats, M.T.J. Livermore and P. Martens, 2004: Climatechange and malaria: analysis of the SRES climate and socio-economic scenarios.Global Environ. Chang., 14, 87-99.
van Meijl, H., T. van Rheenen,A. Tabeau and B. Eickhout, 2006: The impact of dif-ferent policy environments on agricultural land use in Europe. Agr. Ecosyst. En-viron., 114, 21-38.
van Minnen, J.G., J. Alcamo and W. Haupt, 2000: Deriving and applying responsesurface diagrams for evaluating climate change impacts on crop production.Cli-matic Change, 46, 317-338.
van Vuuren, D.P. and K.H. Alfsen, 2006: PPP versus MER: searching for answersin a multi-dimensional debate. Climatic Change, 75, 47-57.
van Vuuren, D.P. and B.C. O’Neill, 2006: The consistency of IPCC’s SRES sce-narios to recent literature and recent projections. Climatic Change, 75, 9-46.
van Vuuren, D.P., J. Weyant and F. de la Chesnaye, 2006: Multi-gas scenarios to sta-bilize radiative forcing. Energ. Econ., 28, 102-120.
van Vuuren, D.P., P. Lucas and H. Hilderink, 2007: Downscaling drivers of globalenvironmental change scenarios: enabling use of the IPCC SRES scenarios at thenational and grid level. Global Environ. Chang., 17, 114-130.
Vaze, J., P. Barnett, G. Beale, W. Dawes, R. Evans, N.K. Tuteja, B. Murphy, G.Geeves and M. Miller, 2004: Modelling the effects of land-use change on waterand salt delivery from a catchment affected by dryland salinity in south-east Aus-tralia. Hydrol. Process., 18, 1613-1637.
Velázquez, A., G. Bocco and A. Torres, 2001: Turning scientific approaches intopractical conservation actions: the case of Comunidad Indigena de Nuevo SanJuan Parangaricutiro, Mexico. Environ. Manage., 27, 655-665.
Vellinga, M. and R.A. Wood, 2002: Global climatic impacts of a collapse of theAtlantic thermohaline circulation. Climatic Change, 54, 251-267.
Verburg, P., C.J.E. Schulp, N. Witte and A. Veldkamp, 2006: Downscaling of landuse change scenarios to assess the dynamics of European landscapes.Agr. Ecosyst.Environ., 114, 39-56.
Verburg, P.H., W. Soepboer, A. Veldkamp, R. Limpiada, V. Espaldon and S.S.A.Mastura, 2002: Modeling the spatial dynamics of regional land use: the CLUE-S model. Environ. Manage., 30, 391-405.
Wandiga, S.O., M. Opondo, D. Olago, A. Githeko, F. Githui, M. Marshall, T.Downs,A. Opere, P.Z. Yanda, R. Kangalawe, R. Kabumbuli, J. Kathuri, E.Apindi,L. Olaka, L. Ogallo, P. Mugambi, R. Sigalla, R. Nanyunja, T. Baguma and P.Achola, 2006: Vulnerability to climate-induced highland malaria in East Africa.AIACC Working Paper No. 25, Assessments of Impacts and Adaptations to Cli-mate Change in Multiple Regions and Sectors Program, Washington, DC, 47 pp.
Wang, X., F. Zwiers and V. Swal, 2004: North Atlantic ocean wave climate changescenarios for the twenty-first century. J. Climate, 17, 2368-2383.
Webster, M.D., M. Babiker, M. Mayer, J.M. Reilly, J. Harnisch, M.C. Sarofim andC. Wang, 2002: Uncertainty in emissions projections for climate models. Atmos.Environ., 36, 3659-3670.
Webster, M.D., C. Forest, J. Reilly, M. Babiker, D. Kicklighter, M. Mayer, R. Prinn,M.C. Sarofim, A. Sokolov, P. Stone and C. Wang, 2003: Uncertainty analysis ofclimate change and policy response. Climatic Change, 61, 295-320.
Wehbe, M., H. Eakin, R. Seiler, M. Vinocur, C. Ávila and C. Marutto, 2006: Localperspectives on adaptation to climate change: lessons from Mexico andArgentina.AIACC Working Paper No. 39, Assessment of Impacts and Adaptation to Cli-mate Change in Multiple Regions and Sectors Program, Washington, DC, 37 pp.
Welp, M., 2001: The use of decision support tools in participatory river basin man-agement. Phys. Chem. Earth Pt B., 26, 535-539.
West, C.C. and M.J. Gawith, Eds., 2005:Measuring Progress: Preparing for ClimateChange through the UK Climate Impacts Programme. UKCIP, Oxford, 72 pp.
Westhoek, H., B. Eickhout and D. van Vuuren, 2006a: A brief comparison of sce-nario assumptions of four scenario studies: IPCC-SRES, GEO-3, MillenniumEcosystem Assessment and FAO towards 2030. MNP Report, Netherlands En-vironmental Assessment Agency (MNP), Bilthoven, 48 pp. [Accessed 27.02.07:http://www.mnp.nl/image/whats_new/]
Westhoek, H.J., M. van den Berg and J.A. Bakkes, 2006b: Scenario developmentto explore the future of Europe’s rural areas. Agr. Ecosyst. Environ., 114, 7-20.
Wigley, T.M.L., 2004: Choosing a stabilization target for CO2.Climatic Change, 67,1-11.
Wigley, T.M.L. and S.C.B. Raper, 2001: Interpretation of high projections forglobal-mean warming. Science, 293, 451-454.
Wilbanks, T.J., S.M. Kane, P.N. Leiby, R.D. Perlack, C. Settle, J.F. Shogren andJ.B. Smith, 2003: Possible responses to global climate change: integrating miti-gation and adaptation. Environment, 45, 28-38.
Wilby, R., M. McKenzie Hedger and C. Parker, 2004a: What We Need to KnowandWhen: Decision-Makers’Perspectives on Climate Change Science.Report ofWorkshop, February 2004, Climate Change Unit, EnvironmentAgency, London,41 pp.
Wilby, R.L. and I. Harris, 2006: A framework for assessing uncertainties in climatechange impacts: low-flow scenarios for the River Thames, UK. Water Resour.Res., 42, W02419, doi:10.1029/2005WR004065.
Wilby, R.L., R. Dawson and E.M. Barrow, 2002: SDSM: a decision support tool forthe assessment of regional climate change assessments. Environ. Modell. Softw.,17, 145-157.
Wilby, R.L., S.P. Charles, E. Zorita, B. Timtal, P. Whetton and L.O. Mearns, 2004b:Guidelines for Use of Climate Scenarios Developed from Statistical Downscal-
New assessment methods and the characterisation of future conditions Chapter 2
170

ing Methods. Supporting material of the Intergovernmental Panel on ClimateChange, IPCC Task Group on Data and Scenario Support for Impact and ClimateAnalysis, Cambridge University Press, Cambridge, 27 pp. [Accessed 26.02.07:http://www.ipcc-data.org/guidelines/dgm_no2_v1_09_2004.pdf]
Williams, J.W., S.T. Jackson and J.E. Kutzbach, 2007: Projected distributions ofnovel and disappearing climates by 2100 AD.P. Natl. Acad. Sci., 104, 5738-5742
Willows, R. and R. Connell, 2003: Climate adaptation: risk, uncertainty and deci-sion-making. UKCIP Technical Report, UK Climate Impacts Programme, Ox-ford, 154 pp.
Wood, A.W., L.R. Leung, V. Sridhar and D.P. Letterman, 2004: Hydrologic impli-cations of dynamical and statistical approaches to downscaling climate modeloutputs. Climatic Change, 62, 189-216.
Wood, R.A., M. Vellinga and R. Thorpe, 2003: Global warming and thermohalinecirculation stability. Philos. T. R. Soc. A, 361, 1961-1975.
Woodworth, P.L. and D.L. Blackman, 2004: Evidence for systematic changes inextreme high waters since the mid-1970s. J. Climate, 17, 1190-1197.
Wooldridge, S., T. Done, R. Berkelmans, R. Jones and P. Marshall, 2005: Precur-
sors for resilience in coral communities in a warming climate: a belief networkapproach.Mar. Ecol.–Prog. Ser., 295, 157-169.
World Bank, 2006: World Development Report 2006: Equity and Development.The World Bank, Washington, DC, and Oxford University Press, Oxford, 336 pp.
Yang, D.W., S. Kanae, T. Oki, T. Koike and K. Musiake, 2003: Global potentialsoil erosion with reference to land use and climate changes.Hydrol. Process., 17,2913-2928.
Yohe, G., 2004: Some thoughts on perspective. Global Environ. Chang., 14, 283-286.
Yohe, G. and F. Toth, 2000: Adaptation and the guardrail approach to tolerable cli-mate change. Climatic Change, 45, 103-128.
Yohe, G. and R.S.J. Tol, 2002: Indicators for social and economic coping capacity:moving toward a working definition of adaptive capacity. Global Environ.Chang., 12, 25-40.
Zebisch, M., F. Wechsung and H. Kenneweg, 2004: Landscape response functionsfor biodiversity: assessing the impact of land-use changes at the county level.Landscape Urban Plan., 67, 157-172.
Chapter 2 New assessment methods and the characterisation of future conditions
171
