newark and sherwood district council€¦ · newark and sherwood district council ... during the...
TRANSCRIPT
1
NEWARK AND SHERWOOD DISTRICT COUNCIL
STATEMENT OF ACCOUNTS
2011-2012
CONTENTS Page 2-7 Explanatory Foreword 8 Statement of Responsibilities for the Statement of Accounts 9-10 Report of Auditors 11-16 Financial Statements
11-12 Movement in Reserves Statement 13 Comprehensive Income and Expenditure Statement 14 Balance Sheet 15-16 Cash Flow Statement
17-67 Notes to Financial Statements 69-76 Supplementary Statements
69 Housing Revenue Account 70 Movement on Housing Revenue Account Balance 71-74 Housing Revenue Account Notes 75 Collection Fund 76 Collection Fund Notes
77-91 Group Accounts 77 Introduction 78-79 Group Movement in Reserves Statement 80 Group Comprehensive Income and Expenditure Statement 81 Group Balance Sheet 82 Group Cash Flow Statement 83-91 Notes to the Group Accounts 92-95 Annual Governance Statement

2
EXPLANATORY FOREWORD 1 Introduction
The Council's accounts for the year 2011/2012 are set out on pages 1 to 91. These comprise various statutory statements concerning internal controls, the accounts of the District Council and the Group Accounts which combine the accounts with those of Newark and Sherwood Homes Limited.
The accounts have been prepared in accordance with the Code of Practice on Local Authority Accounting in the
United Kingdom 2011/2012 (the Code) applicable to local authorities. The Code designates certain of the financial statements as "core" and requires these to be grouped together in a specified order, to be followed by a consolidated set of notes to the accounts covering all of the core statements. Supplementary statements are presented (with their own notes) after the notes on the core statements.
The Code sets out the proper accounting practices required for Statements of Accounts, by section 21(2) of the Local Government Act 2003 prepared in accordance with the statutory framework established for England by the Accounts and Audit Regulations 2003, updated by the Accounts and Audit Regulations 2011. The Statement of Accounts provides information on how the Council has used the financial resources available to it and answers the following significant questions:
How much did the Council’s services cost in 2011/2012?
Where did the money come from?
What were the major influences on the Council’s Income and Expenditure?
What were the Council’s Assets and Liabilities at the close of 2011/2012? 2 Review of 2011/2012 Introduction
The Council incurs both revenue and capital expenditure during the year. Revenue expenditure is generally on items that are consumed within one year, and financed from Government Grants, Council Tax, Council House Rents and various fees and charges. However, capital expenditure is on assets that have a life beyond one year and is financed from supported capital borrowing, proceeds from the sale of assets (capital receipts), capital grants and contributions, major repairs reserve and direct revenue financing.
During the year Council spending has been subject to regular monitoring and scrutiny. Quarterly monitoring reports are considered by Overview and Scrutiny committees and by Cabinet.
2011/2012 has presented the Council with a number of challenges in successfully managing its budgets. Officers and Members have worked closely together to find savings in the provision of services. These included savings to be achieved through voluntary redundancies, flexible retirements and staffing restructures, conditions of service review, efficiencies within services and changes in service delivery for the administration function. The costs of redundancies and retirements will be met over three years from budget savings, however, monies set aside in specific reserves have been used to mitigate the cost in the 2011/2012 financial year.
The General Fund (the Council’s Revenue Account)
The Budget for 2011/2012 was achieved with a 2.7% decrease on the Council Tax giving a Band D Council Tax of £160.73.
The total net expenditure budget for the year was set at £17.44m, representing the net cost of providing the Council’s services (including Parish Precepts). The financing of the total net expenditure budget for the year is shown as follows:
£’000 Government Formula Grant (Revenue Support Grant and re-distributed business rates) 8,422 Other Government Grant (Council Tax Freeze Grant 161 Council Tax Income 8,855
Total 17,438

3
The following table identifies significant variances in service expenditure analysed by Portfolio. Comparison of actuals is against the original budget for 2011/2012 i.e. the budget as approved by Council when setting the Council Tax for 2011/2012 prior to the start of the financial year.
Original Budget Actuals Variance £’000 £’000 £’000 Portfolio Clean and Green 5,538 5,609 71 Culture and Leisure 2,996 2,825 (171) Health and Homes 1,268 1,301 33 Safe and Strong 718 749 31 Strategic and Corporate Policy 3,510 3,802 292 Sustainable Development and Regeneration 2,189 1,921 (268) SMART Focus savings (1,106) 0 1,106
Total Services 15,113 16,207 1,094
Drainage Levy 497 483 (14) Movement to/(from) earmarked reserves (195) 1,112 1,307 Parish Precepts 2,449 2,449 0 Statutory accounting adjustments (426) (2,873) (2,447)
Total Net Expenditure 17,438 17,378 (60)
Formula and Other Grant (8,583) (9,035) (452) Collection Fund (8,855) (8,749) 106
Total (Surplus)/Deficit 0 (406) (406)
Net Expenditure on the General Fund Portfolios for 2011/2012 was over budget by £1,094k. The major variances are:
An impairment charge on Kelham Hall following a downward revaluation of the property. This charge is reversed by a statutory accounting adjustment.
SMART focus savings have been achieved and accounted for within service areas over the course of the year, therefore the variance of £1,106k is offset by portfolio variances.
Housing Revenue Account
The Council maintains a separate revenue account for recording all income and expenditure relating to the management and maintenance of its housing stock. This is known as the Housing Revenue account (HRA) and the items to be charged to it are prescribed by statute.
The Housing Revenue Account includes a management fee paid to Newark and Sherwood Homes Ltd to manage the stock owned by the Council under arms length arrangements. The management agreement came into effect on 1 November 2004. The management contract includes a clause whereby Newark and Sherwood Homes Ltd repay any surplus after tax, relating to the 2011/2012 year, to the District Council which the Council has agreed to re-advance to them on 1 April 2012. This amounted to £2,551,000 and is included in the HRA balance in hand. The Localism Act 2011 legislated for a reform of council house financing known as self financing. The objectives of the reforms are:
To give local authorities the resources, incentives and flexibility they need to manage their own housing stock for the long-term and to drive up quality and efficiency.
To give tenants the information they need to hold their landlord to account, by replacing the current opaque system with one which has a clear relationship between the rent a landlord collects and the services they provide.
For the District Council this means that it will now retain the rental income from its housing stock but has taken on more debt (a one off settlement of £36.1m) under this reform. The total debt attributed to the HRA is £110.4m.
In 2011/2012 the Council budgeted for a zero increase in the HRA working balance. The actual year end position shows an increase in the working balance of £584k. The key reason for the difference being the efficiencies achieved by Newark and Sherwood Homes Ltd over and above those budgeted for.

4
Joint Arrangements – Mansfield Crematorium
Mansfield Crematorium has been recognised as a joint arrangement between Mansfield District Council, Ashfield District Council and Newark and Sherwood District Council. The authority accounts directly for its part of the assets, liabilities, income, expenditure and cash flows held arising from the operations of the crematorium. In 2011/2012 Mansfield Crematorium made a surplus of £424k, £35k of which is attributable to Newark and Sherwood District Council and is shown in the Comprehensive Income and Expenditure Statement under Environmental and Regulatory Services.
Capital Expenditure and Income
Capital expenditure can be defined as that which generates an asset that has a useful life of more than one year. The capital account shows the Income and Expenditure transactions the Council makes when it:
Buys or sells land or property
Builds new property
Carries out major repairs to the Council’s properties
Improves the Council’s properties
Provides grants for the above types of activity
Original Budget Final Budget Actuals £’000 £000 £000 Housing Services 6,448 7,387 7,400 Other Services 1,313 1,561 1,430
Total Capital Expenditure 7,761 8,948 8,830
Borrowing 188 327 867 Other sources of Financing 7,573 8,621 7,963
Total Financing 7,761 8,948 8,830
The phasing of the capital budget has been monitored and adjusted through the course of the year to reflect the actual programme of work on projects planned for delivery over more than one financial year. The principal schemes contributing to the £118k year-end underspending are:
Enhancements to Council communication and surveillance networks (£37k) which is a medium term project to modernise the Council’s communications technology involving the evaluation and implementation of differing solutions
The Sconce & Devon Park restoration project (£48k) is complete but it has not been possible to agree the final contract payments
Energy saving proposals (£39k) which is a phased programme on implementation involving rigorous evaluation of solutions as they are implemented
Play Area renovations (£21k) in which budget is allocated to works as they are identified and external funding is received.
These underspendings have been offset to an extent by expenditure on work that was approved for 2012/2013 but has been brought forward to achieve a more effective programme. Further analysis of the principal items of capital expenditure and finance are provided on pages 45 and 46
Minimum Revenue Provision
The Local Government Act 2003 requires authorities to set aside an amount from revenue (Minimum Revenue Provision) for the repayment of external loans which have been taken out to fund capital expenditure. In line with CLG Regulations from 2008/09 the Council is required to approve an MRP Statement for each year. For capital expenditure incurred before 1 April 2008 or which in the future will be Supported Capital Expenditure (ie Central Government provides revenue to pay for the borrowing), the MRP policy is the Capital Financing Requirement method outlined in the MRP guidance provided to local authorities by Communities and Local Government as part of the implementation of the Local Authorities (Capital Finance and Accounting) (England)(Amendment) Regulations 2008(SI 2008/414). From 1 April 2008 for all unsupported borrowing the MRP policy is the Asset Life Method whereby MRP will be based on the estimated life of the assets, in accordance with regulations.

5
Council Tax Collection
The net collectable amount for 2011/2012 Council Tax was £56.8m, of which £55.7m has been received. This represents a collection rate of 98%. Total Council Tax arrears, including costs, amounted to £2.4m as at 31 March 2012 and will be collected during 2012/2013. Council tax is collected on behalf of Nottinghamshire County Council, Nottinghamshire Fire Authority and Nottinghamshire Police Authority. Amounts collected, bad debt write offs and any surplus or deficit on collection are distributed according to precept.
Significance of Pension Liabilities and Assets
The application of IAS 19 has resulted in a pension liability of £45.1m (£30.2m 2010/2011) shown in the Balance Sheet. This amount is matched by a pension reserve, also shown in the Balance Sheet, and therefore has no impact on the Council’s overall financial position as at 31 March 2012.
Note 48 on page 57 gives further analysis of the Council’s pension liability. Treasury Management Performance
During the financial year, the Council operated within the treasury limits set out in the Council’s Treasury Management and Annual Investment Strategy which was approved on 9 March 2011.
Continuing problems in the financial markets meant that some previously highly rated institutions that had been used for temporarily investing surplus funds remain downgraded and at the same time interest rates continue at historically low levels. In response the Council reviewed its Treasury Management Strategy and as a result it was decided to continue with reduced exposure to the market by utilising internal balances to finance some capital expenditure and also not to renew maturing debt. Remaining cash that is held for daily cashflow purposes is invested in AAA rated or Government backed institutions and instant access Money Market Funds.
In October 2008 the Icelandic banking sector defaulted on its obligations. At that time the Council had £2m invested in Glitnir. On 28 October 2011 the Icelandic Supreme Court ruled that Local Authorities investors were preferential creditors and were, therefore, entitled to receive full repayment of their investments. £1.7m was received on 16 March 2011 with the remaining balance being held in a ring fenced Icelandic bank account until currency exchange restrictions are lifted. Interest credited to the Comprehensive Income and Expenditure Statement in 2011/2012 was £141k which represents an average interest rate of 0.93% for short term instant access deposits. However, due to the nature of investment markets longer term fixed deposits achieved an average interest rate of 1.49%. This compares to the 3 month London Inter-Bank rate (LIBID) of 0.94% for the year.
The Council held investments of £12.1m at 31 March 2012 (£4.1m on 31 March 2011). Reserves and Balances
The General Fund working balance at the end of the financial year is £2,726k which will be carried over into 2012/2013. The working balance is maintained to provide a financial cushion should unexpected events occur that lead to significant unplanned expenditure that would not be met from other sources or by specific Central Government Grants. The current minimum working balance for the General Fund is set at £2.4m.
The Housing Revenue Account working balance of £4,791k represents the existing revenue balance.
The Council holds a number of earmarked reserves to finance future capital and revenue expenditure. The value of specific reserves held at 31 March 2012 is £9,122k (£8,038k at 31 March 2011). A full analysis of earmarked reserves is contained in Note 40 Usable Reserves.
Consolidated Group Accounts
The authority is required under the Local Government Act 2003 to produce a set of Group accounts where it has subsidiaries, joint ventures or associates. The criteria for deciding if the authority has such relationships are laid down by the Code of Practice on Local Authority Accounting in the United Kingdom 2011/2012. The authority is required to consolidate its accounts with those of Newark and Sherwood Homes Ltd (NSH) which is a wholly owned subsidiary or the authority.

6
3 Statutory Statements
The following Statement of Accounts for Newark and Sherwood District Council presents the overall financial position for the Authority for the year ended 31 March 2012, and has been produced in accordance with the Code of Practice on Local Authority Accounting in the United Kingdom 2011/2012 published by the Chartered Institute of Public Finance and Accountancy (CIPFA).
Statement of Responsibilities for the Statement of Accounts (page 8) which is required under current Codes of
Practice for Local Authority Accounting to be signed by the Chief Financial Officer stating the accounts present a true and fair view of the financial position of the Council.
Auditors Report (pages 9-10) which provides an opinion on the fairness of the accounts presented.
Annual Governance Statement (pages 92-95) which sets out the framework within which financial control is exercised and the main components of the system including internal audit arrangements. The statement identifies any significant control issues and action being taken to address them. This has to be certified by the Chief Executive and the Leader of the Council.
4 Financial Statements The Statements required by the Code comprise the following:
Movement in Reserves Statement
Comprehensive Income and Expenditure Statement
Balance Sheet
Cash Flow Statement
Notes to Core Statements
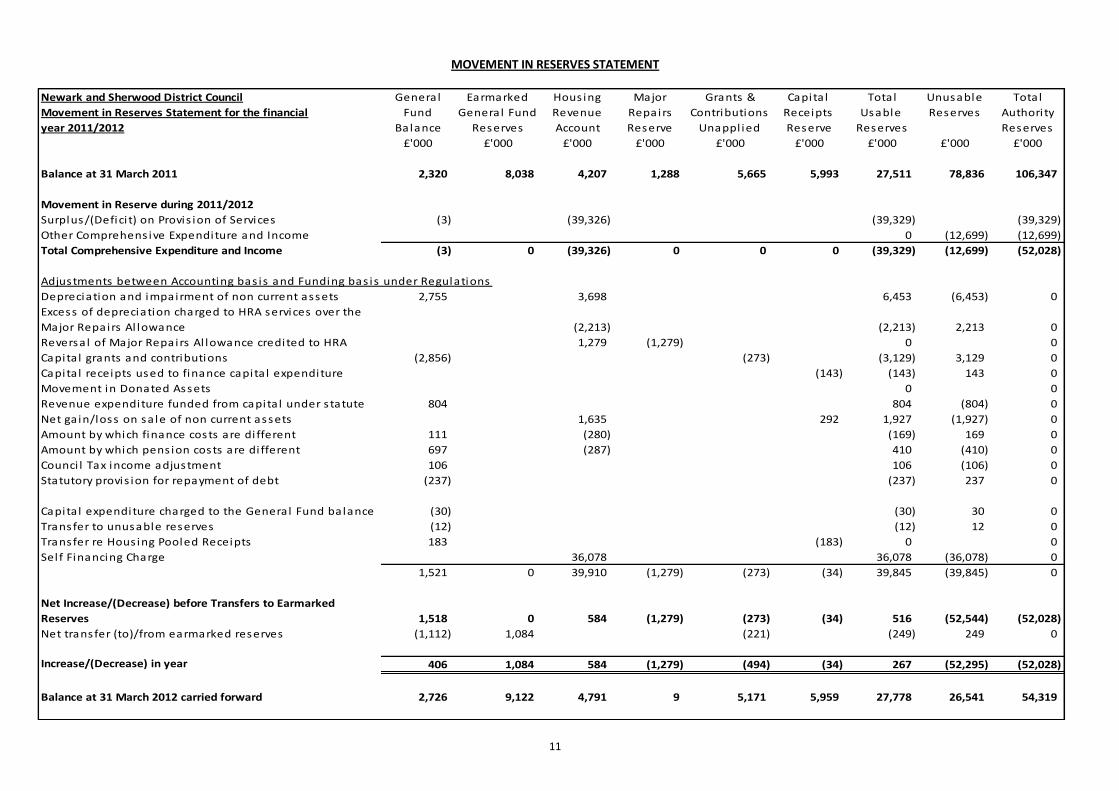
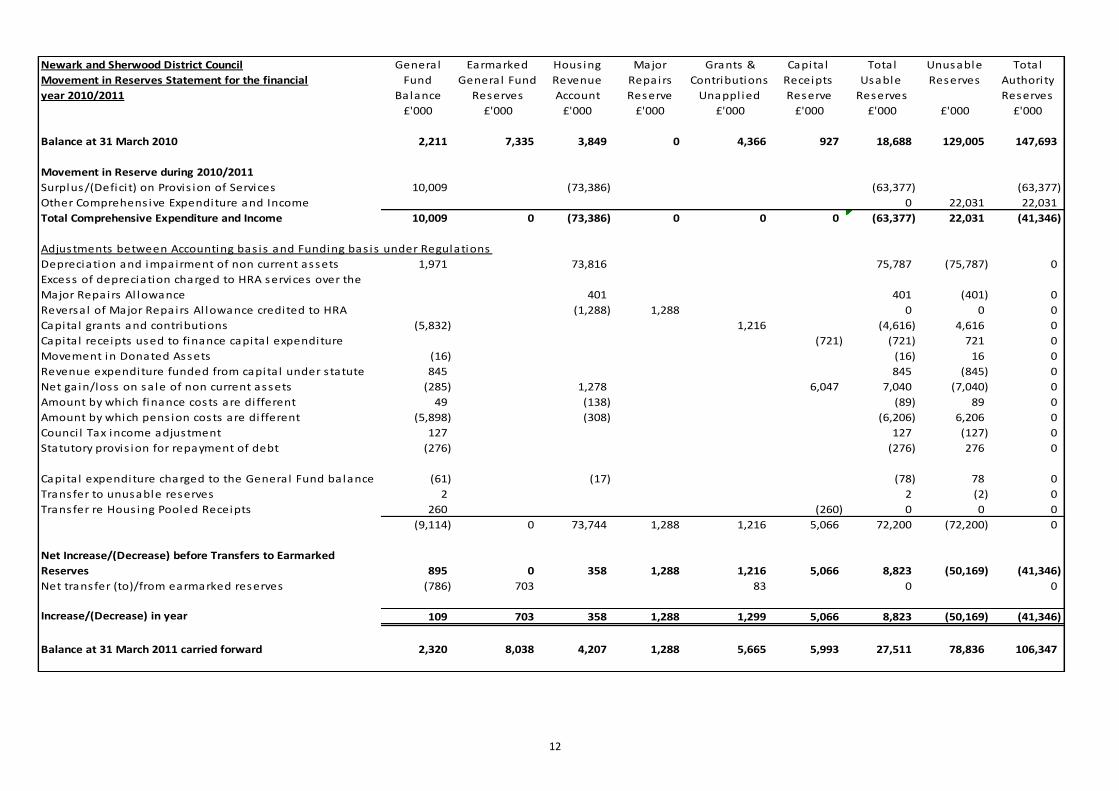
These are described in more detail in the notes below. Movement in Reserves Statement (pages 11-12). This statement shows the movement in the year on the different reserves held by the authority, analysed into ‘usable reserves’ (ie those that can be applied to fund expenditure or reduce local taxation) and unusable reserves. The Surplus/(Deficit) on the Provision of Services line shows the true economic cost of providing the authority’s services, more details of which are shown in the Comprehensive Income and Expenditure Statement. These are different from the statutory amounts required to be charged to the General Fund Balance and the Housing Revenue Account for council tax setting and dwellings rent setting purposes. The Net Increase/(Decrease) before Transfers to Earmarked Reserves line shows the statutory General Fund Balance and Housing Revenue Account Balance before any discretionary transfers to or from earmarked reserves undertaken by the Council.
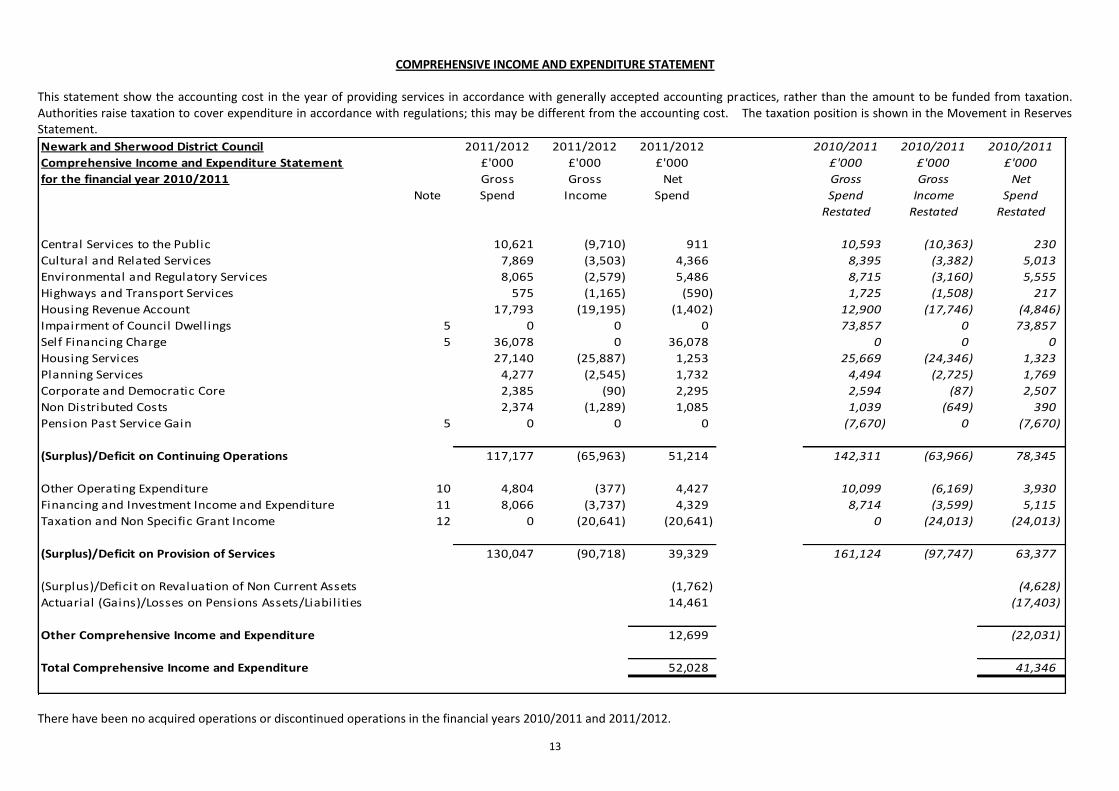
Comprehensive Income and Expenditure Statement (page 13). This account summarises the resources that have been generated and consumed in providing services and managing the Council during 2011/2012. It includes all day-to-day expenses and related income on an accruals basis, as well as transactions measuring the value of non current assets consumed and the real projected value of retirement benefits earned by employees in the year. It includes the amounts spent not only on local taxpayer services but also local rent payer services.
Balance Sheet (page 14) which summarises the Council's assets and liabilities together with the sources of funds i.e.
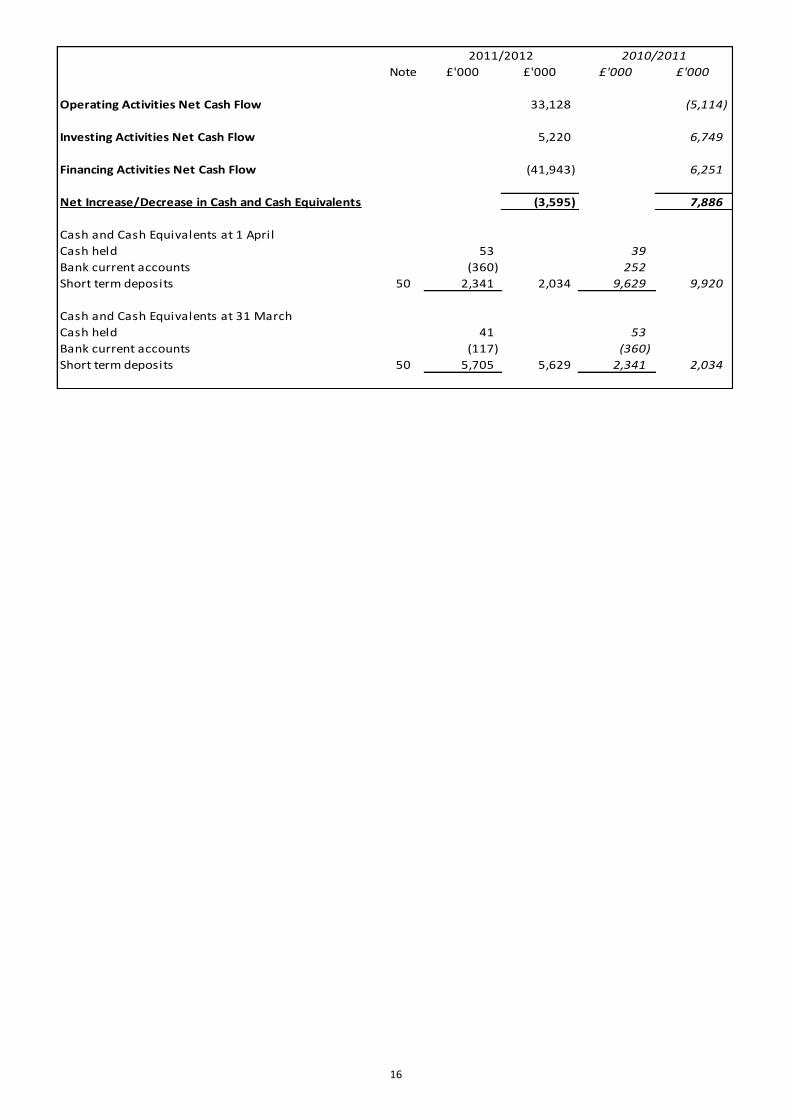
what the Council owns, who it owes money to, who owes it money and what reserves it has to meet future spending. Cash Flow Statement (pages 15-16) which summarises the movement in cash i.e. excluding internal provisions which
have no effect on cash.
Notes to Financial Statements (pages 17-68). These are notes relating to the preceding financial statements which explain and provide additional information to figures included in these statements.
Housing Revenue Account (pages 69-74). This reflects a statutory obligation to account separately for the Council’s housing landlord function. It shows the major elements of housing revenue expenditure – maintenance, administration and capital financing costs, and how these are met by rents, subsidy and other income.

7
Collection Fund (pages 75-76). The Account details all monies due from Council Tax and Business Rate payers and payments made to the County Council, Police and Fire Authorities, Parish Councils and the District Council. All business rates, less a deduction for collection costs, are paid into a central government Pool and redistributed to Local Authorities through the Local Government Finance Settlement.
Group Accounts (pages 77-91). The District Council has considered the relevant legislation and accounting guidance
and has concluded that it will need to prepare Group Accounts. These consolidate the accounts of the District Council with those of Newark and Sherwood Homes Ltd which is wholly owned by the District Council. After due consideration no other third party organisation's accounts need to be consolidated.

8
STATEMENT OF RESPONSIBILITIES FOR THE STATEMENT OF ACCOUNTS
The Authority's Responsibilities 1 The authority is required to:
make arrangements for the proper administration of its financial affairs and to secure that one of its officers has the responsibility for the administration of those affairs. In this authority, that officer is the Director of Resources
manage its affairs to secure economic, efficient and effective use of resources and safeguard its assets
approve the Statement of Accounts Responsibilities of the Director of Resources
2 The Director of Resources is responsible for the preparation of the authority's Statement of Accounts in accordance
with proper practices as set out in the CIPFA/LASAAC Code of Practice on Local Authority Accounting in the United Kingdom (the Code).
3 In preparing this Statement of Accounts, the Director of Resources has:
selected suitable accounting policies and then applied them consistently
made judgments and estimates that were reasonable and prudent
complied with the local authority Code. 4 The Director of Resources has also:
kept proper accounting records which were up to date
taken reasonable steps for the prevention and detection of fraud and other irregularities Certificate of the Director of Resources 5 This statement of accounts is that upon which the auditor should enter his opinion. It presents a true and fair view of
the financial position of the authority at 31st March 2012 and its income and expenditure for the year then ended. D. Dickinson CPFA, BA Director of Resources
5 September 2012
SIGNATURE OF CHAIRMAN OF MEETING WHICH APPROVED THE ACCOUNTS
Councillor Mrs R. Crowe
Chairman Audit and Accounts Committee
5 September 2012
9
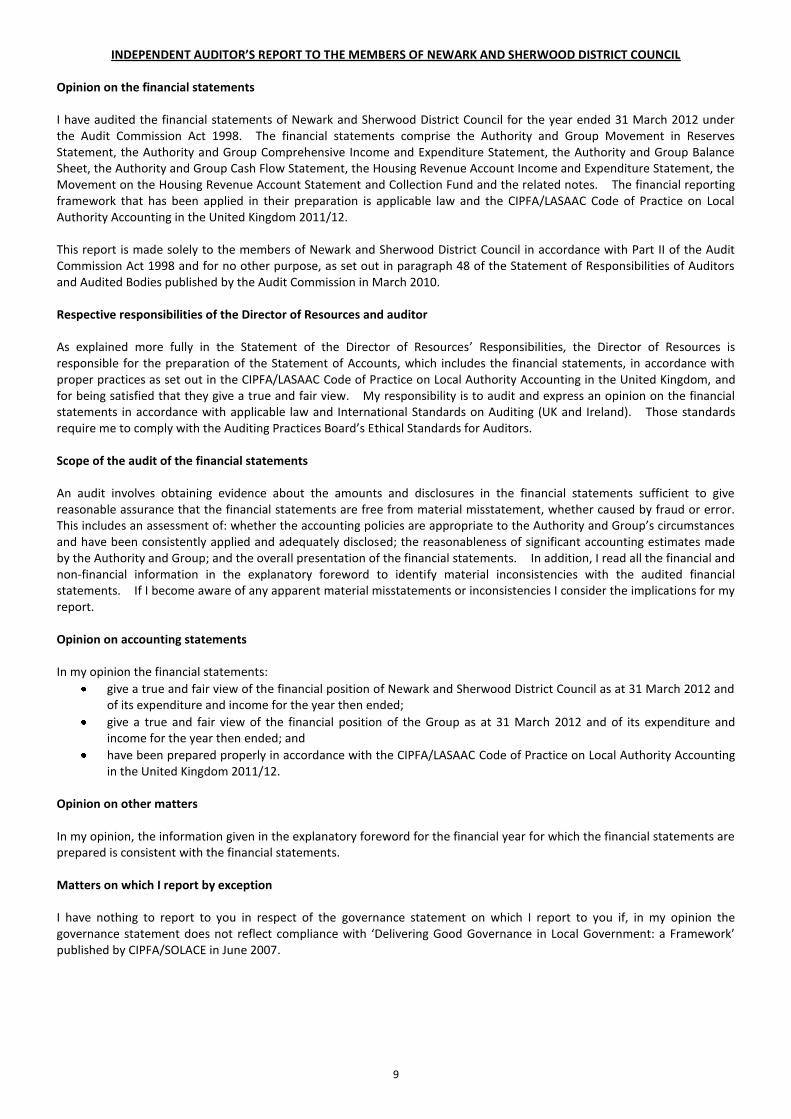
INDEPENDENT AUDITOR’S REPORT TO THE MEMBERS OF NEWARK AND SHERWOOD DISTRICT COUNCIL Opinion on the financial statements I have audited the financial statements of Newark and Sherwood District Council for the year ended 31 March 2012 under the Audit Commission Act 1998. The financial statements comprise the Authority and Group Movement in Reserves Statement, the Authority and Group Comprehensive Income and Expenditure Statement, the Authority and Group Balance Sheet, the Authority and Group Cash Flow Statement, the Housing Revenue Account Income and Expenditure Statement, the Movement on the Housing Revenue Account Statement and Collection Fund and the related notes. The financial reporting framework that has been applied in their preparation is applicable law and the CIPFA/LASAAC Code of Practice on Local Authority Accounting in the United Kingdom 2011/12. This report is made solely to the members of Newark and Sherwood District Council in accordance with Part II of the Audit Commission Act 1998 and for no other purpose, as set out in paragraph 48 of the Statement of Responsibilities of Auditors and Audited Bodies published by the Audit Commission in March 2010. Respective responsibilities of the Director of Resources and auditor As explained more fully in the Statement of the Director of Resources’ Responsibilities, the Director of Resources is responsible for the preparation of the Statement of Accounts, which includes the financial statements, in accordance with proper practices as set out in the CIPFA/LASAAC Code of Practice on Local Authority Accounting in the United Kingdom, and for being satisfied that they give a true and fair view. My responsibility is to audit and express an opinion on the financial statements in accordance with applicable law and International Standards on Auditing (UK and Ireland). Those standards require me to comply with the Auditing Practices Board’s Ethical Standards for Auditors. Scope of the audit of the financial statements An audit involves obtaining evidence about the amounts and disclosures in the financial statements sufficient to give reasonable assurance that the financial statements are free from material misstatement, whether caused by fraud or error. This includes an assessment of: whether the accounting policies are appropriate to the Authority and Group’s circumstances and have been consistently applied and adequately disclosed; the reasonableness of significant accounting estimates made by the Authority and Group; and the overall presentation of the financial statements. In addition, I read all the financial and non-financial information in the explanatory foreword to identify material inconsistencies with the audited financial statements. If I become aware of any apparent material misstatements or inconsistencies I consider the implications for my report. Opinion on accounting statements In my opinion the financial statements:
give a true and fair view of the financial position of Newark and Sherwood District Council as at 31 March 2012 and of its expenditure and income for the year then ended;
give a true and fair view of the financial position of the Group as at 31 March 2012 and of its expenditure and income for the year then ended; and
have been prepared properly in accordance with the CIPFA/LASAAC Code of Practice on Local Authority Accounting in the United Kingdom 2011/12.
Opinion on other matters In my opinion, the information given in the explanatory foreword for the financial year for which the financial statements are prepared is consistent with the financial statements. Matters on which I report by exception I have nothing to report to you in respect of the governance statement on which I report to you if, in my opinion the governance statement does not reflect compliance with ‘Delivering Good Governance in Local Government: a Framework’ published by CIPFA/SOLACE in June 2007.
10
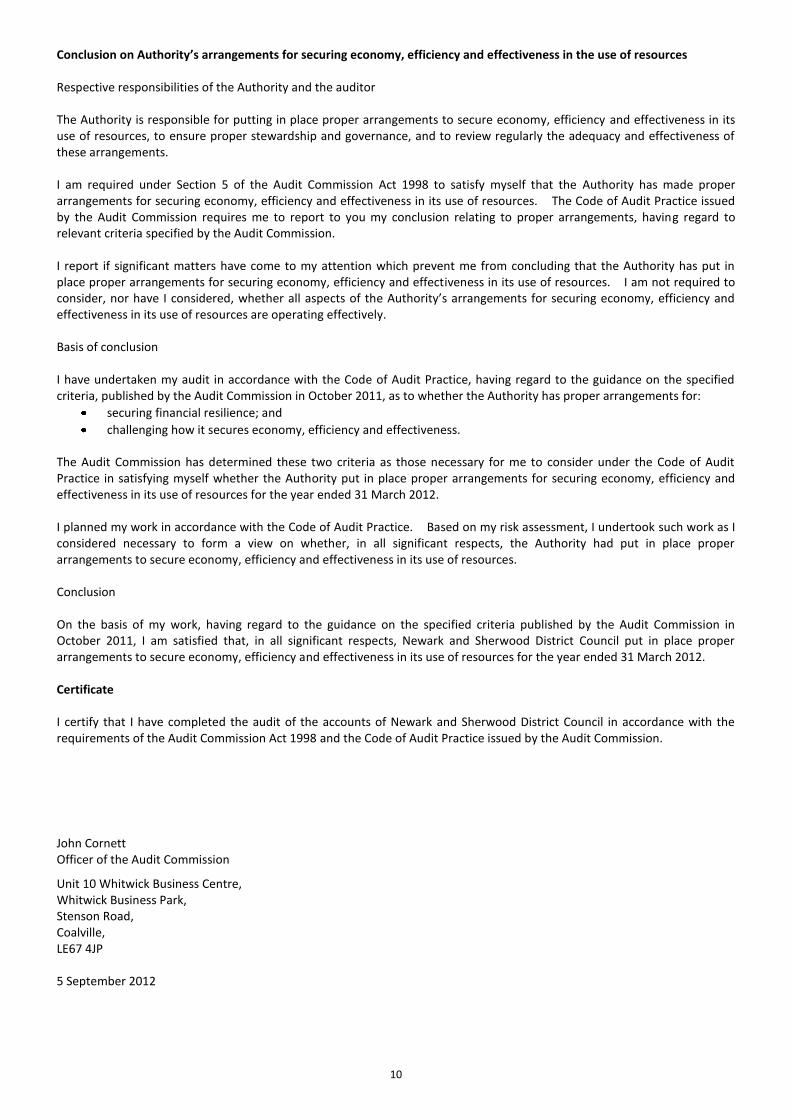
Conclusion on Authority’s arrangements for securing economy, efficiency and effectiveness in the use of resources Respective responsibilities of the Authority and the auditor The Authority is responsible for putting in place proper arrangements to secure economy, efficiency and effectiveness in its use of resources, to ensure proper stewardship and governance, and to review regularly the adequacy and effectiveness of these arrangements. I am required under Section 5 of the Audit Commission Act 1998 to satisfy myself that the Authority has made proper arrangements for securing economy, efficiency and effectiveness in its use of resources. The Code of Audit Practice issued by the Audit Commission requires me to report to you my conclusion relating to proper arrangements, having regard to relevant criteria specified by the Audit Commission. I report if significant matters have come to my attention which prevent me from concluding that the Authority has put in place proper arrangements for securing economy, efficiency and effectiveness in its use of resources. I am not required to consider, nor have I considered, whether all aspects of the Authority’s arrangements for securing economy, efficiency and effectiveness in its use of resources are operating effectively. Basis of conclusion I have undertaken my audit in accordance with the Code of Audit Practice, having regard to the guidance on the specified criteria, published by the Audit Commission in October 2011, as to whether the Authority has proper arrangements for:
securing financial resilience; and
challenging how it secures economy, efficiency and effectiveness. The Audit Commission has determined these two criteria as those necessary for me to consider under the Code of Audit Practice in satisfying myself whether the Authority put in place proper arrangements for securing economy, efficiency and effectiveness in its use of resources for the year ended 31 March 2012. I planned my work in accordance with the Code of Audit Practice. Based on my risk assessment, I undertook such work as I considered necessary to form a view on whether, in all significant respects, the Authority had put in place proper arrangements to secure economy, efficiency and effectiveness in its use of resources. Conclusion On the basis of my work, having regard to the guidance on the specified criteria published by the Audit Commission in October 2011, I am satisfied that, in all significant respects, Newark and Sherwood District Council put in place proper arrangements to secure economy, efficiency and effectiveness in its use of resources for the year ended 31 March 2012. Certificate I certify that I have completed the audit of the accounts of Newark and Sherwood District Council in accordance with the requirements of the Audit Commission Act 1998 and the Code of Audit Practice issued by the Audit Commission.
John Cornett Officer of the Audit Commission
Unit 10 Whitwick Business Centre, Whitwick Business Park, Stenson Road, Coalville, LE67 4JP 5 September 2012
11
MOVEMENT IN RESERVES STATEMENT
Newark and Sherwood District Council General Earmarked Hous ing Major Grants & Capita l Total Unusable Total
Movement in Reserves Statement for the financial Fund General Fund Revenue Repairs Contributions Receipts Usable Reserves Authori ty
year 2011/2012 Balance Reserves Account Reserve Unappl ied Reserve Reserves Reserves
£'000 £'000 £'000 £'000 £'000 £'000 £'000 £'000 £'000
Balance at 31 March 2011 2,320 8,038 4,207 1,288 5,665 5,993 27,511 78,836 106,347
Movement in Reserve during 2011/2012
Surplus/(Defici t) on Provis ion of Services (3) (39,326) (39,329) (39,329)
Other Comprehens ive Expenditure and Income 0 (12,699) (12,699)
Total Comprehensive Expenditure and Income (3) 0 (39,326) 0 0 0 (39,329) (12,699) (52,028)
Adjustments between Accounting bas is and Funding bas is under Regulations
Depreciation and impairment of non current assets 2,755 3,698 6,453 (6,453) 0
Excess of depreciation charged to HRA services over the
Major Repairs Al lowance (2,213) (2,213) 2,213 0
Reversa l of Major Repairs Al lowance credited to HRA 1,279 (1,279) 0 0
Capita l grants and contributions (2,856) (273) (3,129) 3,129 0
Capita l receipts used to finance capita l expenditure (143) (143) 143 0
Movement in Donated Assets 0 0
Revenue expenditure funded from capita l under s tatute 804 804 (804) 0
Net ga in/loss on sa le of non current assets 1,635 292 1,927 (1,927) 0
Amount by which finance costs are di fferent 111 (280) (169) 169 0
Amount by which pens ion costs are di fferent 697 (287) 410 (410) 0
Counci l Tax income adjustment 106 106 (106) 0
Statutory provis ion for repayment of debt (237) (237) 237 0
Capita l expenditure charged to the General Fund balance (30) (30) 30 0
Transfer to unusable reserves (12) (12) 12 0
Transfer re Hous ing Pooled Receipts 183 (183) 0 0
Sel f Financing Charge 36,078 36,078 (36,078) 0
1,521 0 39,910 (1,279) (273) (34) 39,845 (39,845) 0
Net Increase/(Decrease) before Transfers to Earmarked
Reserves 1,518 0 584 (1,279) (273) (34) 516 (52,544) (52,028)
Net transfer (to)/from earmarked reserves (1,112) 1,084 (221) (249) 249 0
Increase/(Decrease) in year 406 1,084 584 (1,279) (494) (34) 267 (52,295) (52,028)
Balance at 31 March 2012 carried forward 2,726 9,122 4,791 9 5,171 5,959 27,778 26,541 54,319
12
Newark and Sherwood District Council General Earmarked Hous ing Major Grants & Capita l Total Unusable Total
Movement in Reserves Statement for the financial Fund General Fund Revenue Repairs Contributions Receipts Usable Reserves Authori ty
year 2010/2011 Balance Reserves Account Reserve Unappl ied Reserve Reserves Reserves
£'000 £'000 £'000 £'000 £'000 £'000 £'000 £'000 £'000
Balance at 31 March 2010 2,211 7,335 3,849 0 4,366 927 18,688 129,005 147,693
Movement in Reserve during 2010/2011
Surplus/(Defici t) on Provis ion of Services 10,009 (73,386) (63,377) (63,377)
Other Comprehens ive Expenditure and Income 0 22,031 22,031
Total Comprehensive Expenditure and Income 10,009 0 (73,386) 0 0 0 (63,377) 22,031 (41,346)
Adjustments between Accounting bas is and Funding bas is under Regulations
Depreciation and impairment of non current assets 1,971 73,816 75,787 (75,787) 0
Excess of depreciation charged to HRA services over the
Major Repairs Al lowance 401 401 (401) 0
Reversa l of Major Repairs Al lowance credited to HRA (1,288) 1,288 0 0 0
Capita l grants and contributions (5,832) 1,216 (4,616) 4,616 0
Capita l receipts used to finance capita l expenditure (721) (721) 721 0
Movement in Donated Assets (16) (16) 16 0
Revenue expenditure funded from capita l under s tatute 845 845 (845) 0
Net ga in/loss on sa le of non current assets (285) 1,278 6,047 7,040 (7,040) 0
Amount by which finance costs are di fferent 49 (138) (89) 89 0
Amount by which pens ion costs are di fferent (5,898) (308) (6,206) 6,206 0
Counci l Tax income adjustment 127 127 (127) 0
Statutory provis ion for repayment of debt (276) (276) 276 0
Capita l expenditure charged to the General Fund balance (61) (17) (78) 78 0
Transfer to unusable reserves 2 2 (2) 0
Transfer re Hous ing Pooled Receipts 260 (260) 0 0 0
(9,114) 0 73,744 1,288 1,216 5,066 72,200 (72,200) 0
Net Increase/(Decrease) before Transfers to Earmarked
Reserves 895 0 358 1,288 1,216 5,066 8,823 (50,169) (41,346)
Net transfer (to)/from earmarked reserves (786) 703 83 0 0
Increase/(Decrease) in year 109 703 358 1,288 1,299 5,066 8,823 (50,169) (41,346)
Balance at 31 March 2011 carried forward 2,320 8,038 4,207 1,288 5,665 5,993 27,511 78,836 106,347
13
COMPREHENSIVE INCOME AND EXPENDITURE STATEMENT
This statement show the accounting cost in the year of providing services in accordance with generally accepted accounting practices, rather than the amount to be funded from taxation. Authorities raise taxation to cover expenditure in accordance with regulations; this may be different from the accounting cost. The taxation position is shown in the Movement in Reserves Statement.
Newark and Sherwood District Council 2011/2012 2011/2012 2011/2012 2010/2011 2010/2011 2010/2011
Comprehensive Income and Expenditure Statement £'000 £'000 £'000 £'000 £'000 £'000
for the financial year 2010/2011 Gross Gross Net Gross Gross Net
Note Spend Income Spend Spend Income Spend
Restated Restated Restated
Central Services to the Public 10,621 (9,710) 911 10,593 (10,363) 230
Cultural and Related Services 7,869 (3,503) 4,366 8,395 (3,382) 5,013
Environmental and Regulatory Services 8,065 (2,579) 5,486 8,715 (3,160) 5,555
Highways and Transport Services 575 (1,165) (590) 1,725 (1,508) 217
Housing Revenue Account 17,793 (19,195) (1,402) 12,900 (17,746) (4,846)
Impairment of Council Dwellings 5 0 0 0 73,857 0 73,857
Self Financing Charge 5 36,078 0 36,078 0 0 0
Housing Services 27,140 (25,887) 1,253 25,669 (24,346) 1,323
Planning Services 4,277 (2,545) 1,732 4,494 (2,725) 1,769
Corporate and Democratic Core 2,385 (90) 2,295 2,594 (87) 2,507
Non Distributed Costs 2,374 (1,289) 1,085 1,039 (649) 390
Pension Past Service Gain 5 0 0 0 (7,670) 0 (7,670)
(Surplus)/Deficit on Continuing Operations 117,177 (65,963) 51,214 142,311 (63,966) 78,345
Other Operating Expenditure 10 4,804 (377) 4,427 10,099 (6,169) 3,930
Financing and Investment Income and Expenditure 11 8,066 (3,737) 4,329 8,714 (3,599) 5,115
Taxation and Non Specific Grant Income 12 0 (20,641) (20,641) 0 (24,013) (24,013)
(Surplus)/Deficit on Provision of Services 130,047 (90,718) 39,329 161,124 (97,747) 63,377
(Surplus)/Deficit on Revaluation of Non Current Assets (1,762) (4,628)
Actuarial (Gains)/Losses on Pensions Assets/Liabilities 14,461 (17,403)
Other Comprehensive Income and Expenditure 12,699 (22,031)
Total Comprehensive Income and Expenditure 52,028 41,346
There have been no acquired operations or discontinued operations in the financial years 2010/2011 and 2011/2012.

14
BALANCE SHEET
The Balance Sheet shows the value, as at the balance sheet date, of the assets and liabilities recognised by the authority. The net assets of the authority (assets less liabilities) are matched by the reserves held by the authority. Reserves are reported in two categories. The first category of reserves are usable reserves ie those reserves the authority may use to provide services, subject to the need to maintain a prudent level of reserves and any statutory limitations on their use (for example the Capital Receipts Reserve that may only be used to fund capital expenditure or repay debt). The second category of reserves is those the authority is not able to use to provide services. This category of reserves includes reserves that hold unrealised gains and losses (for example the Revaluation Reserve), where amounts would only become available to provide services if the assets are sold and reserves that hold timing differences shown in the Movement in Reserves Statement line ‘Adjustments between accounting basis and funding basis under regulations’.
Newark and Sherwood District Council 31st March 2012 31st March 2011 1st April 2010
Balance Sheet as at 31st March 2012 Note £'000 £'000 £'000
Restated Restated
Property Plant and Equipment 20 185,432 187,056 255,345
Heritage Assets 23 1,546 678 678
Investment Property 24 2,689 2,645 3,075
Intangible Assets 26 14 24 16
Assets Held for Sale 25 0 0 0
Long Term Investments 50 10 10 10
Long Term Debtors 31 3,806 4,489 164
Long Term Assets 193,497 194,902 259,288
Short Term Investments 50 6,430 2,159 2,175
Inventories 32 131 159 147
Short Term Debtors 33 8,534 10,140 7,824
Cash and Cash Equivalents 5,629 2,034 9,920
Assets Held for Sale 25 0 0 5,050
Current Assets 20,724 14,492 25,116
Bank Overdraft 0 0 0
Short Term Borrowing 50 (4,685) (7,189) (7,908)
Short Term Creditors 34 (11,156) (5,366) (7,495)
Provisions (1) 0 0
Current Liabilities (15,842) (12,555) (15,403)
Long Term Creditors 36 (1,274) (1,618) (1,535)
Long Term Borrowing 50 (97,295) (58,248) (61,775)
Other Long Term Liabilities 37 (45,448) (30,583) (54,197)
Capital Grants Receipts in Advance 38 (43) (43) (3,801)
Long Term Liabilities (144,060) (90,492) (121,308)
Net Assets 54,319 106,347 147,693
Usable Reserves 39 27,778 27,511 18,688
Unusable Reserves 39 26,541 78,836 129,005
Total Reserves 54,319 106,347 147,693

15
CASH FLOW STATEMENT
The Cash Flow Statement shows the changes in cash and cash equivalents of the authority during the reporting period. The statement shows how the authority generates and uses cash and cash equivalents by classifying cash flows as operating, investing and financing activities. The amount of net cash flows arising from operating activities is a key indicator of the extent to which the operations of the authority are funded by way of taxation and grant income or from the recipients of services provided by the authority. Investing activities represent the extent to which cash outflows have been made for resources which are intended to contribute to the authority’s future service delivery. Cash flows arising from financing activities are useful in predicting claims on future cash flows by providers of capital (ie borrowing) to the authority.
Newark and Sherwood District Council
Cash Flow Statement for 2011/2012 Note £'000 £'000 £'000 £'000
Operating Activities
Cash outflows
Cash paid to and on behalf of Employees 15,006 15,527
Other Operating Costs 79,383 41,197
Revenue Expenditure funded from Capital 804 845
Housing Benefits paid out 14,523 13,801
Contribution to Housing Pooled Receipts 183 260
Parish Precepts 2,449 2,435
Interest Paid 3,440 115,788 3,651 77,716
Cash inflows
Council Tax Income (8,753) (8,870)
Rents (7,783) (7,305)
Distributable amount of NDR from Pool (6,433) (9,018)
Revenue Support Grant (1,988) (1,309)
DWP Grants for Rebates (32,985) (30,795)
Other Government Grants (5,347) (1,725)
Cash Received for Goods and Services (19,253) (23,604)
Interest Received (118) (82,660) (204) (82,830)
Operating Activities Net Cash Flow 53 33,128 (5,114)
Investing Activities
Cash outflows
Purchase of Fixed Assets 8,050 13,275
Cash inflows
Sale of Fixed Assets (304) (6,047)
Capital Grants Received (2,856) (1,058)
Other Capital Cash Income 330 579
(2,830) (6,526)
Investing Activities Net Cash Flow 5,220 6,749
Financing Activities
Cash outflows
Repayments of Amounts Borrowed 16,356 14,889
Agency Payments (9,722) 2,031
Capital Element of Finance Lease Rentals 6 5
6,640 16,925
Cash inflows
Repayment of investments 4,271 (16)
New Loans Raised (52,854) (10,658)
(48,583) (10,674)
Financing Activities Net Cash Flow (41,943) 6,251
2011/2012 2010/2011
16
Note £'000 £'000 £'000 £'000
Operating Activities Net Cash Flow 33,128 (5,114)
Investing Activities Net Cash Flow 5,220 6,749
Financing Activities Net Cash Flow (41,943) 6,251
Net Increase/Decrease in Cash and Cash Equivalents (3,595) 7,886
Cash and Cash Equivalents at 1 April
Cash held 53 39
Bank current accounts (360) 252
Short term deposits 50 2,341 2,034 9,629 9,920
Cash and Cash Equivalents at 31 March
Cash held 41 53
Bank current accounts (117) (360)
Short term deposits 50 5,705 5,629 2,341 2,034
2011/2012 2010/2011

17
NEWARK AND SHERWOOD DISTRICT COUNCIL NOTES TO THE ACCOUNTS FOR THE FINANCIAL YEAR 2011/2012 1 Accounting Policies
1.1 General Principles The Statement of Accounts summarises the Council's transactions for the 2011/2012 financial year and its position at the year-end of 31 March 2012. It has been prepared in accordance with the Code of Practice on Local Authority Accounting in the United Kingdom 2011/12 (the Code). The accounting convention adopted is historical cost, modified firstly by the revaluation of certain categories of non current assets and secondly as regards the valuation of stocks. Accounting policies and estimation techniques have been selected and exercised, having regard to the accounting principles and concepts set out in IAS 8, specifically the qualitative characteristics of financial information:
Relevance
Reliability
Comparability
Understandibility
Materiality and pervasive accounting concepts:
Accruals
Going Concern
Primacy of legislative requirements
1.2 Accruals of Income and Expenditure
Activity is accounted for in the year that it takes place, not simply when cash payments are made or received. In particular:
Fees, charges and rents due from customers are accounted for as income at the date the Council provides the relevant goods or services.
Supplies are recorded as expenditure when they are consumed - where there is a gap between the date supplies are received and their consumption, they are carried as stocks on the Balance Sheet.
Works are charged as expenditure when they are completed, before which they are carried as works in progress on the Balance Sheet.
Interest payable on borrowings and receivable on investments is accounted for on the basis of the effective interest rate for the relevant financial instrument rather than the cash flows fixed or determined by the contract.
Where income and expenditure have been recognised but cash has not been received or paid, a debtor or creditor for the relevant amount is recorded in the Balance Sheet. Where it is doubtful that debts will be settled, the balance of debtors is written down and a charge made to revenue for the income that might not be collected.
Income and expenditure are credited and debited to the relevant service revenue account, unless they properly represent capital receipts or capital expenditure. 1.3 Prior Period Adjustments, Changes in Accounting Policies and Estimates and Errors
Prior period adjustments may arise as a result of a change in accounting policy or to correct a material error. Changes in accounting estimates are accounted for prospectively ie in the current and future years affected by the change and do not give rise to a prior period adjustment.
Changes in accounting policies are only made when required by proper accounting practices or the change provides more reliable or relevant information about the effect of transactions, other events and conditions on the Council’s financial position or financial performance. Where a change is made, it is applied retrospectively (unless stated otherwise) by adjusting opening balances and comparative amounts for the prior period as if the new policy had always been applied. FRS 30 Heritage Assets has been adopted fully for the 2011/2012 Statement of Accounts. Accounting policy 1.11 Non Current Assets included in Note 1 has been updated. A line has been added to the Balance Sheet to show the value of Heritage Assets held as at 1 April 2010 and as at 31 March 2011 as well as at 31 March 2012. Note 9 – Prior Year Restatement shows the adjusted values.
18
The preparation of IFRS accounts requires the use and calculation of estimates. It also requires management to exercise its judgement in applying the use of the Council’s accounting policies. The areas involved in a higher degree of judgement or complexity or areas where assumptions and estimates are significant to the financial statements are disclosed in the relevant sections of the financial statements. Although these estimates are based on management’s best knowledge of current events and actions they may undertake in the future, actual results may differ from these estimates.
1.4 Provisions
Provisions are made where an event has taken place that gives the Council an obligation that probably requires settlement by a transfer of economic benefits, but where the timing of the transfer is uncertain. For instance, the Council may be involved in a court case that could eventually result in the making of a settlement or the payment of compensation.
Provisions are charged to the appropriate service revenue account in the year that the authority becomes aware of the obligation, based on the best estimate of the likely settlement. When payments are eventually made, they are charged to the provision set up in the Balance Sheet. Estimated settlements are reviewed at the end of each financial year - where it becomes more likely than not that a transfer of economic benefits will not now be required (or a lower settlement than anticipated is made), the provision is reversed and credited back to the relevant service revenue account.
Where some or all of the payment required to settle a provision is expected to be met by another party (e.g. from an insurance claim), this is only recognised as income in the relevant service revenue account if it is virtually certain that reimbursement will be received if the obligation is settled. Provisions may also be created where there is some uncertainty over the Council’s entitlement to receive income. This may arise in connection with changes in the eligibility criteria of central government programmes or as a result of the interpretation of new legislation.
1.5 Reserves
The Council sets aside specific amounts as reserves for future policy purposes or to cover contingencies. Reserves are created by appropriating amounts in the Movement in Reserves Statement. When expenditure to be financed from a reserve is incurred, it is charged to the appropriate service revenue account in that year to score against the Surplus/Deficit on Continuing Operations in the Comprehensive Income and Expenditure Statement. The reserve is then appropriated back into the General Fund Balance statement so that there is no net charge against council tax for the expenditure.
Certain reserves are kept to manage the accounting processes for non current fixed assets and retirement benefits and that do not represent usable resources for the Council - these reserves are explained in the relevant policies below. Details of all reserves are shown in Note 39 Reserves.
1.6 Government and Other Grants and Contributions
Whether paid on account, by instalments or in arrears, government grants and third party contributions and donations (including donated assets), both revenue and capital, are recognised as due to the Council when there is reasonable assurance that
The Council will comply with any conditions attached to the payments
The grants or contributions will be received.
Amounts recognised as due to the Council are not credited to the Comprehensive Income and Expenditure Statement until conditions attached to the grant or contribution have been satisfied. Monies advanced as grants and contributions for which conditions have not been satisfied are carried in the Balance Sheet as creditors. When conditions are satisfied the grant or contribution is credited to the Comprehensive Income and Expenditure Account. Revenue grants are matched in service revenue accounts with the service expenditure to which they relate. Grants to cover general expenditure (e.g. Revenue Support Grant and New Homes Bonus Grant) and all capital grants and contributions are credited to Taxation and Non Specific Grant Income. Capital grants are reversed out of the General Fund Balance in the Movement in Reserves Statement.
19
1.7 Post Employment Benefits
The Council fully complies with the requirements of IAS 19, Employee Benefits and recognises the cost of retirement benefits in the revenue account when employees earn them rather than when the benefits are eventually paid as pensions.
Employees of the Council are members of the Local Government Pensions Scheme, administered by Nottinghamshire County Council (the pension fund). The scheme provides defined benefits to members (retirement lump sums and pensions), earned as employees worked for the Council.
The liabilities of the pension scheme attributable to the Council are included in the Balance Sheet on an actuarial basis using the projected unit method - i.e. an assessment of the future payments that will be made in relation to retirement benefits earned to date by employees, based on assumptions about mortality rates, employee turnover rates, etc, and projections of projected earnings for current employees.
Liabilities are discounted to their value at current prices, using a discount rate based on the indicative rate of return on high quality corporate bonds.
The assets of the pension fund attributable to the Council are included in the Balance Sheet at their fair value:
quoted securities – current bid price
unquoted securities - professional estimate
unitised securities - current bid price
property - market value.
The change in the net pensions liability is analysed into seven components:
current service cost - the increase in liabilities as a result of years of service earned this year - allocated in the Comprehensive Income and Expenditure Statement to the revenue accounts of services for which the employees worked
past service cost - the increase in liabilities arising from current year decisions whose effect relates to years of service earned in earlier years - debited to the (Surplus)/Deficit on Continuing Operations in the Comprehensive Income and Expenditure Statement as part of Non Distributed Costs
interest cost - the expected increase in the present value of liabilities during the year as they move one year closer to being paid - debited to (Surplus)/Deficit on Provision of Services in the Comprehensive Income and Expenditure Statement
expected return on assets - the annual investment return on the fund assets attributable to the Council, based on an average of the expected long-term return - credited to (Surplus)/Deficit on Provision of Services in the Comprehensive Income and Expenditure Statement
gains/losses on settlements and curtailments - the result of actions to relieve the Council of liabilities or events that reduce the expected future service or accrual of benefits of employees - debited to the (Surplus)/Deficit on Continuing Operations in the Comprehensive Income and Expenditure Statement as part of Non Distributed Costs
actuarial gains and losses - changes in the net pensions liability that arise because events have not coincided with assumptions made at the last actuarial valuation or because the actuaries have updated their assumptions - debited to Other Comprehensive Income and Expenditure in the Comprehensive Income and Expenditure Account
contributions paid to the pension fund - cash paid as employer's contributions to the pension fund.
Statutory provisions require the General Fund balance to be charged with the amount payable by the Council to the pension fund in the year, not the amount calculated according to the relevant accounting standards. In the Movement in Reserves Statement on the General Fund Balance this means that there are appropriations to and from the Pensions Reserve to remove the notional debits and credits for retirement benefits and replace them with debits for the cash paid to the pension fund and any amounts payable to the fund but unpaid at the year-end.
The Council also has restricted powers to make discretionary awards of retirement benefits in the event of early retirements. Any liabilities estimated to arise as a result of an award to any member of staff are accrued in the year of the decision to make the award and accounted for using the same policies as are applied to the Local Government Pension Scheme.
1.8 Value Added Tax
Income and expenditure excludes any amounts related to VAT, as all VAT collected is payable to HM Revenue and Customs and all VAT paid is recoverable from them.

20
1.9 Overheads and Support Services
The costs of overheads and support services are charged to those that benefit from the supply or service in accordance with the costing principles of the CIPFA Service Reporting Code of Practice 2011/2012 (SeRCOP). The total absorption costing principle is used - the full cost of overheads and support services are shared between users in proportion to the benefits received, with the exception of:
Corporate and Democratic Core - costs relating to the Council's status as a multi-functional, democratic organisation.
Non Distributed Costs - discretionary benefits awarded to employees retiring early and depreciation and impairment losses chargeable on non operational properties.
These two cost categories are defined in SeRCOP and accounted for as separate headings in the Comprehensive Income and Expenditure Statement Account, as part of Continuing Operations. The bases of allocation used for the main categories of overhead and support services are outlined below:
Service Basis of Charge Administrative Buildings Area occupied Information Communication Technology Systems operated and equipment utilised Audit Staff time Revenue Collection Services Transactions Human Resources Staff numbers Administrative Services Staff time Legal Staff time Financial Services Staff time and transactions Central printing, telephones and postages Transactions Corporate Property Services Staff time Management and Administration Staff time
1.10 Non Current Assets
Non current assets are assets that have physical substance and are held for use in the provision of services or for administrative purposes on a continuing basis.
Recognition: expenditure on the acquisition, creation or enhancement of non current assets is capitalised on an accruals basis, provided that it yields benefits to the Council and the services that it provides for more than one financial year. Expenditure that secures but does not extend the previously assessed standards of performance of an asset (e.g. repairs and maintenance) is charged to revenue as it is incurred. Expenditure under the value of £15,000 is treated as de-minimis. Measurement: assets are initially measured at cost, comprising all expenditure that is directly attributable to bringing the asset into working condition for its intended use. Assets are then carried in the Balance Sheet using the following measurement bases:
Investment properties – fair value
Infrastructure assets – are written off in full if they have no tangible value
Community Assets (including Heritage Assets) and Assets Under Construction (excluding Investment Property under construction) – measured at historical cost
Other Land and Buildings, Vehicles, Plant and Equipment and Surplus Assets – fair value or, where there is no market based evidence of fair value, depreciated historical cost
Council dwellings – fair value measured using existing use value – social housing
Assets Held for Sale – the lower of carrying amount and fair value less costs to sell
Heritage Assets – insurance cost valuation Fair Value is defined as the amount for which an asset could be exchanged between knowledgeable, willing parties in an arm’s length transaction and can be further assessed as follows:
Property Plant and Equipment – the amount that would be paid for the asset in its existing use
Investment Properties – the amount that would be paid for the asset in its highest and best use ie market value
Assets Held for Sale – the amount that would be paid for the asset in its highest and best use ie market value

21
Valuation: assets are included in the Balance Sheet at current value on the basis recommended by CIPFA and in accordance with the Appraisal and Valuation Manual issued by the Royal Institution of Chartered Surveyors (RICS). Non current assets are classified into the groupings required by the CIPFA Code of Practice on Local Authority Accounting. Assets included in the Balance Sheet at current value are revalued where there have been material changes in the value, but as a minimum every five years. Community Assets, Infrastructure Assets and Assets Under Construction are held at historical cost and are not revalued. Increases in valuations (except increases in Investment Properties) are matched by credits to the Revaluation Reserve to recognise unrealised gains. Exceptionally, gains might be credited to the Comprehensive Income and Expenditure Statement where they arise from the reversal of an impairment loss previously charged to a service revenue account. All gains on Investment Properties are charged to a service revenue account. The Revaluation Reserve contains revaluation gains recognised since 1
st April 2007 only, the date of its formal
implementation. Gains arising before that date have been consolidated into the Capital Adjustment Account. Impairment: the values of each category of assets and of material individual assets that are not being depreciated are reviewed at the end of each financial year for evidence of reductions in value. Where impairment is identified as part of this review or as a result of a valuation exercise, this is accounted for by:
Non-revalued asset – recognised in the Comprehensive Income and Expenditure Statement
Revalued asset (for both asset specific and non asset specific impairment) - recognised in the Revaluation Reserve up to the credit balance existing in respect of the asset and thereafter to the Comprehensive Income and Expenditure Statement
Investment Properties and Assets Held for Sale– all impairments are charged direct to the Comprehensive Income and Expenditure Statement
Impairment losses are not proper charges to the General Fund and any such amounts are transferred to the Capital Adjustment Account and reported in the Movement in Reserves Statement. Disposals: when an asset is disposed of or decommissioned, the value of the asset in the Balance Sheet is written off to the Comprehensive Income and Expenditure Statement as part of other operating expenditure. Receipts from disposals are credited to the Comprehensive Income and Expenditure Statement as part of other operating expenditure (i.e. netted off against the carrying value of the asset at the time of disposal). Any revaluation gains in the Revaluation Reserve are transferred to the Capital Adjustment Account. Amounts in excess of £10,000 are categorised as capital receipts. A proportion of receipts relating to housing disposals (75% for dwellings, 50% for land and other assets, net of statutory deductions and allowances) is payable to the Government. The balance of receipts is required to be credited to the Capital Receipts Reserve, and can then only be used for new capital investment or set aside to reduce the Council's underlying need to borrow (the capital financing requirement). Receipts are appropriated to the Reserve from the Movement in Reserves Statement. The written-off value of disposals is not a charge against council tax, as the cost of non current assets is fully provided for under separate arrangements for capital financing. Amounts are appropriated to the Capital Adjustment Account from the Movement in Reserves Statement. The Council has taken advantage of the ability to earmark all sales of non right to buy housing revenue account land and property for the provision of affordable housing. In this way 100% of such sales can be retained. Depreciation: depreciation is provided for on all non current assets with a determinable finite life (except for investment properties, assets held for sale and land with an unlimited useful life) by allocating the value of the asset in the Balance Sheet over the periods expected to benefit from their use.
22
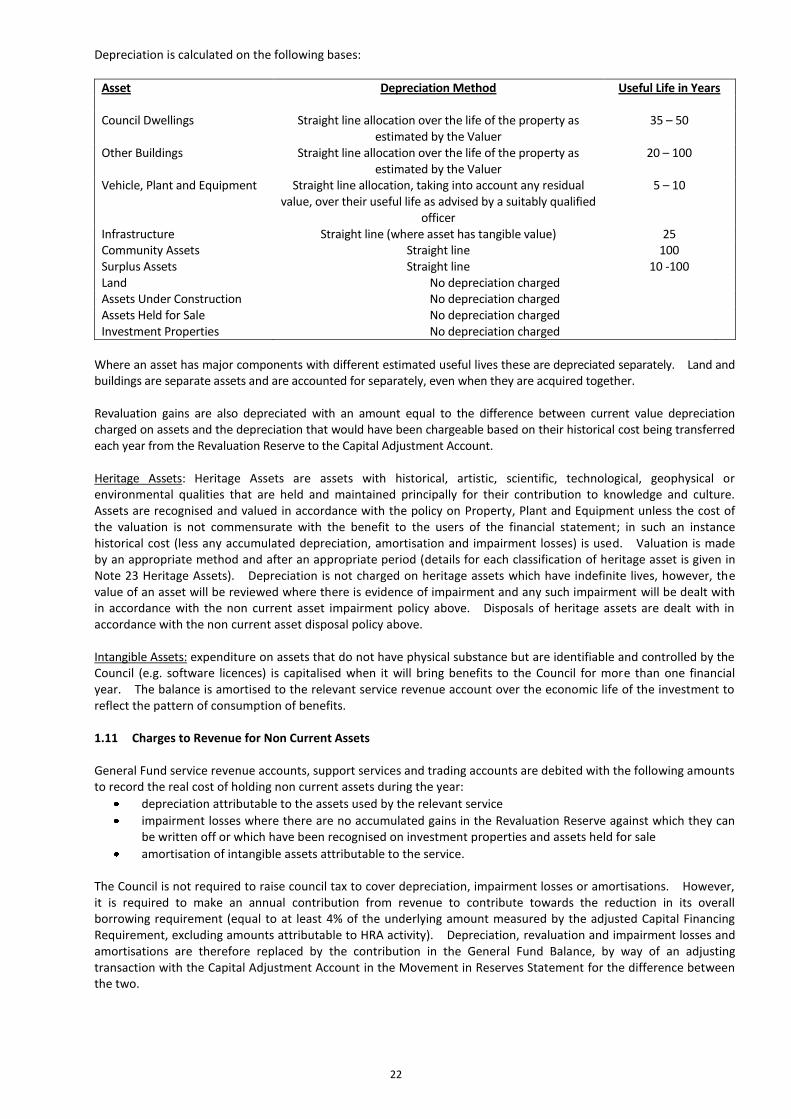
Depreciation is calculated on the following bases:
Asset Depreciation Method Useful Life in Years Council Dwellings Straight line allocation over the life of the property as
estimated by the Valuer 35 – 50
Other Buildings Straight line allocation over the life of the property as estimated by the Valuer
20 – 100
Vehicle, Plant and Equipment Straight line allocation, taking into account any residual value, over their useful life as advised by a suitably qualified
officer
5 – 10
Infrastructure Straight line (where asset has tangible value) 25 Community Assets Straight line 100 Surplus Assets Straight line 10 -100 Land No depreciation charged Assets Under Construction No depreciation charged Assets Held for Sale No depreciation charged Investment Properties No depreciation charged
Where an asset has major components with different estimated useful lives these are depreciated separately. Land and buildings are separate assets and are accounted for separately, even when they are acquired together. Revaluation gains are also depreciated with an amount equal to the difference between current value depreciation charged on assets and the depreciation that would have been chargeable based on their historical cost being transferred each year from the Revaluation Reserve to the Capital Adjustment Account. Heritage Assets: Heritage Assets are assets with historical, artistic, scientific, technological, geophysical or environmental qualities that are held and maintained principally for their contribution to knowledge and culture. Assets are recognised and valued in accordance with the policy on Property, Plant and Equipment unless the cost of the valuation is not commensurate with the benefit to the users of the financial statement; in such an instance historical cost (less any accumulated depreciation, amortisation and impairment losses) is used. Valuation is made by an appropriate method and after an appropriate period (details for each classification of heritage asset is given in Note 23 Heritage Assets). Depreciation is not charged on heritage assets which have indefinite lives, however, the value of an asset will be reviewed where there is evidence of impairment and any such impairment will be dealt with in accordance with the non current asset impairment policy above. Disposals of heritage assets are dealt with in accordance with the non current asset disposal policy above. Intangible Assets: expenditure on assets that do not have physical substance but are identifiable and controlled by the Council (e.g. software licences) is capitalised when it will bring benefits to the Council for more than one financial year. The balance is amortised to the relevant service revenue account over the economic life of the investment to reflect the pattern of consumption of benefits. 1.11 Charges to Revenue for Non Current Assets
General Fund service revenue accounts, support services and trading accounts are debited with the following amounts to record the real cost of holding non current assets during the year:
depreciation attributable to the assets used by the relevant service
impairment losses where there are no accumulated gains in the Revaluation Reserve against which they can be written off or which have been recognised on investment properties and assets held for sale
amortisation of intangible assets attributable to the service.
The Council is not required to raise council tax to cover depreciation, impairment losses or amortisations. However, it is required to make an annual contribution from revenue to contribute towards the reduction in its overall borrowing requirement (equal to at least 4% of the underlying amount measured by the adjusted Capital Financing Requirement, excluding amounts attributable to HRA activity). Depreciation, revaluation and impairment losses and amortisations are therefore replaced by the contribution in the General Fund Balance, by way of an adjusting transaction with the Capital Adjustment Account in the Movement in Reserves Statement for the difference between the two.
23
1.12 Revenue Expenditure Funded from Capital under Statute
Expenditure incurred during the year that may be capitalised under statutory provisions but does not result in the creation of non current assets has been charged as expenditure to the relevant service revenue account in the year. Where the Council has determined to meet the cost of this expenditure from existing capital resources or by borrowing, a transfer to the Capital Adjustment Account then reverses out the amounts charged in the Movement in Reserves Statement so there is no impact on the level of council tax.
1.13 Leased Assets
Finance leases. Assets acquired under finance leases are capitalised in the authority's accounts, together with the liability to pay future rentals. The Council accounts for leases as finance leases when substantially all the risks and rewards relating to the leased property transfer to the Council. Rentals payable are apportioned between
a charge for the acquisition of the interest in the property (recognised as a liability in the Balance Sheet at the start of the lease, matched with a non current asset - the liability is written down as the rent becomes payable) and
a finance charge (debited to Surplus/Deficit on Continuing Services in the Comprehensive Income and Expenditure Statement as the rent becomes payable).
Non current assets recognised under finance leases are accounted for using the policies applied generally to Non Current Assets, subject to depreciation being charged over the lease term if this is shorter than the asset’s estimated useful life.
Operating Leases. Leases that do not meet the definition of finance leases are accounted for as operating leases. Rentals payable are charged to the relevant service revenue account on a straight-line basis over the term of the lease, generally meaning that rentals are charged when they become payable.
1.14 Financial Liabilities
Financial liabilities are recognised on the Balance Sheet where the authority becomes a party to the contractual provisions of a financial instrument and are initially measured at fair value and carried at their amortised cost. Annual charges to the Comprehensive Income and Expenditure Statement for interest payable are based on the carrying amount of the liability multiplied by the effective rate of interest for the instrument. The effective annual interest rate is the rate that exactly discounts estimated future cash payments over the life of the instrument to the amount at which it was originally recognised. For most of the borrowings held by the Council this means the amount presented in the Balance Sheet is the outstanding principal repayable (plus accrued interest) and interest charged to the Comprehensive Income and Expenditure Statement is the amount payable for the year according to the loan agreement. Gains and losses on the repurchase or early settlement of borrowing are credited and debited to (Surplus)/Deficit on Provision of Services in the Comprehensive Income and Expenditure Statement in the year of repurchase/settlement. However, where repurchase has taken place as part of a restructuring of the loan portfolio that involves the modification or exchange of existing instruments, the premium or discount is respectively deducted from or added to the amortised cost of the new or modified loan and the write-down to the Comprehensive Income and Expenditure Statement is spread over the life of the loan by an adjustment to the effective interest rate. Where premiums and discounts have been charged to the Comprehensive Income and Expenditure Statement, regulations allow the impact on the General Fund Balance to be spread over future years. The Council has a policy of spreading the gain/loss over the term that was remaining on the loan against which the premium was payable or discount receivable when it was repaid. The reconciliation of amounts charged to the Comprehensive Income and Expenditure Statement to the net charge required against the General Fund Balance is managed by a transfer to or from the Financial Instruments Adjustment Account in the Movement in Reserves Statement.

24
1.15 Financial Assets Financial assets are classified into two types:
Loans and Receivables – assets that have fixed or determinable payments but are not quoted in an active market
Available for Sale assets – assets that have a quoted market price and/or do not have fixed or determinable payments. The Council does not hold any assets of this type.
Loans and Receivables: are recognised in the Balance Sheet when the authority becomes a party to the contractual provisions of a financial instrument and are initially measured at fair value and carried at their amortised cost. Annual credits to the Comprehensive Income and Expenditure Statement for interest receivable are based on the carrying amount of the asset multiplied by the effective rate of interest for the instrument. For most of the loans the Council has made this means the amount presented in the Balance Sheet is the outstanding principal receivable (plus accrued interest) and interest credited to the Comprehensive Income and Expenditure Statement is the amount receivable for the year in the loan agreement. However, the Council has made a number of loans under its Enterprise Scheme to help new businesses at less than market rates (soft loans). Where these are material a loss is recorded in the Comprehensive Income and Expenditure Statement in line with statutory guidelines. Where assets are identified as impaired because of a likelihood arising from a past event that payments due under the contract will not be made, the asset is written down and a charge made to the Comprehensive Income and Expenditure Statement. Any gains and losses that arise on the derecognition of the asset are credited/debited to the Comprehensive Income and Expenditure Statement.
Instruments entered into before 1
st April 2006: the Council does not hold any instruments of this type.
1.16 Interests in Companies and Other Entities
The Council has material interests in companies and other entities that have the nature of subsidiaries, associates and joint ventures and require it to prepare group accounts. In the Council’s own single entity accounts the interests in companies and other entities are recorded as investments i.e. at cost less any provision for losses. Newark and Sherwood Homes Ltd is a wholly owned subsidiary of the authority which manages the housing stock, owned by the Council, under an arms length arrangement and their accounts are consolidated with the authority’s in accordance with IAS 27. Mansfield Crematorium has been recognised as a joint arrangement between Mansfield District Council, Ashfield District Council and Newark and Sherwood District Council. The authority accounts directly for its part of the assets, liabilities, income, expenditure and cash flows held arising from the operations of the crematorium.
1.17 Cash Equivalents
Cash equivalents are held for the purpose of meeting short term commitments rather than for investment or other purposes. The Council classifies the following as cash equivalents:
Overdrawn balances on the Council’s bank accounts. Bank overdrafts are an integral part of the authority’s cash management and bank balances fluctuate on a regular basis from being positive to overdrawn.
Short term investments with immediate call back or instant access. Any short term investment which is for a fixed term, regardless of the remaining length of that term, is accounted for as a financial instrument. Interest follows the related investment.
25
2 Accounting Standards that have been issued but not yet adopted
Amendments have been made to IFRS 7 Financial Instruments Disclosures (transfers of financial assets) which will need to be adopted fully by the Council in the 2012/2013 statements. These changes will require that disclosures are made for all transferred financial assets existing at the reporting date. A transfer of a financial asset is deemed to have taken place when either of the following occurs:
The Council transfers the contractual rights to receive the cash flows of that financial asset or
The Council retains the contractual rights to receive the cash flows of that financial asset but assumes a contractual obligation to pay the cash flows to one or more recipients in an arrangement.
The Council has made no such transfers during the 2011/2012 financial year and has no plans to make any transfers during 2012/2013. If this is still the case at 31 March 2013 no disclosures will be required in the 2012/2013 Statement of Accounts.
3 Critical Judgements in applying Accounting Policies
In applying the accounting policies set out in Note 1, the Council has had to make certain judgements about complex transactions or those involving uncertainty about future events. The critical judgements made in the Statement of Accounts are:
The authority has a deposit with the Icelandic Bank, Glitnir, which defaulted on its obligations in October 2008. A decision by the courts has confirmed the authority as a preferred creditor, however, the full deposit has not yet been repaid and the authority is exposed to exchange rate risk as a result.
The authority is a trustee of Southwell Leisure Centre Trust which operates the leisure centre at Southwell. It has been determined that the authority does not have control of the Trust and it is not a subsidiary of the authority.
4 Assumptions made about the Future and Other Major Sources of Estimation Uncertainty
The Statement of Accounts contains estimated figures that are based on assumptions made by the authority about the future or that are otherwise uncertain. Estimates are made taking into account historical experience, current trends and other relevant factors. However, because balances cannot be determined with certainty, actual results could be materially different from the assumptions and estimates. Where a component part of a non current asset has been replaced or restored, the carrying amount of the old component has been derecognised to avoid double counting and the new component reflected in the carrying amount. The cost of the new component part has been used to determine the amount to be derecognised. The items in the Council’s Balance Sheet for which there may be a significant risk of material adjustment in the forthcoming financial year are as follows:
Property, Plant and Equipment – assets are depreciated over useful lives that are dependent on assumptions made about the level of repairs and maintenance that will be incurred in relation to individual assets. The current economic climate makes it uncertain if the authority will be able to sustain its current spending on repairs and maintenance, bringing into doubt the useful lives assigned to assets. If the useful life is reduced depreciation increases and the carrying amount of the asset falls.
Pensions Liability – estimation of the net liability to pay pensions depends on a number of complex judgements relating to the discount rate used, the rate at which salaries are projected to increase, changes in retirement ages, mortality rates and expected returns on pension fund assets. A firm of consulting actuaries is engaged to provide the authority with expert advice about the assumptions to be applied. The effects on the net pension liability of changes in individual assumptions can be measured, however, the assumptions interact in complex ways.
Doubtful Debt Provision – will need to be increased due to the introduction of the Council Tax Support Scheme and restrictions in Local Housing Allowance.
5 Material Items of Income and Expenditure
Disclosed separately as an expenditure item on the Comprehensive Income and Expenditure Statement for 2011/2012 is the Housing Revenue Account Self Financing Charge. The charge of £36,078k relates to the loan taken out by the authority to buy itself out of the Government’s housing subsidy system. Items disclosed separately for 2010/2011 were £73,857k impairment of Council housing due to a change in the social housing factor which identifies the economic cost of providing housing at less than market rents and £7,670k pension charge following the change in uprating from the Retail Price Index to the Consumer Price Index.

26
During 2011/2012 the following material transactions, which are not disclosed separately in the Comprehensive Income and Expenditure Statement, took place:
Completion of 26 new council houses at a cost of £1,215,520
Installation of Photo Voltaic (PV) units on houses throughout the district at cost of £2,351,000 6 Material Interest in Joint Bodies The Council appoints six of the nine Trustees of the Southwell Leisure Centre Trust and provides grant aid which for
2011/2012 was £232,712 (2010/2011 £191,420). The Trust is administered in accordance with the Scheme of Administration established 24th October 1974 as amended by the Charity Commissioners on the 29
th December
1983. The object of the Trust is to establish and maintain leisure facilities for the inhabitants of Southwell and district and to achieve a breakeven position on operations.
The Council has a joint interest in Mansfield Crematorium. The annual net surplus from the running of the
crematorium amounts to £35,000 (2010/2011 £16,000) and is included within the net cost of Environmental and Regulatory Services. The Council also includes its share of the assets and liabilities of the crematorium in its Balance Sheet.
The transactions are summarised below:
Mansfield Crematorium 2011/2012 2010/2011
£'000 £'000
Comprehensive Income and Expenditure Statement
Gross Expenditure 89 90
Gross Income (123) (105)
Net Cost of Service (34) (15)
Financing and Investment Income and Expenditure (1) (1)
(Surplus)/Deficit on Provision of Services (35) (16)
Mansfield Crematorium 2011/2012 2010/20111
£'000 £'000
Balance Sheet
Property Plant and Equipment 213 178
Investments 45 252
Debtors 20 67
Cash and Cash Equivalents 116 77
Creditors (14) (17)
Provisions (1) 0
Net Assets 379 557
Usable Reserves 166 379
Unusable Reserves 213 178
379 557
7 Authorisation of Accounts
The Statement of Accounts was issued and authorised by David Dickinson, CPFA, BA, Director of Resources, on 27th June 2012.
8 Trust Funds The Council acts as sole trustee for two Trusts;
The W.E. Knight Trust A permanently endowed charity established by an indenture dated 6 January 1920 as varied by a conveyance of 6 July 1933 by the Trustees to the Mayor, Aldermen and Burgesses of the Borough of Newark-on-Trent. Separate accounts for this Charity have been maintained since 1 April 1984. Up to that date the costs of maintenance and repair and any income received had been included in the accounts of the Borough and District Councils. The Administration and Finance Committee acting as Trustees resolved at their meeting on the 5 April 1993 and subsequently at their meeting on 14 April 1997 that all accrued income and all income received from the 1 April
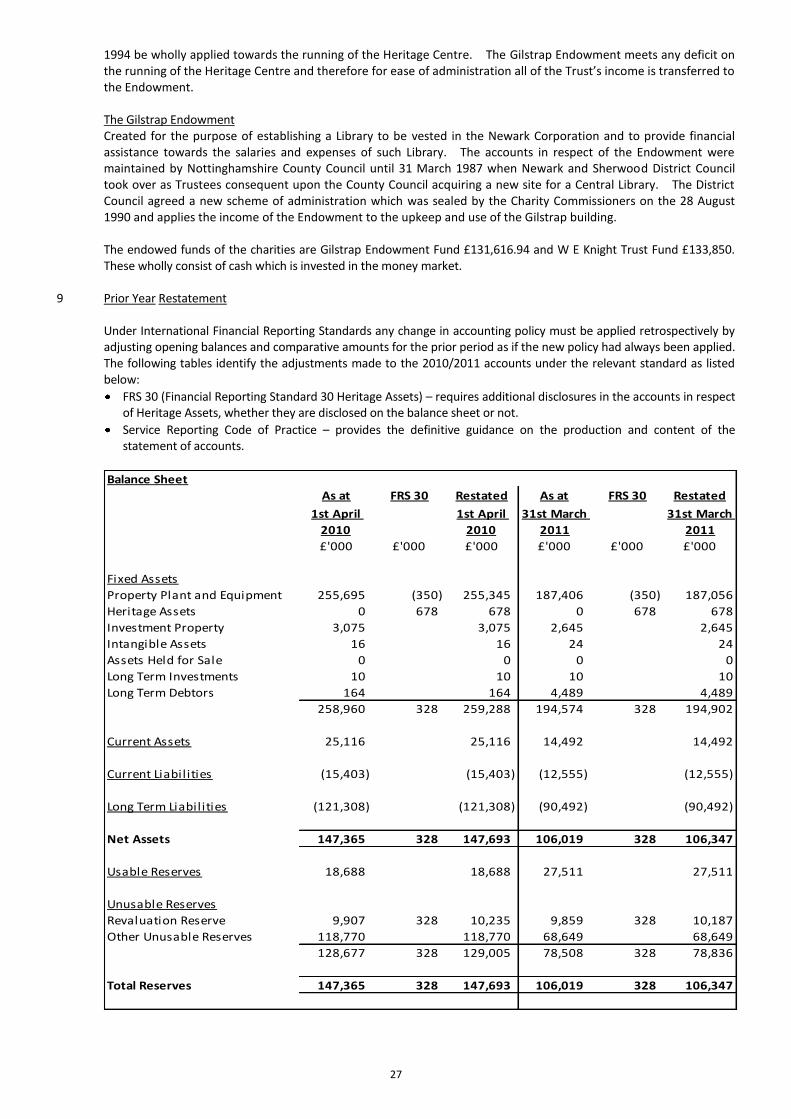
27
1994 be wholly applied towards the running of the Heritage Centre. The Gilstrap Endowment meets any deficit on the running of the Heritage Centre and therefore for ease of administration all of the Trust’s income is transferred to the Endowment.
The Gilstrap Endowment Created for the purpose of establishing a Library to be vested in the Newark Corporation and to provide financial assistance towards the salaries and expenses of such Library. The accounts in respect of the Endowment were maintained by Nottinghamshire County Council until 31 March 1987 when Newark and Sherwood District Council took over as Trustees consequent upon the County Council acquiring a new site for a Central Library. The District Council agreed a new scheme of administration which was sealed by the Charity Commissioners on the 28 August 1990 and applies the income of the Endowment to the upkeep and use of the Gilstrap building.
The endowed funds of the charities are Gilstrap Endowment Fund £131,616.94 and W E Knight Trust Fund £133,850.
These wholly consist of cash which is invested in the money market. 9 Prior Year Restatement
Under International Financial Reporting Standards any change in accounting policy must be applied retrospectively by adjusting opening balances and comparative amounts for the prior period as if the new policy had always been applied. The following tables identify the adjustments made to the 2010/2011 accounts under the relevant standard as listed below:
FRS 30 (Financial Reporting Standard 30 Heritage Assets) – requires additional disclosures in the accounts in respect of Heritage Assets, whether they are disclosed on the balance sheet or not.
Service Reporting Code of Practice – provides the definitive guidance on the production and content of the statement of accounts.
Balance Sheet
As at FRS 30 Restated As at FRS 30 Restated
1st April
2010
1st April
2010
31st March
2011
31st March
2011
£'000 £'000 £'000 £'000 £'000 £'000
Fixed Assets
Property Plant and Equipment 255,695 (350) 255,345 187,406 (350) 187,056
Heritage Assets 0 678 678 0 678 678
Investment Property 3,075 3,075 2,645 2,645
Intangible Assets 16 16 24 24
Assets Held for Sale 0 0 0 0
Long Term Investments 10 10 10 10
Long Term Debtors 164 164 4,489 4,489
258,960 328 259,288 194,574 328 194,902
Current Assets 25,116 25,116 14,492 14,492
Current Liabilities (15,403) (15,403) (12,555) (12,555)
Long Term Liabilities (121,308) (121,308) (90,492) (90,492)
Net Assets 147,365 328 147,693 106,019 328 106,347
Usable Reserves 18,688 18,688 27,511 27,511
Unusable Reserves
Revaluation Reserve 9,907 328 10,235 9,859 328 10,187
Other Unusable Reserves 118,770 118,770 68,649 68,649
128,677 328 129,005 78,508 328 78,836
Total Reserves 147,365 328 147,693 106,019 328 106,347
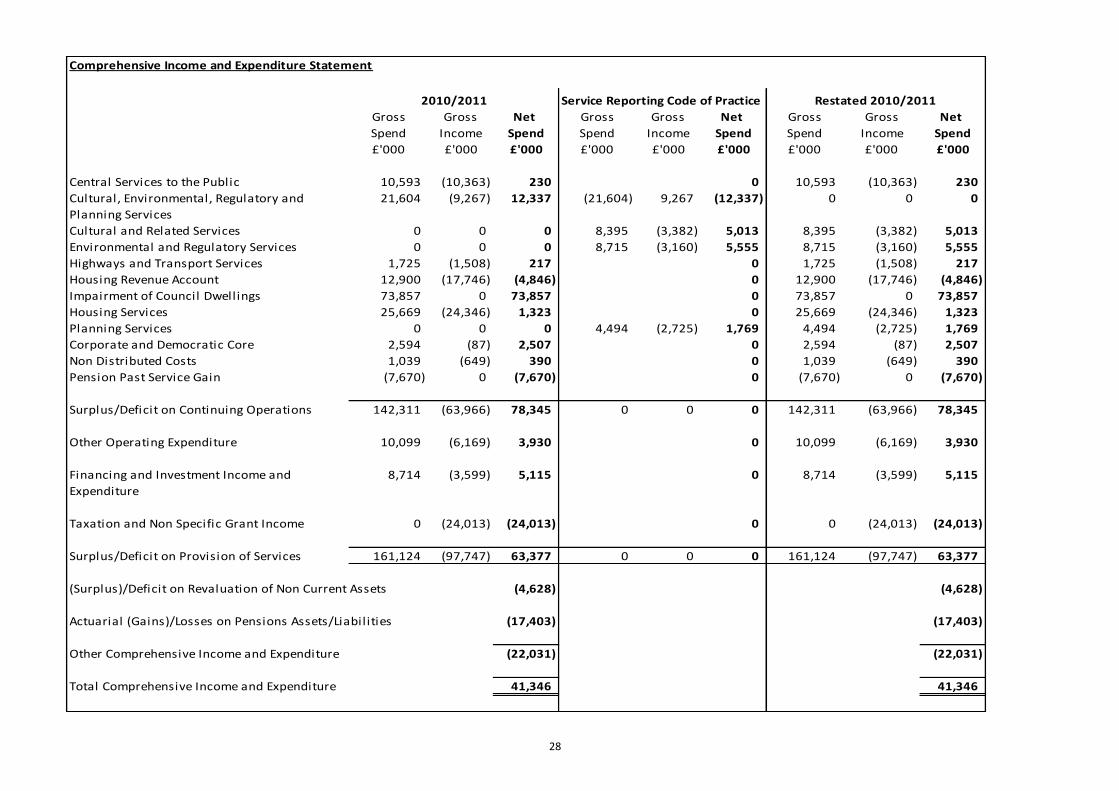
28
Comprehensive Income and Expenditure Statement
Service Reporting Code of Practice
Gross Gross Net Gross Gross Net Gross Gross Net
Spend Income Spend Spend Income Spend Spend Income Spend
£'000 £'000 £'000 £'000 £'000 £'000 £'000 £'000 £'000
Central Services to the Public 10,593 (10,363) 230 0 10,593 (10,363) 230
Cultural, Environmental, Regulatory and
Planning Services
21,604 (9,267) 12,337 (21,604) 9,267 (12,337) 0 0 0
Cultural and Related Services 0 0 0 8,395 (3,382) 5,013 8,395 (3,382) 5,013
Environmental and Regulatory Services 0 0 0 8,715 (3,160) 5,555 8,715 (3,160) 5,555
Highways and Transport Services 1,725 (1,508) 217 0 1,725 (1,508) 217
Housing Revenue Account 12,900 (17,746) (4,846) 0 12,900 (17,746) (4,846)
Impairment of Council Dwellings 73,857 0 73,857 0 73,857 0 73,857
Housing Services 25,669 (24,346) 1,323 0 25,669 (24,346) 1,323
Planning Services 0 0 0 4,494 (2,725) 1,769 4,494 (2,725) 1,769
Corporate and Democratic Core 2,594 (87) 2,507 0 2,594 (87) 2,507
Non Distributed Costs 1,039 (649) 390 0 1,039 (649) 390
Pension Past Service Gain (7,670) 0 (7,670) 0 (7,670) 0 (7,670)
Surplus/Deficit on Continuing Operations 142,311 (63,966) 78,345 0 0 0 142,311 (63,966) 78,345
Other Operating Expenditure 10,099 (6,169) 3,930 0 10,099 (6,169) 3,930
Financing and Investment Income and
Expenditure
8,714 (3,599) 5,115 0 8,714 (3,599) 5,115
Taxation and Non Specific Grant Income 0 (24,013) (24,013) 0 0 (24,013) (24,013)
Surplus/Deficit on Provision of Services 161,124 (97,747) 63,377 0 0 0 161,124 (97,747) 63,377
(Surplus)/Deficit on Revaluation of Non Current Assets (4,628) (4,628)
Actuarial (Gains)/Losses on Pensions Assets/Liabilities (17,403) (17,403)
Other Comprehensive Income and Expenditure (22,031) (22,031)
Total Comprehensive Income and Expenditure 41,346 41,346
2010/2011 Restated 2010/2011
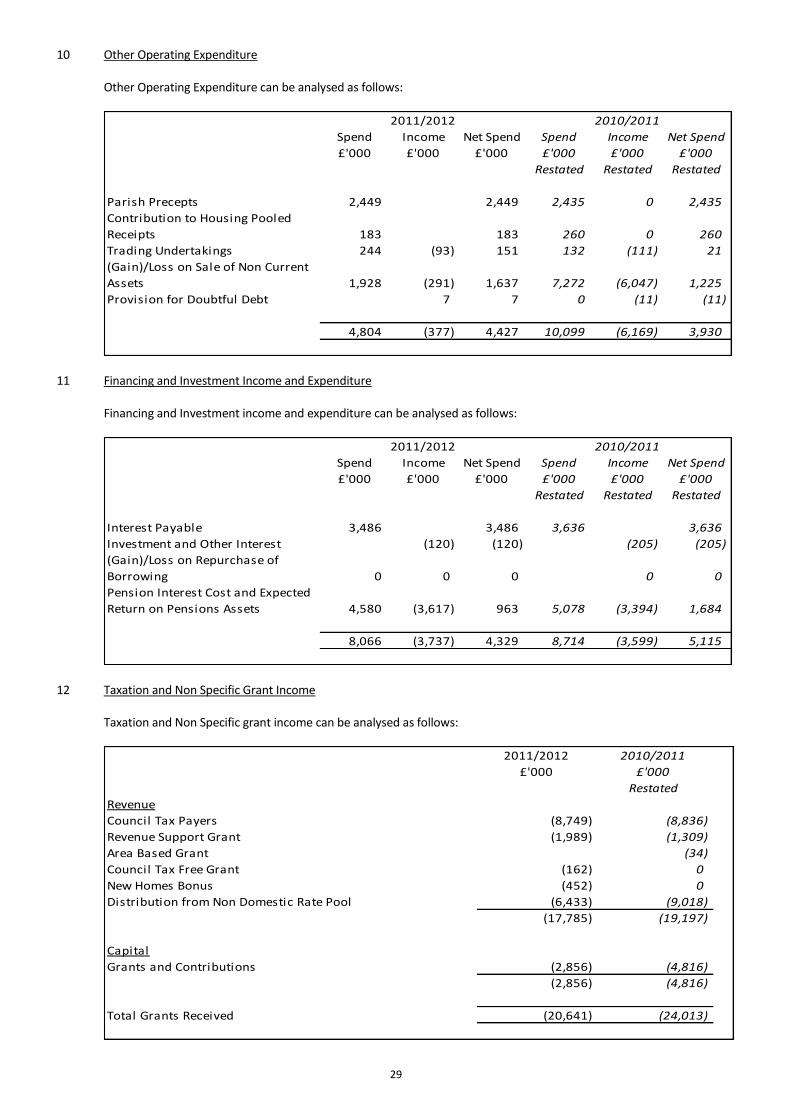
29
10 Other Operating Expenditure Other Operating Expenditure can be analysed as follows:
Spend Income Net Spend Spend Income Net Spend
£'000 £'000 £'000 £'000 £'000 £'000
Restated Restated Restated
Parish Precepts 2,449 2,449 2,435 0 2,435
Contribution to Housing Pooled
Receipts 183 183 260 0 260
Trading Undertakings 244 (93) 151 132 (111) 21
(Gain)/Loss on Sale of Non Current
Assets 1,928 (291) 1,637 7,272 (6,047) 1,225
Provision for Doubtful Debt 7 7 0 (11) (11)
4,804 (377) 4,427 10,099 (6,169) 3,930
2011/2012 2010/2011
11 Financing and Investment Income and Expenditure Financing and Investment income and expenditure can be analysed as follows:
Spend Income Net Spend Spend Income Net Spend
£'000 £'000 £'000 £'000 £'000 £'000
Restated Restated Restated
Interest Payable 3,486 3,486 3,636 3,636
Investment and Other Interest (120) (120) (205) (205)
(Gain)/Loss on Repurchase of
Borrowing 0 0 0 0 0
Pension Interest Cost and Expected
Return on Pensions Assets 4,580 (3,617) 963 5,078 (3,394) 1,684
8,066 (3,737) 4,329 8,714 (3,599) 5,115
2011/2012 2010/2011
12 Taxation and Non Specific Grant Income Taxation and Non Specific grant income can be analysed as follows:
2011/2012 2010/2011
£'000 £'000
Restated
Revenue
Council Tax Payers (8,749) (8,836)
Revenue Support Grant (1,989) (1,309)
Area Based Grant (34)
Council Tax Free Grant (162) 0
New Homes Bonus (452) 0
Distribution from Non Domestic Rate Pool (6,433) (9,018)
(17,785) (19,197)
Capital
Grants and Contributions (2,856) (4,816)
(2,856) (4,816)
Total Grants Received (20,641) (24,013)

30
13 Service Information
The Council’s internal performance management reports are based on the portfolios held by each member of the Cabinet. These portfolios are reported to Overview and Scrutiny Committees on a quarterly basis. The Council’s actual year end figures, as reported in this management format, are disclosed below.
2011/2012 Strategic and Safe and Culture and Sustainable Clean Health Housing Total
Corporate Policy Strong Leisure Development and and Green and Homes Revenue
Regeneration Account
£'000 £'000 £'000 £'000 £'000 £'000 £'000 £'000
Employees 5,452 551 2,351 1,869 3,279 939 287 14,728
Premises 83 36 911 285 228 740 1 2,284
Transport 47 10 11 33 1,259 203 1,563
Supplies and Services 2,278 715 1,508 1,138 866 1,821 8,159 16,485
Transfer Payments 33,228 89 3,554 36,871
Total Expenditure 41,088 1,312 4,781 3,325 5,632 3,792 12,001 71,931
Income (36,039) (747) (3,108) (2,251) (1,731) (3,576) (19,626) (67,078)
Total Income (36,039) (747) (3,108) (2,251) (1,731) (3,576) (19,626) (67,078)
Net Expenditure 5,049 565 1,673 1,074 3,901 216 (7,625) 4,853
Memorandum Items
Support Services 3,034 447 1,466 1,184 1,549 929 310 8,919
Capital Charges 130 3 6,731 6,864
Internal Recharges (4,857) (317) (808) (616) (700) (1,304) (8,602)
3,356 695 2,331 1,642 4,750 (156) (584) 12,034
Reconciliation to (Surplus)/Deficit on Continuing Operations
Add amounts not reported to management 39,330
Remove amounts included on management report but excluded from Continuing Operations (150)
(Surplus)/Deficit on Continuing Operations in Comprehensive Income and Expenditure Statement 51,214
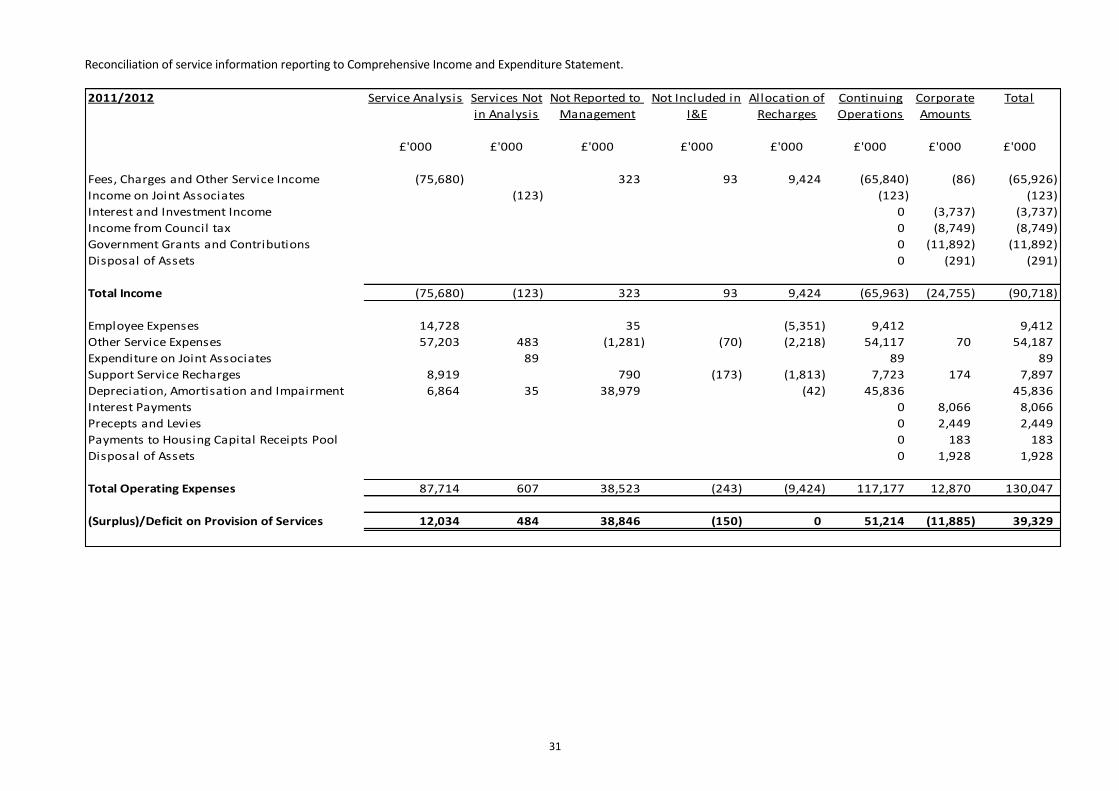
31
Reconciliation of service information reporting to Comprehensive Income and Expenditure Statement.
2011/2012 Service Analysis Services Not Not Reported to Not Included in Allocation of Continuing Corporate Total
in Analysis Management I&E Recharges Operations Amounts
£'000 £'000 £'000 £'000 £'000 £'000 £'000 £'000
Fees, Charges and Other Service Income (75,680) 323 93 9,424 (65,840) (86) (65,926)
Income on Joint Associates (123) (123) (123)
Interest and Investment Income 0 (3,737) (3,737)
Income from Council tax 0 (8,749) (8,749)
Government Grants and Contributions 0 (11,892) (11,892)
Disposal of Assets 0 (291) (291)
Total Income (75,680) (123) 323 93 9,424 (65,963) (24,755) (90,718)
Employee Expenses 14,728 35 (5,351) 9,412 9,412
Other Service Expenses 57,203 483 (1,281) (70) (2,218) 54,117 70 54,187
Expenditure on Joint Associates 89 89 89
Support Service Recharges 8,919 790 (173) (1,813) 7,723 174 7,897
Depreciation, Amortisation and Impairment 6,864 35 38,979 (42) 45,836 45,836
Interest Payments 0 8,066 8,066
Precepts and Levies 0 2,449 2,449
Payments to Housing Capital Receipts Pool 0 183 183
Disposal of Assets 0 1,928 1,928
Total Operating Expenses 87,714 607 38,523 (243) (9,424) 117,177 12,870 130,047
(Surplus)/Deficit on Provision of Services 12,034 484 38,846 (150) 0 51,214 (11,885) 39,329

32
2010/2011 Strategic and Safe and Culture and Sustainable Clean Health Housing Total
Corporate Policy Strong Leisure Development and and Green and Homes Revenue
Regeneration Account
£'000 £'000 £'000 £'000 £'000 £'000 £'000 £'000
Employees (2,623) 622 2,785 2,307 3,368 997 7,456
Premises 157 8 836 350 215 835 2,401
Transport 68 16 22 66 1,256 202 1,630
Supplies and Services 3,418 857 1,390 969 1,030 997 10,222 18,883
Transfer Payments 31,705 41 31,746
Total Expenditure 32,725 1,503 5,033 3,692 5,869 3,072 10,222 62,116
Income (35,328) (1,304) (3,154) (2,262) (1,539) (2,454) (17,746) (63,787)
Total Income (35,328) (1,304) (3,154) (2,262) (1,539) (2,454) (17,746) (63,787)
Net Expenditure (2,603) 199 1,879 1,430 4,330 618 (7,524) (1,671)
Memorandum Items
Support Services 3,208 363 1,304 1,161 1,533 1,067 297 8,933
Capital Charges 144 275 102 1,365 1,041 77,650 80,577
749 562 3,458 2,693 7,228 2,726 70,423 87,839
Reconciliation to (Surplus)/Deficit on Continuing Operations
Add amounts not reported to management (9,473)
Remove amounts included on management report but excluded from Continuing Operations (21)
(Surplus)/Deficit on Continuing Operations in Comprehensive Income and Expenditure Statement 78,345

33
Reconciliation of service information reporting to Comprehensive Income and Expenditure Statement.
2010/2011 Service Analysis Services Not Not Reported to Not Included in Allocation of Continuing Corporate Total
in Analysis Management I&E Recharges Operations Amounts
£'000 £'000 £'000 £'000 £'000 £'000 £'000 £'000
Fees, Charges and Other Service Income (63,787) (9,436) 111 9,251 (63,861) (122) (63,983)
Income on Joint Associates (105) (105) (1) (106)
Interest and Investment Income 0 (3,598) (3,598)
Income from Council tax 0 (8,836) (8,836)
Government Grants and Contributions 0 (15,177) (15,177)
Disposal of Assets 0 (6,047) (6,047)
Total Income (63,787) (105) (9,436) 111 9,251 (63,966) (33,781) (97,747)
Employee Expenses 7,456 38 (5,275) 2,219 2,219
Other Service Expenses 54,660 483 712 (80) (2,322) 53,453 80 53,533
Expenditure on Joint Associates 90 90 90
Support Service Recharges 8,933 (52) (1,613) 7,268 52 7,320
Depreciation, Amortisation and Impairment 80,577 135 (41) 80,671 80,671
Interest Payments 0 8,714 8,714
Precepts and Levies 0 2,435 2,435
Payments to Housing Capital Receipts Pool 0 260 260
Disposal of Assets (1,390) (1,390) 7,272 5,882
Total Operating Expenses 151,626 573 (505) (132) (9,251) 142,311 18,813 161,124
(Surplus)/Deficit on Provision of Services 87,839 468 (9,941) (21) 0 78,345 (14,968) 63,377

34
14 Trading Operations
The Council undertakes a small number of Trading Operations. Any forecast surplus of deficit as a result of these services is included in the Council’s annual budget and within Continuing Operations in the Comprehensive Income and Expenditure Statement where appropriate. Catering Services is shown within Other Operating Expenditure as a Trading Undertaking.
2011/2012 2011/2012 2011/2012 2010/2011
Expenditure Income (Surplus)/Deficit (Surplus)/Deficit
£'000 £'000 £'000 £'000
Industrial Estates 1,069 (924) 145 (62)
Palace Theatre 1,088 (750) 338 526
Building Control 197 (222) (25) 27
Car Parks 449 (1,129) (680) (701)
Catering 244 (93) 151 21
3,047 (3,118) (71) (189)
Industrial Estates – provision of units in industrial estates in various parts of the district. Palace Theatre – provision of performing arts facilities. Building Control – operation of statutory building control service. Catering – provision of catering services for internal and external functions at Kelham Hall. Car Parks - the Council is a member of the Nottinghamshire Parking Partnership which administers all on street and off street parking fines for the county. Included in the income figure above is the sum of £23k in respect of off street parking fine income owed to the Council by the Partnership as detailed below.
Gross Expenditure Gross Income Net Income £’000 £’000 £’000 Off Street Parking – amount due to Newark and Sherwood
307 (330) (23)
On Street Parking – retained by Partnership to fund future highways expenditure
562 (636) (74)
Total 869 (966) (97)
15 Members Allowances Total allowances paid in 2011/2012 were £267,415 (2010/2011 £279,882) made up of Special Responsibility Payments
£78,133 (2010/2011 £90,500), Basic Allowances £168,745 (2010/2011 £168,766) and £20,537 Travel and Subsistence payments (2010/2011 £20,616).
16 Officials’ Emoluments The number of exit packages with total cost per band and total cost of the compulsory and other redundancies are set
out in the table below.
Exit Package
Cost Band
2011/12 2010/11 2011/12 2010/11 2011/12 2010/11 2011/12 2010/11
£'000 £'000
£0 to £20,000 30 6 30 6 343 302
£20,001 to £40,000 7 7 0 196
£40,001 to £60,000 4 4 0 196
£60,001 to £80,000 1 1 0 62
£80,001 to £150,000 0 0
£150,000 plus 1 1 0 158
Total 0 0 43 6 43 6 955 302
Total Cost of
Exit Packages
No of Compulsory
Redundancies
No of Other Agreed
Departures
Total No of
Exit Packages

35
Amounts payable to senior employees in 2011/2012 are disclosed below. These employees have been included in the
disclosure table shown below.
2011/2012 2010/2011
£ £
Chief Executive
Salary 113,490.00 113,490.00
Expenses, Allowances and Other Benefits 1,295.02 2,329.45
Employer's Contribution to Pension 24,854.28 24,854.28
% Employee's Contribution to Pension 7.5% 7.5%
Strategic Director for Communities
(Left April 2011)
Salary 8,079.16 91,271.15
Expenses, Allowances and Other Benefits 194.34 1,494.50
Employer's Contribution to Pension 1,769.34 19,988.37
% Employee's Contribution to Pension 7.5% 7.5%
Deputy Chief Executive
Salary 92,144.79 91,271.15
Expenses, Allowances and Other Benefits 757.06 1,585.96
Employer's Contribution to Pension 20,179.71 19,988.37
% Employee's Contribution to Pension 7.5% 7.5%
Director of Resources
Salary 72,822.00 72,012.00
Expenses, Allowances and Other Benefits 882.65 1,071.93
Employer's Contribution to Pension 15,948.02 15,770.64
% Employee's Contribution to Pension 7.2% 7.2%
Director of Safety
Salary 70,189.50 69,784.50
Expenses, Allowances and Other Benefits 829.00 1,210.13
Employer's Contribution to Pension 15,371.47 15,282.78
% Employee's Contribution to Pension 7.2% 7.2%
Director of Community
Salary 67,557.00 67,557.00
Expenses, Allowances and Other Benefits 1,459.00 2,142.52
Employer's Contribution to Pension 14,795.04 14,795.04
% Employee's Contribution to Pension 7.2% 7.2%
Director of Customers
Salary 67,557.00 65,523.00
Expenses, Allowances and Other Benefits 786.95 1,549.47
Employer's Contribution to Pension 14,795.04 14,349.48
% Employee's Contribution to Pension 7.2% 7.2%
Director of Growth
Salary 67,557.00 62,510.40
Expenses, Allowances and Other Benefits 385.32 689.15
Employer's Contribution to Pension 14,795.04 13,689.79
% Employee's Contribution to Pension 7.2% 7.2%

36
The number of employees whose remuneration, excluding pension contributions, was £50,000 or more in bands of £5,000 were:-
Number of Employees Included Number of
Employees in 2011/2012 Employees
2011/2012 leaving in same year 2010/2011
£50,000 to £54,999 0 0 0
£55,000 to £59,999 1 1 0
£60,000 to £64,999 0 0 2
£65,000 to £69,999 3 0 2
£70,000 to £74,999 2 0 2
£75,000 to £79,999 0 0 0
£80,000 to £84,999 0 0 0
£85,000 to £89,999 0 0 0
£90,000 to £94,999 1 0 2
£95,000 to £99,999 0 0 0
£100,000 to £104,999 0 0 0
£105,000 to £109,999 0 0 0
£110,000 to £114,999 1 0 0
£115,000 to £119,999 0 0 1
8 1 9
17 Related Party Transactions The Authority is required to disclose material transactions with related parties – bodies or individuals that have the
potential to control or influence the council or to be controlled or influenced by the council. Disclosure of these transactions allows an assessment of the extent to which the council might have been constrained in its ability to operate independently or might have secured the ability to limit another party’s ability to bargain freely with the Authority.
Most transactions with related parties are disclosed elsewhere in the Statement of Accounts as follows:
Party Disclosure Page
Central Government has effective control over the general operations of the Authority – it is responsible for providing the statutory framework within which the Authority operates, provides the majority of its funding in the form of grants and prescribes the terms of many of the transactions the Authority has with other parties.
Comprehensive Income and Expenditure Statement
Cash Flow Statement
13
15-16
Members of the council have direct control over the council’s financial and operating policies.
Note 15 Members Allowances
Statutory Register of Interests
34
Precepts from other Local Authorities Collection Fund Accounts 75-76
Newark and Sherwood Hones Ltd is a wholly owned subsidiary of the authority
Group Accounts 77-91
The authority has joint control of Mansfield Crematorium
Note 6 Material Interests in Joint Bodies. 26
The authority appoints the majority of trustees of the Southwell Leisure Centre Trust.
Note 6 Material Interests in Joint Bodies. 26
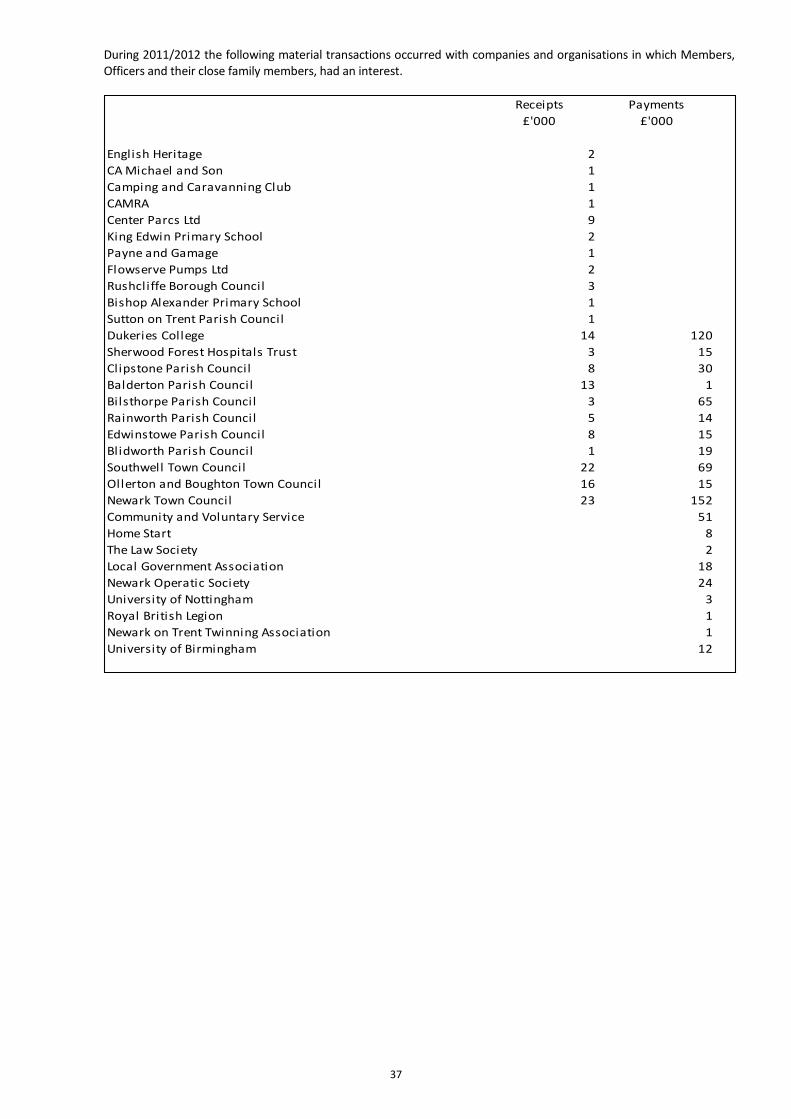
37
During 2011/2012 the following material transactions occurred with companies and organisations in which Members, Officers and their close family members, had an interest.
Receipts Payments
£'000 £'000
English Heritage 2
CA Michael and Son 1
Camping and Caravanning Club 1
CAMRA 1
Center Parcs Ltd 9
King Edwin Primary School 2
Payne and Gamage 1
Flowserve Pumps Ltd 2
Rushcliffe Borough Council 3
Bishop Alexander Primary School 1
Sutton on Trent Parish Council 1
Dukeries College 14 120
Sherwood Forest Hospitals Trust 3 15
Clipstone Parish Council 8 30
Balderton Parish Council 13 1
Bilsthorpe Parish Council 3 65
Rainworth Parish Council 5 14
Edwinstowe Parish Council 8 15
Blidworth Parish Council 1 19
Southwell Town Council 22 69
Ollerton and Boughton Town Council 16 15
Newark Town Council 23 152
Community and Voluntary Service 51
Home Start 8
The Law Society 2
Local Government Association 18
Newark Operatic Society 24
University of Nottingham 3
Royal British Legion 1
Newark on Trent Twinning Association 1
University of Birmingham 12

38
18 Grant Income The Council credited the following grants and contributions to the Comprehensive Income and Expenditure Statement.
2011/2012 2010/2011
£'000 £'000
Credited to Taxation and Non Specific Grant Income
Revenue Support Grant (1,989) (1,309)
Area Based Grant 0 (34)
New Homes Bonus Grant (452) 0
Council Tax Freeze Grant (162) 0
Section 106 (456) (259)
Other Third Parties (1,020) (1,292)
Nottinghamshire County Council Contributions (8) (23)
Lottery Funding (77) (366)
Waste Infrastructure 0 (31)
Growth Point 0 (656)
New Council House Build (605) (1,497)
Private Sector Disabled Facilities (399) (329)
Private Sector Essential Works Allowance (221) (363)
Othe Government Grants (70) 0
(5,459) (6,159)
Credited to Services
Growth Incentive 0 (205)
Housing Benefits Subsidy (24,881) (23,327)
Council Tax Benefits Subsidy (8,249) (8,270)
Personnel section (1) (4)
Council Tax Benefits Grant (156) (156)
Housing Benefits Grant (738) (783)
Land Charges 0 (34)
Finance (12) (79)
Leisure Grants (10) (59)
Museums Management (154) (12)
Staying Put 0 (29)
Primary Care Trust (46) (16)
Planning Development Grants 0 (31)
Concessionary Fares 0 (293)
Other Housing Grants (134) (64)
(34,381) (33,362)
The Council has received a number of grants and contributions that have yet to be recognised as income as they have
conditions attached to them that could require the monies or property to be returned to the giver. Details of these are included in Note 38 Capital Receipts in Advance.
19 Audit Fees In 2011/2012 Newark and Sherwood District Council incurred the following fees relating to external audit and
inspection:
2011/2012 2010/2011
£ £
Fees Payable to the Audit Commission in respect of:
External Audit Services 97,440 109,533
Statutory Inspection 0 0
Certification of Grant Claims 24,783 22,739
Other Services 1,150 1,150
123,373 133,422
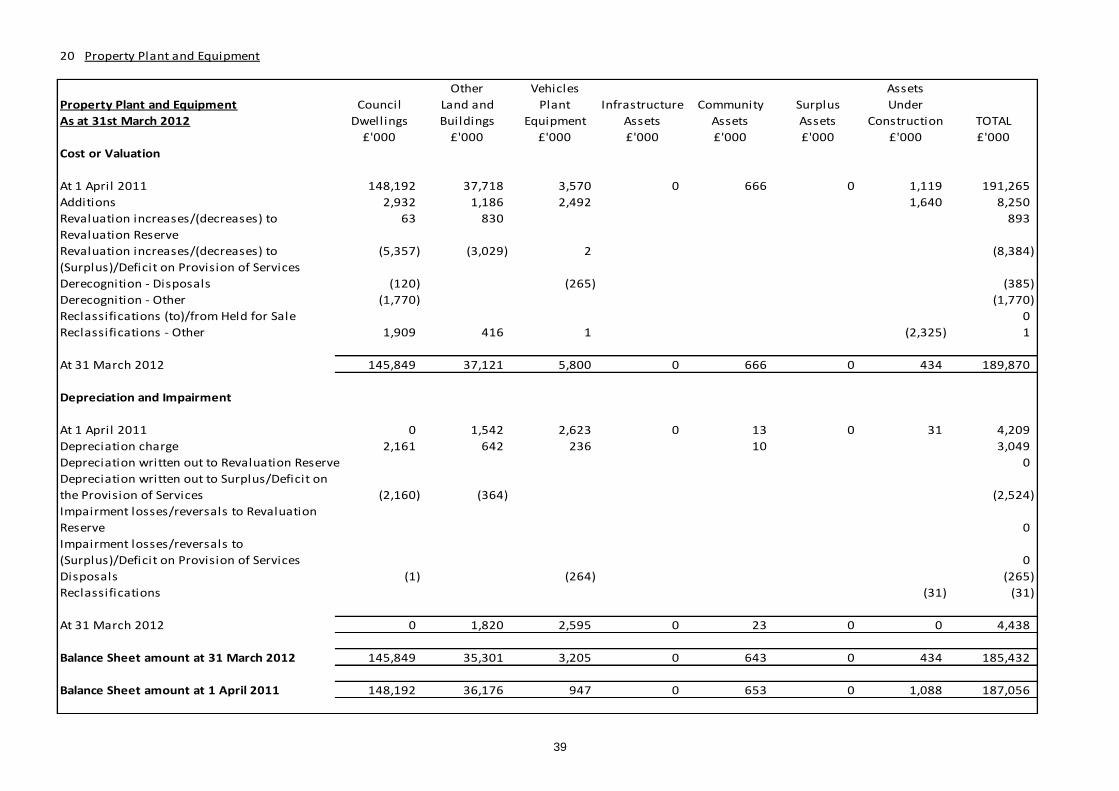
39
20 Property Plant and Equipment
Other Vehicles Assets
Property Plant and Equipment Council Land and Plant Infrastructure Community Surplus Under
As at 31st March 2012 Dwellings Buildings Equipment Assets Assets Assets Construction TOTAL
£'000 £'000 £'000 £'000 £'000 £'000 £'000 £'000
Cost or Valuation
At 1 April 2011 148,192 37,718 3,570 0 666 0 1,119 191,265
Additions 2,932 1,186 2,492 1,640 8,250
Revaluation increases/(decreases) to
Revaluation Reserve
63 830 893
Revaluation increases/(decreases) to
(Surplus)/Deficit on Provision of Services
(5,357) (3,029) 2 (8,384)
Derecognition - Disposals (120) (265) (385)
Derecognition - Other (1,770) (1,770)
Reclassifications (to)/from Held for Sale 0
Reclassifications - Other 1,909 416 1 (2,325) 1
At 31 March 2012 145,849 37,121 5,800 0 666 0 434 189,870
Depreciation and Impairment
At 1 April 2011 0 1,542 2,623 0 13 0 31 4,209
Depreciation charge 2,161 642 236 10 3,049
Depreciation written out to Revaluation Reserve 0
Depreciation written out to Surplus/Deficit on
the Provision of Services (2,160) (364) (2,524)
Impairment losses/reversals to Revaluation
Reserve 0
Impairment losses/reversals to
(Surplus)/Deficit on Provision of Services 0
Disposals (1) (264) (265)
Reclassifications (31) (31)
At 31 March 2012 0 1,820 2,595 0 23 0 0 4,438
Balance Sheet amount at 31 March 2012 145,849 35,301 3,205 0 643 0 434 185,432
Balance Sheet amount at 1 April 2011 148,192 36,176 947 0 653 0 1,088 187,056

40
Other Vehicles Assets
Property Plant and Equipment Council Land and Plant Infrastructure Community Surplus Under
As at 31st March 2011 Restated Dwellings Buildings Equipment Assets Assets Assets Construction TOTAL
£'000 £'000 £'000 £'000 £'000 £'000 £'000 £'000
Cost or Valuation Restated
At 1 April 2010 221,301 32,399 3,664 0 559 0 1,474 259,397
Additions 2,577 665 57 107 3,458 6,864
Revaluation increases/(decreases) to
Revaluation Reserve
(637) 5,265 4,628
Revaluation increases/(decreases) to
(Surplus)/Deficit on Provision of Services
(76,033) (1,810) (77,843)
Derecognition - Disposals (247) (36) (151) (434)
Derecognition - Other (1,390) (1,390)
Reclassifications (to)/from Held for Sale 0
Reclassifications - Other 2,621 1,235 (3,813) 43
At 31 March 2011 148,192 37,718 3,570 0 666 0 1,119 191,265
Depreciation and Impairment
At 1 April 2010 0 1,473 2,538 0 10 0 31 4,052
Depreciation charge 2,180 685 236 3 3,104
Depreciation written out to Revaluation Reserve 0
Depreciation written out to Surplus/Deficit on
the Provision of Services (2,176) (607) (2,783)
Impairment losses/reversals to Revaluation
Reserve 0
Impairment losses/reversals to
(Surplus)/Deficit on Provision of Services 0
Disposals (4) (9) (151) (164)
Reclassifications 0
At 31 March 2011 0 1,542 2,623 0 13 0 31 4,209
Balance Sheet amount at 31 March 2011 148,192 36,176 947 0 653 0 1,088 187,056
Balance Sheet amount at 1 April 2010 221,301 30,926 1,126 0 549 0 1,443 255,345

41
21 Leases – Disclosure as Lessee Finance Leases The authority has a 30 year lease on the Millgate Museum and a 125 year lease on Clipstone Holding Centre which have
been accounted for as finance leases. The assets are included on the Balance Sheet under Property, Plant and Equipment.
The net carrying amounts of the assets as at 31
st March were:
31 March 2012 31 March 2011
£'000 £'000
Land and Buildings 271 275
Vehicles, Plant and Equipment 0 0
271 275
The authority is committed to making minimum payments under the leases comprising settlement of the long term
liability for the interest in the property acquired by the authority in future years while the liability remains outstanding. The minimum lease payments are made up of the following amounts:
31 March 2012 31 March 2011
£'000 £'000
Finance Lease Liabilities 401 406
(net present value of minimum lease payments)
Finance costs payable in future years minimum lease 2,830 2,875
payments
3,231 3,281
The minimum lease payments will be payable over the following periods:
31 March 2012 31 March 2011 31 March 2012 31 March 2011
£'000 £'000 £'000 £'000
Not later than one year 50 50 6 6
Later than one year and not later
than five years 200 200 34 30
Later than five years 2,931 2,981 356 366
3,181 3,231 396 402
Finance Lease Liabilities (NPV)Minimum Lease Payments
The authority has sub let Clipstone Holding Centre units held under the finance lease. The annual minimum payments
expected to be received is £42k (£36k in 2010/2011). Operating Leases Vehicles, Plant, Furniture and Equipment – the authority uses a range of vehicles, mowers and associated equipment,
together with items of fitness equipment, financed under the terms of operating leases. Land and Buildings – the Authority leases several items of land and buildings, to include small pieces of land, cashiers
office and a car park to the rear of London Road, the leasing arrangements for each being accounted for as operating leases.
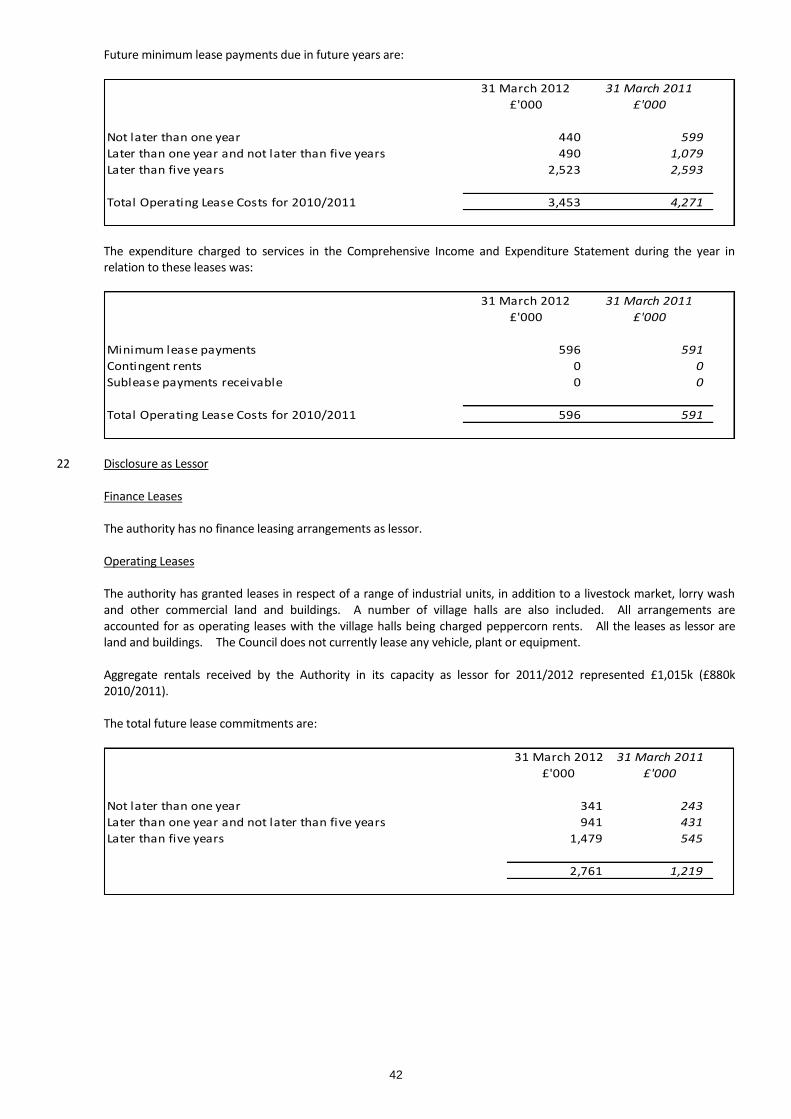
42
Future minimum lease payments due in future years are:
31 March 2012 31 March 2011
£'000 £'000
Not later than one year 440 599
Later than one year and not later than five years 490 1,079
Later than five years 2,523 2,593
Total Operating Lease Costs for 2010/2011 3,453 4,271
The expenditure charged to services in the Comprehensive Income and Expenditure Statement during the year in
relation to these leases was:
31 March 2012 31 March 2011
£'000 £'000
Minimum lease payments 596 591
Contingent rents 0 0
Sublease payments receivable 0 0
Total Operating Lease Costs for 2010/2011 596 591
22 Disclosure as Lessor Finance Leases The authority has no finance leasing arrangements as lessor. Operating Leases The authority has granted leases in respect of a range of industrial units, in addition to a livestock market, lorry wash
and other commercial land and buildings. A number of village halls are also included. All arrangements are accounted for as operating leases with the village halls being charged peppercorn rents. All the leases as lessor are land and buildings. The Council does not currently lease any vehicle, plant or equipment.
Aggregate rentals received by the Authority in its capacity as lessor for 2011/2012 represented £1,015k (£880k
2010/2011). The total future lease commitments are:
31 March 2012 31 March 2011
£'000 £'000
Not later than one year 341 243
Later than one year and not later than five years 941 431
Later than five years 1,479 545
2,761 1,219

43
23 Heritage Assets
For 2011/2012, following changes to the Code of Practice, the authority is required to change its accounting policy for heritage assets due to and recognise then at valuation. Previously heritage assets were either recognised as community assets or were not recognised in the Balance Sheet. In applying the new policy the authority has identified the assets previously held as community assets at £350k that should now be recognised as heritage assets and measured at £375k with a corresponding increase in the revaluation reserve. At 31 March 2012 the authority will also recognise an additional £1.17m (£303k as at 31 March 2011) for the recognition of assets that were not previously recognised on the Balance Sheet, the increase being reflected in the revaluation reserve.
The following table shows the reconciliation of the carrying value of the heritage assets held by the authority. The museums collection was valued during 2011/2012 by Golding Young for the purposes of insurance.
Museum Other Total
Collection Assets Assets
£'000 £'000 £'000
Cost or Valuation
At 1 April 2010 626 52 678
Additions 0 0 0
Disposals 0 0 0
Revaluations 0 0 0
Depreciation 0 0 0
At 31 March 2011 626 52 678
Cost or Valuation
At 1 April 2011 626 52 678
Additions 0 0 0
Disposals 0 0 0
Revaluations 868 0 868
Depreciation 0 0 0
At 31 March 2012 1,494 52 1,546
For the past five financial years the Council has not acquired any heritage assets by purchase or donation, or disposed of or impaired any heritage assets.
The Council’s heritage assets held on the Balance Sheet have been split into the following categories:
Museum Collection – The Council has an extensive museum collection comprising art, civil war artefacts, clocks, coins and tokens and other items of interest. The museum was established in 1912 and the majority of artefacts have been donated by local residents over the course of the years. Approximately 25% of the collection is on display with the remaining items available for viewing by appointment. The collection is the responsibility of the Museum Business Manager and is kept in a controlled environment to ensure minimal deterioration. Should any remedial conservation be required this is contracted out to specialist third parties on an as and when basis. Items are valued for insurance purposes at a minimum of every five years and held on the balance sheet at this value. The assets held within the museum collection are deemed to have indeterminate lives and as such are not depreciated. A significant item of the collection is the Newark Torc, a complete Iron Age gold alloy neck ring which was purchased by a combination of council funding, grant funding and public donations in 2006. The torc is currently on display at the British Museum.
Other – other heritage assets held by the Council include various sculptures which have been commissioned and are on display in the Council’s parks and gardens and the Chairman’s chains of office. Items are valued on an annual basis for insurance purposes and held on the balance sheet at this value.
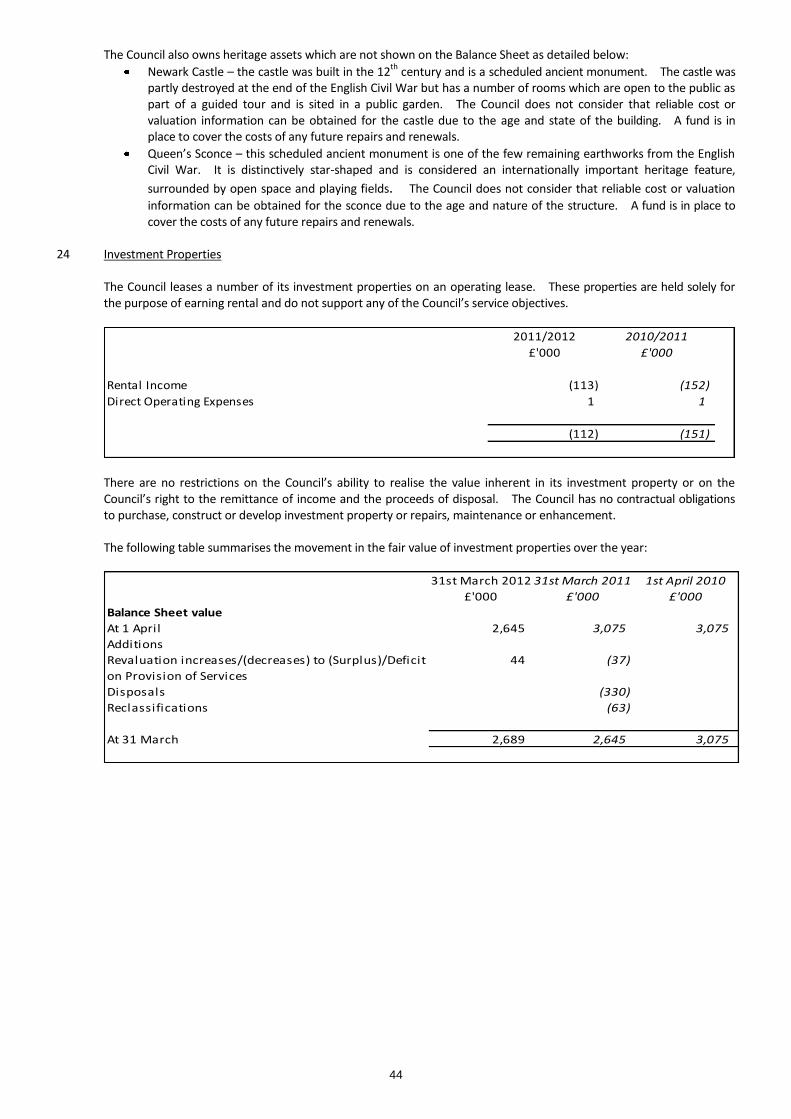
44
The Council also owns heritage assets which are not shown on the Balance Sheet as detailed below:
Newark Castle – the castle was built in the 12th
century and is a scheduled ancient monument. The castle was partly destroyed at the end of the English Civil War but has a number of rooms which are open to the public as part of a guided tour and is sited in a public garden. The Council does not consider that reliable cost or valuation information can be obtained for the castle due to the age and state of the building. A fund is in place to cover the costs of any future repairs and renewals.
Queen’s Sconce – this scheduled ancient monument is one of the few remaining earthworks from the English Civil War. It is distinctively star-shaped and is considered an internationally important heritage feature,
surrounded by open space and playing fields. The Council does not consider that reliable cost or valuation
information can be obtained for the sconce due to the age and nature of the structure. A fund is in place to cover the costs of any future repairs and renewals.
24 Investment Properties
The Council leases a number of its investment properties on an operating lease. These properties are held solely for the purpose of earning rental and do not support any of the Council’s service objectives.
2011/2012 2010/2011
£'000 £'000
Rental Income (113) (152)
Direct Operating Expenses 1 1
(112) (151)
There are no restrictions on the Council’s ability to realise the value inherent in its investment property or on the Council’s right to the remittance of income and the proceeds of disposal. The Council has no contractual obligations to purchase, construct or develop investment property or repairs, maintenance or enhancement. The following table summarises the movement in the fair value of investment properties over the year:
31st March 2012 31st March 2011 1st April 2010
£'000 £'000 £'000
Balance Sheet value
At 1 April 2,645 3,075 3,075
Additions
Revaluation increases/(decreases) to (Surplus)/Deficit
on Provision of Services
44 (37)
Disposals (330)
Reclassifications (63)
At 31 March 2,689 2,645 3,075

45
25 Assets Held for Sale The Council holds the following current assets with the intent of selling them within 12 months of the balance sheet date.
2011/2012 2010/2011 2010/2011
Closing Opening
£'000 £'000 £'000
Balance outstanding at start of year 0 5,050 50
Assets newly classified as held for sale
Property Plant and Equipment 38 0 5,000
Assets declassified as held for sale
Assets Sold (38) (5,050) 0
Transfers 0 0 0
Balance outstanding at year end 0 0 5,050
26 Intangible Assets
During 2011/2012 the Council’s intangible assets consisted of computer software. These were considered to have significant long term value to justify inclusion within the Balance Sheet. They are amortised on a straight line basis over the estimated period of economic benefit to the Council which varies between 5 and 10 years depending on the particular system. The amortisation amount is charged to the relevant revenue service and is included within the (Surplus)/Deficit on Continuing Operations.
31st March 2012 31st March 2011 1st April 2010
£'000 £'000 £'000
Cost or Valuation
At 1 April 691 675 675
Additions 16 0
Revaluation increases/(decreases) to Revaluation
Reserve
0 0
Revaluation increases/(decreases) to
(Surplus)/Deficit on Provision of Services
0 0
Disposals 0 0
At 31 March 691 691 675
Depreciation and Impairment
At 1 April 667 659 652
Amortisation 10 8 7
Impairment losses/reversals to Revaluation Reserve 0 0
Impairment losses/reversals to (Surplus)/Deficit on
Provision of Services
0 0
Disposals 0 0
At 31 March 677 667 659
Balance Sheet amount 31 March 14 24 16
Balance Sheet amount 1 April 24 23 23

46
27 Nature of Asset Holdings The nature of the asset holdings are shown below.
2011/2012 Owned Leased Joint Total
Arrangement
£'000 £'000 £'000 £'000
Property, Plant and Equipment
Council Dwellings 145,849 145,849
Other Land and Buildings 34,817 271 213 35,301
Vehicles, Plant, Furniture and Equipment 3,205 3,205
Community Assets 643 643
Surplus Assets 0
Infrastructure 0
Assets Under Construction 434 434
184,948 271 213 185,432
Heritage Assets 1,546 1,546
Intangible Assets 14 14
Assets Held for Sale 0
Investment Properties 2,689 2,689
189,197 271 213 189,681
28 Capital Expenditure and Financing
The main items of capital expenditure were:-
2011/2012 2010/2011
£'000 £'000
Council Dwellings 2,932 2,577
Other Land and Buildings 940 665
Vehicles, Plant, Furniture and Equipment 2,492 57
Infrastructure Assets 0 0
Community Assets 0 107
Assets Under Construction 1,640 3,458
8,004 6,864
Plus:
HRA Self Financing Settlement 36,078 0
De-Minimis 22 43
Revenue Expenditure Funded from Capital under Statute 804 845
44,908 7,752

47
The expenditure on non current assets was financed as follows:-
2011/2012 2010/2011
£'000 £'000
Internal Borrowing 867 1,325
Loan 36,078 0
Capital Receipts 144 716
Government Grants 1,668 3,235
Contributions from Third Parties 1,486 365
Specific Reserves and Provisions 4,665 2,111
44,908 7,752
The Capital Financing Requirement is a measure of the capital expenditure incurred historically by the Council that has yet to be financed. The analysis of the Capital Financing Requirement is as follows:
2011/2012 2010/2011
£'000 £'000
Opening Capital Financing Requirement 80,896 80,556
Restatement adjustment (728)
Increase in underlying need to borrow (unsupported by
government financial assistance) 36,767 1,068
Closing Capital Financing Requirement 117,663 80,896
The Council has a Capital Programme for 5 years of which £209k is contractually committed as at 31 March 2012.
£'000
Property Plant and Equipment
New Council House build 76
Customer Relationship Management System 20
Grants 61
Sconce and Devon Park 48
Other 4
209
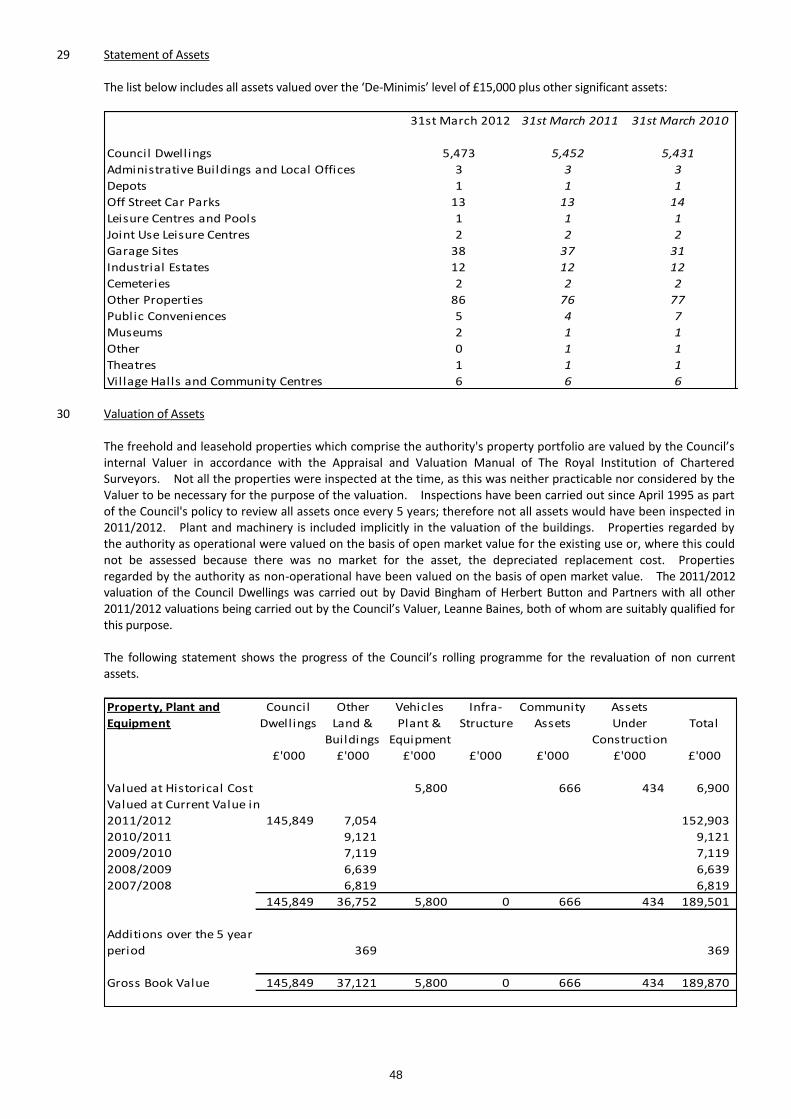
48
29 Statement of Assets The list below includes all assets valued over the ‘De-Minimis’ level of £15,000 plus other significant assets:
31st March 2012 31st March 2011 31st March 2010
Council Dwellings 5,473 5,452 5,431
Administrative Buildings and Local Offices 3 3 3
Depots 1 1 1
Off Street Car Parks 13 13 14
Leisure Centres and Pools 1 1 1
Joint Use Leisure Centres 2 2 2
Garage Sites 38 37 31
Industrial Estates 12 12 12
Cemeteries 2 2 2
Other Properties 86 76 77
Public Conveniences 5 4 7
Museums 2 1 1
Other 0 1 1
Theatres 1 1 1
Village Halls and Community Centres 6 6 6
30 Valuation of Assets The freehold and leasehold properties which comprise the authority's property portfolio are valued by the Council’s
internal Valuer in accordance with the Appraisal and Valuation Manual of The Royal Institution of Chartered Surveyors. Not all the properties were inspected at the time, as this was neither practicable nor considered by the Valuer to be necessary for the purpose of the valuation. Inspections have been carried out since April 1995 as part of the Council's policy to review all assets once every 5 years; therefore not all assets would have been inspected in 2011/2012. Plant and machinery is included implicitly in the valuation of the buildings. Properties regarded by the authority as operational were valued on the basis of open market value for the existing use or, where this could not be assessed because there was no market for the asset, the depreciated replacement cost. Properties regarded by the authority as non-operational have been valued on the basis of open market value. The 2011/2012 valuation of the Council Dwellings was carried out by David Bingham of Herbert Button and Partners with all other 2011/2012 valuations being carried out by the Council’s Valuer, Leanne Baines, both of whom are suitably qualified for this purpose.
The following statement shows the progress of the Council’s rolling programme for the revaluation of non current assets.
Property, Plant and Council Other Vehicles Infra- Community Assets
Equipment Dwellings Land & Plant & Structure Assets Under Total
Buildings Equipment Construction
£'000 £'000 £'000 £'000 £'000 £'000 £'000
Valued at Historical Cost 5,800 666 434 6,900
Valued at Current Value in
2011/2012 145,849 7,054 152,903
2010/2011 9,121 9,121
2009/2010 7,119 7,119
2008/2009 6,639 6,639
2007/2008 6,819 6,819
145,849 36,752 5,800 0 666 434 189,501
Additions over the 5 year
period 369 369
Gross Book Value 145,849 37,121 5,800 0 666 434 189,870
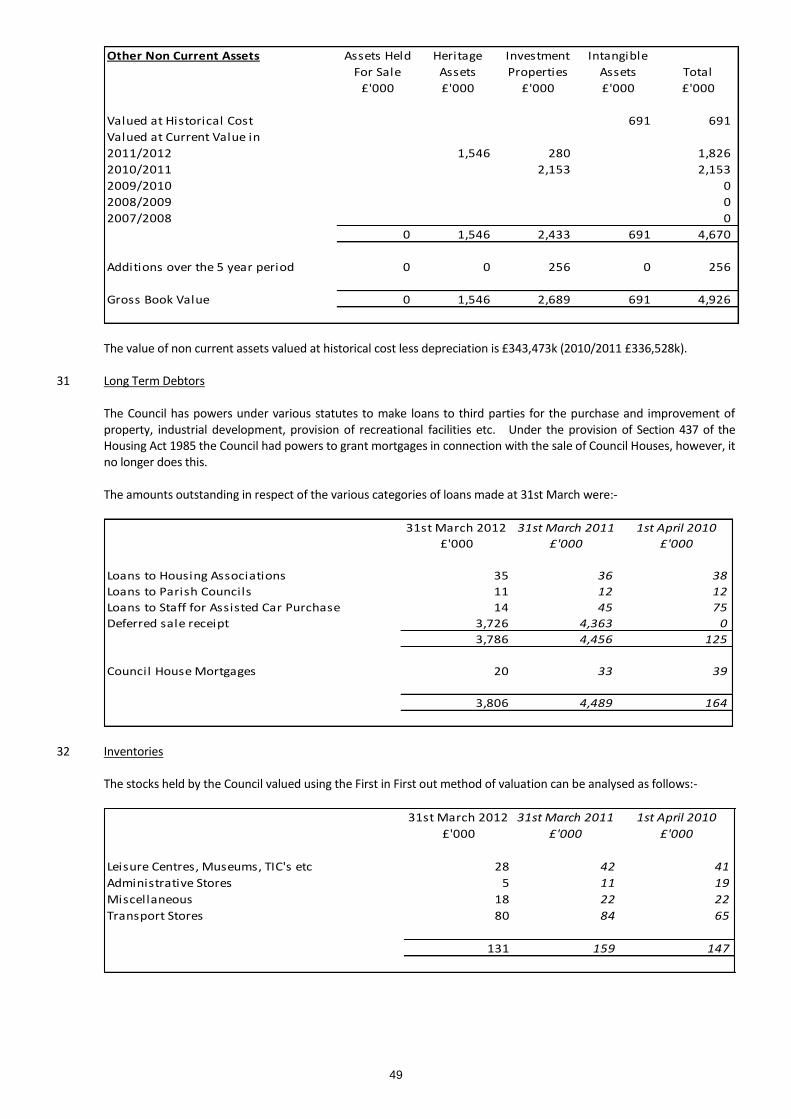
49
Other Non Current Assets Assets Held Heritage Investment Intangible
For Sale Assets Properties Assets Total
£'000 £'000 £'000 £'000 £'000
Valued at Historical Cost 691 691
Valued at Current Value in
2011/2012 1,546 280 1,826
2010/2011 2,153 2,153
2009/2010 0
2008/2009 0
2007/2008 0
0 1,546 2,433 691 4,670
Additions over the 5 year period 0 0 256 0 256
Gross Book Value 0 1,546 2,689 691 4,926
The value of non current assets valued at historical cost less depreciation is £343,473k (2010/2011 £336,528k).
31 Long Term Debtors
The Council has powers under various statutes to make loans to third parties for the purchase and improvement of property, industrial development, provision of recreational facilities etc. Under the provision of Section 437 of the Housing Act 1985 the Council had powers to grant mortgages in connection with the sale of Council Houses, however, it no longer does this.
The amounts outstanding in respect of the various categories of loans made at 31st March were:-
31st March 2012 31st March 2011 1st April 2010
£'000 £'000 £'000
Loans to Housing Associations 35 36 38
Loans to Parish Councils 11 12 12
Loans to Staff for Assisted Car Purchase 14 45 75
Deferred sale receipt 3,726 4,363 0
3,786 4,456 125
Council House Mortgages 20 33 39
3,806 4,489 164
32 Inventories The stocks held by the Council valued using the First in First out method of valuation can be analysed as follows:-
31st March 2012 31st March 2011 1st April 2010
£'000 £'000 £'000
Leisure Centres, Museums, TIC's etc 28 42 41
Administrative Stores 5 11 19
Miscellaneous 18 22 22
Transport Stores 80 84 65
131 159 147

50
33 Short Term Debtors The amounts due to the Council were:-
31st March 2012 31st March 2011 1st April 2010
£'000 £'000 £'000
Amounts falling due within one year:-
Central Government Bodies 1,732 735 524
Other Local Authorities 238 168 651
NHS Bodies 1 0 2
Public Corporations and Trading Funds 0 0 0
Bodies external to General Government 6,855 9,501 6,925
8,826 10,404 8,102
Less Provision for Doubtful Debt (292) (264) (278)
8,534 10,140 7,824
The movement on the provision for doubtful debt comprises £63k write offs and (£91k) contribution. 34 Short Term Creditors The amounts owed by the Council were:-
31st March 2012 31st March 2011 1st April 2010
£'000 £'000 £'000
Amounts falling due within one year:-
Central Government Bodies 292 312 741
Other Local Authorities 572 510 522
NHS Bodies 138 0 0
Public Corporations and Trading Funds 0 0 0
Bodies external to General Government 10,154 4,544 6,232
11,156 5,366 7,495
35 Termination Benefits The authority terminated the contracts of a number of employees in 2011/2012 incurring liabilities in respect of
redundancy payments of £955k (£302k (restated) in 2010/2011). Of this total £158k was payable to the Strategic Director for Communities and £335k to Planning staff as part of the Planning Services restructure. The remaining £462k was paid as part of the Council’s efficiency schemes across a variety of services.
36 Long Term Creditors
31st March 2012 31st March 2011 1st April 2010
£'000 £'000 £'000
Section 106 Receipts 1,274 1,618 1,535
1,274 1,618 1,535
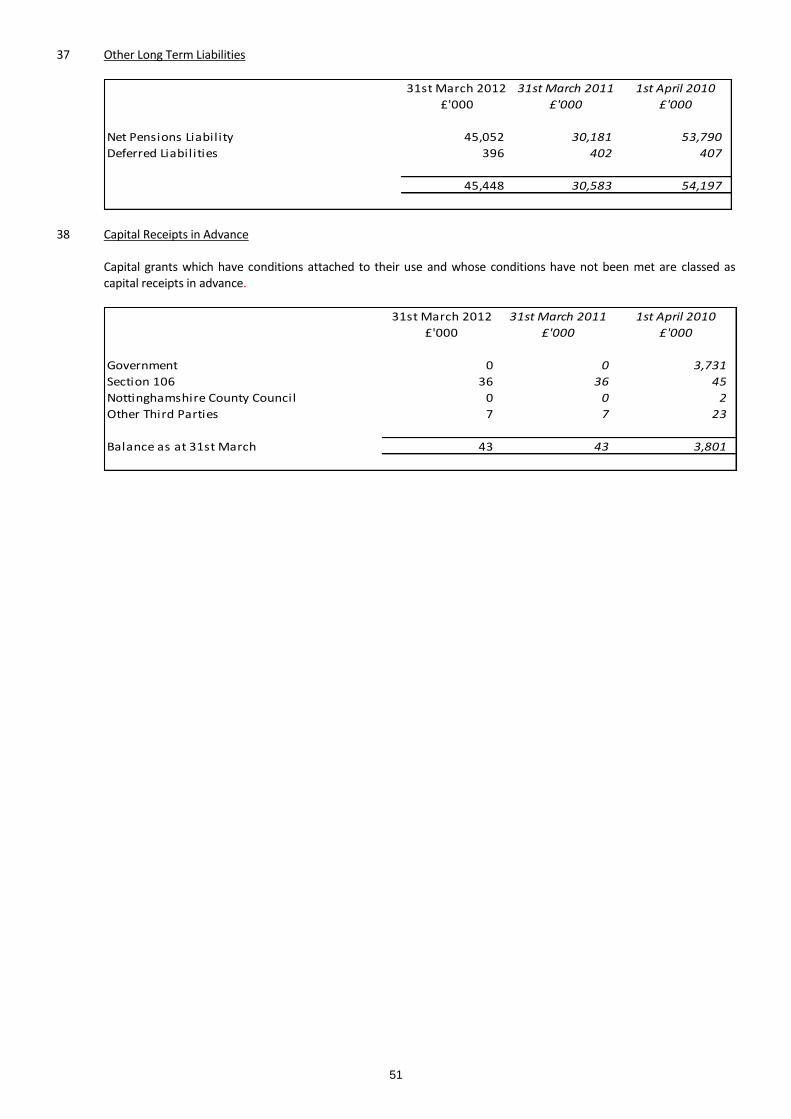
51
37 Other Long Term Liabilities
31st March 2012 31st March 2011 1st April 2010
£'000 £'000 £'000
Net Pensions Liability 45,052 30,181 53,790
Deferred Liabilities 396 402 407
45,448 30,583 54,197
38 Capital Receipts in Advance Capital grants which have conditions attached to their use and whose conditions have not been met are classed as
capital receipts in advance.
31st March 2012 31st March 2011 1st April 2010
£'000 £'000 £'000
Government 0 0 3,731
Section 106 36 36 45
Nottinghamshire County Council 0 0 2
Other Third Parties 7 7 23
Balance as at 31st March 43 43 3,801
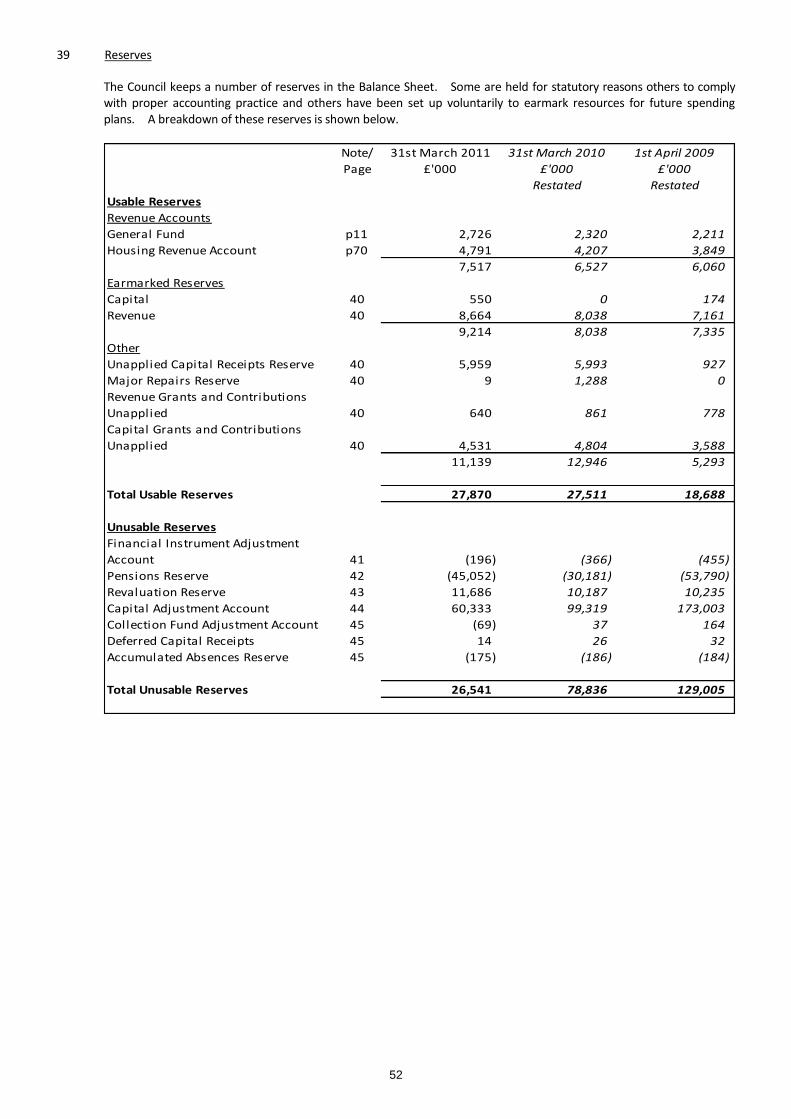
52
39 Reserves
The Council keeps a number of reserves in the Balance Sheet. Some are held for statutory reasons others to comply with proper accounting practice and others have been set up voluntarily to earmark resources for future spending plans. A breakdown of these reserves is shown below.
Note/ 31st March 2011 31st March 2010 1st April 2009
Page £'000 £'000 £'000
Restated Restated
Usable Reserves
Revenue Accounts
General Fund p11 2,726 2,320 2,211
Housing Revenue Account p70 4,791 4,207 3,849
7,517 6,527 6,060
Earmarked Reserves
Capital 40 550 0 174
Revenue 40 8,664 8,038 7,161
9,214 8,038 7,335
Other
Unapplied Capital Receipts Reserve 40 5,959 5,993 927
Major Repairs Reserve 40 9 1,288 0
Revenue Grants and Contributions
Unapplied 40 640 861 778
Capital Grants and Contributions
Unapplied 40 4,531 4,804 3,588
11,139 12,946 5,293
Total Usable Reserves 27,870 27,511 18,688
Unusable Reserves
Financial Instrument Adjustment
Account 41 (196) (366) (455)
Pensions Reserve 42 (45,052) (30,181) (53,790)
Revaluation Reserve 43 11,686 10,187 10,235
Capital Adjustment Account 44 60,333 99,319 173,003
Collection Fund Adjustment Account 45 (69) 37 164
Deferred Capital Receipts 45 14 26 32
Accumulated Absences Reserve 45 (175) (186) (184)
Total Unusable Reserves 26,541 78,836 129,005
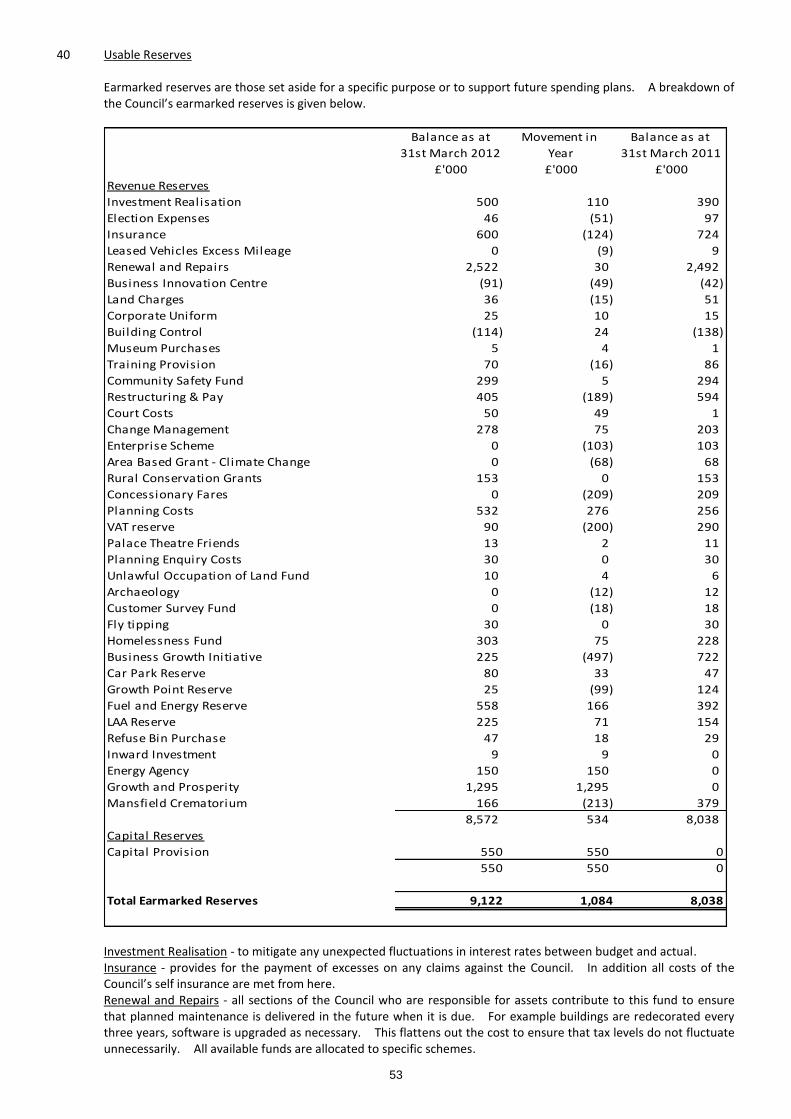
53
40 Usable Reserves Earmarked reserves are those set aside for a specific purpose or to support future spending plans. A breakdown of the Council’s earmarked reserves is given below.
Balance as at Movement in Balance as at
31st March 2012 Year 31st March 2011
£'000 £'000 £'000
Revenue Reserves
Investment Realisation 500 110 390
Election Expenses 46 (51) 97
Insurance 600 (124) 724
Leased Vehicles Excess Mileage 0 (9) 9
Renewal and Repairs 2,522 30 2,492
Business Innovation Centre (91) (49) (42)
Land Charges 36 (15) 51
Corporate Uniform 25 10 15
Building Control (114) 24 (138)
Museum Purchases 5 4 1
Training Provision 70 (16) 86
Community Safety Fund 299 5 294
Restructuring & Pay 405 (189) 594
Court Costs 50 49 1
Change Management 278 75 203
Enterprise Scheme 0 (103) 103
Area Based Grant - Climate Change 0 (68) 68
Rural Conservation Grants 153 0 153
Concessionary Fares 0 (209) 209
Planning Costs 532 276 256
VAT reserve 90 (200) 290
Palace Theatre Friends 13 2 11
Planning Enquiry Costs 30 0 30
Unlawful Occupation of Land Fund 10 4 6
Archaeology 0 (12) 12
Customer Survey Fund 0 (18) 18
Fly tipping 30 0 30
Homelessness Fund 303 75 228
Business Growth Initiative 225 (497) 722
Car Park Reserve 80 33 47
Growth Point Reserve 25 (99) 124
Fuel and Energy Reserve 558 166 392
LAA Reserve 225 71 154
Refuse Bin Purchase 47 18 29
Inward Investment 9 9 0
Energy Agency 150 150 0
Growth and Prosperity 1,295 1,295 0
Mansfield Crematorium 166 (213) 379
8,572 534 8,038
Capital Reserves
Capital Provision 550 550 0
550 550 0
Total Earmarked Reserves 9,122 1,084 8,038
Investment Realisation - to mitigate any unexpected fluctuations in interest rates between budget and actual. Insurance - provides for the payment of excesses on any claims against the Council. In addition all costs of the Council’s self insurance are met from here. Renewal and Repairs - all sections of the Council who are responsible for assets contribute to this fund to ensure that planned maintenance is delivered in the future when it is due. For example buildings are redecorated every three years, software is upgraded as necessary. This flattens out the cost to ensure that tax levels do not fluctuate unnecessarily. All available funds are allocated to specific schemes.
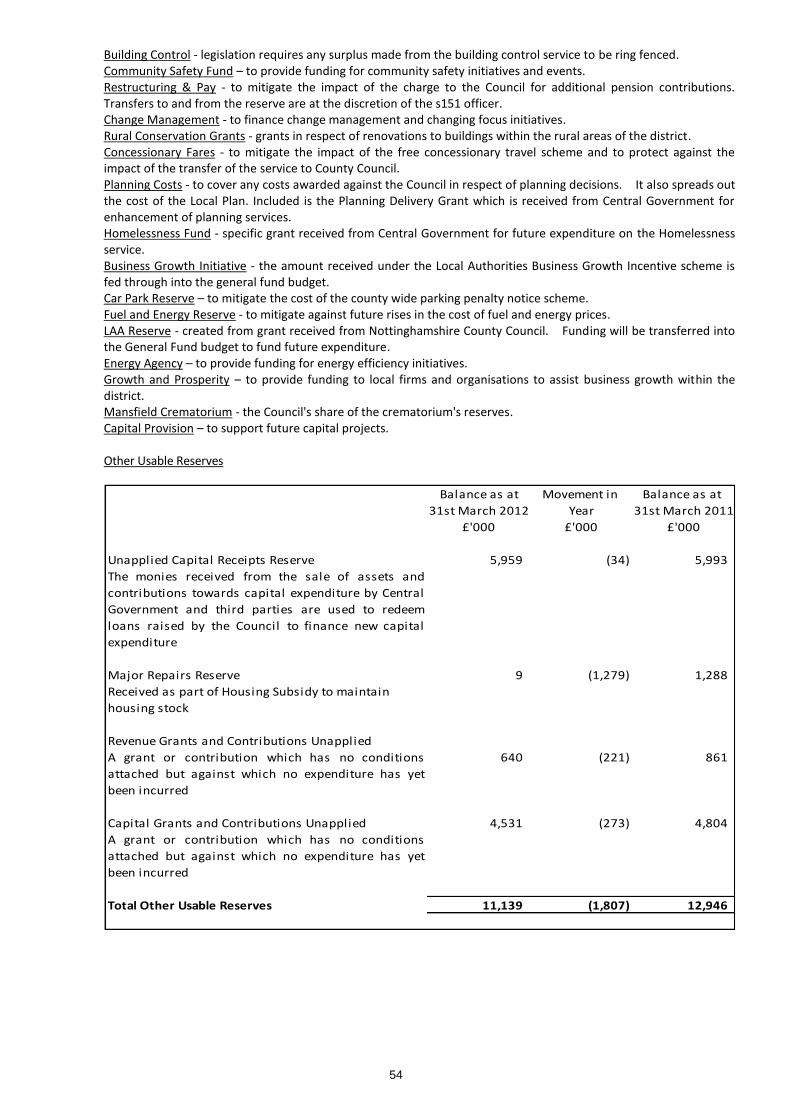
54
Building Control - legislation requires any surplus made from the building control service to be ring fenced. Community Safety Fund – to provide funding for community safety initiatives and events. Restructuring & Pay - to mitigate the impact of the charge to the Council for additional pension contributions. Transfers to and from the reserve are at the discretion of the s151 officer. Change Management - to finance change management and changing focus initiatives. Rural Conservation Grants - grants in respect of renovations to buildings within the rural areas of the district. Concessionary Fares - to mitigate the impact of the free concessionary travel scheme and to protect against the impact of the transfer of the service to County Council. Planning Costs - to cover any costs awarded against the Council in respect of planning decisions. It also spreads out the cost of the Local Plan. Included is the Planning Delivery Grant which is received from Central Government for enhancement of planning services. Homelessness Fund - specific grant received from Central Government for future expenditure on the Homelessness service. Business Growth Initiative - the amount received under the Local Authorities Business Growth Incentive scheme is fed through into the general fund budget. Car Park Reserve – to mitigate the cost of the county wide parking penalty notice scheme. Fuel and Energy Reserve - to mitigate against future rises in the cost of fuel and energy prices. LAA Reserve - created from grant received from Nottinghamshire County Council. Funding will be transferred into the General Fund budget to fund future expenditure. Energy Agency – to provide funding for energy efficiency initiatives. Growth and Prosperity – to provide funding to local firms and organisations to assist business growth within the district. Mansfield Crematorium - the Council's share of the crematorium's reserves. Capital Provision – to support future capital projects.
Other Usable Reserves
Balance as at Movement in Balance as at
31st March 2012 Year 31st March 2011
£'000 £'000 £'000
Unapplied Capital Receipts Reserve 5,959 (34) 5,993
The monies received from the sale of assets and
contributions towards capital expenditure by Central
Government and third parties are used to redeem
loans raised by the Council to finance new capital
expenditure
Major Repairs Reserve 9 (1,279) 1,288
Received as part of Housing Subsidy to maintain
housing stock
Revenue Grants and Contributions Unapplied
A grant or contribution which has no conditions
attached but against which no expenditure has yet
been incurred
640 (221) 861
Capital Grants and Contributions Unapplied 4,531 (273) 4,804
A grant or contribution which has no conditions
attached but against which no expenditure has yet
been incurred
Total Other Usable Reserves 11,139 (1,807) 12,946

55
41 Financial Instrument Adjustment Account
The Financial Instrument Adjustment Account absorbs the timing difference arising from the different arrangements for
accounting for income and expenditure relating to certain financial instruments and for bearing losses or benefitting
from gains per statutory provision. The Council uses the account to manage premiums paid on the early redemption
of loans. Premiums are debited to the Comprehensive Income and Expenditure Statement when they are incurred but
reversed out of the General Fund balance to this account in the Movement in Reserves Statement. Over time the
expense is posted back to the General Fund balance in accordance with statutory arrangements for spreading the
burden on council tax.
In 2011/2012 £130,349 (£137,999 2010/2011) was charged to the HRA and £3,147 (£3,137 2010/2011) was charged to
the General Fund. In addition the full balance of HRA premiums of £150,512 has been written out in 2011/2012
following the HRA self financing settlement. An adjustment of £53,634 was made to General Fund premiums to rectify
an incorrect charge made in 2009/2010. Following the settlement by Glitnir bank the impairment charge held on this
account of £60,854 has now been charged back to the General Fund.
42 Pensions Reserve
The Pensions Reserve absorbs the timing differences arising from the different arrangements for accounting for post
employment benefits and for funding benefits in accordance with statutory provisions. The Council accounts for post
employment benefits in the Comprehensive Income and Expenditure Statement as the benefits are earned by
employees accruing years of service, updating the liabilities recognised to reflect inflation, changing assumptions and
investment returns on any resources set aside to meet the costs. However, statutory arrangements require benefits
earned to be financed as the Council makes employer’s contributions to pension funds or eventually pays any pensions
for which it is directly responsible. The debit balance on the reserve therefore shows a substantial shortfall in the
benefits earned by past and current employees and the resources the Council has set aside to meet them. The
statutory arrangements will ensure that funding will have been set aside by the time the benefits come to be paid.
In 2011/2012 actuarial losses of £14,461k (gains of £17,403k 2010/2011) were charged and net charges of £410k
(£6,206k gain 2010/2011) were reversed.
43 Revaluation Reserve The Revaluation Reserve contains the gains made by the Council arising from increases in the value of its Property,
Plant and Equipment. The balance is reduced when assets with accumulated gains are
Revalued downwards or impaired and the gains are lost
Used in the provision of services and the gains are consumed through depreciation, or
Disposed of and the gains are realised The reserve contains only revaluation gains accumulated since 1 April 2007, the date the reserve was created. Accumulated gains arising before that date are consolidated into the balance in the Capital Adjustment Account.
31st March 2012 31st March 2011 1st April 2010
£'000 £'000 £'000
Restated Restated
Balance as at 1st April 10,187 10,235 3,273
(Deficit)/Surplus on Revaluation and Restatement
of Non Current Assets:
Newark and Sherwood District Council 1,940 4,641 7,041
Joint Arrangement - Mansfield Crematorium (178) (13) 3
Depreciation charge:
Historical Cost Adjustment (227) (123) (82)
Revaluation of Disposed Assets (36) (4,553) 0
Balance as at 31st March 11,686 10,187 10,235

56
44 Capital Adjustment Account The Capital Adjustment Account absorbs the timing differences arising from the different arrangements for the
consumption of non current assets and for financing the acquisition, construction or enhancement of those assets under statutory provisions. The account is debited with the cost of acquisition, construction or enhancement as depreciation, impairment losses and amortisation are charged to the Comprehensive Income and Expenditure Statement. The account is credited with the amounts set aside by the Council as finance for the costs of acquisition, construction and enhancement.
The account contains accumulated gains and losses on Investment Properties and revaluation gains on Property, Plant
and Equipment before 1 April 2007, the date the Revaluation Reserve was created to hold such gains.
31st March 2012 31st March 2011 1st April 2010
£'000 £'000 £'000
Balance as at 1st April 99,319 173,003 167,009
Capital Financing:-
Capital Receipts applied 169 716 1,549
Capital Provision util ised 263 88 81
Government and Other Grants and
Contributions util ised
3,129 4,616 1,467
Use of Major Repairs Allowance 4,638 2,022 3,244
Finance Leases 6 5 0
Minimum Revenue Provision 231 271 287
8,436 7,718 6,628
Capital Charges
Depreciation Council Dwellings (2,161) (2,180) (3,050)
Depreciation Other HRA Assets (264) (242) (210)
Depreciation General Fund Assets (624) (681) (975)
Impairments Council dwellings (3,197) (73,857) 5,754
Impairments Other HRA Assets (501) 42 335
Impairments General Fund Assets (2,121) (1,282) (1,182)
Revenue expenditure funded from capital (804) (845) (992)
Historical Cost Depreciation Adjustment 227 123 81
Revaluation of Disposed Assets 38 4,553 0
Disposal of Assets (1,927) (7,041) (388)
Amortisation of intangible assets (10) (8) (7)
Donated Assets 0 16 0
HRA Self Financing (36,078) 0 0
(47,422) (81,402) (634)
Balance as at 31st March 60,333 99,319 173,003
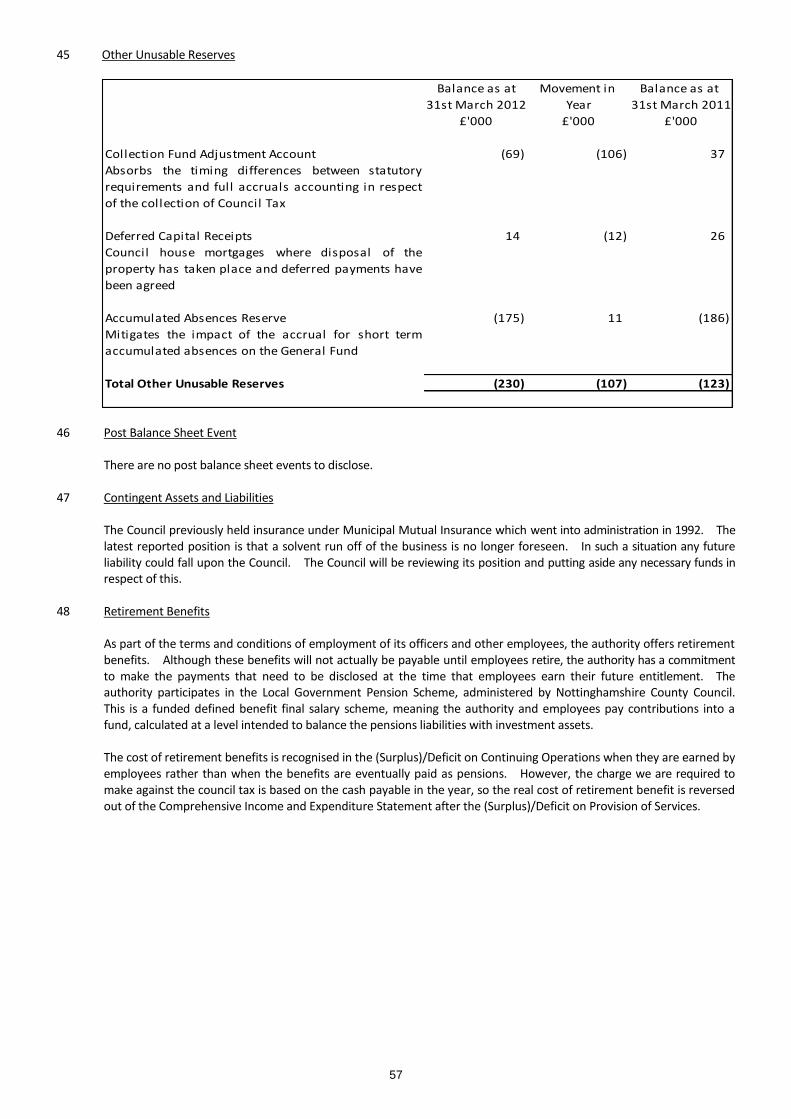
57
45 Other Unusable Reserves
Balance as at Movement in Balance as at
31st March 2012 Year 31st March 2011
£'000 £'000 £'000
Collection Fund Adjustment Account (69) (106) 37
Absorbs the timing differences between statutory
requirements and full accruals accounting in respect
of the collection of Council Tax
Deferred Capital Receipts 14 (12) 26
Council house mortgages where disposal of the
property has taken place and deferred payments have
been agreed
Accumulated Absences Reserve (175) 11 (186)
Mitigates the impact of the accrual for short term
accumulated absences on the General Fund
Total Other Unusable Reserves (230) (107) (123)
46 Post Balance Sheet Event There are no post balance sheet events to disclose. 47 Contingent Assets and Liabilities The Council previously held insurance under Municipal Mutual Insurance which went into administration in 1992. The
latest reported position is that a solvent run off of the business is no longer foreseen. In such a situation any future liability could fall upon the Council. The Council will be reviewing its position and putting aside any necessary funds in respect of this.
48 Retirement Benefits
As part of the terms and conditions of employment of its officers and other employees, the authority offers retirement benefits. Although these benefits will not actually be payable until employees retire, the authority has a commitment to make the payments that need to be disclosed at the time that employees earn their future entitlement. The authority participates in the Local Government Pension Scheme, administered by Nottinghamshire County Council. This is a funded defined benefit final salary scheme, meaning the authority and employees pay contributions into a fund, calculated at a level intended to balance the pensions liabilities with investment assets. The cost of retirement benefits is recognised in the (Surplus)/Deficit on Continuing Operations when they are earned by employees rather than when the benefits are eventually paid as pensions. However, the charge we are required to make against the council tax is based on the cash payable in the year, so the real cost of retirement benefit is reversed out of the Comprehensive Income and Expenditure Statement after the (Surplus)/Deficit on Provision of Services.

58
These transactions are as follows:-
2011/2012 2010/2011
£'000 £'000
Comprehensive Income and Expenditure Statement
(Surplus)/Deficit on Continuing Operations
Current service cost 1,897 2,611
Past service costs 0 (7,670)
Losses on curtailment 461 172
(Surplus)/Deficit on Provision of Services
Interest cost 4,580 5,078
Expected return on scheme assets (3,617) (3,394)
Net Charge to the Comprehensive Income and
Expenditure Statement 3,321 (3,203)
Movement in Reserves Statement
Reversal of net charges made for retirement benefits (410) 6,206
Actual amount charged against the General Fund Balance
Employers' contributions payable to scheme 2,911 3,003
In addition to the recognised gains and losses included in the Comprehensive Income and Expenditure Statement, actuarial gains and losses of £14,461,000 (£17,403,000 2010/2011) were included under Other Comprehensive Income and Expenditure in the Comprehensive Income and Expenditure Statement.
Assets and liabilities in relation to retirement benefits Reconciliation of present value of the scheme liabilities:
Year to Year to
31st March 31st March
2012 2011
£'000 £'000
1st April 83,613 103,708
Current service cost 1,897 2,611
Interest cost 4,580 5,078
Contributions by scheme participants 599 657
Actuarial losses (gains) 12,125 (17,298)
Past service cost 0 (7,670)
Losses (gains) on curtailment 461 172
Benefits paid (3,705) (3,460)
Unfunded pension payments (187) (185)
31st March 99,383 83,613
Reconciliation of fair value of the scheme assets:
Year to Year to
31st March 2012 31st March 2011
£'000 £'000
1st April 53,432 49,918
Expected rate of return 3,617 3,394
Actuarial gains (losses) (2,336) 105
Employer contributions 2,911 3,003
Contributions by scheme participants 599 657
Benefits paid (3,892) (3,645)
31st March 54,331 53,432

59
The expected return on scheme assets is determined by considering the expected returns on the assets underlying the current investment policy. Expected yields on fixed interest investments are based on gross redemption yields as at the Balance Sheet date. Expected returns on equity investments reflect long term real rates of return experienced in the respective markets.
The actual return on scheme assets in the year was £1,281,000 (2010/2011 £3,960,000). The fall in the actual return is
mainly due to a drop in return on UK equities in the summer of 2011. Scheme History
Assets 2011/2012 2010/2011 2009/2010 2008/2009 2007/2008
£'000 £'000 £'000 £'000 £'000
Present value of liabilities (99,383) (83,613) (103,708) (68,772) (80,613)
Fair value of assets 54,331 53,432 49,918 37,340 45,082
Surplus/(deficit) (45,052) (30,181) (53,790) (31,432) (35,531)
The liabilities show the underlying commitments the authority has in the long run to pay retirement benefits. The total liability has a substantial impact on the net worth of the authority as recorded in the Balance Sheet, resulting in negative overall balance of £45,052,000. However, statutory arrangements for funding the deficit mean the financial position of the authority remains healthy; the deficit will be made good by increased contributions over the remaining working life of employees, as assessed by the scheme actuary. The total contributions expected to be made to the scheme by the Council in the year to 31 March 2013 is £1,950,000. History of experience on gains and losses The actuarial gains identified as movements on the Pensions Reserve in 2011/2012 can be analysed into the following categories, measure as a percentage of assets or liabilities at 31 March 2012.
Net Pension Asset as at: 2011/2012 2010/2011 2009/2010 2008/2009
% % % %
Differences between the expected and
actual return on assets (4.3%) 0.2% 20.1% (30.5%)
Experience gains and losses on liabilities (0.1%) 0.7% 0.2% 0.0%
Basis for estimating assets and liabilities Liabilities have been assessed on an actuarial basis using the projected unit method, an estimate of the pensions that will be payable in future years dependent on assumptions about mortality rates, salary levels etc. The scheme liabilities have been assessed by Barnett Waddingham LLP, an independent firm of actuaries, the estimates for the County Council Fund being based on the latest full valuation of the scheme as at 31
st March 2012.

60
The principal assumptions used by the actuary have been:
31st March 2012 31st March 2011
Long term expected rate of return in assets in the scheme
Equity investments 6.2% 7.3%
Bonds 4.6% 5.5%
Gilts 3.3% 4.4%
Property 5.7% 6.8%
Cash 3.0% 3.0%
Mortality assumptions
Longevity at 65 for current pensioners
Men 18.60 18.50
Women 22.70 22.60
Longevity at 65 for future pensioners
Men 20.60 20.50
Women 24.50 24.50
Rate of inflation - Retail Price Index 3.3% 3.5%
Rate of inflation - Consumer Price Index 2.5% 2.7%
Rate of increase in salaries 4.7% 5.0%
Rate of increase in pensions 2.5% 2.7%
Rate for discounting scheme liabilities 4.6% 5.5%
Take up of option to convert annual pension into retirement
lump sum 50% 50%
The Pension Scheme’s assets consist of the following categories, by proportion of the total assets held.
31st March 2012 31st March 2011
% %
Equity Investment 70.0 73.0
Property 14.0 12.0
Gilts 7.0 7.0
Other 9.0 8.0
100.0 100.0
49 Financial Instruments – Risk and Risk Management Disclosure of nature and extent of Risk arising from Financial Instruments The Council’s activities expose it to a variety of financial risks, the key risks being:
Credit risk – the possibility that other parties might fail to pay amounts due to the Council
Liquidity risk – the possibility that the Council might not have funds available to meet its commitments to make payments
Re-financing risk – the possibility that the Council might be requiring to renew a financial instrument on maturity at disadvantageous interest rates or terms
Market risk – the possibility that financial loss might arise for the Council as a result of changes in such measures as interest rate movements

61
Overall Procedures for Managing Risk The Council’s overall risk management procedures focus on the unpredictability of financial markets, and implementing
restrictions to minimise these risks. The procedures for risk management are set out through a legal framework in the Local Government Act 2003 and the associated regulations. These require the Council to comply with the CIPFA Prudential Code, the CIPFA Treasury Management in the Public Services Code of Practice and Investment Guidance issued through the Act. Overall these procedures require the Council to manage risk in the following ways:
by formally adopting the requirements of the Code of Practice
by the adoption of a Treasury Policy Statement and treasury management clauses within the Council’s constitution
by approving annually in advance prudential indicators for the following three years limiting
the Council’s overall borrowing
its maximum and minimum exposures to fixed and variable interest rates
its maximum and minimum exposures for the maturity structure of its debt
its maximum annual exposures to investments maturing beyond a year
by approving an investment strategy for the forthcoming year setting out its criteria for both investing and selecting investment counterparties in compliance with the government guidance
These are required to be reported and approved at or before the Council’s Council Tax setting budget. These items are reported with the annual treasury management strategy which outlines the detailed approach to managing risk in relation to the Council’s financial instrument exposure. Actual performance is also reported annually to members.
The annual treasury management strategy which incorporates the prudential indicators was approved by Council on 9
th
March 2011 and is available on the Council website. Due to the requirements of the self financing of the Housing Revenue Account updated strategies were approved by Council on 27
th September 2011 and 8
th March 2012. The key
issues within the updated strategy were:
the authorised limit for 2011/2012 was set at £126.2m. This is the maximum limit of external borrowings or other long term liabilities
the operational boundary was expected to be £101.7m. This is the expected level of debt and other long term liabilities during the year
the maximum amounts of fixed and variable interest rate exposure were set at £114.9m and £15.6m based on the Council’s debt
the maximum and minimum exposures to the maturity of debt are shown in the refinancing and maturity risk section of this note
These policies are implemented by the Council’s treasury team. The Council maintains written procedures for overall risk management, as well as written policies covering specific areas such as interest rate risk, credit risk and the investment of surplus cash through Treasury Management Practices (TMPs). These TMPs are a requirement of the Code of Practice and are reviewed regularly. Credit Risk Credit risk arises from deposits with banks and financial institutions, as well as credit exposures to the Council’s customers. This risk is minimised through the Annual Investment Strategy, which requires that deposits are not made with financial institutions unless they meet identified minimum credit criteria, in accordance with the Fitch, Moody’s and Standard & Poors Credit Rating Services. The Annual Investment Strategy also imposes a maximum amount and time to be invested with a financial institution located within each category. Deposits are not made with banks and financial institutions unless they meet the minimum requirements of the investment criteria outlined above. Additional selection criteria are also applied after this initial criterion is applied. The key areas of the Investment Strategy are that the minimum criteria for investment counterparties include:
Credit Ratings of Short Term of F1, Long Term A-,Support C and individual 3 (Fitch or equivalent rating) with the lowest available rating being applied to the criteria
UK Institutions provided with support from the UK Government
The Council’s own bank if it falls below the criteria above
‘AAA’ rated Money Market Funds
The full Investment Strategy for 2011/2012 was approved by Full Council on 9th
March 2011 and is available on the Council’s website.
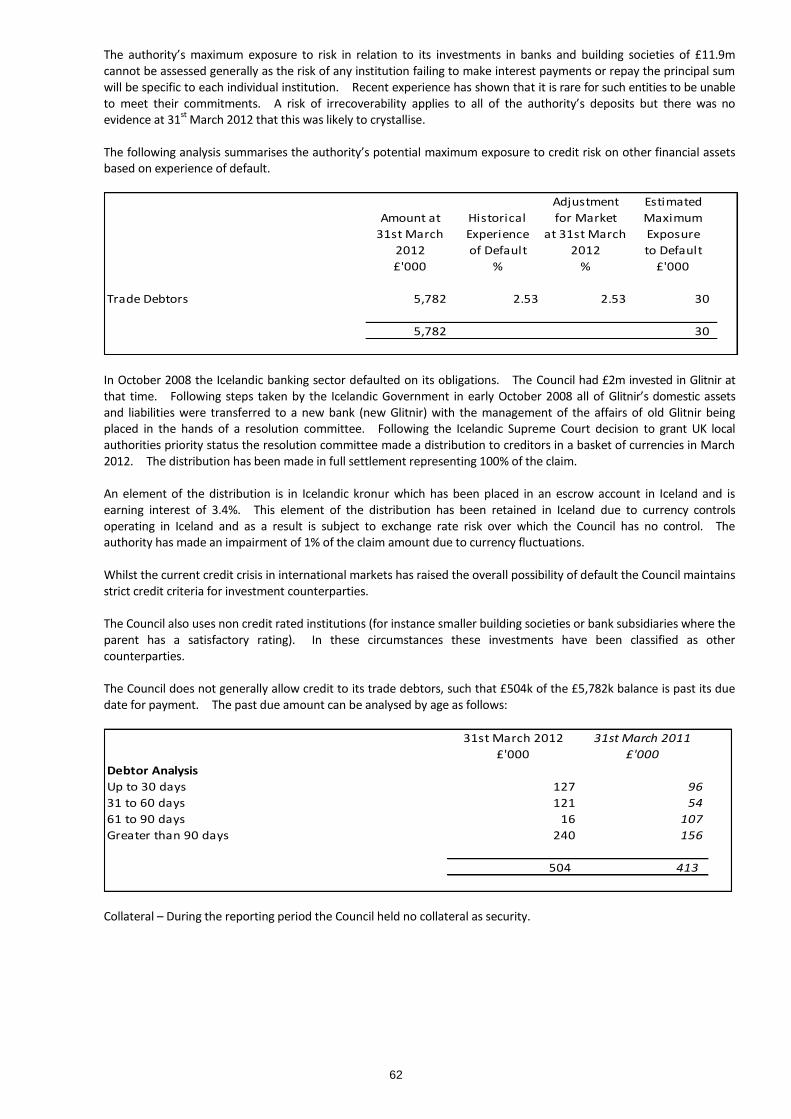
62
The authority’s maximum exposure to risk in relation to its investments in banks and building societies of £11.9m cannot be assessed generally as the risk of any institution failing to make interest payments or repay the principal sum will be specific to each individual institution. Recent experience has shown that it is rare for such entities to be unable to meet their commitments. A risk of irrecoverability applies to all of the authority’s deposits but there was no evidence at 31
st March 2012 that this was likely to crystallise.
The following analysis summarises the authority’s potential maximum exposure to credit risk on other financial assets based on experience of default.
Adjustment Estimated
Amount at Historical for Market Maximum
31st March Experience at 31st March Exposure
2012 of Default 2012 to Default
£'000 % % £'000
Trade Debtors 5,782 2.53 2.53 30
5,782 30
In October 2008 the Icelandic banking sector defaulted on its obligations. The Council had £2m invested in Glitnir at that time. Following steps taken by the Icelandic Government in early October 2008 all of Glitnir’s domestic assets and liabilities were transferred to a new bank (new Glitnir) with the management of the affairs of old Glitnir being placed in the hands of a resolution committee. Following the Icelandic Supreme Court decision to grant UK local authorities priority status the resolution committee made a distribution to creditors in a basket of currencies in March 2012. The distribution has been made in full settlement representing 100% of the claim. An element of the distribution is in Icelandic kronur which has been placed in an escrow account in Iceland and is earning interest of 3.4%. This element of the distribution has been retained in Iceland due to currency controls operating in Iceland and as a result is subject to exchange rate risk over which the Council has no control. The authority has made an impairment of 1% of the claim amount due to currency fluctuations. Whilst the current credit crisis in international markets has raised the overall possibility of default the Council maintains strict credit criteria for investment counterparties. The Council also uses non credit rated institutions (for instance smaller building societies or bank subsidiaries where the parent has a satisfactory rating). In these circumstances these investments have been classified as other counterparties. The Council does not generally allow credit to its trade debtors, such that £504k of the £5,782k balance is past its due date for payment. The past due amount can be analysed by age as follows:
31st March 2012 31st March 2011
£'000 £'000
Debtor Analysis
Up to 30 days 127 96
31 to 60 days 121 54
61 to 90 days 16 107
Greater than 90 days 240 156
504 413
Collateral – During the reporting period the Council held no collateral as security.
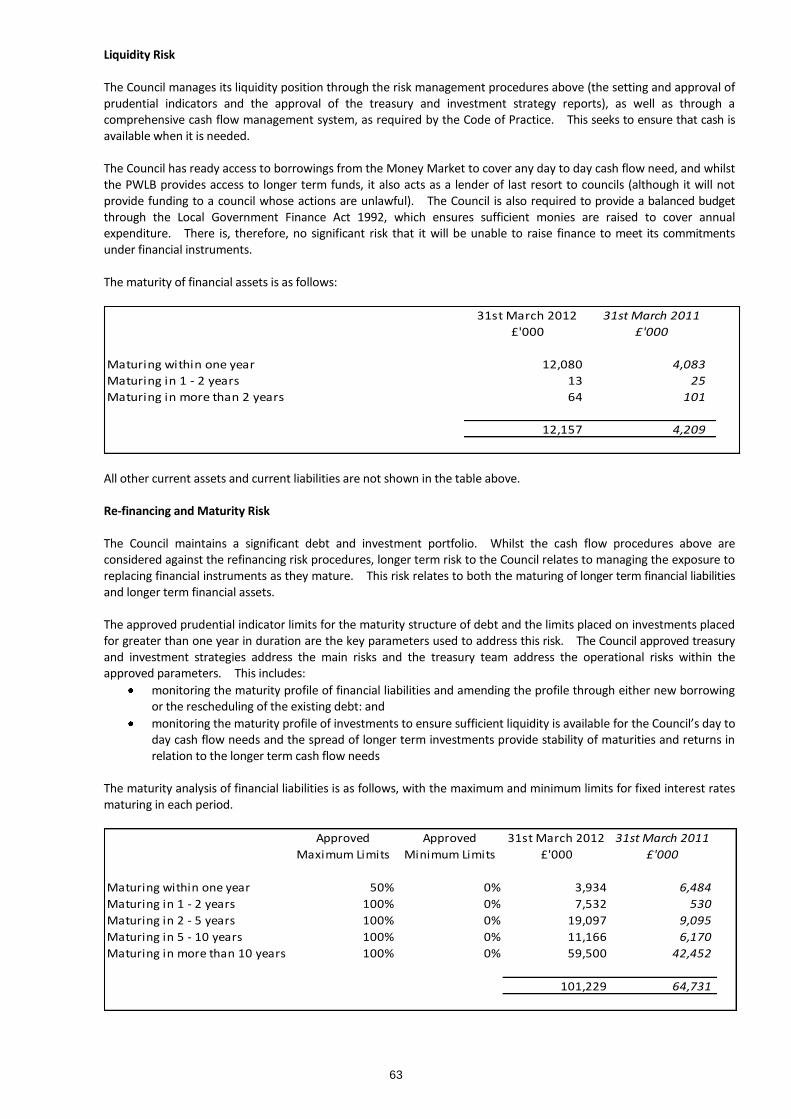
63
Liquidity Risk The Council manages its liquidity position through the risk management procedures above (the setting and approval of prudential indicators and the approval of the treasury and investment strategy reports), as well as through a comprehensive cash flow management system, as required by the Code of Practice. This seeks to ensure that cash is available when it is needed. The Council has ready access to borrowings from the Money Market to cover any day to day cash flow need, and whilst the PWLB provides access to longer term funds, it also acts as a lender of last resort to councils (although it will not provide funding to a council whose actions are unlawful). The Council is also required to provide a balanced budget through the Local Government Finance Act 1992, which ensures sufficient monies are raised to cover annual expenditure. There is, therefore, no significant risk that it will be unable to raise finance to meet its commitments under financial instruments. The maturity of financial assets is as follows:
31st March 2012 31st March 2011
£'000 £'000
Maturing within one year 12,080 4,083
Maturing in 1 - 2 years 13 25
Maturing in more than 2 years 64 101
12,157 4,209
All other current assets and current liabilities are not shown in the table above. Re-financing and Maturity Risk The Council maintains a significant debt and investment portfolio. Whilst the cash flow procedures above are considered against the refinancing risk procedures, longer term risk to the Council relates to managing the exposure to replacing financial instruments as they mature. This risk relates to both the maturing of longer term financial liabilities and longer term financial assets. The approved prudential indicator limits for the maturity structure of debt and the limits placed on investments placed for greater than one year in duration are the key parameters used to address this risk. The Council approved treasury and investment strategies address the main risks and the treasury team address the operational risks within the approved parameters. This includes:
monitoring the maturity profile of financial liabilities and amending the profile through either new borrowing or the rescheduling of the existing debt: and
monitoring the maturity profile of investments to ensure sufficient liquidity is available for the Council’s day to day cash flow needs and the spread of longer term investments provide stability of maturities and returns in relation to the longer term cash flow needs
The maturity analysis of financial liabilities is as follows, with the maximum and minimum limits for fixed interest rates maturing in each period.
Approved Approved 31st March 2012 31st March 2011
Maximum Limits Minimum Limits £'000 £'000
Maturing within one year 50% 0% 3,934 6,484
Maturing in 1 - 2 years 100% 0% 7,532 530
Maturing in 2 - 5 years 100% 0% 19,097 9,095
Maturing in 5 - 10 years 100% 0% 11,166 6,170
Maturing in more than 10 years 100% 0% 59,500 42,452
101,229 64,731

64
Market Risk Interest Rate Risk – The Council is exposed to interest rate movements on its borrowings and investments. Movements in interest rates have a complex impact on the Council, depending on how variable and fixed interest rates move across differing financial instrument periods. For instance, a rise in variable and fixed interest rates would have the following effects:
borrowings at variable rates – the interest expense changed to the Comprehensive Income and Expenditure Statement will rise
borrowings at fixed rates – the fair value of the borrowing will fall
investments at variable rates – the interest income credited to the Comprehensive Income and Expenditure Statement will rise
investments at fixed rates – the fair value of the assets will fall
Borrowings are not carried at fair value on the Balance Sheet, so nominal gains and losses on fixed rate borrowings would not impact on the Comprehensive Income and Expenditure Statement. However, changes in interest payable and receivable on variable rate borrowings and investments will be posted to the Comprehensive Income and Expenditure Statement and affect the General Fund Balance, subject to influences from Government grants. Movements in the fair value of fixed rate investments will be reflected in the Comprehensive Income and Expenditure Statement, unless the investments have been designated as Fair Value through the Comprehensive Income and Expenditure Statement, in which case gains and losses will be posted to the Comprehensive Income and Expenditure Statement.
The Council has a number of strategies for managing interest rate risk. The Annual Treasury Management Strategy draws together the Council’s prudential indicators and its expected treasury operations, including an expectation of interest rate movements. From this Strategy a prudential indicator is set which provides maximum limits for fixed and variable interest rate exposure. The treasury team will monitor market and forecast interest rates within the year to adjust exposures appropriately. For instance during periods of falling interest rates, and where economic circumstances make it favourable, fixed rate investments may be taken for longer periods to secure better long term returns, similarly the drawing of longer term fixed rates borrowing would be postponed.
The risk of interest rate loss is partially mitigated by Government grant payable on financing costs in relation to Housing Revenue Account debt.
All Council borrowings are at a fixed rate of interest.
Price risk - The Council does not invest in equity shares.
Foreign exchange risk – The Council has foreign exchange exposure resulting from an element of the settlement received from Glitnir. This is being held in Icelandic kronur in an escrow account due to the current imposition of currency controls. The value of the deposit as at 31 March was £76,959,157 kronur which, at an exchange rate of 202.95, equates to £379,203.

65
50 Financial Instruments – Balances The borrowings and investments disclosed in the balance sheet are made up of the following categories of financial
instruments:
2011/2012 2010/2011 2011/2012 2010/2011
£'000 £'000 £'000 £'000
Financial Liabilities (Principal) 97,295 58,248 3,934 6,484
Accounting adjustments 0 0 0 0
Financial Liabilities at amortised cost 97,295 58,248 3,934 6,484
Financial Liabilities at fair value 0 0 751 705
Total Borrowings 97,295 58,248 4,685 7,189
Loans and Receivables (Principal) 10 10 6,673 2,252
Accounting adjustments 0 0 (265) (265)
Loans and Receivables at amortised cost 10 10 6,408 1,987
Loans and Receivables at fair value 0 0 22 172
Total Loans and Receivables 10 10 6,430 2,159
Cash Equivalents (Principal) 0 0 5,705 2,340
Accounting adjustments 0 0 0 0
Loans and Receivables at amortised cost 0 0 5,705 2,340
Loans and Receivables at fair value 0 0 0 1
Total Cash Equivalents 0 0 5,705 2,341
Total Investments 10 10 12,135 4,500
Long Term Current
Under accounting requirements the carrying value of the financial instrument value is shown in the balance sheet which includes the principal amount borrowed or lent and further adjustments for breakage costs or stepped interest loans (measured by an effective interest rate calculation) including accrued interest. Accrued interest is shown separately in current assets/liabilities where the payments/receipts are due within one year. The effective interest rate is effectively accrued interest receivable under the instrument, adjusted for the amortisation of any premiums or discounts reflected in the purchase price.
Fair value has been measured by
Direct reference to published price quotations in an active market and/or
Estimating using a valuation technique
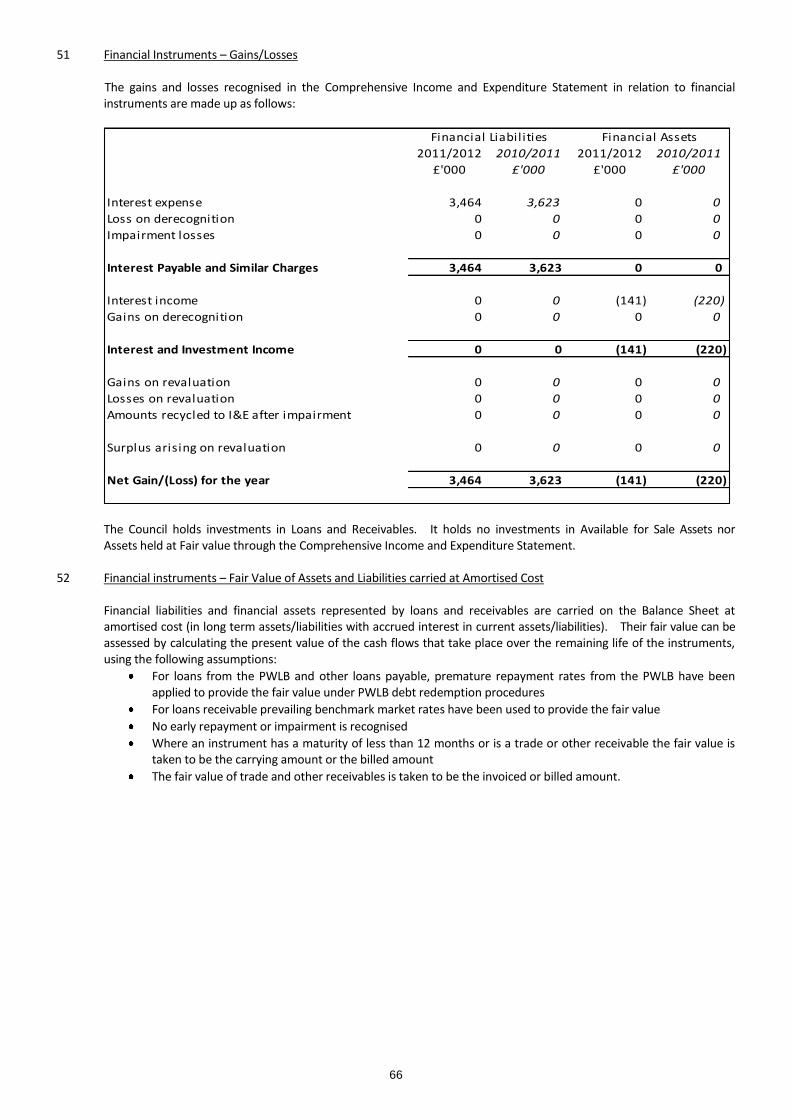
66
51 Financial Instruments – Gains/Losses
The gains and losses recognised in the Comprehensive Income and Expenditure Statement in relation to financial instruments are made up as follows:
2011/2012 2010/2011 2011/2012 2010/2011
£'000 £'000 £'000 £'000
Interest expense 3,464 3,623 0 0
Loss on derecognition 0 0 0 0
Impairment losses 0 0 0 0
Interest Payable and Similar Charges 3,464 3,623 0 0
Interest income 0 0 (141) (220)
Gains on derecognition 0 0 0 0
Interest and Investment Income 0 0 (141) (220)
Gains on revaluation 0 0 0 0
Losses on revaluation 0 0 0 0
Amounts recycled to I&E after impairment 0 0 0 0
Surplus arising on revaluation 0 0 0 0
Net Gain/(Loss) for the year 3,464 3,623 (141) (220)
Financial Liabilities Financial Assets
The Council holds investments in Loans and Receivables. It holds no investments in Available for Sale Assets nor Assets held at Fair value through the Comprehensive Income and Expenditure Statement.
52 Financial instruments – Fair Value of Assets and Liabilities carried at Amortised Cost Financial liabilities and financial assets represented by loans and receivables are carried on the Balance Sheet at
amortised cost (in long term assets/liabilities with accrued interest in current assets/liabilities). Their fair value can be assessed by calculating the present value of the cash flows that take place over the remaining life of the instruments, using the following assumptions:
For loans from the PWLB and other loans payable, premature repayment rates from the PWLB have been applied to provide the fair value under PWLB debt redemption procedures
For loans receivable prevailing benchmark market rates have been used to provide the fair value
No early repayment or impairment is recognised
Where an instrument has a maturity of less than 12 months or is a trade or other receivable the fair value is taken to be the carrying amount or the billed amount
The fair value of trade and other receivables is taken to be the invoiced or billed amount.

67
The fair values calculated are as follows:
31st March 2012 31st March 2012 31st March 2011 31st March 2011
£'000 £'000 £'000 £'000
Carrying Amount Fair value Carrying Amount Fair value
Restated Restated
Public Works Loans Board 81,756 96,058 49,194 56,486
Non PWLB debt 20,224 15,744 16,243 14,260
Total Debt 101,980 111,802 65,437 70,746
Trade Creditors 2,479 2,479 3,299 3,299
Total Financial Liabilities 104,459 114,281 68,736 74,045
Government Stock 10 10 10 10
Mansfield Crematorium 45 45 252 252
Loans and receivables greater than
one year 0 0 0 0
Loans and receivables less than
one year 12,069 12,069 4,074 4,074
Loans and receivables (principal
amount) 12,124 12,124 4,336 4,336
Accrued Interest 21 21 173 173
Total Investments 12,145 12,145 4,509 4,509
Trade Debtors 5,782 5,782 592 592
Total Loans and Receivables 17,927 17,927 5,101 5,101
The fair values for financial liabilities have been determined by reference to the Public Works Loans Board (PWLB) redemption rules and prevailing PWLB redemption rates as at each balance sheet date, and include accrued interest. The fair values for non-PWLB debt have also been calculated using the same procedures and interest rates and this provides a sound approximation for fair value for these instruments.
The fair values for loans and receivables have been determined by reference to the Public Works Loans Board (PWLB) redemption rules which provide a good approximation for the fair value of a financial instrument, and includes accrued interest. The comparator market rates prevailing have been taken from indicative investment rates at each balance sheet date. In practice rates will be determined by the size of the transaction and the counterparty, but it is impractical to use these figures, and the difference is likely to be immaterial.

68
53 Reconciliation of (Surplus)/Deficit on Provision of Services to Operating Activities Net Cash Flow
£'000 £'000 £'000 £'000
Comprehensive Income and Expenditure Statement
(Surplus)/Deficit on Provision of Services 39,329 63,377
Non Cash Transactions
Net Movement on Pensions (410) 6,206
Capital Accounting entries (7,707) (85,077)
Developers Contributions 344 (7,773) (83) (78,954)
Items on an Accruals Basis
Increase/(Decrease) in Stock (28) 12
Increase/(Decrease) in Debtors (1,606) 6,668
(Increase)/Decrease in Creditors (5,790) 2,129
(Increase)/Decrease in Provisions (1) 0
(Increase)/Decrease in Capital Receipts in Advance 0 3,758
Increase/(Decrease) in Long Term Debtors (683) (38)
Increase/(Decrease) in Assets Held for Sale 0 (8,108) (50) 12,479
Items Classified elsewhere in the Cash Flow
Net Movement on Agency Payments 9,722 (2,031)
Net Movement on Financial Instruments (42) 9,680 15 (2,016)
33,128 (5,114)
2011/2012 2010/2011

69
HOUSING REVENUE ACCOUNT
The HRA Income and Expenditure Statement shows the economic cost in the year of providing housing services in accordance with generally accepted accounting practices, rather than the amount to be funded from rents and government grants. Authorities charge rents to cover expenditure in accordance with regulations; this may be different from the accounting cost. The increase or decrease in the year, on the basis on which rents are raised, is shown in the Movement on the Housing Revenue Account Statement.
Newark and Sherwood District Council Note Year Ended Year Ended
Housing Revenue Account for 2011/2012 31st March 2012 31st March 2011
£'000 £'000
Restated
Income
Dwel l ing Rent 17,639 16,201
Garages 190 195
Shops 34 38
Gross Rental Income 17,863 16,434
Charges for Services and Faci l i ties 419 403
Contributions towards Expenditure H10 89 41
Government Subs idies H8 447 437
Other Income 377 431
19,195 17,746
Expenditure
Supervis ion and Management 4,589 4,050
Repairs and Maintenance 3,961 4,129
Rents , Rates , Taxes and Other Charges 1 1
Government Subs idy Payable H8 3,474 2,432
Sel f Financing Settlement H12 36,078 0
Depreciation of non current assets H6
On dwel l ings 2,161 2,180
On other assets 264 243
Impairment of non current assets H7
On dwel l ings 3,198 73,857
On other assets 501 (42)
Debt Management Expenses 91 64
54,318 86,914
Net Cost of HRA Services as included in the whole authority Comprehensive
Income and Expenditure Statement 35,123 69,168
(Gain)/Loss on sa le of HRA non current assets 1,635 1,278
Interest Payable and Simi lar Charges 3,032 3,113
HRA Interest and Investment Income (17) (16)
Newark and Sherwood Homes Efficiency Gain prior year repaid H11 2,104 1,947
Newark and Sherwood Homes Efficiency Gain Current Year H11 (2,551) (2,104)
(Surplus)/Deficit for the year on HRA Services 39,326 73,386

70
MOVEMENT ON THE HOUSING REVENUE ACCOUNT STATEMENT
£'000 £'000 £'000 £'000
HRA Balance brought forward 4,207 3,849
Surplus/(Deficit) on the HRA Income and Expenditure Statement (39,326) (73,386)
Adjustments between Accounting Basis and Funding Basis under Regulations
Difference between Interest Payable and Similar Charges
including amortisation of premiums and discounts (280) (137)
Self Financing Settlement 36,078 0
(Gains)/Losses on disposal of HRA Non Current Assets 1,635 1,278
Contribution to Capital 0 (17)
HRA share of contribution (to)/from the Pensions Reserve (287) (308)
Transfer to/from the Major Repairs Reserve (934) 36,212 (887) (71)
Net Increase/Decrease before transfers to/from Reserves (3,114) (73,457)
Transfer (to)/from Capital Adjustment Account 3,698 73,815
Increase/(Decrease) in year in the HRA 584 358
HRA Balance carried forward 4,791 4,207
2011/2012 2010/2011

71
NEWARK AND SHERWOOD DISTRICT COUNCIL HOUSING REVENUE ACCOUNT NOTES FOR THE YEAR 2011/2012
H1 Housing Stock
The Council was responsible for managing an average of 5,473 dwellings during 2011/2012 (5,452 2010/2011). The stock was made up as follows:
Pre 1945 1945-1964 1965-1974 1974+ Total Total
2011/2012 2010/2011
Traditional/Non Traditional Houses & Bungalows
1-2 Bedrooms 72 791 497 525 1,885 1,876
3+ Bedrooms 415 1,268 289 161 2,133 2,136
Flats
Low Rise (1-2 Storeys) 21 711 412 241 1,385 1,370
Medium Rise (3-5 Storeys) 1 4 37 28 70 70
509 2,774 1,235 955 5,473 5,452
H2 Housing Revenue Account Assets The total Balance Sheet valuations of land, houses and other property within the HRA are as follows:-
HRA Assets Existing Use - Open Market Value Balance as at Balance as at
1st April 2011 31st March 2012
£'000 £'000
Dwellings 148,192 145,849
Other Land and Buildings 5,511 5,511
Investment Properties 1,425 1,390
Community Assets 250 250
Assets Under Construction 703 1,359
Vehicle, Plant and Equipment 235 2,510
Total 156,316 156,869
The vacant possession value of dwellings within the authority’s HRA (values in accordance with the guidance) is shown below. The difference between the vacant possession value and the Balance Sheet value of dwellings within the HRA show the economic cost to the government of providing council housing at less than market rents.
Balance as at Balance as at
1st April 2011 31st March 2012
£'000 £'000
Houses 231,496 227,475
OAP Dwellings 204,362 201,493
Total 435,858 428,968
The council dwellings valuations have been arrived at using a valuation report prepared by a qualified valuer (D.J. Bingham of Herbert Button) who was instructed by the Council’s valuer. The valuation was carried out as at the 31 March 2012. They have been applied to council houses on a beacon property base whereby similar properties in similar areas are all given the same value. Property valuations have moved in line with the current domestic property market.

72
H3 Movements on the Major Repairs Reserve
As part of the HRA Subsidy calculations the Council receives resources to maintain the value of its housing stock. This is known as the Major Repairs Allowance (MRA) and is available to fund capital expenditure on HRA assets. Following provision for depreciation, a sum not less than the MRA must be transferred to the Major Repairs Reserve (MRR) to offset capital expenditure charged to the account. Unspent MRA funds may be carried over from one year to the next.
For 2011/2012 MRA reserves were partially used, with an adjusting transfer to HRA to reflect the excess of depreciation
over the MRA.
£'000
Balance Brought Forward 1st April 2011 (1,288)
Transfers to Reserve re Depreciation 2011/2012:
Dwellings (2,161)
Non Dwellings (264)
Transfers to the HRA 2011/2012
Excess of Depreciation (934)
Amounts used to finance Capital Expenditure 4,638
Balance Carried Forward 31st March 2012 (9)
H4 Capital Expenditure and Financing
2011/2012
£'000
Roofing Works 335
Structural Maintenance 55
Community Security and Safety 174
Kitchens and Bathrooms 530
External Works 602
Disabled Facilities Provision 415
Heating Systems 553
Environmental Works 233
PV Units 2,351
Affordable Housing 1,270
Other Works 238
6,756
Financing
Internal Borrowing 0
Government Grants 606
Contributions 1,356
Major Repairs Reserve 4,638
Capital Provision 156
6,756

73
H5 Capital Receipts
2011/2012
£'000
Land 0
Sold Council Houses 266
Less admin costs (sale of Council Houses) (12)
Repaid Discounts 0
Principal Mortgage Repayments 12
Sub total 266
Less paid to the Government 'pool' (183)
83
Under the Local Government and Housing Act 1989 as amended, the Council has to reserve 75% of council house sales receipts and 50% of other housing receipts. Reserved capital receipts are paid over to the Government as part of the ‘pooling’ regulations.
H6 Depreciation Charges The total charges for depreciation for land, houses and other property within the authority’s HRA are as follows:
2011/2012
£'000
Dwellings 2,161
Land and Buildings 185
Vehicles, Plant and Equipment 79
2,425
H7 Impairment Charges Impairment charges for the financial year in respect of land, houses or other property within the authority’s HRA are
shown in the table below.
HRA Assets Impairment Charges Charges
2011/2012
£'000
Dwellings:
Impairment Gain 0
Impairment Loss 3,198
Other Land and Buildings
Impairment Gain 0
Impairment Loss 501
Total 3,699

74
H8 HRA Subsidy Payable for the Authority
2011/2012
£'000
Management and Maintenance 7,718
Major Repairs Allowance 3,359
Charges for Capital 3,475
Admissible Allowance 0
Interest on Receipts (1)
Guideline Rent Income (17,604)
Total HRA Subsidy (Due to CLG) (3,053)
Less rental constraint allowance (421)
Net subsidy payable to CLG (3,474)
H9 Rent Arrears
The total amount of rent arrears as at 31st March 2012 was £314,438 (2010/2011 £312,121). Included in the doubtful
debt provision is the amount of £139,842 relating to rent arrears. H10 Contributions towards Expenditure The income of £89,353 (£40,935 in 2010/2011) relates to contributions to the Housing Revenue Account from the
General Fund for the upkeep of communal amenities. H11 Arms Length Management
The Housing Revenue Account includes a £7.92m management fee paid to Newark and Sherwood Homes Ltd (2010/2011 £7.65m) to manage the housing stock owned by the Council, under arms length arrangements. This management agreement came into effect on 1st
November 2004.
In line with the management agreement Newark and Sherwood Homes Ltd has to pay to the Council an amount known as the Efficiency gain which for 2011/12 amounted to £2,551,000 (2010/11 £2,104,000). This is calculated from NSH’s 2011/2012 final account surplus after tax. This amount is then advanced back to NSH by the Council on the 1
st April
2012.
H12 HRA Self Financing
On 1 April 2012 the reform of council house finance, known as self financing, will be implemented, as legislated in the Localism Act 2011. The Council will be able to retain the rental income from its housing stock but has also had to take on more debt, being a one off settlement of £36.1m. Government decreed that all debt transactions would be undertaken on 28 March 2012.
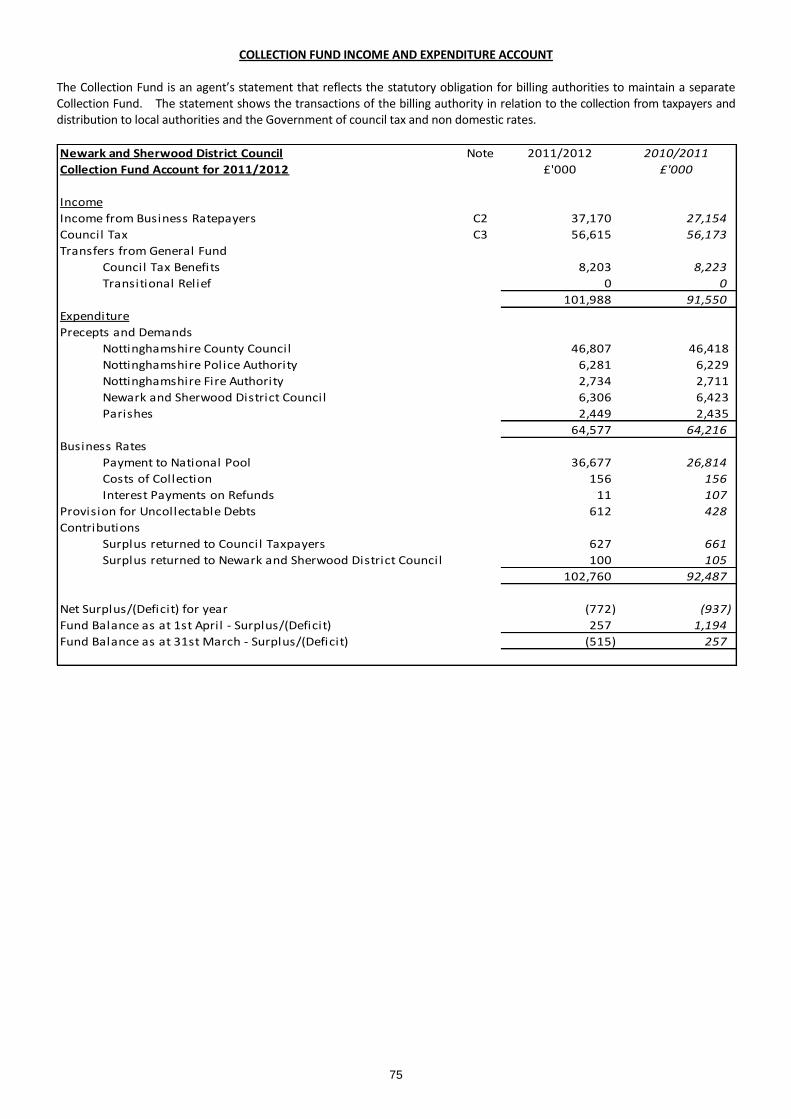
75
COLLECTION FUND INCOME AND EXPENDITURE ACCOUNT
The Collection Fund is an agent’s statement that reflects the statutory obligation for billing authorities to maintain a separate Collection Fund. The statement shows the transactions of the billing authority in relation to the collection from taxpayers and distribution to local authorities and the Government of council tax and non domestic rates.
Newark and Sherwood District Council Note 2011/2012 2010/2011
Collection Fund Account for 2011/2012 £'000 £'000
Income
Income from Business Ratepayers C2 37,170 27,154
Council Tax C3 56,615 56,173
Transfers from General Fund
Council Tax Benefits 8,203 8,223
Transitional Relief 0 0
101,988 91,550
Expenditure
Precepts and Demands
Nottinghamshire County Council 46,807 46,418
Nottinghamshire Police Authority 6,281 6,229
Nottinghamshire Fire Authority 2,734 2,711
Newark and Sherwood District Council 6,306 6,423
Parishes 2,449 2,435
64,577 64,216
Business Rates
Payment to National Pool 36,677 26,814
Costs of Collection 156 156
Interest Payments on Refunds 11 107
Provision for Uncollectable Debts 612 428
Contributions
Surplus returned to Council Taxpayers 627 661
Surplus returned to Newark and Sherwood District Council 100 105
102,760 92,487
Net Surplus/(Deficit) for year (772) (937)
Fund Balance as at 1st April - Surplus/(Deficit) 257 1,194
Fund Balance as at 31st March - Surplus/(Deficit) (515) 257

76
NEWARK AND SHERWOOD DISTRICT COUNCIL COLLECTION FUND NOTES FOR THE YEAR 2011/2012 C1 Accounting Policies
(a) Revenue Support Grant and amounts distributed from the NDR national pool are paid directly to all billing and precepting authorities and will be included within Taxation and Non Specific Grant Income on the Comprehensive Income and Expenditure Statement.
(b) Parish precepts are paid from the General Fund of billing authorities and will be included within Other Operating Expenditure on the Comprehensive Income and Expenditure Statement.
(c) The year-end surplus of £x on the Collection Fund is distributed between billing and precepting authorities on the basis of estimates, made on 15 January, of the year-end balance.
C2 Income from Business Rates
Under the arrangements regarding Uniform Business Rates, the Council collects non domestic rates for its area which are based on local rateable values multiplied by a uniform rate which for 2011/2012 was 43.3p (2010/2011 41.4p). Small Business Rate Relief reduces the multiplier to 42.6p where it applies. The total amount, less certain reliefs and other deductions, is paid to a central pool (the NDR pool) managed by Central Government, which in turn pays back to authorities General Funds their share of the pool based on a standard amount per head of the local population. The non-domestic rateable value at the 31st March 2012 was £94,972,587 (31st March 2011 £80,012,693).
C3 Council Tax
Council Tax is set by calculating the Council Tax base, and then dividing this into the precepts levied by the district, county, parish councils, Nottinghamshire Fire Authority and Nottinghamshire Police Authority. The tax base is the amount that setting a Council Tax of £1 for Band D properties (the standard band) would raise in revenue. The methodology and the factors taken into consideration are complex and are reported in detail when the tax base is set by the Council in December or January. The Council Tax base for 2011/2012 is as follows:
Adjusted for 2011/2012 2010/2011
Discounts, Disabled Adjusted for
Total Relief and Band D Non
Band Dwellings Exemptions Equivalents Collection
A 21,838.00 9,325.50 12,512.50 12,418.65 12,292.25
B 7,662.00 2,409.40 5,252.60 5,213.21 5,249.97
C 8,197.00 1,607.30 6,589.70 6,540.28 6,441.73
D 5,502.00 409.30 5,092.70 5,054.50 5,016.53
E 3,833.00 (539.00) 4,372.00 4,339.21 4,316.89
F 2,451.00 (910.80) 3,361.80 3,336.59 3,289.77
G 1,366.00 (779.30) 2,145.30 2,129.21 2,086.72
H 122.00 (77.40) 199.40 197.90 208.79
Total 50,971.00 11,445.00 39,526.00 39,229.55 38,902.65

77
NEWARK AND SHERWOOD DISTRICT COUNCIL GROUP CONSOLIDATED ACCOUNTS INTRODUCTION The authority is required under the Local Government Act 2003 to produce a set of Group accounts where it has subsidiaries, joint ventures or associates. The criteria for deciding if the authority has such relationships is laid down by the Code of Practice on Local Authority Accounting in the United Kingdom 2011/12 Based on International Financial Reporting Standards (referred to within these accounts as “the Code”). The Code has been developed to bring authority accounts in line with the International Financial Reporting Standards (IFRS) which other reporting bodies have to comply with and to assist users of the accounts to understand better the authority’s overall financial position. The authority has undertaken a review of all its relationships with other bodies and is required to consolidate its accounts with Newark and Sherwood Homes Ltd (NSH), which is a wholly owned subsidiary of the authority, using the merger method. NSH manages the housing stock owned by the Council, under an arms length arrangement. The Housing Revenue Account includes a management fee paid to NSH to manage the stock owned by the Council under arms length arrangements. This management agreement came into effect on 1 November 2004. Newark and Sherwood Homes Ltd produce a set of company accounts with a year end of 31 March. The accounts for 2011/2012, which have been consolidated here, have been audited by NSH’s auditors and have been given an unqualified audit. Newark and Sherwood Homes Ltd publish an Annual Report which may be viewed at their offices at Kelham Hall, Kelham, Newark on Trent, Notts, NG23 5QX. The company is limited by guarantee and does not have any share capital. ACCOUNTING POLICIES The following notes detail any variations from the accounting policies used by the authority and should be read in conjunction with the relevant notes within the authority’s accounts. The consolidation has been done on a merger basis as NSH is 100% owned by NSDC. Taxation
NSH is subject to a charge for taxation which is based on the result for the year and takes into account taxation deferred because of timing differences between the treatment of certain items for taxation and accounting purposes. Except where otherwise required full provision is made without discounting in respect of all timing differences which have arisen but not reversed by the Balance Sheet date, except as otherwise required by IAS 12.

78
GROUP MOVEMENT IN RESERVES STATEMENT Newark and Sherwood District Council Group Accounts General Earmarked Hous ing Major Grants & Capita l Total Unusable Total
Movement in Reserves Statement for the year 2011/2012 Fund GF Revenue Repairs Contributions Receipts Usable Reserves Authori ty
Balance Reserves Account Reserve Unappl ied Reserve Reserves Reserves
£'000 £'000 £'000 £'000 £'000 £'000 £'000 £'000 £'000
Balance at 31 March 2011 2,320 8,038 4,207 1,288 5,665 5,993 27,511 76,660 104,171
Movement in Reserve during 2011/2012
Surplus/(Defici t) on Provis ion of Services (3) (39,326) (39,329) (39,329)
Other Comprehens ive Expenditure and Income 0 (15,835) (15,835)
Total Comprehensive Expenditure and Income (3) 0 (39,326) 0 0 0 (39,329) (15,835) (55,164)
Adjustments between Group accounts and Authori ty accounts (173) (173) (173)
Net Increase/(Decrease) before Transfers (3) 0 (39,499) 0 0 0 (39,502) (15,835) (55,337)
Adjustments between Accounting bas is and Funding bas is under Regulations
Depreciation and impairment of non current assets 2,755 3,698 6,453 (6,453) 0
Excess of depreciation charged to HRA services over the Major
Repairs Al lowance (2,213) (2,213) 2,213 0
Reversa l of Major Repairs Al lowance credited to HRA 1,279 (1,279) 0 0
Capita l grants and contributions (2,856) (273) (3,129) 3,129 0
Capita l receipts used to finance capita l expenditure (143) (143) 143 0
Revenue expenditure funded from capita l under s tatute 804 804 (804) 0
Net ga in/loss on sa le of non current assets 1,635 292 1,927 (1,927) 0
Amount by which finance costs are di fferent 111 (280) (169) 169 0
Amount by which pens ion costs are di fferent 697 (287) 410 (410) 0
Counci l Tax income adjustment 106 106 (106) 0
Statutory provis ion for repayment of debt (237) (237) 237 0
Capita l expenditure charged to the General Fund balance (30) (30) 30 0
Transfer to unusable reserves (12) 173 161 (161) 0
Transfer re Hous ing Pooled Receipts 183 (183) 0 0
Sel f Financing Charge 36,078 36,078 (36,078) 0
1,521 0 40,083 (1,279) (273) (34) 40,018 (40,018) 0
Net Increase/(Decrease) before Transfers to Earmarked Reserves 1,518 0 584 (1,279) (273) (34) 516 (55,853) (55,337)
Net transfer to from earmarked reserves (1,112) 1,084 (221) (249) 249 0
Increase/(Decrease) in year 406 1,084 584 (1,279) (494) (34) 267 (55,604) (55,337)
Balance at 31 March 2012 carried forward 2,726 9,122 4,791 9 5,171 5,959 27,778 21,056 48,834

79
Newark and Sherwood District Council Group Accounts General Earmarked Hous ing Major Grants & Capita l Total Unusable Total
Movement in Reserves Statement for the year 2010/2011 Fund GF Revenue Repairs Contributions Receipts Usable Reserves Authori ty
Balance Reserves Account Reserve Unappl ied Reserve Reserves Reserves
£'000 £'000 £'000 £'000 £'000 £'000 £'000 £'000 £'000
Restated Restated
Balance at 31 March 2010 2,211 7,335 3,849 0 4,366 927 18,688 122,412 141,100
Movement in Reserve during 2010/2011
Surplus/(Defici t) on Provis ion of Services 10,009 (73,386) (63,377) (63,377)
Other Comprehens ive Expenditure and Income 0 25,675 25,675
Total Comprehensive Expenditure and Income 10,009 0 (73,386) 0 0 0 (63,377) 25,675 (37,702)
Adjustments between Group accounts and Authori ty accounts 773 773 773
Net Increase/(Decrease) before Transfers 10,009 0 (72,613) 0 0 0 (62,604) 25,675 (36,929)
Adjustments between Accounting bas is and Funding bas is under Regulations
Depreciation and impairment of non current assets 1,971 73,816 75,787 (75,787) 0
Excess of depreciation charged to HRA services over the Major
Repairs Al lowance 401 401 (401) 0
Reversa l of Major Repairs Al lowance credited to HRA (1,288) 1,288 0 0
Capita l grants and contributions (5,832) 1,216 (721) (5,337) 5,337 0
Movement in Donated Assets (16) (16) 16 0
Revenue expenditure funded from capita l under s tatute 845 845 (845) 0
Net ga in/loss on sa le of non current assets (285) 1,278 6,047 7,040 (7,040) 0
Amount by which finance costs are di fferent 49 (138) (89) 89 0
Amount by which pens ion costs are di fferent (5,898) (308) (6,206) 6,206 0
Counci l Tax income adjustment 127 127 (127) 0
Statutory provis ion for repayment of debt (276) (276) 276 0
Capita l expenditure charged to the General Fund balance (61) (17) (78) 78 0
Transfer to unusable reserves 2 (773) (771) 771 0
Transfer re Hous ing Pooled Receipts 260 (260) 0 0 0
(9,114) 0 72,971 1,288 1,216 5,066 71,427 (71,427) 0
Net Increase/(Decrease) before Transfers to Earmarked Reserves 895 0 358 1,288 1,216 5,066 8,823 (45,752) (36,929)
Net transfer to from earmarked reserves (786) 703 83 0 0 0
Increase/(Decrease) in year 109 703 358 1,288 1,299 5,066 8,823 (45,752) (36,929)
Balance at 31 March 2011 carried forward 2,320 8,038 4,207 1,288 5,665 5,993 27,511 76,660 104,171
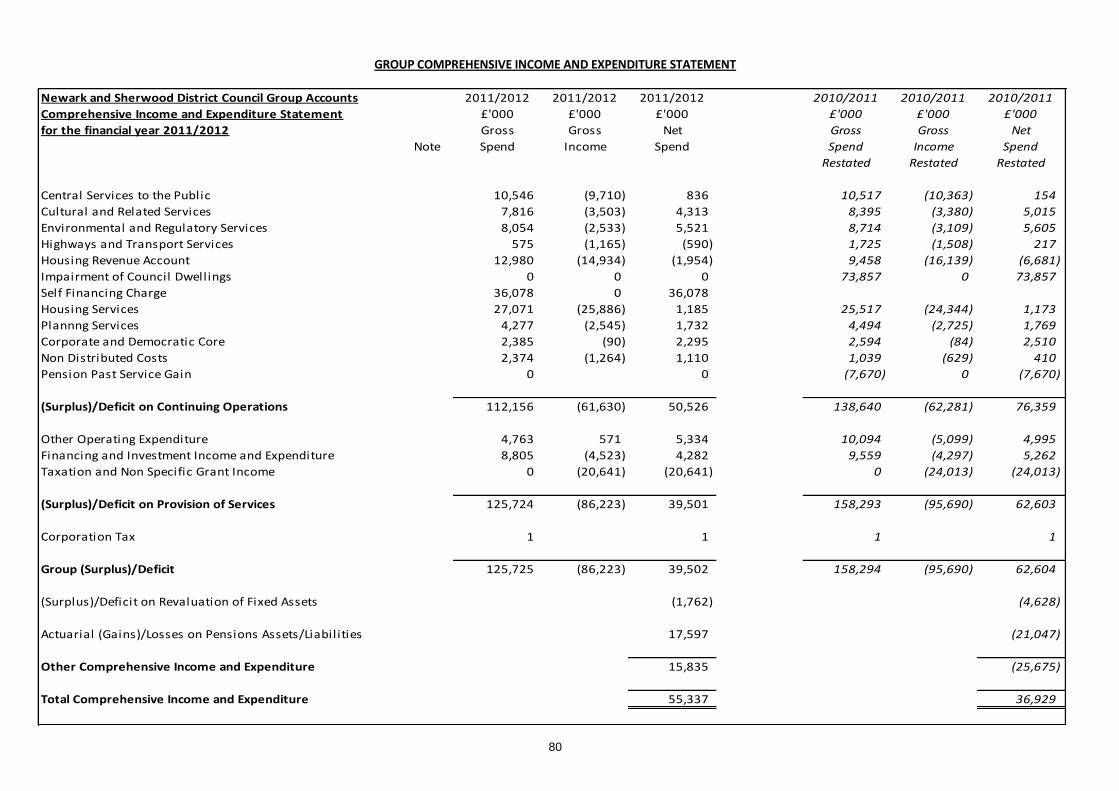
80
GROUP COMPREHENSIVE INCOME AND EXPENDITURE STATEMENT
Newark and Sherwood District Council Group Accounts 2011/2012 2011/2012 2011/2012 2010/2011 2010/2011 2010/2011
Comprehensive Income and Expenditure Statement £'000 £'000 £'000 £'000 £'000 £'000
for the financial year 2011/2012 Gross Gross Net Gross Gross Net
Note Spend Income Spend Spend Income Spend
Restated Restated Restated
Central Services to the Public 10,546 (9,710) 836 10,517 (10,363) 154
Cultural and Related Services 7,816 (3,503) 4,313 8,395 (3,380) 5,015
Environmental and Regulatory Services 8,054 (2,533) 5,521 8,714 (3,109) 5,605
Highways and Transport Services 575 (1,165) (590) 1,725 (1,508) 217
Housing Revenue Account 12,980 (14,934) (1,954) 9,458 (16,139) (6,681)
Impairment of Council Dwellings 0 0 0 73,857 0 73,857
Self Financing Charge 36,078 0 36,078
Housing Services 27,071 (25,886) 1,185 25,517 (24,344) 1,173
Plannng Services 4,277 (2,545) 1,732 4,494 (2,725) 1,769
Corporate and Democratic Core 2,385 (90) 2,295 2,594 (84) 2,510
Non Distributed Costs 2,374 (1,264) 1,110 1,039 (629) 410
Pension Past Service Gain 0 0 (7,670) 0 (7,670)
(Surplus)/Deficit on Continuing Operations 112,156 (61,630) 50,526 138,640 (62,281) 76,359
Other Operating Expenditure 4,763 571 5,334 10,094 (5,099) 4,995
Financing and Investment Income and Expenditure 8,805 (4,523) 4,282 9,559 (4,297) 5,262
Taxation and Non Specific Grant Income 0 (20,641) (20,641) 0 (24,013) (24,013)
(Surplus)/Deficit on Provision of Services 125,724 (86,223) 39,501 158,293 (95,690) 62,603
Corporation Tax 1 1 1 1
Group (Surplus)/Deficit 125,725 (86,223) 39,502 158,294 (95,690) 62,604
(Surplus)/Deficit on Revaluation of Fixed Assets (1,762) (4,628)
Actuarial (Gains)/Losses on Pensions Assets/Liabilities 17,597 (21,047)
Other Comprehensive Income and Expenditure 15,835 (25,675)
Total Comprehensive Income and Expenditure 55,337 36,929
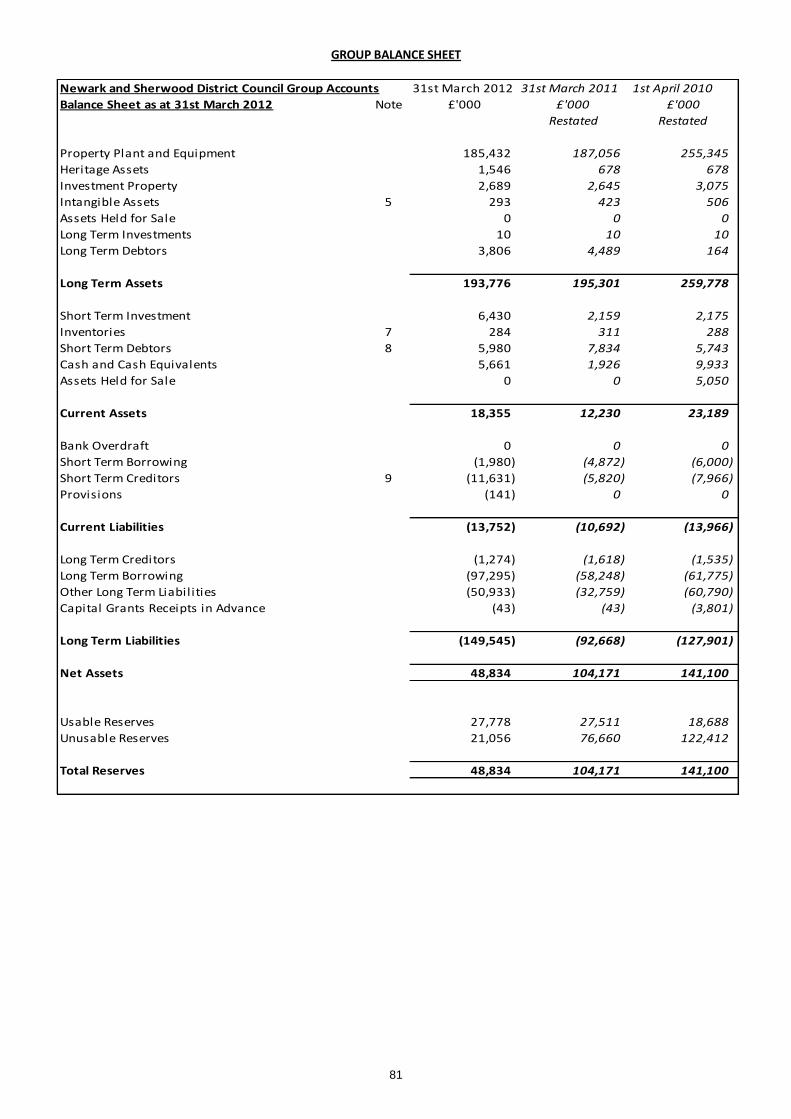
81
GROUP BALANCE SHEET
Newark and Sherwood District Council Group Accounts 31st March 2012 31st March 2011 1st April 2010
Balance Sheet as at 31st March 2012 Note £'000 £'000 £'000
Restated Restated
Property Plant and Equipment 185,432 187,056 255,345
Heritage Assets 1,546 678 678
Investment Property 2,689 2,645 3,075
Intangible Assets 5 293 423 506
Assets Held for Sale 0 0 0
Long Term Investments 10 10 10
Long Term Debtors 3,806 4,489 164
Long Term Assets 193,776 195,301 259,778
Short Term Investment 6,430 2,159 2,175
Inventories 7 284 311 288
Short Term Debtors 8 5,980 7,834 5,743
Cash and Cash Equivalents 5,661 1,926 9,933
Assets Held for Sale 0 0 5,050
Current Assets 18,355 12,230 23,189
Bank Overdraft 0 0 0
Short Term Borrowing (1,980) (4,872) (6,000)
Short Term Creditors 9 (11,631) (5,820) (7,966)
Provisions (141) 0 0
Current Liabilities (13,752) (10,692) (13,966)
Long Term Creditors (1,274) (1,618) (1,535)
Long Term Borrowing (97,295) (58,248) (61,775)
Other Long Term Liabilities (50,933) (32,759) (60,790)
Capital Grants Receipts in Advance (43) (43) (3,801)
Long Term Liabilities (149,545) (92,668) (127,901)
Net Assets 48,834 104,171 141,100
Usable Reserves 27,778 27,511 18,688
Unusable Reserves 21,056 76,660 122,412
Total Reserves 48,834 104,171 141,100

82
GROUP CASH FLOW STATEMENT
Newark and Sherwood District Council Group Accounts
Cash Flow Statement for the year 2011/2012 Note £'000 £'000 £'000 £'000
Operating Activities 11
Newark and Sherwood District Council 33,128 (5,114)
Newark and Sherwood Homes Ltd (529) 32,599 (198) (5,312)
Cash (Inflow)/Outflow from taxation 1 1
Investing Activities
Cash outflows
Purchase of Fixed Assets 8,050 13,184
Cash inflows
Sale of Fixed Assets (304) (6,047)
Capital Grants Received (2,856) (1,058)
Other Capital Cash Income 330 579
(2,830) (6,526)
Investing Activities Net Cash Flow 5,220 6,658
Financing Activities
Cash outflows
Repayments of Amounts Borrowed 16,356 14,889
Agency Payments (9,722) 2,031
Capital Element of Finance Lease Rentals 6 5
6,640 16,925
Cash inflows
Repayment of investments 4,659 393
New Loans Raised (52,854) (10,658)
(48,195) (10,265)
Financing Activities Net Cash Flow (41,555) 6,660
Net Increase/(Decrease) in Cash and Cash Equivalents (3,735) 8,007
Cash and Cash Equivalents at 1 April
Cash (55) 52
Bank Accounts (360) 252
Cash Equivalents 2,341 1,926 9,629 9,933
Cash and Cash Equivalents at 31 March
Cash 73 (55)
Bank Accounts (117) (360)
Cash Equivalents 5,705 5,661 2,341 1,926
2011/2012 2010/2011
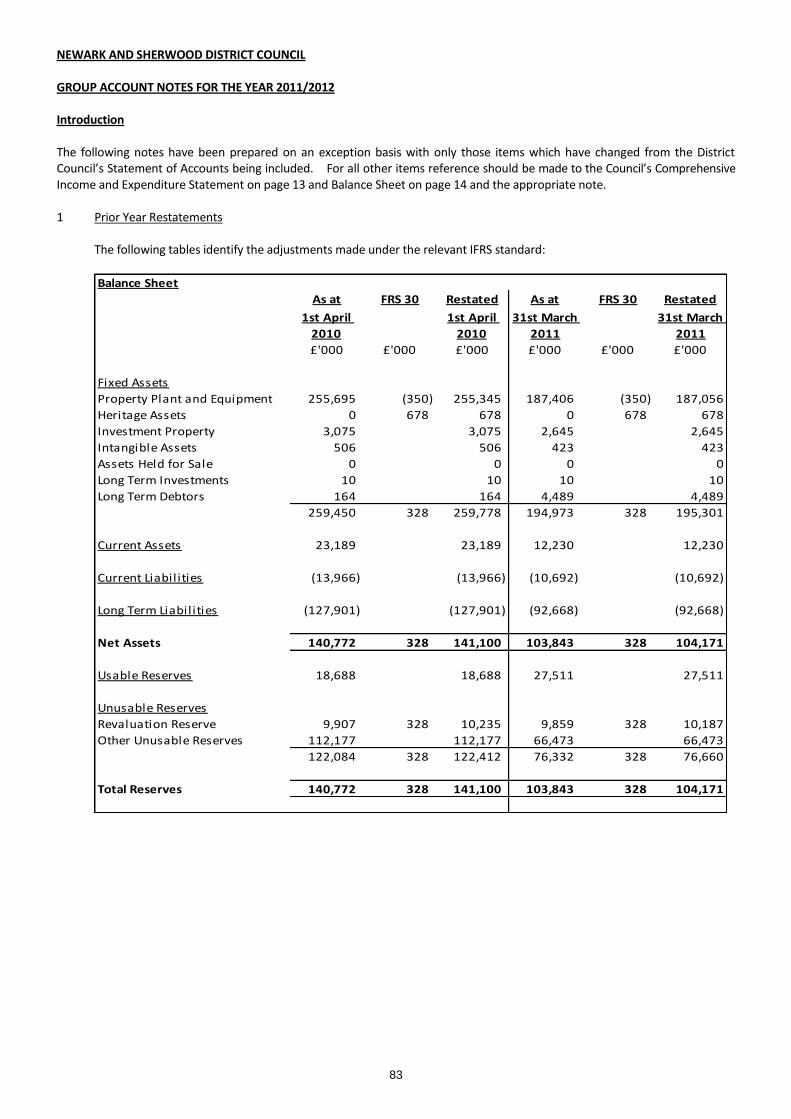
83
NEWARK AND SHERWOOD DISTRICT COUNCIL GROUP ACCOUNT NOTES FOR THE YEAR 2011/2012 Introduction The following notes have been prepared on an exception basis with only those items which have changed from the District Council’s Statement of Accounts being included. For all other items reference should be made to the Council’s Comprehensive Income and Expenditure Statement on page 13 and Balance Sheet on page 14 and the appropriate note. 1 Prior Year Restatements
The following tables identify the adjustments made under the relevant IFRS standard:
Balance Sheet
As at FRS 30 Restated As at FRS 30 Restated
1st April
2010
1st April
2010
31st March
2011
31st March
2011
£'000 £'000 £'000 £'000 £'000 £'000
Fixed Assets
Property Plant and Equipment 255,695 (350) 255,345 187,406 (350) 187,056
Heritage Assets 0 678 678 0 678 678
Investment Property 3,075 3,075 2,645 2,645
Intangible Assets 506 506 423 423
Assets Held for Sale 0 0 0 0
Long Term Investments 10 10 10 10
Long Term Debtors 164 164 4,489 4,489
259,450 328 259,778 194,973 328 195,301
Current Assets 23,189 23,189 12,230 12,230
Current Liabilities (13,966) (13,966) (10,692) (10,692)
Long Term Liabilities (127,901) (127,901) (92,668) (92,668)
Net Assets 140,772 328 141,100 103,843 328 104,171
Usable Reserves 18,688 18,688 27,511 27,511
Unusable Reserves
Revaluation Reserve 9,907 328 10,235 9,859 328 10,187
Other Unusable Reserves 112,177 112,177 66,473 66,473
122,084 328 122,412 76,332 328 76,660
Total Reserves 140,772 328 141,100 103,843 328 104,171

84
Comprehensive Income and Expenditure Statement
Service Reporting Code of Practice
Gross Gross Net Gross Gross Net Gross Gross Net
Spend Income Spend Spend Income Spend Spend Income Spend
£'000 £'000 £'000 £'000 £'000 £'000 £'000 £'000 £'000
Central Services to the Public 10,517 (10,363) 154 0 10,517 (10,363) 154
Cultural, Environmental, Regulatory and
Planning Services
21,603 (9,214) 12,389 (21,603) 9,214 (12,389) 0 0 0
Cultural and Related Services 0 0 0 8,395 (3,380) 5,015 8,395 (3,380) 5,015
Environmental and Regulatory Services 0 0 0 8,714 (3,109) 5,605 8,714 (3,109) 5,605
Highways and Transport Services 1,725 (1,508) 217 0 1,725 (1,508) 217
Housing Revenue Account 9,458 (16,139) (6,681) 0 9,458 (16,139) (6,681)
Impairment of Council Dwellings 73,857 0 73,857 0 73,857 0 73,857
Housing Services 25,517 (24,344) 1,173 0 25,517 (24,344) 1,173
Planning Services 0 0 0 4,494 (2,725) 1,769 4,494 (2,725) 1,769
Corporate and Democratic Core 2,594 (84) 2,510 0 2,594 (84) 2,510
Non Distributed Costs 1,039 (629) 410 0 1,039 (629) 410
Pension Past Service Gain (7,670) 0 (7,670) 0 (7,670) 0 (7,670)
Surplus/Deficit on Continuing Operations 138,640 (62,281) 76,359 0 0 0 138,640 (62,281) 76,359
Other Operating Expenditure 10,094 (5,099) 4,995 0 10,094 (5,099) 4,995
Financing and Investment Income and
Expenditure
9,559 (4,297) 5,262 0 9,559 (4,297) 5,262
Taxation and Non Specific Grant Income 0 (24,013) (24,013) 0 0 (24,013) (24,013)
Surplus/Deficit on Provision of Services 158,293 (95,690) 62,603 0 0 0 158,293 (95,690) 62,603
Corporation Tax 1 1 1 1
158,294 (95,690) 62,604 158,294 (95,690) 62,604
(Surplus)/Deficit on Revaluation of Non Current Assets (4,628) (4,628)
Actuarial (Gains)/Losses on Pensions Assets/Liabilities (21,047) (21,047)
Other Comprehensive Income and Expenditure (25,675) (25,675)
Total Comprehensive Income and Expenditure 36,929 36,929
2010/2011 Restated 2010/2011

85
2 Inter Company Transactions
The Group Accounts exclude transactions between the two organisations; this ensures that expenditure and income is only reflected once within the accounts. The elements of the accounts adjusted for inter company transactions are detailed below.
Comprehensive Income and Expenditure Statement
NSDC NSH 2011/2012
Adjusted Adjusted Group
£'000 £'000 £'000
(Surplus)/Deficit on Continuing Operations 45,304 5,222 50,526
Other Operating Expenditure 5,334 0 5,334
Financing and Investment Income and Expenditure 4,311 (29) 4,282
(Surplus)/Deficit on Provision of Services 34,308 5,193 39,501
Balance Sheet
NSDC NSH Adjustment 2011/2012
Group
£'000 £'000 £'000 £'000
Short Term Debtors 8,534 461 (3,015) 5,980
Cash and Cash Equivalents 5,629 2,737 (2,705) 5,661
Short Term Borrowing (4,685) 2,705 (1,980)
Short Term Creditors (11,156) (3,490) 3,015 (11,631)
3 Reconciliation of the Single Entity (Surplus)/Deficit to the Group (Surplus)/Deficit
2011/2012 2010/2011
(Surplus)/Deficit on the Council's Comprehensive Income and
Expenditure Statement
39,329 63,377
Adjustments for transactions with other Group entities (5,021) (4,962)
(Surplus)/Deficit in the Group Comprehensive Income and
Expenditure 34,308 58,415
Statement attributable to the Council
(Surplus)/Deficit in the Group Comprehensive Income and
Expenditure Statement attributable to Group Subsidiaries
(adjusted for intra group transactions) 5,194 4,188
(Surplus)/Deficit for the year on the Group Comprehensive Income
and Expenditure Statement 39,502 62,603
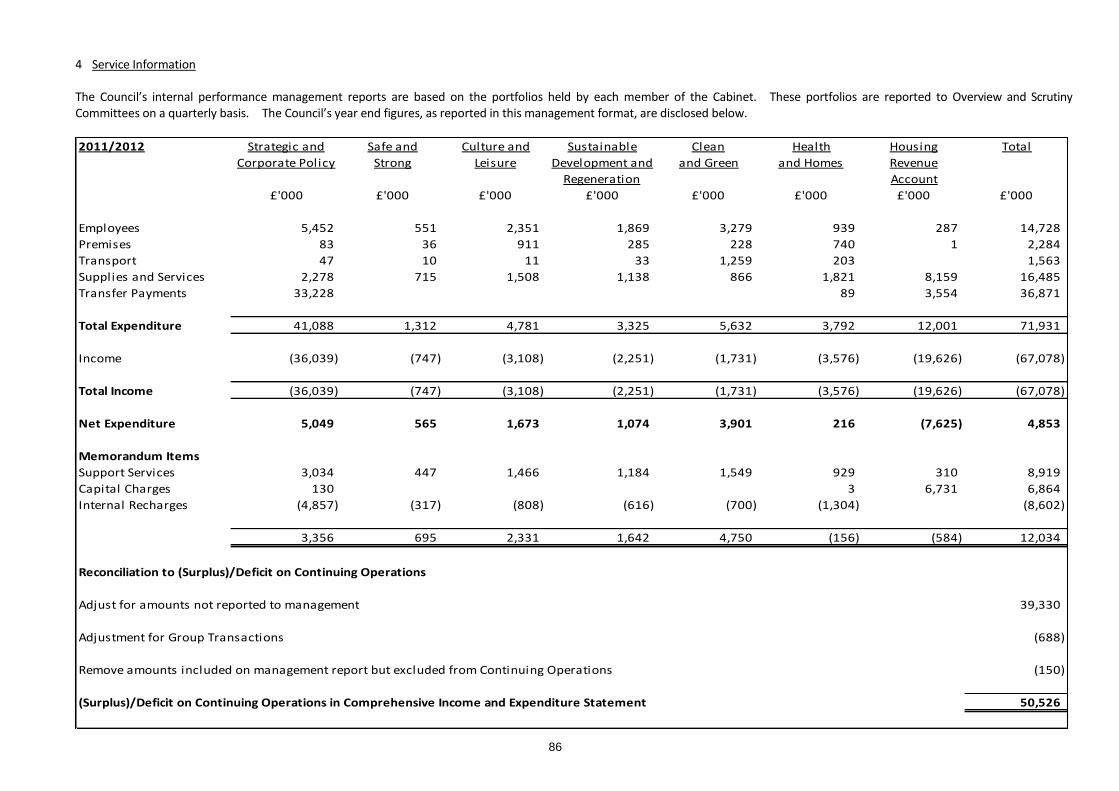
86
4 Service Information
The Council’s internal performance management reports are based on the portfolios held by each member of the Cabinet. These portfolios are reported to Overview and Scrutiny Committees on a quarterly basis. The Council’s year end figures, as reported in this management format, are disclosed below.
2011/2012 Strategic and Safe and Culture and Sustainable Clean Health Housing Total
Corporate Policy Strong Leisure Development and and Green and Homes Revenue
Regeneration Account
£'000 £'000 £'000 £'000 £'000 £'000 £'000 £'000
Employees 5,452 551 2,351 1,869 3,279 939 287 14,728
Premises 83 36 911 285 228 740 1 2,284
Transport 47 10 11 33 1,259 203 1,563
Supplies and Services 2,278 715 1,508 1,138 866 1,821 8,159 16,485
Transfer Payments 33,228 89 3,554 36,871
Total Expenditure 41,088 1,312 4,781 3,325 5,632 3,792 12,001 71,931
Income (36,039) (747) (3,108) (2,251) (1,731) (3,576) (19,626) (67,078)
Total Income (36,039) (747) (3,108) (2,251) (1,731) (3,576) (19,626) (67,078)
Net Expenditure 5,049 565 1,673 1,074 3,901 216 (7,625) 4,853
Memorandum Items
Support Services 3,034 447 1,466 1,184 1,549 929 310 8,919
Capital Charges 130 3 6,731 6,864
Internal Recharges (4,857) (317) (808) (616) (700) (1,304) (8,602)
3,356 695 2,331 1,642 4,750 (156) (584) 12,034
Reconciliation to (Surplus)/Deficit on Continuing Operations
Adjust for amounts not reported to management 39,330
Adjustment for Group Transactions (688)
Remove amounts included on management report but excluded from Continuing Operations (150)
(Surplus)/Deficit on Continuing Operations in Comprehensive Income and Expenditure Statement 50,526

87
2011/2012 Service Services Adjustment Not Reported Not Included Allocation Continuing Corporate Total
Analysis Not in for Group to in I&E of Operations Amounts
Analysis Transactions Management Recharges
£'000 £'000 £'000 £'000 £'000 £'000 £'000 £'000 £'000
Fees, Charges and Other Service Income (75,680) 323 93 9,424 (65,840) (86) (65,926)
Income on Joint Associates and Subsidiaries (123) 4,333 4,210 162 4,372
Interest and Investment Income 0 (3,737) (3,737)
Income from Council tax 0 (8,749) (8,749)
Government Grants and Contributions 0 (11,892) (11,892)
Disposal of Assets 0 (291) (291)
Total Income (75,680) (123) 4,333 323 93 9,424 (61,630) (24,593) (86,223)
Employee Expenses 14,728 35 (5,351) 9,412 9,412
Other Service Expenses 57,203 483 (1,281) (70) (2,218) 54,117 70 54,187
Expenditure on Joint Associates and Subsidiaries 89 (5,021) (4,932) 699 (4,233)
Support Service Recharges 8,919 790 (173) (1,813) 7,723 174 7,897
Depreciation, Amortisation and Impairment 6,864 35 38,979 (42) 45,836 45,836
Interest Payments 0 8,066 8,066
Precepts and Levies 0 2,449 2,449
Payments to Housing Capital Receipts Pool 0 183 183
(Gain)/Loss on Disposal of Fixed Assets 0 1,928 1,928
Total Operating Expenses 87,714 607 (5,021) 38,523 (243) (9,424) 112,156 13,569 125,725
(Surplus)/Deficit on Provision of Services 12,034 484 (688) 38,846 (150) 0 50,526 (11,024) 39,502

88
2010/2011 Strategic and Safe and Culture and Sustainable Clean Health Housing Total
Corporate Policy Strong Leisure Development and and Green and Homes Revenue
Regeneration Account
£'000 £'000 £'000 £'000 £'000 £'000 £'000 £'000
Employees (2,623) 622 2,785 2,307 3,368 997 7,456
Premises 157 8 836 350 215 835 2,401
Transport 68 16 22 66 1,256 202 1,630
Supplies and Services 3,418 857 1,390 969 1,030 997 10,222 18,883
Transfer Payments 31,705 41 31,746
Total Expenditure 32,725 1,503 5,033 3,692 5,869 3,072 10,222 62,116
Income (35,328) (1,304) (3,154) (2,262) (1,539) (2,454) (17,746) (63,787)
Total Income (35,328) (1,304) (3,154) (2,262) (1,539) (2,454) (17,746) (63,787)
Net Expenditure (2,603) 199 1,879 1,430 4,330 618 (7,524) (1,671)
Memorandum Items
Support Services 3,208 363 1,304 1,161 1,533 1,067 297 8,933
Capital Charges 144 275 102 1,365 1,041 77,650 80,577
749 562 3,458 2,693 7,228 2,726 70,423 87,839
Reconciliation to (Surplus)/Deficit on Continuing Operations
Adjust for amounts not reported to management (9,473)
Adjustment for Group Transactions (1,986)
Remove amounts included on management report but excluded from Continuing Operations (21)
(Surplus)/Deficit on Continuing Operations in Comprehensive Income and Expenditure Statement 76,359

89
2010/2011 Service Services Adjustment Not Reported Not Included Allocation Continuing Corporate Total
Analysis Not in for Group to in I&E of Operations Amounts
Analysis Transactions Management Recharges
£'000 £'000 £'000 £'000 £'000 £'000 £'000 £'000 £'000
Fees, Charges and Other Service Income (63,787) (9,436) 111 9,251 (63,861) (122) (63,983)
Income on Joint Associates and Subsidiaries (105) 1,685 1,580 371 1,951
Interest and Investment Income 0 (3,598) (3,598)
Income from Council tax 0 (8,836) (8,836)
Government Grants and Contributions 0 (15,177) (15,177)
Disposal of Assets 0 (6,047) (6,047)
Total Income (63,787) (105) 1,685 (9,436) 111 9,251 (62,281) (33,409) (95,690)
Employee Expenses 7,456 38 (5,275) 2,219 2,219
Other Service Expenses 54,660 483 712 (80) (2,322) 53,453 80 53,533
Expenditure on Joint Associates and Subsidiaries 90 (3,671) (3,581) 845 (2,736)
Support Service Recharges 8,933 (52) (1,613) 7,268 52 7,320
Depreciation, Amortisation and Impairment 80,577 135 (41) 80,671 80,671
Interest Payments 0 8,710 8,710
Precepts and Levies 0 2,435 2,435
Payments to Housing Capital Receipts Pool 0 260 260
(Gain)/Loss on Disposal of Fixed Assets (1,390) (1,390) 7,272 5,882
Total Operating Expenses 151,626 573 (3,671) (505) (132) (9,251) 138,640 19,654 158,294
(Surplus)/Deficit on Provision of Services 87,839 468 (1,986) (9,941) (21) 0 76,359 (13,755) 62,604
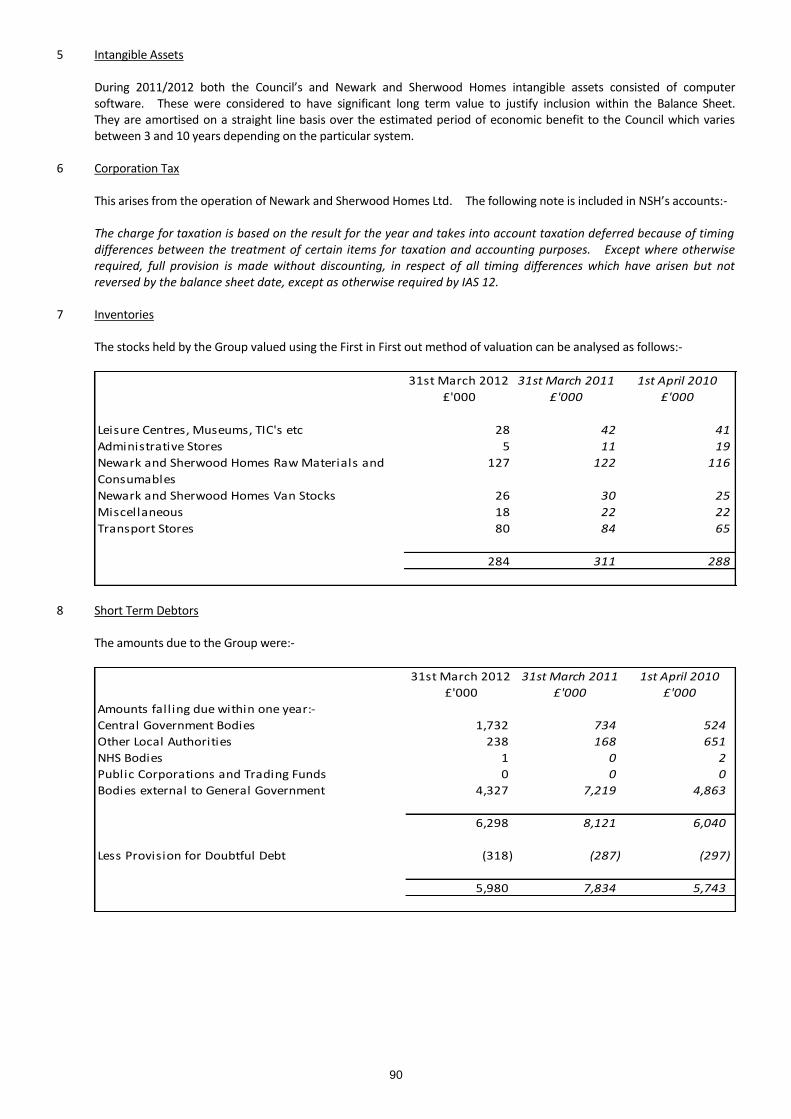
90
5 Intangible Assets
During 2011/2012 both the Council’s and Newark and Sherwood Homes intangible assets consisted of computer software. These were considered to have significant long term value to justify inclusion within the Balance Sheet. They are amortised on a straight line basis over the estimated period of economic benefit to the Council which varies between 3 and 10 years depending on the particular system.
6 Corporation Tax
This arises from the operation of Newark and Sherwood Homes Ltd. The following note is included in NSH’s accounts:- The charge for taxation is based on the result for the year and takes into account taxation deferred because of timing differences between the treatment of certain items for taxation and accounting purposes. Except where otherwise required, full provision is made without discounting, in respect of all timing differences which have arisen but not reversed by the balance sheet date, except as otherwise required by IAS 12.
7 Inventories The stocks held by the Group valued using the First in First out method of valuation can be analysed as follows:-
31st March 2012 31st March 2011 1st April 2010
£'000 £'000 £'000
Leisure Centres, Museums, TIC's etc 28 42 41
Administrative Stores 5 11 19
Newark and Sherwood Homes Raw Materials and
Consumables
127 122 116
Newark and Sherwood Homes Van Stocks 26 30 25
Miscellaneous 18 22 22
Transport Stores 80 84 65
284 311 288
8 Short Term Debtors The amounts due to the Group were:-
31st March 2012 31st March 2011 1st April 2010
£'000 £'000 £'000
Amounts falling due within one year:-
Central Government Bodies 1,732 734 524
Other Local Authorities 238 168 651
NHS Bodies 1 0 2
Public Corporations and Trading Funds 0 0 0
Bodies external to General Government 4,327 7,219 4,863
6,298 8,121 6,040
Less Provision for Doubtful Debt (318) (287) (297)
5,980 7,834 5,743
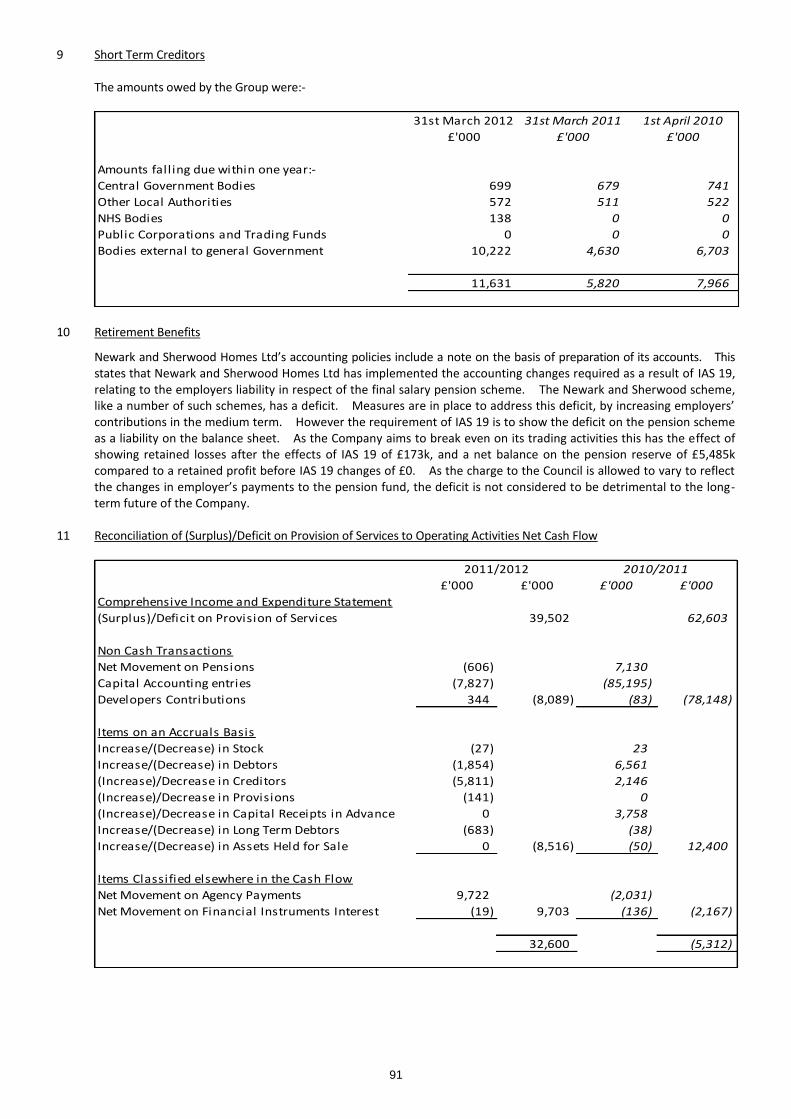
91
9 Short Term Creditors The amounts owed by the Group were:-
31st March 2012 31st March 2011 1st April 2010
£'000 £'000 £'000
Amounts falling due within one year:-
Central Government Bodies 699 679 741
Other Local Authorities 572 511 522
NHS Bodies 138 0 0
Public Corporations and Trading Funds 0 0 0
Bodies external to general Government 10,222 4,630 6,703
11,631 5,820 7,966
10 Retirement Benefits
Newark and Sherwood Homes Ltd’s accounting policies include a note on the basis of preparation of its accounts. This states that Newark and Sherwood Homes Ltd has implemented the accounting changes required as a result of IAS 19, relating to the employers liability in respect of the final salary pension scheme. The Newark and Sherwood scheme, like a number of such schemes, has a deficit. Measures are in place to address this deficit, by increasing employers’ contributions in the medium term. However the requirement of IAS 19 is to show the deficit on the pension scheme as a liability on the balance sheet. As the Company aims to break even on its trading activities this has the effect of showing retained losses after the effects of IAS 19 of £173k, and a net balance on the pension reserve of £5,485k compared to a retained profit before IAS 19 changes of £0. As the charge to the Council is allowed to vary to reflect the changes in employer’s payments to the pension fund, the deficit is not considered to be detrimental to the long-term future of the Company.
11 Reconciliation of (Surplus)/Deficit on Provision of Services to Operating Activities Net Cash Flow
£'000 £'000 £'000 £'000
Comprehensive Income and Expenditure Statement
(Surplus)/Deficit on Provision of Services 39,502 62,603
Non Cash Transactions
Net Movement on Pensions (606) 7,130
Capital Accounting entries (7,827) (85,195)
Developers Contributions 344 (8,089) (83) (78,148)
Items on an Accruals Basis
Increase/(Decrease) in Stock (27) 23
Increase/(Decrease) in Debtors (1,854) 6,561
(Increase)/Decrease in Creditors (5,811) 2,146
(Increase)/Decrease in Provisions (141) 0
(Increase)/Decrease in Capital Receipts in Advance 0 3,758
Increase/(Decrease) in Long Term Debtors (683) (38)
Increase/(Decrease) in Assets Held for Sale 0 (8,516) (50) 12,400
Items Classified elsewhere in the Cash Flow
Net Movement on Agency Payments 9,722 (2,031)
Net Movement on Financial Instruments Interest (19) 9,703 (136) (2,167)
32,600 (5,312)
2011/2012 2010/2011
92
ANNUAL GOVERNANCE STATEMENT
1 Scope of responsibility
Newark and Sherwood District Council is responsible for ensuring that the Authority’s own and, with the addition of Newark and Sherwood Homes, its Group business is conducted in accordance with the law and proper standards, and that public money is safeguarded and properly accounted for, and used economically, efficiently and effectively. Newark and Sherwood District Council also has a duty under the Local Government Act 1999 to make arrangements to secure continuous improvement in the way in which its functions are exercised, having regard to a combination of economy, efficiency and effectiveness. In discharging this overall responsibility, Newark and Sherwood District Council is responsible for putting in place proper arrangements for the governance of its affairs and facilitating the effective exercise of its functions, including arrangements for the management of risk.
2 The purpose of the governance framework
The governance framework comprises the systems and processes, and culture and values by which the authority is directed and controlled and its activities through which it accounts to, engages with and leads the community. It enables the authority to monitor the achievement of its strategic objectives and to consider whether those objectives have led to the delivery of appropriate, cost-effective services. The system of internal control is a significant part of that framework and is designed to manage risk to a reasonable level. It cannot eliminate all risk of failure to achieve policies, aims and objectives and can therefore only provide reasonable and not absolute assurance of effectiveness. The system of internal control is based on an ongoing process designed to identify and prioritise the risks to the achievement of Newark and Sherwood District Council’s policies, aims and objectives, to evaluate the likelihood of those risks being realised and the impact should they be realised, and to manage them efficiently, effectively and economically. The governance framework has been in place at Newark and Sherwood District Council for the year ended 31 March 2012 and up to the date of approval of the statement of accounts.
3 The governance framework The key elements of the District Council’s governance framework are as follows: The District Council has adopted a constitution which sets out how the Council operates, how decisions are made and the procedures which are followed to ensure that these are efficient, transparent and accountable to local people. The Constitution is subject to periodic change either through national legislation or local decision and the Governance Framework may be amended accordingly. During 2011/12 the Council reviewed its strategic priorities. The new priorities are: Prosperity; People; Place; and Public Service. Further detailed objectives are being developed to support these priorities. The delivery of these priorities will be conducted in accordance with the Governance framework. The Council facilitates policy and decision-making through the Cabinet. Meetings are open to the public except where exempt or confidential matters are being disclosed. In addition, senior officers of the council can make decisions under delegated authority. The Council publishes a Forward Plan which contains details of key decisions to be made by the Council, its committees and Chief Officers under their delegated powers. The District Council has a cross-departmental Risk Management Group that meets regularly to identify and evaluate all significant risks. A Risk Register is in place and appropriate staff have been trained in the assessment, management and monitoring of risks. Through reviews by external auditors, external agencies, Internal Audit and its Performance Team the District Council constantly seeks ways of ensuring the economical, effective and efficient use of resources, and for securing continuous improvement in the way in which its functions are exercised, having regard to a combination of economy, efficiency and effectiveness.

93
Services are delivered by trained and experienced people. All posts have a detailed job description and person specification. Training needs are identified through the Performance Appraisal Scheme. The Council has appointed the Deputy Chief Executive as Monitoring Officer. It is the function of the Monitoring officer to ensure compliance with established policies, procedures, laws and regulations. After consulting with the Head of Paid Service, the Monitoring Officer will report to the full Council if she considers that any proposal, decision or omission would give rise to unlawfulness or maladministration. During 2011/12, the Council had a Standards Committee which promotes and maintains high standards of conduct by members. Due to a change in legislation, the structure of the Standards Committee has changed with effect from July 2012 and a Designated Independent Person has been appointed. The standards of behaviour for members and employees are defined through codes of conduct. The Council also has an Anti-Fraud and Corruption Strategy and a Whistleblowing Policy that enables concerns to be raised confidentially by employees or persons doing business with the Council. A complaints system is also operated by the Council to enable comments on services to be received and investigated. The Council has appointed the Director of Resources as the section 151 (s151) Officer. The s151 Officer is responsible for the proper administration of the Council’s financial affairs including, maintenance of financial records, presentation of statutory accounts and budgets, provision of effective internal audit and financial advice to Council. The Council’s financial management arrangements conform with the governance requirements of the CIPFA Statement on the Role of the Chief Financial Officer in Local Government. The Council communicates with the community and its stakeholders by means of a periodic publication, “Voice”, through its Internet website and by specific consultation.
4 Review of effectiveness Newark and Sherwood District Council has responsibility for conducting, at least annually, a review of the effectiveness of its governance framework including the system of internal control. The review of effectiveness is informed by the work of the executive managers within the authority who have responsibility for the development and maintenance of the governance environment, the Audit Manager’s annual report, and also by comments made by the external auditors and other review agencies and inspectorates. Business managers provide assurance to the s151 officer that service areas are compliant with the Council’s governance arrangements. The process that has been applied in maintaining and reviewing the effectiveness of the system of internal control includes: The Deputy Chief Executive (the ‘Monitoring Officer’) has a duty to monitor and review the operation of the Constitution to ensure its aims and principles are given full effect. The Council reviews the Constitution through a dedicated working party comprising, inter alia, all the group leaders, on a regular basis, and has formed a Councillors’ Commission to consider any changes resulting from recent legislation. The Council currently has three Overview and Scrutiny Committees. They can “call-in” a decision made by Cabinet but not yet implemented, to enable them to consider whether the decision is appropriate. Both overview and scrutiny and, indeed, Cabinet, do on occasion appoint Task and Finish Groups, where appropriate, to explore issues in greater depth. One of the Overview and Scrutiny committees is tasked to examine specifically the Council’s external relationships and interactions with our partners and other key stakeholders. The Council has stated its intention to change to a Committee system in 2013. Internal Audit is responsible for reviewing the quality and effectiveness of systems of internal control. A rolling plan is approved by the Director of Resources and reported to the Audit and Accounts Committee. The reporting process for Internal Audit requires a report of each audit to be submitted to the relevant Chief Officer and Business Manager. The report includes recommendations for improvements that are included within an action plan and require agreement or rejection by service managers. The Audit and Accounts Committee receives executive summaries of all internal audit reports and is advised of progress in implementing recommendations. Internal Audit reports are considered by the Council’s Corporate Management Team. The Internal Audit Section is subject to regular inspection by the Council’s external auditors who place reliance on the work carried out by the section. It should be noted that, with effect from April 2012 the internal audit function is carried out by Audit Lincolnshire.

94
Risk management policies and procedures are in place with the objective of ensuring that the risks facing the authority in achieving its objectives are evaluated, regularly reviewed and mitigation strategies developed.
5 Significant governance issues
Issue Action Responsible Officer
Organisational Change In common with all local authorities, the Council will need to continue to make significant changes to its budget to meet changing financial circumstances as a result of the national economic position.
The Council has a change programme led by the Chief Executive and involving all senior officers and Members. This has delivered significant savings and improvements. This will be taken forward through a Commissioning approach which has been approved by Council with all relevant officers and Members receiving appropriate training
A. Muter Chief Executive
Organisational change – Introduction of a Committee system The Council has agreed to move towards a Committee System with effect from 2013. This will replace the current system of Cabinet and Overview and Scrutiny Committees.
The Council’s Constitution will be amended to reflect this change.
Mrs K. Cole Deputy Chief Executive
Business Continuity In order to maintain the integrity of business continuity plans throughout the Council, assurance needs to be obtained that such plans are robust and current.
Responsibility for Emergency Planning and Business Continuity has been allocated to appropriate Business Managers. All business continuity plans will be reviewed during the course of the year and appropriately tested. An assurance mechanism has been introduced.
Mrs L. Lancaster Business Manager Community Safety Mrs J. Middleton Business Manager Performance
Housing Stock Options and Self Financing Housing Revenue Account Options for the future management of the Council’s housing stock are being considered and the requirements of the Self Financing Housing Revenue Account are being developed.
The Council has put in place appropriate Member and officer structures to consider the issues
C. Walker Director of Growth D. Dickinson Director of Resources
Growth Point Newark and Sherwood is a designated housing growth point area. This brings additional responsibilities for the development of housing in the District and the Council has been awarded significant additional funding as a result.
The Council has appointed staff dedicated to the delivery of the Growth Point objectives and has put in place mechanisms to deal with the resultant issues.
C. Walker Director of Growth
Changes to Internal and external audit The Council’s Internal Audit function is being carried out by Audit Lincolnshire with effect from April 2012; From October 2012 the Council’s external auditors will be KPMG who will replace the Audit Commission.
A performance framework has been agreed with Audit Lincolnshire and will be monitored throughout the year. Meetings will be held with the external auditors to manage the transition. Both areas will be reported to the Audit and Accounts Committee.
D. Dickinson Director of Resources

95
Health and Safety A robust approach needs to be maintained by the Council in continuing to properly discharge its Health and Safety responsibilities and assurance that policies and procedures are fit for that purpose
The Council’s health and safety policies have been reviewed and updated. All members and officers will receive appropriate training and awareness of their respective level of responsibilities An audit of the effectiveness of the policies and procedures implemented will be undertaken
Mrs K. White Director of Safety
We propose over the coming year to take steps to address the above matters to further enhance our governance arrangements. We are satisfied that these steps will address the need for proper governance arrangements to be in place. We will undertake ongoing monitoring of the implementation of any improvements that were identified in our review of effectiveness and as part of our next annual review. Signed
A. Muter R.V. Blaney Chief Executive Leader of the Council 5 September 2012 5 September 2012