new zealand exporter guide annual - usda gain publications...u.s. exporters can contact freight...
TRANSCRIPT
THIS REPORT CONTAINS ASSESSMENTS OF COMMODITY AND TRADE ISSUES MADE BY
USDA STAFF AND NOT NECESSARILY STATEMENTS OF OFFICIAL U.S. GOVERNMENT
POLICY
Date:
GAIN Report Number:
Approved By:
Prepared By:
Report Highlights: In New Zealand, consumer-oriented agricultural products have trended upward over the past several years, but fell slightly in
2009 to US $1.65 billion. Australia is by far the leading supplier with a 47% market share followed by the United States at
10% and China at 4%. Leading imports from the United States include pet food, food preparations, frozen meat products,
fruit & vegetable juices, fresh fruit (grapes, oranges and peaches) dried fruit and nuts, and sauces/condiments.
Vinita Sharma
Laura Scandurra
Annual
Exporter Guide
New Zealand
NZ1018
12/22/2010
Required Report - public distribution
Post:
SECTION I: MARKET OVERVIEW
Overview
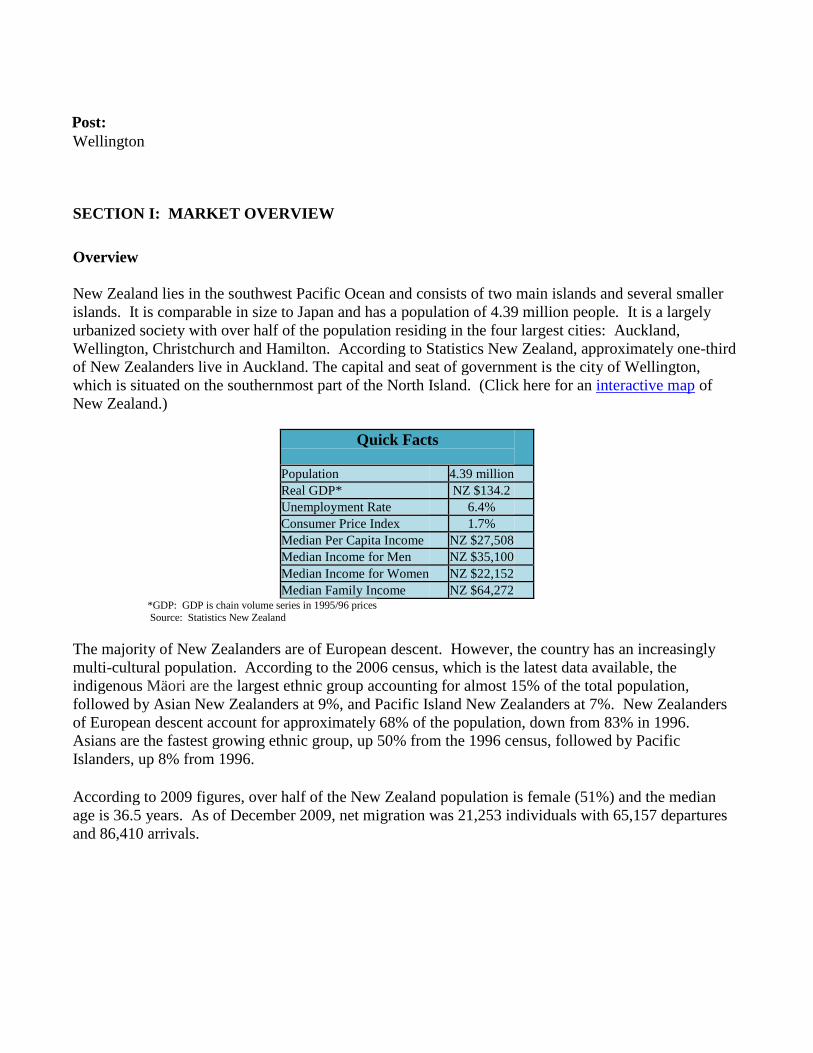
New Zealand lies in the southwest Pacific Ocean and consists of two main islands and several smaller
islands. It is comparable in size to Japan and has a population of 4.39 million people. It is a largely
urbanized society with over half of the population residing in the four largest cities: Auckland,
Wellington, Christchurch and Hamilton. According to Statistics New Zealand, approximately one-third
of New Zealanders live in Auckland. The capital and seat of government is the city of Wellington,
which is situated on the southernmost part of the North Island. (Click here for an interactive map of
New Zealand.)
Quick Facts
Population 4.39 million
Real GDP* NZ $134.2
Unemployment Rate 6.4%
Consumer Price Index 1.7%
Median Per Capita Income NZ $27,508
Median Income for Men NZ $35,100
Median Income for Women NZ $22,152
Median Family Income NZ $64,272 *GDP: GDP is chain volume series in 1995/96 prices Source: Statistics New Zealand
The majority of New Zealanders are of European descent. However, the country has an increasingly
multi-cultural population. According to the 2006 census, which is the latest data available, the
indigenous Mäori are the largest ethnic group accounting for almost 15% of the total population,
followed by Asian New Zealanders at 9%, and Pacific Island New Zealanders at 7%. New Zealanders
of European descent account for approximately 68% of the population, down from 83% in 1996.
Asians are the fastest growing ethnic group, up 50% from the 1996 census, followed by Pacific
Islanders, up 8% from 1996.
According to 2009 figures, over half of the New Zealand population is female (51%) and the median
age is 36.5 years. As of December 2009, net migration was 21,253 individuals with 65,157 departures
and 86,410 arrivals.
Wellington
New Zealand Population
Year Ended 31 December
2005 2006 2007 2008 2009
Mean estimated resident population 4,136,000 4,186,900 4,230,700 4,271,100 4,318,100
Males 2,026,200 2,049,500 2,072,000 2,093,300 2,118,600
Females 2,109,800 2,137,400 2,158,800 2,177,800 2,199,500
Median age (years) 35.5 35.8 36.1 36.3 36.5
Arrivals (permanent and long-term) 78,963 82,732 82,572 87,463 86,410
Departures (permanent and long-term) 71,992 68,123 77,081 83,649 65,157
Net migration 6,971 14,609 5,491 3,814 21,253 Source: Statistics New Zealand
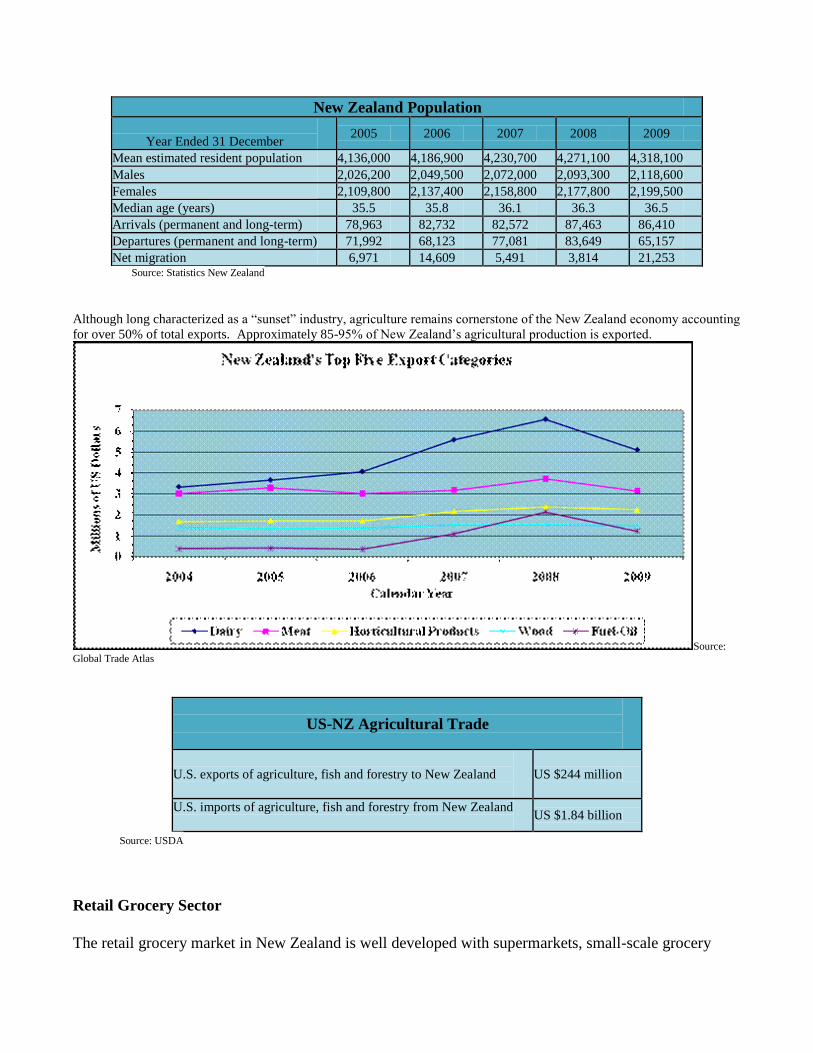
Although long characterized as a “sunset” industry, agriculture remains cornerstone of the New Zealand economy accounting
for over 50% of total exports. Approximately 85-95% of New Zealand’s agricultural production is exported.
Source:
Global Trade Atlas
US-NZ Agricultural Trade
U.S. exports of agriculture, fish and forestry to New Zealand
US $244 million
U.S. imports of agriculture, fish and forestry from New Zealand
US $1.84 billion
Source: USDA
Retail Grocery Sector
The retail grocery market in New Zealand is well developed with supermarkets, small-scale grocery

stores, fresh food specialty stores and convenience stores in all of the major population centers. New
Zealand’s food expenditures in 2010 (June year) were valued at over NZ $26 billion (US $18.72
billion). Approximately 51% of sales, NZ $13.2 billion (US $9.5 billion), were made through
supermarkets followed by cafes and restaurants at 15%, corner stores at 7%, fast food outlets at 5%,
bars/pubs and clubs at 5%, and other outlets at 17%. (Source: Coriolis Research, June 2009 report)
Source: Coriolis Research, June 2010
Consumer-Oriented Food Product Trade
As shown in the table below, New Zealand’s imports of consumer-oriented agricultural products have
trended upward over the past several years, but fell slightly in 2009 to US $1.65 billion. Australia is by
far the leading supplier with a 47% market share followed by the United States at 10% and China at
4%.
Leading consumer-oriented imports from Australia include wine, food preparations (including food
crystals, powders, nut pastes etc.), snack foods, bread/cookies/cakes, pet food, confectionery and frozen
meat products etc. Leading imports from the United States include pet food, food preparations, frozen
meat products, fruit & vegetable juices, fresh fruit (grapes, oranges, and peaches), dried fruits and nuts,
and sauces/condiments. Top imports from China include sugar confectionery products, peanuts, pasta,
food preparations, bakery products, frozen/cooked vegetables, prepared peaches, pasta, starches, frozen
vegetables, and apple juice. (Source: Global Trade Atlas)
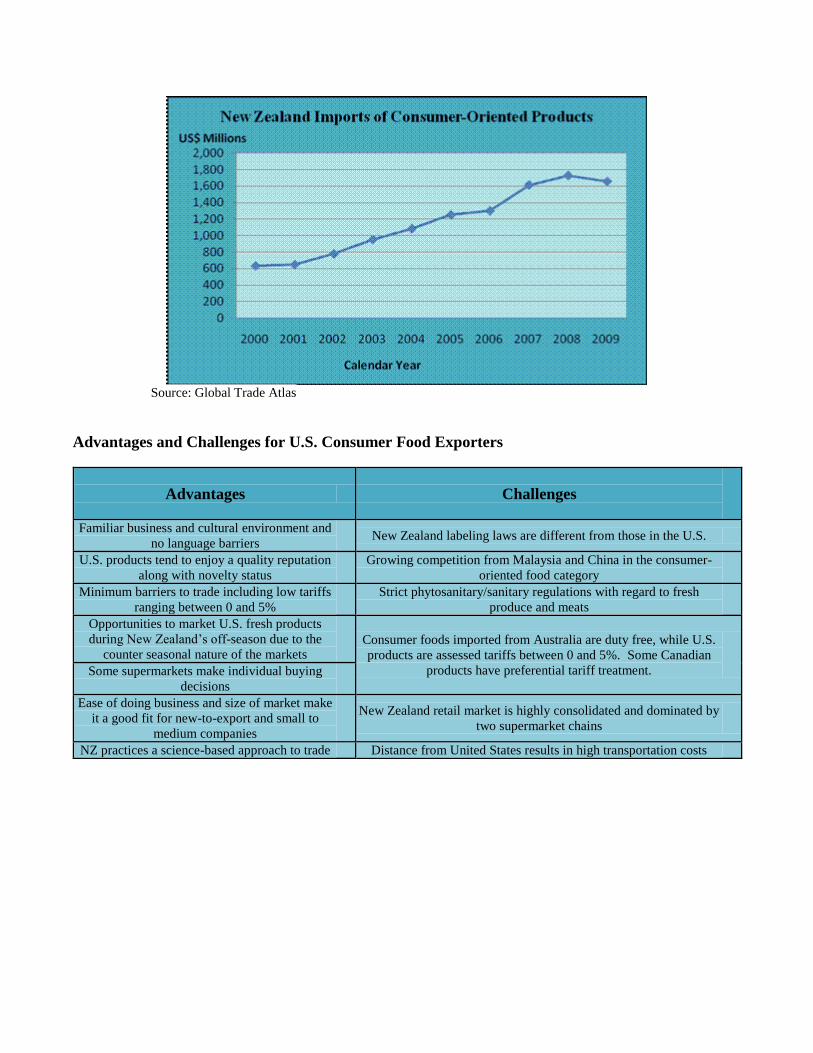
Source: Global Trade Atlas
Advantages and Challenges for U.S. Consumer Food Exporters
Advantages
Challenges
Familiar business and cultural environment and
no language barriers New Zealand labeling laws are different from those in the U.S.
U.S. products tend to enjoy a quality reputation
along with novelty status Growing competition from Malaysia and China in the consumer-
oriented food category
Minimum barriers to trade including low tariffs
ranging between 0 and 5% Strict phytosanitary/sanitary regulations with regard to fresh
produce and meats
Opportunities to market U.S. fresh products
during New Zealand’s off-season due to the
counter seasonal nature of the markets Consumer foods imported from Australia are duty free, while U.S.
products are assessed tariffs between 0 and 5%. Some Canadian
products have preferential tariff treatment. Some supermarkets make individual buying
decisions
Ease of doing business and size of market make
it a good fit for new-to-export and small to
medium companies
New Zealand retail market is highly consolidated and dominated by
two supermarket chains
NZ practices a science-based approach to trade Distance from United States results in high transportation costs

SECTION II: EXPORTER BUSINESS TIPS
New Zealand is a well-developed market. Establishing good working relationships with
importers/distributors is key to entering the New Zealand marketplace. Approximately 90% of
all imported food products are purchased and distributed within New Zealand by
importers/distributors. New Zealand supermarkets mainly purchase imported products from importers and distributors
rather than importing directly. In the case of Foodstuffs, interested U.S. exporters should
contact each of the regional offices directly as they can make buying decisions independently of
each other. (Please see Section V for contact information.) Tariffs assessed on U.S. food products range from zero to 5%. Tariff rates can be checked at
Working Tariff Document of New Zealand on the New Zealand Customs website. General sales tax (GST) on domestic and imported products is 15%. The cost of international freight can be a fairly significant percentage of the final cost of a
product. U.S. exporters can contact freight forwarders in the United States to determine
transportation cost. New Zealand importers and distributors can arrange shipment with the help
of customs brokers in New Zealand. High quality products with innovative packaging and unique features that are price competitive
tend to do well in the New Zealand market. Fresh U.S. produce is an especially welcome addition to New Zealand retail shelves during
winter in the Southern Hemisphere. Innovative, environmentally-friendly packaging has an advantage in retail food products. New Zealand has strict food standards and labeling requirements that are set out in the Australia
New Zealand Food Standards Code. U.S. exporters are encouraged to review the Food and
Agriculture Import Regulations and Standards (FAIRS) report for New Zealand which contains
detailed information on New Zealand’s food standards, labeling requirements, import
regulations, etc. This report can be viewed at the following site:
http://www.fas.usda.gov/scriptsw/attacherep/default.htm
SECTION III: MARKET STRUCTURE AND TRENDS
Market Structure
Two supermarket chains, Foodstuffs (NZ) Limited and Progressive Enterprises Limited, dominate the
New Zealand retail sector. Foodstuffs (NZ) Ltd. has an estimated 55% share of the New Zealand
grocery market and Progressive Enterprises has an estimated 40% share.
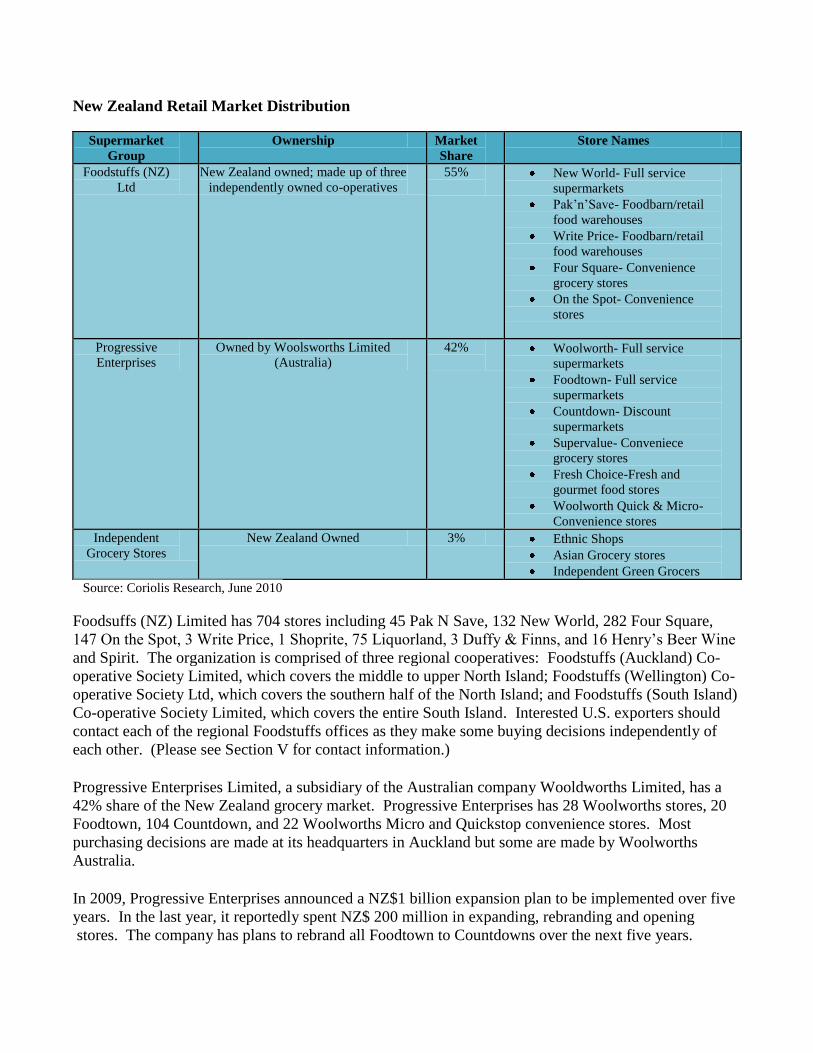
New Zealand Retail Market Distribution
Supermarket
Group Ownership Market
Share Store Names
Foodstuffs (NZ)
Ltd New Zealand owned; made up of three
independently owned co-operatives 55%
New World- Full service
supermarkets
Pak’n’Save- Foodbarn/retail
food warehouses
Write Price- Foodbarn/retail
food warehouses
Four Square- Convenience
grocery stores
On the Spot- Convenience
stores
Progressive
Enterprises Owned by Woolsworths Limited
(Australia) 42%
Woolworth- Full service
supermarkets
Foodtown- Full service
supermarkets
Countdown- Discount
supermarkets
Supervalue- Conveniece
grocery stores
Fresh Choice-Fresh and
gourmet food stores
Woolworth Quick & Micro-
Convenience stores
Independent
Grocery Stores New Zealand Owned 3% Ethnic Shops
Asian Grocery stores
Independent Green Grocers
Source: Coriolis Research, June 2010
Foodsuffs (NZ) Limited has 704 stores including 45 Pak N Save, 132 New World, 282 Four Square,
147 On the Spot, 3 Write Price, 1 Shoprite, 75 Liquorland, 3 Duffy & Finns, and 16 Henry’s Beer Wine
and Spirit. The organization is comprised of three regional cooperatives: Foodstuffs (Auckland) Co-
operative Society Limited, which covers the middle to upper North Island; Foodstuffs (Wellington) Co-
operative Society Ltd, which covers the southern half of the North Island; and Foodstuffs (South Island)
Co-operative Society Limited, which covers the entire South Island. Interested U.S. exporters should
contact each of the regional Foodstuffs offices as they make some buying decisions independently of
each other. (Please see Section V for contact information.)
Progressive Enterprises Limited, a subsidiary of the Australian company Wooldworths Limited, has a
42% share of the New Zealand grocery market. Progressive Enterprises has 28 Woolworths stores, 20
Foodtown, 104 Countdown, and 22 Woolworths Micro and Quickstop convenience stores. Most
purchasing decisions are made at its headquarters in Auckland but some are made by Woolworths
Australia.
In 2009, Progressive Enterprises announced a NZ$1 billion expansion plan to be implemented over five
years. In the last year, it reportedly spent NZ$ 200 million in expanding, rebranding and opening
stores. The company has plans to rebrand all Foodtown to Countdowns over the next five years.
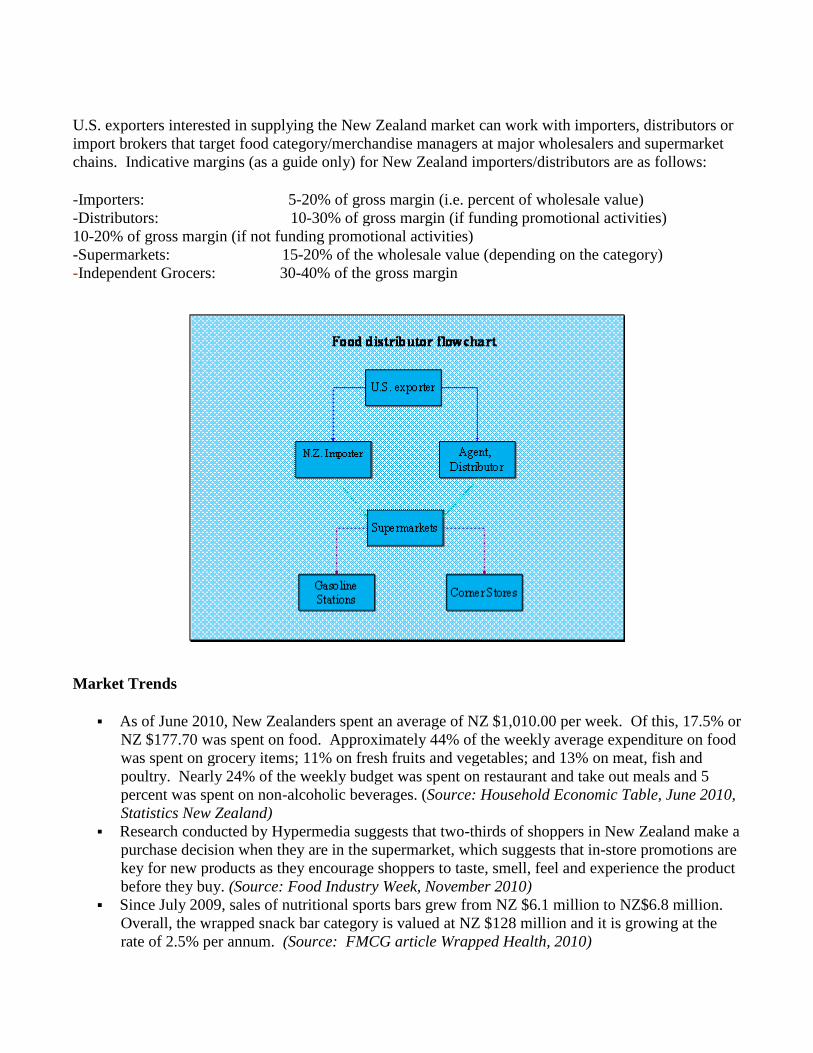
U.S. exporters interested in supplying the New Zealand market can work with importers, distributors or
import brokers that target food category/merchandise managers at major wholesalers and supermarket
chains. Indicative margins (as a guide only) for New Zealand importers/distributors are as follows:
-Importers: 5-20% of gross margin (i.e. percent of wholesale value) -Distributors: 10-30% of gross margin (if funding promotional activities) 10-20% of gross margin (if not funding promotional activities) -Supermarkets: 15-20% of the wholesale value (depending on the category) -Independent Grocers: 30-40% of the gross margin
Market Trends
As of June 2010, New Zealanders spent an average of NZ $1,010.00 per week. Of this, 17.5% or
NZ $177.70 was spent on food. Approximately 44% of the weekly average expenditure on food
was spent on grocery items; 11% on fresh fruits and vegetables; and 13% on meat, fish and
poultry. Nearly 24% of the weekly budget was spent on restaurant and take out meals and 5
percent was spent on non-alcoholic beverages. (Source: Household Economic Table, June 2010,
Statistics New Zealand) Research conducted by Hypermedia suggests that two-thirds of shoppers in New Zealand make a
purchase decision when they are in the supermarket, which suggests that in-store promotions are
key for new products as they encourage shoppers to taste, smell, feel and experience the product
before they buy. (Source: Food Industry Week, November 2010) Since July 2009, sales of nutritional sports bars grew from NZ $6.1 million to NZ$6.8 million.
Overall, the wrapped snack bar category is valued at NZ $128 million and it is growing at the
rate of 2.5% per annum. (Source: FMCG article Wrapped Health, 2010)
For the year ending November 2010, snack food sales through New Zealand supermarkets were
NZ $286 million. Of this, potato chips accounted for NZ$121 million. New Zealand’s total meat consumption fell 5.4% to 382,052 tons for the year ending December
2009 in comparison to 2008. Sheep meat consumption declined 25% to 41,167 tons, beef
consumption declined 1.1% to 117,472 tons, and poultry consumption decreased 4.8% to
136,728 tons. In comparison, pork consumption increased by 0.5% to 85,056 tons. (Source:
FMCG) The recession and an uptick in food prices has impacted on food shopping habits in New
Zealand. According to a survey conducted by The Nielsen Company, 97% of shoppers reported
an increase in food and beverage prices and 80% changed the way they shop. Approximately
81% of shoppers surveyed now check prices before making a buying decision, as compared to
63% in June 2008. Approximately 65% of those surveyed were buying fewer luxury items.
Instead, consumers are spending more on affordable treats that offer value for money. (Source:
National Business Review, March 2009) New Zealanders have one of the world’s highest rates of allergy or food intolerance, with an
estimated 25% suffering from some form of allergy including asthma, anaphylaxis, wheat, dairy
and egg allergies. As a result, a growing category is gluten-free products. Estimated at NZ
$22.3 million in 2007, the gluten-free market is expected to grow by almost 30% per annum by
2011 to NZ $50 million. (Source: FMCG, June 2009) According to the OECD Report- The HealthCare Data 2009, New Zealand ranks as the third
most obese nation among the developed countries. The obesity rate among adults in 2007 was
26.5%, up from 25% in 2003 and 18% in 1997. (Source: New Zealand Herald, July 2009)
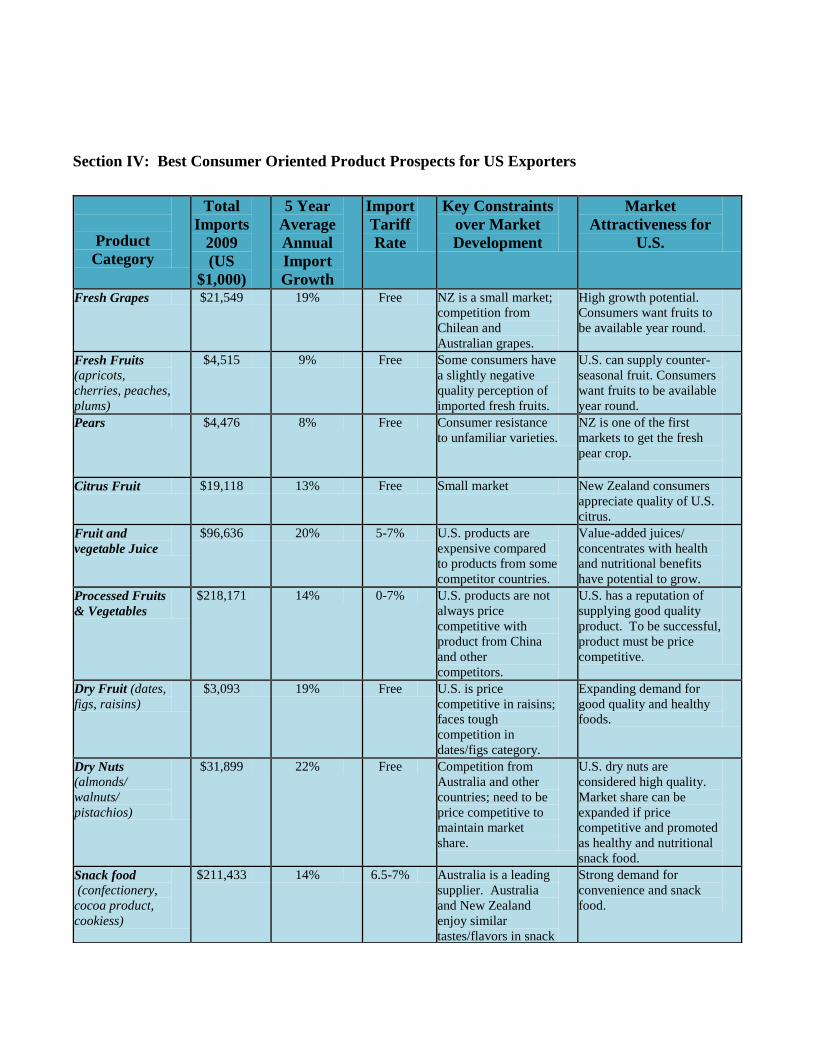
Section IV: Best Consumer Oriented Product Prospects for US Exporters
Product
Category
Total
Imports
2009
(US
$1,000)
5 Year
Average
Annual
Import
Growth
Import
Tariff
Rate
Key Constraints
over Market
Development
Market
Attractiveness for
U.S.
Fresh Grapes $21,549 19% Free NZ is a small market;
competition from
Chilean and
Australian grapes.
High growth potential.
Consumers want fruits to
be available year round.
Fresh Fruits
(apricots,
cherries, peaches,
plums)
$4,515 9% Free Some consumers have
a slightly negative
quality perception of
imported fresh fruits.
U.S. can supply counter-
seasonal fruit. Consumers
want fruits to be available
year round.
Pears $4,476 8% Free Consumer resistance
to unfamiliar varieties. NZ is one of the first
markets to get the fresh
pear crop.
Citrus Fruit $19,118 13% Free Small market New Zealand consumers
appreciate quality of U.S.
citrus.
Fruit and
vegetable Juice $96,636 20% 5-7% U.S. products are
expensive compared
to products from some
competitor countries.
Value-added juices/
concentrates with health
and nutritional benefits
have potential to grow.
Processed Fruits
& Vegetables $218,171 14% 0-7% U.S. products are not
always price
competitive with
product from China
and other
competitors.
U.S. has a reputation of
supplying good quality
product. To be successful,
product must be price
competitive.
Dry Fruit (dates,
figs, raisins) $3,093 19% Free U.S. is price
competitive in raisins;
faces tough
competition in
dates/figs category.
Expanding demand for
good quality and healthy
foods.
Dry Nuts
(almonds/
walnuts/ pistachios)
$31,899 22% Free Competition from
Australia and other
countries; need to be
price competitive to
maintain market
share.
U.S. dry nuts are
considered high quality.
Market share can be
expanded if price
competitive and promoted
as healthy and nutritional
snack food.
Snack food
(confectionery,
cocoa product,
cookiess)
$211,433 14% 6.5-7% Australia is a leading
supplier. Australia
and New Zealand
enjoy similar
tastes/flavors in snack
Strong demand for
convenience and snack
food.

items.
Breakfast Cereal $42,572 15% Free Strong competition
from Australia. Strong demand.
Pet Food $116,270 18% 0-7% Price competitive
products from
Australia.
Strong demand for
premium products.
Wine $127,216 9% 5% Lack of importers
handling U.S. wines American style Zinfandel
and Cabernet Sauvignon
have potential to expand
in this market.
Section V: Key Contacts
Foodstuffs (Wellington) Co-operative Society Limited PO Box 38-896 Kiln Street, Silverstream Wellington, New Zealand Attn: Eve Kelly, Purchase Manager; Andrew Loveridge Tel: +64-4-527-2510; 04-527-2655 Email: [email protected]
Foodstuffs (South Island) Co-operative Society Limited 167, Main North Road, Papanui Christchurch, New Zealand Attn: Graham May, Purchase Manager Tel: +64-3-353-8648 Email: [email protected]
Foodstuffs (Auckland) Co-operative Society Limited PO Box CX12021 Auckland, New Zealand Attn: Mr. Tony Olson, Purchase Manager Tel: +64-4-621-0641 Email:
Progressive Enterprises Private Bag 93306 Otahuhu Auckland, New Zealand Attn: Graham Walker, Business Manager Tel +64-9-275-2621 Email:
Agricultural Affairs Office Foreign Agricultural Service U.S. Department of Agriculture American Embassy 29 Fitzherbert Terrace Thorndon Wellington Tel: +64-4-462-6012 Fax: +64-4-462-6016 Email: [email protected]
Food Standards Australia New Zealand (FSANZ) 108 The Terrace Wellington 6036 New Zealand Tel: 64-4-978-5631 Fax: 64-4-473-9855 Internet Homepage:
New Zealand Food Safety Authority (NZFSA) 68-86 Jervois Quay PO Box 2835 Wellington NEW ZEALAND Phone: +64 4 463 2500 Fax: +64 4 463 2501 Email: [email protected] Internet Homepage: http://www.nzfsa.govt.nz
Ministry of Agriculture and Fisheries (MAF) PO Box 2526 Wellington New Zealand Tel: 64-4-474-4100 Fax: 64-4-474-4111 Internet Homepage:
Restaurant Association of New Zealand P.O. Box 47 244 Ponsonby Auckland, New Zealand Phone: 64-9- 378-8403 Fax: 64-9- 378-8585 Internet Homepage:

APPENDIX 1. STATISTICS
Table A. Key Trade and Demographic Information
Key Trade and Demographic Information
Agricultural Imports from All Countries US$ millions (2009) U.S. Market Share
$2,448
9%
Consumer Food Imports from All Countries US$ millions (2009) U.S. Market Share (%)
$1,654 10%
Edible Fishery Imports from All Countries US$ millions (2009) U.S Market Share (%)
$93 4%
Total Population (Millions) Annual Growth Rate (Calendar Year 2009)
4.39 million 1.28%
Urban Population (Millions) (2010) 2.9
Number of Major Metropolitan Areas1 1
Per Capita Real Gross Domestic Product (US$/2010) $22,050 (NZ$30,625)
Unemployment Rate (%) (2010) 6.4%
Per Capita Food Expenditure (US$) 2
(2010) 5,389
Percent of Female Population Employed (June 2010) 46.9%
Exchange Rate (Nov 2010) US$1 = NZ$1.29
Source: U.N. Database; Statistics New Zealand
1/ There is only one city in NZ with a population in excel of one million – Auckland with a population of
1.46million. New Zealand has three other large metropolitan areas (June 2010): Wellington region
(483,200), Christchurch region (565,800), and Hamilton region (411,500). 2/ Agricultural Affairs Office estimate.
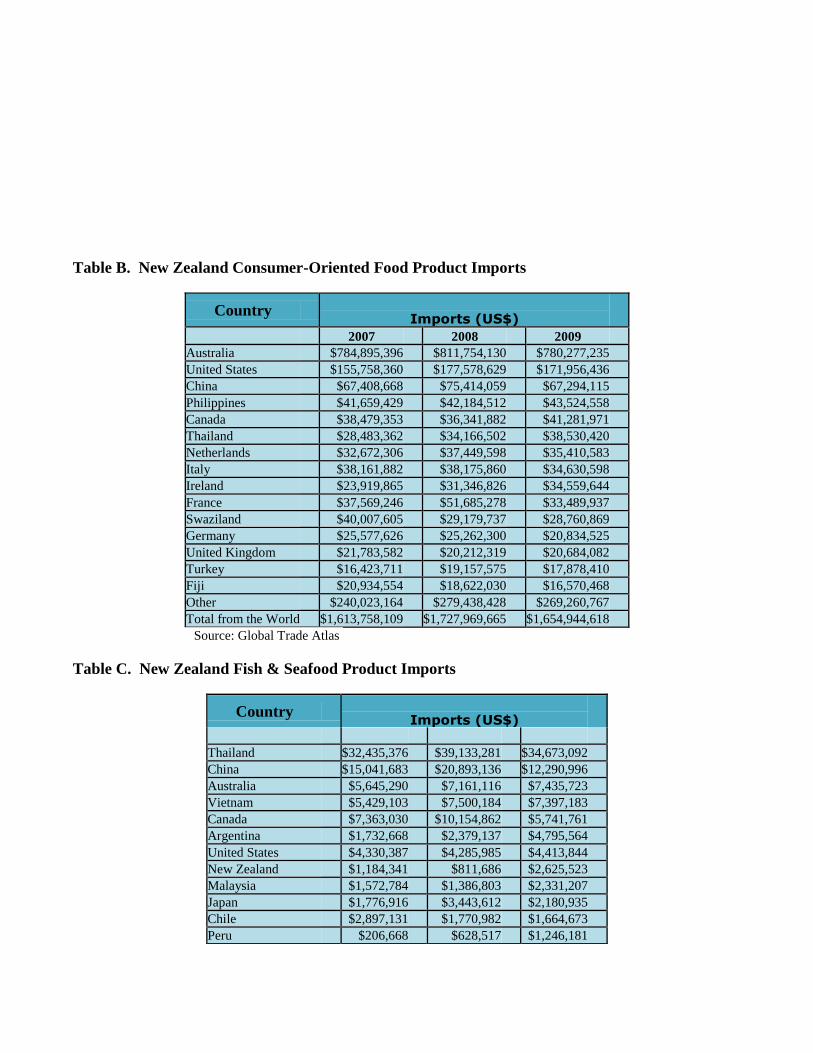
Table B. New Zealand Consumer-Oriented Food Product Imports
Country
Imports (US$)
2007 2008 2009
Australia $784,895,396 $811,754,130 $780,277,235
United States $155,758,360 $177,578,629 $171,956,436
China $67,408,668 $75,414,059 $67,294,115
Philippines $41,659,429 $42,184,512 $43,524,558
Canada $38,479,353 $36,341,882 $41,281,971
Thailand $28,483,362 $34,166,502 $38,530,420
Netherlands $32,672,306 $37,449,598 $35,410,583
Italy $38,161,882 $38,175,860 $34,630,598
Ireland $23,919,865 $31,346,826 $34,559,644
France $37,569,246 $51,685,278 $33,489,937
Swaziland $40,007,605 $29,179,737 $28,760,869
Germany $25,577,626 $25,262,300 $20,834,525
United Kingdom $21,783,582 $20,212,319 $20,684,082
Turkey $16,423,711 $19,157,575 $17,878,410
Fiji $20,934,554 $18,622,030 $16,570,468
Other $240,023,164 $279,438,428 $269,260,767
Total from the World $1,613,758,109 $1,727,969,665 $1,654,944,618
Source: Global Trade Atlas
Table C. New Zealand Fish & Seafood Product Imports
Country
Imports (US$)
Thailand $32,435,376 $39,133,281 $34,673,092
China $15,041,683 $20,893,136 $12,290,996
Australia $5,645,290 $7,161,116 $7,435,723
Vietnam $5,429,103 $7,500,184 $7,397,183
Canada $7,363,030 $10,154,862 $5,741,761
Argentina $1,732,668 $2,379,137 $4,795,564
United States $4,330,387 $4,285,985 $4,413,844
New Zealand $1,184,341 $811,686 $2,625,523
Malaysia $1,572,784 $1,386,803 $2,331,207
Japan $1,776,916 $3,443,612 $2,180,935
Chile $2,897,131 $1,770,982 $1,664,673
Peru $206,668 $628,517 $1,246,181
India $2,609,192 $1,088,188 $1,188,004
Fiji $1,341,465 $1,626,989 $1,186,303
South Korea $1,030,918 $1,420,184 $1,028,419
Other $5,057,729 $4,184,629 $3,704,339
Total from the World $89,654,681 $107,869,291 $93,903,747
Source: Global Trade Atlas
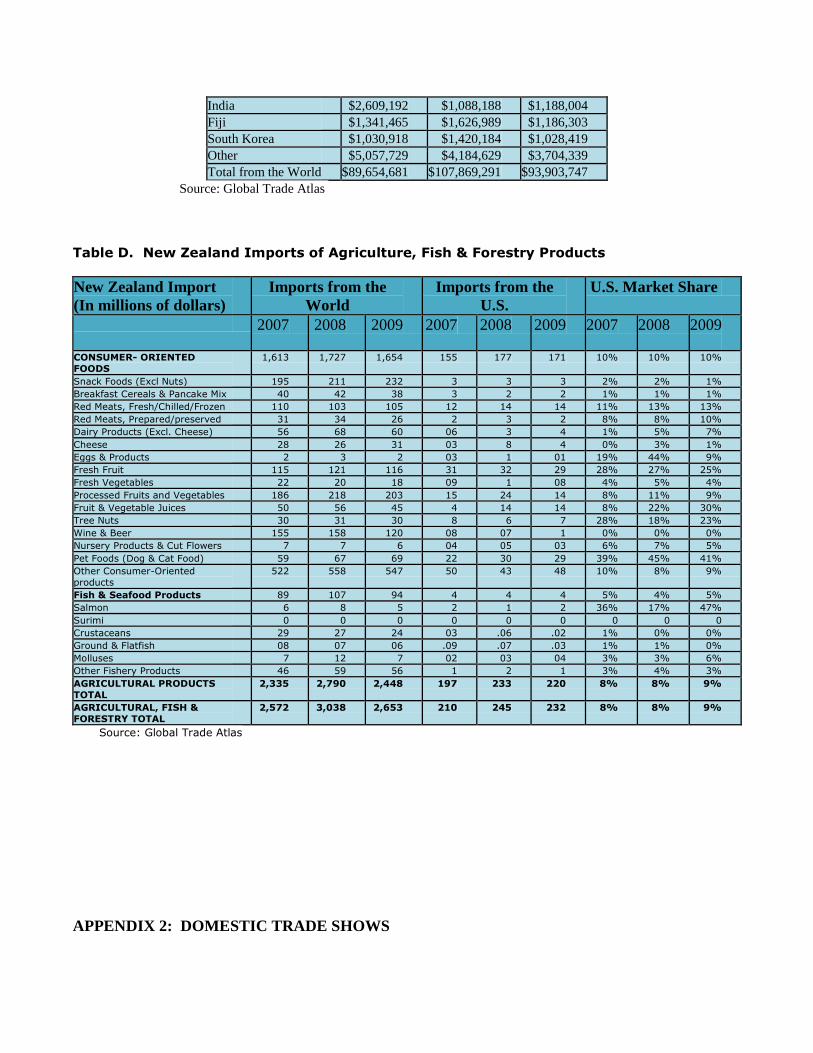
Table D. New Zealand Imports of Agriculture, Fish & Forestry Products
New Zealand Import
(In millions of dollars)
Imports from the
World
Imports from the
U.S.
U.S. Market Share
2007 2008 2009 2007 2008 2009 2007 2008 2009
CONSUMER- ORIENTED
FOODS 1,613 1,727 1,654 155 177 171 10% 10% 10%
Snack Foods (Excl Nuts) 195 211 232 3 3 3 2% 2% 1% Breakfast Cereals & Pancake Mix 40 42 38 3 2 2 1% 1% 1% Red Meats, Fresh/Chilled/Frozen 110 103 105 12 14 14 11% 13% 13% Red Meats, Prepared/preserved 31 34 26 2 3 2 8% 8% 10% Dairy Products (Excl. Cheese) 56 68 60 06 3 4 1% 5% 7% Cheese 28 26 31 03 8 4 0% 3% 1% Eggs & Products 2 3 2 03 1 01 19% 44% 9% Fresh Fruit 115 121 116 31 32 29 28% 27% 25% Fresh Vegetables 22 20 18 09 1 08 4% 5% 4% Processed Fruits and Vegetables 186 218 203 15 24 14 8% 11% 9% Fruit & Vegetable Juices 50 56 45 4 14 14 8% 22% 30% Tree Nuts 30 31 30 8 6 7 28% 18% 23% Wine & Beer 155 158 120 08 07 1 0% 0% 0% Nursery Products & Cut Flowers 7 7 6 04 05 03 6% 7% 5% Pet Foods (Dog & Cat Food) 59 67 69 22 30 29 39% 45% 41% Other Consumer-Oriented
products 522 558 547 50 43 48 10% 8% 9%
Fish & Seafood Products 89 107 94 4 4 4 5% 4% 5% Salmon 6 8 5 2 1 2 36% 17% 47% Surimi 0 0 0 0 0 0 0 0 0 Crustaceans 29 27 24 03 .06 .02 1% 0% 0% Ground & Flatfish 08 07 06 .09 .07 .03 1% 1% 0% Molluses 7 12 7 02 03 04 3% 3% 6% Other Fishery Products 46 59 56 1 2 1 3% 4% 3% AGRICULTURAL PRODUCTS
TOTAL 2,335 2,790 2,448 197 233 220 8% 8% 9%
AGRICULTURAL, FISH &
FORESTRY TOTAL 2,572 3,038 2,653 210 245 232 8% 8% 9%
Source: Global Trade Atlas
APPENDIX 2: DOMESTIC TRADE SHOWS
There are three major domestic Food Trade Shows in New Zealand:
Foodstuffs Food Show, Palmerston North (10-11 August 2011)
This is a trade-only show that exclusively targets Foodstuffs Limited supermarket store owners/buyers and distributors from
the Upper North Island and from the South Island. Foodstuffs Limited operates more than 628 supermarkets throughout New
Zealand and controls about 54 percent of New Zealand’s retail/supermarket food trade. This show alternates between fresh-
produce showcase (including seafood, deli, butchery, fresh produce and bakery) and retail/grocery foods (packaged foods).
Foodstuffs Food Show 2011 will focus on Fresh food products. Contact details are:
Foodstuff Food Show
Silverstream
Wellington, New Zealand
Atn: Joanna Fefita
Tel: +64-4-527-2607
Email: [email protected]
Katrina Gordon Show (major metropolitan centers)
This local food show takes place in 16 major cities of New Zealand, including Auckland, Wellington, Christchurch and
Queenstown in different months throughout the year. For more information, contact:
Katrina Gordon Trade Shows
PO Box 8647
Christchurch, New Zealand
Tel: 64-3-348-2042
Fax: 64-3-348-0950
Internet Homepage:
The Food Show (major metropolitan centers)
The Food Show is a consumer-focused food show. The show runs for four days, and has a preview day for trade and media
group. Last year, Auckland show attracted 300 exhibitors and 37,000 visitors. Every year, it takes place in major cities of
New Zealand, including Christchurch, Wellington and Auckland. Next year’s Food Show will take place in following
cities:
Christchurch, 8-10 April, 2011
Wellington, 27-29 May, 2011
Auckland, 28-31 July, 2011
For more information, contact:
The Food Show
PO Box 47213, Ponsonby, Auckland, New Zealand
Phone +64 9 376 4603
Fax +64 9 378 7659
Web: www.foodshow.co.nz
Fine Food Show (New Zealand) –June 17-19 June, 2012, Auckland Fine Food Show New Zealand was first organized in 2010 in New Zealand. It followed the same format as Fine Food Show
Australia, which has been running successfully in metro cities in Australia. Fine Food is an international event and attracts
companies from Europe, Australia, Asia and New Zealand. This show focuses on food and beverage and hospitality
products. This show is a trade only event, visitors from the food industry are invited to the show.

For more information please contact:
Exhibition Sales Manager
Fine Food Show New Zealand
PO Box 47213, Ponsonby,
Auckland
Atn: Gail Lorigan
Tel: +64-9-376-4603
Email: [email protected]