new york state opioid poisoning, overdose and prevention · the areas of the state where opioid...
TRANSCRIPT
New York State
OPIOID POISONING, OVERDOSE AND PREVENTION
2015 Report to the Governor and NYS Legislature

i
Acknowledgements
This report was prepared with the invaluable assistance from the following agencies:
New York State Department of Health: AIDS Institute, Bureau of Emergency Medical Services and Trauma Systems; Bureau of Occupational Health and Injury Prevention; Bureau of Narcotics Enforcement
New York State Division of Criminal Justice Services
New York State Office of Alcoholism and Substance Abuse Services
Harm Reduction Coalition
ii
Table of Contents
Acknowledgements ................................................................................................................................................................... i Introduction .............................................................................................................................................................................. iii I. Opioid-Related Overdose in New York State, 2010-2015 ................................................................................... 1 Trends in Public Health Surveillance Data in NYS .................................................................................................... 1 Drug-Related Overdose Deaths per Year and Trends Since 2009 ...................................................................... 1 Heroin............................................................................................................................................................................................. 1 Prescription Opioids ................................................................................................................................................................ 2 Opioid-Related Emergency Department Outpatient Visits: Trends Since 2010 and Most Recent Year Available ............................................................................................................................................................................ 3 Hospitalizations with Opioid-Related Inpatient Admissions ................................................................................ 5 II. Responses ................................................................................................................................................................................ 6 Expansion of the NYSDOH Opioid Overdose Prevention Program..................................................................... 6 Law Enforcement ...................................................................................................................................................................... 8 Pre-Hospital Services .............................................................................................................................................................. 8 Emergency Medical Services (EMS) Calls: Advanced Life Support and Basic Life Support ................... 8 Intranasal Naloxone for Basic Life Support EMS Agencies ................................................................................... 9 Firefighters ............................................................................................................................................................................... 10 Substance Use Disorder Treatment Trends for Opioid Dependence .............................................................. 10 Prescription Drug Reform.................................................................................................................................................. 12 The Prescription Monitoring Program Registry ..................................................................................................... 12 Results ......................................................................................................................................................................................... 12 Changes to the Controlled Substances Schedules ................................................................................................... 13 Outreach and Education .................................................................................................................................................... 15 Safe Disposal of Unused, Unwanted or Expired Controlled Substances ....................................................... 15 III. Key Legislative Changes Addressing Legal Barriers to Scaling Up Opioid Overdose Prevention with Naloxone in New York State .................................................................................................................................. 16 911 “Good Samaritan” Law .............................................................................................................................................. 16 Non-Patient Specific Prescribing (“Standing Orders”)......................................................................................... 16 The Role of Syringe Exchange Programs in Preventing Overdose Deaths and Related Harm .......... 16 Expanded Syringe Access and Safe Disposal Programs (ESAP): A Pharmacy Model ............................. 17 Combat Heroin and Prescription Drug Abuse Awareness Campaign ........................................................... 17 Newest Initiatives .................................................................................................................................................................. 18 Role of Pharmacies in Overdose Prevention .............................................................................................................. 18 Opioid Overdose Prevention Trainings for Incarcerated Individuals Soon to Be Released from Prison .......................................................................................................................................................................................... 19 Piloting Long-Acting Injectable Opioid Antagonist Treatment with Persons Under Criminal Justice Supervision ............................................................................................................................................................................... 19 Opioid Overdose Prevention Training in Schools .................................................................................................... 19 IV. Conclusions, Challenges, and Interagency Action Plans ............................................................................... 20 Appendix A - Legal Actions Related to Opioid Overdose Prevention: Timeline......................................... 24 Appendix B - Opioid Overdose Related Mortality Data 2008-2013 ................................................................ 27 Appendix C - Emergency Department Admissions ................................................................................................. 34 Appendix D - Opioid-Related Inpatient Hospitalizations .................................................................................... 38 Appendix E - Naloxone Distribution to Registered Programs, 2007-2015 ................................................. 43 Appendix G - Emergency Basic Medical Services .................................................................................................... 46 Appendix I - Online Resources .......................................................................................................................................... 50
iii
Opioid Related Overdose Annual Report 2015
Introduction
Public Health Law section 3309 requires submission of a report on opioid related overdose.This report provides an overview of opioid-related mortality and morbidity and other consequences of heroin and prescription opioid misuse across the state over the last five years. It also summarizes new and expanded initiatives and collaborative cross-disciplinary efforts to identify, assess, and address those problems.
The report reflects the work of many state and local government agencies,1 which have collected, shared and examined data to identify where and to whom opioid overdoses are occurring, and to help inform timely, effective public health and public safety policy and practices to reduce the related deaths, disease, and social harms affecting New York’s communities.
Death from drug poisoning is a national issue. According to the Centers for Disease Control and Prevention (CDC), drug poisoning is the leading cause of injury-related mortality in the United States and was associated with 47,055 lives lost in 2014. About 61 percent of drug poisoning deaths were attributed to opioids, such as heroin and prescription opioid analgesics in 2014. Heroin-related overdose deaths have tripled across the country from 2011 to 20142.
A bedrock of New York State’s (NYS) response has been training first responders and other likely witnesses to recognize and respond to overdoses, and providing access to naloxone to reverse opioid overdoses, a practice implemented in 2006 by community harm reduction programs under Public Health Law Section 3309. Demand for overdose prevention trainings has grown substantially over the past two years, and the NYS Department of Health (NYSDOH) has responded by training responders to go out and train others. As of this writing, more than 225 agencies across NYS have registered with NYSDOH as overdose prevention programs, and have trained more than 75,000 overdose responders who have documented more than 1,800 overdose reversals. Building on the community overdose prevention model, NYSDOH has formed strong collaborations with community partners and with state and local government agencies concerned with health, behavioral health, public safety and education to help turn the tide of opioid-related deaths.
The goal is to ensure that those who either witness or are first on the scene of an overdose have appropriate training to keep victims alive until they can receive medical attention. This report reviews newer initiatives as well as developments in longstanding community overdose prevention programs.
These initiatives would not be possible without the legal and regulatory actions that allow for enhanced fatal overdose prevention among a wider population socially and geographically where heroin and prescription opioid fatalities have increased. Appendix A is a timeline of the statutory and regulatory changes.
The rise of heroin and pharmaceutical opioid use has increased the need and demand for treatment across the state. Treatment with opioid agonist medications has long been shown to prevent overdose fatalities and the spread of HIV, Hepatitis viruses and help people live healthy lives. NYSDOH is working collaboratively with the NYS Office of Alcoholism and Substance Abuse Services (OASAS) and medical educational and professional organizations to increase
1 See Acknowledgements. 2 Centers for Disease Control and Prevention Morbidity and Mortality Weekly Report, January 1, 2016/ 64(50); 1378-82.
iv
access to evidence-based medical treatment for opioid dependence and addiction, prioritizing the areas of the state where opioid overdose is high and treatment access is low.
NYS has dedicated considerable resources in 2014-15 and 2015-16 to its agencies in response to the rising number of overdose deaths. From 2006 to 2013, NYSDOH had less than $300,000 annually in State funding to provide naloxone to registered opioid overdose prevention programs. In 2014-15, NYSDOH, OASAS and NYS Division of Criminal Justice Services (DCJS) spent more than $3.5 million on naloxone, an amount which will increase in 2015-16.
NYS spends $1.2 billion annually to support the OASAS prevention, treatment, and recovery system, another bedrock in addressing the opioid epidemic. This includes $111 million annually in federal Substance Abuse Prevention and Treatment (SAPT) Block Grant funding.
OASAS also received $ 2 million for the Combat Heroin Campaign. In addition, in September 2014, OASAS was awarded more than $8 million in federal funds to help prevent prescription drug misuse and abuse, heroin use, and heroin/prescription opioid overdose among people ages 12-25. OASAS recently awarded 10 local coalitions an average of $627,000 each from those funds for prevention efforts through September 2019.
This report concludes with a summary of anticipated challenges, as well as plans and opportunities for enhanced early response to, and prevention of, further opioid-related morbidity and mortality.

1
I. Opioid-Related Overdose in New York State, 2010-2015
Trends in Public Health Surveillance Data in NYS3
During the last five years for which data are available on opioid use, misuse, morbidity, and mortality, both heroin and opioid analgesic-related deaths have increased:
2,175 drug-related deaths were reported in 2013, 40 percent more than in 2009.
Heroin was involved in 637 (29 percent) of drug-related deaths in 2013 vs. 242 (16 percent) in 2009.
Opioid analgesic-related deaths increased 30 percent from 2009 to 2013 (from 735 to 952).
Naloxone was administered during 11,992 emergency medical services (EMS) calls in 20144, a 57 percent increase from the previous year (7,649 in 2013).
Opioid-related emergency department visits increased 73 percent from 2010 to 2014.
75,110 opioid-related inpatient hospital admissions were reported in 2014; an increase of 3 percent from 2010.
118,875 (42 percent) of the 281,800 admissions to NYS certified substance abuse treatment programs in 2014 included “any opioid” as the primary, secondary or tertiary drug problem, up 19 percent from 2010 (100,004).
Drug-Related Overdose Deaths per Year and Trends Since 20095
In 2009, there were 1,538 reported deaths from unintentional drug poisonings in NYS. Toxicology tests identified heroin in 242 (16 percent) of these deaths, and opioid analgesics in 735 (48 percent). In 2013, the latest full year for which data are available, the number of reported drug overdose deaths increased to 2,175, a 41 percent increase from 2009. The number of heroin-related deaths increased in 2013 to 637, and opioid analgesics related deaths rose to 952, increases of 163 percent and 30 percent from 2009, respectively.
Heroin
In 2013, an average of two New Yorkers a day died of heroin-related overdoses. More than four times as many men (n=516) died of one of these overdoses compared to women (n=121). Whites died of heroin-related overdoses at a rate of nearly twice that of Blacks (3.95 compared to 2.12), and almost 1.35 times that of Hispanics (2.93).6
3 Data are not uniformly reported for the same time frames and may not fully capture activities or events for
the periods reported. 4 Pre-hospital services data reflect only EMS calls that were reported electronically to the Bureau of
Emergency Medical Services and Trauma Systems. Although the transition to electronic reporting is nearly complete, up to 10 percent of EMS activities are recorded on paper, and not yet reflected in the reported data.
5 These data represent deaths in which the presence of heroin or opioid analgesics was indicated in toxicology, and they are defined as heroin and opioid-related accidental deaths. Note that there may be overlap between heroin and opioid analgesics reported. Vital Records lists the underlying cause of death as death from drug overdose (X40-44, X60-64, X85, or Y10-14).
6 The heroin overdose rates were calculated based on White, Black and Hispanic population data for New York per 100,000 provided by the U.S. Census for 2010. Rates are used here because of the differences
2
The upward trend in heroin-related overdose fatalities among younger New Yorkers is particularly alarming. Half the people who died were under age 35; the numbers rose from 85 deaths in 2009 to 313 in 2013, a 268 percent increase. Of those 313 deaths, 210 were people aged 25-34 and 103 were aged 15-24. The number of deaths increased among people in all age categories from the previous year. (See Appendix B.)
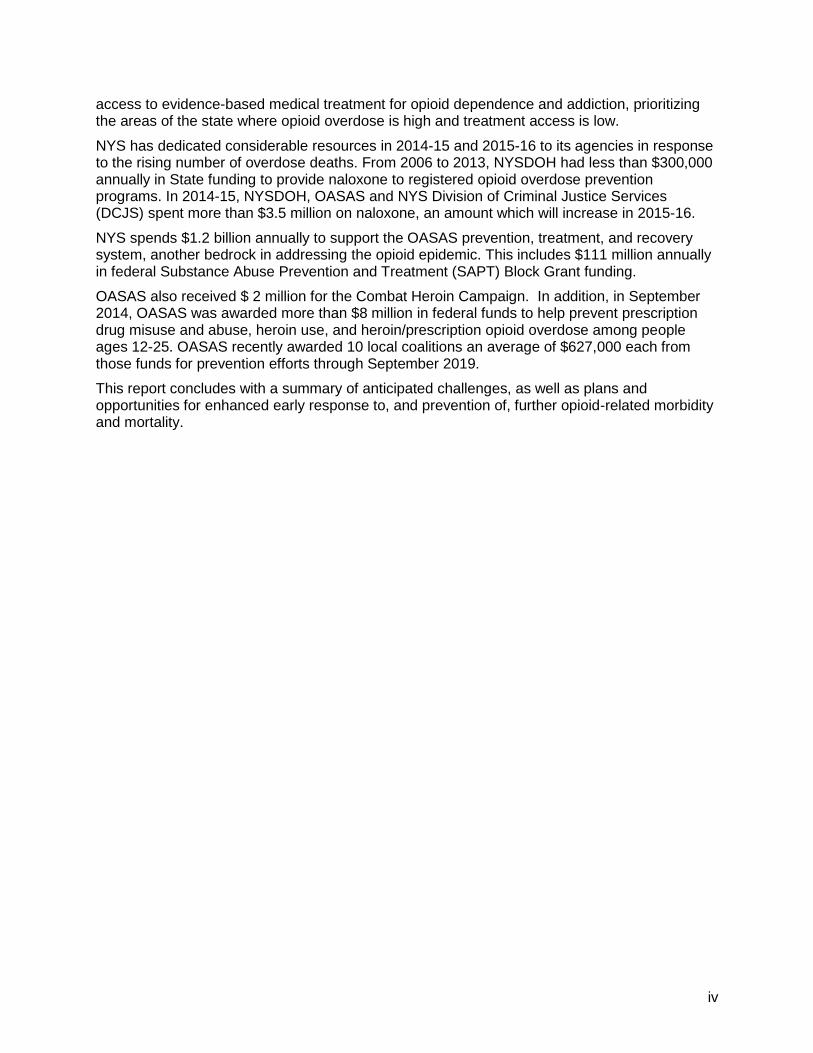
The highest rates of heroin-related overdose fatalities from 2009-2013 were seen in Dutchess, Suffolk and Bronx counties. In 2015, the CDC compiled a list of all counties in the United States with more than 20 reported heroin-related deaths over that time period. Below are the numbers and rates of NYS counties from the CDC’s list:
Figure 1: Total Drug Deaths by NYS County Involving Heroin Between 2009 and 2013 (Counties with 20 or more total deaths)
* Rates are per 100,000 population. Source: Centers for Disease Control and Prevention, 2015.
Prescription Opioids
The 952 drug-related deaths in 2013 involving prescription opioids (also called “opioid analgesics”) represent more than 18 fatalities weekly. The number of New Yorkers aged 45-54, historically the most affected of all age categories, reached a record high of 279 analgesic-associated deaths that year. Nearly twice as many men (612) as women (340) succumbed to these overdoses. Whites died of opioid analgesic-related overdoses at twice the rate of Blacks and Hispanics (6.5 compared to 2.98 and 2.84, respectively).7 Eight deaths were counted among Asian/Pacific Island New Yorkers in 2013 and none among American Indians/Alaska Natives; however, these racial and ethnic classifications may not reflect the true impact on these populations because of imprecise and incomplete reporting.8
in the racial make-up of New York residents. The 2010 census estimated New York’s population at 19,378,112; 11,304,247 as White; 2,783,857 as Black; and 3,416,922 as Hispanic.
7 Opioid analgesic death rates were calculated in the same manner as heroin deaths (see FN 6 above). 8 See Appendix B.
3
Opioid-Related Emergency Department Outpatient Visits: Trends Since 2010 and Most Recent Year Available
Hospital emergency departments (EDs) play an important role in the treatment of drug poisoning, and they also see many individuals who are at risk for opioid overdose.
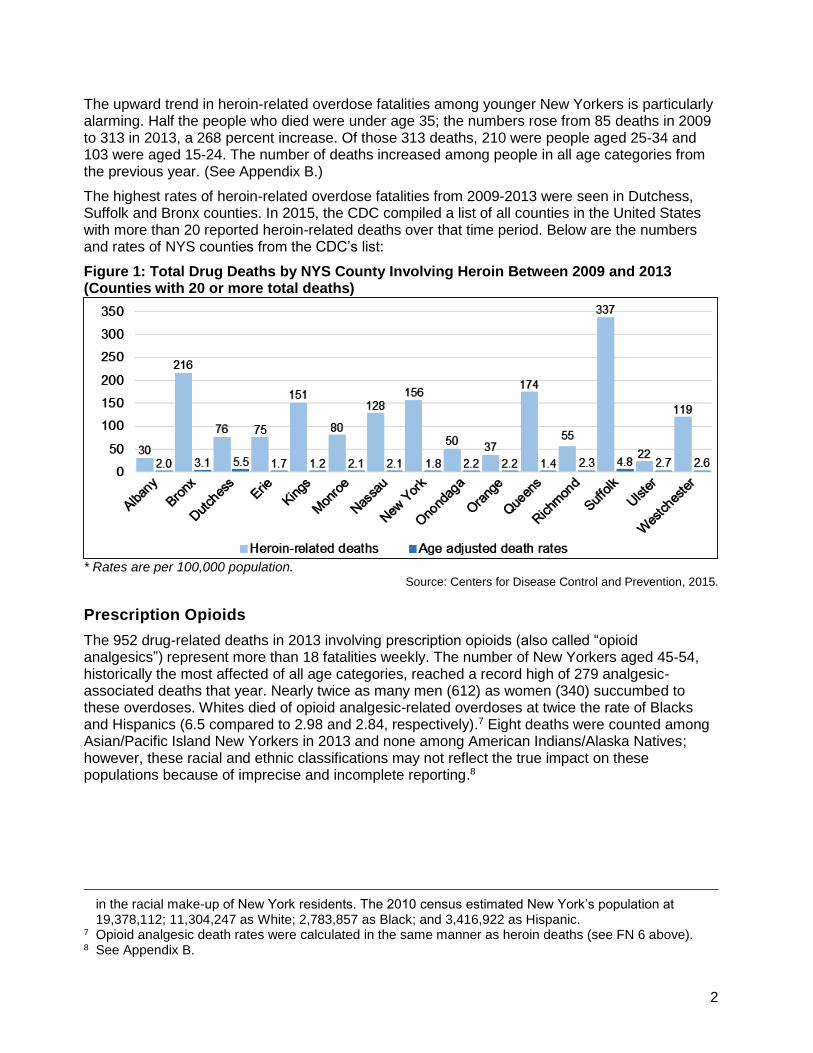
Statewide, there were 37,347 opioid-related outpatient ED visits9 in 2014, a 73.1 percent increase from 2010.10 Although these data do not necessarily reflect overdoses, they show the increasing prevalence of opioids in ED visits. Table 1 shows the growth (in frequency and rates) in opioid-related hospital ED visits for New York City (NYC) and for the regions outside NYC for the most recent five years. The steep rise in ED visits outside NYC is clearly seen in Table 1 and Figure 2. Appendix C shows opioid-related ED visits for each county.
Table 1: Outpatient Emergency Department Use Without Hospitalization for a Diagnosis of Heroin, Methadone and/or Opioid-Related Narcotics Use by NYC vs. Rest of New York State, 2010-2014*
Region 2010 2011 2012 2013 2014 2010-2014
% Change N Rate N Rate N Rate N Rate N Rate
New York City 8,409 102.9 10,782 131.9 12,534 153.3 12,916 158.0 14,691 179.7 74.7%
Rest of State 12,554 112.1 14,083 125.7 17,645 157.5 19,271 172.0 21,576 192.6 71.9%
Unknown 843 N/A 1,005 N/A 1,302 N/A 1,723 N/A 1,480 N/A N/A
NYS Total 21,806 112.5 25,870 133.5 31,481 162.5 33,910 175.0 37,747 194.8 73.1%
* The rates are calculated based on the number of ED visits per 100,000 population. The population is based on U.S. Census Bureau data 2010.
Source: Statewide Planning and Research Cooperative System (SPARCS)11, June 2015. Prepared by the NYSDOH, AIDS Institute, July 2015.
9 The 37,347 total of opioid-related outpatient emergency department visits for 2014 represents only those
who were admitted to the ED, and not subsequently admitted as an inpatient from the ED to the hospital. 10 . The 2014 data for all ED visits was calculated on July 7, 2015; and opioid-related visits was calculated
on June 24, 2015 based on these ICD-9 data codes: 304, 304.7,305.5,E850.0, E850.2, 935.1,935.2,965,965.01,965.02,965.09.
11 SPARCS is a comprehensive all-payer data reporting system established in 1979 as a result of cooperation between the health care industry and government. SPARCS collects patient-level detail on patient characteristics, diagnoses and treatments, services, and charges for each hospital inpatient stay and outpatient (ambulatory surgery, emergency department, and outpatient services) visit; and each ambulatory surgery and outpatient services visit to a hospital extension clinic and diagnostic and treatment center licensed to provide ambulatory surgery services. The enabling legislation for SPARCS is located under Section 28.16 of the Public Health Law (PHL). SPARCS regulations are under Section 400.18 of Title 10 (Health) of the Official Compilation of Codes, Rules, and Regulations of the State of New York (NYCRR).” https://www.health.ny.gov/statistics/sparcs/
4
Figure 2: Number of Opioid-Related Outpatient Emergency Department Visits by NYC vs. Rest of New York State, 2010-2014
Source: Statewide Planning and Research Cooperative System (SPARCS) June 2015.
Prepared by NYSDOH, AIDS Institute, July 2015.
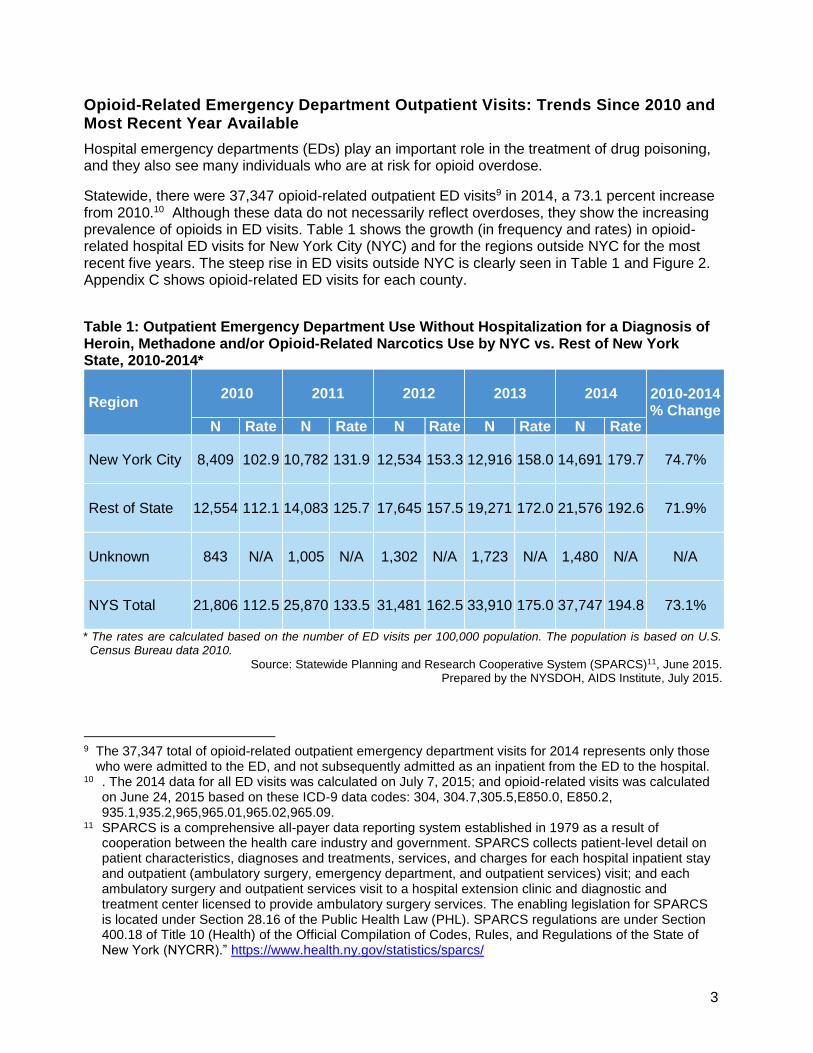
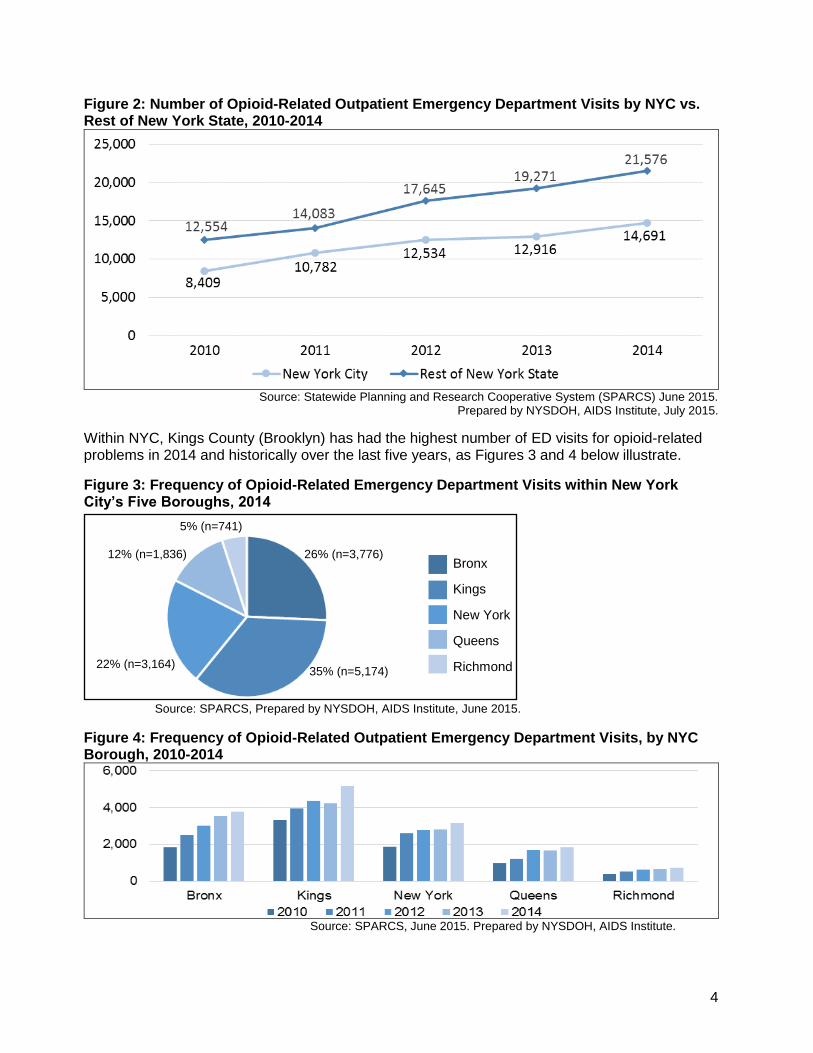
Within NYC, Kings County (Brooklyn) has had the highest number of ED visits for opioid-related problems in 2014 and historically over the last five years, as Figures 3 and 4 below illustrate.
Figure 3: Frequency of Opioid-Related Emergency Department Visits within New York City’s Five Boroughs, 2014
Source: SPARCS, Prepared by NYSDOH, AIDS Institute, June 2015.
Figure 4: Frequency of Opioid-Related Outpatient Emergency Department Visits, by NYC Borough, 2010-2014
Source: SPARCS, June 2015. Prepared by NYSDOH, AIDS Institute.
22% (n=3,164)
26% (n=3,776)
5% (n=741)
12% (n=1,836) Bronx
Kings
New York
Queens
Richmond 35% (n=5,174)

5
Hospitalizations with Opioid-Related Inpatient Admissions
Using the same SPARCS data codes for ED visits, NYSDOH examined the number of admissions to hospitals statewide with opioid-related diagnoses over the last five years. In 2014, there were 75,110 opioid-related inpatient hospital admissions. Of those, 64 percent (48,170) came via the emergency department. Adding those admissions to the outpatient-only ED visits (37,747), the total opioid-related ED visits to NYS emergency rooms in 2014 was 85,917.
The 75,110 opioid-related inpatient hospital admissions are a 3.4 percent increase from 2010, and nearly unchanged from the year before. Nearly 60 percent of these admissions were male (47,149).
Nine counties had rates of opioid-related hospital admissions higher than the state’s average of 387.6 per 100,000 population. (See Appendix D for the numbers and rates for all counties.) Bronx County had both the highest number of opioid-related admissions (11,900) and the highest rate, 585.8. Among larger counties (population greater than 100,000), St. Lawrence had the highest rate (and the second-highest rate of all counties). Among smaller counties, Greene County had the highest rate (and the fourth highest rate of all counties). Conversely, for the first time since 2010, the numbers of opioid-related hospital admissions went down in 28 counties.12
Figure 5: 2014 Rates* of Opioid-Related Inpatient Hospital Admissions by County
* Rates are per 100,000 population.
Source: SPARCS. Prepared by NYSDOH AIDS Institute, June 2015.
12 SPARCS June 2015 report on frequency and rates of opioid-related hospital admissions by county.
Attached in Appendix D, Tables D1-A, B.
6
II. Responses
Naloxone is made available for registered programs throughout NYS at no cost. NYSDOH provides naloxone to all requesting programs outside NYC. Within NYC, NYSDOH provides naloxone for intramuscular administration to all requesting programs, as well as intranasal naloxone to drug treatment providers. The New York City Department of Health and Mental Hygiene (NYCDOHMH) provides intranasal naloxone to registered programs within NYC that are not drug treatment programs.
Expansion of the NYSDOH Opioid Overdose Prevention Program
NYS is a leader in the implementation of public health programming to prevent death from opioid overdoses. Its multi-pronged approach focuses on building overdose response capacity within communities throughout the State. Complementing the longstanding efforts by Emergency Medical Services agencies throughout NYS, this community capacity comprises trained responders, including opioid-dependent individuals, their families and friends, staff of agencies who work with people who use drugs, law enforcement personnel, firefighters, drug treatment providers, prison guards, prisoners about to be released and their family members, and others.
The core of this program is for community “laypersons” to be trained by organizations registered with NYSDOH to recognize and respond to opioid overdoses. These individuals are known as trained overdose responders.13
Under regulation, these entities may maintain regulated opioid overdose prevention programs:
Health care facilities, such as hospitals and diagnostic and treatment clinics that are regulated by NYSDOH under Public Health Law
Individual medical practitioners—including physicians, nurse practitioners and physician assistants—as long as they are legally authorized in NYS to prescribe medication
Drug treatment programs that are licensed under New York’s Mental Hygiene Law
Community-based organizations incorporated under the Not-for-Profit Corporation Law
Local and state government agencies
Public safety agencies
Institutions of higher education, approved by the Regents of the University of the State of New York, which provide a course of study leading to a post-secondary degree or diploma
13 The following definition appears in the regulations: “Trained overdose responder means any individual
not otherwise permitted by law to administer an opioid antagonist, who is either: (i) an opioid antagonist recipient as defined in PHL Section 3309 who has successfully completed an opioid overdose prevention training curriculum offered by an authorized opioid overdose prevention program and has been authorized by a registered provider to possess the opioid antagonist; (ii) a public safety officer who has completed a curriculum approved by the Division of Criminal Justice Services for purposes of intervening in opioid overdoses prior to the arrival of emergency medical services; or (iii) a firefighter who has completed a comparable curriculum approved by the department.”
More than 83,000 people have been trained as overdose prevention responders through registered programs in NY.

7
Business, trade, technical and occupational schools approved by the Regents of theUniversity of the State of New York or by a nationally-recognized accrediting agency orassociation accepted by the Regents
Pharmacies registered under the Education Law
NYSDOH’s community overdose prevention and naloxone distribution program began in 2006. As of December 31, 2015, 270 programs have registered and are active. The registered programs include the 12 Addiction Treatment Centers operated by OASAS.
Table 2: Overdose Responders Trained in 2015
Time Frame Law Enforcement14 Firefighters All Others All Responders
1st Quarter 2015 4,071 240 5,896 10,207
2nd Quarter 2015 4,469 834 9,531 14,834
3rd Quarter 2015 670 78 7,903 8,651
4th Quarter 2015 1,035 323 11,258 12,616
Total for 2015 10,245 1,475 36,753 48,473
Source: NYSDOH, AIDS Institute, March 2016.
The number of registered community programs is growing dramatically. For example, just 86 programs were approved between 2006 (when the program started) and 2013. In contrast, 102 new programs were approved during 2014 alone, with 70 more were added in 2015.
Table 3: Summary of Naloxone Administration Reports through December 2015*
Program Type Program Inception
Prior to 2013
2013 2014 2015 Total Since Inception
Community Program 2006 709 177 310 504 1,700
Law Enforcement 2014 NA NA 137 963 1,100
Firefighters 2015 NA NA 1 141 142
Total 709 177 448 1,608 2,942
* Reports of naloxone administrations are current as of December 2015 for the Community Program andthe for public safety (law enforcement and firefighters) programs. They do not include EMS naloxoneadministrations.
Source: NYSDOH, AIDS Institute, December 2015.
As of the end of December 2015, 1,700 naloxone administrations had been reported by community programs, resulting in 1,636 overdose reversals (96 percent). Due to data reporting challenges, these 1,636 reports are thought to be a fraction of the actual number of overdose administrations by community programs. Each reversal may be considered a life saved. Nearly 310 were reported in 2014, and 504 in 2015, respectively.15
Community programs in 45 counties reported at least one administration of naloxone, led by Erie (296), then Manhattan (279), and the Bronx (248). Most naloxone administrations took place in a
14 The count of trained law enforcement officers includes those officers who have received training under NYSDOH training. It does not include NYPD and those trained under the Attorney General’s Office. They have separate reporting systems.
15 The figures do not include administrations of naloxone made by public safety personnel nor by EMS (see Table 2). NYSDOH AIDS Institute, 8/4/15.3
8
private residence (888), followed by on the street (303). Most of those receiving naloxone were male (69 percent), White (56 percent) and under age 45 (71 percent), with those between the ages of 25-34 (32 percent) representing the greatest number of overdosed individuals. In 76 percent of the reports, the person receiving naloxone was reported to have injected heroin.16
Law Enforcement
Law enforcement agencies from 56 counties have submitted reports of naloxone administrations to NYSDOH as of December 31, 2015. The greatest number came from Suffolk County (234), followed by Erie County (231). As 2015 ended, 770 trained law enforcement responders reported that 958 individuals (87.3 percent) to whom they had administered naloxone responded to it. Fifty-two of them (4.7) did not live. Similar to the community reports, heroin was reported to be involved in 75.8 percent of the instances when naloxone was administered, and police also reported that those between the ages of 25-34 were the largest group to whom they administered naloxone (42.4 percent).17
Law enforcement officers who patrol community streets can help prevent opioid overdose fatalities. For example, under the State’s Basic Life Support Service, some Suffolk County police officers were trained as Emergency Medical Technicians (EMTs), and began reporting overdose reversals made while on patrol. Their use of naloxone helped catalyze statewide opioid overdose training tailored to law enforcement officers, using intranasal naloxone administration. With collaboration by NYSDOH, DCJS, OASAS, the Harm Reduction Coalition, Albany Medical Center and other local partners, the first law enforcement training was held in April 2014. As of December 2015, close to 8,000 law enforcement personnel had been trained (N=7,873). Each trained officer was given a naloxone kit free of charge.
Addressing opioid misuse and overdose fatalities has become a national priority. Staff of the Office of National Drug Control Policy (ONDCP) inquired about using New York’s police training as a model for other states. ONDCP Director Michael Botticelli attended a training session in Queens in October 2014. The Department of Justice has included DCJS‘s resources in the Bureau of Justice Assistance’s online toolkit to educate police officers about naloxone, how other law enforcement officers are using it, and how they can develop their own overdose prevention programs.
Pre-Hospital Services
Emergency Medical Services (EMS) Calls: Advanced Life Support and Basic Life Support
NYS has an expanding, but not yet complete, system for the electronic submission of patient care reports for pre-hospital service calls. In 2013, 7,649 of these reports included administration of
16 The metrics used to capture program activities have improved significantly in the past year. Under
revisions to the regulations in 10 NYCRR 80.138 instituted in the fourth quarter of 2014, all registered opioid overdose prevention programs are required to report quarterly to NYSDOH on the number of newly trained overdose responders and the number of doses of naloxone furnished to them.
17 See Law Enforcement Reports in Appendix F.
“Patient was found unconscious in back seat of vehicle of an apparent opiate overdose. Officer administered 2mg of Narcan to the aided in which she began to start breathing and regain consciousness.”
- Suffolk County Police Department

9
naloxone. In 2014, this number rose to 11,992, a 57 percent increase. Preliminary data for 2015 indicate a continuing trend.
Intranasal Naloxone for Basic Life Support EMS Agencies
Although naloxone has been used for decades by Advanced Life Support EMS agencies to reverse opioid overdoses, its use in NYS’s Basic Life Support (BLS) agencies is recent. Many areas of NYS rely on BLS agencies to provide emergency medical response through their Basic Emergency Medical Technicians (EMT-Bs) and their Certified First Responders (CFRs). Equipping them with intranasal naloxone could expand significantly the reach of this life-saving medicine into communities where it is needed.
In October 2013, the NYS Emergency Medical Advisory Committee (SEMAC) recommended expansion of the permissible scope of practice of EMT-Bs and CFRs who are part of a BLS agency to include intranasal naloxone administration.18
The SEMAC recommendation and NYSDOH guidelines are the outgrowth of a demonstration project led by the Regional Emergency Medical Organization in the Capital District. This demonstration project, conducted in a handful of EMS regions across the State from April 2012-December 2013, included development of web-based training and accompanying materials, as well as hands-on trainings.19
Outcomes from the 20-month demonstration project include:20
2,035 EMT-Bs were trained.
223 opioid overdose reversals were reported by trained responders.
10 percent of contacted reversals entered rehabilitation programs.
75 percent of the overdosed individuals were male.
72 percent were under 35 years old.
Heroin was identified as the source of the overdose in 66 percent of the calls; an unknown opioid in 16 percent; and oxycodone/hydrocodone in 6 percent.
No adverse events were reported. There were instances of anger and agitation after successful naloxone administration, consistent with overdose reversal, but no reported assaults or injuries to crew.
EMT-Bs readily accepted naloxone into their life-saving arsenal.21
In the wake of the demonstration program and the issuance of NYSDOH guidelines for statewide implementation, another 8,469 responders viewed the online training video, bringing the number of trained EMT-Bs and CFRs to 10,504.
To date, 379 BLS agencies are using intranasal naloxone.
18 Policy Statement 13-10 issued on December 10, 2013. 19 See Appendix G. 20 Source: Albany Medical College, University of Rochester, NYSDOH AIDS Institute, and NYSDOH
Bureau of Emergency Medical Services and Trauma Systems. See Appendix G “Distributive Education can be used to Teach Basic EMTs to Treat Opioid Overdose with Intranasal Naloxone.” 2015.
21 NYS DOH Bureau of Emergency Medical Services and Trauma Systems, June 2015.
Statewide, 716 advanced life support agencies and 379 basic life support agencies are currently equipped with naloxone.
10
NYSDOH continues to work with the Regional EMS Councils to coordinate the reporting of naloxone administrations on EMS calls.
Firefighters
In a newer initiative, and with support from OASAS, NYSDOH has been working with regional EMS Councils to help roll out and coordinate trainings for non-EMS fire departments. NYSDOH and the Office of Fire Prevention and Control (OFPC) within the Division of Homeland Security and Emergency Services (DHSES) have approved a training curriculum, with state-certified fire instructors providing the trainings.
In June 2015, NYSDOH, DHSES and OASAS held an inaugural training for 30 firefighters at the West Albany Fire Department. The event received significant media coverage: The Associated Press ran a national story, and the news was also broadcast on local television. Additional trainings occurred throughout the year. As of June 2015, 12 regional EMS program agencies have registered as opioid overdose programs to train their local fire departments.
Substance Use Disorder Treatment Trends for Opioid Dependence
NYS’s treatment system for substance use disorders consists of crisis services and non-crisis treatment services. Crisis services include hospital-based detoxification and medically monitored or supervised services in free-standing or hospital settings. Non-crisis treatment services include opioid (methadone, long acting injectable naltrexone and buprenorphine) treatment programs, other outpatient treatment, inpatient rehabilitation and residential programs. Lengths of stay in these settings vary. These programs serve an average of 97,000 individuals on any given day. In 2013, OASAS approved the development of new 25-bed residential facilities to serve young people ages 18-24 on Long Island and in Western New York. Both are expected to open in 2017. A third 24-bed facility opened in September 2014 in Staten Island. Finally, OASAS is expected to award 50 new residential treatment beds to the Southern Tier and Western New York in the first half of 2016.
OASAS reported 281,800 admissions to NYS-certified substance abuse treatment programs in 2014, of which 118,875 (42 percent) included “any opioid” as the primary, secondary or tertiary drug problem.22 Opioid admissions increased by 19 percent from 2010-2014. Inpatient treatment programs experienced the largest increase; 27 percent more than in 2010. Crisis treatment programs had the most opioid admissions in 2014 (42,398), an increase of 16 percent over 2010.23
The biggest group of NYS residents admitted to treatment programs with a primary substance abuse of heroin or other opioids were between the ages of 20-29 in 2014, comprising 39 percent (37,668 of the total 95,739), which was an increase of 49 percent in that age group from 2010.
22 “Any opioid admission” means an admission to a treatment program where the primary, secondary or
tertiary substance of abuse was heroin or a prescription opioid. All OASAS admissions data in this report refers to NYS residents.
23 See Table H-2 in Appendix H.
"… It is critical that non-EMS fire departments and all emergency responders receive this training, which is particularly useful when firefighters are dispatched to overdose situations and arrive prior to EMS. One preventable overdose is one too many, and I encourage departments across the state to sign up for this potentially life-saving training." - DHSES Commissioner John P. Melville, June 16, 2015.
11
Overall, New Yorkers under age 40 made up 64 percent of the opioid treatment admissions, with approximately 45 percent from upstate, 40 percent from NYC and 14 percent from Long Island.
Heroin was reported as the primary drug in 81 percent of the opioid treatment admissions in 2014, an increase of 39 percent over 2010. Nearly two-thirds of these patients reported daily use of heroin, up from 52 percent from 2010.
Prescription opioids were reported as the primary drug in 4 percent fewer treatment admissions in 2014 than in 2010 (18,092 compared to 18,767), and the number reporting daily use decreased as well, by 13.6 percent.24
In addition to OASAS-certified programs, physicians who take specialized training and receive federal certification (“waiver”) may prescribe buprenorphine to their patients in general practice settings to treat opioid dependence and addiction. This has the potential to expand access to treatment, while addressing demographic and geographic changes in opioid use and misuse. In NYS, 91 opioid treatment programs have the federal waiver to prescribe buprenorphine. 25 In 2014, a total of 14,000 people in OASAS-certified treatment programs received buprenorphine to treat their opioid addiction.26
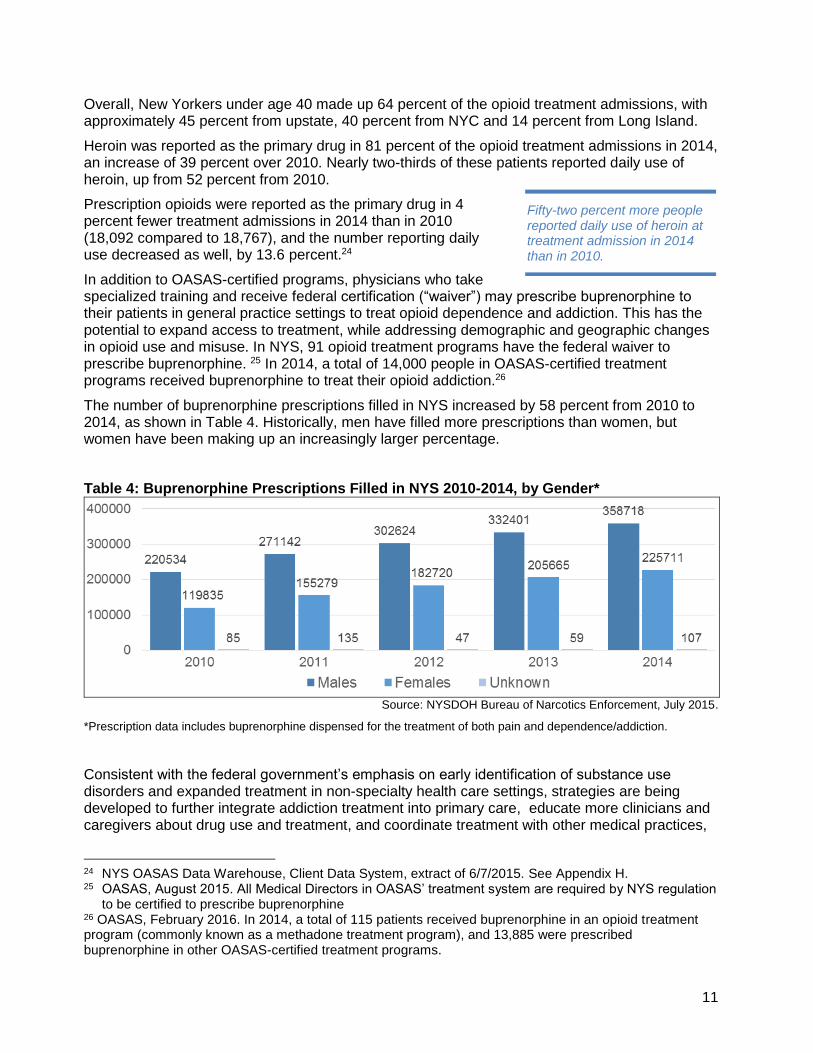
The number of buprenorphine prescriptions filled in NYS increased by 58 percent from 2010 to 2014, as shown in Table 4. Historically, men have filled more prescriptions than women, but women have been making up an increasingly larger percentage.
Table 4: Buprenorphine Prescriptions Filled in NYS 2010-2014, by Gender*
Source: NYSDOH Bureau of Narcotics Enforcement, July 2015.
*Prescription data includes buprenorphine dispensed for the treatment of both pain and dependence/addiction.
Consistent with the federal government’s emphasis on early identification of substance use disorders and expanded treatment in non-specialty health care settings, strategies are being developed to further integrate addiction treatment into primary care, educate more clinicians and caregivers about drug use and treatment, and coordinate treatment with other medical practices,
24 NYS OASAS Data Warehouse, Client Data System, extract of 6/7/2015. See Appendix H. 25 OASAS, August 2015. All Medical Directors in OASAS’ treatment system are required by NYS regulation
to be certified to prescribe buprenorphine 26 OASAS, February 2016. In 2014, a total of 115 patients received buprenorphine in an opioid treatment program (commonly known as a methadone treatment program), and 13,885 were prescribed buprenorphine in other OASAS-certified treatment programs.
Fifty-two percent more people reported daily use of heroin at treatment admission in 2014 than in 2010.

12
including but not limited to family medicine, infectious disease, pain and palliative care, orthopedics and emergency medicine to help increase access to treatment and save lives.
OASAS is also expanding the use of long-acting naltrexone, an opioid antagonist given as a monthly injection to block the effects of heroin and other opioids.
Prescription Drug Reform
Millions of prescriptions for opioid analgesics are written in NYS each year. Some are diverted, misused, or abused, and result in addiction, accidental overdose deaths, and other social costs. In 2012, Governor Cuomo signed the Prescription Drug Reform Act to help stem the rising death toll and social costs. The act updated the Prescription Monitoring Program (PMP) to mandate its use, and make it more current and user-friendly. The law also changed the scheduling of certain controlled substances to enable enhanced monitoring, public and professional education and outreach, and safe disposal of these drugs. The PMP Registry, also known as I-STOP, went into effect in August 2013, pursuant to Public Health Law Section 3343-a.
The Prescription Monitoring Program Registry
The NYSDOH Bureau of Narcotic Enforcement (BNE) Prescription Monitoring Program collects and analyzes dispensed controlled substance data from pharmacies and dispensers. The data, consisting of patient, prescriber, pharmacy and controlled substance prescription information, become the basis for the information available to practitioners and pharmacists through the online PMP. Practitioners and pharmacists are provided a patient’s current controlled substance prescription information to better evaluate drug therapy and to inform a practitioner of other controlled substance use. This data also identify potential sources of prescription drug diversion or abuse, including prescription fraud, “doctor-shopping” or multiple-provider episodes, and improper prescribing and dispensing.
In February 2010, BNE implemented a PMP that provided secure online access for practitioners to their patients’ recent controlled substance prescription histories. From February 2010 to June 2013, 5,087 practitioners (of 100,000 statewide) conducted 465,639 searches.
Before I-STOP, pharmacies and dispensers submitted data monthly. A key change in the 2012 law required “real time” submission of dispensed controlled substance data, authorized PMP access for pharmacists, updated the 2010 PMP system and mandated its use by any practitioner writing prescriptions for a Schedule II, III or IV controlled substance, with limited exceptions. As a result, controlled substance data is provided to the PMP within 24 hours of dispensing.
Results
Since I-STOP’s implementation in August 2013, through September 2015, more than 34 million PMP searches were conducted by more than 96,000 searchers on more than 12 million patients. Further, the number of “doctor-shoppers,” defined as patients who present to five or more prescribers and five or more pharmacies receiving a controlled substance within a three-month period, had dropped by 75 percent by the end of 2013.27 That trend has continued with a reported
27 CDC Vital Signs report, July 2014. Accessed at http://www.cdc.gov/vitalsigns/opioid-
prescribing/index.html
The number of “doctor-shoppers” has dropped by 82% from fourth quarter 2012 to fourth quarter 2014.

13
further drop from fourth quarter 2012 to fourth quarter 2014 of 82 percent.28 The NYS PMP has become a model for other states.
Changes to the Controlled Substances Schedules
Controlled substances, including opioid analgesics, are scheduled based on whether the drug has a currently accepted medical use, its relative abuse potential, and its likelihood of causing dependence.
Before I-STOP, one of the most utilized prescription opioid analgesics, hydrocodone, was scheduled in NYS and federally as a Schedule III controlled substance. Five years ago, hydrocodone prescriptions comprised nearly 50 percent of the five most commonly prescribed controlled analgesics in NYS. When hydrocodone was up-scheduled to a Schedule II controlled substance in February 2013, all strengths, formulations and combination products of hydrocodone became subject to stricter refill and phone-in prescription rules, requiring greater physician oversight of patients’ hydrocodone prescriptions, as well as providing further opportunities for physicians to identify and treat their patients’ substance misuse/abuse and addictions. At the end of 2014, hydrocodone prescriptions dropped to 32 percent of the five most commonly prescribed controlled analgesics.29
The I-STOP legislation also categorized tramadol, a previously unscheduled opioid pain reliever, to Schedule IV. In 2014, tramadol prescriptions were 16 percent of the five most commonly prescribed controlled analgesics 13 percent of the total opioid prescriptions (10,909,602).30
Figure 6: Commonly Prescribed Controlled Pain Relievers
Source: NYSDOH, Bureau of Narcotics Enforcement, July 2015.
Overall, the number of prescribed opioid analgesics remained essentially the same from 2010-2014 (10,805,644 and 10,909,602 respectively), bearing in mind that the 2014 data includes mandatory reporting of tramadol as of February 2013. Oxycodone, the second most frequently
28 NYSDOH Bureau of Narcotics Enforcement, September 2015. 29 In 2014, the five most commonly prescribed opioid analgesics were hydrocodone, oxycodone, codeine3,
propoxyphene, and codeine5, NYSDOH Bureau of Narcotics Enforcement, July 2015. 30 NYSDOH Bureau of Narcotics Enforcement, July 2015.
ISTOP took effect Feb. 2013 and tramadol was added to the registry.
14
prescribed analgesic in 2010, rose 20 percent in 2014, to become the most prescribed (40 percent) opioid analgesic in NYS. BNE continues to monitor this trend.
PMP’s 2014 data also indicates that 3,346,545 individuals received opioid analgesic prescriptions. Women over 45 years of age received the most of any group, accounting for 39 percent of all opioid prescriptions. In relation to the rest of the country, New York was among the lowest 10 percent of states in the rate of these prescriptions, according to a 2012 national audit.31
31 CDC Vital Signs, July 2014 data from National Prescription Audit 2012. Accessed at http://www.cdc.gov/vitalsigns/opioid-prescribing/infographic.html#map
15
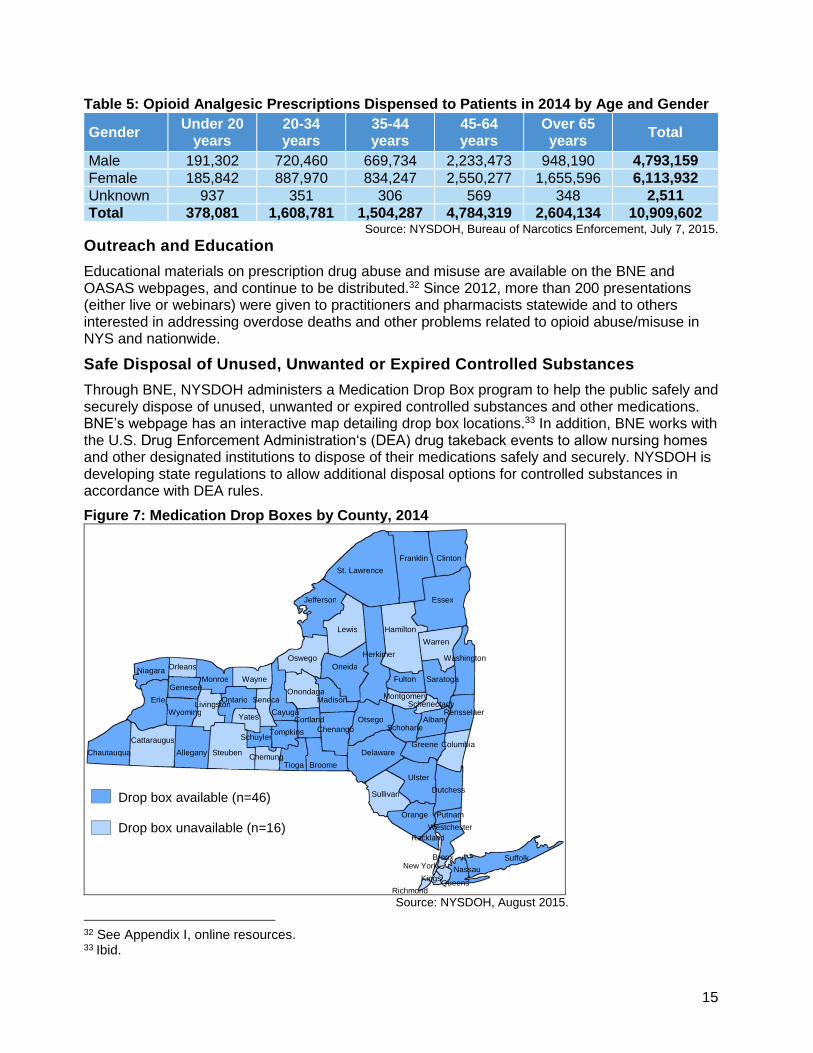
Table 5: Opioid Analgesic Prescriptions Dispensed to Patients in 2014 by Age and Gender
Gender Under 20
years 20-34 years
35-44 years
45-64 years
Over 65 years
Total
Male 191,302 720,460 669,734 2,233,473 948,190 4,793,159
Female 185,842 887,970 834,247 2,550,277 1,655,596 6,113,932
Unknown 937 351 306 569 348 2,511
Total 378,081 1,608,781 1,504,287 4,784,319 2,604,134 10,909,602 Source: NYSDOH, Bureau of Narcotics Enforcement, July 7, 2015.
Outreach and Education
Educational materials on prescription drug abuse and misuse are available on the BNE and OASAS webpages, and continue to be distributed.32 Since 2012, more than 200 presentations (either live or webinars) were given to practitioners and pharmacists statewide and to others interested in addressing overdose deaths and other problems related to opioid abuse/misuse in NYS and nationwide.
Safe Disposal of Unused, Unwanted or Expired Controlled Substances
Through BNE, NYSDOH administers a Medication Drop Box program to help the public safely and securely dispose of unused, unwanted or expired controlled substances and other medications. BNE’s webpage has an interactive map detailing drop box locations.33 In addition, BNE works with the U.S. Drug Enforcement Administration‘s (DEA) drug takeback events to allow nursing homes and other designated institutions to dispose of their medications safely and securely. NYSDOH is developing state regulations to allow additional disposal options for controlled substances in accordance with DEA rules.
Figure 7: Medication Drop Boxes by County, 2014
Source: NYSDOH, August 2015.
32 See Appendix I, online resources. 33 Ibid.
Drop box available (n=46) Drop box unavailable (n=16)
St. Lawrence
Tompkins
Monroe
Suffolk
Oswego
Onondaga
Oneida
Cayuga
Franklin
Lewis
Genesee
Orleans
Clinton
Erie
Niagara Wayne
New York Bronx
Richmond
Kings Queens
Nassau
Jefferson
Delaware
Broome Tioga Chemung
Steuben Allegany
Cattaraugus
Chautauqua
Madison
Otsego Schoharie
Fulton
Putnam
Rensselaer
Saratoga
Albany
Rockland
Orange
Sullivan
Herkimer
Hamilton
Essex
Warren
Washington
Schenectady Montgomery Seneca
Wyoming Livingston
Yates
Ontario
Schuyler
Cortland
Chenango
Greene
Ulster
Columbia
Dutchess
Westchester
16
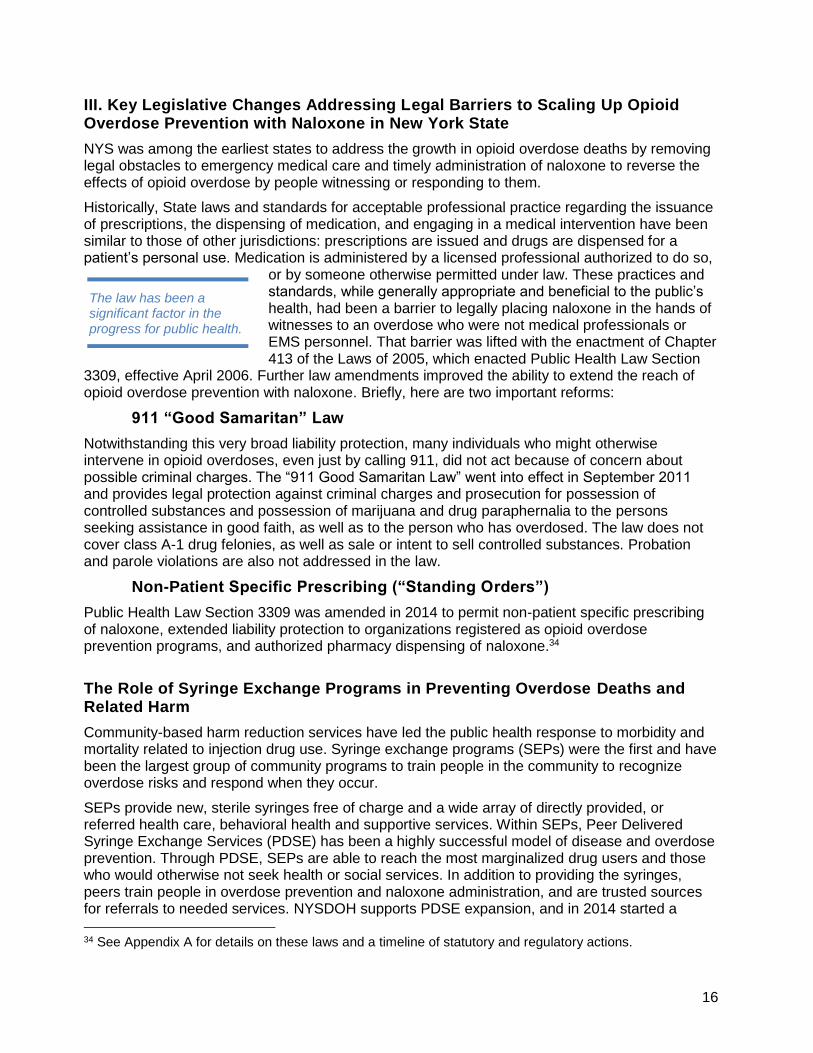
III. Key Legislative Changes Addressing Legal Barriers to Scaling Up Opioid Overdose Prevention with Naloxone in New York State
NYS was among the earliest states to address the growth in opioid overdose deaths by removing legal obstacles to emergency medical care and timely administration of naloxone to reverse the effects of opioid overdose by people witnessing or responding to them.
Historically, State laws and standards for acceptable professional practice regarding the issuance of prescriptions, the dispensing of medication, and engaging in a medical intervention have been similar to those of other jurisdictions: prescriptions are issued and drugs are dispensed for a patient’s personal use. Medication is administered by a licensed professional authorized to do so,
or by someone otherwise permitted under law. These practices and standards, while generally appropriate and beneficial to the public’s health, had been a barrier to legally placing naloxone in the hands of witnesses to an overdose who were not medical professionals or EMS personnel. That barrier was lifted with the enactment of Chapter 413 of the Laws of 2005, which enacted Public Health Law Section
3309, effective April 2006. Further law amendments improved the ability to extend the reach of opioid overdose prevention with naloxone. Briefly, here are two important reforms:
911 “Good Samaritan” Law
Notwithstanding this very broad liability protection, many individuals who might otherwise intervene in opioid overdoses, even just by calling 911, did not act because of concern about possible criminal charges. The “911 Good Samaritan Law” went into effect in September 2011 and provides legal protection against criminal charges and prosecution for possession of controlled substances and possession of marijuana and drug paraphernalia to the persons seeking assistance in good faith, as well as to the person who has overdosed. The law does not cover class A-1 drug felonies, as well as sale or intent to sell controlled substances. Probation and parole violations are also not addressed in the law.
Non-Patient Specific Prescribing (“Standing Orders”)
Public Health Law Section 3309 was amended in 2014 to permit non-patient specific prescribing of naloxone, extended liability protection to organizations registered as opioid overdose prevention programs, and authorized pharmacy dispensing of naloxone.34
The Role of Syringe Exchange Programs in Preventing Overdose Deaths and Related Harm
Community-based harm reduction services have led the public health response to morbidity and mortality related to injection drug use. Syringe exchange programs (SEPs) were the first and have been the largest group of community programs to train people in the community to recognize overdose risks and respond when they occur.
SEPs provide new, sterile syringes free of charge and a wide array of directly provided, or referred health care, behavioral health and supportive services. Within SEPs, Peer Delivered Syringe Exchange Services (PDSE) has been a highly successful model of disease and overdose prevention. Through PDSE, SEPs are able to reach the most marginalized drug users and those who would otherwise not seek health or social services. In addition to providing the syringes, peers train people in overdose prevention and naloxone administration, and are trusted sources for referrals to needed services. NYSDOH supports PDSE expansion, and in 2014 started a
34 See Appendix A for details on these laws and a timeline of statutory and regulatory actions.
The law has been a significant factor in the progress for public health.
17
Young IDU SEP Initiative in 18 SEPs, addressing the increase in heroin use by young people across the state.
There are 24 SEPs in NYS. Since 1992, they have served more than 184,750 people and distributed more than 62.5 million syringes.35
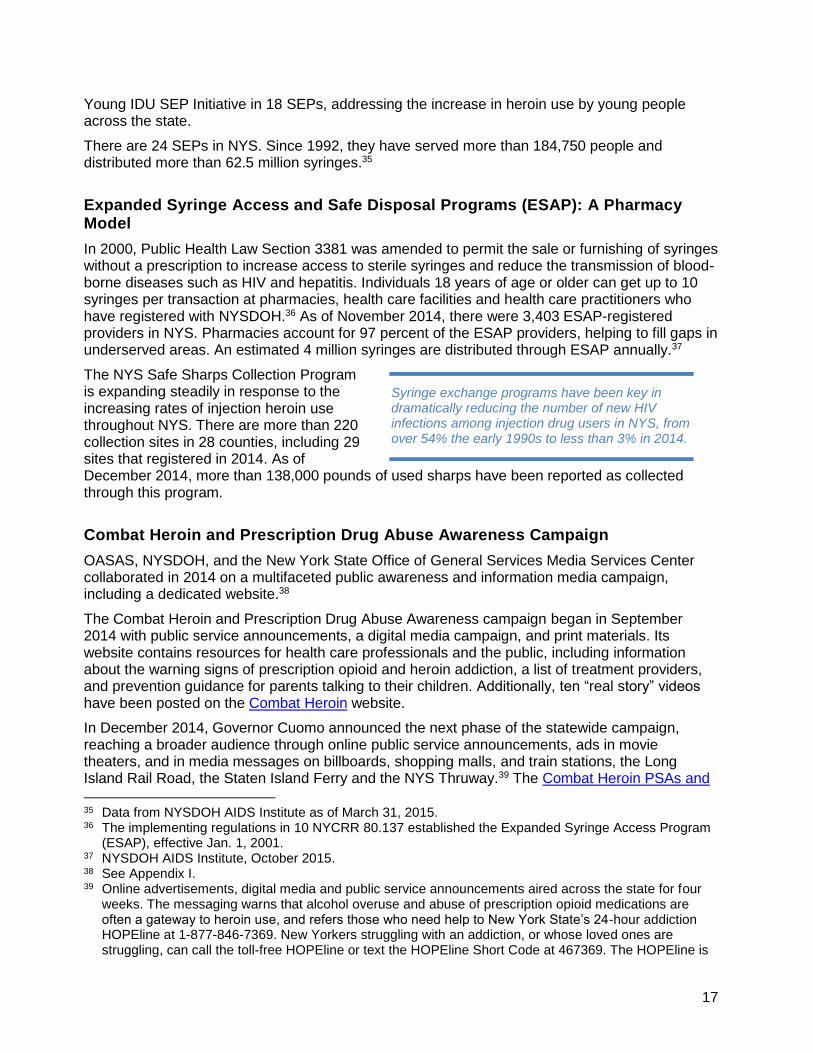
Expanded Syringe Access and Safe Disposal Programs (ESAP): A Pharmacy Model
In 2000, Public Health Law Section 3381 was amended to permit the sale or furnishing of syringes without a prescription to increase access to sterile syringes and reduce the transmission of blood-borne diseases such as HIV and hepatitis. Individuals 18 years of age or older can get up to 10 syringes per transaction at pharmacies, health care facilities and health care practitioners who have registered with NYSDOH.36 As of November 2014, there were 3,403 ESAP-registered providers in NYS. Pharmacies account for 97 percent of the ESAP providers, helping to fill gaps in underserved areas. An estimated 4 million syringes are distributed through ESAP annually.37
The NYS Safe Sharps Collection Program is expanding steadily in response to the increasing rates of injection heroin use throughout NYS. There are more than 220 collection sites in 28 counties, including 29 sites that registered in 2014. As of December 2014, more than 138,000 pounds of used sharps have been reported as collected through this program.
Combat Heroin and Prescription Drug Abuse Awareness Campaign
OASAS, NYSDOH, and the New York State Office of General Services Media Services Center collaborated in 2014 on a multifaceted public awareness and information media campaign, including a dedicated website.38
The Combat Heroin and Prescription Drug Abuse Awareness campaign began in September 2014 with public service announcements, a digital media campaign, and print materials. Its website contains resources for health care professionals and the public, including information about the warning signs of prescription opioid and heroin addiction, a list of treatment providers, and prevention guidance for parents talking to their children. Additionally, ten “real story” videos have been posted on the Combat Heroin website.
In December 2014, Governor Cuomo announced the next phase of the statewide campaign, reaching a broader audience through online public service announcements, ads in movie theaters, and in media messages on billboards, shopping malls, and train stations, the Long Island Rail Road, the Staten Island Ferry and the NYS Thruway.39 The Combat Heroin PSAs and
35 Data from NYSDOH AIDS Institute as of March 31, 2015. 36 The implementing regulations in 10 NYCRR 80.137 established the Expanded Syringe Access Program
(ESAP), effective Jan. 1, 2001. 37 NYSDOH AIDS Institute, October 2015. 38 See Appendix I. 39 Online advertisements, digital media and public service announcements aired across the state for four
weeks. The messaging warns that alcohol overuse and abuse of prescription opioid medications are often a gateway to heroin use, and refers those who need help to New York State’s 24-hour addiction HOPEline at 1-877-846-7369. New Yorkers struggling with an addiction, or whose loved ones are struggling, can call the toll-free HOPEline or text the HOPEline Short Code at 467369. The HOPEline is
Syringe exchange programs have been key in dramatically reducing the number of new HIV infections among injection drug users in NYS, from over 54% the early 1990s to less than 3% in 2014.
18
videos underscore the message that while addiction can happen to anyone, any family, at any time – recovery is possible.
More than 24 million people were reached through the digital campaign, and the website has received 400,000 page views.
In May 2015, OASAS announced the redesigned and updated website and three-phase media campaign, Talk2Prevent.ny.gov, giving parents information and tools to talk to their children about the risks of underage drinking and substance abuse.40 The first phase launched in October 2015; the second in November 2015, and the third will launch in April 2016. Talk2Prevent also has a Facebook page featuring weekly posts on underage alcohol and drug use.
Newest Initiatives
Role of Pharmacies in Overdose Prevention
With NYS’s mounting number of heroin and prescription opioid overdoses, it is increasingly important to have naloxone available in pharmacies and dispensed by pharmacists. There are community pharmacies in every corner of the State and, as in the ESAP program, they can be engaged as public health partners in addressing opioid overdose.
Pharmacies are authorized to register as an opioid overdose prevention program as long as they identify a program director and a clinical director. Many pharmacies are now stocking naloxone, and virtually all pharmacies can access naloxone through standard pharmaceutical distribution channels. As of October 2015, managed care organizations are required to cover the cost of at least one formulation of naloxone. Insurance coverage will foster increased pharmacy dispensing. Some commercial health insurance plans cover the cost of naloxone. Injectable and intranasal naloxone are covered as part of Medicaid’s fee-for-service pharmacy benefit in NYS. Medicaid has requested a “J-code” from the Centers for Medicare and Medicaid Services (CMS) for the atomizer, which is not covered.
Pharmacists may now dispense naloxone pursuant to patient-specific and non-patient specific prescriptions. The latter is sometimes referred to as a standing order. There are two models for non-patient dispensing: 1) the pharmacy may become a registered opioid overdose program; or 2) the pharmacy may dispense under a standing order issued by an “external” registered opioid overdose program. Starting in late 2015, both models are in use. In 2016, there will be substantial expansion to cover all regions of the State.
Dispensing naloxone in pharmacies and continuing to address reimbursement will be priorities in 2015-16.
staffed by masters’ level clinicians who are well trained, knowledgeable, and ready to answer questions and offer treatment referrals to more than 1,500 local prevention and treatment providers. HOPEline services include crisis and motivational interviewing for callers in need, multilingual assistance, 48-hour callback to those who wish to be contacted and information materials.
40 The website, Talk2Prevent.ny.gov, includes a toolkit for parents that has an agreement for parent and child to sign to establish a clear understanding of family rules around underage drinking. The toolkit also has conversation starters, texting ideas and a list of warning signs. Another feature of the website is the wide variety of media pieces that New York substance abuse coalitions or prevention providers can use to reach out to parents.

19
Opioid Overdose Prevention Trainings for Incarcerated Individuals Soon to Be Released from Prison
Studies indicate that newly released prisoners have very high rates of drug overdose deaths.41 The NYSDOH AIDS Institute, NYS Department of Corrections and Community Supervision, and the Harm Reduction Coalition have been collaborating to provide opioid overdose prevention training to incarcerated individuals whose release date is approaching. Individuals who want a naloxone kit will get it with any other medications they receive at the time of their release.
A pilot training began in February 2015 at the Queensboro Correctional Facility. Through December 2015, more than 1,400 individuals had been trained in opioid overdose recognition and response, and more than 500 of them took a kit when released from prison. Overdose trainings are now part of the facility’s inmate orientation, and refresher training is offered to inmates shortly before their release, with the option to receive a free naloxone kit upon release. Initial trainings were conducted by the Harm Reduction Coalition and then turned over to correctional staff once they were confident in conducting trainings independently.
The pilot was expanded to five correctional facilities by December 2015. Feedback has been very positive, and the goal is to have opioid overdose prevention trainings in all 54 State Correctional Facilities.
To complement the training of individuals being released, parole officers are also being trained. The first 15 parole officers were trained in Staten Island in August 2015, and more are planned throughout NYS.
The New York State Department of Corrections and Community Supervision was the first state agency to register as an opioid overdose prevention program. A standing order allows all nurses in State Correctional Facilities to administer naloxone. This groundbreaking action reinforces the Department’s commitment to prevent overdose deaths.
Piloting Long-Acting Injectable Opioid Antagonist Treatment with Persons Under Criminal Justice Supervision
In 2015, OASAS initiated an opioid antagonist treatment program targeting opioid-dependent persons leaving jail, a correctional facility, on probation, or under drug court supervision. Where available, such persons who desire and consent to treatment may receive a monthly injection of long-acting naltrexone, a long-acting opioid antagonist to block the effects of heroin and prescription opioids. OASAS requires that patients treated through this program be referred for psychosocial addiction treatment at an OASAS-certified treatment provider.
Opioid Overdose Prevention Training in Schools
NYSDOH, OASAS, and the Harm Reduction Coalition have been collaborating with the NY State Education Department to allow opioid overdose prevention training and naloxone kits to be provided to school nurses and other school personnel, as well as with the State University of New York (SUNY) and the City University of New York (CUNY) to train and educate college personnel. School districts have the option to register as opioid overdose prevention programs.
A curriculum has been developed to be implemented in the 2015-16 school year. All participating schools will be able to access the training. Once training is complete, naloxone kits will be
41 Merrall, E. L. C., Kariminia, A., Binswanger, I. A., Hobbs, M. S., Farrell, M., Marsden, J., Bird, S. M.
(2010). Meta-analysis of drug-related deaths soon after release from prison. Addiction (Abingdon, England), 105(9), 1545–1554. doi:10.1111/j.1360-0443.2010.02990.x
20
provided to the schools free of charge. Trained staff will have access to strategically placed kits. NYSDOH’s budget covers the naloxone costs for the 2015-16 fiscal year.
All administrations of naloxone will be reported to NYSDOH, entered into a database, and shared with collaborating agencies.
Also in 2015, OASAS and the State Education Department entered into a Memorandum of Understanding to update the health education curriculum guidance document regarding alcohol and other drugs for all its districts. It includes a special emphasis on heroin and other opioids
IV. Conclusions, Challenges, and Interagency Action Plans
The collaboration of state agencies to share data has been instrumental in guiding understanding of these issues and targeting actions to address them. The increasing numbers of New Yorkers negatively impacted by opioid-related overdoses challenges the State to continue collaborations and include additional partners in treatment, education, law, public safety, medical practice, professional associations, pharmacies, and other businesses.
Most overdoses are not instantaneous, and most are witnessed by others. Therefore, many overdose fatalities are preventable, especially if witnesses have had appropriate training and are prepared to respond safely and effectively. Prevention measures include education on risk factors (such as poly-drug use and recent abstinence), recognition of overdose, and appropriate responses, including calling EMS and providing resuscitation while awaiting its arrival. Administering naloxone immediately reverses the effects of heroin overdose and restores breathing. Naloxone is an opioid antagonist with no abuse potential and no effect on a recipient who has not taken opioids. It is available only by prescription, but its cost and lack of insurance coverage put it out of reach for many people, causing concern about sustainability. With its partners, NYSDOH is providing free naloxone to first responders and others who may witness an opioid overdose. With the recent authority to distribute naloxone through standing orders, more naloxone is in the hands of those who need it.
Sustained evidence-based interventions are needed to turn the tide, targeted to those at risk of overdosing, especially those struggling with dependency or addiction. There is solid scientific evidence on the effectiveness of buprenorphine and methadone maintenance treatments in protecting against overdose, as well as the spread of blood-borne diseases by reducing or eliminating drug use and the sharing of needles and syringes. A newer treatment with long-acting naltrexone is showing promise for people with opioid dependence.
Barriers to fuller access to these medications include limited insurance coverage, and stigma and prejudice against drug users and their treatment. The U.S. Secretary of Health and Human Services recently announced a plan to lift the limits on the number of patients doctors can treat with buprenorphine to help increase access to the medication. But there are not enough doctors who treat patients with buprenorphine, especially in parts of the state with little or no treatment and high need.
The State is endeavoring to reach more people throughout NYS by:
Building on the momentum brought by training first responders and people who are likely to witness an overdose in opioid overdose prevention and equipping them with naloxone.
Developing and implementing uniform standards for toxicology testing in identifying drug poisoning deaths. Getting this critical data early will help identify patterns and assist in developing community interventions quickly.
21
Broadening overdose prevention and naloxone training to include probation, drug court and criminal court judges, family court, defense attorneys and prosecutors.
Widening access to overdose prevention with naloxone with pharmacists, health insurance providers, and educational institutions.
Improving access to quality opioid agonist treatments, buprenorphine and methadone, which have strong scientific support for their effectiveness in reducing risk factors and opioid use that leads to fatal overdoses.
Expanding implementation of the opioid antagonist long-acting injectable naltrexone to prevent overdoses. All State-operated Addiction Treatment Centers (ATCs) offer this to patients.
DCJS, OASAS, DOH, and DOCCS working together to increase the availability of pharmaceutical treatments for opioid addiction in prison, drug courts, and other treatment programs for those who are most at risk.
Improving medical education about preventing opioid overdose through increased awareness of risks that could lead to overdose; encouraging co-prescribing of naloxone with opioid analgesics, and engaging primary care, pain and palliative care practitioners, and other medical care providers.
Continuing to educate prescribers to use I-Stop, the New York State prescription drug monitoring program, which helps identify where individuals are receiving multiple prescriptions for pain medications and other sedatives, which may contribute to overdose deaths.
Educating people who use drugs, their friends and loved ones to reach out for help when needed, especially when witnessing someone overdosing, through continued support for community overdose prevention programs and new programs; increasing and sustaining targeted public information campaigns to know the signs of overdose and respond effectively and call for medical assistance; and training and equipping them with naloxone.
Developing new strategies for reaching more young people through collaborations with universities and through social media contact.
Improving surveillance, data collection and analysis to increase our ability to identify problem areas, knowledge gaps and trends in drug use so that resources are optimally deployed for early, targeted interventions to reduce overdose fatalities.
Reducing accidental overdose through improved care coordination and interoperability of electronic medical records, while strictly protecting patients’ privacy.
Assessing accessibility, quality and effectiveness of content in school curricula.
Partnering with professional associations to develop standards for effective substance use prevention education for young people, family members and residents of communities most affected.
Monitoring and assessing existing initiatives to determine where needs are unmet, where improvements could be made, and where successes occur and what they look like.

22

23
Appendices
24
Appendix A - Legal Actions Related to Opioid Overdose Prevention: Timeline
Overdose Prevention Programs
Chapter 413 of the Laws of 2005, effective April 1, 2006, added Section 3309 of the Public Health Law to provide for opioid overdose prevention programs in NYS. Pursuant to PHL Section 3309(1), as amended by Chapters 34 and 42 of the Laws of 2014, the Commissioner of Health is authorized to establish standards for approval of opioid overdose prevention programs.
April 1, 2006 N.Y. PBH. LAW § 3309: Opioid overdose prevention.
The statute establishing NYS’s opioid overdose initiative went into effect, authorizing NYSDOH to set standards for opioid overdose prevention programs. These standards became embodied in regulation: Section 89.137 of Title 10 (Health) of the Official Compilation of Codes, Rules and Regulations of the State of New York (10 NYCRR 89.137) in 2007.
1. The commissioner is authorized to establish standards for approval of any opioid overdose prevention program which may include, but not be limited to, standards for program directors, appropriate clinical oversight, training, record keeping and reporting.
2. Notwithstanding any inconsistent provisions of section sixty-five hundred twelve of the education law or any other law, the purchase, acquisition, possession or use of an opioid antagonist pursuant to this section shall not constitute the unlawful practice of a profession or other violation under title eight of the education law or this article.
3. Use of an opioid antagonist pursuant to this section shall be considered first aid or emergency treatment for the purpose of any statute relating to liability.
4. The commissioner shall publish findings on statewide opioid overdose data that reviews overdose death rates and other information to ascertain changes in the cause and rates of fatal opioid overdoses. The report may be part of existing state mortality reports issued by the department, and shall be submitted annually for three years and as deemed necessary by the commissioner thereafter, to the governor, the temporary president of the senate and the speaker of the assembly. The report shall include, at a minimum, the following information: (a) information on opioid overdose deaths, including age, gender, ethnicity, and geographic location; (b) data on emergency room utilization for the treatment of opioid overdose; (c) data on utilization of pre-hospital services; (d) suggested improvements in data collection.
June 24, 2014 Amendment to § 3309:
Authorizing health care providers to prescribe, dispense or distribute an opioid antagonist by patient specific or non-patient specific; allowing pharmacists to dispense an opioid antagonist through patient specific and non-patient specific prescribing; and permitting authorized opioid antagonist recipients to possess and distribute opioid antagonists, and administer them to persons they reasonably believe are experiencing opioid overdoses.
Feb. 1, 2007 N.Y. Comp. Codes R. & Regs. 10, § 80.138
Defines terms, including “Opioid Overdose Prevention Program,” “Opioid antagonist,” “Trained Overdose Responder,” and “Registered provider.”
Permits registered providers to operate an Opioid Overdose Prevention Program if they obtain a certificate of approval from NYSDOH.
Lists requirements for registered providers and Programs.
Requires Programs to maintain record-keeping system and defines requirements for that system.
25
Purports to limit protections of N.Y. Pub. Health Law § 3309 regarding the “purchase, acquisition, possession or use of an opioid antagonist” to approved programs and trained overdose responders.
May 6, 2015 N.Y. Comp. Codes R. & Regs 10 § 80.138
Sets the standards and procedures for opioid overdose prevention programs. The 2015 amendments authorize clinical directors and affiliated prescribers of registered programs to direct the furnishing or dispensing of an opioid antagonist to trained overdose responders pursuant to a patient-specific prescription or a non-patient specific prescription. This most recent version of the regulations is in N.Y. Comp. Codes R. & Regs 10, § 80.138.
Aug. 27, 2013 N.Y. Comp. Codes R. & Regs. 10, § 80.63. Prescription Drug Reform Act Internet System for Tracking Over-Prescribing (I-STOP)
An amendment to 10 NYCRR Section 80.63 Rules and Regulations on Controlled Substances enhancing the PMP requiring most prescribers to consult the PMP when writing prescriptions for Schedule II, III, and IV controlled substances. The amendment changed the frequency by which dispensing practitioners and pharmacies must submit dispensed controlled substance data to NYSDOH, and included a requirement for reporting that no controlled substances were dispensed.
February 2013 Two additional changes to the PMP were codified in Section 3306 of the New York State Public Health Law: Tramadol was added to the list of controlled substances and hydrocodone was up-scheduled from Schedule III to Schedule II. N.Y. Penal and Criminal Procedure Laws
Sept. 18, 2011 N.Y. Criminal Procedure Law §390.40 (3) The act of seeking health care for someone who is experiencing a drug or alcohol overdose or other life threatening medical emergency shall be considered by the court when presented as a mitigating factor in any criminal prosecution for a controlled substance, marihuana, drug paraphernalia, or alcohol related offense.
Oct. 28, 2010, September 18, 2011 and April 13, 2015 N.Y. Penal Law § 220.03
Criminal Possession Of a Controlled Substance in the Seventh Degree was amended to exclude residue of a controlled substance in a hypodermic needle obtained pursuant to PBH Law § 3381, to provide legal protection against criminal charges and prosecution for misdemeanor possession of controlled substances, marijuana and drug paraphernalia to the person(s) seeking assistance in good faith, as well as to the person who has overdosed, known as the medical amnesty, 911 or Good Samaritan Law, and mostly recently to amend Penal Law 220.03 (criminal possession of a controlled substance 7th) and 220.45 (criminally possessing a hypodermic instrument) to make clear that the exception for possession of a syringe/needle pursuant to PBH Law § 3381 includes the state’s syringe exchange and pharmacy and medical provider-based expanded syringe access programs. Created Penal Law sec. 220.78. Expanded syringe access demonstration program (ESAP)
March 7, 2001 N.Y. Comp. Codes R. & Regs. 10, § 80.137 Amended Part 80 of Title 10 (Health) NYCRR, pursuant to Section 3381 of the Public Health Law establishing the regulations for authorized providers to sell and furnish hypodermic needles and syringes without a prescription Syringe Exchange
October. 13, 1993 N.Y. Comp. Codes R. & Regs. 10, § 80.135 Authorization to conduct hypodermic syringe and needle exchange programs

26
In May 1992, NYSDOH filed emergency regulations which were adopted in October 1993 as non-emergency regulations authorizing the State Health Commissioner to approve programs and personnel to possess, collect and distribute hypodermic syringes and needles to injecting drug users without a prescription to prevent HIV transmission. Additional Legislation
Heroin/Opioid Legislative Package
Chapter 31 (S.7902/A.10154) – Criminal sale of a controlled substance by a practitioner or pharmacist: Amends the penal law to make it a Class C Felony for a practitioner or pharmacist to knowingly and unlawfully sell a controlled substance through their professional practice.
Chapter 32 (S.7903/A.10160) – Heroin and Opioid Addiction Wraparound Services Demonstration Program: Directs the OASAS commissioner to develop a demonstration program to provide those with opioid/heroin addiction with wraparound services, from the start of treatment until up to nine months after treatment. Wraparound services include case management services (educational resources, legal services, financial services, social services, family services and childcare services), peer-to-peer support groups, employment support, and transportation assistance to address factors that can lead to relapse.
Chapter 33 (S.7904/A.10159) – Opioid Treatment and Hospital Diversion Demonstration Program: Directs the OASAS commissioner, using funds appropriated, to establish a statewide demonstration program that offers short-term residential and peer-supported detox and transitional services to individuals suffering from heroin/opioid addiction. OASAS-certified medically monitored detox beds, where appropriate, will be modified as needed to treat opioid/heroin addiction. Required services include patient and family support, and referral services upon completion of treatment.
Chapter 34 (S.7905/A.10156) – Information Sheets in Naloxone Kits: Requires naloxone kits provided under the Opioid Overdose Prevention Program to include an information sheet that includes overdose symptoms, instructions to call first responders, pre- and post-administration instructions, and the OASAS HELPLINE phone number and the OASAS website.
Chapter 35 (S.7906/A.10158) – Health Department Bureau of Narcotic Enforcement Investigators: Allows the NYSDOH Bureau of Narcotic Enforcement investigators to directly access criminal histories maintained by DCJS.
Chapter 36 (S.7907/A.10155) – Fraud and Deceit of Prescription Medication: Makes it a Class A Misdemeanor to obtain, or attempt to obtain, a controlled substance or a prescription by misrepresenting oneself as a doctor or pharmacist, concealing a material fact, giving a false name or address, or presenting a forged prescription. This will prevent doctor shopping by a patient because it makes it a crime for a patient who receives a prescription during the course of treatment from one doctor to intentionally withhold that information when receiving treatment from another doctor.
Chapter 36 (S.7908/A.10157) – Criminal sale of a controlled substance by a practitioner or pharmacist: Includes the sale of a controlled substance by a practitioner or pharmacist under the definition of a designated offense for purposes of eavesdropping warrants, and makes it a criminal act eligible for prosecution under the enterprise corruption statute.
Source: OASAS 2015
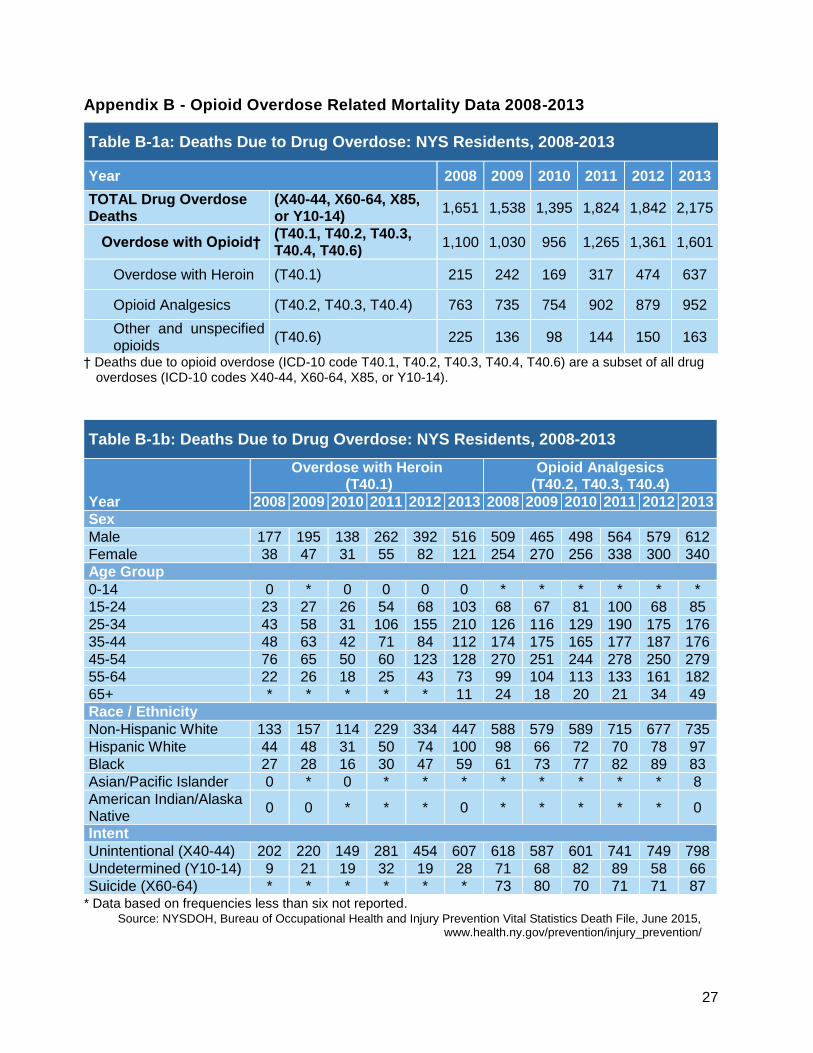
27
Appendix B - Opioid Overdose Related Mortality Data 2008-2013
Table B-1a: Deaths Due to Drug Overdose: NYS Residents, 2008-2013
Year 2008 2009 2010 2011 2012 2013
TOTAL Drug Overdose Deaths
(X40-44, X60-64, X85, or Y10-14)
1,651 1,538 1,395 1,824 1,842 2,175
Overdose with Opioid† (T40.1, T40.2, T40.3, T40.4, T40.6)
1,100 1,030 956 1,265 1,361 1,601
Overdose with Heroin (T40.1) 215 242 169 317 474 637
Opioid Analgesics (T40.2, T40.3, T40.4) 763 735 754 902 879 952
Other and unspecified opioids
(T40.6) 225 136 98 144 150 163
† Deaths due to opioid overdose (ICD-10 code T40.1, T40.2, T40.3, T40.4, T40.6) are a subset of all drug overdoses (ICD-10 codes X40-44, X60-64, X85, or Y10-14).
* Data based on frequencies less than six not reported. Source: NYSDOH, Bureau of Occupational Health and Injury Prevention Vital Statistics Death File, June 2015,
www.health.ny.gov/prevention/injury_prevention/
Table B-1b: Deaths Due to Drug Overdose: NYS Residents, 2008-2013
Year
Overdose with Heroin (T40.1)
Opioid Analgesics (T40.2, T40.3, T40.4)
2008 2009 2010 2011 2012 2013 2008 2009 2010 2011 2012 2013
Sex
Male 177 195 138 262 392 516 509 465 498 564 579 612
Female 38 47 31 55 82 121 254 270 256 338 300 340
Age Group
0-14 0 * 0 0 0 0 * * * * * *
15-24 23 27 26 54 68 103 68 67 81 100 68 85
25-34 43 58 31 106 155 210 126 116 129 190 175 176
35-44 48 63 42 71 84 112 174 175 165 177 187 176
45-54 76 65 50 60 123 128 270 251 244 278 250 279
55-64 22 26 18 25 43 73 99 104 113 133 161 182
65+ * * * * * 11 24 18 20 21 34 49
Race / Ethnicity
Non-Hispanic White 133 157 114 229 334 447 588 579 589 715 677 735
Hispanic White 44 48 31 50 74 100 98 66 72 70 78 97
Black 27 28 16 30 47 59 61 73 77 82 89 83
Asian/Pacific Islander 0 * 0 * * * * * * * * 8
American Indian/Alaska Native
0 0 * * * 0 * * * * * 0
Intent
Unintentional (X40-44) 202 220 149 281 454 607 618 587 601 741 749 798
Undetermined (Y10-14) 9 21 19 32 19 28 71 68 82 89 58 66
Suicide (X60-64) * * * * * * 73 80 70 71 71 87
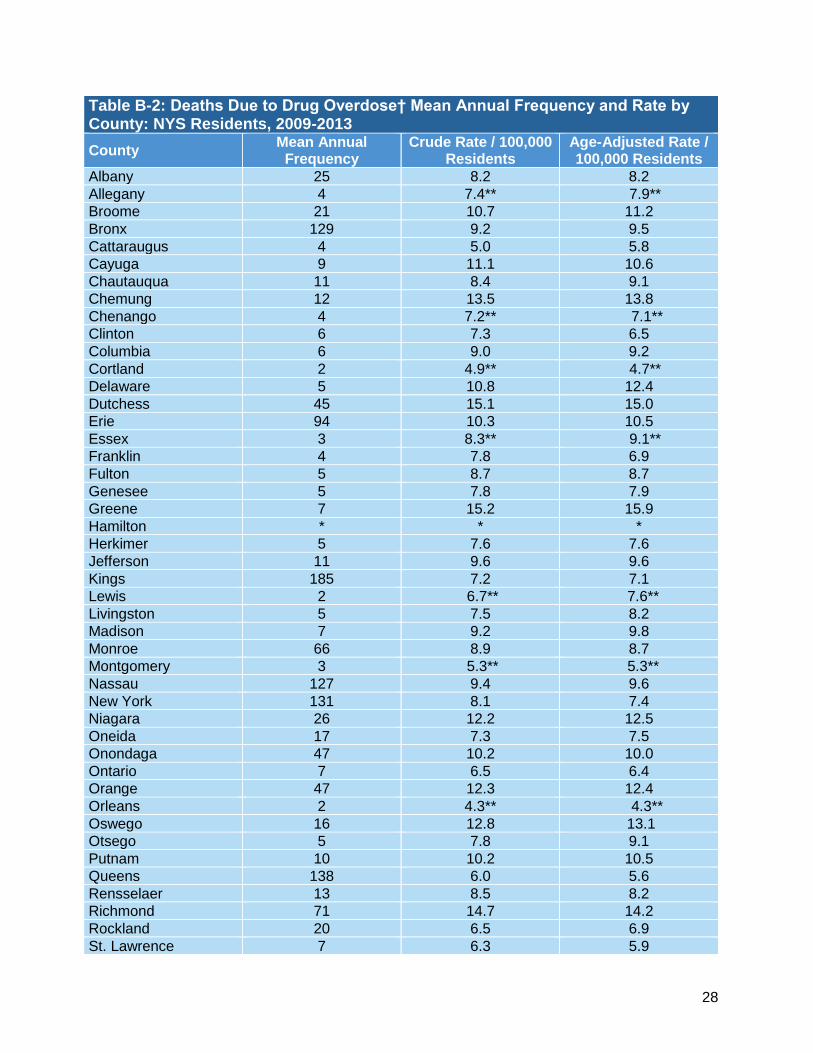
28
Table B-2: Deaths Due to Drug Overdose† Mean Annual Frequency and Rate by County: NYS Residents, 2009-2013
County Mean Annual
Frequency Crude Rate / 100,000
Residents Age-Adjusted Rate / 100,000 Residents
Albany 25 8.2 8.2
Allegany 4 7.4** 7.9**
Broome 21 10.7 11.2
Bronx 129 9.2 9.5
Cattaraugus 4 5.0 5.8
Cayuga 9 11.1 10.6
Chautauqua 11 8.4 9.1
Chemung 12 13.5 13.8
Chenango 4 7.2** 7.1**
Clinton 6 7.3 6.5
Columbia 6 9.0 9.2
Cortland 2 4.9** 4.7**
Delaware 5 10.8 12.4
Dutchess 45 15.1 15.0
Erie 94 10.3 10.5
Essex 3 8.3** 9.1**
Franklin 4 7.8 6.9
Fulton 5 8.7 8.7
Genesee 5 7.8 7.9
Greene 7 15.2 15.9
Hamilton * * *
Herkimer 5 7.6 7.6
Jefferson 11 9.6 9.6
Kings 185 7.2 7.1
Lewis 2 6.7** 7.6**
Livingston 5 7.5 8.2
Madison 7 9.2 9.8
Monroe 66 8.9 8.7
Montgomery 3 5.3** 5.3**
Nassau 127 9.4 9.6
New York 131 8.1 7.4
Niagara 26 12.2 12.5
Oneida 17 7.3 7.5
Onondaga 47 10.2 10.0
Ontario 7 6.5 6.4
Orange 47 12.3 12.4
Orleans 2 4.3** 4.3**
Oswego 16 12.8 13.1
Otsego 5 7.8 9.1
Putnam 10 10.2 10.5
Queens 138 6.0 5.6
Rensselaer 13 8.5 8.2
Richmond 71 14.7 14.2
Rockland 20 6.5 6.9
St. Lawrence 7 6.3 5.9
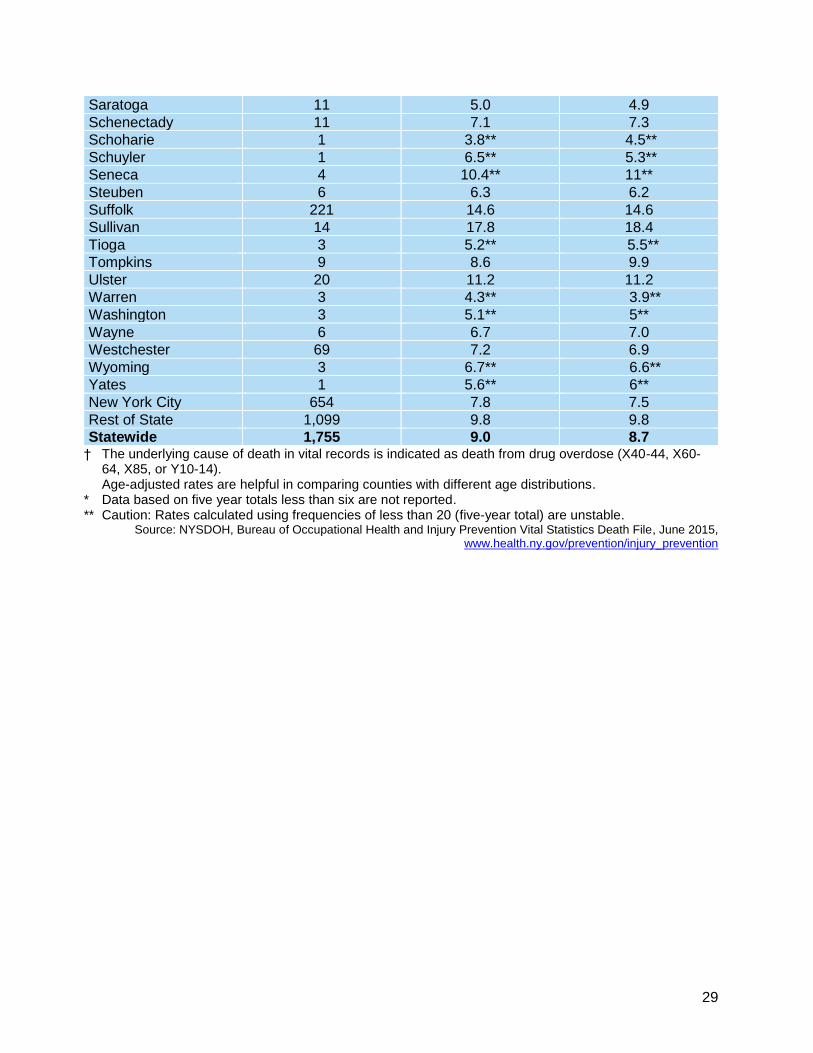
29
Saratoga 11 5.0 4.9
Schenectady 11 7.1 7.3
Schoharie 1 3.8** 4.5**
Schuyler 1 6.5** 5.3**
Seneca 4 10.4** 11**
Steuben 6 6.3 6.2
Suffolk 221 14.6 14.6
Sullivan 14 17.8 18.4
Tioga 3 5.2** 5.5**
Tompkins 9 8.6 9.9
Ulster 20 11.2 11.2
Warren 3 4.3** 3.9**
Washington 3 5.1** 5**
Wayne 6 6.7 7.0
Westchester 69 7.2 6.9
Wyoming 3 6.7** 6.6**
Yates 1 5.6** 6**
New York City 654 7.8 7.5
Rest of State 1,099 9.8 9.8
Statewide 1,755 9.0 8.7 † The underlying cause of death in vital records is indicated as death from drug overdose (X40-44, X60-
64, X85, or Y10-14). Age-adjusted rates are helpful in comparing counties with different age distributions.
* Data based on five year totals less than six are not reported. ** Caution: Rates calculated using frequencies of less than 20 (five-year total) are unstable.
Source: NYSDOH, Bureau of Occupational Health and Injury Prevention Vital Statistics Death File, June 2015, www.health.ny.gov/prevention/injury_prevention

30
Table B-3: Deaths Due to Drug Overdose: Heroin† Mean Annual Frequency and Rate by County: NYS Residents, 2009-2013
County Mean Annual
Frequency Crude Rate / 100,000
Residents Age-Adjusted Rate / 100,000 Residents
Albany 6 1.9 1.9
Allegany * * *
Bronx 41 2.9 3.0
Broome 3 1.6** 1.8**
Cattaraugus * * *
Cayuga 1 1.5** 1.8**
Chautauqua 2 1.3** 1.5**
Chemung * * *
Chenango * * *
Clinton * * *
Columbia 1 2.3** 2.2**
Cortland * * *
Delaware * * *
Dutchess 13 4.3 4.6
Erie 15 1.6 1.7
Essex * * *
Franklin * * *
Fulton * * *
Genesee * * *
Greene 3 5.3** 5.6**
Hamilton * * *
Herkimer * * *
Jefferson 2 1.3** 1.4**
Kings 29 1.1 1.1
Lewis * * *
Livingston * * *
Madison * * *
Monroe 15 2.0 2.0
Montgomery * * *
Nassau 24 1.7 1.9
New York 30 1.9 1.7
Niagara 2 1.1** 1.3**
Oneida 4 1.5** 1.6**
Onondaga 10 2.1 2.2
Ontario * * *
Orange 7 1.8 2.0
Orleans * * *
Oswego 1 1.2** 1.2**
Otsego * * *
Putnam 2 2.4** 3.1**
Queens 33 1.4 1.4
Rensselaer 3 1.8** 1.7**
Richmond 11 2.3 2.3
Rockland 3 1** 1.2**
St. Lawrence * * *

31
Saratoga 2 1.1** 1.2**
Schenectady 1 0.8** 0.9**
Schoharie * * *
Schuyler * * *
Seneca * * *
Steuben * * *
Suffolk 64 4.2 4.6
Sullivan 2 3.1** 3.6**
Tioga * * *
Tompkins * * *
Ulster 4 2.3 2.6
Warren * * *
Washington * * *
Wayne 1 1.3** 1.5**
Westchester 21 2.2 2.3
Wyoming * * *
Yates * * *
New York City 144 1.7 1.6
Rest of State 223 2.0 2.1
Statewide 368 1.9 1.9 † Deaths due to heroin overdose (ICD-10 code T40.1) are a subset of all drug overdoses (ICD-10 codes
X40-44, X60-64, X85, or Y10-14). Age-adjusted rates are helpful in comparing counties with different age distributions.
* Data based on five-year totals less than six are not reported. ** Caution: Rates calculated using frequencies of less than 20 (five-year total) are unstable.
Source: NYSDOH, Bureau of Occupational Health and Injury Prevention Vital Statistics Death File, June 2015, www.health.ny.gov/prevention/injury_prevention

32
Table B-4: Deaths Due to Drug Overdose: Opioid Analgesics† Mean Annual Frequency and Rate by County: NYS Residents, 2009-2013
County Mean Annual
Frequency Crude Rate / 100,000
Residents Age-Adjusted Rate / 100,000 Residents
Albany 8 2.5 2.5
Allegany 3 5.7** 6.5**
Bronx 50 3.6 3.6
Broome 6 2.9 2.8
Cattaraugus 1 1.5** 1.7**
Cayuga 5 6.8 6.2
Chautauqua 4 3.3 3.5
Chemung 7 7.9 8.3
Chenango * * *
Clinton 3 3.9** 3.5**
Columbia 3 4.5** 4.6**
Cortland 1 2.5** 2.4**
Delaware 2 4.7** 5.9**
Dutchess 21 7.0 6.9
Erie 43 4.7 4.8
Essex * * *
Franklin 2 3.5** 3**
Fulton 2 3.6** 3.5**
Genesee 3 5.1** 5.2**
Greene 4 8.6 9.3
Hamilton * * *
Herkimer 3 4.7** 5.2**
Jefferson 8 6.4 6.3
Kings 93 3.6 3.6
Lewis * * *
Livingston 3 5** 5.6**
Madison 4 5.6 6.2
Monroe 33 4.5 4.4
Montgomery * * *
Nassau 66 4.9 5.0
New York 49 3.0 2.8
Niagara 15 6.9 7.3
Oneida 8 3.4 3.5
Onondaga 27 5.9 5.9
Ontario 2 2.2** 2.1**
Orange 21 5.4 5.4
Orleans 1 3.3** 3.6**
Oswego 11 8.7 8.9
Otsego 2 2.9** 3.2**
Putnam 4 4.2 4.3
Queens 60 2.6 2.4
Rensselaer 6 3.8 3.8
Richmond 48 10.1 9.9
Rockland 9 3.0 3.1
St. Lawrence 5 4.9 4.8
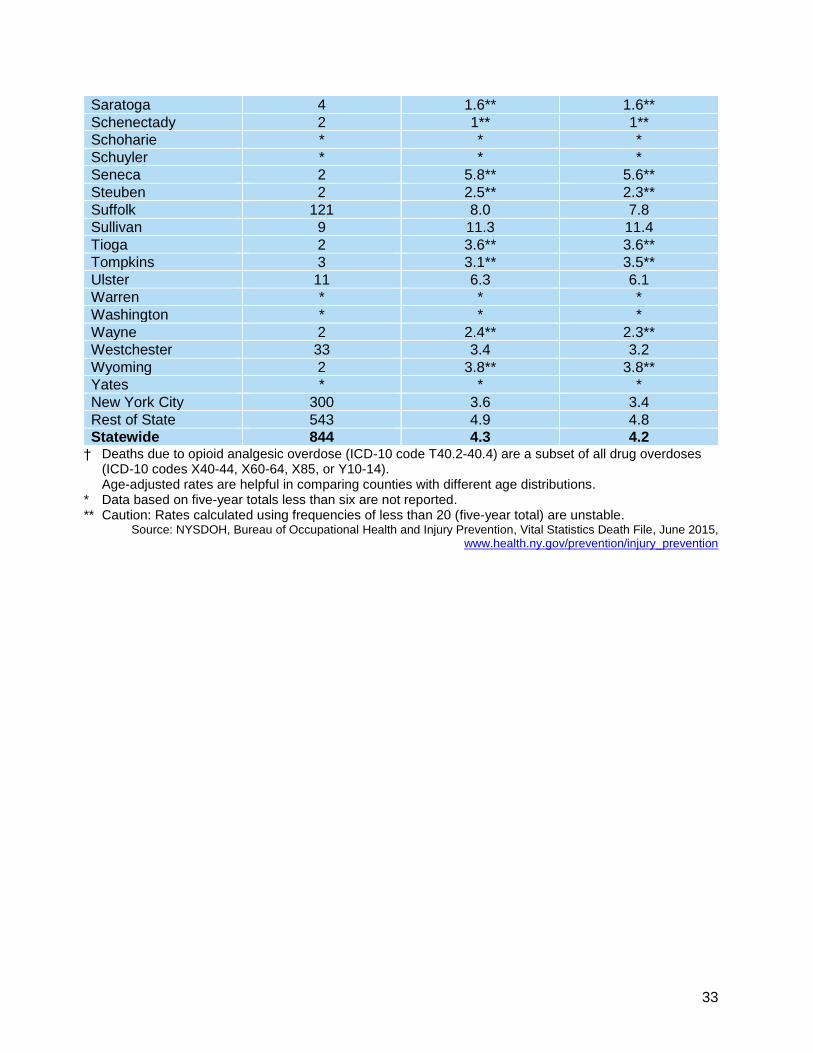
33
Saratoga 4 1.6** 1.6**
Schenectady 2 1** 1**
Schoharie * * *
Schuyler * * *
Seneca 2 5.8** 5.6**
Steuben 2 2.5** 2.3**
Suffolk 121 8.0 7.8
Sullivan 9 11.3 11.4
Tioga 2 3.6** 3.6**
Tompkins 3 3.1** 3.5**
Ulster 11 6.3 6.1
Warren * * *
Washington * * *
Wayne 2 2.4** 2.3**
Westchester 33 3.4 3.2
Wyoming 2 3.8** 3.8**
Yates * * *
New York City 300 3.6 3.4
Rest of State 543 4.9 4.8
Statewide 844 4.3 4.2 † Deaths due to opioid analgesic overdose (ICD-10 code T40.2-40.4) are a subset of all drug overdoses
(ICD-10 codes X40-44, X60-64, X85, or Y10-14). Age-adjusted rates are helpful in comparing counties with different age distributions.
* Data based on five-year totals less than six are not reported. ** Caution: Rates calculated using frequencies of less than 20 (five-year total) are unstable.
Source: NYSDOH, Bureau of Occupational Health and Injury Prevention, Vital Statistics Death File, June 2015, www.health.ny.gov/prevention/injury_prevention
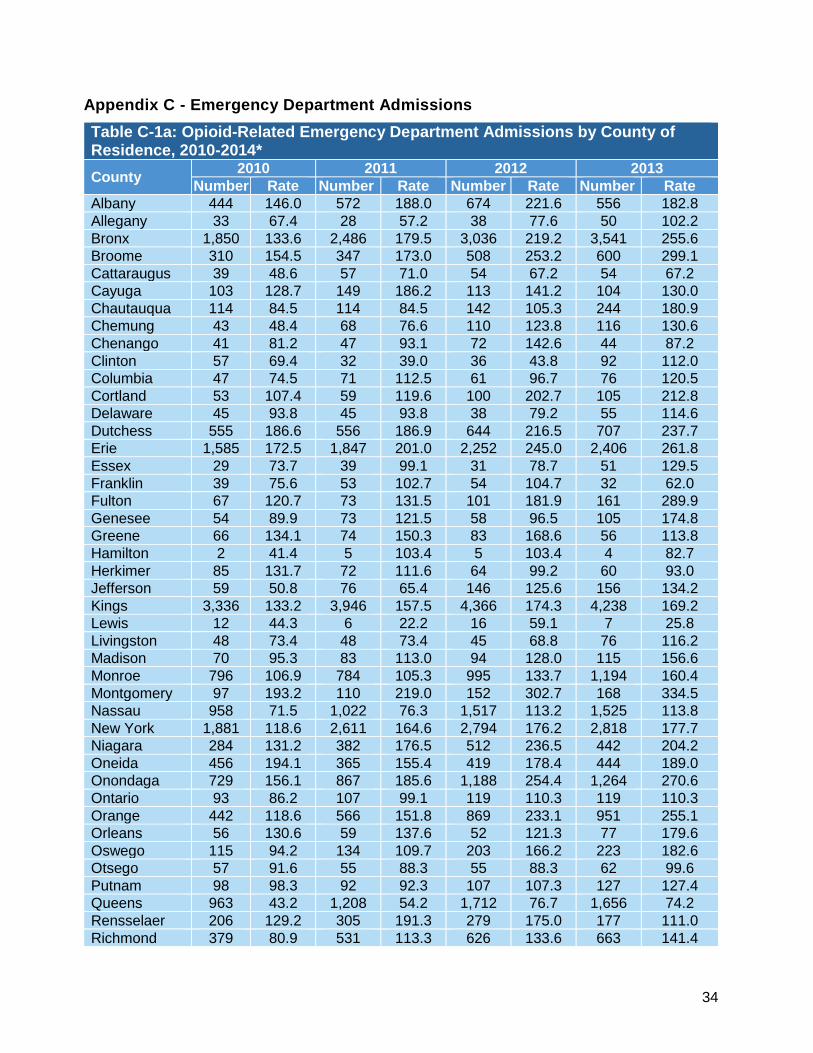
34
Appendix C - Emergency Department Admissions
Table C-1a: Opioid-Related Emergency Department Admissions by County of Residence, 2010-2014*
County 2010 2011 2012 2013
Number Rate Number Rate Number Rate Number Rate
Albany 444 146.0 572 188.0 674 221.6 556 182.8
Allegany 33 67.4 28 57.2 38 77.6 50 102.2
Bronx 1,850 133.6 2,486 179.5 3,036 219.2 3,541 255.6
Broome 310 154.5 347 173.0 508 253.2 600 299.1
Cattaraugus 39 48.6 57 71.0 54 67.2 54 67.2
Cayuga 103 128.7 149 186.2 113 141.2 104 130.0
Chautauqua 114 84.5 114 84.5 142 105.3 244 180.9
Chemung 43 48.4 68 76.6 110 123.8 116 130.6
Chenango 41 81.2 47 93.1 72 142.6 44 87.2
Clinton 57 69.4 32 39.0 36 43.8 92 112.0
Columbia 47 74.5 71 112.5 61 96.7 76 120.5
Cortland 53 107.4 59 119.6 100 202.7 105 212.8
Delaware 45 93.8 45 93.8 38 79.2 55 114.6
Dutchess 555 186.6 556 186.9 644 216.5 707 237.7
Erie 1,585 172.5 1,847 201.0 2,252 245.0 2,406 261.8
Essex 29 73.7 39 99.1 31 78.7 51 129.5
Franklin 39 75.6 53 102.7 54 104.7 32 62.0
Fulton 67 120.7 73 131.5 101 181.9 161 289.9
Genesee 54 89.9 73 121.5 58 96.5 105 174.8
Greene 66 134.1 74 150.3 83 168.6 56 113.8
Hamilton 2 41.4 5 103.4 5 103.4 4 82.7
Herkimer 85 131.7 72 111.6 64 99.2 60 93.0
Jefferson 59 50.8 76 65.4 146 125.6 156 134.2
Kings 3,336 133.2 3,946 157.5 4,366 174.3 4,238 169.2
Lewis 12 44.3 6 22.2 16 59.1 7 25.8
Livingston 48 73.4 48 73.4 45 68.8 76 116.2
Madison 70 95.3 83 113.0 94 128.0 115 156.6
Monroe 796 106.9 784 105.3 995 133.7 1,194 160.4
Montgomery 97 193.2 110 219.0 152 302.7 168 334.5
Nassau 958 71.5 1,022 76.3 1,517 113.2 1,525 113.8
New York 1,881 118.6 2,611 164.6 2,794 176.2 2,818 177.7
Niagara 284 131.2 382 176.5 512 236.5 442 204.2
Oneida 456 194.1 365 155.4 419 178.4 444 189.0
Onondaga 729 156.1 867 185.6 1,188 254.4 1,264 270.6
Ontario 93 86.2 107 99.1 119 110.3 119 110.3
Orange 442 118.6 566 151.8 869 233.1 951 255.1
Orleans 56 130.6 59 137.6 52 121.3 77 179.6
Oswego 115 94.2 134 109.7 203 166.2 223 182.6
Otsego 57 91.6 55 88.3 55 88.3 62 99.6
Putnam 98 98.3 92 92.3 107 107.3 127 127.4
Queens 963 43.2 1,208 54.2 1,712 76.7 1,656 74.2
Rensselaer 206 129.2 305 191.3 279 175.0 177 111.0
Richmond 379 80.9 531 113.3 626 133.6 663 141.4
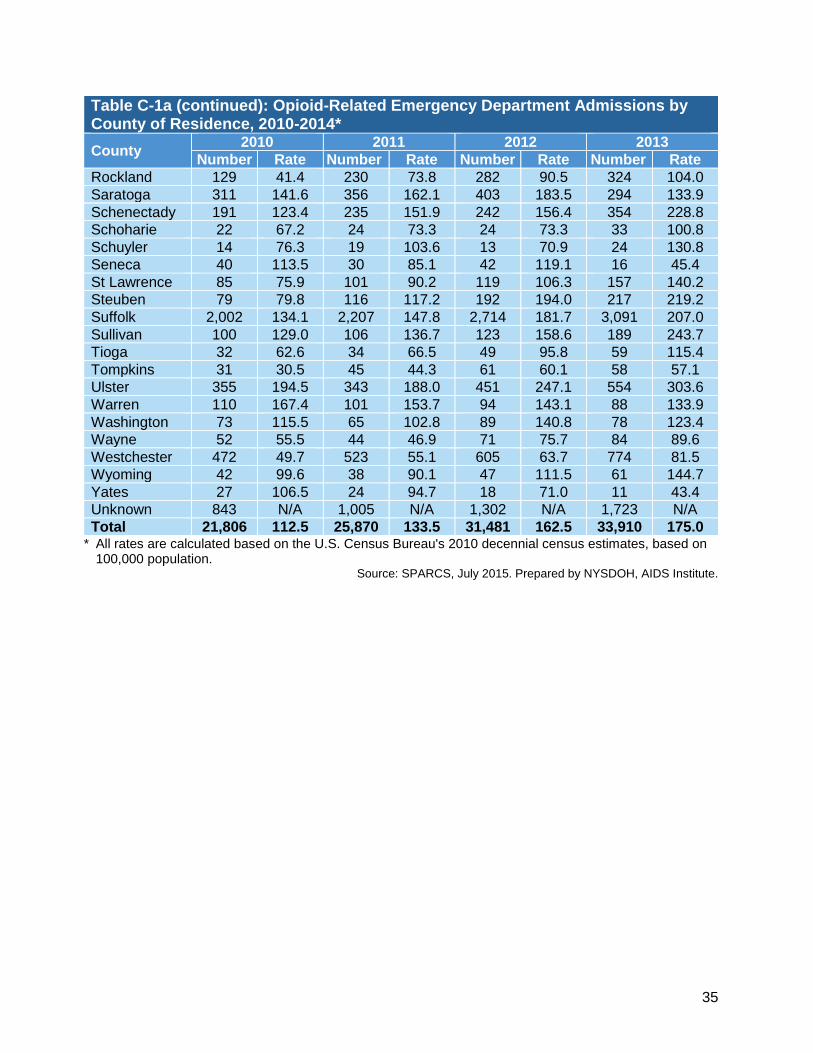
35
Table C-1a (continued): Opioid-Related Emergency Department Admissions by County of Residence, 2010-2014*
County 2010 2011 2012 2013
Number Rate Number Rate Number Rate Number Rate
Rockland 129 41.4 230 73.8 282 90.5 324 104.0
Saratoga 311 141.6 356 162.1 403 183.5 294 133.9
Schenectady 191 123.4 235 151.9 242 156.4 354 228.8
Schoharie 22 67.2 24 73.3 24 73.3 33 100.8
Schuyler 14 76.3 19 103.6 13 70.9 24 130.8
Seneca 40 113.5 30 85.1 42 119.1 16 45.4
St Lawrence 85 75.9 101 90.2 119 106.3 157 140.2
Steuben 79 79.8 116 117.2 192 194.0 217 219.2
Suffolk 2,002 134.1 2,207 147.8 2,714 181.7 3,091 207.0
Sullivan 100 129.0 106 136.7 123 158.6 189 243.7
Tioga 32 62.6 34 66.5 49 95.8 59 115.4
Tompkins 31 30.5 45 44.3 61 60.1 58 57.1
Ulster 355 194.5 343 188.0 451 247.1 554 303.6
Warren 110 167.4 101 153.7 94 143.1 88 133.9
Washington 73 115.5 65 102.8 89 140.8 78 123.4
Wayne 52 55.5 44 46.9 71 75.7 84 89.6
Westchester 472 49.7 523 55.1 605 63.7 774 81.5
Wyoming 42 99.6 38 90.1 47 111.5 61 144.7
Yates 27 106.5 24 94.7 18 71.0 11 43.4
Unknown 843 N/A 1,005 N/A 1,302 N/A 1,723 N/A
Total 21,806 112.5 25,870 133.5 31,481 162.5 33,910 175.0 * All rates are calculated based on the U.S. Census Bureau's 2010 decennial census estimates, based on
100,000 population. Source: SPARCS, July 2015. Prepared by NYSDOH, AIDS Institute.
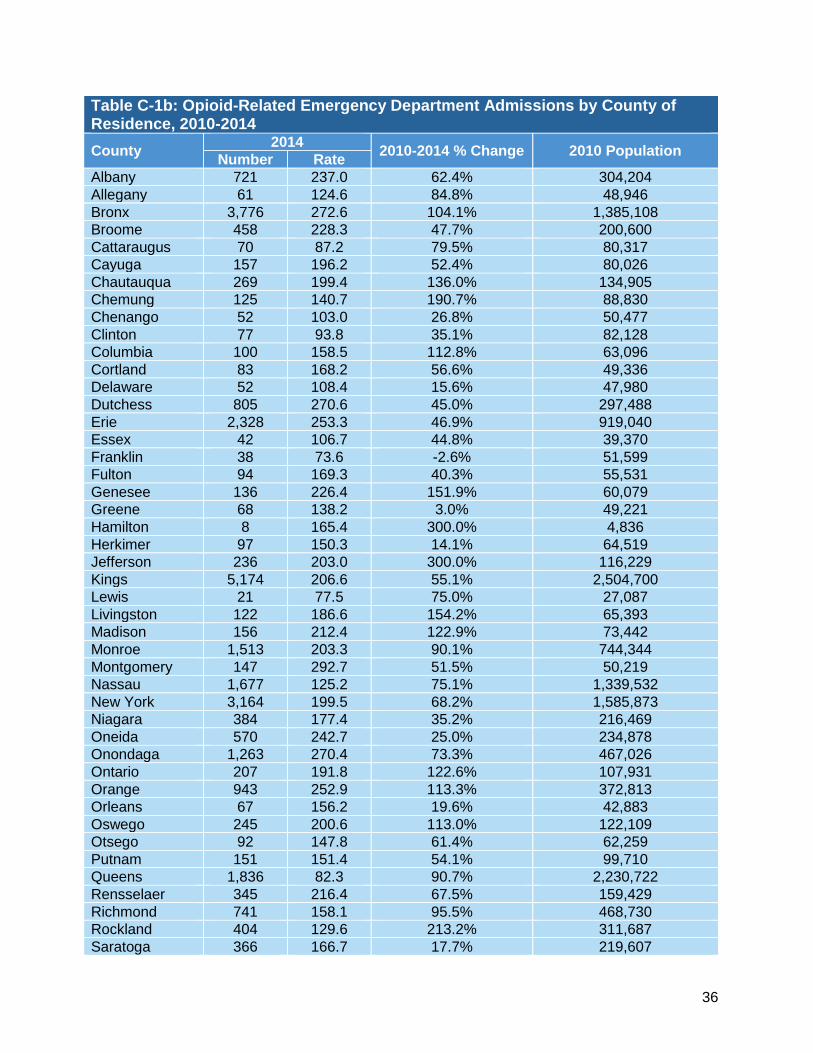
36
Table C-1b: Opioid-Related Emergency Department Admissions by County of Residence, 2010-2014
County 2014
2010-2014 % Change 2010 Population Number Rate
Albany 721 237.0 62.4% 304,204
Allegany 61 124.6 84.8% 48,946
Bronx 3,776 272.6 104.1% 1,385,108
Broome 458 228.3 47.7% 200,600
Cattaraugus 70 87.2 79.5% 80,317
Cayuga 157 196.2 52.4% 80,026
Chautauqua 269 199.4 136.0% 134,905
Chemung 125 140.7 190.7% 88,830
Chenango 52 103.0 26.8% 50,477
Clinton 77 93.8 35.1% 82,128
Columbia 100 158.5 112.8% 63,096
Cortland 83 168.2 56.6% 49,336
Delaware 52 108.4 15.6% 47,980
Dutchess 805 270.6 45.0% 297,488
Erie 2,328 253.3 46.9% 919,040
Essex 42 106.7 44.8% 39,370
Franklin 38 73.6 -2.6% 51,599
Fulton 94 169.3 40.3% 55,531
Genesee 136 226.4 151.9% 60,079
Greene 68 138.2 3.0% 49,221
Hamilton 8 165.4 300.0% 4,836
Herkimer 97 150.3 14.1% 64,519
Jefferson 236 203.0 300.0% 116,229
Kings 5,174 206.6 55.1% 2,504,700
Lewis 21 77.5 75.0% 27,087
Livingston 122 186.6 154.2% 65,393
Madison 156 212.4 122.9% 73,442
Monroe 1,513 203.3 90.1% 744,344
Montgomery 147 292.7 51.5% 50,219
Nassau 1,677 125.2 75.1% 1,339,532
New York 3,164 199.5 68.2% 1,585,873
Niagara 384 177.4 35.2% 216,469
Oneida 570 242.7 25.0% 234,878
Onondaga 1,263 270.4 73.3% 467,026
Ontario 207 191.8 122.6% 107,931
Orange 943 252.9 113.3% 372,813
Orleans 67 156.2 19.6% 42,883
Oswego 245 200.6 113.0% 122,109
Otsego 92 147.8 61.4% 62,259
Putnam 151 151.4 54.1% 99,710
Queens 1,836 82.3 90.7% 2,230,722
Rensselaer 345 216.4 67.5% 159,429
Richmond 741 158.1 95.5% 468,730
Rockland 404 129.6 213.2% 311,687
Saratoga 366 166.7 17.7% 219,607
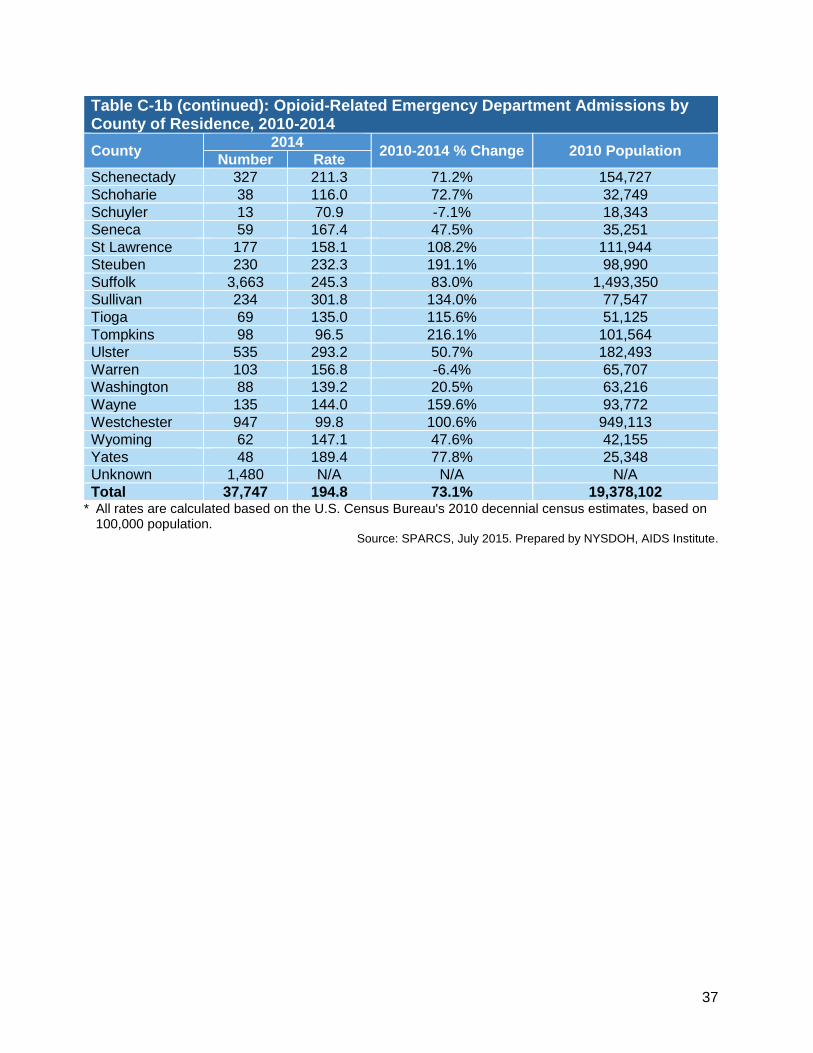
37
Table C-1b (continued): Opioid-Related Emergency Department Admissions by County of Residence, 2010-2014
County 2014
2010-2014 % Change 2010 Population Number Rate
Schenectady 327 211.3 71.2% 154,727
Schoharie 38 116.0 72.7% 32,749
Schuyler 13 70.9 -7.1% 18,343
Seneca 59 167.4 47.5% 35,251
St Lawrence 177 158.1 108.2% 111,944
Steuben 230 232.3 191.1% 98,990
Suffolk 3,663 245.3 83.0% 1,493,350
Sullivan 234 301.8 134.0% 77,547
Tioga 69 135.0 115.6% 51,125
Tompkins 98 96.5 216.1% 101,564
Ulster 535 293.2 50.7% 182,493
Warren 103 156.8 -6.4% 65,707
Washington 88 139.2 20.5% 63,216
Wayne 135 144.0 159.6% 93,772
Westchester 947 99.8 100.6% 949,113
Wyoming 62 147.1 47.6% 42,155
Yates 48 189.4 77.8% 25,348
Unknown 1,480 N/A N/A N/A
Total 37,747 194.8 73.1% 19,378,102 * All rates are calculated based on the U.S. Census Bureau's 2010 decennial census estimates, based on
100,000 population. Source: SPARCS, July 2015. Prepared by NYSDOH, AIDS Institute.
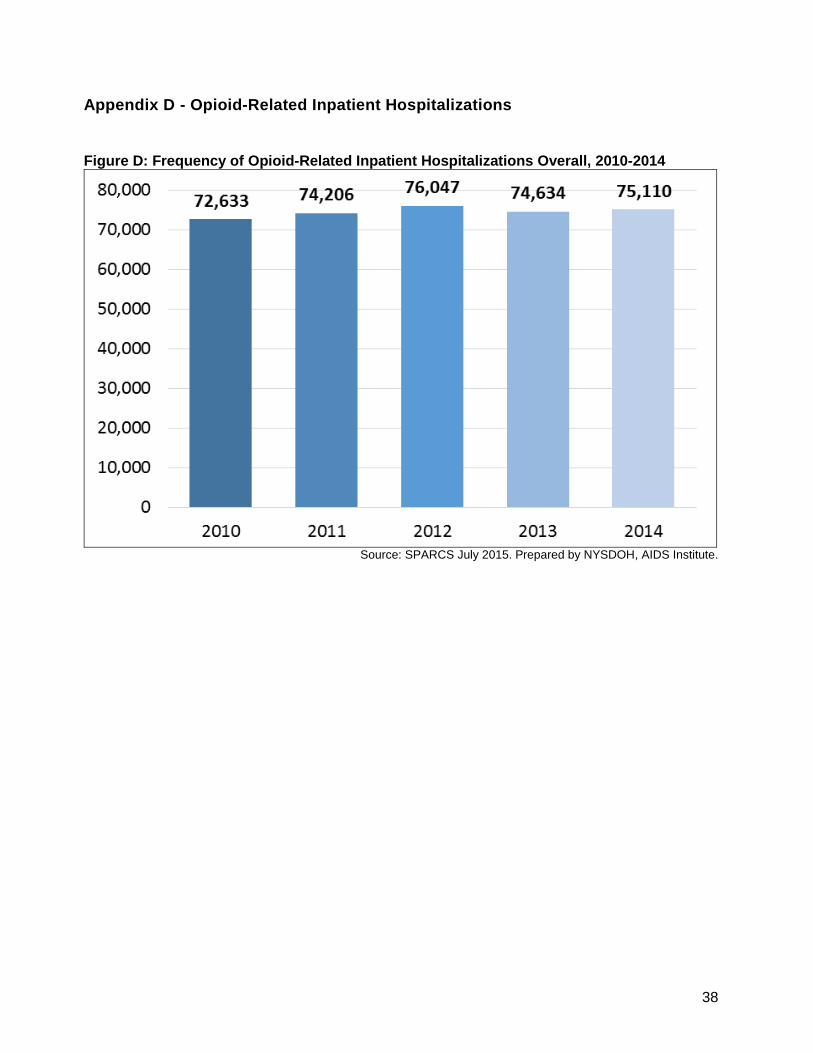
38
Appendix D - Opioid-Related Inpatient Hospitalizations
Figure D: Frequency of Opioid-Related Inpatient Hospitalizations Overall, 2010-2014
Source: SPARCS July 2015. Prepared by NYSDOH, AIDS Institute.
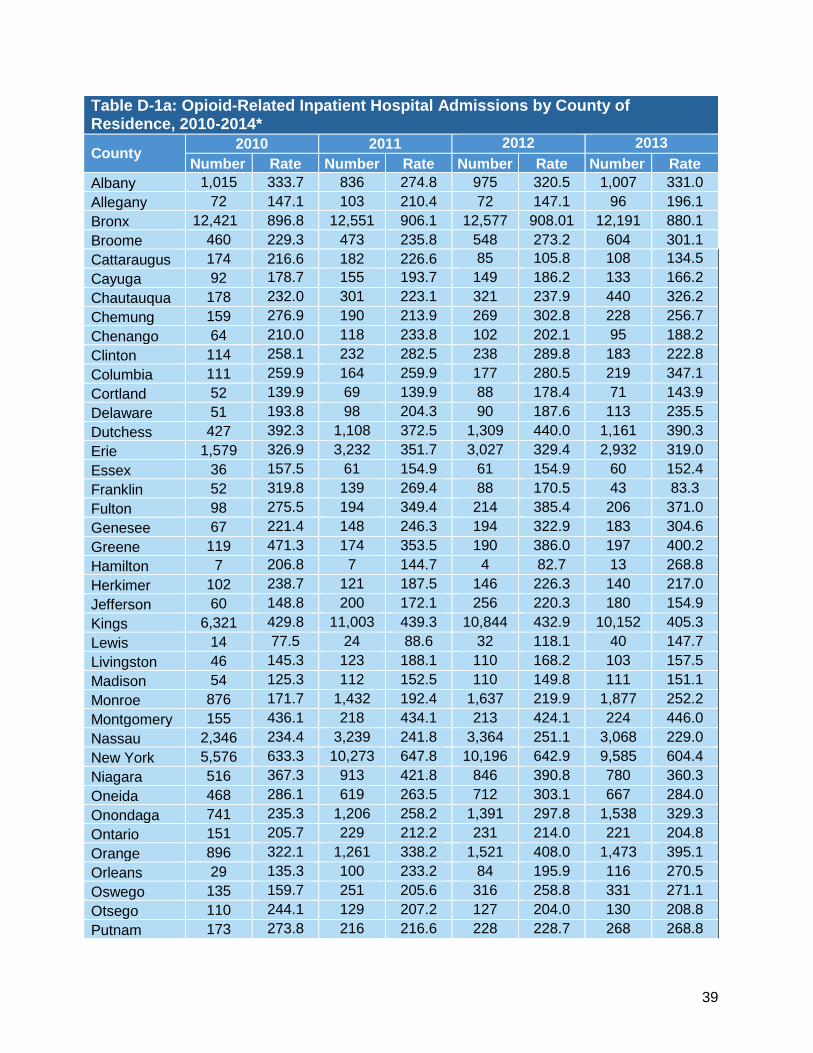
39
Table D-1a: Opioid-Related Inpatient Hospital Admissions by County of Residence, 2010-2014*
County 2010 2011 2012 2013
Number Rate Number Rate Number Rate Number Rate
Albany 1,015 333.7 836 274.8 975 320.5 1,007 331.0
Allegany 72 147.1 103 210.4 72 147.1 96 196.1
Bronx 12,421 896.8 12,551 906.1 12,577 908.01 12,191 880.1
Broome 460 229.3 473 235.8 548 273.2 604 301.1
Cattaraugus 174 216.6 182 226.6 85 105.8 108 134.5
Cayuga 92 178.7 155 193.7 149 186.2 133 166.2
Chautauqua 178 232.0 301 223.1 321 237.9 440 326.2
Chemung 159 276.9 190 213.9 269 302.8 228 256.7
Chenango 64 210.0 118 233.8 102 202.1 95 188.2
Clinton 114 258.1 232 282.5 238 289.8 183 222.8
Columbia 111 259.9 164 259.9 177 280.5 219 347.1
Cortland 52 139.9 69 139.9 88 178.4 71 143.9
Delaware 51 193.8 98 204.3 90 187.6 113 235.5
Dutchess 427 392.3 1,108 372.5 1,309 440.0 1,161 390.3
Erie 1,579 326.9 3,232 351.7 3,027 329.4 2,932 319.0
Essex 36 157.5 61 154.9 61 154.9 60 152.4
Franklin 52 319.8 139 269.4 88 170.5 43 83.3
Fulton 98 275.5 194 349.4 214 385.4 206 371.0
Genesee 67 221.4 148 246.3 194 322.9 183 304.6
Greene 119 471.3 174 353.5 190 386.0 197 400.2
Hamilton 7 206.8 7 144.7 4 82.7 13 268.8
Herkimer 102 238.7 121 187.5 146 226.3 140 217.0
Jefferson 60 148.8 200 172.1 256 220.3 180 154.9
Kings 6,321 429.8 11,003 439.3 10,844 432.9 10,152 405.3
Lewis 14 77.5 24 88.6 32 118.1 40 147.7
Livingston 46 145.3 123 188.1 110 168.2 103 157.5
Madison 54 125.3 112 152.5 110 149.8 111 151.1
Monroe 876 171.7 1,432 192.4 1,637 219.9 1,877 252.2
Montgomery 155 436.1 218 434.1 213 424.1 224 446.0
Nassau 2,346 234.4 3,239 241.8 3,364 251.1 3,068 229.0
New York 5,576 633.3 10,273 647.8 10,196 642.9 9,585 604.4
Niagara 516 367.3 913 421.8 846 390.8 780 360.3
Oneida 468 286.1 619 263.5 712 303.1 667 284.0
Onondaga 741 235.3 1,206 258.2 1,391 297.8 1,538 329.3
Ontario 151 205.7 229 212.2 231 214.0 221 204.8
Orange 896 322.1 1,261 338.2 1,521 408.0 1,473 395.1
Orleans 29 135.3 100 233.2 84 195.9 116 270.5
Oswego 135 159.7 251 205.6 316 258.8 331 271.1
Otsego 110 244.1 129 207.2 127 204.0 130 208.8
Putnam 173 273.8 216 216.6 228 228.7 268 268.8
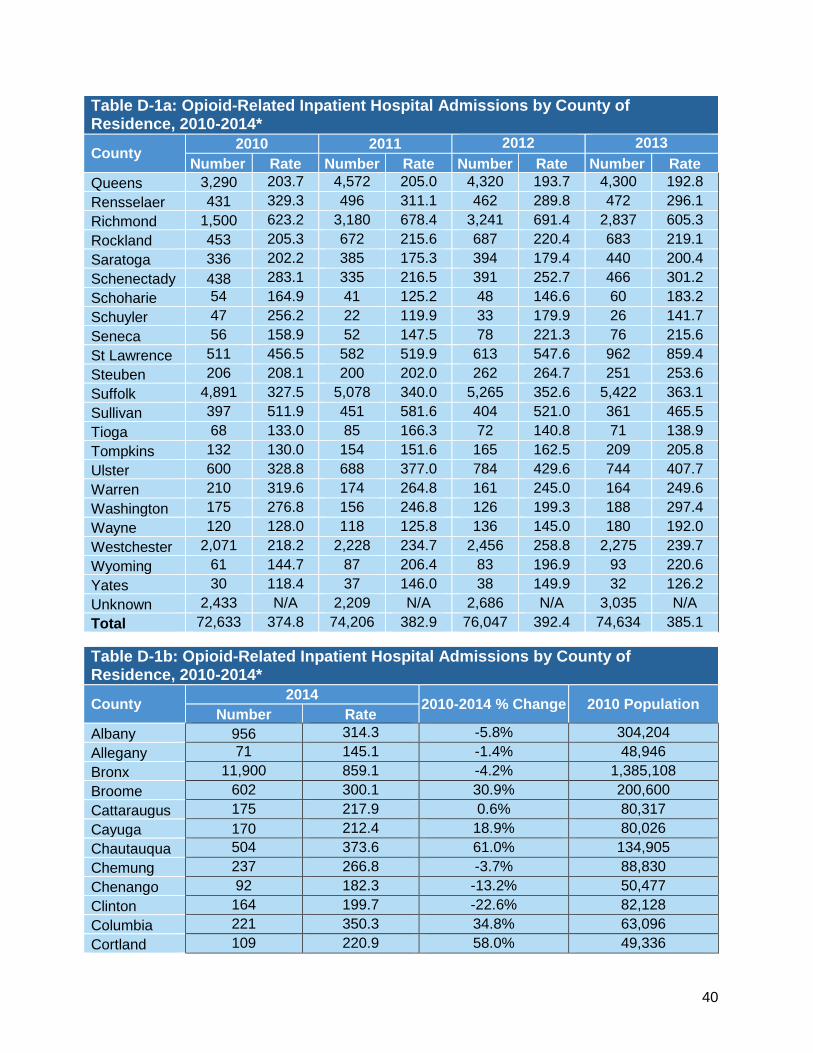
40
Table D-1a: Opioid-Related Inpatient Hospital Admissions by County of Residence, 2010-2014*
County 2010 2011 2012 2013
Number Rate Number Rate Number Rate Number Rate
Queens 3,290 203.7 4,572 205.0 4,320 193.7 4,300 192.8
Rensselaer 431 329.3 496 311.1 462 289.8 472 296.1
Richmond 1,500 623.2 3,180 678.4 3,241 691.4 2,837 605.3
Rockland 453 205.3 672 215.6 687 220.4 683 219.1
Saratoga 336 202.2 385 175.3 394 179.4 440 200.4
Schenectady 438 283.1 335 216.5 391 252.7 466 301.2
Schoharie 54 164.9 41 125.2 48 146.6 60 183.2
Schuyler 47 256.2 22 119.9 33 179.9 26 141.7
Seneca 56 158.9 52 147.5 78 221.3 76 215.6
St Lawrence 511 456.5 582 519.9 613 547.6 962 859.4
Steuben 206 208.1 200 202.0 262 264.7 251 253.6
Suffolk 4,891 327.5 5,078 340.0 5,265 352.6 5,422 363.1
Sullivan 397 511.9 451 581.6 404 521.0 361 465.5
Tioga 68 133.0 85 166.3 72 140.8 71 138.9
Tompkins 132 130.0 154 151.6 165 162.5 209 205.8
Ulster 600 328.8 688 377.0 784 429.6 744 407.7
Warren 210 319.6 174 264.8 161 245.0 164 249.6
Washington 175 276.8 156 246.8 126 199.3 188 297.4
Wayne 120 128.0 118 125.8 136 145.0 180 192.0
Westchester 2,071 218.2 2,228 234.7 2,456 258.8 2,275 239.7
Wyoming 61 144.7 87 206.4 83 196.9 93 220.6
Yates 30 118.4 37 146.0 38 149.9 32 126.2
Unknown 2,433 N/A 2,209 N/A 2,686 N/A 3,035 N/A
Total 72,633 374.8 74,206 382.9 76,047 392.4 74,634 385.1
Table D-1b: Opioid-Related Inpatient Hospital Admissions by County of Residence, 2010-2014*
County 2014
2010-2014 % Change 2010 Population Number Rate
Albany 956 314.3 -5.8% 304,204
Allegany 71 145.1 -1.4% 48,946
Bronx 11,900 859.1 -4.2% 1,385,108
Broome 602 300.1 30.9% 200,600
Cattaraugus 175 217.9 0.6% 80,317
Cayuga 170 212.4 18.9% 80,026
Chautauqua 504 373.6 61.0% 134,905
Chemung 237 266.8 -3.7% 88,830
Chenango 92 182.3 -13.2% 50,477
Clinton 164 199.7 -22.6% 82,128
Columbia 221 350.3 34.8% 63,096
Cortland 109 220.9 58.0% 49,336

41
Table D-1b: Opioid-Related Inpatient Hospital Admissions by County of Residence, 2010-2014*
County 2014
2010-2014 % Change 2010 Population Number Rate
Delaware 85 177.2 -8.6% 47,980
Dutchess 1,112 373.8 -4.7% 297,488
Erie 3,163 344.2 5.3% 919,040
Essex 39 99.1 -37.1% 39,370
Franklin 45 87.2 -72.7% 51,599
Fulton 207 372.8 35.3% 55,531
Genesee 215 357.9 61.7% 60,079
Greene 236 479.5 1.7% 49,221
Hamilton 11 227.5 10.0% 4,836
Herkimer 138 213.9 -10.4% 64,519
Jefferson 169 145.4 -2.3% 116,229
Kings 10,373 414.1 -3.6% 2,504,700
Lewis 35 129.2 66.7% 27,087
Livingston 130 198.8 36.8% 65,393
Madison 148 201.5 60.9% 73,442
Monroe 1,804 242.4 41.2% 744,344
Montgomery 221 440.1 0.9% 50,219
Nassau 3,090 230.7 -1.6% 1,339,532
New York 9,002 567.6 -10.4% 1,585,873
Niagara 759 350.6 -4.5% 216,469
Oneida 673 286.5 0.1% 234,878
Onondaga 1,570 336.2 42.9% 467,026
Ontario 202 187.2 -9.0% 107,931
Orange 1,411 378.5 17.5% 372,813
Orleans 107 249.5 84.5% 42,883
Oswego 380 311.2 94.9% 122,109
Otsego 126 202.4 -17.1% 62,259
Putnam 256 256.7 -6.2% 99,710
Queens 4,429 198.5 -2.5% 2,230,722
Rensselaer 410 257.2 -21.9% 159,429
Richmond 2,743 585.2 -6.1% 468,730
Rockland 763 244.8 19.2% 311,687
Saratoga 432 196.7 -2.7% 219,607
Schenectady 529 341.9 20.8% 154,727
Schoharie 50 152.7 -7.4% 32,749
Schuyler 32 174.5 -31.9% 18,343
Seneca 74 209.9 32.1% 35,251
St Lawrence 828 739.7 62.0% 111,944
Steuben 251 253.6 21.8% 98,990
Suffolk 6,323 423.4 29.3% 1,493,350

42
Table D-1b: Opioid-Related Inpatient Hospital Admissions by County of Residence, 2010-2014*
County 2014
2010-2014 % Change 2010 Population Number Rate
Sullivan 334 430.7 -15.9% 77,547
Tioga 102 199.5 50.0% 51,125
Tompkins 241 237.3 82.6% 101,564
Ulster 775 424.7 29.2% 182,493
Warren 201 305.9 -4.3% 65,707
Washington 167 264.2 -4.6% 63,216
Wayne 155 165.3 29.2% 93,772
Westchester 2,462 259.4 18.9% 949,113
Wyoming 91 215.9 49.2% 42,155
Yates 39 153.9 30.0% 25,348
Unknown 2,771 N/A N/A N/A
Total 75,110 387.6 3.4% N/A
* All rates are calculated based on the U.S. Census Bureau's 2010 decennial census estimates, based on 100,000 population.
Source: SPARCS July 2015. Prepared by NYSDOH, AIDS Institute.
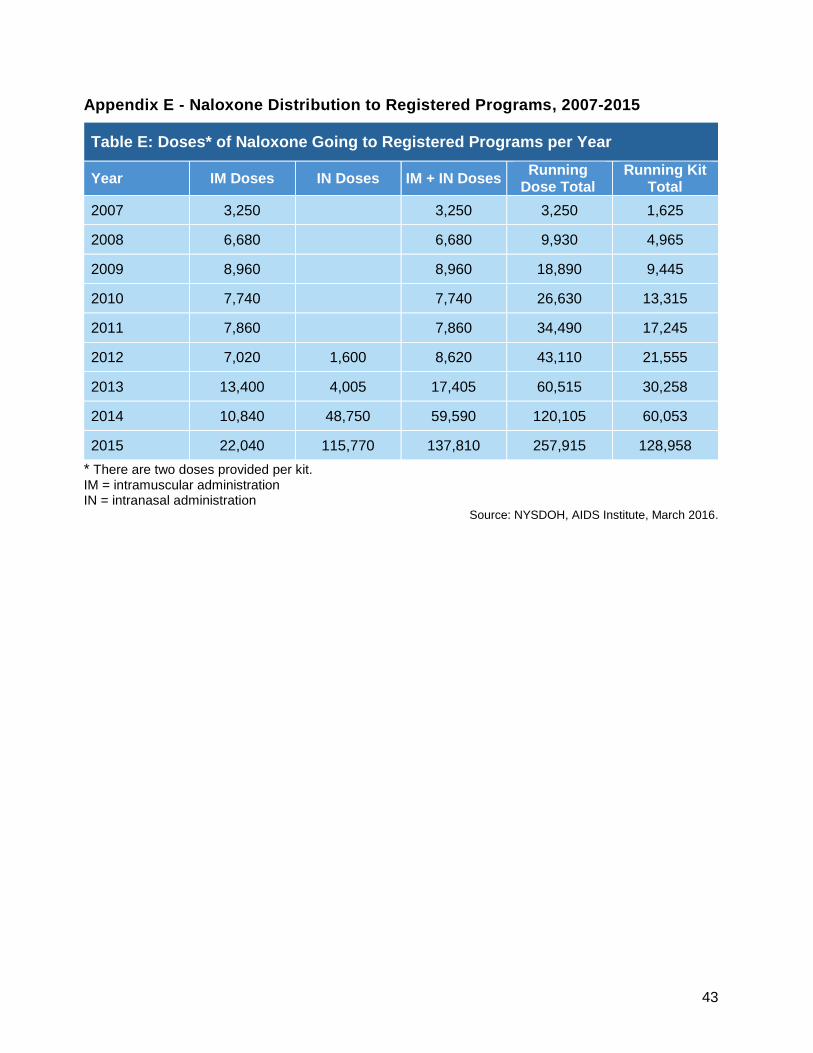
43
Appendix E - Naloxone Distribution to Registered Programs, 2007-2015
Table E: Doses* of Naloxone Going to Registered Programs per Year
Year IM Doses IN Doses IM + IN Doses Running
Dose Total Running Kit
Total
2007 3,250 3,250 3,250 1,625
2008 6,680 6,680 9,930 4,965
2009 8,960 8,960 18,890 9,445
2010 7,740 7,740 26,630 13,315
2011 7,860 7,860 34,490 17,245
2012 7,020 1,600 8,620 43,110 21,555
2013 13,400 4,005 17,405 60,515 30,258
2014 10,840 48,750 59,590 120,105 60,053
2015 22,040 115,770 137,810 257,915 128,958
* There are two doses provided per kit. IM = intramuscular administration IN = intranasal administration
Source: NYSDOH, AIDS Institute, March 2016.
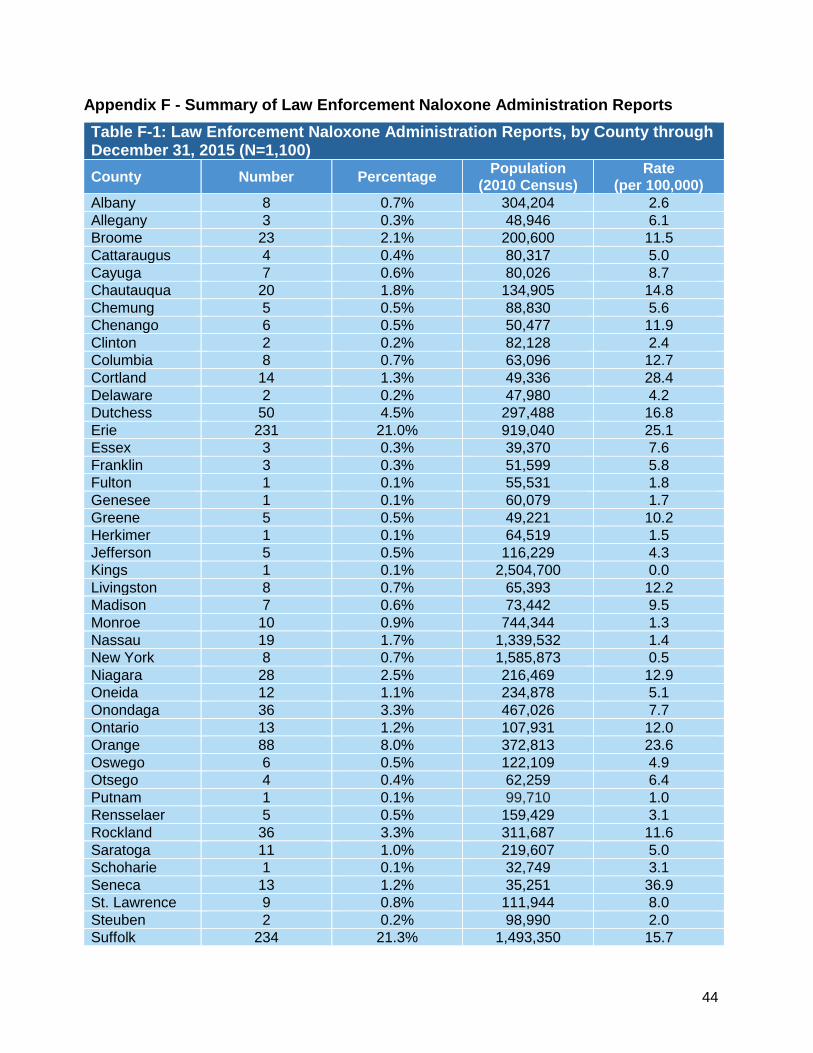
44
Appendix F - Summary of Law Enforcement Naloxone Administration Reports
Table F-1: Law Enforcement Naloxone Administration Reports, by County through December 31, 2015 (N=1,100)
County Number Percentage Population
(2010 Census) Rate
(per 100,000)
Albany 8 0.7% 304,204 2.6
Allegany 3 0.3% 48,946 6.1
Broome 23 2.1% 200,600 11.5
Cattaraugus 4 0.4% 80,317 5.0
Cayuga 7 0.6% 80,026 8.7
Chautauqua 20 1.8% 134,905 14.8
Chemung 5 0.5% 88,830 5.6
Chenango 6 0.5% 50,477 11.9
Clinton 2 0.2% 82,128 2.4
Columbia 8 0.7% 63,096 12.7
Cortland 14 1.3% 49,336 28.4
Delaware 2 0.2% 47,980 4.2
Dutchess 50 4.5% 297,488 16.8
Erie 231 21.0% 919,040 25.1
Essex 3 0.3% 39,370 7.6
Franklin 3 0.3% 51,599 5.8
Fulton 1 0.1% 55,531 1.8
Genesee 1 0.1% 60,079 1.7
Greene 5 0.5% 49,221 10.2
Herkimer 1 0.1% 64,519 1.5
Jefferson 5 0.5% 116,229 4.3
Kings 1 0.1% 2,504,700 0.0
Livingston 8 0.7% 65,393 12.2
Madison 7 0.6% 73,442 9.5
Monroe 10 0.9% 744,344 1.3
Nassau 19 1.7% 1,339,532 1.4
New York 8 0.7% 1,585,873 0.5
Niagara 28 2.5% 216,469 12.9
Oneida 12 1.1% 234,878 5.1
Onondaga 36 3.3% 467,026 7.7
Ontario 13 1.2% 107,931 12.0
Orange 88 8.0% 372,813 23.6
Oswego 6 0.5% 122,109 4.9
Otsego 4 0.4% 62,259 6.4
Putnam 1 0.1% 99,710 1.0
Rensselaer 5 0.5% 159,429 3.1
Rockland 36 3.3% 311,687 11.6
Saratoga 11 1.0% 219,607 5.0
Schoharie 1 0.1% 32,749 3.1
Seneca 13 1.2% 35,251 36.9
St. Lawrence 9 0.8% 111,944 8.0
Steuben 2 0.2% 98,990 2.0
Suffolk 234 21.3% 1,493,350 15.7

45
Table F-1 (continued): Law Enforcement Naloxone Administration Reports, by County through Dec. 31, 2015 (N=1,100)
County Number Percentage Population
(2010 Census) Rate
(per 100,000)
Sullivan 25 2.3% 77,547 32.2
Tioga 1 0.1% 51,125 2.0
Tompkins 5 0.5% 101,564 4.9
Ulster 30 2.7% 182,493 16.4
Warren 3 0.3% 65,707 4.6
Washington 7 0.6% 63,216 11.1
Wayne 16 1.5% 93,772 17.1
Westchester 49 4.5% 949,113 5.2
Wyoming 2 0.2% 42,155 4.7
Yates 8 0.7% 25,348 31.6 Source: NYSDOH, AIDS Institute, Office of Program Evaluation and Research, Dec. 31, 2015.
Table F-2: Age Ranges of Individuals who were Administered Naloxone by Law Enforcement through December 31, 2015 (N=982)
Age Range Number Percentage
14 years or less 2 0.2%
15 - 24 years old 325 30.9%
25 - 34 years old 446 42.4%
35 - 44 years old 152 14.5%
45 - 54 years old 84 8.0%
55 - 64 years old 38 3.6%
64 or older 4 0.4%
Source: NYSDOH, AIDS Institute, Office of Program Evaluation and Research, Dec. 31, 2015.

46
Appendix G - Emergency Basic Medical Services
Figure G: Training Results Poster Presentation
Source: Albany Medical College, University of Rochester, NYSDOH AIDS Institute, and NYSDOH Bureau of EMS and
Trauma Systems, 2015.
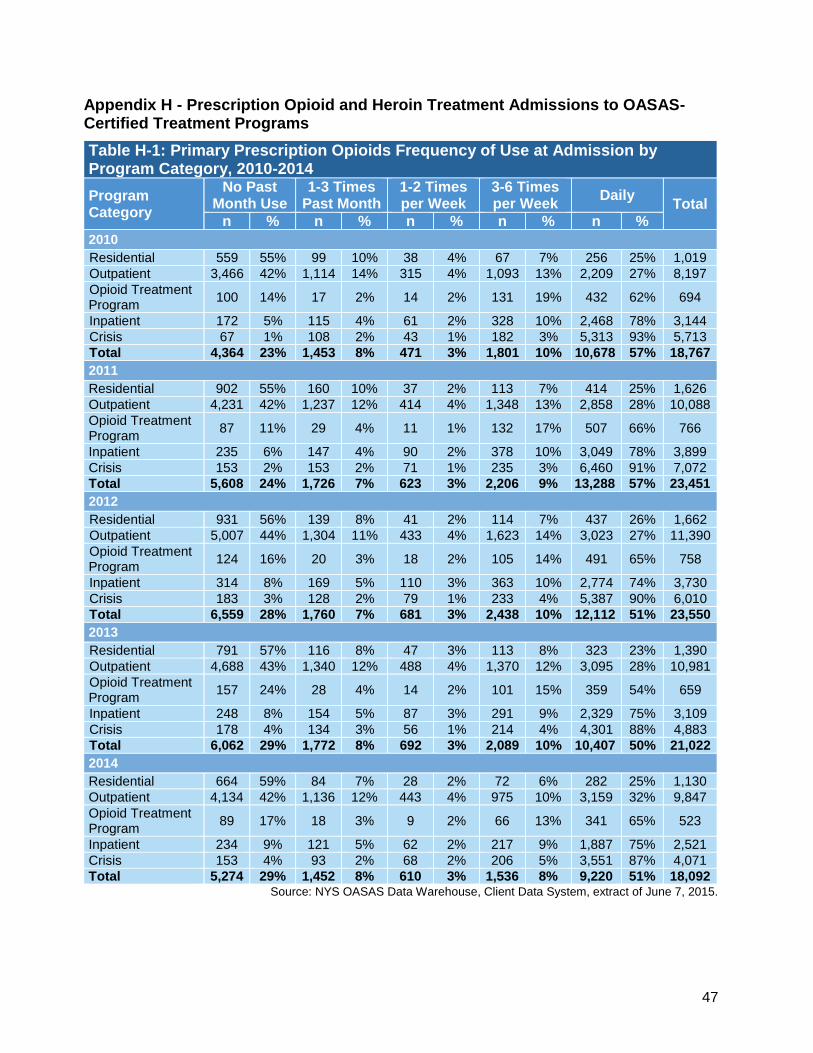
47
Appendix H - Prescription Opioid and Heroin Treatment Admissions to OASAS-Certified Treatment Programs
Source: NYS OASAS Data Warehouse, Client Data System, extract of June 7, 2015.
Table H-1: Primary Prescription Opioids Frequency of Use at Admission by Program Category, 2010-2014
Program Category
No Past Month Use
1-3 Times Past Month
1-2 Times per Week
3-6 Times per Week
Daily Total
n % n % n % n % n %
2010
Residential 559 55% 99 10% 38 4% 67 7% 256 25% 1,019
Outpatient 3,466 42% 1,114 14% 315 4% 1,093 13% 2,209 27% 8,197
Opioid Treatment Program
100 14% 17 2% 14 2% 131 19% 432 62% 694
Inpatient 172 5% 115 4% 61 2% 328 10% 2,468 78% 3,144
Crisis 67 1% 108 2% 43 1% 182 3% 5,313 93% 5,713
Total 4,364 23% 1,453 8% 471 3% 1,801 10% 10,678 57% 18,767
2011
Residential 902 55% 160 10% 37 2% 113 7% 414 25% 1,626
Outpatient 4,231 42% 1,237 12% 414 4% 1,348 13% 2,858 28% 10,088
Opioid Treatment Program
87 11% 29 4% 11 1% 132 17% 507 66% 766
Inpatient 235 6% 147 4% 90 2% 378 10% 3,049 78% 3,899
Crisis 153 2% 153 2% 71 1% 235 3% 6,460 91% 7,072
Total 5,608 24% 1,726 7% 623 3% 2,206 9% 13,288 57% 23,451
2012
Residential 931 56% 139 8% 41 2% 114 7% 437 26% 1,662
Outpatient 5,007 44% 1,304 11% 433 4% 1,623 14% 3,023 27% 11,390
Opioid Treatment Program
124 16% 20 3% 18 2% 105 14% 491 65% 758
Inpatient 314 8% 169 5% 110 3% 363 10% 2,774 74% 3,730
Crisis 183 3% 128 2% 79 1% 233 4% 5,387 90% 6,010
Total 6,559 28% 1,760 7% 681 3% 2,438 10% 12,112 51% 23,550
2013
Residential 791 57% 116 8% 47 3% 113 8% 323 23% 1,390
Outpatient 4,688 43% 1,340 12% 488 4% 1,370 12% 3,095 28% 10,981
Opioid Treatment Program
157 24% 28 4% 14 2% 101 15% 359 54% 659
Inpatient 248 8% 154 5% 87 3% 291 9% 2,329 75% 3,109
Crisis 178 4% 134 3% 56 1% 214 4% 4,301 88% 4,883
Total 6,062 29% 1,772 8% 692 3% 2,089 10% 10,407 50% 21,022
2014
Residential 664 59% 84 7% 28 2% 72 6% 282 25% 1,130
Outpatient 4,134 42% 1,136 12% 443 4% 975 10% 3,159 32% 9,847
Opioid Treatment Program
89 17% 18 3% 9 2% 66 13% 341 65% 523
Inpatient 234 9% 121 5% 62 2% 217 9% 1,887 75% 2,521
Crisis 153 4% 93 2% 68 2% 206 5% 3,551 87% 4,071
Total 5,274 29% 1,452 8% 610 3% 1,536 8% 9,220 51% 18,092

48
Source: NYS OASAS Data Warehouse, Client Data System, extract of June 7, 2015.
Table H-2: Heroin Frequency of Use at Admission by Program Category, 2010-2014
Program Category
No Past Month Use
1-3 Times Past Month
1-2 Times per Week
3-6 Times per Week
Daily Total
n % n % n % n % n %
2010
Outpatient 7,967 58% 1,619 12% 513 4% 1,222 9% 2,407 18% 13,728
Residential 2,124 52% 393 10% 119 3% 335 8% 1,141 28% 4,112
Opioid Treatment Program
2,416 22% 569 5% 310 3% 1,713 16% 5,765 54% 10,773
Inpatient 419 6% 254 4% 166 3% 540 8% 5,179 79% 6,558
Crisis 334 2% 290 1% 180 1% 934 5% 18,991 92% 20,729
Total 13,260 24% 3,125 6% 1,288 2% 4,744 8% 33,483 60% 55,900
2011
Outpatient 7,320 56% 1,475 11% 533 4% 1,093 8% 2,625 20% 13,046
Residential 2,160 48% 456 10% 114 3% 369 8% 1,358 30% 4,457
Opioid Treatment Program
2,131 21% 505 5% 267 3% 1,428 14% 6,011 58% 10,342
Inpatient 454 7% 294 5% 147 2% 559 9% 4,971 77% 6,425
Crisis 354 2% 342 2% 201 1% 1,009 5% 18,745 91% 20,651
Total 12,419 23% 3,072 6% 1,262 2% 4,458 8% 33,710 61% 54,921
2012
Outpatient 7,393 52% 1,636 12% 589 4% 1,526 11% 3,022 21% 14,166
Residential 2,116 47% 360 8% 132 3% 330 7% 1,574 35% 4,512
Opioid Treatment Program
2,685 24% 504 4% 289 3% 1,633 15% 6,111 54% 11,222
Inpatient 498 6% 309 4% 202 3% 648 8% 6,028 78% 7,685
Crisis 475 2% 384 2% 222 1% 1,070 5% 20,352 90% 22,503
Total 13,167 22% 3,193 5% 1,434 2% 5,207 9% 37,087 62% 60,088
2013
Outpatient 8,351 48% 2,052 12% 761 4% 1,785 10% 4,308 25% 17,257
Residential 2,510 47% 416 8% 186 3% 436 8% 1,784 33% 5,332
Opioid Treatment Program
2,164 19% 484 4% 277 2% 1,839 16% 6,512 58% 11,276
Inpatient 651 7% 327 3% 221 2% 673 7% 7,739 81% 9,611
Crisis 615 2% 363 1% 213 1% 758 3% 23,222 92% 25,171
Total 14,291 21% 3,642 5% 1,658 2% 5,491 8% 43,565 63% 68,647
2014
Outpatient 9,537 47% 2,378 12% 890 4% 1,784 9% 5,912 29% 20,501
Residential 2,888 50% 481 8% 199 3% 519 9% 1,677 29% 5,764
Opioid Treatment Program
1,770 16% 477 4% 255 2% 1,500 14% 7,013 64% 11,015
Inpatient 704 6% 288 3% 239 2% 528 5% 9,306 84% 11,065
Crisis 814 3% 444 2% 274 1% 832 3% 26,938 92% 29,302
Total 15,713 20% 4,068 5% 1,857 2% 5,163 7% 50,846 65% 77,647
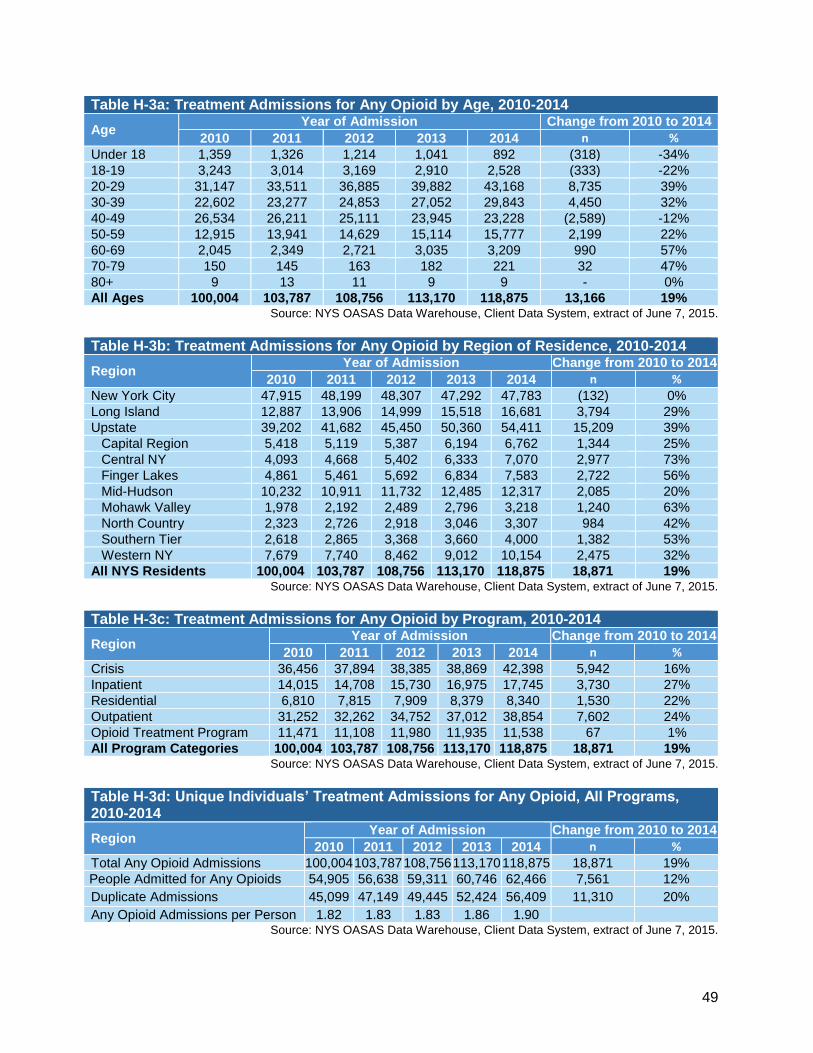
49
Table H-3a: Treatment Admissions for Any Opioid by Age, 2010-2014
Age Year of Admission Change from 2010 to 2014
2010 2011 2012 2013 2014 n %
Under 18 1,359 1,326 1,214 1,041 892 (318) -34%
18-19 3,243 3,014 3,169 2,910 2,528 (333) -22%
20-29 31,147 33,511 36,885 39,882 43,168 8,735 39%
30-39 22,602 23,277 24,853 27,052 29,843 4,450 32%
40-49 26,534 26,211 25,111 23,945 23,228 (2,589) -12%
50-59 12,915 13,941 14,629 15,114 15,777 2,199 22%
60-69 2,045 2,349 2,721 3,035 3,209 990 57%
70-79 150 145 163 182 221 32 47%
80+ 9 13 11 9 9 - 0%
All Ages 100,004 103,787 108,756 113,170 118,875 13,166 19% Source: NYS OASAS Data Warehouse, Client Data System, extract of June 7, 2015.
Table H-3b: Treatment Admissions for Any Opioid by Region of Residence, 2010-2014
Region Year of Admission Change from 2010 to 2014
2010 2011 2012 2013 2014 n %
New York City 47,915 48,199 48,307 47,292 47,783 (132) 0%
Long Island 12,887 13,906 14,999 15,518 16,681 3,794 29%
Upstate 39,202 41,682 45,450 50,360 54,411 15,209 39%
Capital Region 5,418 5,119 5,387 6,194 6,762 1,344 25%
Central NY 4,093 4,668 5,402 6,333 7,070 2,977 73%
Finger Lakes 4,861 5,461 5,692 6,834 7,583 2,722 56%
Mid-Hudson 10,232 10,911 11,732 12,485 12,317 2,085 20%
Mohawk Valley 1,978 2,192 2,489 2,796 3,218 1,240 63%
North Country 2,323 2,726 2,918 3,046 3,307 984 42%
Southern Tier 2,618 2,865 3,368 3,660 4,000 1,382 53%
Western NY 7,679 7,740 8,462 9,012 10,154 2,475 32%
All NYS Residents 100,004 103,787 108,756 113,170 118,875 18,871 19% Source: NYS OASAS Data Warehouse, Client Data System, extract of June 7, 2015.
Table H-3c: Treatment Admissions for Any Opioid by Program, 2010-2014
Region Year of Admission Change from 2010 to 2014
2010 2011 2012 2013 2014 n %
Crisis 36,456 37,894 38,385 38,869 42,398 5,942 16%
Inpatient 14,015 14,708 15,730 16,975 17,745 3,730 27%
Residential 6,810 7,815 7,909 8,379 8,340 1,530 22%
Outpatient 31,252 32,262 34,752 37,012 38,854 7,602 24%
Opioid Treatment Program 11,471 11,108 11,980 11,935 11,538 67 1%
All Program Categories 100,004 103,787 108,756 113,170 118,875 18,871 19% Source: NYS OASAS Data Warehouse, Client Data System, extract of June 7, 2015.
Table H-3d: Unique Individuals’ Treatment Admissions for Any Opioid, All Programs, 2010-2014
Region Year of Admission Change from 2010 to 2014
2010 2011 2012 2013 2014 n %
Total Any Opioid Admissions 100,004 103,787 108,756 113,170 118,875 18,871 19%
People Admitted for Any Opioids 54,905 56,638 59,311 60,746 62,466 7,561 12%
Duplicate Admissions 45,099 47,149 49,445 52,424 56,409 11,310 20%
Any Opioid Admissions per Person 1.82 1.83 1.83 1.86 1.90 Source: NYS OASAS Data Warehouse, Client Data System, extract of June 7, 2015.

50
Appendix I - Online Resources
Community Overdose Prevention Programs
Directory of community overdose prevention programs and an interactive map showing their locations: http://www.health.ny.gov/overdose
Program registration form: http://www.health.ny.gov/overdose
Community overdose prevention training calendar: http://www.health.ny.gov/diseases/aids/general/opioid_overdose_prevention/training_calendar.htm
Syringe Access, including locations and hours of operation of providers: http://www.health.ny.gov/diseases/aids/consumers/prevention/needles_syringes/index.htm
ESAP pharmacy, providers, and health care facility directory: http://www.health.ny.gov/diseases/aids/consumers/prevention/needles_syringes/index.htm
Emergency Medical Services Basic Life Support
Naloxone protocol: http://www.cnyems.org/documents/listings/narcan%20memo%20and%20policy%20statement%202013.pdf
Web-based BLS naloxone training: http://youtu.be/Q4HVeYqHSLk
Treatment and Prevention
Combat Heroin website: http://combatheroin.ny.gov/
New York State Office of Alcoholism and Substance Abuse Services Addiction Treatment Centers’ Calendar of Heroin and Opioid Overdose Prevention Training Sessions: http://www.oasas.ny.gov/atc/ATCherointraining.cfm
Prescription Drug Awareness
Bureau of Narcotics Enforcement website: Prescription Drug Abuse Awareness http://www.health.ny.gov/professionals/narcotic/prescription_drug_abuse_awareness/
Office of Alcohol and Substance Abuse Services website: http://www.oasas.ny.gov/StopRxMisuse/index.cfm

51
Figure I: Prescription Drug Misuse Brochure
Source: NYS OASAS, May 2013. www.oasas.ny.gov/publications/pdf/SafeMedNY-1087.pdf