new york physician supply and demand through 2030 ... · new york physician supply and demand...
TRANSCRIPT

New York Physician Supply and Demand through 2030
Executive Summary
The Center for Health Workforce Studies School of Public Health, University at Albany State University of New York 1 University Place, Suite 220 Rensselaer, NY 12144 Phone: (518) 402-0250 Web: http://chws.albany.edu Email: [email protected]

New York Physician Supply and Demand Through 2030 ii

New York Physician Supply and Demand Through 2030 iii
Preface This report presents an analysis of the current physician workforce and forecasts of the future physician workforce in New York. It provides forecasts of the supply of and demand for physicians throughout the state by specialty through 2030. This report was prepared for and with funding from the New York State Department of Health. This report is intended to provide useful information for policy makers, educators, and other interested parties. This report was prepared by the Center for Health Workforce Studies at the School of Public Health, University at Albany, State University of New York. The Center is dedicated to the collection, analysis, and distribution of health workforce data to assist health, professional and educational organizations, policy makers, and the public understand issues related to the supply, demand, distribution, and use of health workers. This report was prepared by Gaetano J. Forte and David P. Armstrong. The views expressed in this report are those of the Center for Health Workforce Studies and do not necessarily represent positions or policies of the School of Public Health, University at Albany, State University of New York, or the New York State Department of Health. March 2009

New York Physician Supply and Demand Through 2030 iv

New York Physician Supply and Demand Through 2030 1
Executive Summary Introduction An adequate supply and distribution of physicians is an essential component of an effective health care system. While there is no simple ratio to determine how many physicians a nation, state, or region should have, it is possible to evaluate the adequacy of physician supply of a particular geographic area by applying supply and demand models that inform physician workforce decisions. Due to the length of time and great expense required for physician education and training, it is prudent to anticipate likely physician supply and demand imbalances well in advance of their potential occurrence. To that end, the Center for Health Workforce Studies has conducted an assessment of the future supply and demand for physicians in New York through 2030. The goal of the assessment is to identify future physician supply and demand imbalances and suggest strategies for reconciling those imbalances. This report highlights the main findings of the Center’s physician supply and demand forecasts. Background National Perspective In January 2005, the federal Council on Graduate Medical Education (COGME) released its sixteenth report, Physician Workforce Policy Guidelines for the United States, 2000 – 2020. The report detailed forecasts of national physician supply and demand that indicated a substantial shortage of physicians by 2020. The magnitude of the shortage was estimated at 85,000 to 96,000 physicians, or between 7.5 and 8.5 percent of the likely number of physicians required to provide services for the nation’s population in 2020. One of the failings of federal COGME’s report, however, was its lack of attention to regional and specialty-specific variations embedded in its forecasts. Consequently, concerned stakeholders in a number of states conducted studies to determine how the projected national physician shortage would play out in their areas. Efforts to forecast physician supply/demand gaps were undertaken in Wisconsin, Kentucky, Arizona, California, Colorado, Oregon, Michigan, New Jersey, North Carolina, Mississippi, Texas, and Massachusetts. Further, in the past several years, specialty-specific studies in cardiology, endocrinology, allergy and immunology, psychiatry, neurosurgery, pediatric subspecialties, dermatology, medical genetics, radiology, geriatric medicine, and critical care have also yielded findings of current or future shortages of physicians. New York Perspective With more than a dozen medical schools and over 15,000 residents and fellows, New York has made a considerable investment in training new physicians. The New York State Council on Graduate Medical Education was asked by Health Commissioner Richard Daines to consider issues related to the state’s GME system and asked for recommendations on GME improvements and reforms. In response to this request, the Council deliberated and released a report1 in 2008 with recommendations about strengthening GME policy in the state. The report focused on several themes, including transparency and accountability in GME funding, improving the quality of training, promoting diversity in medicine, and recognition of the role of GME as an important source of new physicians in the state. The report presented a number of policy 1 New York State Council on Graduate Medical Education. Policy Recommendations to the Commissioner of Health. March 2008. http://www.health.state.ny.us/nysdoh/gme/reports/docs/policy_recommendations.pdf.

New York Physician Supply and Demand Through 2030 2
recommendations, including enhancing strategies to attract physicians to underserved communities, and supporting efforts to collect data that provide regular, periodic information about and analysis of physician supply in relation to demand for them. Some of these policy recommendations resulted in the establishment of new programs and policies designed to address physician maldistribution and shortages. One of these programs, a loan repayment and practice support initiative, Doctors Across New York, was implemented in 2008 to encourage physician recruitment and retention in underserved areas.
The COGME report acknowledged the work of the Center for Health Workforce Studies at the School of Public Health, University at Albany. The Center has monitored the physician workforce in New York for more than a decade.
• Since 1996, the Center has managed the New York Physician Licensure Re-registration Survey. Data drawn from this ongoing survey have become an important source of information on active physicians in the state.
• Beginning in 1998, the Center has conducted an annual survey of residents and fellows completing graduate medical training in New York. These data are used to monitor changes in the relative demand for various medical specialties.
Together, these research projects provide a critical base of information to understand supply and distribution of physicians in the state. In fact, findings from both of these sources were used in the analyses described in this report. Key Findings 1. Between 2006 and 2030, growth in the demand for physicians in New York will likely outpace growth in the supply of physicians. Using forecasting models adapted to include data specific to New York, the Center developed a variety of supply and demand scenarios to estimate the potential impact of a number of factors, including changes in the retention of physicians trained in the state, the implementation of universal health insurance, and efforts to make the delivery of health care more efficient. Based on these forecasting models, the Center concluded that between 2006 and 2030, growth in the demand for physicians in New York would likely outpace growth in the supply of physicians. The forecasts suggested that New York was likely to face a physician shortage in 2030, and, in the case of areas and populations already experiencing shortages, the intensification of current shortages. The magnitude of forecast difference between supply and demand growth was between 2,500 and 17,000 physicians, or between 3 and 15 percent of the number of physicians required to meet the anticipated demand for physician services in 2030. 2. The number of physicians practicing in New York continues to grow. The number of physicians in New York was forecast to grow as long as the state continues to retain the physicians who train in the state at the rate it currently does. If the retention of physicians trained in the state were to decline below current levels, the overall number of

New York Physician Supply and Demand Through 2030 3
physicians in the state could begin to decline within a decade or sooner.2 However, the supply forecasts differed across specialties. A number of specialties were projected to experience growth over the entire forecast period: anesthesiology, cardiovascular disease, emergency medicine, general pediatrics, general surgery, orthopedic surgery, radiology, and other internal medicine subspecialties. A number of specialties were projected to experience a period of growth, then decline from about 2020 to the end of the forecast period: general internal medicine, general/family medicine, obstetrics and gynecology, and otolaryngology. Finally, and most immediately problematic, there were a number of specialties projected to experience decline throughout the forecast period: ophthalmology, pathology, psychiatry, urology, and other surgical specialties. 3. Demand for physicians practicing in New York continues to grow. The number of physicians required to meet the demand for their services in New York was forecast to continue to grow from 2006 to 2030. Even after factoring in potential modest gains in the efficiency of the health care delivery system, demand for physicians in the state was projected to grow. Physician demand was not forecast to grow at the same rate across all specialties, however. In most specialties, demand was forecast to grow through 2030. The fastest growth in demand was forecast in cardiovascular diseases (1.0 percent annually), ophthalmology (0.9 percent annually), and urology (0.9 percent annually). Slower growth was forecast for emergency medicine (0.3 percent annually), psychiatry (0.4 percent annually), and general/family medicine (0.4 percent annually). No growth was forecast for obstetrics and gynecology and general pediatrics. These forecast rates of physician demand growth were increased in scenarios simulating the implementation of universal health insurance and a growing economy. 4. The forecast growth in demand for physicians was not evenly distributed across all parts of the state. Based on forecast changes in the size and composition of the population, most regions of the state were forecast to experience growth in demand for physicians. The exceptions were Central New York and Mohawk Valley, which were projected to experience no significant change in physician demand during the forecast period, and Western New York, which was projected to experience a decline in physician demand. New York City was forecast to experience the greatest growth in physician demand. 5. The greatest gaps between supply and demand growth were projected in specialties that were forecast to lose physicians. Since demand was forecast to grow in almost all specialties, the greatest gaps between supply and demand growth were projected in those specialties that were forecast to lose physicians:
2 In its most recent annual reports on physicians completing graduate medical training in New York, the Center has observed that a smaller percentage of new physicians are remaining in New York to practice. Moreover, the Center has also observed a slight downward trend in the percentage of physicians with practice addresses in New York among all active physicians licensed to practice medicine in the state. Should these newly observed trends continue, the decline in physicians may begin sooner than predicted in supply scenario 3b.

New York Physician Supply and Demand Through 2030 4
ophthalmology, urology, psychiatry, pathology, some surgical subspecialties. Large gaps between supply and demand growth were also projected in those specialties that were forecast to experience a period of growth, then a period of decline: general internal medicine, general/family medicine, and otolaryngology. Smaller gaps were projected in some of the specialties that were forecast to grow throughout the period as well: anesthesiology and orthopedic surgery. For other specialties that were projected to grow throughout the period, no gaps were forecast: radiology and general surgery. Finally, in a number of specialties, supply was projected to grow more quickly than demand: cardiovascular diseases, emergency medicine, general pediatrics, and some internal medicine subspecialties. 6. The greatest gaps between supply and demand growth were forecast in regions where demand was forecast to grow most rapidly. Similarly, with regard to regional supply and demand gaps, the greatest gaps were projected in regions where demand was forecast to grow most rapidly. New York City and the Hudson Valley, in particular, were forecast to experience the greatest gap between physician supply and demand in 2030. In those regions, the gaps between physician supply and demand approached 10 percent, with some specialties (e.g., urology, pathology, and ophthalmology) forecast to experience gaps greater than 33 percent, and adult primary care physician supply and demand gaps of greater than 12 percent. On the other hand, while no region of the state was immune to physician supply and demand gaps, physician supply growth was forecast to more closely parallel physician demand growth in the Capital District and the Finger Lakes regions. 7. Current shortages of physicians are likely to grow worse over time. It should be noted that the forecast gaps between supply growth and demand growth detailed in this report ignore existing physician shortages. With 107 designated primary care health professional shortages areas, there are areas of the state and populations that are already underserved by the current physician supply. The implications of the forecasts for these areas and populations are dire. Areas and populations that are already underserved will continue to suffer and are likely to experience even greater physician shortages in the future than they do now. Moreover, efforts to expand access to physician services by implementing universal health insurance programs will exacerbate these forecast physician supply and demand gaps. Efforts to expand and strengthen the health safety net need to take into account physician workforce issues and the forecast shortages presented in this report. Successful reform will entail addressing both the expansion of access to health insurance and the expansion of physician services in the state.

New York Physician Supply and Demand Through 2030 5
Forecasting Physician Supply and Demand through 2030 in New York There are many factors to be considered when forecasting physician supply and demand in a particular area. These include (but are not limited to) the size and characteristics of the current physician supply and of new physicians entering the workforce; how physician services are utilized in terms of the characteristics of patients, the location where the services are provided, and who provides them; and the characteristics of the population in the particular area. Also important are potential medical advances, physician practice and migration patterns, public and private health care cost-containment efforts, changes in the health care delivery system and health insurance coverage, and a host of other related factors. Characteristics of Physicians in New York in 2006 and Recent Trends in Supply and Distribution In 2006, there were 79,451 licensed physicians in New York. Seventy-nine percent (62,770) were active patient care physicians. Of the active patient care physicians, 72 percent practiced in downstate New York3 and 91 percent practiced in urban counties. Physician Distribution Physicians in New York were not distributed evenly in 2006. The ratio of physicians to the population was highest in the New York City region, with 387 active patient care physicians per 100,000 population. The ratio was lowest in the Mohawk Valley, with 165 physicians per 100,000 population. Despite overall growth statewide in the physician supply between 2002 and 2006, two regions experienced declines in the number of active patient care physicians per 100,000 population. The Mohawk Valley and Western New York regions experienced physician declines of 4 percent and 1 percent, respectively, between 2002 and 2006. Several regions experienced very little growth in the physician supply between 2002 and 2006. The Capital District, Central New York, Finger Lakes, and Southern Tier regions experienced physician per 100,000 population growth of 3 percent or less. More than 19,000 physicians (30 percent of the total) reported one of the primary care specialties (family medicine, general internal medicine, and general pediatrics) as their principal specialty. Between 2002 and 2006, the number of primary care physicians per 100,000 population grew in all regions of the state except Central New York, Mohawk Valley, North Country, and Western New York. The decline in primary care physician supply in these regions ranged from less than 1 percent in Mohawk Valley to 5 percent in North Country. The number of non-primary care physicians per 100,000 population grew in all regions of the state except in the Capital District, Mohawk Valley, and Western New York regions. Declines in the number of non-primary care physicians per 100,000 population in these areas ranged from 1 percent in Western New York to 7 percent in the Mohawk Valley.
3 Downstate New York includes the following counties: Bronx, Kings, Nassau, New York, Queens, Richmond, Suffolk, and Westchester.

New York Physician Supply and Demand Through 2030 6
Figure 1 Physician Supply and Distribution in New York, 2006
Number of Active Patient Care Physicians per 100,000 Population by Region
Specialty Capital District
Central New York
Finger Lakes
Hudson Valley
Long Island
Mohawk Valley
New York City
North Country
Southern Tier
Western New York
New York
(Total) Primary Care 84 72 91 98 100 66 114 65 82 77 99 Non-Primary Care 170 179 172 217 248 99 273 116 153 158 226
Obstetrics/Gynecology 13 15 14 17 18 7 21 12 13 12 18 Internal Medicine Specialties 35 32 31 35 55 15 56 13 26 27 45
General Surgery 7 8 7 8 9 6 9 8 9 8 8 Surgical Subspecialties 32 37 27 36 41 18 40 21 31 31 36
Facility Based 30 35 34 36 49 22 43 22 33 30 39 Psychiatry 19 17 19 43 25 15 46 14 17 13 33 Other Specialties 34 35 40 42 51 16 58 26 24 37 47
Total 254 251 263 315 348 165 387 181 235 235 325
Physician Demographics Active patient care physicians in New York were predominantly male (70 percent) in 2006. However, women physicians were significantly younger than men, reflecting the growing number of women entering the profession. The average age of women in the physician workforce was 47.1 years compared to 52.8 years for men. Seventy percent of active patient care physicians in New York were non-Hispanic Whites. Underrepresented minorities (URMs) (Blacks/African Americans, Hispanics/Latinos, and American Indians) made up 10 percent of the physician workforce in 2006. At the same time, URMs made up approximately 35 percent of New York’s population. Physician Training and Certification Thirty-eight percent of active patient care physicians in New York were graduates of medical schools located in New York. Thirty-six percent of active patient care physicians were international medical graduates (IMGs), that is, they attended medical school outside the United States or Canada. There were significant variations in the percentage of IMGs by specialty. For instance, 52 percent of pathologists reported being IMGs while less than 10 percent of dermatologists were IMGs. In terms of graduate medical training, more than 75 percent of the active patient care physicians practicing in New York had completed residency or fellowship training in the state. Eighty percent of physicians were certified by the nationally recognized American Board of Medical Specialties in their principal specialty. This figure varied significantly across specialties, from 60 percent in occupational medicine to 90 percent in pathology. Practice Characteristics The most common principal specialty among active patient care physicians was general internal medicine. More than 9,800 (nearly 16 percent of all active patient care physicians) practiced general internal medicine as their principal specialty. This was followed by adult psychiatry (9 percent), general pediatrics (8 percent), and family medicine (7 percent).

New York Physician Supply and Demand Through 2030 7
Group practice was the largest principal practice setting in 2006, with 37 percent of physicians in New York. Solo practice (28 percent) and hospital practice (27 percent) were the next most frequent practice settings. Demographic Trends in New York The most recently released population forecasts4 suggested that the U.S. will experience a 25 percent increase in population between 2006 and 2030. This forecast amounted to a 0.93 percent average annual growth rate. By contrast, New York was forecast to grow much more slowly from 19.3 million to just over 20 million (3.8 percent) over the same time period. This forecast amounted to a 0.16 percent average annual growth rate – one of the slowest rates in the nation. Moreover, because of this very slow growth rate, New York was forecast make up a smaller portion of the total U.S. population in 2030 than it did in 2006. Figure 2 Anticipated Population Change in New York, 2006-2030
Total Population
Region 2006 2010 2015 2020 2025 2030
% Change 2006 to
2030 Avg Annual
% Change Capital District 1,063,621 1,063,173 1,062,733 1,059,133 1,050,684 1,036,696 -2.5% -0.11%
Central New York 716,032 706,963 696,152 683,492 668,202 650,046 -9.2% -0.40% Finger Lakes 1,205,419 1,206,018 1,207,086 1,205,606 1,199,061 1,186,249 -1.6% -0.07%
Hudson Valley 2,281,845 2,309,665 2,344,431 2,377,124 2,401,883 2,415,524 5.9% 0.24% Long Island 2,831,266 2,831,259 2,831,291 2,830,637 2,818,832 2,789,402 -1.5% -0.06%
Mohawk Valley 507,194 502,322 496,150 488,802 479,942 468,912 -7.5% -0.33% New York City 8,119,187 8,289,458 8,507,739 8,720,871 8,910,821 9,073,034 11.7% 0.46% North Country 425,633 429,820 435,774 440,406 444,288 447,345 5.1% 0.21% Southern Tier 719,143 715,303 711,041 704,192 695,422 684,532 -4.8% -0.21%
Western New York 1,420,166 1,399,137 1,372,619 1,344,494 1,313,277 1,277,106 -10.1% -0.44% Total 19,289,506 19,453,118 19,665,016 19,854,757 19,982,410 20,028,847 3.8% 0.16%
U.S. (in 1,000s) 298,755 310,233 325,540 341,387 357,452 373,504 25.0% 0.93% NY % of U.S. 6.5% 6.3% 6.0% 5.8% 5.6% 5.4%
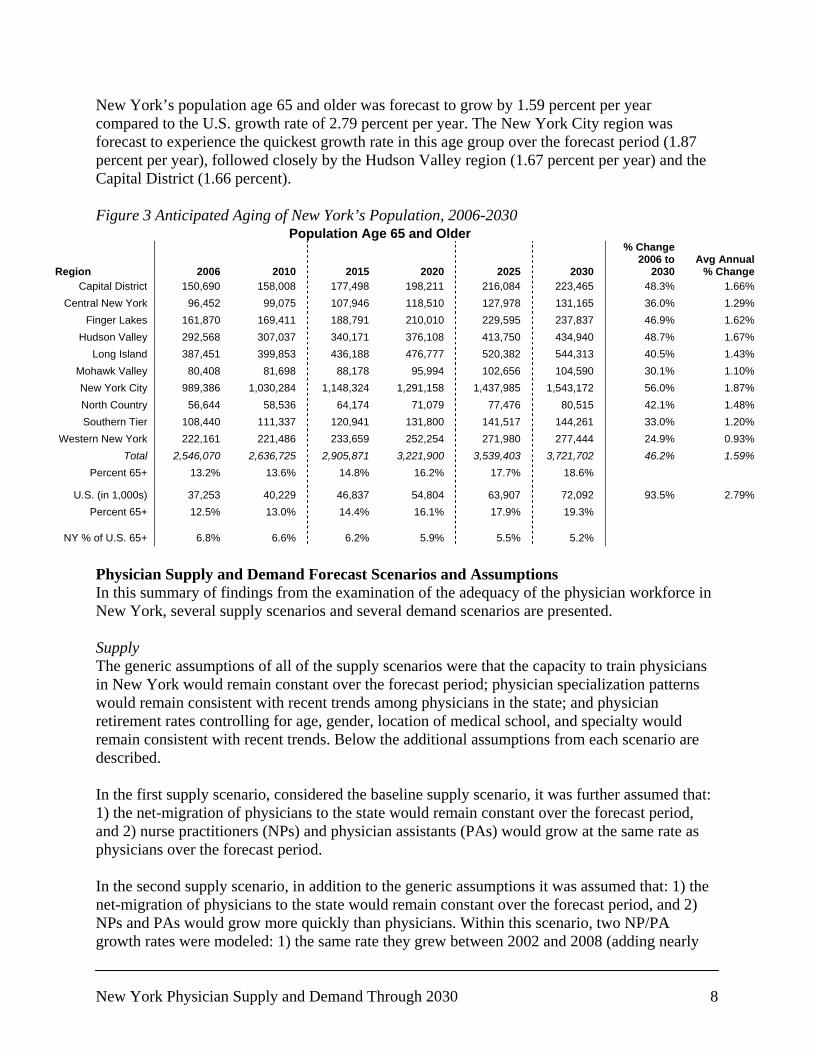
Forecast growth rates varied considerably across regions as well. The New York City region was forecast to grow at the quickest rate (0.46 percent per year) from 2006 to 2030. Only two other regions were forecast to grow between 2006 and 2030, the Hudson Valley region at 0.24 percent per year and the North Country region at 0.21 percent per year. The remaining regions were forecast to shrink between 2006 and 2030. The greatest decline in population was forecast for the Western New York region (0.44 percent per year, 10.1 percent over the forecast period), followed closely by the Central New York region (0.40 percent per year, 9.2 percent over the forecast period) and the Mohawk Valley region (0.33 percent per year, 7.5 percent over the forecast period). The differences across the regional population change rates had significant effects on the physician demand forecasts as well, especially for the primary care specialties. While the population age 65 and older in the U.S. was forecast to nearly double between 2006 and 2030, New York’s population was forecast to age at a slower rate. Between 2006 and 2030, 4 Population projection data were obtained from the Cornell Program on Applied Demographics in February 2008. http://pad.human.cornell.edu/che/BLCC/pad/data/projections02.cfm.
New York Physician Supply and Demand Through 2030 8
New York’s population age 65 and older was forecast to grow by 1.59 percent per year compared to the U.S. growth rate of 2.79 percent per year. The New York City region was forecast to experience the quickest growth rate in this age group over the forecast period (1.87 percent per year), followed closely by the Hudson Valley region (1.67 percent per year) and the Capital District (1.66 percent). Figure 3 Anticipated Aging of New York’s Population, 2006-2030
Population Age 65 and Older
Region 2006 2010 2015 2020 2025 2030
% Change 2006 to
2030 Avg Annual
% Change Capital District 150,690 158,008 177,498 198,211 216,084 223,465 48.3% 1.66%
Central New York 96,452 99,075 107,946 118,510 127,978 131,165 36.0% 1.29% Finger Lakes 161,870 169,411 188,791 210,010 229,595 237,837 46.9% 1.62%
Hudson Valley 292,568 307,037 340,171 376,108 413,750 434,940 48.7% 1.67% Long Island 387,451 399,853 436,188 476,777 520,382 544,313 40.5% 1.43%
Mohawk Valley 80,408 81,698 88,178 95,994 102,656 104,590 30.1% 1.10% New York City 989,386 1,030,284 1,148,324 1,291,158 1,437,985 1,543,172 56.0% 1.87% North Country 56,644 58,536 64,174 71,079 77,476 80,515 42.1% 1.48% Southern Tier 108,440 111,337 120,941 131,800 141,517 144,261 33.0% 1.20%
Western New York 222,161 221,486 233,659 252,254 271,980 277,444 24.9% 0.93% Total 2,546,070 2,636,725 2,905,871 3,221,900 3,539,403 3,721,702 46.2% 1.59%
Percent 65+ 13.2% 13.6% 14.8% 16.2% 17.7% 18.6%
U.S. (in 1,000s) 37,253 40,229 46,837 54,804 63,907 72,092 93.5% 2.79% Percent 65+ 12.5% 13.0% 14.4% 16.1% 17.9% 19.3%
NY % of U.S. 65+ 6.8% 6.6% 6.2% 5.9% 5.5% 5.2%
Physician Supply and Demand Forecast Scenarios and Assumptions In this summary of findings from the examination of the adequacy of the physician workforce in New York, several supply scenarios and several demand scenarios are presented. Supply The generic assumptions of all of the supply scenarios were that the capacity to train physicians in New York would remain constant over the forecast period; physician specialization patterns would remain consistent with recent trends among physicians in the state; and physician retirement rates controlling for age, gender, location of medical school, and specialty would remain consistent with recent trends. Below the additional assumptions from each scenario are described. In the first supply scenario, considered the baseline supply scenario, it was further assumed that: 1) the net-migration of physicians to the state would remain constant over the forecast period, and 2) nurse practitioners (NPs) and physician assistants (PAs) would grow at the same rate as physicians over the forecast period. In the second supply scenario, in addition to the generic assumptions it was assumed that: 1) the net-migration of physicians to the state would remain constant over the forecast period, and 2) NPs and PAs would grow more quickly than physicians. Within this scenario, two NP/PA growth rates were modeled: 1) the same rate they grew between 2002 and 2008 (adding nearly

New York Physician Supply and Demand Through 2030 9
1,000 new practitioners annually); and 2) half the rate they grew between 2002 and 2008 (adding about 500 new practitioners annually) over the forecast period. In the third supply scenario, in addition to the generic assumptions it was assumed that: 1) the net-migration of physicians to the state would change over the forecast period, and 2) NPs and PAs would grow at the same rate as physicians over the forecast period. Within this scenario, two net-migration alternatives were modeled. The first alternative was that the state will retain 100 additional physicians annually beginning in 2009. This alternative closely paralleled the goals of New York State Department of Health’s newly implemented Doctors Across New York program. The first alternative was further explored by modeling three potential specialty distributions for these additional 100 physicians: 1) 33 percent primary care/67 percent non-primary care, 2) 25 percent primary care/75 percent non-primary care, and 3) 20 percent primary care/80 percent non-primary care. Recently, the distribution for new physicians was approximately 27 percent primary care and 73 percent non-primary care. The second alternative was that the state would retain 100 fewer physicians annually beginning in 2009. This alternative portrayed the potential outcome of increased competition for physicians among states given the national physician shortage context. Demand The generic assumptions of all of the demand scenarios were that utilization rates of physician services by age, gender, insurance status, and rurality would remain constant over the forecast period; anticipated population change would follow the trends described in the previous section; and no significant changes would occur in the reimbursement of physician services. In the first demand scenario, considered the baseline demand scenario, it was further assumed that: 1) the long term economic health of the state would remain stable over the forecast period; 2) there would be no significant changes in the level of insurance coverage in the state; and 3) there would be no significant improvement in the identification or reduction of unnecessary/marginally-beneficial/duplicative services in the health care delivery system. In the second demand scenario, in addition to the generic assumptions it was assumed that: 1) there would be modest long term economic growth in the state of an additional 1 percent annually5 over the forecast period; 2) there would be no significant changes in the level of insurance coverage in the state; and 3) there would be no significant improvement in the identification or reduction of unnecessary/marginally-beneficial/duplicative services in the health care delivery system. In the third demand scenario, in addition to the generic assumptions it was assumed that: 1) the long term economic health of the state would remain stable over the forecast period; 2) there would be a constant increase in the proportion of the population that has health insurance, and by 2020, all residents of the state would have health insurance; and 3) there would be no significant
5 To put this assumption into perspective, between 2003 and 2007, New York experienced an average annual growth in real gross state product of 3.2 percent (10th highest in the country). Between 1998 and 2007, the average annual growth rate was 3.1 percent (9th highest in the country). The average annual growth of real gross domestic product in the U.S. during those time periods was 2.3 percent and 2.4 percent, respectively (Source: BEA data retrieved November 2008).
New York Physician Supply and Demand Through 2030 10
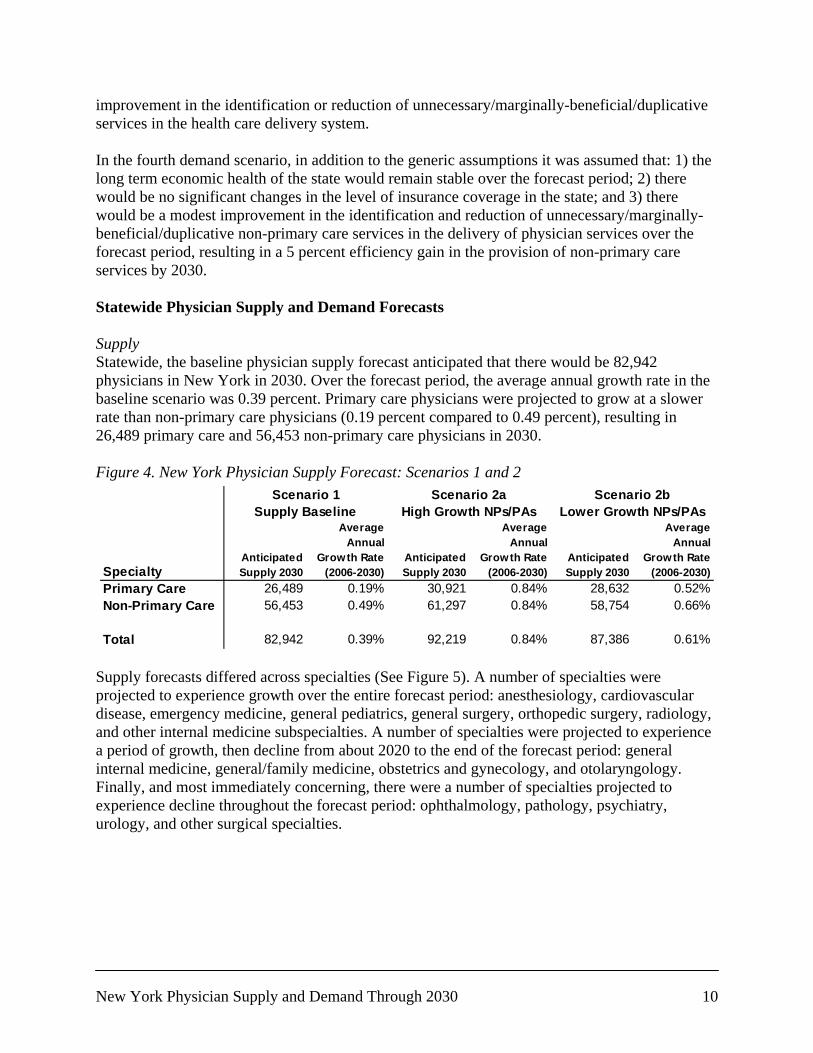
improvement in the identification or reduction of unnecessary/marginally-beneficial/duplicative services in the health care delivery system. In the fourth demand scenario, in addition to the generic assumptions it was assumed that: 1) the long term economic health of the state would remain stable over the forecast period; 2) there would be no significant changes in the level of insurance coverage in the state; and 3) there would be a modest improvement in the identification and reduction of unnecessary/marginally-beneficial/duplicative non-primary care services in the delivery of physician services over the forecast period, resulting in a 5 percent efficiency gain in the provision of non-primary care services by 2030. Statewide Physician Supply and Demand Forecasts Supply Statewide, the baseline physician supply forecast anticipated that there would be 82,942 physicians in New York in 2030. Over the forecast period, the average annual growth rate in the baseline scenario was 0.39 percent. Primary care physicians were projected to grow at a slower rate than non-primary care physicians (0.19 percent compared to 0.49 percent), resulting in 26,489 primary care and 56,453 non-primary care physicians in 2030. Figure 4. New York Physician Supply Forecast: Scenarios 1 and 2
Supply forecasts differed across specialties (See Figure 5). A number of specialties were projected to experience growth over the entire forecast period: anesthesiology, cardiovascular disease, emergency medicine, general pediatrics, general surgery, orthopedic surgery, radiology, and other internal medicine subspecialties. A number of specialties were projected to experience a period of growth, then decline from about 2020 to the end of the forecast period: general internal medicine, general/family medicine, obstetrics and gynecology, and otolaryngology. Finally, and most immediately concerning, there were a number of specialties projected to experience decline throughout the forecast period: ophthalmology, pathology, psychiatry, urology, and other surgical specialties.
SpecialtyAnticipated Supply 2030
Average Annual
Growth Rate (2006-2030)
Anticipated Supply 2030
Average Annual
Growth Rate (2006-2030)
Anticipated Supply 2030
Average Annual
Growth Rate (2006-2030)
Primary Care 26,489 0.19% 30,921 0.84% 28,632 0.52%Non-Primary Care 56,453 0.49% 61,297 0.84% 58,754 0.66%
Total 82,942 0.39% 92,219 0.84% 87,386 0.61%
High Growth NPs/PAsSupply Baseline Lower Growth NPs/PAsScenario 1 Scenario 2a Scenario 2b

New York Physician Supply and Demand Through 2030 11
Figure 5. New York Physician Specialty Supply Forecast Assuming that the growth of NPs and PAs would remain constant at its current level, supply scenario 2a anticipated that, effectively6, there would be 92,219 physicians in New York in 2030. Over the forecast period, the average annual growth rate in scenario 2a was 0.84 percent. Both primary care and non-primary care physicians were forecast to grow at an annual rate of 0.84 percent as well, resulting in the equivalent of 30,219 primary care physicians and 61,297 non-primary care physicians in 2030. Because it is not clear that NPs and PAs will continue to grow at as aggressive a rate as they have over the past decade, supply scenario 2b was developed assuming that NPs and PAs would grow at half that rate over the course of the forecast period. Under this assumption, there would
6 The additional physicians forecast in this scenario are actually NPs and PAs translated into physician equivalents. Assuming recent growth rates, the number of NPs and PAs is forecast to more than double between 2006 and 2030, growing at an average annual rate of 3.3 percent. Since the baseline physician scenario assumes growth rates of NPs and PAs that are equal to physicians, this scenario generates additional NPs and PAs. The additional NPs and PAs are then converted into equivalent physicians using a productivity multiplier (0.70 for primary care practitioners and 0.33 for non-primary care practitioners).
Specialty Supply 2006Anticipated Supply 2030
Percent Change
(2006-2030)
Average Annual
Growth Rate (2006-2030)
Anesthesiology 3,695 4,085 11% 0.42%Cardiovascular Diseases 2,335 3,059 31% 1.13%Emergency Medicine 2,712 4,265 57% 1.90%General Internal Medicine 14,242 14,810 4% 0.16%General Pediatrics 5,939 6,631 12% 0.46%General Surgery 2,683 3,146 17% 0.67%General/Family Medicine 5,108 5,048 -1% -0.05%Obstetrics and Gynecology 3,832 4,027 5% 0.21%Ophthalmology 1,974 1,601 -19% -0.87%Orthopedic Surgery 1,931 2,132 10% 0.41%Other Internal Medicine Subspecialties 8,974 12,889 44% 1.52%Other Specialties 7,470 7,750 4% 0.15%Other Surgical Specialties 1,399 1,215 -13% -0.59%Otolaryngology 828 778 -6% -0.26%Pathology 1,716 1,286 -25% -1.19%Psychiatry 6,166 5,238 -15% -0.68%Radiology 3,548 4,221 19% 0.73%Urology 937 761 -19% -0.86%
Primary Care 25,289 26,489 5% 0.19%Non-Primary Care 50,200 56,453 12% 0.49%
Total 75,489 82,942 10% 0.39%
Scenario 1Supply Baseline

New York Physician Supply and Demand Through 2030 12
be the equivalent of 87,386 physicians in New York in 2030. Over the forecast period, the average annual growth rate in scenario 2b was 0.61 percent. Primary care physicians were projected to grow at a slower rate than non-primary care physicians (0.52 percent compared to 0.66 percent), resulting in the equivalent of 28,632 primary care and 58,754 non-primary care physicians in 2030. Relaxing the generic assumptions once again and adding an additional 100 physicians annually to the supply in the state, supply scenario 3a projected there would be 84,942 physicians in New York in 2030. Over the forecast period, the average annual growth rate in scenario 3a was 0.49 percent. For the primary care and non-primary supply forecasts, several alternative distributions of the additional 100 physicians were modeled (see Figure 6): 1) 33 percent primary care/67 percent non-primary care; 2) 25 percent primary care/75 percent non-primary care; 3) 20 percent primary care/80 percent non-primary care7. For primary care physicians, the alternatives suggested a range of between 26,889 and 27,155 physicians in New York in 2030, with an average annual growth rate of between 0.26 and 0.30 percent. For non-primary care physicians, the alternatives suggested a range of between 57,787 and 58,053 physicians in 2030, with an average annual growth rate of between 0.59 and 0.61 percent. Figure 6. New York Physician Supply Forecast: Scenario 3a
Supply scenario 3a demonstrated what a physician recruitment/retention program like Doctors Across New York might be able to accomplish in the state. On the other hand, increased competition from other states facing a national physician shortage environment is certainly likely, so understanding how retaining fewer physicians would impact the state’s future physician supply is important. Supply scenario 3b assumed that the state would add 100 fewer physicians annually to the supply in the state. This scenario suggested that there would be 80,942 physicians in New York in 2030. Over the forecast period, the average annual growth rate in scenario 3b was 0.29 percent. Again, for the primary care and non-primary supply forecasts, several alternative distributions of the 100 physicians were modeled (see Figure 7): 1) 33 percent primary care/67 percent non-primary care; 2) 25 percent primary care/75 percent non-primary care; and 3) 20 percent primary care/80 percent non-primary care. For primary care physicians, the alternatives suggested a range of between 25,823 and 26,089 physicians in New York in 2030, with an average annual growth rate of between 0.09 and 0.13 percent. For non-primary
7 In the recent past, the distribution of new physicians added to the New York physician supply has been 26 percent primary care and 74 percent non-primary care.
SpecialtyAnticipated Supply 2030
Average Annual
Growth Rate (2006-2030)
Anticipated Supply 2030
Average Annual
Growth Rate (2006-2030)
Anticipated Supply 2030
Average Annual
Growth Rate (2006-2030)
Primary Care 27,155 0.30% 26,989 0.27% 26,889 0.26%Non-Primary Care 57,787 0.59% 57,953 0.60% 58,053 0.61%
Total 84,942 0.49% 84,942 0.49% 84,942 0.49%
Scenario 3a - Increase in Physician Retention33% Primary Care /
67% Non-Primary Care25% Primary Care /
75% Non-Primary Care20% Primary Care /
80% Non-Primary Care

New York Physician Supply and Demand Through 2030 13
care physicians, the alternatives suggested a range of between 54,853 and 55,119 physicians in 2030, with an average annual growth rate of between 0.37 and 0.39 percent. Figure 7. New York Physician Supply Forecast: Scenario 3b
Demand Statewide, the baseline physician demand forecast anticipated that demand for physicians would grow to 86,589 physicians in New York in 2030. Over the forecast period, the average annual growth rate in the baseline scenario was 0.57 percent. Demand for primary care physicians was projected to grow at a slightly slower rate than demand for non-primary care physicians (0.52 percent compared to 0.60 percent), resulting in demand for 28,640 primary care and 57,949 non-primary care physicians in 2030. Figure 8. New York Physician Demand Forecast: Scenarios 1 and 2
Physician demand was not forecast to grow at the same rate across all specialties (see Figure 9). In most specialties, demand was projected to grow through 2030. The fastest growth was forecast in cardiovascular diseases (1.0 percent annually), ophthalmology (0.9 percent annually), and urology (0.9 percent annually). Slower growth was projected for emergency medicine (0.3 percent annually), psychiatry (0.4 percent annually), and general/family medicine (0.4 percent annually). Overall, negligible change in demand was projected for obstetrics and gynecology and general pediatrics. In the case of obstetrics and gynecology, demand was projected to grow at a very slow rate at the beginning of the forecast period, and then decline very slowly from 2020 through 2030. For pediatrics, demand was projected to decline through 2015, and then slowly increase through 2030.
SpecialtyAnticipated Supply 2030
Average Annual
Growth Rate (2006-2030)
Anticipated Supply 2030
Average Annual
Growth Rate (2006-2030)
Anticipated Supply 2030
Average Annual
Growth Rate (2006-2030)
Primary Care 25,823 0.09% 25,989 0.11% 26,089 0.13%Non-Primary Care 55,119 0.39% 54,953 0.38% 54,853 0.37%
Total 80,942 0.29% 80,942 0.29% 80,942 0.29%
Scenario 3b - Decrease in Physician Retention33% Primary Care /
67% Non-Primary Care25% Primary Care /
75% Non-Primary Care20% Primary Care /
80% Non-Primary Care
SpecialtyAnticipated
Demand 2030
AverageAnnual
Growth Rate(2006-2030)
AnticipatedDemand 2030
AverageAnnual
Growth Rate(2006-2030)
Primary Care 28,640 0.52% 30,752 0.82%Non-Primary Care 57,949 0.60% 67,034 1.21%
Total 86,589 0.57% 97,786 1.08%
Demand Baseline Growing EconomyScenario 2Scenario 1

New York Physician Supply and Demand Through 2030 14
Figure 9. New York Physician Specialty Demand Forecast Anticipating an additional 1 percent annual growth in real gross state product, demand scenario 2 forecast that the demand for physicians would grow to 97,786 physicians in 2030. Over the forecast period, the average annual growth rate in demand scenario 2 was 1.08 percent. Since demand for non-primary care physicians was more sensitive to economic fluctuations than for demand for primary care physicians, in this scenario, demand for non-primary care physicians was forecast to grow at a significantly higher rate than demand for primary care physicians (1.21 percent compared to 0.82 percent), yielding a demand for 67,034 non-primary care physicians and 30,752 primary care physicians in 2030. Demand scenario 3 modeled the implications of providing health insurance to the uninsured on demand for physicians. This scenario projected that the demand for physicians would grow to 90,805 physicians in 2030. Over the forecast period, the average annual growth rate in demand scenario 3 was 0.77 percent. Demand for primary care physicians was forecast to grow at a slightly slower rate than demand for non-primary care physicians (0.74 percent compared to 0.77 percent), resulting in a demand for 30,161 primary care physicians and 60,644 non-primary care physicians in 2030.
Specialty Demand 2006Anticipated
Demand 2030
Percent Change
(2006-2030)
Average Annual
Growth Rate (2006-2030)
Anesthesiology 3,695 4,384 19% 0.71%Cardiovascular Diseases 2,335 2,968 27% 1.00%Emergency Medicine 2,712 2,880 6% 0.25%General Internal Medicine 14,242 17,096 20% 0.76%General Pediatrics 5,939 5,901 -1% -0.03%General Surgery 2,683 3,148 17% 0.67%General/Family Medicine 5,108 5,643 10% 0.42%Obstetrics and Gynecology 3,832 3,865 1% 0.04%Ophthalmology 1,974 2,427 23% 0.86%Orthopedic Surgery 1,931 2,247 16% 0.63%Other Internal Medicine Subspecialties 8,974 10,783 20% 0.77%Other Specialties 7,470 8,611 15% 0.59%Other Surgical Specialties 1,399 1,655 18% 0.70%Otolaryngology 828 920 11% 0.44%Pathology 1,716 1,953 14% 0.54%Psychiatry 6,166 6,758 10% 0.38%Radiology 3,548 4,203 18% 0.71%Urology 937 1,147 22% 0.85%
Primary Care 25,289 28,640 13% 0.52%Non-Primary Care 50,200 57,949 15% 0.60%
Total 75,489 86,589 15% 0.57%
Scenario 1Demand Baseline

New York Physician Supply and Demand Through 2030 15
Figure 10. New York Physician Demand Forecast: Scenarios 3 and 4
In order to show how efforts to identify and eliminate unnecessary/marginally-beneficial/duplicative non-primary care services might affect the demand for physician services, demand scenario 4 forecast that the demand for physicians would grow to 83,692 physicians in 2030. Over the forecast period, the average annual growth rate in demand scenario 4 was 0.43 percent. Demand for primary care physicians was projected to grow at a slightly faster rate than demand for non-primary care physicians (0.52 percent compared to 0.39 percent), resulting in demand for 28,640 primary care and 55,692 non-primary care physicians in 2030. New York Physician Supply and Demand Forecast Implications There are a number of important implications of the physician supply and demand forecasts presented above. First, while New York will continue to have a substantial supply of physicians over the foreseeable future, it likely will not escape the physician shortages that the nation will experience over the next 25 years. Demand for physicians is likely to continue to grow at a faster rate than the supply of physicians between now and 2030, leading to a shortage of physicians of between 2,500 to as many as 17,000 in 2030, or between 3 percent and 15 percent of the physicians required to meet anticipated demand. The magnitude of the shortage will depend on a number of factors, including the growth of non-physician clinicians, efforts to implement universal insurance, the long-term health of the economy, and efforts to reform the health care delivery system. Since demand was projected to grow in almost all specialties, the greatest gaps between supply and demand growth were forecast in those specialties that were losing physicians: ophthalmology, urology, psychiatry, pathology, some surgical subspecialties. Large gaps between supply and demand growth were also predicted in those specialties that were forecast to experience a period of growth, then a period of decline: general internal medicine, general/family medicine, and otolaryngology. Smaller gaps were projected in some of the specialties that were forecast to grow throughout the period as well: anesthesiology and orthopedic surgery. For other specialties that were forecast to grow throughout the period, no gaps were anticipated: radiology, general surgery. Finally, in a number of specialties, supply was forecast to grow more quickly than demand: cardiovascular diseases, emergency medicine, general pediatrics, and some internal medicine subspecialties.
SpecialtyAnticipated
Demand 2030
AverageAnnual
Growth Rate(2006-2030)
AnticipatedDemand 2030
AverageAnnual
Growth Rate(2006-2030)
Primary Care 30,161 0.74% 28,640 0.52%Non-Primary Care 60,644 0.79% 55,052 0.39%
Total 90,805 0.77% 83,692 0.43%
Universal Health Insuranceby 2020
Scenario 3 Scenario 4Partial Elimination of Unnecessary/
Marginally-Beneficial Services

New York Physician Supply and Demand Through 2030 16
Figure 11. New York Physician Supply and Demand Projected: Relationship between Supply and Demand in 2030
Specialty
Difference Between Supply
and Demand 2030
Percentage ofAnticipated
Demand 2030
Difference Between Supply
and Demand 2030
Percentage of Anticipated
Demand 2030
Difference Between Supply
and Demand 2030
Percentage of Anticipated
Demand 2030
Difference Between Supply
and Demand 2030
Percentage of Anticipated
Demand 2030
Scenario 1 Supply BaselinePrimary Care -2,151 -8% -4,263 -14% -3,672 -12% -2,151 -8%Non-Primary Care -1,496 -3% -10,581 -16% -4,191 -7% 1,401 3%
All Physicians -3,647 -4% -14,844 -15% -7,863 -9% -750 -1%
Scenario 2a NP/PA GrowthHigh
Primary Care 2,281 8% 169 1% 760 3% 2,281 8%Non-Primary Care 3,348 6% -5,736 -9% 653 1% 6,246 11%
All Physicians 5,630 7% -5,568 -6% 1,413 2% 8,527 10%
Lower
Primary Care -8 0% -2,120 -7% -1,529 -5% -8 0%Non-Primary Care 805 1% -8,280 -12% -1,890 -3% 3,702 7%
All Physicians 797 1% -10,400 -11% -3,419 -4% 3,694 4%
Scenario 3a Increased Physician Retention(33% Primary Care/67% Non-Primary Care)
Primary Care -1,485 -5% -3,597 -12% -3,006 -10% -1,485 -5%Non-Primary Care -162 0% -9,247 -14% -2,857 -5% 2,735 5%
All Physicians -1,647 -2% -12,844 -13% -5,863 -6% 1,250 1%
(25% Primary Care/75% Non-Primary Care)
Primary Care -1,651 -6% -3,763 -12% -3,172 -11% -1,651 -6%Non-Primary Care 4 0% -9,081 -14% -2,691 -4% 2,901 5%
All Physicians -1,647 -2% -12,844 -13% -5,863 -6% 1,250 1%
(20% Primary Care/80% Non-Primary Care)
Primary Care -1,751 -6% -3,863 -13% -3,272 -11% -1,751 -6%Non-Primary Care 104 0% -8,981 -13% -2,591 -4% 3,001 5%
All Physicians -1,647 -2% -12,844 -13% -5,863 -6% 1,250 1%
Scenario 3b Decreased Physician Retention(33% Primary Care/67% Non-Primary Care)
Primary Care -2,817 -10% -4,929 -16% -4,338 -14% -2,817 -10%Non-Primary Care -2,830 -5% -11,915 -18% -5,525 -9% 67 0%
All Physicians -5,647 -7% -16,844 -17% -9,863 -11% -2,750 -3%
(25% Primary Care/75% Non-Primary Care)
Primary Care -2,651 -9% -4,763 -15% -4,172 -14% -2,651 -9%Non-Primary Care -2,996 -5% -12,081 -18% -5,691 -9% -99 0%
All Physicians -5,647 -7% -16,844 -17% -9,863 -11% -2,750 -3%
(20% Primary Care/80% Non-Primary Care)
Primary Care -2,551 -9% -4,663 -15% -4,072 -14% -2,551 -9%Non-Primary Care -3,096 -5% -12,181 -18% -5,791 -10% -199 0%
All Physicians -5,647 -7% -16,844 -17% -9,863 -11% -2,750 -3%
Demand Baseline Growing Economy Universal Health Insurance by 2020
Partial Elimination of Unnecessary/ Marginally-
Beneficial/ Duplicative Services
Demand Scenario 1 Demand Scenario 2 Demand Scenario 4Demand Scenario 3
Second, the anticipated shortages will be experienced in both primary care and non-primary care specialties. Even with a significant shift of interest in non-primary care specialties among new physicians in the past decade, shortages of non-primary care specialists are anticipated. The supply of non-primary care physicians is likely to grow at about 0.6 percent annually, while demand for non-primary care physicians may grow at 1.0 percent or more annually. At the same

New York Physician Supply and Demand Through 2030 17
time, while the supply of primary care physicians is likely to grow at an even slower rate, demand for primary care physicians is also likely grow somewhat more slowly than demand for non-primary care physicians. Third, two factors affecting New York give the state a somewhat more positive outlook than other parts of the country and the nation as a whole. First, the state has an enormous medical education and training infrastructure in place that continues to produce a large pool of new physicians. Second, since the state’s population is projected to grow at a much slower rate and age more slowly than the rest of the country, physician demand is likely to grow more slowly in New York compared to other parts of the country. While these factors mitigate the likely physician shortage to a certain extent, they are not enough to completely eradicate it. Moreover, since the physician shortage may not be as great in New York as it is in other states, the state will be an even more attractive source of physicians than it already is. Thus, policies, such as Doctors Across New York, designed to improve the retention of physicians currently practicing in the state and those who are trained here will be even more critical in the years ahead and should be afforded continued support from stakeholders statewide. Finally, since non-physician clinicians are growing at a faster rate than physicians, they will also be able to shoulder some of the increasing physician demand burden. However, it is not certain that the rate of growth among non-physician clinicians will remain as high as it has been recently. To the extent that their growth does slow, this group of practitioners, while still contributing important services, will not be able to completely eradicate the anticipated shortage. Regional Outlook With regard to forecast regional supply and demand gaps, the greatest gaps were projected in regions where demand was forecast to grow most rapidly. New York City and the Hudson Valley, in particular, were forecast to experience the greatest gaps between physician supply and demand in 2030. In those regions, the gaps between physician supply and demand approached 10 percent, with some specialties (e.g., urology, pathology, and ophthalmology) forecast to experience gaps greater than 33 percent, and adult primary care physician supply and demand gaps of greater than 12 percent. On the other hand, while no region of the state was immune to physician supply and demand gaps, physician supply growth was forecast to more closely parallel physician demand growth in the Capital District and the North Country regions. In addition to the scenarios described above, an additional parameter was manipulated in the regional forecasts: the effect of changes in anticipated demand on physicians’ practice location decisions. The first regional supply forecast assumed that the geographic distribution of physicians in the state would remain constant over the forecast period; that is, changes in the regional distribution of demand would have no effect on physicians’ practice location decisions. The second regional supply forecast assumed that the geographic distribution of physicians in the state would be responsive to anticipated changes in demand; that is, physicians would move into areas at a greater rate where physician demand is growing and leave areas at a greater rate where demand is declining or not growing as quickly as in other regions. An examination of the forecasts under these two assumptions yielded several important observations. First, if physicians’ practice location decisions were to perfectly respond to the anticipated changes in demand, in the regions with the more extreme forecast gaps between

New York Physician Supply and Demand Through 2030 18
supply and demand (e.g., New York City), gaps would be smaller. However, there would be a trade off: some regions in which the physician supply was projected to be adequate (e.g., Mohawk Valley) or somewhat oversupplied (e.g., Western New York) in 2030 would lose physicians and potentially face shortages of physicians. Moreover, in some areas (e.g., Hudson Valley and Capital District), if physicians were to respond to changes in the geographic distribution of demand, shortages would be exacerbated. These findings suggest that the solutions to the forecast physician supply and demand gaps in the state cannot rely on the market alone. Rather, the solutions will have to include the intervention of public and private stakeholders. Limitations The findings presented in this summary are subject to a number of limitations that should be considered prior to developing policy based upon them. Nature of Forecasting In general, as with all forecasting endeavors, the forecasts of physician supply and demand presented here are constructed on a foundation of assumptions. These assumptions are associated with the factors that determine physician supply and demand (e.g., number of new entrants into the New York physician workforce; age-, gender-, location-, insurance status-specific physician utilization rates; estimated elasticities of physician demand to economic change; and so forth). To the extent these assumptions fail to hold over the forecast period, the accuracy of the forecasts will suffer. However, the assumptions made were based upon historical data and, where available, New York-specific data. Moreover, the construction of multiple scenarios that allow for variation in some of the key assumptions of the forecasting models mitigates the risk of inaccuracy due to ill-chosen assumptions. Another way to consider the forecasts in this report is to think of them as illustrative of what the future might hold under a specific set of conditions. For example, in one of the demand scenarios developed for this report, it was assumed that five percent of non-primary care services would be identified as unnecessary/marginally-beneficial/duplicative services and would be eliminated by 2030. How likely is it that the health care system will change enough for this assumption to hold true? At this point in time, it is not clear. However, the scenario developed with this assumption does illustrate the effect on demand for physicians in such an environment. Thus, one could use this information to know what the effect might be should some portion of these services be eliminated. The same could be said for any of the assumptions made in these forecasts. Potential Feedback The findings presented here also do not take into account the potential feedback effects resulting from the predicted national physician shortage or the predicted physician shortage in New York. For example, the predicted shortage of cardiologists nationally may influence young physicians to select cardiology as a practice specialty at a higher rate than the forecast models assume. Moreover, in response to a widespread shortage of physicians, current practitioners may delay retirement. Further, if demand for physicians was to decrease as sharply as the scenarios in which unnecessary services were eliminated, it is likely that supply would respond by growing at a slower same rate than forecast, reducing the imbalances suggested by the models. There is a

New York Physician Supply and Demand Through 2030 19
nearly infinite list of other potential feedback effects in response to physician shortages that could affect supply and demand in the future. Similarly, the findings presented in this summary do not fully take into account policy changes that might be wrought as a result of the publication of the findings. While national policies around the physician workforce do not appear to have been affected greatly by the federal COGME’s Sixteenth Report yet, state-level initiatives have begun to respond to the predicted shortage of physicians. With a reported shortages worsening in many states, it is likely that competition for physicians among states will increase. In the same way states compete feverishly for new businesses and their accompanying jobs, they are acting similarly with regard to physician recruitment. The nature of this competition is likely to have ramifications for the relationship between physician supply and demand in New York that is not accounted for completely in the current forecasting models. Forward Looking Forecasts Finally, this report does not attempt to determine the extent to which there are current shortages of physicians in the state. Rather, it is forward-looking, focused on trends in the growth rates of physician supply and demand under a number of potential scenarios. An assessment of the current adequacy would require a radically different approach, including the construction of rational services areas, small area analyses, health status indicators, and the involvement of local provider agencies, among other things.8 The purpose of the current assessment is to provide information for the higher-level, broader policy community and offer a context within which to develop targeted policies and programs.
8 Such an assessment is currently being conducted by the Center for Health Workforce Studies and the Community Health Center Association of New York State with support from the New York State Department of Health.

New York Physician Supply and Demand Through 2030 20
Capital District Physician Supply and Demand Outlook 2006-2030
Specialty
Difference Between Supply
and Demand 2030
Percentage ofAnticipated
Demand 2030
Difference Between Supply
and Demand 2030
Percentage ofAnticipated
Demand 2030
Difference Between Supply
and Demand 2030
Percentage of Anticipated
Demand 2030
Difference Between Supply
and Demand 2030
Percentage of Anticipated
Demand 2030
Supply BaselineSupply unresponsive to demand
Primary Care -30 -3% -110 -9% -82 -7% -30 -3%Non-Primary Care 11 0% -348 -13% -91 -4% 127 6%
All Physicians -18 -1% -459 -12% -174 -5% 97 3%
Supply responsive to demand
Primary Care -83 -8% -163 -14% -135 -12% -83 -8%Non-Primary Care -50 -2% -410 -15% -153 -6% 65 3%
All Physicians -133 -4% -574 -15% -289 -8% -18 -1%
Demand Baseline Growing Economy Universal Health Insurance by 2020
Partial Elimination of Unnecessary/ Marginally-
Beneficial/ Duplicative Services
Demand Scenario 1 Demand Scenario 2 Demand Scenario 3 Demand Scenario 4
In the Capital District region, assuming physician location would not respond to changes in demand, the anticipated number of physicians in 2030 was forecast to be 3,377. Under the baseline supply scenario, anticipated demand for physicians would grow to 3,395, yielding a deficit of 18 physicians (1 percent) by 2030. The deficit was forecast to be entirely among the primary care specialties. This scenario suggests that the supply of non-primary care specialties would be sufficient to meet demand, perhaps exceeding demand slightly (less than 1 percent). Assuming an additional 1 percent economic growth annually, the anticipated demand for physicians was forecast to be 3,835, yielding a deficit of more than 450 physicians (12 percent) by 2030. Since non-primary care specialty demand is more sensitive to economic fluctuations than primary care specialty demand, in this scenario, the deficit was forecast to be greater for non-primary care specialties than primary care specialties (13 percent compared to 9 percent, respectively). Assuming universal health insurance was completely implemented by 2020, the anticipated demand for physicians was forecast to be 3,550, yielding a deficit of 174 physicians (5 percent) by 2030. In this scenario, primary care specialties were forecast to experience greater deficits than non-primary care specialties (7 percent compared to 4 percent). In the scenario that assumed that 5 percent of non-primary services would be identified as unnecessary, of marginal benefit, or duplicative and would be eliminated, the Capital District region was forecast to have a 127 physician excess (6 percent) in 2030. On the other hand, assuming that physician location would respond to changes in demand, it was forecast that the Capital District region would have 3,262 physicians in 2030, having peaked at slightly more than 3,300 physicians in 2020. The anticipated number of physicians in this scenario was lower than in the unresponsive forecast due to the projected population decline in the region over the forecast period and associated slower rate of demand growth relative to other parts of the state. This forecast yielded a deficit of 133 physicians (4 percent) by 2030. The deficit was forecast to be greater for primary care specialties than non-primary care specialties (8 percent compared to 2 percent, respectively). Moreover, because demand in other regions was forecast to grow more quickly than in the Capital District region, the physician supply and demand deficits forecast under the other demand scenarios were also larger than if physician practice location decisions were not responsive to changes in demand. The Capital District region includes the following counties: Albany, Columbia, Greene, Rensselaer, Saratoga, Schenectady, Warren, and Washington.

New York Physician Supply and Demand Through 2030 21
Central New York Physician Supply and Demand Outlook 2006-2030
Specialty
Difference Between Supply
and Demand 2030
Percentage ofAnticipated
Demand 2030
Difference Between Supply
and Demand 2030
Percentage ofAnticipated
Demand 2030
Difference Between Supply
and Demand 2030
Percentage of Anticipated
Demand 2030
Difference Between Supply
and Demand 2030
Percentage of Anticipated
Demand 2030
Supply BaselineSupply unresponsive to demand
Primary Care 38 6% -10 -1% 7 1% 38 6%Non-Primary Care 218 14% -25 -1% 147 9% 296 20%
All Physicians 256 12% -34 -1% 155 7% 334 16%
Supply responsive to demand
Primary Care -44 -7% -92 -13% -75 -11% -44 -7%Non-Primary Care -30 -2% -273 -15% -101 -6% 48 3%
All Physicians -74 -3% -365 -15% -176 -8% 4 0%
Demand Scenario 1 Demand Scenario 2 Demand Scenario 3 Demand Scenario 4
Demand Baseline Growing Economy Universal Health Insurance by 2020
Partial Elimination of Unnecessary/ Marginally-
Beneficial/ Duplicative Services
In the Central New York region, assuming physician location would not respond to changes in demand, the anticipated number of physicians in 2030 was forecast to be 2,466. Under the baseline supply scenario, anticipated demand for physicians would grow to 2,210, yielding an excess of 256 physicians (12 percent) by 2030. The excess was forecast to be greater among the primary care specialties than primary care specialties (14 percent compared to 6 percent, respectively). Assuming an additional 1 percent economic growth annually, the anticipated demand for physicians was forecast to be 2,500, yielding a deficit of 34 physicians (1 percent) by 2030. The deficit was forecast to be about the same among primary care specialties as non-primary care specialties (1 percent). Assuming universal health insurance was completely implemented by 2020, the anticipated demand for physicians was forecast to be 2,312, yielding an excess of 155 physicians (7 percent) by 2030. In this scenario, non-primary care specialties were forecast to experience a greater excess than primary care specialties (9 percent compared to 1 percent). In the scenario that assumed that 5 percent of non-primary services would be identified as unnecessary, of marginal benefit, or duplicative and would be eliminated, the Central New York region was forecast to have a 334 physician excess (16 percent) in 2030. On the other hand, assuming that physician location would respond to changes in demand, it was forecast that the Central New York region would have 2,136 physicians in 2030, having peaked at more than 2,270 physicians in 2015. The anticipated number of physicians in this scenario was lower than in the unresponsive forecast due to the projected population decline in the region over the forecast period and associated slower rate of demand growth relative to other parts of the state. This forecast yielded a deficit of 74 physicians (3 percent) by 2030. The deficit was forecast to be greater for primary care specialties than non-primary care specialties (7 percent compared to 2 percent, respectively). Moreover, because demand in other regions was forecast to grow more quickly than in the Central New York region, the physician supply and demand deficits forecast under the other demand scenarios were also larger than if physician practice location decisions were not responsive to changes in demand. The Central New York region includes the following counties: Cayuga, Cortland, Onondaga, and Oswego.

New York Physician Supply and Demand Through 2030 22
Finger Lakes Physician Supply and Demand Outlook 2006-2030
Specialty
Difference Between Supply
and Demand 2030
Percentage ofAnticipated
Demand 2030
Difference Between Supply
and Demand 2030
Percentage ofAnticipated
Demand 2030
Difference Between Supply
and Demand 2030
Percentage of Anticipated
Demand 2030
Difference Between Supply
and Demand 2030
Percentage of Anticipated
Demand 2030
Supply BaselineSupply unresponsive to demand
Primary Care -32 -2% -137 -9% -106 -7% -32 -2%Non-Primary Care 144 5% -278 -9% 18 1% 279 11%
All Physicians 111 3% -414 -9% -88 -2% 247 6%
Supply responsive to demand
Primary Care -107 -8% -211 -14% -180 -12% -107 -8%Non-Primary Care -37 -1% -459 -15% -163 -6% 98 4%
All Physicians -144 -3% -670 -14% -343 -8% -9 0%
Demand Baseline Growing Economy Universal Health Insurance by 2020
Partial Elimination of Unnecessary/ Marginally-
Beneficial/ Duplicative Services
Demand Scenario 1 Demand Scenario 2 Demand Scenario 3 Demand Scenario 4
In the Finger Lakes region, assuming physician location would not respond to changes in demand, the anticipated number of physicians in 2030 was forecast to be 4,229. Under the baseline supply scenario, anticipated demand for physicians would grow to 4,118, yielding an excess of 111 physicians (3 percent) by 2030. The excess was forecast to be entirely among the non-primary care specialties. In fact, among primary care specialties, a deficit of 32 physicians (2 percent) was forecast by 2030. Assuming an additional 1 percent economic growth annually, the anticipated demand for physicians was forecast to be 4,644, yielding a deficit of more than 400 physicians (9 percent) by 2030. The deficit was forecast to be about the same among primary care specialties as non-primary care specialties (9 percent). Assuming universal health insurance was completely implemented by 2020, the anticipated demand for physicians was forecast to be 4,317, yielding a deficit of 88 physicians (2 percent) by 2030. In this scenario, primary care specialties were forecast to experience greater deficits than non-primary care specialties (7 percent compared to 1 percent, respectively). In the scenario that assumed that 5 percent of non-primary services would be identified as unnecessary, of marginal benefit, or duplicative and would be eliminated, the Finger Lakes region was forecast to have a 127 physician excess (6 percent) in 2030. On the other hand, assuming that physician location would respond to changes in demand, it was forecast that the Finger Lakes region would have 3,974 physicians in 2030, having peaked at more than 4,000 physicians in 2020. The anticipated number of physicians in this scenario was lower than in the unresponsive forecast due to the projected population decline in the region over the forecast period and associated slower rate of demand growth relative to other parts of the state. This forecast yielded a deficit of 144 physicians (4 percent) by 2030. The deficit was forecast to be greater for primary care specialties than non-primary care specialties (8 percent compared to 1 percent, respectively). Moreover, because demand in other regions was forecast to grow more quickly than in the Finger Lakes region, the physician supply and demand deficits forecast under the other demand scenarios were also larger than if physician practice location decisions were not responsive to changes in demand. The Finger Lakes region includes the following counties: Genesee, Livingston, Monroe, Ontario, Orleans, Seneca, Wayne, Wyoming, and Yates.

New York Physician Supply and Demand Through 2030 23
Hudson Valley Physician Supply and Demand Outlook 2006-2030
Specialty
Difference Between Supply
and Demand 2030
Percentage ofAnticipated
Demand 2030
Difference Between Supply
and Demand 2030
Percentage ofAnticipated
Demand 2030
Difference Between Supply
and Demand 2030
Percentage of Anticipated
Demand 2030
Difference Between Supply
and Demand 2030
Percentage of Anticipated
Demand 2030
Supply BaselineSupply unresponsive to demand
Primary Care -225 -7% -457 -14% -391 -12% -225 -7%Non-Primary Care -213 -3% -1,201 -17% -507 -8% 101 2%
All Physicians -438 -5% -1,658 -16% -898 -9% -124 -1%
Supply responsive to demand
Primary Care -226 -7% -458 -14% -392 -12% -226 -7%Non-Primary Care -266 -4% -1,254 -17% -560 -9% 47 1%
All Physicians -492 -5% -1,713 -16% -952 -10% -179 -2%
Demand Scenario 1 Demand Scenario 2 Demand Scenario 3 Demand Scenario 4
Demand Baseline Growing Economy Universal Health Insurance by 2020
Partial Elimination of Unnecessary/ Marginally-
Beneficial/ Duplicative Services
In the Hudson Valley region, assuming physician location would not respond to changes in demand, the anticipated number of physicians in 2030 was forecast to be 8,977. Under the baseline supply scenario, anticipated demand for physicians would grow to 9,415, yielding a deficit of 438 physicians (5 percent) by 2030. The deficit was forecast to be greater among the primary care specialties than among non-primary care specialties (7 percent compared to 3 percent, respectively). Assuming an additional 1 percent economic growth annually, the anticipated demand for physicians was forecast to be 10,635, yielding a deficit of more than 1,600 physicians (16 percent) by 2030. Since non-primary care specialty demand is more sensitive to economic fluctuations than primary care specialty demand, in this scenario, the deficit was forecast to be greater for non-primary care specialties than primary care specialties (17 percent compared to 14 percent, respectively). Assuming universal health insurance was completely implemented by 2020, the anticipated demand for physicians was forecast to be 9,875, yielding a deficit of 898 physicians (9 percent) by 2030. In this scenario, primary care specialties were forecast to experience greater deficits than non-primary care specialties (12 percent compared to 8 percent, respectively). In the scenario that assumed that 5 percent of non-primary services would be identified as unnecessary, of marginal benefit, or duplicative and would be eliminated, the Hudson Valley region was forecast to have a 124 physician shortage (1 percent) in 2030. On the other hand, assuming that physician location would respond to changes in demand, it was forecast that the Hudson Valley region would have 8,923 physicians in 2030, having peaked at more than 8,950 physicians in 2025. The anticipated number of physicians in this scenario was slightly lower than in the unresponsive forecast due to the region’s projected population growth rate over the forecast period and associated slower rate of demand growth relative to the New York City region. This forecast yielded a deficit of 492 physicians (5 percent) by 2030. The deficit was forecast to be greater for primary care specialties than non-primary care specialties (7 percent compared to 4 percent, respectively). Moreover, because demand in other regions was forecast to grow about the same rate as in the Hudson Valley region, the physician supply and demand deficits forecast under the other demand scenarios were also about the same as were forecast if physician practice location decisions were not responsive to changes in demand. The Hudson Valley region includes the following counties: Dutchess, Orange, Putnam, Rockland, Sullivan, Ulster, and Westchester.

New York Physician Supply and Demand Through 2030 24
Long Island Physician Supply and Demand Outlook 2006-2030
Specialty
Difference Between Supply
and Demand 2030
Percentage ofAnticipated
Demand 2030
Difference Between Supply
and Demand 2030
Percentage ofAnticipated
Demand 2030
Difference Between Supply
and Demand 2030
Percentage of Anticipated
Demand 2030
Difference Between Supply
and Demand 2030
Percentage of Anticipated
Demand 2030
Supply BaselineSupply unresponsive to demand
Primary Care -18 0% -285 -7% -205 -5% -18 0%Non-Primary Care 369 4% -950 -10% -25 0% 789 10%
All Physicians 352 3% -1,235 -9% -230 -2% 771 7%
Supply responsive to demand
Primary Care -242 -7% -510 -13% -430 -11% -242 -7%Non-Primary Care -141 -2% -1,460 -15% -535 -6% 278 3%
All Physicians -384 -3% -1,970 -14% -965 -8% 36 0%
Demand Baseline Growing Economy Universal Health Insurance by 2020
Partial Elimination of Unnecessary/ Marginally-
Beneficial/ Duplicative Services
Demand Scenario 1 Demand Scenario 2 Demand Scenario 3 Demand Scenario 4
In the Long Island region, assuming physician location would not respond to changes in demand, the anticipated number of physicians in 2030 was forecast to be 12,370. Under the baseline supply scenario, anticipated demand for physicians would grow to 12,018, yielding an excess of 352 physicians (3 percent) by 2030. The excess was forecast to be entirely among the non-primary care specialties. In fact, among primary care specialties, a deficit of 18 physicians (less than 1 percent) was forecast by 2030. Assuming an additional 1 percent economic growth annually, the anticipated demand for physicians was forecast to be 13,605, yielding a deficit of more than 1,200 physicians (9 percent) by 2030. Since non-primary care specialty demand is more sensitive to economic fluctuations than primary care specialty demand, in this scenario, the deficit was forecast to be greater for non-primary care specialties than primary care specialties (10 percent compared to 7 percent, respectively). Assuming universal health insurance was completely implemented by 2020, the anticipated demand for physicians was forecast to be 12,600, yielding a deficit of 230 physicians (2 percent) by 2030. In this scenario, primary care specialties were forecast to experience greater deficits than non-primary care specialties (5 percent compared to less than 1 percent, respectively). In the scenario that assumed that 5 percent of non-primary services would be identified as unnecessary, of marginal benefit, or duplicative and would be eliminated, the Long Island region was forecast to have a 771 physician excess (7 percent) in 2030. On the other hand, assuming that physician location would respond to changes in demand, it was forecast that the Long Island region would have 11,364 physicians in 2030, having peaked at slightly fewer than 11,800 physicians in 2020. The anticipated number of physicians in this scenario was lower than in unresponsive forecast due to the projected population decline in the region over the forecast period and associated slower rate of demand growth relative to other parts of the state. This forecast yielded a deficit of 384 physicians (3 percent) by 2030. The deficit was forecast to be greater for primary care specialties than non-primary care specialties (7 percent compared to 2 percent, respectively). Moreover, because demand in other regions was forecast to grow more quickly than in the Long Island region, the physician supply and demand deficits forecast under the other demand scenarios were also larger than if physician practice location decisions were not responsive to changes in demand. Long Island includes the following counties: Nassau and Suffolk.

New York Physician Supply and Demand Through 2030 25
Mohawk Valley Physician Supply and Demand Outlook 2006-2030
Specialty
Difference Between Supply
and Demand 2030
Percentage ofAnticipated
Demand 2030
Difference Between Supply
and Demand 2030
Percentage ofAnticipated
Demand 2030
Difference Between Supply
and Demand 2030
Percentage of Anticipated
Demand 2030
Difference Between Supply
and Demand 2030
Percentage of Anticipated
Demand 2030
Supply BaselineSupply unresponsive to demand
Primary Care 8 2% -19 -5% -9 -2% 8 2%Non-Primary Care 44 9% -36 -6% 20 4% 69 14%
All Physicians 52 6% -55 -6% 12 1% 77 9%
Supply responsive to demand
Primary Care -33 -9% -61 -15% -50 -13% -33 -9%Non-Primary Care -19 -4% -99 -17% -43 -8% 6 1%
All Physicians -52 -6% -159 -16% -93 -10% -27 -3%
Demand Scenario 1 Demand Scenario 2 Demand Scenario 3 Demand Scenario 4
Demand Baseline Growing Economy Universal Health Insurance by 2020
Partial Elimination of Unnecessary/ Marginally-
Beneficial/ Duplicative Services
In the Mohawk Valley region, assuming physician location would not respond to changes in demand, the anticipated number of physicians in 2030 was forecast to be 933, having peaked at slightly fewer than 940 physicians in 2025. Under the baseline supply scenario, anticipated demand for physicians would grow to 881, yielding an excess of 52 physicians (6 percent) by 2030. The excess was forecast to be greater among the non-primary care specialties than among primary care specialties (9 percent compared to 2 percent, respectively). Assuming an additional 1 percent economic growth annually, the anticipated demand for physicians was forecast to be 988, yielding a deficit of 55 physicians (6 percent) by 2030. Since non-primary care specialty demand is more sensitive to economic fluctuations than primary care specialty demand, in this scenario, the deficit was forecast to be slightly greater for non-primary care specialties than primary care specialties (6 percent compared to 5 percent, respectively). Assuming universal health insurance was completely implemented by 2020, the anticipated demand for physicians was forecast to be 921, yielding an excess of 12 physicians (1 percent) by 2030. However, in this scenario, primary care specialties were forecast to experience a 9 physician deficit (2 percent). In the scenario that assumed that 5 percent of non-primary services would be identified as unnecessary, of marginal benefit, or duplicative and would be eliminated, the Mohawk Valley region was forecast to have a 77 physician excess (9 percent) in 2030. On the other hand, assuming that physician location would respond to changes in demand, it was forecast that the Mohawk Valley region would have 829 physicians in 2030, having peaked at slightly more than 880 physicians in 2015. The anticipated number of physicians in this scenario was lower than in the unresponsive forecast due to the projected population decline in the region over the forecast period and associated slower rate of demand growth relative to other parts of the state. This forecast yielded a deficit of 52 physicians (6 percent) by 2030. The deficit was forecast to be greater for primary care specialties than non-primary care specialties (9 percent compared to 4 percent, respectively). Moreover, because demand in other regions was forecast to grow more quickly than in the Mohawk Valley region, the physician supply and demand deficits forecast under the other demand scenarios were also larger than if physician practice location decisions were not responsive to changes in demand. Mohawk Valley includes the following counties: Fulton, Herkimer, Madison, Montgomery, Oneida, and Schoharie.

New York Physician Supply and Demand Through 2030 26
New York City Physician Supply and Demand Outlook 2006-2030
Specialty
Difference Between Supply
and Demand 2030
Percentage ofAnticipated
Demand 2030
Difference Between Supply
and Demand 2030
Percentage ofAnticipated
Demand 2030
Difference Between Supply
and Demand 2030
Percentage of Anticipated
Demand 2030
Difference Between Supply
and Demand 2030
Percentage of Anticipated
Demand 2030
Supply BaselineSupply unresponsive to demand
Primary Care -1,972 -12% -3,153 -18% -2,851 -17% -1,972 -12%Non-Primary Care -2,593 -8% -7,610 -21% -4,086 -12% -995 -3%
All Physicians -4,565 -10% -10,763 -20% -6,938 -14% -2,967 -6%
Supply responsive to demand
Primary Care -1,223 -8% -2,404 -14% -2,103 -12% -1,223 -8%Non-Primary Care -884 -3% -5,901 -16% -2,378 -7% 713 2%
All Physicians -2,108 -4% -8,306 -15% -4,481 -9% -510 -1%
Demand Baseline Growing Economy Universal Health Insurance by 2020
Partial Elimination of Unnecessary/ Marginally-
Beneficial/ Duplicative Services
Demand Scenario 1 Demand Scenario 2 Demand Scenario 3 Demand Scenario 4
In the New York City region, assuming physician location would not respond to changes in demand, the anticipated number of physicians in 2030 was forecast to be 43,394. Under the baseline supply scenario, anticipated demand for physicians would grow to 47,959, yielding a deficit of more than 4,500 physicians (10 percent) by 2030. The deficit was forecast to be greater among the primary care specialties than among non-primary care specialties (12 percent compared to 8 percent, respectively). Assuming an additional 1 percent economic growth annually, the anticipated demand for physicians was forecast to be 54,157, yielding a deficit of more than 10,000 physicians (20 percent) by 2030. Since non-primary care specialty demand is more sensitive to economic fluctuations than primary care specialty demand, in this scenario, the deficit was forecast to be greater for non-primary care specialties than primary care specialties (21 percent compared to 18 percent, respectively). Assuming universal health insurance was completely implemented by 2020, the anticipated demand for physicians was forecast to be 50,332, yielding a deficit of more than 6,900 physicians (14 percent) by 2030. In this scenario, primary care specialties were forecast to experience greater deficits than non-primary care specialties (17 percent compared to 12 percent, respectively). In the scenario that assumed that 5 percent of non-primary services would be identified as unnecessary, of marginal benefit, or duplicative and would be eliminated, the New York City region was forecast to have a 2,967 physician deficit (6 percent) in 2030. On the other hand, assuming that physician location would respond to changes in demand, it was forecast that the New York City region would have 45,851 physicians in 2030. The anticipated number of physicians in this scenario was higher than in the unresponsive forecast due to the projected higher than average population growth in the region over the forecast period and associated faster rate of demand growth relative to other parts of the state. This forecast yielded a deficit of more than 2,100 physicians (4 percent) by 2030. The deficit was forecast to be greater for primary care specialties than non-primary care specialties (8 percent compared to 3 percent, respectively). Moreover, because demand in the region was forecast to grow more quickly than in other parts of the state, the physician supply and demand deficits forecast under the other demand scenarios were smaller than if physician practice location decisions were not responsive to changes in demand. New York City includes the following counties: Bronx, Kings, New York, Queens, and Richmond.

New York Physician Supply and Demand Through 2030 27
North Country Physician Supply and Demand Outlook 2006-2030
Specialty
Difference Between Supply
and Demand 2030
Percentage ofAnticipated
Demand 2030
Difference Between Supply
and Demand 2030
Percentage ofAnticipated
Demand 2030
Difference Between Supply
and Demand 2030
Percentage of Anticipated
Demand 2030
Difference Between Supply
and Demand 2030
Percentage of Anticipated
Demand 2030
Supply BaselineSupply unresponsive to demand
Primary Care -21 -7% -44 -13% -36 -11% -21 -7%Non-Primary Care 15 3% -64 -10% -6 -1% 42 8%
All Physicians -7 -1% -108 -11% -41 -5% 20 2%
Supply responsive to demand
Primary Care -23 -8% -45 -14% -37 -12% -23 -8%Non-Primary Care 4 1% -75 -12% -17 -3% 31 6%
All Physicians -19 -2% -120 -13% -54 -6% 8 1%
Demand Scenario 1 Demand Scenario 2 Demand Scenario 3 Demand Scenario 4
Demand Baseline Growing Economy Universal Health Insurance by 2020
Partial Elimination of Unnecessary/ Marginally-
Beneficial/ Duplicative Services
In the North Country region, assuming physician location would not respond to changes in demand, the anticipated number of physicians in 2030 was forecast to be 832. Under the baseline supply scenario, anticipated demand for physicians would grow to 839, yielding a very small deficit of 7 physicians (1 percent) by 2030. The deficit was forecast to be entirely among the primary care specialties. This scenario suggests that the supply of non-primary care specialties would be sufficient to meet demand, perhaps exceeding demand slightly (3 percent). Assuming an additional 1 percent economic growth annually, the anticipated demand for physicians was forecast to be 940, yielding a deficit of more than 100 physicians (11 percent) by 2030. In this scenario, the deficit was forecast to be greater for primary care specialties than non-primary care specialties (13 percent compared to 10 percent, respectively). Assuming universal health insurance was completely implemented by 2020, the anticipated demand for physicians was forecast to be 874, yielding a deficit of 41 physicians (5 percent) by 2030. In this scenario, primary care specialties were forecast to experience greater deficits than non-primary care specialties (11 percent compared to 1 percent). In the scenario that assumed that 5 percent of non-primary services would be identified as unnecessary, of marginal benefit, or duplicative and would be eliminated, the North Country region was forecast to have a 20 physician excess (2 percent) in 2030. However, a 21 primary care physician deficit (7 percent) would remain under this scenario. On the other hand, assuming that physician location would respond to changes in demand, it was forecast that the North Country region would have 820 physicians in 2030. The anticipated number of physicians in this scenario was slightly lower than in the unresponsive forecast due to the region’s projected population growth rate over the forecast period and associated slower rate of demand growth relative to the New York City region. This forecast yielded a deficit of 19 physicians (2 percent) by 2030. The deficit was forecast to be entirely among the primary care specialties. This scenario suggests that the supply of non-primary care specialties would be sufficient to meet demand, perhaps exceeding demand (3 percent). Moreover, because demand in the region was forecast to grow a bit less quickly than in the New York City region, the physician supply and demand deficits forecast under the other demand scenarios were slightly larger than if physician practice location decisions were not responsive to changes in demand. North Country includes the following counties: Clinton, Essex, Franklin, Hamilton, Jefferson, Lewis, and St. Lawrence.
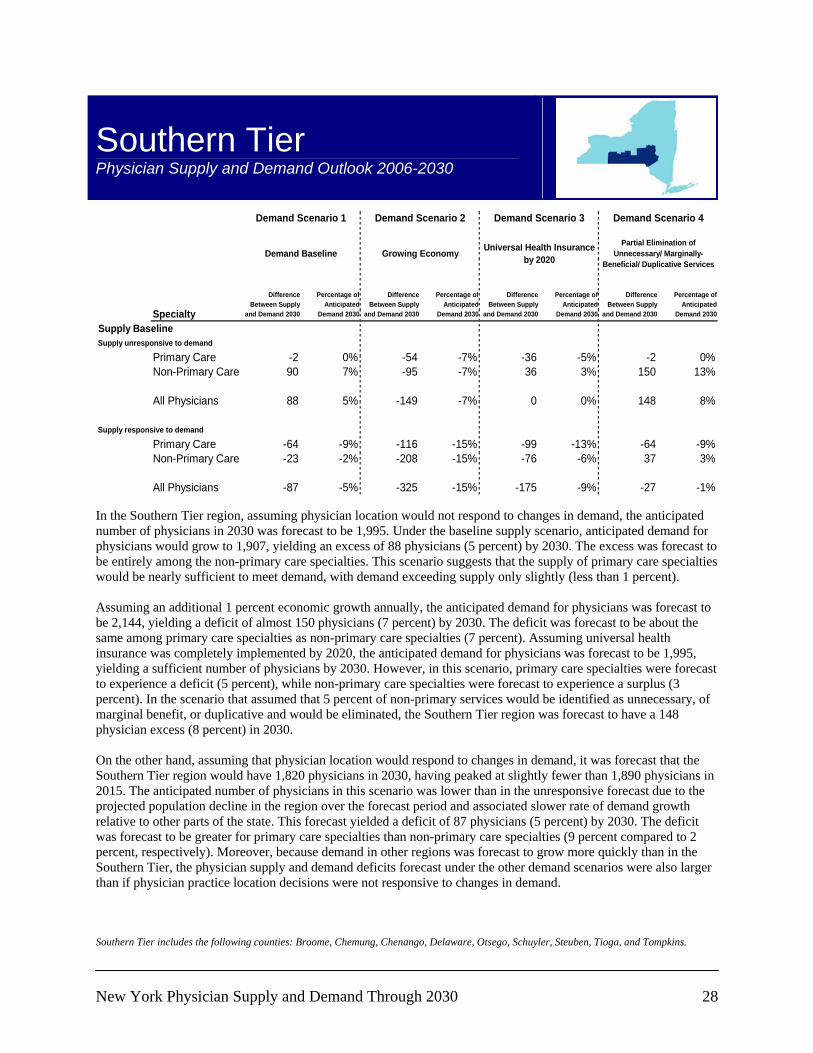
New York Physician Supply and Demand Through 2030 28
Southern Tier Physician Supply and Demand Outlook 2006-2030
Specialty
Difference Between Supply
and Demand 2030
Percentage ofAnticipated
Demand 2030
Difference Between Supply
and Demand 2030
Percentage ofAnticipated
Demand 2030
Difference Between Supply
and Demand 2030
Percentage of Anticipated
Demand 2030
Difference Between Supply
and Demand 2030
Percentage of Anticipated
Demand 2030
Supply BaselineSupply unresponsive to demand
Primary Care -2 0% -54 -7% -36 -5% -2 0%Non-Primary Care 90 7% -95 -7% 36 3% 150 13%
All Physicians 88 5% -149 -7% 0 0% 148 8%
Supply responsive to demand
Primary Care -64 -9% -116 -15% -99 -13% -64 -9%Non-Primary Care -23 -2% -208 -15% -76 -6% 37 3%
All Physicians -87 -5% -325 -15% -175 -9% -27 -1%
Demand Baseline Growing Economy Universal Health Insurance by 2020
Partial Elimination of Unnecessary/ Marginally-
Beneficial/ Duplicative Services
Demand Scenario 1 Demand Scenario 2 Demand Scenario 3 Demand Scenario 4
In the Southern Tier region, assuming physician location would not respond to changes in demand, the anticipated number of physicians in 2030 was forecast to be 1,995. Under the baseline supply scenario, anticipated demand for physicians would grow to 1,907, yielding an excess of 88 physicians (5 percent) by 2030. The excess was forecast to be entirely among the non-primary care specialties. This scenario suggests that the supply of primary care specialties would be nearly sufficient to meet demand, with demand exceeding supply only slightly (less than 1 percent). Assuming an additional 1 percent economic growth annually, the anticipated demand for physicians was forecast to be 2,144, yielding a deficit of almost 150 physicians (7 percent) by 2030. The deficit was forecast to be about the same among primary care specialties as non-primary care specialties (7 percent). Assuming universal health insurance was completely implemented by 2020, the anticipated demand for physicians was forecast to be 1,995, yielding a sufficient number of physicians by 2030. However, in this scenario, primary care specialties were forecast to experience a deficit (5 percent), while non-primary care specialties were forecast to experience a surplus (3 percent). In the scenario that assumed that 5 percent of non-primary services would be identified as unnecessary, of marginal benefit, or duplicative and would be eliminated, the Southern Tier region was forecast to have a 148 physician excess (8 percent) in 2030. On the other hand, assuming that physician location would respond to changes in demand, it was forecast that the Southern Tier region would have 1,820 physicians in 2030, having peaked at slightly fewer than 1,890 physicians in 2015. The anticipated number of physicians in this scenario was lower than in the unresponsive forecast due to the projected population decline in the region over the forecast period and associated slower rate of demand growth relative to other parts of the state. This forecast yielded a deficit of 87 physicians (5 percent) by 2030. The deficit was forecast to be greater for primary care specialties than non-primary care specialties (9 percent compared to 2 percent, respectively). Moreover, because demand in other regions was forecast to grow more quickly than in the Southern Tier, the physician supply and demand deficits forecast under the other demand scenarios were also larger than if physician practice location decisions were not responsive to changes in demand. Southern Tier includes the following counties: Broome, Chemung, Chenango, Delaware, Otsego, Schuyler, Steuben, Tioga, and Tompkins.

New York Physician Supply and Demand Through 2030 29
Western New York Physician Supply and Demand Outlook 2006-2030
Specialty
Difference Between Supply
and Demand 2030
Percentage ofAnticipated
Demand 2030
Difference Between Supply
and Demand 2030
Percentage ofAnticipated
Demand 2030
Difference Between Supply
and Demand 2030
Percentage of Anticipated
Demand 2030
Difference Between Supply
and Demand 2030
Percentage of Anticipated
Demand 2030
Supply BaselineSupply unresponsive to demand
Primary Care 102 8% 5 0% 36 3% 102 8%Non-Primary Care 418 17% 25 1% 302 11% 545 23%
All Physicians 521 14% 30 1% 338 8% 647 17%
Supply responsive to demand
Primary Care -105 -8% -202 -14% -171 -12% -105 -8%Non-Primary Care -48 -2% -442 -15% -164 -6% 78 3%
All Physicians -153 -4% -644 -15% -336 -8% -27 -1%
Demand Scenario 1 Demand Scenario 2 Demand Scenario 3 Demand Scenario 4
Demand Baseline Growing Economy Universal Health Insurance by 2020
Partial Elimination of Unnecessary/ Marginally-
Beneficial/ Duplicative Services
In the Western New York region, assuming physician location would not respond to changes in demand, the anticipated number of physicians in 2030 was forecast to be 4,368. Under the baseline demand scenario, anticipated demand for physicians would decline to 3,847, yielding an excess of 521 physicians (14 percent) by 2030. The excess was forecast to be greater for non-primary care specialties than primary care specialties (17 percent compared to 8 percent, respectively). Assuming an additional 1 percent economic growth annually, the anticipated demand for physicians was forecast to grow to 4,338, yielding an excess of 30 physicians (1 percent) by 2030. The excess was forecast to be slightly greater for non-primary care specialties than primary care specialties (1 percent compared to less than 1 percent, respectively). Assuming universal health insurance was completely implemented by 2020, the anticipated demand for physicians was forecast to grow to 4,030, yielding an excess of 338 physicians (8 percent) by 2030. In this scenario, non-primary care specialties were forecast to experience greater excess than primary care specialties (11 percent compared to 3 percent). In the scenario that assumed that 5 percent of non-primary services would be identified as unnecessary, of marginal benefit, or duplicative and would be eliminated, the Western New York region was forecast to have a 647 physician excess (17 percent) in 2030. On the other hand, assuming that physician location would respond to changes in demand, it was forecast that the Western New York region would have 3,694 physicians in 2030, having peaked at slightly fewer than 4,000 physicians in 2010. The anticipated number of physicians in this scenario was lower than in the unresponsive forecast due to the projected population decline in the region over the forecast period and associated slower rate of demand growth relative to other parts of the state. This forecast yielded a deficit of 153 physicians (4 percent) by 2030. The deficit was forecast to be greater for primary care specialties than non-primary care specialties (8 percent compared to 2 percent, respectively). Moreover, because demand in other regions was forecast to grow or decline more slowly than in the Western New York region, the physician supply and demand deficits forecast under the other demand scenarios were also larger than if physician practice location decisions were not responsive to changes in demand. Western New York includes the following counties: Allegany, Cattaraugus, Chautauqua, Erie, and Niagara.
