new york p runoff index – documentation and user’s guide...
TRANSCRIPT

New York P Runoff Index – Documentation and User’s Guide. First Edition. 7/8/2003.
The New York Phosphorus Runoff Index
User’s Manual and Documentation
K. J. Czymmek1, Q. M. Ketterings2, L. D. Geohring3, G. L. Albrecht2
1ProDairy, 2Department of Crop and Soil Sciences,
3Department of Biological and Environmental Engineering, Cornell University
Prepared for
New York State Department of Environmental Conservation New York State Department of Agriculture and Markets
Cornell University, Ithaca, NY 14853, July 2003

NY P Runoff Index - Documentation and User’s Manual. First Edition. 7/8/2003.
- ii -
The New York Phosphorus Runoff Index
User’s Manual and Documentation
Prepared by
K. J. Czymmek1, Q. M. Ketterings2, L. D. Geohring3, and G. L. Albrecht2
1Pro-Dairy 2Department of Crop and Soil Sciences
3Department of Biological and Environmental Engineering
In conjunction with the
New York State P Index Working Group:
S.E. Bossard, Field Crop Specialist, Cornell Cooperative Extension Cayuga County D.R. Dewing, Field Crop Specialist, Cornell Cooperative Extension Delaware County
W. Elder, Water Quality Coordinator, Natural Resources Conservation Service J. Ten Eyck, Assoc. Environmental Analyst, NY State Soil & Water Conservation Committee
T. Horvath, State Agronomist, Natural Resources Conservation Service T.S. Steenhuis, Professor, Biological & Environmental Engineering, Cornell University
Correct Citation:
Czymmek, K.J., Ketterings, Q.M., Geohring, L.D., and Albrecht, G.L. (2003). The New York Phosphorus Runoff Index. User’s Manual and Documentation. CSS Extension Publication E03-13. 64 pages.
NY P Index Website: http://nmsp.css.cornell.edu/publications/pindex.asp
Prepared for New York State Department of Environmental Conservation
New York State Department of Agriculture and Markets Under contract # C200042
Cornell University, Ithaca, NY 14853, July 2003

NY P Runoff Index - Documentation and User’s Manual. First Edition. 7/8/2003.
- iii -
Executive Summary
o The NY Phosphorus Index (NY P Index) is a water quality tool designed to estimate the relative risk of generating phosphorus runoff from agricultural fields.
o The NY P Index replaces earlier runoff estimation tools, including Runoff Risk Levels 1-4 previously used in many Comprehensive Nutrient Management Plans (CNMP).
o The NY P Index will be implemented over the next few years on all fields in operations developing a CNMP to satisfy a Concentrated Animal Feeding Operation (CAFO) permit, Agricultural Environmental Management (AEM) requirements, or requirements by State and Federal cost share programs.
o The NY P Index does not estimate actual P loss, but rates sites for loss potential and triggers managerial changes designed to reduce both the particulate and dissolved P runoff load.
o The NY P Index score calculation is based upon information garnered from farm records, soil erosion control plans, manure and fertilization plans, and field visits.
o The NY P Index assesses current and past management practices by including soil test P and expected manure and fertilizer rate, time of year applied, and method of application (P “sources”).
o The NY P Index assesses fields for the likelihood of contributing runoff to streams and waterbodies by including soil drainage class, erosion estimate, flooding frequency, presence of significant concentrated flow areas, and the distance from the edge of the field that runoff has to flow to reach a stream or ditch (P “transport”).
o The NY P Index will be used to evaluate fields on a yearly basis to take into account crop rotation.
o The NY P Index score can be reduced by altering management practices: Producers and planners are encouraged to do so-many dairy and livestock farms will have some fields that require changes in management.
o Some fields will score very high on the NY P Index even with management changes; for those fields phosphorus cannot be applied.
o The NY P Index will continue to undergo changes as scientific advances are made.

NY P Runoff Index - Documentation and User’s Manual. First Edition. 7/8/2003.
- iv -
Acknowledgments Past members of the NY P Index working group that were instrumental in developing the first draft of the NY P Index include Fred Gaffney, Agronomist (Retired), Natural Resources Conservation Service; Jim Perry (retired), Resource Conservationist, Natural Resources Conservation Service; Ray Bryant, Research Leader & Soil Scientist, USDA-ARS; Barbara Bellows, formerly Extension Associate, Department of Biological and Environmental Engineering; Paul Ray, Resource Conservationist, Natural Resources Conservation Service; and Dean Hively, Graduate Student, Department of Natural Resources. Special thanks to our reviewers Tibor Horvath, Jeff Ten Eyck, and Sheryl Swink.

NY P Runoff Index - Documentation and User’s Manual. First Edition. 7/8/2003.
- v -
Table of Contents
Executive Summary....................................................................................................................... iii
Acknowledgments...........................................................................................................................iv
Table of Contents.............................................................................................................................v
1. Introduction................................................................................................................................. 1
2. Background ................................................................................................................................. 2
3. General Overview of NY P Index and Ranking Site Vulnerability............................................ 3
4. Structure of the P Source Factor ................................................................................................. 4
4.1 Soil Test P .............................................................................................................................. 6 4.2 Fertilizer P ............................................................................................................................. 7 4.3 Organic P ............................................................................................................................... 8
5. Structure of the P Transport Factor............................................................................................. 9
5.1 Dissolved P Transport.......................................................................................................... 11 5.2 Particulate P Transport ........................................................................................................ 15 5.3 RUSLE................................................................................................................................. 17 5.4 Concentrated Flow............................................................................................................... 18
6. Using the Excel Spreadsheet Calculator ................................................................................... 18
7. Examples and Management Alternatives.................................................................................. 22
8. Using Cornell Cropware to Calculate the NY P Index............................................................. 32
Summary....................................................................................................................................... 48
Literature Cited ............................................................................................................................. 50
Appendix....................................................................................................................................... 54
Appendix A: Phosphorus Concentrations of Field Crops and Vegetables................................ 54 Appendix B: Flooding Frequency and Drainage Class of New York Soils .............................. 57

NY P Runoff Index - Documentation and User’s Manual. First Edition. 7/8/2003.
- vi -

NY P Runoff Index - Documentation and User’s Manual. First Edition. 7/8/2003.
- 1 -
1. Introduction Phosphorus (P) enrichment is a leading source of water quality impairment of the nation’s lakes, streams, and rivers. The loss of P to surface waters accelerates freshwater eutrophication, resulting in algal blooms, low seasonal oxygen status, and reduced water clarity. The concern over nutrient enrichment from agricultural operations led to the development of the 1999 USDA/EPA Unified National Strategy for Animal Feeding Operations (http:// www.epa.gov/npdes/pubs/finafost.pdf). Within this National Strategy all animal feeding operations (AFOs) are expected to develop and implement technically sound, economically feasible, and site-specific Comprehensive Nutrient Management Plans (CNMPs). The implementation of CNMPs should facilitate the protection of clean waterbodies, and further reduce nutrient loading to impaired waterbodies (USDA-EPA, 1998). Since surface water is the primary source of drinking water for many public water supply systems in New York (e.g., New York City, Syracuse, etc.), P enrichment is also a major statewide environmental concern. Consequently, the New York State Department of Environmental Conservation (NYS DEC), in conjunction with the New York State Department of Agriculture and Markets (NYS DAM), is implementing the National Strategy as part of a broad environmental initiative known as the Agricultural Environmental Management (AEM) program. Livestock operations subject to meeting US-EPA Clean Water Act requirements for developing and implementing CNMPs will be required to base their nutrient management and manure application strategies on approved methodologies. The New York Phosphorus Runoff Index has been developed to meet the NRCS NY590 nutrient management standard and to refine nutrient management planning efforts. This assessment tool results in a site vulnerability (risk) score for each field based upon site characteristics and the producer’s intended crop rotation, inorganic fertilizer use and manure application practices. Although most of these factors are weighted subjectively, the NY P Index was developed so fields receiving a higher score are likely to present a higher probability of P loss through runoff. The final score ranks a field into one of four relative risk categories (low, medium, high and very high). Fields with a high or very high P Index score should be evaluated for opportunities to reduce this risk. Changes in nutrient management practices will often be sufficient to reduce risk. In other cases, sites with high scores may have to be managed to minimize P losses and further application of P nutrients may be restricted or eliminated. It should be noted that a low or medium score does not imply that P loss does not occur. The poor timing of manure or fertilizer application relative to a rainfall or runoff event may result in substantial P losses. Nevertheless, low and medium risk rankings will allow a producer to manage livestock manure nutrient applications to the field on the basis of nitrogen (N) recommendations while more precise solutions are sought. The NY P Index risk assessment tool does not estimate the actual P loss in pounds/acre per year from a site. Actual P losses are very difficult to predict and quantify because P nutrient sources and concentrations in the soil and runoff are dependent on soil chemical, physical and microbial characteristics, timing of nutrient applications, landscape position, and hydrological events. A more complex and spatially based model is necessary to accurately estimate P loss from a field

NY P Runoff Index - Documentation and User’s Manual. First Edition. 7/8/2003.
- 2 -
and the loading of P to surface waters. A spatial-based tool would further improve the identification of critical P loss sites. However, such a tool is still in the developmental stages and may be cumbersome to use even with a high-speed computer. With minimal data inputs, the NY P Index, although incapable of predicting actual P loss, can assist producers and planners in quickly identifying fields or portions of fields that present the highest risk for contributing P to receiving lakes and streams. This manual describes the various factors important to P fate and transport, provides some documentation as to the selection and weighting of the different source and transport factors, and aids the user in calculating the NY P Index for farm fields through the use of either the NY P Index spreadsheet or Cornell Cropware. The methodology for arriving at a qualitative risk- level score is presented in detail along with some case scenarios, discussion, and interpretations of how the NY P Index can be used to identify and reduce P losses to the environment. Adjustments to the NY P Index will be made as field experience and research dictates.
2. Background Most NRCS standards are developed at the federal level and states are expected to make local adjustments using the federal standard as a baseline. In 1999, the agency developed a policy introducing the P Index as a potential site vulnerability assessment technique when developing CNMPs. The Federal template for the NRCS Nutrient Management Standard (590) provided for three ways to allocate phosphorus when manure is land applied. The three methods were to base P applications in any combination of fertilizer and manure on: (1) agronomic soil test recommendations, (2) some pre-determined environmental soil- test threshold, or (3) a site-specific risk assessment such as a P Index. The P Index offers the greatest flexibility to producers while taking into account important field-specific differences such as soil test P level, the influences of different soil type, topography, erosion, hydrology, and other water transport properties. The P Index concept does not consider all fields with a similar soil test P level to contribute equally to P losses to the environment. For example, a field that is adjacent to a stream will be evaluated differently than a field far away from the stream, even if the two fields have similar soil types, P soil test levels, and intended fertilizer and manure use. The P Index is the most flexible method offered, and thus will likely be more acceptable to producers and planners, while at the same time providing a reasonable, scientific approach to the risk for P nutrient losses. The concept of a P Index was first proposed at the national level by Lemunyon and Gilbert in 1993 and NRCS in 1994. These proposals included factors such as soil test P, fertilizer P appli-cation rate and method, organic P application rate and method, soil erosion, irrigation erosion, and soil runoff. However, as the index concept evolved, other factors were proposed for inclusion. Those factors included hydrological sensitivity (such as saturated areas and flooding frequency), distance to waterbody, vegetation grazing management, degree of soil P saturation, soil reactive aluminum, buffer width, leaching potential, and drainage class (see Box 1). In 1998,

NY P Runoff Index - Documentation and User’s Manual. First Edition. 7/8/2003.
- 3 -
Gburek and coworkers proposed using a contributing distance or return period and dividing the factors in the index into two groups: (1) P-source (soil test P, fertilizer rate and application method, and organic P rate and application method), and (2) P-transport (soil erosion, runoff class, and contributing distance). Gburek suggested summing each of the source and transport factors, and then multiplying the sum of the source factors by the sum of the transport factors. The sum of the source factors could be 1 to 1000 or more, while the sum of the transport factors is scaled between 0.1 and 1.0.
3. General Overview of NY P Index and Ranking Site Vulnerability
The NY P Index is separated into two main components: potential sources of P (“source factors”) and the potential movement of P (“transport factors”). The P source factor is determined based on soil P test values and an array of nutrient application and management factors. The value of the P source factor can be any positive number and typically reflects the pounds P/acre in the agronomic soil test plus the P2O5 equivalent of any nutrients applied. The range in the P source factor value will generally be from 0 to 150, although higher values are encountered. The P transport factor is divided into separate components to arrive at a dissolved P (DP) transport factor and a particulate P (PP) transport factor. Both the dissolved P and the particulate P transport factors are scaled in the NY P Index so that the values range from 0.1 to 1.0 (a low transport capacity to a maximum transport potential). Thus, two different risk scores need to be determined for the site being evaluated. The dissolved P Index score is calculated with Equation [1] and is primarily used to address the risk of water-soluble P loss from a field that occurs as a result of the runoff associated with saturated soil conditions (“saturation-excess”): Dissolved P Index = P Source Factor x Dissolved P Transport Factor [1] The particulate P Index score is determined with Equation [2] and reflects the risk of P loss that occurs when rainfall intensity exceeds a soils infiltration capacity causing the erosion of soil and/or manure particles (“infiltration excess”) : Particulate P Index = P Source Factor x Particulate P Transport Factor [2]
Box 1: Factor proposed for inclusion in the P runoff index:
- Saturated areas and flooding frequency (Walter and coworkers, 1995). - Distance to waterbody and vegetation grazing management (McFarland and coworkers, 1998). - Degree of soil P saturation (Bolinder and coworkers, 1998). - Soil reactive aluminum (Jokela, 2000).

NY P Runoff Index - Documentation and User’s Manual. First Edition. 7/8/2003.
- 4 -
Table 1 shows the site vulnerability risk category associated with the score and the general nutrient management expectations for that risk category. Although both the dissolved P and the particulate P Index scores need to be assessed and reported in CNMPs, management recommendations using Table 1 are based on the higher of the two scores. When the higher score exceeds 74, further applications of P begin to be restricted (see Appendix A for a list of crop P concentrations for calculations of P removal). Note in Table 1 that when scores exceed 100, no additional P nutrient applications are allowed. If risk scores exceed 74, one should review the variables in the P Index calculation to determine which variables are adding significantly to the score. Making minor management changes, implementing appropriate conservation practices, or altering field boundaries will often result in a lower risk score and additional flexibility in nutrient applications. Of course, particular knowledge about a field and experience with farming the field may indicate a need to treat a field more strictly than the NY P Index requires. It is possible in some situations that the NY P Index may underestimate runoff risk. If common sense dictates, planners should implement more conservative practices. Table 1: NY-PI scores, site vulnerability category, and nutrient management implications.
Ranking Value
Site Vulnerability
Management
50 Low N based management 50 – 74 Medium N based management with BMPs 75 – 99 High P applications limited to crop removal* = 100 Very High No P2O5 fertilizer or manure application
* See Appendix A for crop P concentrations for P removal calculations.
4. Structure of the P Source Factor The P source factor value that is used for the calculations in Equations [1] and [2] must first be determined with Equation [3]:
P Source Factor = Soil Test P + Fertilizer P + Organic P [3] Equation [3] illustrates that the major components of the P source consist of a combination of the soil test P level and the planned additions of inorganic and organic sources of P nutrients. Table 2 outlines how each variable in Equation [3] is determined. One can work directly through this table to determine the P Source Factor. A detailed discussion of the variables in Table 2 follows, providing additional background, justification, and demonstrating the process with mathematical formulas. These formulas are used in the NY P Index spreadsheet calculator, in the web-based NY P Index, and in Cornell Cropware, which will be discussed in subsequent sections.

NY P Runoff Index - Documentation and User’s Manual. First Edition. 7/8/2003.
- 5 -
Table 2: Calculation of the P Source Factor.
Step 1: Calculate the soil test contribution:
Soil Test P Contribution: Soil Test P = 1.25 x Morgan P (lbs/acre)* * see section 4.1 for Mehlich-III soil test data discussion.
Step 2: Calculate the fertilizer P contribution:
Fertilizer P Contribution: Fertilizer P = (Pfa) x (Pft) x (Pfm)
Fertilizer P application rate (Pfa)
Lbs P2O5 / acre
Fertilizer P timing (Pft)
May – August
0.4
September – October
0.7
November – January
0.9
February – April 1.0
Fertilizer P method (Pfm)
Inject or subsurface band
Broadcast and incorporate within
Surface apply or broadcast and incorporate >5
days after application
Surface apply on frozen, snow covered or
saturated ground
1-2 days 3-5 days 0.2 0.4 0.6 0.8 1.0
Step 3: Calculate the organic (manure) P contribution:
Organic P Contribution: Organic P = (Poa) x (Pot) x (Pom)
Organic P application rate (Poa)
0.75 x lbs P2O5 (in the organic source) applied / acre
Organic P timing (Pot)
May – August 0.4
September – October
0.7
November – January
0.9
February – April
1.0 Organic P method (Pom)
Inject or subsurface band
Broadcast and incorporate
within
Surface apply or broadcast and incorporate >5
days after application
Surface apply on frozen, snow covered or
saturated ground
1-2 days 3-5 days 0.2 0.4 0.6 0.8 1.0
Step 4: Calculate the total P source factor.
P Source Factor: Soil Test P + Fertilizer P + Organic P

NY P Runoff Index - Documentation and User’s Manual. First Edition. 7/8/2003.
- 6 -
4.1 Soil Test P The soil test P level is an important indicator of the availability of P for crop uptake as well as the potential transport of P through runoff or leaching. Soil test P is an indicator of the net accumulation of P based on previous additions of manure and fertilizer, minus crop removal and other losses over time. High soil test P levels may occur on livestock farms as a result of the disproportionate amounts of nitrogen, phosphorus and potassium in manure relative to plant requirements and the increase in costs associated with land application as one spreads further away from the manure source. Although different soil and land management practices influence the exact relationship, several studies have shown a strong positive correlation between soil test P levels and the dissolved P and particulate P concentrations in both surface and subsurface runoff1. These research results imply that a high soil test P level also means a high risk for P loss when transport occurs. As shown in Table 2, the soil test P variable of the P source factor score is obtained with the following equation:
Soil test P = 1.25 x Cornell Morgan Soil Test P (lbs P/acre) [4]
The Morgan soil test utilizes a sodium acetate solution buffered at pH 4.8 and is extensively calibrated to New York’s wide ranging soil chemical characteristics. Good correlations of Cornell Morgan extractable P to water extractable P were shown for some strongly acid till soils in the Catskills region by Murray (2001). Kleinman (2000) reported good correlation between Cornell Morgan soil test P and the soil P saturation level. Soil P saturation is the level at which soils are unable to be a net “consumer” of P. Soil test P results based on Mehlich-III and modified Morgan extraction methods from other laboratories must be converted to a Cornell Nutrient Analysis Laboratory Morgan P equivalent prior to use in Equation [4]. A number of calibration equations have been developed for this purpose and it is highly advisable to consult articles on this conversion process before sending soil samples for analysis (see Ketterings and coworkers, 2001). Conversion tools developed for New York agricultural soils can be found at http://nmsp.css.cornell.edu/. For New York’s CNMP permit process, only those laboratories for which conversion equations were developed and uncertainty in the interpretation of the results is known, are acceptable. The purpose of the multiplier coefficient (1.25) in Equation [4] is to arrive at a soil test P value that is considered to be representative of an environmental threshold level. The NY P Index may begin to restrict P additions when the Morgan soil test exceeds 80 lbs P/acre. This threshold value is based upon field research conducted on acid till soils in southeastern New York within the Catskills Region of the Upper Delaware River Watershed. Soil P saturation levels were found to occur at a Morgan’s soil test level ranging between 60 to 80 lbs P/acre (Kleinman et al, 1999). Although P saturation levels will likely differ depending on the soil mineralogy and soil amendments that are added over time, research findings indicate that the concentration of P in 1 See McDowell and Sharpley (2001), Smith and coworkers (1998), Pote and coworkers (1996), and Sharpley and coworkers (1977).

NY P Runoff Index - Documentation and User’s Manual. First Edition. 7/8/2003.
- 7 -
runoff increases as soil test P increases. Recently, Ketterings and coworkers have initiated research in New York to determine soil P saturation for important agricultural soil groups. 4.2 Fertilizer P Current or planned addition of fertilizer P is an important source component because fertilizer P addition may alter the soil test P level over time and it is immediately available for loss following application. The fertilizer P (FP) variable in Equation [3] is determined by:
FP = FPamount x FPapplication timing x FPapplication method [5] The FPamount is the amount of fertilizer expected to be applied in pounds P2O5/acre. Table 2 (at the beginning of section 4) shows the FP application timing and FPapplication method weighting coefficients used in Equation [5] to adjust the fertilizer P score. Additions of phosphorus fertilizer increase P concentrations in runoff depending on amount applied, timing of application, and the method of application. It has been known for a long time that high rates of fertilizer P application can lead to accumulations of soil P and/or rapid losses during transport events (Neller, 1946; Romkens and Nelson, 1974; Cogger and Duxbury, 1984). P concentration in runoff can increase by as much as 300-fold above baseline values right after fertilizer application. While highly soluble fertilizers result in higher losses of dissolved P, even less soluble fertilizers such as dicalcium phosphate can increase total P losses (Sharpley and coworkers, 1978). Timing of fertilizer application relative to soil moisture and probability of runoff affect P loss (Burwell and coworkers, 1975; Haygarth and Jarvis, 1997). Phosphorus concentrations in runoff are highest in the first runoff event following an application and decrease rapidly with time. Actual runoff P concentrations vary with type and amount of fertilizer and the timing of runoff producing events after application, but the effect or opportunity for P loss generally lasts for 50 to 100 days following an application. Surface broadcast applications of fertilizer typically result in greater losses than when the fertilizer is incorporated in some manner (Kimmell and coworkers, 2001). Baker and Laflen (1982) found that the dissolved P concentration in runoff from surface broadcast applications was on average100 times greater than in runoff where the same rate of fertilizer was incorporated to 2 inches below the soil surface. The multipliers for the timing of application (Table 2) reflect typical soil moisture conditions and the potential risk for runoff and leaching based on the long term average seasonal water balance between precipitation and evapotranspiration. The loss of soil water to evapotranspiration during May-August dries the soil; as a result, fertilizer P applied at this time is least prone to loss from runoff and leaching events. This is also the time of year when there is active plant growth and uptake of P, so the availability for loss diminishes more quickly. The highest seasonal risk for runoff and leaching normally occurs during the period from February to April because of the accumulated soil moisture recharge and snowfall over the winter. Snowmelt and soil thawing occurs sometime during this period, resulting in high, and often saturated, soil moisture content.

NY P Runoff Index - Documentation and User’s Manual. First Edition. 7/8/2003.
- 8 -
The multipliers for the method of application (Table 2) indicate that the highest risk of loss occurs when fertilizer P is surface applied and not incorporated, especially at times or to soil areas highly conducive or susceptible to runoff. However, even during drier soil conditions, Van Es and coworkers (1991) found that surface applied chemicals (both sorbing and non-sorbing) are more vulnerable to transport loss when not incorporated. The P fertilizer timing and method coefficients are reduced gradually, based on length of time between surface application and incorporation (if any). Since the average time between precipitation events is about five days, Table 2 reflects a break in the multiplier when incorporation occurs before or after this amount of elapsed time. Fertilizer P that is injected and immediately mixed with the soil is assigned the lowest multiplier, along with subsurface band applications. 4.3 Organic P As with fertilizer P, current or planned additions of organic P are also important source components. Organic P applications can quickly influence P concentrations in runoff depending on the amount applied, the timing of the application, and the method by which it is applied. The organic P (OP) variable in Equation [5] is determined by:
OP = 0.75 x OPamount x OPapplication timing x OPapplication method [6] The OPamount is the amount of P2O5 equivalent expected to be applied from manure. Where manure is applied twice on a field within a single planning year (e.g., fall and spring application), the organic P scores of both applications are calculated separately and added to obtain the final organic P score for the field. Several studies have shown that the rate of organic P application from livestock manure is positively correlated to the P concentration in runoff and leachate (Hergert and coworkers, 1981; Mueller and coworkers, 1984; Edwards and Daniel, 1994). Some research has demonstrated that manure P transport into the soil may be greater than fertilizer P transport and this may affect runoff and leaching concentrations (Chardon and coworkers, 1997; Eghball and coworkers, 1996; Frossard and coworkers, 1989). McDowell and Sharpley (2002) reported that manure applications not only increased total P concentrations in runoff when compared with bare soil, but also increased the proportion of total P that was in the dissolved form. Their study showed total P concentration in the runoff from a bare Berks channery silt loam soil having a high soil P test level peaked at 6 ppm, 10% of which was in the dissolved P form. After manure was applied, total P concentration in the runoff peaked at 45 ppm and about half was dissolved P. Sharpley and Moyer (2000) found that 63, 84, and 91% of the total P contained in dairy, poultry, and swine slurry manures, respectively, was in the inorganic P form, which is more likely to become part of the dissolved P in runoff. In composted forms of dairy and poultry manure, 92 and 87%, respectively, of total P was in the inorganic form. Research has also shown that manure P is about 80% as effective as fertilizer P in raising soil test P levels. This is why a factor of 0.75 is applied to the organic P calculation.

NY P Runoff Index - Documentation and User’s Manual. First Edition. 7/8/2003.
- 9 -
Currently, the NY P Index does not distinguish among organic sources. Several studies indicate that the P in livestock manures can vary considerably in both the amount available and solubility (Box 2). Thus, additional research is needed to better evaluate and quantify P loss risks for different organic P sources. The current multiplier of 0.75 for all organic P sources may be refined in the future. For simplicity, the same weighting coefficients given in Table 2, Step 2 for Fertilizer P are also applied to OPapplication timing and OPapplication method to adjust the organic P score. Geohring and coworkers (2001) found that soil wetness, timing of runoff producing events, and application method could significantly affect the loss of P from liquid dairy manure applications. In this study, more P loss occurred when manure was applied under wet soil conditions and then followed by a precipitation event. High total P concentrations ranging from 5 to 25 ppm were observed in the tile discharge during the first rain event directly after application. Concentrations were much less (about one third) when rain occurred 6 days later. Incorporation of the manure reduced the P concentrations compared to surface broadcast application and subsequently resulted in less total P loss. These results are similar to those reported in other studies (Mueller and coworkers, 1984; Harris and coworkers, 1995). As a result, the weighting coefficients for organic P are considered to follow similar general trends as those for fertilizer P in projecting the risk of P loss, but the multipliers used in the NY P Index may also need to be adjusted in the future when more research findings become available.
5. Structure of the P Transport Factor Both dissolved and particulate P forms are a concern for water quality. To better assess and manage the potential loss of each P form, a dual transport factor calculation was developed in the NY P Index. With this methodology, it is easier to identify and evaluate what management changes are deemed necessary. For example, if the particulate P score is higher than the dissolved P score, it suggests that the P loss risk for the field is more closely associated with erosion or particulate P loss, and the nutrient loss occurs primarily through surface runoff. There is a strong basis for separating and identifying dissolved P loss and not just basing the NY P Index on particulate or total P. First of all, the concern regarding dissolved P loss is that it is immediately bio-available for algal growth and only a few parts per million can saturate algal growth in most surface water systems (Correll, 1998). Particulate P, or the P fixed to eroded soil minerals, must first be broken down into a dissolved P form in order to be bio-available to algae; and during this process, the eroded soil is subject to settling out of the water column. Since most P is believed to be transported via erosion, many agricultural best management practice (BMP)
Box 2: The type and amount of P fed in the diet to dairy cows is another factor that apparently affects the amount and form of P in runoff. Dairy cows fed a high P diet (0.49%) compared to those fed a low P diet (0.31%) not only excreted more P in the manure, but the P was also more soluble. Powell and coworkers (2001) and Ebeling and coworkers (2002) land applied equal weights of manure from cows fed on either diet and measured 8-10 times more P in the runoff from the high P diet cow manure. When the manure application was adjusted so equivalent amounts of actual P were applied, the researchers still found 4-5 times more P in the runoff from the high P diet cow manure.

NY P Runoff Index - Documentation and User’s Manual. First Edition. 7/8/2003.
- 10 -
recommendations have focused in the past on the surface water pathways and erosion (particulate P loss) controls. Unfortunately, the anticipated reductions in particulate P or total P losses have not always resulted in improved water quality (Effler and Bader, 1998; Heathwaite and coworkers, 1996). As a result, lake and reservoir managers are becoming increasingly concerned about dissolved P concentrations. Secondly, dissolved and particulate P are lost in varying amounts depending on the processes involved (i.e, surface residue, soil organic matter, fresh manure), and the predominant transport pathway (i.e., surface versus subsurface flow). For example, Gaynor and Bissonnette (1992) found that while conservation tillage (e.g., no-till, ridge till) effectively reduced soil erosion and particulate P loss, the transport of dissolved P and total P were greater than in the conventional tillage treatment. Although surface residues can reduce soil displacement and movement resulting in a lower particulate P loss from a field, the effect may be offset because the higher organic and moisture content in the residue promotes organic mineralization of P and the dissolution of weakly bound soil P near the surface to dissolved P. Since the amount and pathway of water lost was basically similar in this study, conservation tillage only changed the form in which P was lost. The percentages of dissolved and particulate P in surface and subsurface runoff can thus vary greatly with type of nutrient addition and land cover. The predominant transport pathway is an important consideration when determining the form of P loss. The ratio of particulate P to the total P is generally higher in surface runoff, whereas the ratio of dissolved P to total P is generally higher in subsurface water transport. Since the percentage of dissolved P in runoff from heavily fertilized croplands typically ranges between 5 to 50 percent, particulate P is generally the predominant form of P lost from tilled croplands. On the other hand, dissolved P (30-90 percent) is generally the predominant form of P lost from forests and grasslands (Gilliam and coworkers, 1999; Heckrath and coworkers, 1995). Several studies have shown that the subsurface leaching of dissolved P can occur rapidly through shallow soils (Scott and coworkers, 1998) including lateral flows through the soil until surfacing at a seep or ditch (Wood, 1998), through subsurface drains (Geohring, 1999; Ulén and Persson, 1999; Haygarth and coworkers, 1998; Sims and coworkers, 1998), or more slowly to deeper groundwater (Spruill, 2000; Lowrance and coworkers, 1985). Since total P losses from croplands typically range from 1 to 4 lbs/acre for mineral soils and from 1 to 33 lbs/acre for organic soils (Gilliam and coworkers, 1999), the long held concept that losses of P are not significant may be true from an agronomic perspective. However, water bodies are very sensitive to the dissolved P inputs and so the contribution of dissolved P to watercourses may be environmentally significant. Eghball and Gilley (1999) concluded that particulate P loss is better correlated to erosion or soil loss, whereas dissolved P is dependent on the amount of water lost. This leads to the third point for having both a particulate and a dissolved component in the NY P Index. The soils and hydrology in the Northeastern US are unique because of the abundance of cool, wet and/or shallow soils in a highly undulating landscape. This has an effect on how runoff is generated in the landscape and moves into waterbodies. Most hydrological models and phosphorus indices assume runoff is generated when the rainfall rate exceeds the infiltration rate of the soil, a phenomenon termed infiltration-excess overland flow. However, Steenhuis and Muck (1988) found that soils of the Northeast, especially the shallow hillside soils maintained in grass and pasture, have infiltration rates that are rarely exceeded by the rainfall rate. Similar conclusions

NY P Runoff Index - Documentation and User’s Manual. First Edition. 7/8/2003.
- 11 -
were drawn by Merwin and coworkers (1994) and Dunne and Black (1970). Runoff from these soils occurs because the soil becomes saturated quickly during a storm, termed saturation-excess overland flow. Areas prone to saturation either have a high ground water table or an impermeable layer (fragipan) or bedrock at shallow depth. The runoff mechanism is important because it determines the relative proportions of particulate and dissolved P that are lost in the total annual runoff. Where infiltration-excess runoff occurs, a large amount of particulate P can be lost during a single intense storm event even though the runoff volume is a small amount of the total annual runoff. In areas prone to saturation-excess, both particulate and dissolved P losses are usually small during a single intense storm event because of the minimal amount of surface runoff and inter- flow produced. However, over the course of the year and especially when precipitation amounts begin to exceed evapotranspiration, the runoff and inter- flow is important and results in the formation of saturated areas at the bottom of slopes, usually in concave areas, or quickly resurfaces in seeps and ditches. It is important to note that the runoff mechanism may not always be the same because a shallow hillside soil maintained in pasture for a long time, and exhibiting saturation-excess overland flow, can rapidly be changed to one that exhibits infiltration-excess overland flow when the soil is tilled. Another reason the runoff mechanism is so important to evaluating the risk of P loss is that it governs the runoff location. The location of infiltration-excess runoff generation depends on soil type (i.e., infiltration rate, soil erodibility) but is independent of position in the landscape. Conversely, the position in the landscape and the soil depth (i.e., available water storage capacity) are the important parameters determining the runoff location for saturation-excess overland flow. As a result, each runoff mechanism generates runoff at different locations in the landscape and when P is applied in a vulnerable location, it is more readily lost. The infiltration-excess runoff interacts with the soil surface and results in erosion and proportionately greater losses of particulate P during usually brief, intense, hit or miss events. On the other hand, saturation-excess overland flow engages a greater depth of the soil profile, produces proportionately more dissolved P, and may continue to produce flow for long durations as long as precipitation exceeds evaporation. Consequently, the NY P Index utilizes both a dissolved and a particulate P Index to better identify which process is likely to produce a greater risk for P loss. 5.1 Dissolved P Transport The dissolved P Index and dissolved P (DP) transport factor to be determined using Equation [7] require input variables that reflect the saturation-excess overland flow runoff and leaching concept. The value of the dissolved P transport factor for use in Equation [7] is determined by: DP Transport Factor = Soil drainage + Flooding frequency + Flow distance to stream [7] Table 3 outlines the variables used to determine the dissolved P transport factor. It should be noted that if the sum of the soil drainage, flooding frequency, and flow distance to stream variables in Equation [7] exceed 1.0, the value of the dissolved P transport factor is set to a maximum of 1.0.

NY P Runoff Index - Documentation and User’s Manual. First Edition. 7/8/2003.
- 12 -
The soil drainage classification is readily determined from the soil survey and is not modified if drainage practices have been installed. The value of the soil drainage contribution to use in Equation [7] for different soil drainage classifications is given in Table 3. Although various forms of mineral bound P in the soil are more soluble under oxygen-limited conditions and plant uptake of P is also generally limited, the important implication of the drainage classification for the NY P Index is that on average, less well drained soils have higher moisture content for a longer period of time than better drained soils. This increases the risk for P transport.
Table 3: Calculation of the Dissolved P Transport Factor.
Step 1: Determine the soil drainage contribution.
Soil Drainage
Well to excessively well drained
0.1
Moderately well drained
0.3
Somewhat poorly drained
0.7
Poorly or very poorly drained
1.0
Step 2: Determine the flooding frequency contribution.
Flooding Frequency
Rare / Never > 100 years
0
Occasional 10 – 100 years
0.2
Frequent < 10 years
1.0 Step 3: Determine the flow distance contribution.
Flow Distance in feet to blue line stream (or equivalent) as depicted on a topographic map and confirmed based on field evaluation
Intermittent Stream
>200 feet
Perennial Stream
>300 feet --------------------
0
Intermittent Stream 25 to 200 feet
Perennial Stream 50 to 300 feet
------------------------ Intermittent Stream
1 – (Distance–25)/175
Perennial Stream 1 – (Distance–50)/250
Intermittent Stream <25 feet
Perennial Stream
< 50 feet -------------------
1.0
* Intermittent streams are generally depicted with a dashed blue line on topographic maps and perennial streams are shown with a solid blue line.
Step 4: Determine the dissolved P transport factor.
Dissolved P Transport Factor = Drainage + Flooding Frequency + Flow Distance*
* if the Dissolved P Transport Factor exceeds 1, the value is set to 1.

NY P Runoff Index - Documentation and User’s Manual. First Edition. 7/8/2003.
- 13 -
In general, the soil drainage classification describes the ease with which a soil drains off excess water by percolation or, essentially, the length of time a soil will remain in a wet and saturated condition. There are several different reasons why water does not percolate vertically or laterally in a soil classified as poorly drained. One reason may be the inherent nature of the soil void space, for example, the very small diameter pores in a clay soil which do not conduct water readily under saturated conditions and which have a high potential to retain water in unsaturated conditions. In certain conditions, some coarse gravelly or sandy soils are also classified as poorly drained. High precipitation to evaporation ratios, soil layers restricting downward water movement, and accumulation of water in low areas of the landscape are all interrelated factors contributing to poorly drained soils. Soils at the bottom of a slope and adjacent to water courses are often classified as poorly drained because shallow groundwater frequently moves toward streams rather than straight down into deeper layers of the earth’s crust. Precipitation falling on poorly drained soils produces more runoff than when falling on better drained soils because the poorly drained soil has limited water storage capacity. Frankenberger (1996) found that runoff correlated strongly with soil drainage class and depth to water table. On the other hand, runoff production was not well correlated with hydrologic soil group, runoff curve number, or soil slope. As a result, soil drainage class was selected as an important transport indicator in the NY P Index, and one that would most likely serve as an indicator for dissolved P transport. Each soil type is assigned a flooding frequency classification (see Appendix B). Sometimes this information may be available on flood hazard boundary maps as well. Occasionally, the construction of dams will alter the flooding frequency: areas below the dams may flood less often and areas immediately upstream may flood more often. Planners need to be aware of these situations and, with documented reasoning, adjust the flooding frequency accordingly. The weighting coefficient s to be used in Equation [7] for different flooding frequencies are given in Table 3. Since the temporal duration of a flooding event is not considered to be very important to the overall transport of dissolved P, there is no further correction for the flooding duration. Although it is apparent that flooding may be an important transport phenomenon, the significance to P loss will depend greatly on the connectivity to water courses and the flow velocities that develop. Flooding may also result in nutrient entrapment and deposition under some circumstances. The risk of actual P loss with flooding frequency is difficult to quantify without a great deal more information. Consequently, the weighting coefficients given in Table 3 are primarily used to rapidly raise the transport score in order to flag those areas subjected to flooding conditions. For most circumstances in NY, frequent flooding will occur in conjunction with poorly drained soils or in close proximity to streams. Before discussing flow path and distance, there are a few definitions that need to be set out. Firstly: perennial streams, intermittent streams and concentrated flows. Perennial streams (or other perennial waterbodies) contain water 365 days per year, though in some dry periods smaller perennial streams may dry up for a short time. Intermittent streams or waterbodies contain water on a seasonal basis only during most years. Another way to consider intermittent streams is that in most years water is present only during those parts of the year when the water table is relatively high. Most concentrated flows are not specifically depicted on topographic maps (though they may show up through contour lines) but are often marked on soil

NY P Runoff Index - Documentation and User’s Manual. First Edition. 7/8/2003.
- 14 -
conservation plan maps. These are areas where water sometimes flows for a short time after a significant rainfall. Concentrated flows that are extensive enough to require treatment from an erosion control standpoint are to be considered in the P Index. The P Index relies on topographic maps to help planners to identify streams. Most topographic maps depict perennial streams with a solid blue line (hence the phrase “blue line” stream) and intermittent streams with a dashed blue line, although some topographic maps for NY State depict all streams with a solid blue line. Also, since some topographic surveys were completed 20-30 or more years ago, the maps do not reflect more recent drainage work. This all adds up to the need for a field inspection to confirm topographic information. Planners should not ignore a stream just because it is not depicted on the topographic map, nor is a planner bound to labeling all streams perennial in a county where the topographic maps do not differentiate between perennial and intermittent streams. Planners should document any decisions that deviate from topographic designations. Complete topographic maps for the state are available in both print and digital form through the New York State Office for Technology, Center for Geographic Information, 2nd Floor Kenmore Building, 74 N. Pearl St., Albany, NY 12207 (518-443-2042 or see the New York State GIS Clearinghouse web site at http://www.nysgis.state.ny.us/). The flow distance or distance to a watercourse (blue line stream or equivalent) is the drainage path that excess runoff water takes as it leaves the edge of a field and finds it way down slope to a stream. For a first assessment, the flow path and distance can be approximated from topographic maps where the flow path runs perpendicular to the contour lines, but this needs to be confirmed by field inspection. There may be more than one flow path leaving a field. Often there are several flow paths heading in the same general direction. Other times, multiple flow paths may head in very different directions. Planners are expected to evaluate these situations and identify the general direction and distance of flow for the majority of the runoff that leaves the field or management unit being evaluated. For example, road ditches frequently receive some surface runoff from fields, but it is often only a small portion of the total runoff. A road ditch is considered part of the flow path only if it receives the majority of runoff from the field. Road ditches are also often challenging to label perennial, intermittent or concentrated flow. If a road ditch does not receive the majority of runoff from the field, it is not necessary to apply a label. In well drained locations, the road ditch may receive the majority of runoff, but runoff occurs infrequently due to the drainage. In cases like this, the road ditch is essentially functioning as a concentrated flow, and it is counted as part of the flow distance until it discharges to an intermittent or perennial stream. In other cases, a road ditch may be serving a larger watershed and will classify as an intermittent stream. Since the NY P Index separates the determination of flow distance into a distance to either perennial or intermittent type watercourses, it utilizes different distance (or setback) criteria for each in determining the transport weighting coefficient for Equation [7] (see Table 3). This separation acknowledges the different spatial position of a watercourse in the landscape whereby an intermittent stream is likely to have a smaller contributing area and the groundwater table is not always intersecting the streambed. As a result, the transport or risk of P loss via an intermittent watercourse is attenuated at times compared to the perennial counterpart. The objective for the flow distance is to be a representative distance over which runoff or leaching water has an opportunity to interact with vegetation and/or soil. The concept of flow

NY P Runoff Index - Documentation and User’s Manual. First Edition. 7/8/2003.
- 15 -
distance in reducing the nutrient load of water has been around for a long time, particularly with regards to the removal of sediments. Stevens (1936) observed that sediment delivery to a lake was reduced by vegetative growth above it, and Brown (1943) coined the term “vegetative screen” to describe a growth of dense vegetation through which sediment-laden water must flow prior to entering a reservoir. In attempts to quantify the effects of flow distance, Wilson (1967) determined that Bermuda grass strips of 10, 50, and 400 feet in width were necessary to
maximize the removal of sand, silt, and clay particles from runoff waters, respectively. Several other studies have been done to quantify and establish relationships between flow distance and the effectiveness of P removal from both non-point and more concentrated sources (Box 3). Although the flow distance and the weighting coefficients used in Table 3 are necessarily simplified and may not be indicative for dissolved P, these weighting coefficients generally reflect the range of buffer distance effectiveness reported in the literature. Thus, a properly determined flow distance should also reflect the general risk of total P loss. The site-specific conditions having the greatest effect on
removing P in the flow path appear to be the hydrology and the soils. Studies by Heatwole and Shanholtz (1991) and Chaubey and coworkers (2000) suggest that the flow path distance is of greater importance than the land slope in the delivery of nutrients to the watercourse so, outside of the RUSLE input, slope has not been separately included in the NY P Index. The research to date also does not provide any definitive answers as to whether grass or tree vegetation in the flow path makes any difference in the amount of P removed so no further delineation of buffer type, quality, or flow distance characterization is included at this time. 5.2 Particulate P Transport Particulate P is the phosphorus that is bound or fixed in eroding soil or manure particles. Dissolved P is also lost simultaneously in the erosion process, but dissolved P generally constitutes a lesser amount of the total P loss during erosion events. The particulate P Index and particulate P transport factor to be determined for Equation [2] require input variables that reflect the infiltration-excess overland flow runoff and erosion producing mechanism. The value of the particulate P transport factor for use in Equation [2] is determined by:
PP Transport Factor = (0.1 x Soil erosion) + Flooding frequency + Flow distance + Concentrated flow [8]
Box 3: The scientific literature contains numerous studies that indicate that flow distances or buffer widths ranging anywhere from 10 to 650 feet are effective in reducing total P by 30 to 95%, depending on site-specific conditions (Bingham and coworkers, 1980; Peterjohn and Correl, 1984; Lowrance and coworkers, 1985; Cooper and Gilliam, 1986; Cooke, 1988; Dillaha and coworkers 1988 and 1989; Magette and coworkers, 1989; Parsons and coworkers, 1994; Castelle and coworkers, 1994; Daniels and Gilliam, 1996; and Uusi-Kämppä and coworkers, 2000). McDowell and Sharpley (2002) found that the concentrations of all P fractions decreased with increasing flow path length, but attributed the reduction in dissolved P to dilution rather than P sorption. They also suggested that the minimum distance between manure application sites and the stream should be at least 80 and 570 feet for low and high soil test P soils, respectively, in order to reduce P concentrations at the stream to 0.1 ppm. The primary benefit of the flow distance separation appears to be in removing particulate P. Several of the studies cited above did not report a significant reduction in the dissolved P concentration.

NY P Runoff Index - Documentation and User’s Manual. First Edition. 7/8/2003.
- 16 -
Table 4: Calculating of the particulate P transport factor.
Step 1: Determine the flooding frequency contribution.
Flooding Frequency
Rare / Never > 100 years
0
Occasional 10 – 100 years
0.2
Frequent < 10 years
1.0 Step 2: Determine the flow distance contribution.
Flow Distance in feet to blue line stream (or equivalent) as depicted on a topographic map and confirmed based on field evaluation
Intermittent Stream
>200 feet
Perennial Stream
>300 feet --------------------
0
Intermittent Stream 25 to 200 feet
Perennial Stream 50 to 300 feet
------------------------ Intermittent Stream
1 – (Distance–25)/175
Perennial Stream 1 – (Distance–50)/250
Intermittent Stream <25 feet
Perennial Stream
< 50 feet -------------------
1.0
* Intermittent streams are generally depicted with a dashed blue line on topographic maps and perennial streams are shown with a solid blue line.
Step 3: Determine the soil erosion contribution.
Soil erosion (value from RUSLE model)
0.1 x RUSLE Erosion rate (tons/acre)
Step 4: Determine the concentrated flow contribution.
Is a concentrated flow present in the field?
No 0
Yes 0.2
Step 5: Determine the particulate P transport factor.
Particulate P Transport Factor = Flooding Frequency + Flow Distance + Soil Erosion + Concentrated Flow*
* if the Particulate P Transport Factor exceeds 1, the value is set to 1.

NY P Runoff Index - Documentation and User’s Manual. First Edition. 7/8/2003.
- 17 -
Table 4 outlines the variables used to determine the particulate P transport factor. Similar to the dissolved P transport factor calculation, if the sum of the soil erosion, flooding frequency, flow distance to stream, and concentrated flow variables in Equation [8] exceed 1, the value of the particulate P transport factor is set to 1. Thus, the dissolved and particulate P transport factors represent a percentage that cannot exceed 100% of the P source factor when calculating the final dissolved P Index and particulate P Index risk scores. The particulate P transport factor (Equation [8]) is similar to the dissolved P transport factor (Equation [7]) in that both include the same flooding frequency and flow distance to stream factors with the same weighting coefficients (note Tables 3 and 4). Thus, the same values determined for flooding frequency and flow distance in Table 3 are also used in Table 4 to determine the particulate P transport factor. 5.3 RUSLE Soil erosion is given consideration as a particulate P transport factor because it is the predominate mode for particulate P loss. The soil erosion rate for a field site must first be estimated with the Revised Universal Soil Loss Equation (RUSLE). RUSLE was developed to evaluate sheet and rill erosion for different types of agricultural cropping systems. RUSLE is an improved version of what was previously termed the Universal Soil Loss Equation (USLE) that was developed from field plot studies by Wischmeier and Smith (1978). Because of the complex interacting processes and data requirements of the USLE equation, Renard et al (1991), with input from many USDA-ARS and university scientists, developed RUSLE for computer applications. RUSLE is used to guide conservation planning, to inventory erosion rates over large areas, and to estimate sediment production on upland areas that might become sediment yield in watersheds. It can be used on cropland, pastureland, rangeland, disturbed forestland, construction sites, mined land, reclaimed land, landfills, military lands, and other areas where mineral soil is exposed to raindrop impact and surface overland flow produced by rainfall intensities that exceed infiltration rate. Version 2 of RUSLE estimates soil loss, sediment yield, and sediment characteristics from rill and interrill (sheet and rill) erosion caused by rainfall and its associated overland flow. RUSLE2 uses factors that represent the effects of climatic erosivity, soil erodibility, topography, cover-management, and support practices to compute erosion. The RUSLE2 database and its rules and procedures are used to describe a site-specific condition; once given a description, RUSLE2 estimates erosion. The software is available from http://fargo.nserl.purdue.edu/rusle2_dataweb/RUSLE2_Index.htm. For updates on RUSLE2 issues in New York State, be sure to visit the NRCS-NY electronic Field Office Technical Guide (eFOTG) at http://www.nrcs.usda.gov/technical/efotg/ and click on the map of NY State. In the RUSLE2 worksheet, the user enters the location, soil type, slope topography, and field management (crop rotation and tillage system). The program predicts soil loss and reports it on the screen as “Soil loss for conservation plan in ton/acre per year”. To calculate the P transport factor in the NY P Index, this predicted soil loss is multiplied by 0.1 as shown in Table 4 or Equation [8]. This adjustment is included in the NY P Index to take into account that a small amount of natural soil erosion is generally unavoidable. A 0.1 multiplier of 10 tons/acre soil loss

NY P Runoff Index - Documentation and User’s Manual. First Edition. 7/8/2003.
- 18 -
will result in a maximum value of 1. It should be noted that RUSLE2 calculates annual average soil loss in tons per acre over a rotation. Within a rotation, the erosion rate in any given year can be substantially higher, for example, the third year of corn in 3-year corn / 4-year hay rotation can be as large as 10 or 20 tons per acre. At the present time, it is difficult to obtain year by year erosion rates from the RUSLE2 software. Expect future versions of the P Index to consider year by year erosion rates when the estimates are readily available. 5.4 Concentrated Flow The determination of whether or not a concentrated flow path is present in the field should be made from field inspection. The current resolution of contour lines on topographic maps may not be sufficient to determine whether a concentrated flow path is present. Concentrated flow is somewhat loosely defined, but generally refers to situations where enough runoff water has come together within the field such that it flows as a small stream during rainfall events. This concentrated flow is thus sufficient to begin forming rill and gully types of erosion. A rill or gully which cannot be removed (i.e., smoothed out) during normal tillage operations is considered a concentrated flow for P Index purposes. Table 4 shows the weighting coefficient to add into Equation [8] when concentrated flow is present.
6. Using the Excel Spreadsheet Calculator In addition to being an integral component of Cornell Cropware (see section 8), the NY P Index exists on its own as an MS Excel® spreadsheet (Figure 1). The spreadsheet can be downloaded at : http://nmsp.css.cornell.edu/publications/pindex.asp. This spreadsheet was developed to help gain experience with the P Index on a field by field basis, independent of other factors used in developing a full nutrient management plan with Cornell Cropware. The following steps provide a guide to using the calculator. Once finished, you will have entered the data for Example 1 in Section 8. 6.1 Spreadsheet overview The spreadsheet shown in Figure 1 consists of six columns: the left-most column for outlining the necessary inputs and the resulting outputs and the remaining five columns for entering data from individual fields. Moving from top to bottom, the spreadsheet offers the input categories used to characterize the “Source Factor”, the “Dissolved P Transport Factor”, and the “Particulate P Transport Factor”, as explained in Sections 4 and 5. Below the inputs, the scores for the “Dissolved P Index” and the “Particulate P Index” are displayed, followed by the resulting “Management Recommendation”, as outlined in Table 1 of Section 3. The “Management Recommendation” is based on the higher of the two scores (dissolved and

NY P Runoff Index - Documentation and User’s Manual. First Edition. 7/8/2003.
- 19 -
particulate P Index scores). The remaining rows show the extent to which various management decisions and field characteristics influence the P Index score. This is useful when considering where management could be changed to reduce the final P Index score.
NYS P INDEX CALCULATOR Version 2 (May 1, 2003) The NY P Index was developed by the NY P Index Working Group.
This Excel spreadsheet was developed by Q.M. Ketterings, G. Albrecht, K. Ganoe and K. Czymmek.
SOURCE FACTOR Field 1 Field 2
Soil test P (Morgan P in lbs P/acre) 50 50 Fertilizer P application rate (lbs P2O5/acre) 10 20 Fertilizer P application timing May-August May-August Fertilizer P application method Injected or subsurface banded Injected or subsurface banded Organic P application #1 rate (lbs P2O5/acre) 100 40 Organic P application #1 timing May-August September-October
Organic P application #1 method Surface applied or broadcast/incorporated after 5 days
Surface applied on frozen, snow covered or saturated ground
Organic P application #2 rate (lbs P2O5/acre) 0 50 Organic P application #2 timing None applied February-April
Organic P application #2 method None applied Surface applied or
broadcast/incorporated after 5 days
DISSOLVED P TRANSPORT FACTOR Soil drainage class Moderately well drained Moderately well drained Flooding frequency Rare (>100 years) or never Rare (>100 years) or never Flow distance to blue line or equivalent (feet) 150 150 Stream type (blue line on topomap or equivalent) Intermittent - Dashed Blue Line Intermittent - Dashed Blue Line
PARTICULATE P TRANSPORT FACTOR Erosion (RUSLE in tons/acre) 2 2 Flooding frequency Rare (>100 years) or never Rare (>100 years) or never Flow distance to blue line or equivalent (feet) 150 150 Stream type (blue line on topomap or equivalent) Intermittent - Dashed Blue Line Intermittent - Dashed Blue Line Concentrated flow? No (not present) Yes (present)
51 67 DISSOLVED P INDEX Medium Medium
42 79 PARTICULATE P INDEX Low High
Management Recommendation N based management with BMPs P application not to exceed crop removal
TOTAL SOURCE SCORE 87 115 Soil test P contribution 63 63 Fertilizer P contribution 1 2 Organic P contribution 24 51
TOTAL DISSOLVED TRANSPORT SCORE 0.6 0.6 Flow distance contribution 0.3 0.3
TOTAL PARTICULATE TRANSPORT SCORE 0.5 0.7 Erosion contribution 0.2 0.2 Flow distance contribution 0.3 0.3 Concentrated flow contribution 0.0 0.2
Figure 1 : P Index calculator ( http://nmsp.css.cornell.edu/publications/pindex.asp).

NY P Runoff Index - Documentation and User’s Manual. First Edition. 7/8/2003.
- 20 -
6.2 Entering data The data entry cells are shaded orange, indicating that all other cells are populated with calculated values. With the spreadsheet open, try entering the following data for Example 1 in Section 7. Source Factor
Soil test P (Morgan P in lbs P/acre) 10 Fertilizer P application rate (lbs P2O5/acre) 20 Fertilizer P application timing May-August Fertilizer P application method Injected or subsurface banded
The soil test P data must be from the Cornell Nutrient Analysis Laboratory (CNAL). If you have soil test results from Brookside Laboratories Inc., Spectrum Analytic Inc., A&L Eastern Laboratories Inc., A&L Canada Laboratories Inc. or the laboratory of the University of Vermont, you must first convert these into a Cornell Morgan P equivalent using the soil test conversion equations found on the Nutrient Management Spear Program website (http://nmsp.css.cornell.edu). The Mehlich-III soil test extracts significantly more P than the Morgan soil test. Because of this, failure to convert Mehlich-III data to a Cornell Morgan equivalent will result in a much higher P Index score. The fertilizer P application rate can be calculated by multiplying the % P2O5 of the fertilizer (i.e., use the middle number of the N-P2O5-K2O fertilizer composition) with the pounds of fertilizer material applied per acre. For instance, applying 200 lbs/acre of 20-10-10 fertilizer would apply 20 lbs P2O5/acre (200 lbs fertilizer applied/acre x 0.10). Continuing with the organic P applications, you will notice that the P Index allows you to characterize two applications of organic P (e.g., P in manure) per year. This allows you to more accurately describe management within the P Index. For instance, if a farm topdresses manure in the fall and then layers a second application in the spring with incorporation in 1-2 days, each application should be characterized according to its actual rate, timing, and method. In Example 1, a single application is characterized, so the second organic P application entries will remain empty (see Example 4 in Section 7 for a field receiving two manure applications per year). The organic P inputs for Example 1 begin with the organic P application rate in lbs P2O5/acre. To calculate this value, one must multiply the manure application rate (i.e., tons/acre or gallons/acre) with the manure analysis (i.e., lbs P2O5/ton or lbs P2O5/1000 gallons, respectively2). In the first scenario, the application rate is calculated as follows:
(25 tons manure applied/acre) x (5 lbs P2O5/ton) = 125 lbs P2O5/acre
2 Some manure testing laboratories provide P and P2O5 values. Be sure to use P2O5 and not P if the laboratory supplies both numbers. If the testing lab supplies P only, multiply by 2.3 to convert to P2O5. For example: if the manure test is 1 lbs P per 1,000 gallons, this equals 1*2.3=2.3 lbs of P2O5 per 1,000 gallons.

NY P Runoff Index - Documentation and User’s Manual. First Edition. 7/8/2003.
- 21 -
NYS P INDEX CALCULATOR Version 2 (May 1, 2003) The NY P Index was developed by the NY P Index Working Group.
Table 1: Fertilizer/Organic P application timing. February-April 1.0 May-August 0.4 None applied 0.0 November-January 0.9 September-October 0.7 Table 2: Fertilizer and Organic P application method. Broadcast + incorporated in 1-2 days 0.4 Broadcast + incorporated in 3-5 days 0.6 Injected or subsurface banded 0.2 None applied 0 Surface applied on frozen or snow covered or saturated ground 1 Surface applied or broadcast/incorporated after 5 days 0.8 Table 3: Soil Drainage Class. Moderately well drained 0.3 Poorly or very poorly drained 1 Somewhat poorly drained 0.7 Well/excessively well drained 0.1 Table 4: Flooding Frequency. Frequent (<10 years frequency) 1 Occasional (once in 10-100 years) 0.2 Rare (>100 years) or never 0 Table 5: Topomap Blue Line Stream Type. Intermittent - Dashed Blue Line 1 Perennial - Solid Blue Line 2 Table 6: Concentrated Flow? No 0 Yes 0.2
Figure 2: NY P Index Lookup Table.
Using the spreadsheet calculator, enter the following inputs for organic P application: Source Factor (Continued)
Organic P application #1 rate (lbs P2O5/acre) 125 Organic P application #1 timing February-April
Organic P application #1 method Surface applied on frozen, snow covered or saturated ground
Organic P application #2 rate (lbs P2O5/acre) 0 Organic P application #2 timing None applied Organic P application #2 method None applied
Continue by entering the inputs for the transport factors. You will notice that the flooding frequency, flow distance, and stream type for the particulate P transport factor are carried over from the inputs for the dissolved P transport factors to reduce data entry effort.

NY P Runoff Index - Documentation and User’s Manual. First Edition. 7/8/2003.
- 22 -
Dissolved P Transport Factor Soil drainage class Somewhat poorly drained Flooding frequency Rare (>100 years) or never Flow distance to blue line or equivalent (feet) 0 Stream type (blue line on topomap or equivalent) Intermittent - Dashed Blue Line
Particulate P Transport Factor
Erosion (RUSLE in tons/acre) 2 Flooding frequency Rare (>100 years) or never Flow distance to blue line or equivalent (feet) 0 Stream type (blue line on topomap or equivalent) Intermittent - Dashed Blue Line Concentrated flow? No (not present)
Now that you have a feel for entering data and maneuvering around the spreadsheet, continue to Section 7 to gain experience with the impact that management changes can have on P Index scores across a number of scenarios relevant to New York State.
7. Examples and Management Alternatives Many of the inputs needed to derive the NY P Index for a field can be obtained in the office either from published documents such as soil surveys and topographic maps or from farm records and plans (see Box 6). Runoff flow direction can be estimated in the office using topographic maps and confirmed in the field. Topographic maps portray intermittent and perennial “blue line” streams, again requiring field confirmation. Soil conservation plans show planned or existing water management structures that may be more or less obvious in the field depending on the time of year visited. Each of these resources can provide important clues as to what can be expected in the field. Although reviewing soil maps, topographic maps, and soil conservation plans can provide an initial assessment of the inputs needed, an accurate estimate of the NY P Index cannot be obtained from the office only. Field verification of map-derived inputs is needed. Such verification can be done when visiting fields to collect soil samples or RUSLE data. The most challenging aspect of the NY P Index relates to the estimation of flow path and distance. Flow path is the direction that surface runoff water takes upon exiting the downslope area(s) of the field. Since water may flow out of a field in 2 or 3 distinctly different directions, planners must identify the general area where the largest portion of the surface runoff water leaves the field. Once the predominant flow direction is identified, the evaluation is completed by measuring the length of the path the water must travel to reach the first intermittent or perennial waterbody it comes to; this is called the flow distance. The flow distance may be

NY P Runoff Index - Documentation and User’s Manual. First Edition. 7/8/2003.
- 23 -
estimated by pacing, using a viewfinder, or other reasonably accurate methods. Scaling from the office needs to be confirmed by a field measurement. If runoff is discharged from two areas of
similar size, the area more sensitive from a water quality standpoint should be evaluated. Because the flow path, concentrated flow, and intermittent stream concepts are difficult to assess in practice, serious P Index users are strongly encouraged to attend a P Index field walk session. A session can be arranged by contacting Karl Czymmek, senior extension associate with ProDairy, at [email protected]. The examples in this section look at fields in various representative landscapes around New York State. Unusual situations will be encountered from time to time. For example, some fields will have a soil test P level so high that no changes in management will reduce the score enough to accommodate additional manure spreading. In those situations, a crop response to addition of P is highly unlikely and additional manure and/or fertilizer P applications are very difficult to justify. In other situations, contour or other ditches may discharge into woodland and the water disperses without an obvious connection with a natural stream. In those situations, because of the dispersion, a maximum flow distance (>300 feet) can be recorded for the field being evaluated.
Planners must keep in mind that changes made to practices applied to individual fields may have significant additive impact across the farm. For example, if a farm has limited resources available for storing and incorporating manure, the planner cannot reasonably expect that substantial quantities of spring applied manure on corn ground will be incorporated. Example 1: Scenario 1 (Photo 1) represents relatively flat, generally less well drained landscapes that were formed beneath shallow lakes and largely consist of relatively fine sediments with silty clay loam or clay loam textures. Natural streams and numerous man-made ditches bisect the landscape and many agricultural fields are intensively tile drained to achieve optimum crop production. Erosion is generally low but there can be considerable runoff during peak periods, especially early in the spring following snow melt. This type of landscape can be found in the St Lawrence, Champlain, Hudson, Erie and Ontario Basins.
Box 6: NY P Index Checklist: Office related:
• Soil test for each field or management unit (less than 3 years old).
• Expected fertilizer P2O5 rate, timing of application and method of application.
• Expected manure P2O5 rate, timing of application and method of application.
• RUSLE “A” factor (actual erosion estimate).
• Drainage class and flooding frequency for the predominant soil type from the Soil Survey.
• Topographic maps for stream evaluation and general flow path / direction.
Field related:
• Collect soil tests and/or RUSLE data if not available
• Identify presence or absence of concentrated flows within the field
• Identify flow path and distance from edge of field to first intermittent or perennial stream
• This field visit can also be used to identify hydrologically sensitive areas, proximate well locations and any manure spreading setback requirements necessary to meet the basic elements of the NRCS nutrient management standard

NY P Runoff Index - Documentation and User’s Manual. First Edition. 7/8/2003.
- 24 -
This example consists of a somewhat poorly drained Rhinebeck soil that is in a corn silage/intensive grass rotation. While there is often some ponded water in spring, the field rarely floods and erosion is estimated at 2 tons per acre average across the rotation. The down-slope edge of the field is bordered by a drainage ditch that runs several months during the year and most runoff water from the field drains toward this ditch. The soil is classified as high in phosphorus with a Cornell soil test of 10 lbs Morgan extractable P/acre. The producer intends to apply 20 lbs P2O5 as banded starter fertilizer in May in addition to a surface application of 125 lbs of P2O5 from manure on frozen soil during February.
The NY P Index spreadsheet calculates both the dissolved and particulate P Index scores as 108 (Figure 3). This classifies the field as “Very High” for its risk of P runoff. Since both scores must be below 100 in order for the field to receive manure, some changes in intended practices must be made. The quickest way to identify what factors are the greatest contributors to P runoff risk is to look at the contributions of the source and the transport functions listed underneath the P Index scores and management recommendation in the spreadsheet. For this particular example, we calculated a total source score of 108. The soil test P contribution was 13, the fertilizer P contribution was 2 and the organic P contribution was 94. It is obvious from these scores that the greatest reductions in P Index score are expected with changes in manure management. What are the options? The initial scenario was to apply 125 lbs P2O5 from manure during February on, in all likelihood, frozen soil. From a runoff standpoint, February through April is considered the most risky time of the year for manure application, so one option is to change the time of application. By shifting the time of spreading to November, the scores for both dissolved and particulate P drop from 108 (very high) to 82 (high). The score is reduced for two reasons: (1) November timing of manure application poses a somewhat lower risk; and (2) the soil is less likely to be frozen, so the broadcast method also poses a somewhat lower runoff risk. However, a score of 82 still means that P applications are limited to P crop removal (Figure 3). The corn silage yield potential of a tile drained Rhinebeck soil is around 20 tons/acre (35% dry matter) and this crop is expected to remove about 86 lbs of P2O5 (see appendix A for crop removal estimates). Thus, with a score of 82, the manure application needs to be reduced to no more than 86 lbs of P2O5. However, more can be done to reduce the P Index of this site without having to reduce the manure application.
Photo 1: St Lawrence River Valley landscape.

NY P Runoff Index - Documentation and User’s Manual. First Edition. 7/8/2003.
- 25 -
NYS P INDEX CALCULATOR Version 2 (May 1, 2003) The NY P Index was developed by the NY P Index Working Group.
SOURCE FACTOR Example 1 Alternative 1a Alternative 1b
Soil test P (Morgan P in lbs P/acre) 10 10 10 Fertilizer P application rate (lbs P2O5/acre) 20 20 20 Fertilizer P application timing May-August May-August May-August
Fertilizer P application method Injected or subsurface banded
Injected or subsurface banded
Injected or subsurface banded
Organic P application #1 rate (lbs P2O5/acre) 125 125 125 Organic P application #1 timing February-April November-January November-January
Organic P application #1 method Surface applied on
frozen, snow covered or saturated ground
Surface applied or broadcast/incorporated
after 5 days
Surface applied or broadcast/incorporated
after 5 days Organic P application #2 rate (lbs P2O5/acre) 0 0 0 Organic P application #2 timing None applied None applied None applied Organic P application #2 method None applied None applied None applied
DISSOLVED P TRANSPORT FACTOR
Soil drainage class Somewhat poorly
drained Somewhat poorly
drained Somewhat poorly
drained
Flooding frequency Rare (>100 years) or
never Rare (>100 years) or
never Rare (>100 years) or
never Flow distance to blue line or equivalent (feet) 0 0 175
Stream type (blue line on topomap or equivalent) Intermittent - Dashed
Blue Line Intermittent - Dashed
Blue Line Intermittent - Dashed
Blue Line PARTICULATE P TRANSPORT FACTOR
Erosion (RUSLE in tons/acre) 2 2 2
Flooding frequency Rare (>100 years) or
never Rare (>100 years) or
never Rare (>100 years) or
never Flow distance to blue line or equivalent (feet) 0 0 175
Stream type (blue line on topomap or equivalent) Intermittent - Dashed
Blue Line Intermittent - Dashed
Blue Line Intermittent - Dashed
Blue Line Concentrated flow? No (not present) No (not present) No (not present)
108 82 69 DISSOLVED P INDEX Very High High Medium
108 82 28 PARTICULATE P INDEX Very High High Low
Management Recommendation No fertilizer P2O5 or manure applications
P application not to exceed crop removal
N based management with BMPs
TOTAL SOURCE SCORE 108 82 82 Soil test P contribution 13 13 13 Fertilizer P contribution 2 2 2 Organic P contribution 94 68 68
TOTAL DISSOLVED TRANSPORT SCORE 1.0 1.0 0.8 Flow distance contribution 1.0 1.0 0.1
TOTAL PARTICULATE TRANSPORT SCORE 1.0 1.0 0.3 Erosion contribution 0.2 0.2 0.2 Flow distance contribution 1.0 1.0 0.1 Concentrated flow contribution 0.0 0.0 0.0
Figure 3: Original scenario for a somewhat poorly drained field in Northern NY and acceptable alternatives including a change in time of application of manure from February-April to November (Alternative 1a) and establishing a spreading setback of 175 feet (Alternative 1b). Figure 3 shows that the dissolved and the particulate transport factors are both 1.0. Looking at the flow distance contribution, it becomes obvious that under the proposed scenarios flow

NY P Runoff Index - Documentation and User’s Manual. First Edition. 7/8/2003.
- 26 -
distance alone causes maximum transport risk. Although reducing erosion and eliminating concentrated flows in the field are always good practices, those practices will not reduce the risk for P loss from this field nearly as much as increasing the flow distance by implementing a manure spreading setback. If a manure spreading setback of 175 feet from the edge of the ditch is established, the scores for this field drop from 82 to 69 (Medium) for the dissolved P Index and to 28 (Low) for the particulate P Index (Figure 3). Thus, a 175 foot setback would allow for a manure application rate of 125 lbs/acre P2O5 in November if the soil is not expected to be frozen. Of course, reducing the manure rate to no more than crop removal is always recommended for fields that are classified as high or very high in soil test P. Example 2: Our second example represents the rolling to hilly, generally well-drained terrain of Central New
York State found in the Finger Lakes Region (Photo 2), along the NYS Thruway and through the Mohawk River Valley. The loam and silt loam soils are derived from glacial till and are medium to high in lime content. Fast-moving streams have formed deep cuts in some parts of the landscape. Ditches remove excess water mainly in spring and fall and are found in the low areas for the purpose of draining small pockets of less well-drained soil; tile patterns are usually random. Concentrated flows are evident, especially in steeper parts of the landscape.
For this example consider a well-drained Honeoye soil in a corn silage/alfalfa grass hay rotation. The Cornell Morgan soil test of 43 lbs P/acre rates as Very High based upon Cornell Guidelines. The producer plans to apply 10 lbs P2O5/acre in the banded starter fertilizer blend in May. He expects to surface apply 150 lbs P2O5/acre as manure in late winter, a rate designed to meet the N requirements of the subsequent corn crop. The silage yield potential of a Honeoye soil is estimated at 23 tons/acre (35% dry matter) which corresponds with a removal rate of approximately 100 lbs of P2O5. The majority of runoff flows toward a shallow, vegetated road ditch that runs 75 feet before reaching an intermittent stream. The field does not flood, there are no concentrated flow areas that require treatment and RUSLE is estimated at 3 tons per acre. Under these conditions, the field scores 136 for the dissolved P Index and 167 for the particulate P Index. Both indices are very high, indicating that management changes are required if manure is to be applied. One possibility is to implement a manure spreading setback of 100 feet along the road ditch, which receives most of the runoff. This reduces the dissolved P score to 41 (Low) and the particulate P score to 74 (Medium), allowing for winter spreading at the intended rate of 150 lbs P2O5/acre.
Photo 2: Rolling glacial till soils of the Finger Lakes Region represented in example 2.

NY P Runoff Index - Documentation and User’s Manual. First Edition. 7/8/2003.
- 27 -
NYS P INDEX CALCULATOR Version 2 (May 1, 2003) The NY P Index was developed by the NY P Index Working Group.
SOURCE FACTOR Example 2 Alternative 2a Alternative 2b
Soil test P (Morgan P in lbs P/acre) 43 43 43 Fertilizer P application rate (lbs P2O5/acre) 10 10 10 Fertilizer P application timing May-August May-August May-August
Fertilizer P application method Injected or subsurface banded
Injected or subsurface banded
Injected or subsurface banded
Organic P application #1 rate (lbs P2O5/acre) 150 150 150 Organic P application #1 timing February-April February-April May-August
Organic P application #1 method Surface applied on
frozen, snow covered or saturated ground
Surface applied on frozen, snow covered or saturated ground
Injected or subsurface banded
Organic P application #2 rate (lbs P2O5/acre) 0 0 0 Organic P application #2 timing None applied None applied None applied Organic P application #2 method None applied None applied None applied
DISSOLVED P TRANSPORT FACTOR
Soil drainage class Well/excessively well
drained Well/excessively well
drained Well/excessively well
drained
Flooding frequency Rare (>100 years) or
never Rare (>100 years) or
never Rare (>100 years) or
never Flow distance to blue line or equivalent (feet) 75 175 75
Stream type (blue line on topomap or equivalent) Intermittent - Dashed
Blue Line Intermittent - Dashed
Blue Line Intermittent - Dashed
Blue Line PARTICULATE P TRANSPORT FACTOR
Erosion (RUSLE in tons/acre) 3 3 3
Flooding frequency Rare (>100 years) or
never Rare (>100 years) or
never Rare (>100 years) or
never Flow distance to blue line or equivalent (feet) 75 175 75
Stream type (blue line on topomap or equivalent) Intermittent - Dashed
Blue Line Intermittent - Dashed
Blue Line Intermittent - Dashed
Blue Line Concentrated flow? No (not present) No (not present) No (not present)
136 41 52 DISSOLVED P INDEX Very High Low Medium
167 74 64 PARTICULATE P INDEX Very High Medium Medium
Management Recommendation No fertilizer P2O5 or manure applications
N based management with BMPs
N based management with BMPs
TOTAL SOURCE SCORE 167 167 64 Soil test P contribution 54 54 54 Fertilizer P contribution 1 1 1 Organic P contribution 113 113 9
TOTAL DISSOLVED TRANSPORT SCORE 0.8 0.2 0.8 Flow distance contribution 0.7 0.1 0.7
TOTAL PARTICULATE TRANSPORT SCORE 1.0 0.4 1.0 Erosion contribution 0.3 0.3 0.3 Flow distance contribution 0.7 0.1 0.7 Concentrated flow contribution 0.0 0.0 0.0
Figure 4: P Index scores for Example 2, a rolling to hilly, well-drained terrain of Central New York. A drastic reduction in P Index is obtained by implementing a spreading setback of 100 feet from the edge of the field (Alternative 2a). A similar reduction can be obtained by injecting manure in May instead of a surface application in March (Alternative 2b). A similar result can be achieved (without a manure spreading setback) by changing the time of application to spring (May) and injecting the manure. In this case the scores become 52 and 64

NY P Runoff Index - Documentation and User’s Manual. First Edition. 7/8/2003.
- 28 -
(both Medium) for the dissolved and the particulate P Index, respectively, which again allows for management according to nitrogen needs of the crop. However, since approximately 65% of the inorganic (NH4-N) is now expected to be available to the corn crop due to incorporation in the spring, the total application rate of manure will need to be reduced to avoid over-application (and hence potential leaching) of nitrogen. Another option for reducing the P Index scores is to frost-till in late winter or early spring, if conditions are appropriate. If manure is applied at the rate of 100 lbs P2O5/acre by frost injection between early February and the end of April, no setback is necessary as the P Index scores become 57 and 70 for the dissolved and the particulate P Index, respectively. Field strips, an additional option, present a simple mechanism for instituting manure spreading setbacks. As the strips proceed up the hill, the width of each strip typically increases the flow distance, reducing the P Index score correspondingly. Planners may elect to change manure timing and method of application on one or two strips with the shortest flow distance to water while being less restrictive with the upper strips. Example 3: The third scenario represents the acidic, upland glacial till soils found in much of the Southern Tier and portions of Eastern New York (Photo 3). The upland areas in this landscape are typically bisected by fast flowing streams that have formed gullies. Soils can be well or moderately well drained silt loam textures, but considerable portions of the landscape consist of somewhat poorly drained silt loam soils with fragipans. Contour diversion ditches are often necessary to manage water as well as soil erosion, and tile drainage is usually randomly patterned. Concentrated flow areas exist throughout the landscape and many have been treated with grass waterways. In this example, the field is predominantly moderately well-drained Mardin soil in a corn
silage/alfalfa grass rotation. The soil test is 20 lbs P/acre (Cornell Morgan extraction) and the producer plans to band 20 lbs P2O5/acre with starter fertilizer and to surface apply 100 lbs P2O5/acre as manure during the February-April period. The field is not prone to flooding and the soil erosion rate is estimated at 3 tons/acre. Concentrated flows are present and runoff predominantly flows to a shallow diversion ditch that travels 25 feet from the edge of the field to a seasonal stream. Under this set of conditions, the field scores 102 (very high) on both the dissolved and particulate P indices (Figure 5).
Photo 3: Upland areas of the Southern Tier and Eastern New York represented in Example 3 .

NY P Runoff Index - Documentation and User’s Manual. First Edition. 7/8/2003.
- 29 -
NYS P INDEX CALCULATOR Version 2 (May 1, 2003) The NY P Index was developed by the NY P Index Working Group.
SOURCE FACTOR Example 3 Alternative 3a Alternative 3b
Soil test P (Morgan P in lbs P/acre) 20 20 20 Fertilizer P application rate (lbs P2O5/acre) 20 20 20 Fertilizer P application timing May-August May-August May-August
Fertilizer P application method Injected or subsurface banded
Injected or subsurface banded
Injected or subsurface banded
Organic P application #1 rate (lbs P2O5/acre) 100 40 40 Organic P application #1 timing February-April February-April February-April
Organic P application #1 method Surface applied on
frozen, snow covered or saturated ground
Surface applied on frozen, snow covered or saturated ground
Surface applied on frozen, snow covered or saturated ground
Organic P application #2 rate (lbs P2O5/acre) 0 60 60 Organic P application #2 timing None applied September-October September-October
Organic P application #2 method None applied Surface applied or
broadcast/incorporated after 5 days
Surface applied or broadcast/incorporated
after 5 days DISSOLVED P TRANSPORT FACTOR
Soil drainage class Moderately well
drained Moderately well
drained Moderately well
drained
Flooding frequency Rare (>100 years) or
never Rare (>100 years) or
never Rare (>100 years) or
never Flow distance to blue line or equivalent (feet) 25 25 200
Stream type (blue line on topomap or equivalent) Perennial - Solid Blue
Line Perennial - Solid Blue
Line Perennial - Solid Blue
Line PARTICULATE P TRANSPORT FACTOR
Erosion (RUSLE in tons/acre) 3 3 3
Flooding frequency Rare (>100 years) or
never Rare (>100 years) or
never Rare (>100 years) or
never Flow distance to blue line or equivalent (feet) 25 25 200
Stream type (blue line on topomap or equivalent) Perennial - Solid Blue
Line Perennial - Solid Blue
Line Perennial - Solid Blue
Line Concentrated flow? Yes (present) Yes (present) Yes (present)
102 82 57 DISSOLVED P INDEX Very High High Medium
102 82 74 PARTICULATE P INDEX Very High High Medium
Management Recommendation No fertilizer P2O5 or manure applications
P application not to exceed crop
removal
N based management with
BMPs TOTAL SOURCE SCORE 102 82 82
Soil test P contribution 25 25 25 Fertilizer P contribution 2 2 2 Organic P contribution 75 55 55
TOTAL DISSOLVED TRANSPORT SCORE 1.0 1.0 0.7 Flow distance contribution 1.0 1.0 0.4
TOTAL PARTICULATE TRANSPORT SCORE 1.0 1.0 0.9 Erosion contribution 0.3 0.3 0.3 Flow distance contribution 1.0 1.0 0.4 Concentrated flow contribution 0.2 0.2 0.2
Figure 5: P indices for Example 3. A drastic reduction in P Index is obtained with a shift in timing of application from spreading on frozen soil in February-April to surface application in September-October (Alternative 3a). A similar reduction can be obtained with a total manure P reduction to 85 lbs P2O5/acre and a setback of 175 feet (Alternative 3b).

NY P Runoff Index - Documentation and User’s Manual. First Edition. 7/8/2003.
- 30 -
Assuming this operation has other fields that can receive winter-spread manure, shifting 60% of the planned application to an early fall period (September/October) is enough to reduce both P Index scores to 82 (High). Scores of 57 and 74 (Medium) for the dissolved and particulate P indices, respectively, can be achieved by also implementing a spreading setback from the edge of the field of 175 feet (making the total flow distance 200 feet). Example 4:
This example represents the glacial outwash and alluvial soils characteristic of Southern Tier valleys, the Cortland Valley being a prime example (Photo 4). These soils formed from coarse sediments, gravel and often cobblestone as glacial melt-water dispersed, or from somewhat less coarse deposits of river-carried sediment. Either way, this landscape tends to be well- to excessively well-drained. Some of the alluvial soils continue to be prone to flooding. Tile drainage is rarely needed and in many cases road ditches are shallow or non-existent because the soil is so well drained. The field in this example is bordered by a perennial stream. It is somewhat undulating and
consists of the well-drained Palmyra soil. As is often the case in this landscape, the undulations generally run parallel to the stream rather than directly to it. The Cornell Morgan soil test is 64 lbs P/acre and the producer plans to use a starter fertilizer consisting of nitrogen only. Manure will be spread dai ly throughout the winter, approximately 60 lbs of P2O5 equivalent from December through January, and an additional 80 lbs P2O5 equivalent from
February through April. This field does not flood, does not have concentrated flows significant enough to treat, and RUSLE erosion is 3 tons/acre. Because the undulations mainly flow to the next field down slope before reaching the perennial stream, the flow distance is 225 feet. Under these conditions, the New York P Index scores are 69 (Medium) for the dissolved P Index and 103 (Very High) for the particulate P Index. Once again, the particulate P Index must be reduced if the field is to receive manure. One way to do this is to shift manure intended for February-April into early May and incorporate within 1-2 days. This reduces the dissolved P Index to 49 (Low) and the particulate P Index to 73 (Medium). Many farms have short-term storage and can save up enough manure to cover a field or two during the spring planting season.
Photo 4: Glacial outwash and alluvial soils, like the Cortland Valley, represented in example 4.

NY P Runoff Index - Documentation and User’s Manual. First Edition. 7/8/2003.
- 31 -
NYS P INDEX CALCULATOR Version 2 (May 1, 2003)
The NY P Index was developed by the NY P Index Working Group. SOURCE FACTOR Example 4 Alternative 4a
Soil test P (Morgan P in lbs P/acre) 64 64 Fertilizer P application rate (lbs P2O5/acre) 0 0 Fertilizer P application timing None applied None applied Fertilizer P application method None applied None applied Organic P application #1 rate (lbs P2O5/acre) 60 60 Organic P application #1 timing November-January November-January
Organic P application #1 method Surface applied or
broadcast/incorporated after 5 days
Surface applied or broadcast/incorporated after 5
days Organic P application #2 rate (lbs P2O5/acre) 80 80 Organic P application #2 timing February-April May-August
Organic P application #2 method Surface applied on frozen or snow covered or saturated ground
Broadcast + incorporated in 1-2 days
DISSOLVED P TRANSPORT FACTOR Soil drainage class Well/excessively well drained Well/excessively well drained Flooding frequency Rare (>100 years) or never Rare (>100 years) or never Flow distance to blue line or equivalent (feet) 225 225 Stream type (blue line on topomap or equivalent) Perennial - Solid Blue Line Perennial - Solid Blue Line
PARTICULATE P TRANSPORT FACTOR Erosion (RUSLE in tons/acre) 3 3 Flooding frequency Rare (>100 years) or never Rare (>100 years) or never Flow distance to blue line or equivalent (feet) 225 225 Stream type (blue line on topomap or equivalent) Perennial - Solid Blue Line Perennial - Solid Blue Line Concentrated flow? No (not present) No (not present)
69 49 DISSOLVED P INDEX Medium Low
103 73 PARTICULATE P INDEX Very High Medium
Management Recommendation No fertilizer P2O5 or manure applications
N based management with BMPs
TOTAL SOURCE SCORE 172 122 Soil test P contribution 80 80 Fertilizer P contribution 0 0 Organic P contribution 92 42
TOTAL DISSOLVED TRANSPORT SCORE 0.4 0.4 Flow distance contribution 0.3 0.3
TOTAL PARTICULATE TRANSPORT SCORE 0.6 0.6 Erosion contribution 0.3 0.3 Flow distance contribution 0.3 0.3 Concentrated flow contribution 0.0 0.0
Figure 6: New York P Index for Example 4, glacial outwash and alluvial soils and landscapes characteristic of Southern Tier valleys. One way to reduce the P Index scores is to shift manure intended for February-April into early May and incorporate within 1-2 days (Alternative 4a).

NY P Runoff Index - Documentation and User’s Manual. First Edition. 7/8/2003.
- 32 -
8. Using Cornell Cropware to Calculate the NY P Index
Cornell Cropware3 is a software tool for developing nutrient management plans consistent with the Natural Resources Conservation Service Nutrient Management Standard (NRCS-NY 590). In doing so, it integrates the NY P Index with the Nitrate Leaching Index, soil test conversion equations, Cornell crop nutrient guidelines, and on-farm logistics of manure, fertilizer, and crop management. This integration of tools in Cropware, allows users to consider all of a farm’s fields and all of its manure sources when deciding which fields are best suited to receive manure and/or fertilizer for healthy crops and a clean environment. The steps for developing a nutrient management plan with Cropware are outlined in Figure 7, below.
Figure 7: Diagram of the basic process of nutrient management planning with Cropware. 3 Cornell Cropware can be downloaded from the Nutrient Management Spear Program website (http://nmsp.css.cornell.edu/)
Cropware Nutrient Management Planning Flow
Allocate Manure and Fertilizer to Fields
Characterize Manure-Based
Nutrient Sources
Characterize Field-Based
Nutrient Factors
Characterize Landscape
Features
Characterize Crop
Rotations
Calculate Crop Nutrient Requirements
If No
Met crop nutrient guidelines? Minimal nutrient loss risk? Utilized all manure on farm? Feasible?
Publish and Deliver Plan
Implement Plan
Record Implementation
Evaluate
Calculate Nutrient
Loss Risks
Calculate Manure
Inventories
Calculate Nutrient
Balances
If OK
2
3
1
4

NY P Runoff Index - Documentation and User’s Manual. First Edition. 7/8/2003.
- 33 -
Considering the flow from the top, the planner must first characterize the manure sources and fields (Step 1). Based on this information, Cropware will calculate crop nutrient requirements for the plan year. Next, the planner will consider the crop nutrient requirements, NY P Index, N Leaching Index, manure inventories, and other on-farm logistics to initially allocate manure and fertilizer across the fields (Step 2). Cropware will calculate nutrient balances and P Index scores per field, as well as manure inventories for all sources. Based on such calculations, the planner may need to re-allocate manure and/or fertilizer to fields to better satisfy the questions posed in Step 3. Specific to the P Index, this step can be used to reduce the P Index scores by changing management relative to the first run-through as discussed in section 7. Such management changes could include: § Modifications in the timing, rate, and/or method of manure and fertilizer applications. § Increases in flow distance through the use of no spreading buffers. § Reductions in the RUSLE predicted soil loss through changes in crop rotation
management. § Adoption of best management practices to address concentrated flows.
Once satisfied with the revisions, the planner is set to create reports and deliver the plan to their client for review and implementation (Step 4). Let’s step through this process in Cropware, focusing on the P Index. To gain a better understanding of the full, comprehensive use of Cropware, consult the Help section of Cropware. 8.1 Characterizing the farm Before planning manure and fertilizer applications according to the NY P Index, N Leaching Index, crop nutrient guidelines, and so on, the planner must characterize the manure sources and the fields (Step 1). Manure: Within Cropware, the Manure screen (Figure 8) is used to define the quantity of manure available for application, the nutrient analyses of the manures, and the storage capacity for each manure source. Such information is used in determining the organic P contribution to the P Index. Manure quantities can be entered within the “Manure Source Data” tab, directly from records, using the “Estimate Using Farm Records” option; from a description of the herd, using the “Estimate Using Animal Parameters” option; or by entering the number of spreader loads, using the “Estimate Using Number and Average Weight of Manure Applications” option. Manure analyses for each manure source can be entered on the “Manure Analysis” tab, shown in Figure 9, and finally, the manure storage capacity can be calculated using the “Manure Storage” tab, shown in Figure 10. A farm’s manure storage capacity can influence the timing of manure applications, thereby making it an important practical consideration in planning with the P Index.

NY P Runoff Index - Documentation and User’s Manual. First Edition. 7/8/2003.
- 34 -
Figure 8: The Manure Source Data tab within the Manure screen in Cropware helps the user determine the amount of manure available for application.
Figure 9: The Manure Analysis tab enables the user to input manure analysis results.

NY P Runoff Index - Documentation and User’s Manual. First Edition. 7/8/2003.
- 35 -
Figure 10: The Manure Storage tab assists the user in estimating manure storage capacities.
Fields: The Fields screen in Cropware (Figure 11) organizes the basic inputs used to characterize a farm’s fields.
Figure 11: The Fields screen in Cornell Cropware enables the user to characterize each field. The “Field Data” tab captures basic background information about a field.

NY P Runoff Index - Documentation and User’s Manual. First Edition. 7/8/2003.
- 36 -
Seven tabs are used to characterize each field. On the “Field Data” tab shown above (Figure 11), the “Soil Name” is used to set default “Soil Drainage” and “Flooding Frequency” inputs for the Transport factors. The resulting default “Soil Drainage” and “Flooding Frequency” inputs can be changed, if necessary, on the “PI Factors” tab.
Figure 12: The Soil Test tab captures soil analysis results.
Figure 13: The Crop Data tab allows the user to characterize the crop rotation.

NY P Runoff Index - Documentation and User’s Manual. First Edition. 7/8/2003.
- 37 -
Soil Test information is entered on the “Soil Test” tab (Figure 12). If the soil analysis was performed by the Cornell Nutrient Analysis Lab (CNAL), then the soil test phosphorus value (lbs P/acre) can be directly entered into the “P (Required)” cell. If another soil test laboratory is used, then other inputs, specifically Al, Ca and pH, are required in order to convert the analyses into CNAL Morgan extraction equivalents (See section 4.1). The “Crop Data” tab (Figure 13) is used to define the crop rotation. This information is critical to the planner, because it aids in defining the crop nutrient guidelines and thereby influences the application of manure and fertilizer nutrients.
Figure 14: The Manure Use tab enables the user to characterize up to two separate manure application events per field.
The “Manure Use” tab (Figure 14) is used to characterize the manure applications for the upcoming plan year in terms of source, timing, and method of application. The manure source, test and rate may also be selected on the Allocation screen (Figure 18), where the user has more information about other fields and manure sources in view. Regarding manure application timing and method, the default settings are “Feb-Apr” and “Top Dress/Incorp. After 5 Days”. If you have information that is contrary to the default settings at this step in the planning process, then change the default settings. Otherwise, maintain the default settings for timing and method, because they represent a higher risk management and thereby establish a conservative base from which to plan. For example, if after planning initial manure and fertilizer applications on the Allocation screen, one finds that a field’s P Index score is High or Very High, then a potentially simple, risk reducing management change could be to switch the timing and/or method to a setting less prone to P loss. This will be discussed in greater detail in Section 8.3.

NY P Runoff Index - Documentation and User’s Manual. First Edition. 7/8/2003.
- 38 -
Figure 15: The Past Manure Use tab helps the user enter information about manure applications from the past two years.
Figure 16: The Fertilizers tab captures information about up to four fertilizer applications per field.

NY P Runoff Index - Documentation and User’s Manual. First Edition. 7/8/2003.
- 39 -
The “Past Manure Use” tab (Figure 15) documents manure applications from the last two years in order to calculate nitrogen credits from those applications. This is relevant to the P Index in that it impacts crop nitrogen guidelines and, therefore, planned manure applications on the Allocation screen. The “Fertilizers” tab (Figure 16) is used to select up to four different fertilizers or fertilizer application events, including rate, timing, and method. As noted earlier, the fertilizer material and rate may be selected on the Allocation screen (Figure 18), where the user has more information about other fields in view.
Figure 17: The PI Factors tab captures the remaining information required for the P Index.
The “PI Factors” tab (Figure 17) captures the remaining inputs necessary for the P Index. The RUSLE “A” value should be entered into the “Soil Erosion” cell. The “Proximate Waterbody Type” allows for the selection of “None”, “Intermittent”, or “Perennial” and is used in combination with the “Predominant Flow Distance to Blue Line Stream or Equivalent” in calculation of the Transport factor. “Soil Drainage Class” and “Flooding Frequency” values are based on the “Soil Name” selection on the “Field Data” tab (Figure 11). The “Concentrated Flow” box is used to indicate whether a field has a concentrated flow (a checked box signals “Yes” and an unchecked box means “No”).

NY P Runoff Index - Documentation and User’s Manual. First Edition. 7/8/2003.
- 40 -
8.2 Allocating manure and fertilizer Now that the manure sources and fields have been characterized, Cropware will compute crop nutrient guidelines and manure inventories. The planner must consider the crop nutrient guidelines, P Index, N Leaching Index, manure inventories, and other on-farm logistics to initially allocate manure and fertilizer across the fields (Step 2). Cropware will then calculate nutrient balances and P Index scores per field, as well as manure inventories for all sources. This is accomplished on the Allocation screen, shown in Figure 18.
Figure 18: The Allocation screen integrates manure inventories, crop nutrient guidelines, and environmental risk indices on a single screen to facilitate planning.
The Allocation screen allows the user to consider running totals of manure inventories in the “Manure Summary” grid as well as nutrient guidelines, nutrient balances, and environmental risk indices in the “Field Nutrient Balance” grid. To further explain the Allocation screen, consider field 628.10 (Figure 18). This third year corn field has total N, P2O5, and K2O requirements of 100, 20, and 0 lbs/acre, respectively. By clicking on the Primary Source cell for field 628.10, the planner chose the Heifer Barn manure source. Similarly, the planner also selected the Heifer 2003 manure test and a rate of 15 tons/acre. For a second coat of manure, the planner chose the Main Barn source with a rate of 10,000 gallons/acre. By scrolling to the right on the Allocation screen, we see that the planner supplemented the manure applications with a starter fertilizer application of 6 gallons/acre of urea ammonium nitrate liquid fertilizer (Figure 19).

NY P Runoff Index - Documentation and User’s Manual. First Edition. 7/8/2003.
- 41 -
Figure 19: The Allocation screen; notice the Very High P Index scores. Continuing to the right, you will see that the N balance is 3 lbs/acre and the Phosphorus Index is 115 for the dissolved P Index (DP) and 144 for the particulate P Index (PP). Finally, as a result of the planned applications, the “Manure Balance” in the “Manure Summary” grid indicates that most of the manure available has been allocated (an important consideration, especially for farms without manure storage).
8.3 Revising the initial plan At this point the planner must take stock of how well the major objectives of Step 3 of the planning process have been satisfied (Figure 7):
§ Have crop nutrient guidelines been satisfied? § Is management appropriate for the P Index and N Leaching Index? § Has all of the available manure been planned for application? § Can the plan be implemented on the farm?
By focusing on field 628.10 again, we see that the N balance is satisfactory, the N Leaching Index is moderate, and the bulk of the manure from the Main Barn and Heifer Barn has been

NY P Runoff Index - Documentation and User’s Manual. First Edition. 7/8/2003.
- 42 -
planned for application. The P Index, though, is Very High for both the dissolved P and particulate P Indices. This means that no additional phosphorus is to be applied to the field (Table 1). As a result, the planner must revise the plan to lower the P Index scores. As stated earlier in this section, such management changes could include:
§ Modifications in the timing, rate, and/or method of manure and/or fertilizer applications. § Increases in flow distance through the use of no spreading buffers. § Reductions in the RUSLE predicted soil loss through changes in crop rotation
management. § Adoption of best management practices to address concentrated flows.
A number of management changes and/or combinations of management changes could be used to satisfy the objectives outlined in Step 3. The following scenarios represent a sampling of management changes aimed at reducing the risk of phosphorus loss.
Management Change Scenario 1: Scenario 1 involves changes in the Transport factor of the P Index. By navigating back to the “PI Factors” tab within the Fields screen for field 628.10 (Figure 17), notice that the “Predominant Flow Distance” is 125 feet and that untreated “Concentrated Flows” exist in the field. By creating a spreading setback of 125 feet within the field, the “Predominant Flow Distance” could be increased to 250 feet and the concentrated flow could be eliminated by installing a grass waterway (Figure 20).
Figure 20: Returning to the PI Factors tab of the Fields screen, the planner revised the plan by increasing the flow distance and eliminating the concentrated flow.

NY P Runoff Index - Documentation and User’s Manual. First Edition. 7/8/2003.
- 43 -
The producer viewed both changes as feasible and the resulting P Index scores were reduced to 43/58 (Figure 21). Considering the higher of the two P Index scores, this field is classified as Medium risk, allowing N based management with best management practices to curb nutrient loss (Table 1).
Figure 21: The changes in Transport factors resulted in reduced P Index scores, as shown on the Allocation screen.
The creation of a spreading setback of 125 feet within field 628.10 results in a new management unit separate from field 628.10. To reflect this change, a new field should be created to represent the no-spreading buffer area, originally within field 628.10. This can be performed in the Fields screen. The “Copy Field” function should be used to copy the original field 628.10 once with the “Field ID”, 628.10A, and a second time with the “Field ID”, 628.10B. The correct acreage can be assigned to each new field, for example 7.5 acres and 1.0 acres for fields 628.10A and 628.10B, respectively. Finally, the “Delete Field” function is used to delete the original field 628.10. If needed, the “Re-Order Fields” button can be used to re-arrange the list of fields. Returning to the Allocation screen, you will see that both 628.10A and 628.10B exist as independent fields (Figure 22). It is now possible to develop a simple nutrient management plan for the spreading setback area (i.e., 628.10B), to ensure productive and environmentally sound crop production in this newly created management unit.

NY P Runoff Index - Documentation and User’s Manual. First Edition. 7/8/2003.
- 44 -
Figure 22: The updated field distinctions now appear on the Allocation screen.
Management Change Scenario 2: Considering Scenario 1 with field 628.10, if the spreading setback was the only feasible change for the field, the resulting P Index scores would be 43/86. Considering the higher of the two P Index scores, this field is classified as High risk, limiting applications of manure and fertilizer to the P2O5 removal of the crop (Table 1). In order to determine the rate of manure necessary to meet P2O5 crop removal, consider the following steps:
1. Estimate the dry matter (DM) yield of the crop (e.g., 20 tons/acre corn silage (COS) on a Chagrin soil with 35% DM = 7 tons DM yield/acre).
2. Determine the P2O5 content of the DM from Appendix A (e.g., 0.62% P2O5 for COS). 3. Calculate the lbs of P2O5 removal per acre (e.g., 7 tons DM/acre x 2000 lbs/ton x
0.0062 = 87 lbs P2O5 removal/acre). 4. Go to the Allocation screen in Cropware:
a. Remove any manure allocated to the field. b. Consider the “P2O5 Balance” column, add the P2O5 removal rate calculated above
to the balance and record the result on the side (e.g., -20 + 87 = 67 lbs P2O5/acre). c. Allocate manure until the “P2O5 Balance” value equals the calculated result from
step 4b, above. d. Such an allocation may reduce the P Index score to well below the High category,
as in this example with field 628.10. If deemed the best use of manure for crop production and water quality, additional manure could be allocated to this field with the stipulation that the P Index scores remain in the Medium category.

NY P Runoff Index - Documentation and User’s Manual. First Edition. 7/8/2003.
- 45 -
Figure 23: The shift in manure from field 628.10 to field 3982.07 and the updated manure inventories are shown on the Allocation screen.
Management Change Scenario 3: An alternative to changing Transport factors could be to modify management considered in the Source factor calculations. The planner first shifted the timing of both manure applications from “Feb-Apr” to “Sept-Oct” on the Fields—Manure Use screen. In this case, the change resulted in a slight, but inadequate reduction in the DP/PP scores, to 85/106. Incorporation of manure was not an option on this farm, because of the lack of manure storage, so the planner considered reducing the amount of manure applied to field 628.10. The planner removed the second application (10,000 gallons/acre from the Main Barn) from field 628.10, but upon checking the manure inventories, realized that 85,000 additional gallons of manure were now unplanned. By applying 5,000 gallons/acre of Main Barn manure as a second application to field 3982.07 (another field with a significant nutrient requirement), the manure inventory constraint was satisfied (Figure 23). But what about the nutrient balances and P Index scores for both fields?
The nitrogen balance was restored by adjusting the amount of recommended sidedress nitrogen fertilizer in the Fertilizer #2 category for both fields (Figure 24); notice the 7 gallons/acre and 15 gallons/acre of urea ammonium nitrate for fields 3982.07 and 628.10, respectively. Through changes in management, the P Index Source factor was reduced. The P Index scores are now in the medium range for both field 3982.07 (35/48) and field 628.10 (47/59), necessitating N based management with best management practices (Table 1).

NY P Runoff Index - Documentation and User’s Manual. First Edition. 7/8/2003.
- 46 -
Figure 24: The impact on the P Index scores is shown on the Allocation screen.
A planner may check the feasibility of the plan by using the Calendar screen to determine whether or not the plan is possible when field access and manure supply are considered (Figure 25). The Calendar screen is comprised of a grid for planning manure applications for each month of the plan year. The “Planned Quantity” of manure is the total recommended amount of manure per field calculated from the planner’s work on the Allocation screen. The shaded months represent those months when spreading is difficult, due to constraints with field accessibility, labor and equipment availability, etc. The bottom grid tracks manure inventories on a monthly basis as allocations are made on the upper grid. When considering both grids, the planner aims to completely allocate all of the manure as planned on the Allocation screen (i.e., the Quantity Difference column values are approximately zero) while not applying more manure than is available in a given month or, conversely, not allowing manure to accumulate beyond the capacity of storage structures. If this is not possible, then manure plans on the Allocation screen will require modification. Once the more tactical, temporal allocation plan is completed, the planner can click the “Update PI” button to set the manure Timings for the P Index according to the inputs on the Calendar screen. By navigating back to the “Manure Use” tab within the Fields screen, the planner will see that the manure application timings have been updated to correspond with the Calendar screen. As a final thought for this section, it is often helpful to begin a nutrient management plan by characterizing the current level of manure and fertilizer management on the farm. Allocating nutrients with consideration for the crop nutrient guidelines, the NY P Index, the N leaching Index, and on-farm logistics will likely highlight areas for improvement. Regardless of the

NY P Runoff Index - Documentation and User’s Manual. First Edition. 7/8/2003.
- 47 -
approach toward improvement, a nutrient management plan will likely require some revisions through Cropware as well as consultations with the client before becoming feasible, environmentally sound, and ready for implementation.
Figure 25: The Calendar screen enables the user to determine the feasibility of the plan develop-ed on the Allocation screen. 8.4 Publish and de liver the plan Once revisions have been made, Cropware offers many options for reporting the plan for review or implementation by the client (Figure 26). Of the pre-defined reports available in the Reports screen of Cropware, the “Nutrient Management Plan” report provides the user with a balance sheet of nutrient requirements and sources as well as the P Index scores all on a per field basis. The “Fertilizer and Manure Management” report provides a recipe for implementation, including the basic recommendations for manure, fertilizer, and lime applications. The “Field Details Report” offers a detailed, per field summary of the inputs and guidelines for implementation. Finally, the Custom Report tool allows planners to build their own reports to satisfy their particular nutrient management planning needs.

NY P Runoff Index - Documentation and User’s Manual. First Edition. 7/8/2003.
- 48 -
Figure 26: Examples of Cropware reports: Nutrient Management Plan (top), Fertilizer and Manure Management Report (middle left), Field Details Report (middle right), and the Custom Report (bottom).

NY P Runoff Index - Documentation and User’s Manual. First Edition. 7/8/2003.
- 49 -
Summary The Phosphorus Index for New York State (NY P Index) is a qualitative risk-based assessment tool designed to enhance nutrient management planning for agricultural operations. The goal of implementing the P Index is to protect clean surface waterbodies and to further reduce phosphorus nutrient loading to impaired surface waterbodies. The NY P Index is not a quantitative tool. In other words, it will not address the actual nutrient retention or losses from agricultural operations in the context of Total Maximum Daily Loads (TMDLs), but, rather, is a step toward eventual quantification of P losses from fields. However, the purpose of the P Index is to rank agricultural field vulnerability to phosphorus loss so fields posing a high risk to surface water quality impairment can be identified. The fields identified as high risk can then quickly be targeted for more careful evaluation. Producers are encouraged to make management changes or implement site-specific management improvements to reduce the risk of nutrient losses from high risk areas. The NY P Index risk assessment tool is designed to address losses of both particulate and dissolved phosphorus. Since dissolved phosphorus can be transported in both surface and shallow subsurface water flows, different assessment factors are used to acknowledge these differences. The objective of this approach is to better assess losses of dissolved phosphorus, which are rapidly available to algae and other aquatic plant life. The NY P Index tool combines various sources of phosphorus with different water transport mechanisms to arrive at a risk level score. Risk levels are divided into four categories whereby the highest risk level implies that no more additional phosphorus should be applied to the area. Depending on the weighting of individual factors that make up the source and transport scores, management changes or site improvements may or may not sufficiently alter the risk score. Nevertheless, this approach in the P Index allows for considerable flexibility in nutrient management within certain upper limits of nutrient loss risk. The NY P Index is designed to be a flexible yet scientifically reasonable approach to assisting agricultural producers and planners in identifying field areas that present the highest risk of contributing phosphorus to lakes and streams. It should be a more viable and acceptable approach to nutrient management because it combines factors of sources of phosphorus that may reside (i.e., soil phosphorus) or be placed at risk in the path of water transport. Nutrient loading outside of critical management areas would still be considered acceptable. The NY P Index should serve as a rapid assessment and educational tool until more viable or quantitative-based tools are available.

NY P Runoff Index - Documentation and User’s Manual. First Edition. 7/8/2003.
- 50 -
Literature Cited Baker, J.L. and J.M. Laflen. 1982. Effect of crop residue and fertilizer management on soluble
nutrient runoff losses. Trans. ASAE 25:344-348. Bingham, S.C., P.W. Westerman, and M.R. Overcash. 1980. Effects of grass buffer zone length
in reducing the pollution from land application areas. Trans. ASAE 23:330-342. Bolinder, M.A., R.R. Simard, S. Beachemin, and K.B. MacDonald. 1998. Indicator of risk of
water contamination: methodology for the phosphorus component. Report No. 24. Agriculture and Agri-Food Canada.
Brown, C.B. 1943. The control of reservoir silting. USDA Misc. Pub. No. 521, USDA, Washington, D.C.
Burwell, R.E., D.R. Timmons, and R.F. Holt. 1975. Nutrient transport in surface runoff as influenced by soil cover and seasonal periods. Soil Sci. Soc. Am. J. 39:523-528.
Castelle, A.J., A.W. Johnson, and C. Conolly. 1994. Wetland and stream buffer size requirements - A review. J. Environ. Qual. 23:878-882.
Chardon, W.J., O. Oenema, P. del Castillo, R. Vriesema, J. Japenga, and D. Blaauw. 1997. Organic phosphorus in solutions and leachates from soils treated with animal slurries. J. Environ. Qual. 26:372-378.
Chaubey, I., L. Han, and S.N. Addy. 2000. Nonpoint pollution assesment of poultry litter application using GIS, remote sensing and water quality modeling. ASAE Paper No. 00-2208. ASAE, St. Joseph, MI. 18 pp.
Cogger, C., and J.M. Duxbury, 1984. Factors affecting phosphorus losses from cultivated organic soils. J. Environ. Qual. 23:116-120.
Cooke, J.G. 1988. Sources and sinks of nutrients in a New Zealand hill pasture catchment. II. Phosphorus. Hydrol. Proc. 2:123-133.
Cooper, J.R,. and J.W. Gilliam. 1987. Phosphorus redistribution from cultivated fields into riparian areas. Soil Sci. Soc. Am. J. 51:1600-1604.
Correll, D.L. 1998. The role of phosphorus in the eutrophication of receiving waters: A review. J. Environ. Qual. 27:261-266.
Daniels, R.B., and J.W. Gilliam. 1996. Sediment and chemical load reduction by grass and riparian filters, Soil Sci. Soc. Am. J. 60:246-251.
Dillaha, T.A., R.B. Reneau, S. Mostaghimi, and D. Lee. 1989. Vegetative filter strips for agricultural nonpoint source pollution control. Trans. ASAE 32:491-496
Dillaha, T.A., J.H. Sherrard, D. Lee, S. Mostaghimi, and V.O. Shanholtz. 1988. Evaluation of vegetative filter strips as a best management practice for feedlots. J. Water Pollution Control Fed. 60:1231-1238.
Dunne, T., and R.D. Black. 1970. Partial-area contributions to storm runoff in a small New England watershed. Water Resources Res. 6:1296-1311.
Ebeling, A.M., L.G. Bundy, T.W. Andraski, and J.M. Powell. 2002. Dairy diet phosphorus effects on phosphorus losses in runoff from land-applied manure. Soil Sci. Soc. Am. J. 66:284-291.
Edwards, D.R., and T.C. Daniel. 1994. Runoff quality impacts of swine manure applied to fescue plots. Trans. ASAE 36:81-86.
Effler, S.W., and A.P. Bader. 1998. A limnological analysis of Cannonsville Reservoir, NY. J. of Lake and Reservoir Management 14:125-139.
Eghball, B., G.D. Binford, and D.D. Baltensperger. 1996. Phosphorus movement and adsorption

NY P Runoff Index - Documentation and User’s Manual. First Edition. 7/8/2003.
- 51 -
in a soil receiving long-term manure and fertilizer applications. J. Environ. Qual. 25:1339-1343.
Eghball, B., and J.E. Gilley. 1999. Phosphorus and nitrogen in runoff following beef cattle manure or compost application. J. Environ. Qual. 28:1201-1210.
Frankenberger, J.R. 1996. Identification of critical runoff generating areas using a variable source area model. Ph.D. Thesis, Department of Agricultural and Biological Engineering, Cornell University, Ithaca, NY. 207 pp.
Frossard, E., J.W.B. Stewart, and R.J. St. Arnaud. 1989. Distribution and mobility of phosphorus in grassland and forest soils of Saskatchewan. Can. J. Soil Sci. 69:401-416.
Gaynor, J. and D. Bissonnette. 1992. The effect of conservation tillage practices on the losses of phosphorus and herbicides in surface and subsurface waters. Report # 60, Soil & Water Envir. Enhancement Prog., Agriculture Canada. 134 pp.
Gburek, W.J., A.N. Sharpley, and G.J. Folmar. 1998. Modifying the P Index to account for transport pathways. Report to the SERA Transport Workgroup. USDA-ARS, University Park, PA.
Geohring, L.D. O.V. McHugh, M.T. Walter, T.S. Steenhuis, M.S. Akthar, M.F. Walter. 2001. Phosphorus transport into subsurface drains by macropores after manure applications: Implications for best manure management practices. Soil Sci. 166(12):896-909.
Geohring, L.D. 1999. Tile drains and nutrient management planning considerations. In: Nutrient Management Planning: Competitive Agriculture in Harmony with the Community. Ontario Soil and Crop Improvement Assoc., Guelph, Ontario, Canada. pp: 211-221.
Gilliam, J.W., J.L. Baker, and K.R. Reddy. 1999. Water quality effects of drainage in humid regions. In: Skaggs, R.W. and J. van Schilfgaarde (Editors), Agricultural Drainage, No. 38, American Society of Agronomy, Inc. Madison, WI. pp. 809-813.
Harris, R.A., Heathwaite, A.L., and P.M. Haygarth. 1995. High temporal resolution sampling of P exported from grassland soil during a storm, and the impact of slurry additions. Proceedings of the International Workshop on Phosphorus Loss to Water from Agriculture. TEAGASC, Johnstown Castle, Wexford, Ireland, 25-26.
Haygarth, P.M. and S.C. Jarvis. 1997. Soil derived phosphorus in surface runoff from grazed grassland lysimeters. Water Resources Res. 31:140-148.
Haygarth, P.M., L. Hepworth, and S.C. Jarvis. 1998. Forms of phosphorus transfer in hydrological pathways from soils under grazed grassland. Eur. J. Soil Sci. 42:65-72.
Heathwaite, A.L., P.J. Johnes, and N.P. Peters. 1996. Trends in nutrients. Hydro. Proc. 10:263-293.
Heatwole, C.D. and V.O. Shanholtz. 1991. Targeting animal waste pollution potential using a GIS. Applied Engr. Agric. 7(6):692-698.
Heckrath, G., P.C. Brookes, P.R. Poulton, and K.W.T. Goulding. 1995. Phosphorus leaching from soils containing different phosphorus concentration in the Broadbank experiment. J. Environ. Qual. 24:904-910.
Hergert, G.W., S.D. Klausner, D.R. Bouldin, and P.J. Zwerman. 1981. Effects of dairy manure on phosphorus concentrations and losses in tile effluent. J. Environ. Qual. 10:345-349.
Jokela, W.E. 2000. A phosphorus index for Vermont. In: Managing Nutrients and Pathogens from Animal Agriculture, NRAES-130. Natural Resource, Agriculture, and Engineering Service, 152 Riley Robb, Cornell University, Ithaca, NY. pp. 302-315.
Ketterings, Q.M., B.C. Bellows, K.J. Czymmek, W.S. Reid, and R.F. Wildman. 2001. Conversion equation part I: Do modified Morgan and Mehlich-III P have a Morgan P

NY P Runoff Index - Documentation and User’s Manual. First Edition. 7/8/2003.
- 52 -
equivalent. What’s Cropping Up? 11(3):2-3. March-April, 2001. (Available online at http://nmsp.css.cornell.edu/publications/index.asp)
Kimmell, R.J., G.M. Pierzynski, K.A.Janssen, and P.L. Barnes. 2001. Effects of tillage and phosphorus placement on phosphorus runoff losses in a grain sorghum-soybean rotation. J. Environ. Qual. 30:1324-1330.
Kleinman, P.J.A. 2000. Source risk indicators of nutrient loss from agricultural lands. In: Managing Nutrients and Pathogens from Animal Agriculture, NRAES-130. Natural Resource, Agriculture, and Engineering Service, 152 Riley Robb, Cornell University, Ithaca, NY. pp. 237-252.
Kleinman, P.J.A, R.B. Bryant, and W.S. Reid. 1999. Development of pedo-transfer functions to quantify phosphorus saturation of agricultural soils. J. Environ. Qual. 28:2026-2030.
Lemunyon, J.L., and R.G. Gilbert. 1993. The concept and need for a phosphorus assessment tool. J.Prod. Agric. 6:483-486.
Lowrance, R.R., R.A. Leonard, and L.E. Asmussen. 1985. Nutrient budgets for agricultural watersheds in the southeastern coastal plain. Ecology 66:287-296.
Magette, W.L., R.B. Brinsfield, R.E. Palmer, and J.D. Wood. 1989. Nutrient and sediment removal by vegetated filter strips. Trans. ASAE 32:663-667.
McDowell, R.W. and A.N. Sharpley. 2002. Phosphorus transport in overland flow in response to position of manure application. J. Environ. Qual. 31:217-227.
McDowell, R.W. and A.N. Sharpley. 2001. Approximating phosphorus release from soils to surface runoff and subsurface drainage. J. Environ. Qual. 30:508-520.
McFarland, A., L. Hauck, J. White, W. Donham, J. Lemunyon, and S. Jones. 1998. Nutrient management using a phosphorus risk index for manure application fields. In: Manure management in harmony with the environment and society conference proceedings at Ames, IA. SWCS. (Available online at http://www.ctic.purdue.edu/Core4/Nutrient/ManureMgmt/ Paper62.html)
Merwin, I.A., W.C. Stiles, H.M. Van Es. 1994. Orchard Groundcover Management Impacts on Soil Physical-properties. J. Am. Soc. Hort. Sci. 119: 216-222.
Mueller, D.H., R.C. Wendt, and T.C. Daniel. 1984. Phosphorus losses as affected by tillage and manure application. Soil Sci. Soc. Am. J. 48:901-905.
Murray, T.P. 2001. Evaluating level- lip spreader vegetative filter strips in removing phosphorus from milkhouse waste in New York City’s water supply watersheds. M.S. Thesis. Dept. of Biological and Environmental Engineering, Cornell University, Ithaca, NY. 107 pp.
Natural Resources Conservation Service (NRCS). 1994. The Phosphorus Index: A phosphorus assessment tool. Technical Note. Series No. 1901. (Available online at http:// www.nrcs.usda.gov/technical/ECS/nutrient/pindex.html).
Neller, J.R. 1946. Mobility of phosphates in sandy soils. Soil Sci. Soc. Am. J. 11:227-230. Parsons, J.E., J.W. Gilliam, R. Munoz-Carpena, R.B. Daniels, and T.A. Dillaha. 1994. Nutrient
and sediment removal by grass and riparian buffers. In: Campbell and coworkers (eds.) Environmentally Sound Agriculture - Proceedings of the 2nd Conference. ASAE, St. Joseph, MI. pp. 147-154.
Peterjohn, W.T., and D.L. Correll. 1984. Nutrient dynamics in an agricultural watershed: observations on the role of a riparian forest. Ecology 65:1466-1475.
Pote, D.H., T.C. Daniel, A.N. Sharpley, P.A. Moore, Jr., D.R. Edwards, and D.J. Nichols. 1996. Relating extractable soil phosphorus to phosphorus losses in runoff. Soil Sci. Soc. Am. J. 60:855-859.

NY P Runoff Index - Documentation and User’s Manual. First Edition. 7/8/2003.
- 53 -
Powell, J.M., Z. Wu, and L.D. Satter. 2001. Dairy diet effects on phosphorus cycles of cropland. J. Soil &Water Conserv. 56(1):22-26.
Renard, K.G., G.R. Foster, G.A. Weesies, and J.P. Porter. 1991. RUSLE Revised Universal Soil Loss Equation. J. Soil Water Conserv. Soc., 46:30-33.
Romkens, M.J.M. and D.W. Nelson. 1974. Phosphorus relationships in runoff from fertilized soil. J. Environ. Qual. 3:10-13.
Scott, C.A., L.D. Geohring, and M.F. Walter. 1998. Water quality impacts of tile drains in shallow, sloping, structured soils as affected by manure application. Applied Engr. Agric. 14:599-603.
Sharpley, A.N., and B.G. Moyer. 2000. Phosphorus forms in manure and compost and their release during simulated rainfall. J. Environ. Qual. 29:1462–1469.
Sharpley, A.N., J.K. Syers, and P.E.H. Gregg. 1978. Transport in surface runoff of phosphorus derived from dicalcium phosphate and superphosphate. N.Z. J. Sci. 21:307-310.
Sharpley, A.N., R.W. Tillman, and J.K. Syers. 1977. Use of laboratory extraction data to predict loses of dissolved inorganic phosphate in surface runoff and tile drainage. J. Environ. Qual. 6:33-36.
Sims, J.T., R.R. Simard, and B.C. Joern. 1998. Phosphorus loss in agricultural drainage: Historical perspective and current research. J. Environ. Qual. 27:277-293.
Smith, K.A., A.G. Chalmers, B.J. Chalmers, and P. Christie. 1998. Organic manure phosphorus accumulation, mobility and management. Soil Use Manage. 14:154-159.
Spruill, T.B. 2000. Statistical evaluation of effects of riparian buffers on nitrate and ground water quality. J. Environ. Qual. 29:1523-1538.
Steenhuis, T.S. and R.E. Muck. 1988. Preferred Movement of Nonadsorbed Chemicals on Wet, Shallow, Sloping Soils. J. Environ. Qual. 17:376-384.
Stevens, J.G. 1936. The silt problem. Trans. of the ASCE 101:207-288. USDA-EPA. 1998. U.S. Department of Agriculture-U.S. Environmental Protection Agency
Unified National Strategy for Animal Feeding Operations, 63 Fed. Reg. 50192-50195. Ulén, B. and K. Persson. 1999. Field-scale phosphorus losses from a drained clay soil in Sweden.
Hydro. Proc. 13:2801-2812. Uusi-Kämppä, J., B. Braskerud, H. Jansson, N. Syversen, and R. Uusitalo. 2000. Buffer zones
and constructed wetlands as filters for agricultural phosphorus. J. Environ. Qual. 29:151-158. Van Es, H.M., T.S. Steenhuis, L.D. Geohring, J. Vermeulen, and J. Boll. 1991. Movement of
surface-applied and soil-embodied chemicals to drainage lines in a well structured soil. In: T.J. Gish and A. Shirmohammadi (eds.) Preferential flow. ASAE, St. Joseph, MI. pp. 59-67.
Walter, M.F., J. Boll, C.A. Scott, G. Albrecht, S. Boibeaux, E. Brooks, C. Brush, N. Doon, J. Frankenburger, J. Hoogewood, S. Kim, W. Kuo, J. Parlange, B. Patel, A. Schwinehart, T. Steenhuis, M. Walker, P. Wright, and X. Xin. 1995. Hydrological basis for WFP risk assessment and management. Science for Whole Farm Planning Phase II 4th Qtr. Report, NYS-WRI, Center for the Environment, Cornell University, Ithaca, NY. pp. 30-63.
Wilson, L.G. 1967. Sediment removal from flood water by grass filtration. Trans. ASAE 10:35-37.
Wischmeier, W.H., and D.D. Smith. 1978. Predicting rainfall erosion losses - A guide to conservation planning. USDA Agricultural Handbook 537, USDA-SCS, Washington, D.C.
Wood, C.W. 1998. Agricultural phosphorus and water quality: An overview. In: Soil Testing for Phosphorus. Environmental Uses and Implications, J.T. Sims (ed.) SERA-IEG-17, USDA-CSREES Regional Committee. Southern Cooperative Series Bulletin No. 389.

NY P Runoff Index - Documentation and User’s Manual. First Edition. 7/8/2003.
- 54 -
Appendix
Appendix A: Phosphorus Concentrations of Field Crops and Vegetables. To obtain P2O5 removal rates, multiply yield in lbs/acre with dry matter content in % and P2O5 concentration in % and divide the final answer by 10,000. For example, estimated P2O5 removal by a 20 tons/acre corn silage crop at 35% dry matter amounts to 20*2000*35*0.62/10,000 = 87 lbs P2O5. This equals 4.3 lbs P2O5 per ton of silage (35% dry matter). All data on vegetable crops and the data on field crops marked with an asterisk (*) were obtained from the NRCS Plant Database (http://npk.nrcs.usda.gov). All other field crop data were obtained from DairyOne, Inc.
Appendix A: P concentrations for crop removal of field and vegetable crops.
%P %P2O5 %P %P2O5 Field Crops % of dry matter
Vegetable Crops* % of dry matter
ALT Alfalfa 0.33 0.76 ASP Asparagus 0.71 1.62
AGE/ AGT
Alfalfa-grass mix
0.23 0.53 BDR Beans – Dry
0.53 1.22
ABE/ ABT
Alfalfa-trefoil-grass
0.23 0.53 BET Beets 0.34 0.79
BTE/ BTT
Birdsfoot trefoil 0.23 0.53 BNL Beans – Lima
0.45 1.03
BGE/ BGT
Birdsfoot trefoil-grass
0.23 0.53 BNS Beans – Snap
0.50 1.14
BCE/ BCT
Birdsfoot trefoil-clover
0.23 0.53 BRP Broccoli – Transplanted
0.75 1.73
BSE/ BST
Birdsfoot trefoil-seed
0.23 0.53 BRS Broccoli – Seeded
0.75 1.73
CLE/ CLT
Clover 0.34 0.78 BUS Brussels Sprouts 0.51 1.17
CGE/ CGT
Clover-grass 0.24 0.55 CAR Carrots 0.33 0.75
CSE/ CST
Clover-seed production
0.34 0.78 CBP Cabbage – Transplanted
0.36 0.82
CVE/ CVT
Crownvetch 0.34 0.78 CBS Cabbage – Seeded
0.36 0.82
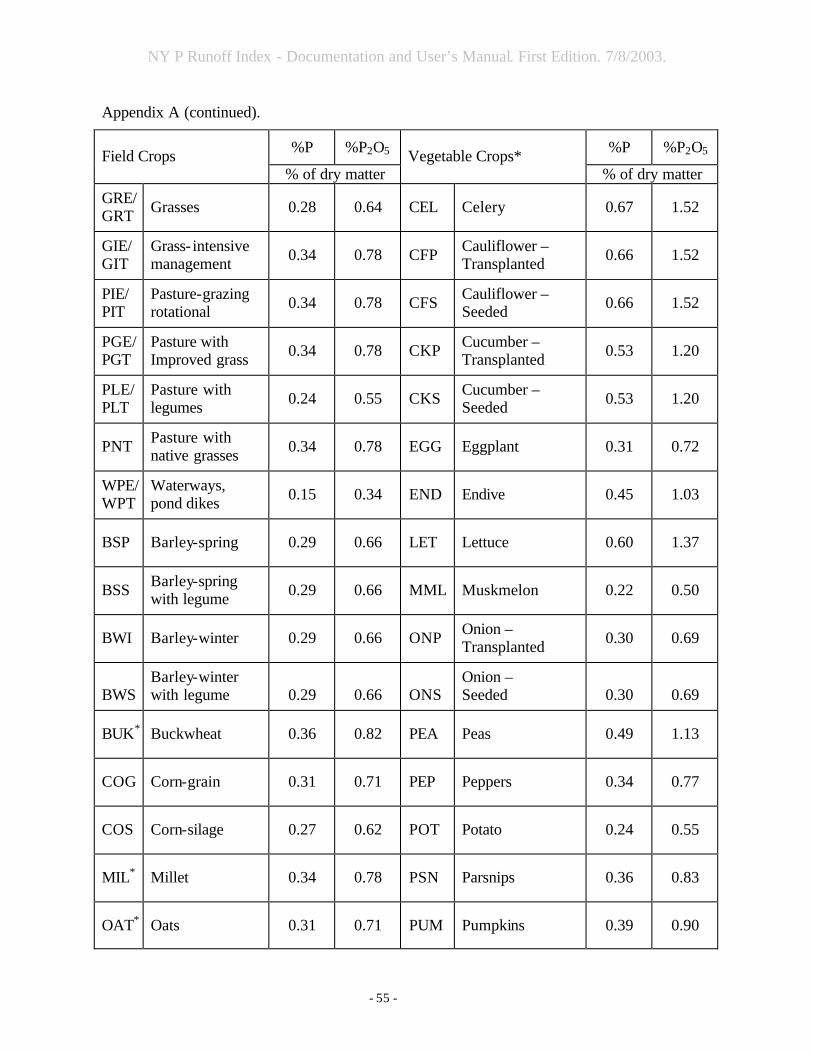
NY P Runoff Index - Documentation and User’s Manual. First Edition. 7/8/2003.
- 55 -
Appendix A (continued).
%P %P2O5 %P %P2O5 Field Crops % of dry matter
Vegetable Crops* % of dry matter
GRE/ GRT Grasses 0.28 0.64 CEL Celery 0.67 1.52
GIE/ GIT
Grass- intensive management 0.34 0.78 CFP Cauliflower –
Transplanted 0.66 1.52
PIE/ PIT
Pasture-grazing rotational 0.34 0.78 CFS Cauliflower –
Seeded 0.66 1.52
PGE/ PGT
Pasture with Improved grass 0.34 0.78 CKP Cucumber –
Transplanted 0.53 1.20
PLE/ PLT
Pasture with legumes 0.24 0.55 CKS Cucumber –
Seeded 0.53 1.20
PNT Pasture with native grasses 0.34 0.78 EGG Eggplant 0.31 0.72
WPE/WPT
Waterways, pond dikes 0.15 0.34 END Endive 0.45 1.03
BSP Barley-spring 0.29 0.66 LET Lettuce 0.60 1.37
BSS Barley-spring with legume 0.29 0.66 MML Muskmelon 0.22 0.50
BWI Barley-winter 0.29 0.66 ONP Onion – Transplanted 0.30 0.69
BWS
Barley-winter with legume
0.29
0.66
ONS
Onion – Seeded
0.30
0.69
BUK* Buckwheat 0.36 0.82 PEA Peas 0.49 1.13
COG Corn-grain 0.31 0.71 PEP Peppers 0.34 0.77
COS Corn-silage 0.27 0.62 POT Potato 0.24 0.55
MIL* Millet 0.34 0.78 PSN Parsnips 0.36 0.83
OAT* Oats 0.31 0.71 PUM Pumpkins 0.39 0.90

NY P Runoff Index - Documentation and User’s Manual. First Edition. 7/8/2003.
- 56 -
Appendix A (continued).
%P %P2O5 %P %P2O5 Field Crops % of dry matter
Vegetable Crops* % of dry matter
OAS Oats-seeded with legume 0.30 0.69 RAD Radishes 0.44 1.01
RYC Rye-cover crop 0.36 0.82 RHU Rhubarb 0.23 0.54
RYS Rye-seed production 0.36 0.82 RUT Rutabagas 0.41 0.94
SOG Sorghum-grain 0.22 0.50 SPF Spinach – Fall 0.54 1.24
SOF Sorghum-forage 0.22 0.50 SPS Spinach – Spring 0.54 1.24
SSH Sorghum-sudangrass hybrid 0.50 1.15 SQS Squash –
Summer 0.49 1.12
SUD Sudangrass 0.50 1.15 SQW Squash – Winter 0.27 0.62
SOY Soybeans 0.65 1.49 SWC Sweetcorn 0.38 0.88
SUN Sunflower 1.02 2.34 TOM Tomato 0.47 1.08
TRP Triticale/peas 0.30 0.69 TUR Turnips 0.37 0.86
WHT Wheat 0.29 0.66 WAT Watermelon 0.11 0.26
Downloadable from: http://nmsp.css.cornell.edu/. Last updated: May 19, 2003.

NY P Runoff Index - Documentation and User’s Manual. First Edition. 7/8/2003.
- 57 -
Appendix B: Flooding Frequency and Drainage Class of New York Soils Drainage Class: V = very poorly drained; P = poorly drained; S = somewhat poorly drained; M = moderately well drained; W = well drained; E = excessively well drained. Soil Series
Drainage Class
Flooding Frequency
Acton M Rare/none Adams W Rare/none Adirondack W Rare/none Adjidaumo P Frequent Adrian V Rare/none Agawam W Rare/none Albia S Rare/none Albrights M Rare/none Alden V Rare/none Allagash W Rare/none Allard W Rare/none Allendale P Rare/none Allis P Rare/none Alluvial land S Rare/none Almond S Rare/none Alps M Rare/none Altmar M Rare/none Alton W Rare/none Amboy W Rare/none Amenia M Rare/none Angola S Rare/none Appleton S Rare/none Arkport W Rare/none Armagh P Rare/none Arnot W Rare/none Ashville V Rare/none Atherton P Rare/none Atkins V Frequent Atsion P Rare/none Au gres S Rare/none Aurelie P Rare/none Aurora M Rare/none Barbour W Occasional Barcelona S Rare/none Barre P Rare/none Bash S Frequent
Soil Series
Drainage Class
Flooding Frequency
Basher M Occasional Bath W Rare/none Becket W Rare/none Becraft M Rare/none Belgrade M Rare/none Benson E Rare/none Berkshire W Rare/none Bernardston W Rare/none Berrien M Rare/none Berryland V Frequent Beseman V Rare/none Bice W Rare/none Biddeford V Rare/none Birdsall V Rare/none Blasdell W Rare/none Bombay M Rare/none Bonaparte E Rare/none Bono V Rare/none Boots V Rare/none Borosaprists V Rare/none Boynton P Rare/none Braceville M Rare/none Brayton S Rare/none Bridgehampton W Rare/none Bridport S Rare/none Briggs W Rare/none Brinkerton P Rare/none Broadalbin M Rare/none Brockport S Rare/none Brookfield W Rare/none Buckland W Rare/none Bucksport V Rare/none Budd W Rare/none Burdett S Rare/none Burnham P Rare/none Busti S Rare/none

NY P Runoff Index - Documentation and User’s Manual. First Edition. 7/8/2003.
- 58 -
Appendix B (continued). Soil Series
Drainage Class
Flooding Frequency
Buxton M Rare/none Cambria P Rare/none Cambridge M Rare/none Camillus W Rare/none Camroden S Rare/none Canaan E Rare/none Canaan-rock outcrop E Rare/none Canadice P Rare/none Canandaigua P Rare/none Canaseraga M Rare/none Canastota M Rare/none Caneadea S Rare/none Canfield M Rare/none Canton W Rare/none Carbondale V Rare/none Carlisle V Rare/none Carrollton W Rare/none Carver E Rare/none Carver-plymouth E Rare/none Castile W Rare/none Cathro V Rare/none Cathro-greenwood V Rare/none Cattaraugus W Rare/none Cavode S Rare/none Cayuga W Rare/none Cazenovia M Rare/none Ceresco M Rare/none Chadakoin W Rare/none Chagrin W Occasional Champlain E Rare/none Charles P Frequent Charlton W Rare/none Chatfield (e) E Rare/none Chatfield (we) W Rare/none Chaumont S Rare/none Chautauqua M Rare/none Cheektowaga P Rare/none Chenango W Rare/none Cheshire W Rare/none
Soil Series
Drainage Class
Flooding Frequency
Chippeny V Rare/none Chippewa P Rare/none Churchville S Rare/none Cicero S Rare/none Clarkson M Rare/none Claverack M Rare/none Clymer W Rare/none Cohoctah P Frequent Collamer M Rare/none Colonie W Rare/none Colosse E Rare/none Colrain W Rare/none Colton E Rare/none Colwood P Rare/none Conesus M Rare/none Conotton W Rare/none Constable W Rare/none Cook V Rare/none Copake W Rare/none Cornish S Occasional Cosad S Rare/none Cossayuna W Rare/none Covert M Rare/none Coveytown S Rare/none Covington P Rare/none Crary M Rare/none Croghan M Rare/none Culvers M Rare/none Dalbo M Rare/none Dalton S Rare/none Danley M Rare/none Dannemora P Rare/none Darien S Rare/none Dawson V Rare/none Deerfield M Rare/none Deford P Rare/none Dekalb W Rare/none Depeyster M Rare/none Deposit M Occasional Derb S Rare/none

NY P Runoff Index - Documentation and User’s Manual. First Edition. 7/8/2003.
- 59 -
Appendix B (continued). Soil Series
Drainage Class
Flooding Frequency
Dixmont M Rare/none Dorval V Rare/none Dover W Rare/none Duane M Rare/none Dunkirk W Rare/none Dutchess W Rare/none Duxbury W Rare/none Edwards V Rare/none Eel M Occasional Eelweir M Rare/none Elka W Rare/none Ellery P Rare/none Elmridge M Rare/none Elmwood M Rare/none Elnora M Rare/none Empeyville M Rare/none Enfield W Rare/none Ensley P Rare/none Erie S Rare/none Ernest W Rare/none Essex W Rare/none Fahey M Rare/none Farmington W Rare/none Farnham M Rare/none Fernlake E Rare/none Flackville M Rare/none Fonda V Rare/none Franklinville W Rare/none Fredon S Occasional Freetown V Rare/none Fremont S Rare/none Frenchtown P Rare/none Frewsburg S Rare/none Fryeburg W Rare/none Fulton P Rare/none Gage P Rare/none Galen M Rare/none Galestown E Rare/none Galoo W Rare/none Galoo-rock outcrop W Rare/none
Soil Series
Drainage Class
Flooding Frequency
Galway W Rare/none Genesee W Occasional Georgia M Rare/none Getzville P Rare/none Gilpen W Rare/none Gilpin W Rare/none Glebe W Rare/none Glebe-saddleback W Rare/none Glendora W Rare/none Glenfield V Rare/none Gloucester E Rare/none Glover E Rare/none Gougeville V Rare/none Granby P Rare/none Grattan E Rare/none Greene S Rare/none Greenwood V Rare/none Grenville W Rare/none Gretor S Rare/none Groton M Rare/none Groveton W Rare/none Guff P Rare/none Guffin P Rare/none Gulf P Rare/none Hadley W Rare/none Haights W Rare/none Haights-gulf P Rare/none Hailesboro S Rare/none Halcott W Rare/none Halsey V Rare/none Hamlin W Occasional Hamplain W Rare/none Hannawa P Rare/none Hartland W Rare/none Haven W Rare/none Hawksnest W Rare/none Hempstead W Rare/none Henrietta V Rare/none Herkimer M Rare/none Hermon W Rare/none

NY P Runoff Index - Documentation and User’s Manual. First Edition. 7/8/2003.
- 60 -
Appendix B (continued). Soil Series
Drainage Class
Flooding Frequency
Hero M Rare/none Heuvelton M Rare/none Hilton M Rare/none Hinckley E Rare/none Hinesburg W Rare/none Hogansburg M Rare/none Hogback M Rare/none Hogback-ricker M Rare/none Holderton S Occasional Hollis S Rare/none Holly P Frequent Holyoke W Rare/none Holyoke-rock outcrop W Rare/none Homer S Rare/none Honeoye W Rare/none Hoosic W Rare/none Hornell S Rare/none Hornellsville S Rare/none Houghtonville W Rare/none Houghtonville-rawson W Rare/none Houseville S Rare/none Howard W Rare/none Hudson M Rare/none Hulberton S Rare/none Ilion P Rare/none Insula W Rare/none Ipswich V Frequent Ira M Rare/none Ischua M Rare/none Ivory S Rare/none Jebavy P Rare/none Joliet P Frequent Junius P Rare/none Kalurah M Rare/none Kanona S Rare/none Kars W Rare/none Kearsarge E Rare/none Kendaia S Rare/none
Soil Series
Drainage Class
Flooding Frequency
Kibbie S Rare/none Kingsbury S Rare/none Kinzua W Rare/none Knickerbocker E Rare/none Lackawanna W Rare/none Lagross W Rare/none Lagross-haights W Rare/none Lairdsville M Rare/none Lakemont P Rare/none Lakewood E Rare/none Lamson P Rare/none Lanesboro W Rare/none Langford W Rare/none Lansing W Rare/none Leck kill W Rare/none Leicester P Rare/none Leon P Rare/none Lewbath W Rare/none Lewbeach W Rare/none Leyden M Rare/none Lima M Rare/none Limerick P Frequent Linden W Rare/none Linlithgo S Occasional Livingston V Rare/none Lobdell M Occasional Lockport S Rare/none Lorain P Rare/none Lordstown W Rare/none Lovewell M Occasional Lowville W Rare/none Loxley V Rare/none Lucas M Rare/none Ludlow M Rare/none Lupton V Rare/none Lyman E Rare/none Lyman-becket-berkshire E Rare/none Lyme P Rare/none Lyons P Rare/none

NY P Runoff Index - Documentation and User’s Manual. First Edition. 7/8/2003.
- 61 -
Appendix B (continued). Soil Series
Drainage Class
Flooding Frequency
Machias M Rare/none Macomber W Rare/none Macomber-taconic W Rare/none Madalin P Rare/none Madawaska M Rare/none Madrid W Rare/none Malone S Rare/none Manahawkin V Frequent Mandy W Rare/none Manheim S Rare/none Manhoning S Rare/none Manlius W Rare/none Mansfield V Rare/none Maplecrest W Rare/none Marcy P Rare/none Mardin M Rare/none Marilla M Rare/none Markey V Rare/none Marlow W Rare/none Martisco V Frequent Massena S Rare/none Matoon S Rare/none Matunuck V Frequent Medihemists V Rare/none Medina W Rare/none Medomak V Frequent Melrose W Rare/none Menlo P Rare/none Mentor W Rare/none Merrimac W Rare/none Middlebrook M Rare/none Middlebrook-mongaup M Rare/none Middlebury M Occasional Millis W Rare/none Millsite W Rare/none Mineola M Rare/none Miner P Rare/none Mino S Rare/none Minoa S Rare/none
Soil Series
Drainage Class
Flooding Frequency
Mohawk W Rare/none Moira M Rare/none Monadnock W Rare/none Monarda S Rare/none Mongaup W Rare/none Montauk W Rare/none Mooers M Rare/none Morocco P Rare/none Morris S Rare/none Mosherville S Rare/none Muck V Rare/none Muck-peat V Rare/none Mundal W Rare/none Mundalite W Rare/none Mundalite-rawsonville W Rare/none Munson S Rare/none Munuscong P Rare/none Muskego V Rare/none Muskellunge S Rare/none Napoleon V Rare/none Napoli S Rare/none Nassau E Rare/none Naumburg S Rare/none Nehasne W Rare/none Nellis W Rare/none Neversink P Rare/none Newfane W Rare/none Newstead S Rare/none Newton V Rare/none Niagara S Rare/none Nicholville M Rare/none Ninigret M Rare/none Norchip P Rare/none Norwell S Rare/none Norwich V Rare/none Nunda M Rare/none Oakville W Rare/none Occum W Occasional Odessa S Rare/none

NY P Runoff Index - Documentation and User’s Manual. First Edition. 7/8/2003.
- 62 -
Appendix B (continued). Soil Series
Drainage Class
Flooding Frequency
Ogdensburg S Rare/none Olean M Rare/none Ondawa W Occasional Oneida S Rare/none Onoville M Rare/none Ontario W Rare/none Onteora S Rare/none Ontusia S Rare/none Oquaga W Rare/none Oramel S Rare/none Organic V Rare/none Orpark S Rare/none Orwell P Rare/none Ossipee V Rare/none Otego M Occasional Otisville E Rare/none Ottawa W Rare/none Ovid S Rare/none Palatine W Rare/none Palms V Frequent Palmyra W Rare/none Panton P Rare/none Papakating P Frequent Parishville M Rare/none Parsippany P Rare/none Patchin P Rare/none Pawcatuck V Frequent Pawling M Occasional Paxton W Rare/none Peacham P Rare/none Peat V Rare/none Peat-muck V Rare/none Peru M Rare/none Petoskey W Rare/none Phelps M Rare/none Philo M Occasional Pillsbury S Rare/none Pinckney M Rare/none Pipestone S Rare/none Pittsfield W Rare/none
Soil Series
Drainage Class
Flooding Frequency
Pittstown M Rare/none Plainbo E Rare/none Plainfield E Rare/none Plessis S Rare/none Plymouth E Rare/none Podunk M Occasional Poland W Rare/none Pompton M Rare/none Pootatuck M Occasional Pope W Occasional Potsdam W Rare/none Poygan V Rare/none Punsit S Rare/none Pyrities W Rare/none Quetico W Rare/none Quetico-rock outcrop W Rare/none Raquette S Rare/none Rawsonville W Rare/none Rawsonville-beseman W Rare/none Rayne W Rare/none Raynham S Occasional Raypol P Rare/none Red hook S Rare/none Redwater S Frequent Remsen S Rare/none Retsof S Rare/none Rexford S Rare/none Rhinebeck S Rare/none Ricker E Rare/none Ricker-lyman E Rare/none Ridgebury P Rare/none Rifle V Rare/none Riga M Rare/none Rippowam P Frequent Riverhead W Rare/none Rockaway W Rare/none Romulus P Rare/none Ross W Rare/none

NY P Runoff Index - Documentation and User’s Manual. First Edition. 7/8/2003.
- 63 -
Appendix B (continued). Soil Series
Drainage Class
Flooding Frequency
Roundabout S Rare/none Rumney P Frequent Runeberg P Rare/none Ruse P Rare/none Rushford M Rare/none Saco V Frequent Salamanca M Rare/none Salmon W Rare/none Saprists V Rare/none Saugatuck S Rare/none Scantic P Rare/none Scarboro P Rare/none Schoharie M Rare/none Schroon M Rare/none Schuyler M Rare/none Scio M Rare/none Scituate M Rare/none Scriba S Rare/none Searsport P Rare/none Shaker P Rare/none Shoreham V Rare/none Sisk V Rare/none Skerry M Rare/none Sloan V Frequent Sodus W Rare/none Somerset P Rare/none St johns P Rare/none Staatsburg W Rare/none Stafford S Rare/none Steamburg M Rare/none Stetson W Rare/none Stissing P Rare/none Stockbridge W Rare/none Stockholm P Rare/none Stowe W Rare/none Sudbury M Rare/none Suffield M Rare/none Summerville E Rare/none Sun V Rare/none Sunapee M Rare/none
Soil Series
Drainage Class
Flooding Frequency
Suncook E Occasional Suny P Rare/none Surplus V Rare/none Surplus-sisk V Rare/none Sutton M Rare/none Swanton P Rare/none Swartswood W Rare/none Swormville S Rare/none Taconic W Rare/none Taconic-macomber W Rare/none Tawas V Rare/none Teel M Frequent Tioga W Occasional Toledo V Rare/none Tonawanda S Rare/none Tor S Rare/none Torull S Rare/none Towerville M Rare/none Trestle W Occasional Trout river E Rare/none Troy M Rare/none Trumbull P Rare/none Tughill V Rare/none Tuller S Rare/none Tunbridge W Rare/none Tunbridge-adirondack W Rare/none Tunkhannock W Rare/none Turin S Rare/none Tuscarora M Rare/none Unadilla W Rare/none Valois W Rare/none Varick P Rare/none Varysburg W Rare/none Venango S Rare/none Vergennes M Rare/none Vly W Rare/none Volusia S Rare/none Waddington W Rare/none Wainola S Rare/none

NY P Runoff Index - Documentation and User’s Manual. First Edition. 7/8/2003.
- 64 -
Appendix B (continued). Soil Series
Drainage Class
Flooding Frequency
Wakeland S Frequent Wakeville S Occasional Wallace E Rare/none Wallington S Rare/none Wallkill V Frequent Walpole P Rare/none Walton W Rare/none Wampsville W Rare/none Wappinger W Occasional Wareham P Rare/none Warners V Frequent Wassaic M Rare/none Watchaug M Rare/none Waumbeck M Rare/none Wayland P Frequent Weaver M Occasional Wegatchie P Rare/none Wellsboro M Rare/none Wenonah W Occasional Westbury S Rare/none Westland V Rare/none Wethersfield W Rare/none Wharton M Rare/none Whately V Rare/none Whippany S Rare/none Whitelaw W Rare/none Whitman V Rare/none
Soil Series
Drainage Class
Flooding Frequency
Wilbraham S Rare/none Willdin M Rare/none Willette V Rare/none Williamson M Rare/none Willowemock M Rare/none Wilmington P Rare/none Wilpoint M Rare/none Windsor E Rare/none Winooski M Rare/none Wolcottsburg P Rare/none Wonsqueak V Rare/none Woodbridge M Rare/none Woodlawn W Rare/none Woodstock E Rare/none Woodstock-rock outcrop E Rare/none Wooster W Rare/none Woostern W Rare/none Woostern-bath-valois W Rare/none Worden S Rare/none Worth W Rare/none Wurtsboro M Rare/none Wyalusing P Frequent Yalesville W Rare/none Yorkshire M Rare/none