new york economic handbook 2008 - agecon...
TRANSCRIPT

December 2007 E.B. 2007-20
New York Economic Handbook
2008
Department of Applied Economics and Management College of Agriculture and Life Sciences
Cornell University Ithaca, NY 14853-7801

It is the Policy of Cornell University actively to support equality of educational and employment opportunity. No person shall be denied admission to any educational program or activity or be denied employment on the basis of any legally prohibited discrimination involving, but not limited to, such factors as race, color, creed, religion, national or ethnic origin, sex, age or handicap. The University is committed to the maintenance of affirmative action programs which will assure the continuation of such equality of opportunity. This material is based upon work supported by Smith Lever funds from the Cooperative State Research, Education, and Extension Service, U.S. Department of Agriculture. Any opinions, findings, conclusions, or recommendations expressed in this publication are those of the author(s) and do not necessarily reflect the view of the U.S. Department of Agriculture. Publication Price Per Copy: $10.00 For additional copies, contact:
Linda Putnam Dept. of Applied Economics and Management Agricultural Finance and Management Group 305 Warren Hall Cornell University Ithaca, New York 14853-7801
E-mail: [email protected] Fax: 607-255-1589 Phone: 607-255-8429 Or visit:
http://aem.cornell.edu/outreach/publications.htm

i
Table of Contents Chapter Topic Author(s)* Page
1 Websites for Economic Information and Commentary
Steven Kyle 1-1
2 The Marketing System Kristen Park 2-1
3 Cooperatives Brian Henehan and Todd Schmit 3-1
4 Finance Calum Turvey 4-1
5 Grain and Feed Todd Schmit and William Tomek 5-1
6 Dairy – Markets and Policy Mark Stephenson 6-1
7 Dairy – Farm Management Wayne Knoblauch, George Conneman and Linda Putnam
7-1
8 Immigration Issues Craig Regelbrugge and Thomas Maloney
8-1
9 Agriculture and the Environment Nelson Bills, David Kay and Gregory Poe
9-1
10 Vegetables Wen-fei Uva 10-1
11 Ornamentals Wen-fei Uva 11-1 ____________________ *Faculty, staff or former staff in the Department of Applied Economics and Management, Cornell University, except Craig Regelbrugge, Senior Director of Government Relations, American Nursery and Landscape Association; and David Kay, Department of Development Sociology, Cornell University.
This publication contains information pertaining to the general economic situation and New York agriculture. It is prepared primarily for use by professional agricultural workers in New York State. USDA reports provide current reference material pertaining to the nation’s agricultural situation. Many of these reports are available on the internet. Click on “Newsroom” at the following website: http://www.usda.gov/wps/portal/usdahome
The chapters in this handbook are available in PDF format on the Applied Economics and
Management outreach website: http://aem.cornell.edu/outreach/publications.htm

ii

S.C. Kyle Websites for Economic Information and Commentary
Chapter 1. Websites for Economic Information and Commentary
Steven C. Kyle, Associate Professor
1. http://rfe.org Resources for Economists This American Economics Association website has an encyclopedic list of all sorts of web-based economics sites.
2. http://www.economagic.com/ Economagic -- Economic Times Series PageEconomagic is an excellent site for all kinds of U.S. economic data, including national income accounts, the Federal Reserve, the Bureau of Labor Statistics and more. The site includes a very useful graphing function and allows downloads to excel worksheets as well as simple statistical functions.
3. http://www.econstats.com/ Economic Statistics EconStats is another site with links to all kinds of US data. It also has links to data for many other countries.
4. http://www.whitehouse.gov/fsbr/esbr.html Economics Statistics Briefing RoomThis is the White House site for overall economics statistics. This also includes links to other parts of the government.
5. http://www.cbpp.org/index.html Center on Budget and Policy PrioritiesThe Center on Budget and Policy Priorities is a non-partisan web site that focuses on economic policies related to the budget and their effects on low- and moderate-income people.
6. http://www.argmax.com/ ArgMaxThis is an excellent site for economic news, data links and analysis.
7. http://www.econlib.org/ Library of Economics and LibertyThe Library of Economics and Liberty web site features articles and links to many books and other economics related resources.
8. http://www.heritage.org/ Heritage FoundationThe Heritage Foundation comments on economic policy from a conservative viewpoint. This link takes you to a very useful federal budget calculator that will help you understand what the federal government spends its money on and where they get the money from.
9. http://www.kowaldesign.com/budget/ Budget ExplorerThis site contains a budget explorer which I like because it allows you not only to calculate your own budget but also links to the various executive branch departments with spending authority, so you can see exactly where the money is going.
10. http://www.concordcoalition.org/ The Concord CoalitionThe Concord Coalition is a non-partisan group advocating a balanced budget. Their site contains very useful graphs and projections showing what current taxing and spending proposals mean for the federal budget in the years ahead.
11. http://www.economy.com/dismal/ The Dismal ScientistThis is a very good web site for evaluations of current statistics and policy.
Page 1-2 2008 Outlook Handbook
Websites for Economic Information and Commentary S.C. Kyle
12. http://www.federalbudget.com/ National Debt Awareness CenterThe National Debt Awareness Center has a useful graph providing up to date information on the size of the national debt and what the Federal Government is spending money on.
13. http://www.ombwatch.org/ OMB WatchOMB Watch is another web site devoted to information on what is happening to the federal budget.
14. http://www.brook.edu/default.htm The Brookings InstitutionThe Brookings Institution publishes lots of good articles on current economic and political policy.
15. http://www.realtor.org National Assoc. of RealtorsCheck this site if you want information on real estate.
16. http://www.census.gov/ U.S. Census BureauThe U.S. Census Bureau web site provides demographic and population numbers.
17. http://www.briefing.com/Investor/Index.htm Briefing.comFor a more in-depth analysis of stock and bond markets and the factors that influence them, check out Briefing.com.
18. http://www.imf.org/ International Monetary FundThe International Monetary Fund is an excellent site for data on all member countries, with a particular emphasis on balance of payments, exchange rate and financial/monetary data.
19. http://worldbank.org/ The World Bank Group The World Bank has cross country data on a wide variety of subjects.
20. http://www.undp.org/ United Nations Development Programme The UNDP has cross country data with a particular focus on measures of human welfare and poverty.
21. http://www.fao.org/ Food and Agriculture Organization of the UNThe Food and Agriculture Organization of the UN has cross country information on food and agriculture.
22. http://datacentre2.chass.utoronto.ca/pwt/ Penn World TablesThe Penn World Tables are a useful source for a variety of economic data series not available from other sources.
23. http://www.bls.gov/fls/ U.S. Department of Labor, Foreign Labor StatisticsThe Foreign Labor Statistics program provides international comparisons of hourly compensation costs; productivity and unit labor costs; labor force, employment and unemployment rates; and consumer prices. The comparisons relate primarily to the major industrial countries, but other countries are included in certain measures.
24. http://www.kyle.aem.cornell.edu/ Professor Kyle’s Web SiteVisit my web site for information about me, material contained in this chapter, and my work in the area of economic policy.

K. S. Park The Marketing System
Chapter 2. The Marketing System Kristen S. Park, Extension Associate
Special Topic – Food Safety: Its Effect on the Agricultural Marketing System
The subject of food safety is shaking up consumers and the food industry. In the last 18 months we have lived through e. coli in packaged spinach; e. coli at Taco Bell; dog food contaminant (found later in other sectors of the animal industries); the pesticide aldicarb found in imported ginger from China; the e. coli beef recall that shuttered Topps meat processor; and the list goes on.
The associated food safety recalls have highlighted food security weaknesses in our system. The food
sector and individual industries are focused on improvements in certification programs, testing programs, production practices, and traceability practices. Consumers are asking for transparency and results. But as the industry supply chains become more complex, encompassing greater geographies, farms, suppliers, product formulations, etc., the problems—and the solutions—also become more complex. How are these forces effecting the market?
Consumer Perceptions In a national shopper survey in June 2007, the Food Industry Management Program at Cornell asked
shoppers their perceptions about some food safety issues specifically in fresh fruits and vegetables (since this study surveyed shoppers specifically about produce, caution is needed before assuming that the results apply to other industries). When asked if they were concerned about germs, pesticides, and imports, consumers answered as follows with pesticides being of concern to a large majority of respondents (83.4%) (Table 2 – 1). While 50.2% of shoppers were concerned about germs in their produce, even more shoppers were concerned about imported produce (72.6%). We might guess that the impact of the numerous recalls for products produced in China has had on shopper opinions will last quite a while and that these recalls have shaded opinions about imports from other countries as well. One consumer responding to the Cornell survey said, “Imported produce makes me nervous to the point where I will not buy anything from China for me or my animals.”
TABLE 2 – 1. CONSUMER CONCERNS OVER FOOD SAFETY ISSUES IN FRESH FRUITS AND VEGETABLES
Fresh Fruit and Vegetable Food safety Issues
Percent Responding “Agree” or “Strongly Agree”
“I am concerned about pesticide residues on my fresh fruits and vegetables.”
83.8%
“I am concerned about the safety of fresh fruits and vegetables imported from other countries.”
72.6%
“I am worried about germs on my fresh fruits and vegetables.” 50.2%
Source: Inside the Minds of Retailers and Consumers, McLaughlin, Edward W., Kristen Park, and Debra Perosio. Food Industry Management Program working paper, September 2007.

Page 2-2 2008 Outlook Handbook
The Marketing System K. S. Park
Consumers are concerned. And given the Center for Disease Control’s increased ability to detect and trace food safety outbreaks and contaminants, there may well be a period of adjustment when consumers will decide how they will react to these and future outbreaks. Even now some consumers are paying or say they are willing to pay for a safer food supply. For example 73.3% of the shoppers Cornell surveyed said they are willing to pay more for produce certified as “safe” (Table 2 – 2). This elicits many questions for the industry to ponder. Who does the certification—private or public? At what additional retail price? And can they guarantee that level of safety? At the very least, providing consumers with more information about current food safety practices could not hurt. It could be that reassurance and information is really what the consumer is looking for.
Almost 54% of all shoppers said they believe organics are safer than regularly grown produce. And
some consumers perceive they are paying for “safety certification” in the form of price premiums for certified organics.
At least some consumers correlate food safety and the distance food has traveled. In the same survey
of produce shoppers, 66.4% “agreed” or “strongly agreed” with the statement, “I feel that locally grown fresh fruits and vegetables are safer than produce that is transported long distances.” Some shoppers perceive that anything shipped is somehow “preserved” or treated with hormones. One shopper said she preferred “local” produce because it wasn’t “gassed”. A focus group participant in the study said, “I feel local produce is safer. It is not packaged with chemicals to make it last longer.”
Supply Chain Pro-actions Many in the supply chain have acted swiftly in response to the recent food safety challenges—even
before consumers became fully engaged in their own reactions. Most of these efforts are focused on production practices and testing along the supply chain. One practice that could be improved significantly is traceability. In almost all recent outbreaks, traceability has not been as effective. Companies need to do what it takes to ensure traceability—use all the existing technology to the full extent, manage plant operations, improve on technology, use suppliers who can trace product back to production fields.
In general, all efforts are totally opaque to the general public and there is a significant opportunity to
tell consumers about efforts made to ensure a safer food supply.
TABLE 2 – 2. CONSUMER ATTITUDES TOWARDS FRESH FRUIT AND VEGETABLE INDUSTRY PRACTICES
Survey Statement: Percent Responding “Agree”
or “Strongly Agree” “I would pay extra for fresh fruits and vegetables certified as being grown under safe farming practices.” 73.3% “I believe organic fresh fruits and vegetables are safer than regularly grown produce.” 53.3% “I feel that locally grown fresh fruits and vegetables are safer than produce that is transported long distances.” 66.4%
Source: Inside the Minds of Retailers and Consumers, McLaughlin, Edward W., Kristen Park, and Debra Perosio. Food Industry Management Program working paper, September 2007.

2008 Outlook Handbook Page 2-3
K. S. Park The Marketing System
• Retailers receive their point of sale information primarily from suppliers. Actively engage with your own promotion/advertising group or trade association to provide a well-researched statement of industry actions in providing consumers with safe food. Proactive information provided in supermarkets—AND OTHER PLACES—about pesticide safety and use might help alleviate or reduce consumer concerns. Certified grower programs such as Integrated Pest Management could be highlighted proactively by retailers to inform consumers about efforts to reduce pesticide usage.
• Major U.S. growing regions, with arguably the best technology and safe growing programs in the
world, need major help in communicating this to the consuming public. They are losing the confidence of consumers to local establishments.
• Whether from the farm down the road or halfway around the world most consumers are interested
in knowing where their produce is grown. In addition, as people no longer grow what they eat nor have a close connection with where their food comes from, they may feel a loss of control over what they eat. Imported food is a concern for 72.6% of shoppers surveyed, but “local” is sought by almost 70% of shoppers.
• Since consumers embrace local programs and feel that local is “safer”, NYS producers should
take advantage of this opportunity to work with markets to establish or expand local, in-store programs. Simultaneously, retailers should be working with only local producers employing the safest production and distribution practices from farm to store.
Increasing consumer awareness of the relevance of local or regional foods and shorter supply chains
and the desire to know the source of their food represents a major opportunity for NYS agriculture. The challenge for NY’s agriculture sector will be to seize the opportunity by delivering food with the quality and security that the State’s consumers expect.

Page 2-4 2008 Outlook Handbook
The Marketing System K. S. Park
USDA Agricultural Sector Indicators – Food Prices The following projections to 2016 were developed by researchers at USDA-Economic Research Service. Their full report can be found at: http://www.ers.usda.gov/publications/oce071/
“Strong economic growth in highly energy-dependent economies in Asia, including China, India, and other rapidly growing Asian economies, is a major factor pushing oil prices higher in the projections. Reductions in energy intensity in these economies are expected, however.”
-- USDA Agricultural Projections to 2016, Paul Westcott, USDA-ERS contact. OCE-2007-1, February 2007.
Increases in consumer food prices, food inflation, are expected to be higher over the next 3 years than in previous years and expected to be higher than the overall CPI (Table 2 – 3). Rising energy prices coupled with increases in corn-based ethanol production join forces to increase farm commodity prices. Rising energy prices also are increasing the costs of manufacturing and transporting food to the major markets. The commodities driving the larger increases in food inflation are the corn-based animal products, such as meats, poultry, and eggs. Dairy prices are expected to increase strongly in 2008 but then drop to average increases by 2009-2010.
TABLE 2 – 3. USDA PROJECTIONS FOR CHANGES IN CONSUMER FOOD PRICES. Table 32. Changes in consumer food prices, long-term projections
CPI category 2005 2006 2007 2008 2009 2010 2011 2012 2013 2014 2015 2016
All food 2.4 2.4 1.9 2.8 2.9 2.7 2.4 2.0 1.7 1.7 1.7 1.9
Food away from home 3.1 3.1 2.8 2.8 3.0 2.8 2.6 2.4 2.2 2.2 2.2 2.3
Food at home 1.9 1.7 1.5 2.8 2.8 2.7 2.3 1.7 1.4 1.4 1.3 1.5
Meats 2.3 0.7 -1.2 3.6 4.2 3.6 2.5 1.4 0.5 0.2 0.3 0.8 Beef and veal 2.6 0.8 -0.5 3.2 5.0 4.0 2.9 1.0 0.0 0.0 0.1 0.6 Pork 2.0 -0.2 -1.9 5.0 4.1 3.5 2.1 1.8 0.8 0.0 0.0 0.7 Other meats 2.4 1.8 -2.0 2.5 2.3 2.2 1.7 1.7 1.4 1.2 1.2 1.4 Poultry 2.0 -1.8 1.1 3.8 6.2 5.8 4.5 2.0 0.4 -0.4 0.0 0.7 Fish and seafood 3.0 4.7 3.5 3.0 2.5 2.5 2.5 2.5 2.5 2.5 2.5 2.5 Eggs -13.7 4.9 7.1 12.7 10.4 5.8 2.5 1.4 1.4 1.4 1.4 1.3 Dairy products 1.2 -0.5 2.3 3.2 2.6 2.3 2.0 0.5 0.0 0.2 0.0 0.2 Fats and oils -0.1 0.2 2.6 2.8 2.5 2.4 2.4 1.9 1.7 1.8 1.7 1.8 Fruits and vegetables 3.7 4.8 1.0 2.0 1.9 1.9 1.9 1.9 1.9 2.0 1.9 1.9 Sugar and sweets 1.2 3.8 1.7 1.4 1.4 2.5 2.2 2.1 2.0 2.0 2.0 2.0 Cereals and bakery products 1.5 1.8 2.8 2.3 2.1 2.4 2.4 2.4 2.4 2.4 2.3 2.4 Nonalcoholic beverages 2.8 2.1 2.1 2.1 2.1 2.1 2.1 2.1 2.1 2.1 2.1 2.1 Other foods 1.6 1.4 1.6 1.6 1.5 1.5 1.5 1.6 1.5 1.6 1.5 1.5
Percent
Source: USDA Agricultural Projections to 2016, Paul Westcott, USDA-ERS contact. OCE-2007-1, February 2007. http://www.ers.usda.gov/publications/oce071/

2008 Outlook Handbook Page 2-5
K. S. Park The Marketing System
The Producer Price Index
While not a part of the 2016 ag projections mentioned above, the Producer Price Index (PPI), unlike
the CPI, is based on prices received by producers from whomever makes the first purchase. For many farm products it has not changed much since 1982 which is the base year. For example, a PPI of 100.0 reflects a farm price equal to that of the base year, 1982. The PPIs shown here, in the figure below, including that for all consumer foods, have all hovered between roughly 80 – 160%, a testimony perhaps to the great output and efficiencies of the agricultural system but also to the downward price pressures put on the system. Since 2002, fresh vegetables, excluding potatoes, have shown more consistent, overall farm price gains with a 2006 PPI of 160.5. Beef and veal showed stronger prices in the last 2004 – 2005 but dropped slightly in 2006, while others, especially eggs, have exhibited low and fluctuating producer prices and are expected to plummet in 2008.
PRODUCER PRICE INDICES, FARM PRODUCTS
Base Year = 1982
40.0
60.0
80.0
100.0
120.0
140.0
160.0
180.0
2002 2003 2004 2005 2006
PPI,
1982
=100 Consumer foods
Fresh f ruit
Fresh vegetables
Eggs
Beef /veal products
Fluid milk
Source: USDA-ERS, Agricultural Outlook http://www.ers.usda.gov/publications/Agoutlook/AOTables/ last updated October 2007.
USDA Agricultural Sector Indicators – Food Prices, continued Consumer expenditures for food away from home are expected to finally surpass expenditures for
food at home in 2009 (Figure 2 – 1). Expenditures for food away from home will continue to grow in importance through 2016. In 2005, away from home expenditures were 48.5% of total food expenditures. By 2010, they are expected to be 50.4% of total and to be 51.1% by 2015 (Table 2 – 4).

Page 2-6 2008 Outlook Handbook
The Marketing System K. S. Park
Per capita consumption of some food products is expected to increase during the projection period,
including horticultural products, fruit and vegetables, as well as nuts. Consumer demand for produce year round continues to drive increases in imports of fresh fruits and vegetables. Meats consumption, however, is expected to decline for the next 3 years due to high prices and only increase in the latter period of the projections.
FIGURE 2 – 1. CONSUMER FOOD EXPENDITURE PROJECTIONS
400.0
500.0
600.0
700.0
800.0
900.0
2005 2010 2015
Bill
ion
$ Food at home
Food away fromhome
Source: USDA Agricultural Projections to 2016, Paul Westcott, USDA-ERS contact. OCE-2007-1, February 2007. http://www.ers.usda.gov/publications/oce071/
TABLE 2 – 4. FOOD EXPENDITURE PROJECTIONS 2005 2010 2015 Billion $ All food $1,023.2 $1,288.9 $1,571.8 Food at home 527.0 638.9 768.5 Food away from home 496.2 650.0 803.3 Percent Food at home 51.5% 49.6% 48.9% Food away from home 48.5 50.4 51.1
Source: USDA Agricultural Projections to 2016, Paul Westcott, USDA-ERS contact. OCE-2007-1, February 2007. http://www.ers.usda.gov/publications/oce071/

2008 Outlook Handbook Page 2-7
K. S. Park The Marketing System
The U.S. Food Marketing System Update
Despite predicted increases in the food price index for the next 3 years, in general, food costs as a percent of disposable income continue to decrease. Fifty years ago, families and individuals spent 18% of their disposable income on food, while in 2006, food cost only 9.9% of our disposable income (Figure 2 – 2).
Food and beverage sales experienced very good growth in 2006, increasing 6.9% from 2005
(Table 2 – 5). Food-away-from-home sales grew particularly well (7.2%).
FIGURE 2 – 2. FOOD EXPENDITURES AS A SHARE OF DISPOSABLE PERSONAL INCOME
18.1
14.813.6
11.610.4 9.9
0.0
5.0
10.0
15.0
20.0
1956 1966 1976 1986 1996 2006
% o
f dis
posa
ble
inco
me
Source: USDA-ERS, Food CPI, Prices and Expenditures. http://www.ers.usda.gov/Briefing/CPIFoodAndExpenditures/Data/table7.htm
TABLE 2 – 5. FOOD SALES1
Sector Sales 2005 Sales 2006 Increase Growth
--$ billion-- --$ billion-- --% change-- Total food and beverage sales 1,157,940 1,237,266 79,326 6.9 Total food sales (excluding alcohol) 1,010,069 1,082,495 67,426 6.6 Food at home sales 515,096 546,932 31,812 6.1 Food away from home sales 451,550 486,181 35,615 7.2 Alcoholic beverage sales 142,871 154,771 11,900 8.3
1 Does not include home production, donation, or school lunch program expenditures Source: USDA-ERS, http://www.ers.usda.gov/briefing/CPIFoodAndExpenditures/Data/table1.htm, last updated: July 2, 2007.

Page 2-8 2008 Outlook Handbook
The Marketing System K. S. Park
Increases in away from home consumption will be due to a combination of decreases in cooking in the home and increases in the relative costs of food away from home due to increases in costs associated with foodservice handling, preparation, and servicing. Table 2 – 6 illustrates this trend for increasing restaurant prices relative to retail prices.
The USDA calculates farm value and marketing costs for food produced and consumed in the United
States. In 2005, the latest year with data, consumer expenditures for food produced in the U.S. were $831 billion (Figure 2 – 3). Of that, the farm value portion was $157.8 or 19.5% of expenditures.
A recent study by USDA-Economic Research Service researcher, Hayden Stewart, analyzed the
methodology for calculating “farm value” for fresh fruits and vegetables.1 The results indicate that the farm value, at least for produce, has been understated in recent years. According to Steward, farm value is being calculated according to the “market basket” of foods shoppers purchased in the mid-80s. The current market basket for produce contains much larger quantities of higher valued commodities such as asparagus, greenhouse peppers, and romaine lettuce rather than celery, onions, and iceberg lettuce. The current series estimates farm value in 2004 for fresh vegetables and fruits as 19% and 20% respectively. The farm value estimate using an adjusted market basket for fresh vegetables and fruits is 23.5% and 26.6% respectively. More work should be done to evaluate the other, non-produce commodities and market basket as a whole.
1 Stewart, Hayden. How Low Has the Farm Share of Retail Food Prices Really Fallen? Economic Research Report 24. USDA-Economic Research Service. August 2006.
TABLE 2 – 6. RELATIVE PRICES OF FOOD AT TWO STAGES OF THE SYSTEM
Year Restaurant prices Retail store
prices Percent of retail store prices
1996 170.9 100 1997 171.5 100 1998 172.7 100 1999 173.7 100 2000 173.8 100 2001 173.2 100 2002 175.4 100 2003 175.3 100 2004 173.9 100 2005 176.0 100 2006 178.3 100
Source: USDA-ERS, CPI, Food and Expenditures, http://www.ers.usda.gov/Briefing/CPIFoodAndExpenditures/Data/table13.htm July 2007.

2008 Outlook Handbook Page 2-9
K. S. Park The Marketing System
Of the $830.7 estimated expenditures for food produced and consumed in the U.S., $672.9 or 80.5%
are estimated to be for marketing costs. The term “marketing” costs is a bit misleading to some. Marketing costs include much more than
advertising and promotion costs, which are only a small fraction of the marketing costs. Marketing costs include processing post farm gate, such as all food processing and manufacturing, as well as distribution from production areas to the larger markets. The increasing portion of marketing costs is a reflection of the greater transformation of farm products to consumer ready-to-eat products. In addition, marketing costs associated with food away from home expenditures are greater than retail costs as they include chef preparation and restaurant overhead costs. And as consumers eat out more, these costs constitute a greater portion of the marketing bill.
Estimates of the components of the marketing bill from 1995 – 2005 are shown in Figure 2 – 4. Since
2000, there has been little fluctuation in the proportion spent on each component. Recent surges in energy prices in 2006 and 2007, however, are currently being felt in transportation, distribution, and manufacturing. Data for these periods are not available at this time.
FIGURE 2 – 3. U.S. FARM VALUE AND MARKETING BILL, 1995 - 20051
113.8 157.8
415.7
672.9
0.0
200.0
400.0
600.0
800.0
1000.0
1995 2000 2005
Bill
ions
$830.7
529.5
Marketing Costs
Farm Value
Consumer Expenditures
1 Marketing bill and farm value components of consumer expenditures for domestically produced farm foods Source: USDA-ERS Food Marketing and Price Spreads, http://www.ers.usda.gov/Briefing/FoodPriceSpreads/bill/table1.htm (updated by email November 2007).

Page 2-10 2008 Outlook Handbook
The Marketing System K. S. Park
FIGURE 2 – 4. MARKETING BILL COMPONENTS FOR FOOD PRODUCED IN THE U.S., 2005
0.0
10.0
20.0
30.0
40.0
50.0
60.0
1995 2000 2005
%
LaborPackagingTransportationEnergyProfitsMiscellaneous
“Other” includes depreciation, rent, advertising and promotion, interest, taxes, licenses, insurance, professional services, local for-hire transportation, food service in schools, colleges, hospitals, and other institutions, and miscellaneous items The marketing bill is the difference between the farm value and consumer expenditures and covers processing, wholesaling, transportation, retailing costs, and profits. Source: USDA-ERS, Food Marketing and Price Spreads, http://www.ers.usda.gov/Briefing/FoodPriceSpreads/bill/table2.htm (updated by email November 2007)
Miscellaneous: Advertising 4.0% Rent 4.0 Deprec. 3.5 Bus. Taxes 3.5 Interest 2.5 Repairs 1.5 Other 2.5

B. Henehan, T.M. Schmit Cooperatives
Chapter 3. Cooperatives Brian M. Henehan, Senior Extension Associate, & Todd M. Schmit, Assistant Professor
U.S. Situation
Farmer cooperatives in the U.S. had gross sales of over $126 billion in 2006 (Table 3-1). Total business volume was up nearly four percent from $122 billion in 2005. However, while total cooperative sales increased, sales changes across cooperative types varied considerably. In the largest category, marketing cooperatives experienced a decrease in sales of farm products of nearly 2 percent to $76.5 billion. However, farm supply cooperative sales increased to nearly $46 billion, or a 16.7 percent increase from 2005. Cooperative farm services decreased nearly 5 percent to $4.1 billion in 2006.
From 2005 to 2006, total assets increased 2.8 percent, liabilities increased 3.3 percent, and equity
grew two percent (Table 3-1). Total net income before taxes increased significantly by 24 percent to $3.2 billion. Patronage income increased 24 percent, from $400 to $500 million over this one year period. Farmer cooperatives remain one of the largest employers in many rural communities. Total full- and part-time employees increased slightly in 2006 to 181,000.
Table 3-1. U.S. FARMER COOPERATIVES, COMPARISON OF 2006 AND 2005
Item Sales Marketing Farm Supplies Service Total Balance sheet Assets Liabilities Equity Liabilities and net worth Income Statement Sales (Gross) Patronage income Net income before taxes Employees Full-time Part-time, seasonal Total Membership Cooperatives
2006
($ billion)
76.5 45.9 4.1 126.5
47.9 28.0 19.9 47.9
126.5 0.5
3.2
(Thousand) 123.4 57.3
180.7
(Million) 2.6
(Number)
2,675
2005 ($ billion)
78.0 39.3 4.3
121.7
46.6 27.0 19.5 46.6
121.7 0.4 2.5
(Thousand) 125.4 54.4 179.9
(Million) 2.6
(Number)
2,896
Change percent
-1.98 +16.72 -4.90 +3.96
+2.80 +3.35 +2.03 +2.80
+3.96 24.15 +24.13
-1.62 5.26 0.46
-0.08
-7.63 Source: Rural Cooperatives, July/August 2007. Rural Business-Cooperative Service, USDA, Washington, D.C.

Page 3-2 2008 Outlook Handbook
Cooperatives B. Henehan, T.M. Schmit
Farm numbers continue to decline, as do memberships in cooperatives and the number of farmer cooperatives. Cooperative memberships remained level at 2.6 million, in 2006. Many farmers are members of more than one cooperative, hence cooperative memberships exceed U.S. farm numbers. There were 2,675 farmer cooperatives in 2006, down from 2,896 for the previous year. New York State Situation
State-level data for agricultural cooperatives headquartered in New York State were obtained from the biennial Cooperative Service survey cited below. The most current statistics available are for the years of 2005 and 2003. Table 3-2 summarizes cooperative numbers and business volume for New York State.
Table 3-2. NEW YORK STATE AGRICULTURAL COOPERATIVE NUMBERS AND NET BUSINESS VOLUME BY MAJOR BUSINESS, 2005 and 20031 Major Business Activity Marketing: Dairy Fruit & Vegetable Other Products2 TOTAL MARKETING Supply: Crop Protectants Feed Fertilizer Petroleum Seed Other Supplies TOTAL SUPPLY Related Service3 TOTAL
Number Headquartered in State 2005 2003 57 61 9 9 5 6 71 76 7 11 4 [included
with supply] _____ 82 87
Net Volume 2005 2003 ($ million) 1,676.3 1,229.9 37.0 72.5 42.7 152.1 ______ 1,856.0 1,454.5 1.2 50.9 39.3 103.8 11.9 42.6 5.0 28.5 2.3 57.8 28.3 73.7 88.0 357.3 88.2 242.3 ______ 2,032.2 2,054.1
Source: Farmer Cooperative Statistics, 2005, Service Report 65, USDA, RBS, Washington, DC April, 2007 and Farmer Cooperative Statistics, 2003. Rural Development Service Report 64, USDA, Washington, DC April, 2006. 1 Totals may not add due to rounding. 2 Includes wool, poultry, dry bean, grains, livestock, maple syrup, and miscellaneous. 3 Includes those cooperatives that provide services related to cooperative marketing and purchasing.
The number of agricultural cooperatives headquartered in New York State in 2005 showed a net decrease of 5 cooperatives from 2003, with fewer dairy cooperatives and a decrease in the number of other marketing cooperatives. Total net business volume declined from $2,054 million in 2003 to $2,032 million in 2005, a decrease of 27 percent. It should be noted that state level data for agricultural cooperatives are becoming more difficult to obtain as more are operating across broader multi-state areas. Cooperatives headquartered in New York State generate significant business volume outside of New York State and a number of cooperatives headquartered outside of New York generate significant volume in New York.

2008 Outlook Handbook Page 3-3
B. Henehan, T.M. Schmit Cooperatives
Total net volume for marketing cooperatives decreased by $522 million, with fruit and vegetable marketing cooperatives showing a significant decrease in volume over the two-year period. Total volume for other products marketed through cooperatives increased. A major portion of the decline in revenues for fruit and vegetable cooperatives came from restructuring in the processed fruit and vegetable industry. Net business volume for dairy marketing cooperatives showed strong increases over the two-year period of about $446 million or 36 percent.
Supply cooperative volume decreased by $269 million due to decreased overall sales, as well as
ongoing impactw of the loss of the Agway system. Total volume for services related to marketing or purchasing decreased from about $242 million to $88 million over the two-year period. Cooperative Share of Northeast Federal Milk Marketing Order 1
The proportion of milk receipts handled by dairy cooperatives fluctuated over the last 20 years, leveling off at about 67 percent from 1996 to 1999 under the old Federal Order 2 (Figure 3-1). However, the cooperative share of milk receipts increased significantly to 76 percent in 2000 under the new consolidated Order combining former Federal Order 1 (New England), Federal Order 2 (New York-New Jersey), and Federal Order 4 (Middle Atlantic) into the new Northeast Milk Marketing Order 1. The increase following the consolidation of Orders was primarily the result of pre-existing higher percentages of milk being shipped to cooperatives in the former Orders 1 and 4. Those higher percentages increased the total average of milk received by cooperatives in the new Order 1. The cooperative share of milk receipts for the first nine months of 2007 declined slightly to 76 percent from an average of 77 percent during the previous year.
FIGURE 3-1. COOPERATIVE SHARE OF PRODUCER MILK RECEIPTS, FEDERAL ORDER 2 (1986-1999) and NORTHEAST FEDERAL ORDER 1 (2000-2007) a
0
10
20
30
40
50
60
70
80
Perc
ent
87 88 89 90 91 92 93 94 95 96 97 98 99 00 01 02 03 04 05 06 07
Year
Federal Order 2 NE Federal Order 1
Source: Market Administrator's Office, Northeast Federal Milk Marketing Order 1. a Year 2007 is based on data for the first 8 months of the year. Data from 2000 forward represent the consolidated Federal Milk Marketing Order 1, the merger of the old Federal Orders 1, 2, and 4.

Page 3-4 2008 Outlook Handbook
Cooperatives B. Henehan, T.M. Schmit
Cooperative Performance
The financial performance of agricultural cooperatives operating in New York State has on the whole been good. Due to the importance of dairy marketing and service cooperatives to New York producers, we will review their situation first.
As discussed above, the share of milk receipts accounted for by dairy marketing cooperatives under
Federal Milk Marketing Order 1 has remained stable at about 76 percent from 2000 through 2005. For the first nine months of 2007, the cooperative share has declined slightly by 1 percent. There is a volume of milk produced by farmers who are not members of cooperatives that is being marketed in Federal Order 1 by a cooperative marketing alliance that combines independent supplies of milk with that from cooperative members.
Dry weather conditions in scattered areas of New York during the growing season put pressure on
field crop harvests and milk production. Otherwise weather during planting and harvest seasons has been, in general, favorable.
Milk prices have increased significantly over the last year which contributed to more positive performance of cooperatives offering dairy herd improvement or breeding genetics to members. Export sales of genetics and increased international operations continue to add to the revenues of the major genetics cooperative.
Dairy cooperatives involved in value-added operations experienced mixed results. Two New York headquartered dairy marketing cooperatives completed a merger that will combine manufacturing operations. Preliminary results of the merger are positive with projected for economic gains being achieved. Sales of yogurt and other soft dairy products have been strong.
A dairy product manufacturing cooperative running various types of processing plants has been
recovering from losses due to increased costs of energy, packaging and high value inventories, as well as weak cheese sales. However the international market for dry milk products has been very strong. Cooperatives involved in manufacturing and marketing dry dairy products for export have experienced strong sales and good returns.
The bankruptcy settlement of Agway, the major supply cooperative in the Northeast continues as
unsecured creditors have received periodic distributions from 2004 through 2007. Payments are being made to unsecured creditors until the Trust created by the bankruptcy court is exhausted. Total payments to be eventually received by unsecured creditors, many of whom were members or retired farmers, are estimated at between 54 cents and 66 cents on the dollar. As of August, 2007, a total of six have been made adding up to 53 cents on the dollar. Until all outstanding accounts are identified and all costs are deducted from the Trust, the value of the total distribution cannot be determined. For more information see the liquidating trust web site at: http://www.agwaylt.com
The major juice grape cooperative in New York has reported weaker sales, higher expenses, and
lower returns to growers. Consumer dietary trends have hurt sales of fruit juices. A new CEO has been selected to run the marketing company. He has trimmed management positions and is cutting costs. New marketing strategies have been implemented to improve performance. Financial performance has been improving. A larger advance payment was made to growers this Fall than last year.
A fresh apple marketing cooperative continues to grow with new members joining from across a
broader geography. This organization works on improving the coordination of marketing and quality control

2008 Outlook Handbook Page 3-5
B. Henehan, T.M. Schmit Cooperatives
on behalf of members. The apple crop is in general, comprised of smaller sized fruit. Warmer weather in the Fall may have a negative impact on the storability of the crop resulting in downward pressure on prices.
The major vegetable processing cooperative continues to re-structure operations following a change
in its relationship with a major food processing customer. When the processing and marketing assets of the cooperative were acquired by an investment group, a portion of member’s equity was converted to shares in the holding company that was created. That holding company sold processing assets and made a distribution to shareholders, including cooperative members. Members received a cash distribution based on their shares in the holding company that the equity investment group is currently managing.
A new frozen vegetable and fruit processing firm has acquired several processing plants in New
York and other states. The new owner is continuing to operate plants in New York State and maintain supplier relations with growers who previously delivered to those plants. Acreage of processing vegetables delivered to the cooperative remained stable, although dry weather conditions limited production of early crops in some areas.
The Farm Credit associations experienced relatively good financial performance during the year. Strengthening prices for a number of commodities combined with favorable weather in most areas will contribute to stronger farm financial performance and creditworthiness.
The cooperative bank that lends to rural cooperatives in the U.S. and New York, showed positive results during the most recent year that data are available. Net income, cash patronage distributions, and member equity all increased from last year. Cooperative Outlook
Most cooperatives operating in New York State had positive results in 2007. Stronger milk prices should help support the performance of dairy marketing and service cooperatives. Milk prices and dairy farm income are projected to remain at relatively high levels in 2008. Dairy producers should be able to receive prices above their cost of production and rebuild credit reserves. Dairy cooperatives continue to experience a declining member numbers as farmers exit farming. Improved financial conditions may tend to slow the rate of dairy farm sales and declining membership numbers.
Dairy cooperatives with value-added operations will experience increasing costs for processing milk,
packaging, transportation, and ingredients as energy prices continue to increase. It remains to be seen how energy prices unfold in 2008, but forecasts call for more increases.
Dietary concerns of consumers such as low carbohydrate diets and childhood obesity will continue
to impact sales of consumer food products produced or sold by marketing cooperatives. The "low-carb" craze of the past several years has waned a bit, but the increasing incidence of diabetes and childhood obesity continues to be a consumer concern. These concerns have created both challenges and opportunities for marketing cooperatives.
Although 2007 has brought a number of challenges for cooperatives operating in New York State, increasing milk prices, improved farm income, and revitalized organizations bode well for the upcoming year. Most cooperatives operating in New York State are well positioned for solid performance in 2008.

Notes

C.G. Turvey Finance
Chapter 4. Finance Calum G. Turvey, Professor
Table 4-1. United States Farm Balance Sheet Current Dollars, December 31
Excluding Operator Households
Item 2000 2002 2003 2004 2005 2006 2007c billion dollars
Assets
Real Estate 946 1,046 1,112 1,308 1,485 1,682 1,912 Livestock 77 76 79 79 81 81 81 Machinery 90 94 96 102 105 113 117 Cropsa 28 23 24 24 24 23 27 Purchased Inputs 5 5 6 6 6 6 7 Financial Assets 57 60 62 66 67 74 79 Total 1,203 1,304 1,379 1,585 1,769 1,979 2,223
Liabilities & Equity Real Estate Debt 91 103 94 97 102 109 112 Nonreal Estate Debtb 87 90 81 86 92 98 102 Total 178 193 175 183 194 207 214 Owner Equity 1,025 1,111 1,204 1,402 1,576 1,771 2,009 Total 1,203 1,304 1,379 1,585 1,769 1,979 2,223 Percent Equity 85 85 87 88 89 89 90
a Excludes crops under CCC loan. b Excludes CCC loans. c Forecast
Table 4-2. Changes in Structure, United States Farm Balance Sheet Current Dollars, December 31
Excluding Operator Households
Item 2000 2002 2003 2004 2005 2006 2007 c percent of total
Assets
Real Estate 79 80 81 83 84 85 86 Livestock 6 6 6 5 5 4 4 Machinery 7 7 7 6 6 6 5 All Othera 7 7 7 6 6 5 5 Total 100 100 100 100 100 100 100
Liabilities Real Estate Debt 51 53 54 53 53 53 52 Nonreal Estate Debtb 49 47 46 47 47 47 48 Total 100 100 100 100 100 100 100
a Excludes crops under CCC loan. b Excludes CCC loans. c Forecast Source: Agricultural Income and Finance Outlook, ERS, USDA; Agricultural Outlook: Statistical Indicators, ERS, USDA.
Page 4-2 2008 Outlook Handbook
_______________________________________________________________________________________ Finance C.G. Turvey
Table 4-3. Distribution of United States Farm Debt by Lender Current Dollars, December 31
Excluding Operator Households Item 1995 2000 2002 2003 2004 2005 2006b
billion dollars Real Estate Farm Credit System 24.8 29.7 37.8 37.7 37.7 40.1 43.9 Farm Service Agency 5.1 3.4 3.2 2.5 2.2 2.1 2.3 Commercial Banks 22.3 29.8 33.1 32.9 35.2 36.9 40.5 Insurance Companies 9.1 11.0 11.4 11.4 10.9 11.0 11.0 Individuals & Others 18.0 17.2 9.9 9.7 10.8 11.4 11.4 CCC-Storage 0.0 0.0 0.0 0.0 0.0 0.0 0.0 Total 79.3 91.1 95.4 94.1 96.9 101.5 109.0 Nonreal Estatea Farm Credit System 12.5 16.7 20.5 20.2 21.9 24.2 27.9 Farm Service Agency 5.1 4.2 4.0 3.6 3.2 3.0 2.8 Commercial Banks 37.7 44.8 44.3 43.6 45.8 48.5 51.7 Individuals & Others 16.2 20.8 13.0 13.6 15.1 16.0 16.0 Total 71.5 86.5 81.8 81.0 86.1 91.7 98.3
a Excludes crops under CCC loan. b Forecast: Data not available for 2007 at time of writing. Sums may differ from Table 4-1
Table 4-4. Market Share of United States Farm Debt by Lender Current Dollars, December 31
Excluding Operator Households Item 1995 2000 2002 2003 2004 2005 2006 percent of total
Farm Credit System 24.7 26.1 32.9 33.0 32.6 33.3 34.6 Farm Service Agency 6.8 4.3 4.0 3.5 3.0 2.6 2.4 Commercial Banks 39.8 42.0 43.7 43.7 44.3 44.2 44.5 Insurance Companies 6.0 6.2 6.4 6.5 6.0 5.7 5.3 Individuals & merchants 22.7 21.4 12.9 13.3 14.2 14.1 13.2 Totala 100.0 100.0 100.0 100.0 100.0 100.0 100.0
a Excludes crops under CCC loan. Source: Economic Research Service, USDA, Data, Farm Balance Sheet.

2008 Outlook Handbook Page 4-3
C. G. Turvey Finance
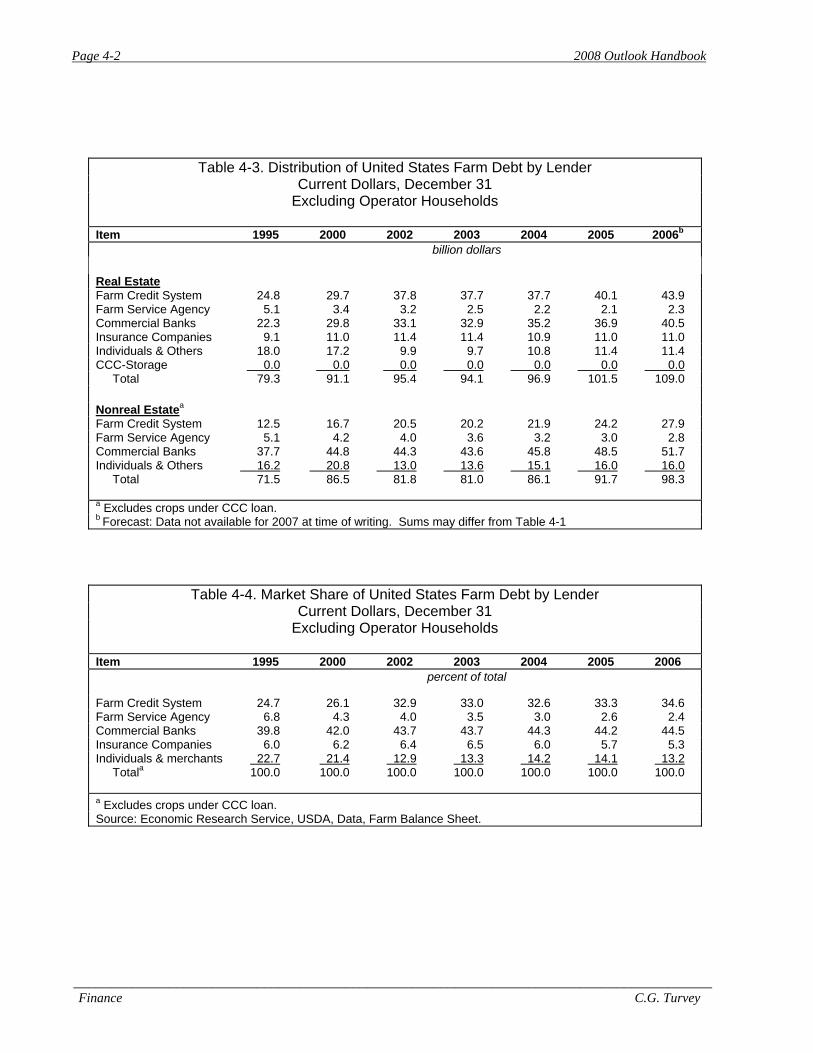
The value of U.S. farm assets increased 12.3% in 2007, largely mobilized by a surge in farm real estate values of 13.4% and well in excess of the rate of inflation (Tables 4-1 and 4-2). Sector debt levels, however, increased by only 3.4%, which is lower than the 6.7% increase than observed between 2005 and 2006. Consequently, the rate of growth in farm equity increased to over 13% and higher than the 12.3% recorded in 2006. Real estate debt increased by about 9.8% in comparison to a 4.1% increase in non-real estate debt. Part of this shift results from the need to fund higher value real estate and part reflects a change in methods of securing farm loans. In aggregate the degree of financial leverage in agriculture is very low at only 10%. With 90% of assets supported by equity (including unrealized capital gains) there is much room for leveraged growth and it is unlikely that any disturbances to the agricultural economy could not be withstood. New York typically has about 3-5% more debt than the U.S. average. The USDA has stopped providing state-level summaries.
Tables 4-3 and 4-4 show that the Farm Credit System continues to be the major provider of real-estate credit to agriculture, with a total of $43.9 billions in loans representing an increase of 9.49% in 2006. Commercial lenders are close with $40.5 billion in loans with an increase of 9.7% over 2005. By far commercial lenders provide the majority of non-real estate loans with a total of $51.7 Billion in 2006. In 2006 the Farm Credit System provided 34.6% of credit to farmers with commercial lenders providing 44.5%, largely due to the non-real estate business. The Farm Service Agency as well as other lenders are actually decreasing their lending activities in proportion to commercial lenders and Farm Credit.
Table 4-5. Nonaccrual and Nonperforming Loans Farm Credit System, December 31
Year Nonaccrual Nonperforminga percent of loan volume
1988 6.5 12.3 1989 5.1 11.0 1990 4.5 9.7 1991 3.7 8.0 1992 2.7
6.0
1993 2.3 4.2 1994 1.9 2.9 1995 1.4 2.1 1996 1.1 1.5 1997 0.9
1.3
1998 1.8 2.1 1999 1.4 1.6 2000 0.9 1.2 2001 0.9 1.2 2002 1.0
1.3
2003 1.1 1.3 2004 0.7 0.8
2005 0.6 0.6 2006 0.5 0.5 a Nonaccrual plus accrual that are restructured or 90 days or more past due (impaired loans). Source: Annual and Quarterly Reports of the Farm Credit System.

Page 4-4 2008 Outlook Handbook
_______________________________________________________________________________________ Finance C.G. Turvey
Credit quality of commercial lenders (Farm Credit and commercial banks) continues to be very high with an overall increase in soundness in 2007. The Farm Credit System saw a further decrease in both nonaccrual and nonperforming loans (Table 4-5) in 2006 only 1 in 200 loans was non performing or non accrual. This is a significant decline when compared to 2003 when more than 1 in a hundred was either non accrual or non performing. Nonaccrual and nonperforming loans are at about as low levels as they could be expected to attain without severely restricting credit to a large group of people, most of whom are good credit risks. Throughout the farm credit system loan performance to borrowers is as a near all time high in both 2006 and 2007. These conditions are largely mimicked in commercial lending (Table 4-6).
Table 4-6. Nonaccrural, Nonperforming, and Total Delinquent United States Commercial Banks, December 31
Farm Nonreal Estate Loans Farm Real Estate Loans Year Nonaccrual Nonperforminga Delinquentb Nonaccrual Nonperforming Delinquent
percent of loan volume 1988 2.9 3.3 4.5 1989 1.9 2.3 3.7 1990 1.6 1.9 3.1 1991 1.6 1.9 3.2
1992 1.5 1.8 2.8 1.0 1.3 2.1 1993 1.2 1.4 2.2 0.8 1.1 1.8 1994 0.9 1.1 2.0 0.9 1.4 2.4 1995 0.9 1.1 2.1
0.9 1.4 2.4
1996 1.0 1.3 2.4 1.0 1.7 2.8 1997 0.9 1.1 2.0 0.9 1.5 2.6 1998 0.9 1.2 2.2 1.0 1.7 2.9 1999 1.1 1.3 2.1
0.7 1.3 2.0
2000 1.0 1.2 2.1 0.8 1.4 2.3 2001 1.3 1.5 2.7 1.2 1.5 2.6 2002 1.3 1.6 2.6 1.2 1.5 2.5 2003 1.2 1.5 2.3
1.1 1.3 2.1
2004 0.9 1.0 1.6 0.8 1.0 1.6 2005 0.5 0.7 1.3 0.6 0.7 1.3 2006 0.5 0.6 1.3 0.5 0.7 1.3 2007 0.5 0.8 1.9 0.5 0.7 1.6 a Includes nonaccrural and past due 90 days but accruing. b Includes nonperforming and past due 30 to 89 days but accruing. Source: Agricultural Financial Databook, Board of Governors of the Federal Reserve System.
2008 Outlook Handbook Page 4-5
C. G. Turvey Finance
Outlook on Credit Supply and Credit Risk
Ratio of Agricultural Production Loans to Consumer Mortgage Charge Offs and Delinquency
-1
0
1
2
3
4
5
1991
Q1
1991
Q4
1992
Q3
1993
Q2
1994
Q1
1994
Q4
1995
Q3
1996
Q2
1997
Q1
1997
Q4
1998
Q3
1999
Q2
2000
Q1
2000
Q4
2001
Q3
2002
Q2
2003
Q1
2003
Q4
2004
Q3
2005
Q2
2006
Q1
2006
Q4
2007
Q3
Quarter
Rat
io
Charge offDelinquencyPoly. (Charge off)Poly. (Delinquency)
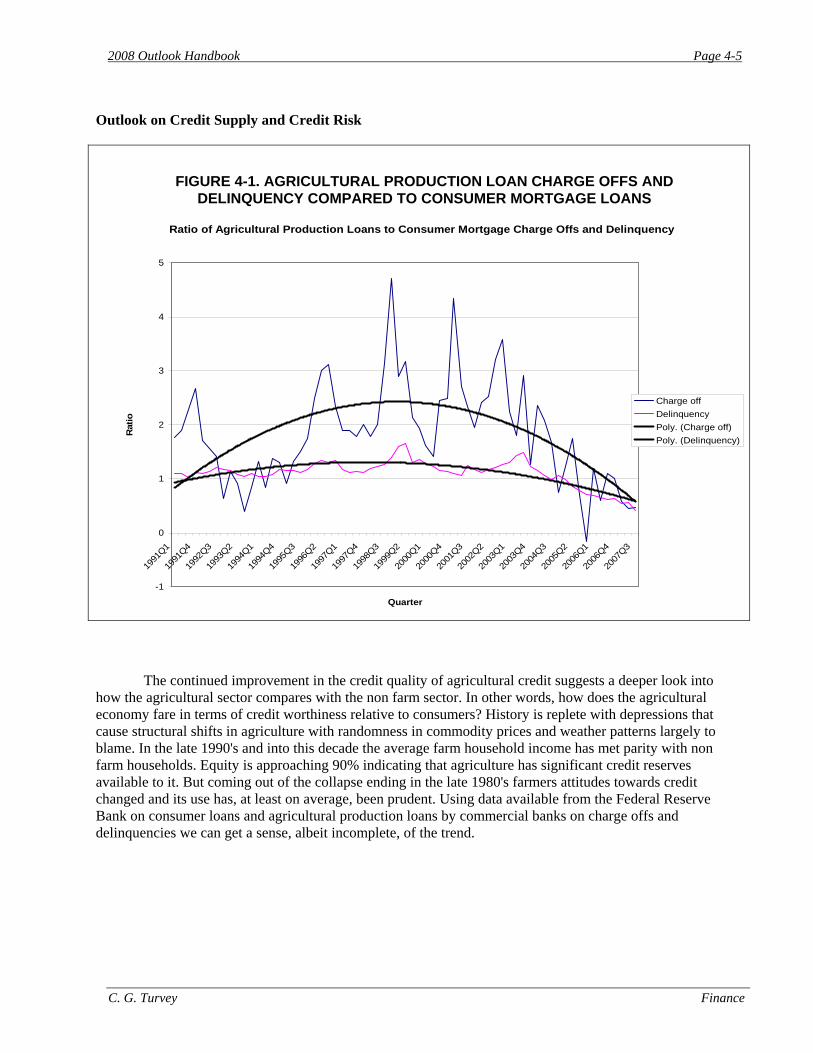
The continued improvement in the credit quality of agricultural credit suggests a deeper look into how the agricultural sector compares with the non farm sector. In other words, how does the agricultural economy fare in terms of credit worthiness relative to consumers? History is replete with depressions that cause structural shifts in agriculture with randomness in commodity prices and weather patterns largely to blame. In the late 1990's and into this decade the average farm household income has met parity with non farm households. Equity is approaching 90% indicating that agriculture has significant credit reserves available to it. But coming out of the collapse ending in the late 1980's farmers attitudes towards credit changed and its use has, at least on average, been prudent. Using data available from the Federal Reserve Bank on consumer loans and agricultural production loans by commercial banks on charge offs and delinquencies we can get a sense, albeit incomplete, of the trend.
FIGURE 4-1. AGRICULTURAL PRODUCTION LOAN CHARGE OFFS AND DELINQUENCY COMPARED TO CONSUMER MORTGAGE LOANS

Page 4-6 2008 Outlook Handbook
_______________________________________________________________________________________ Finance C.G. Turvey
Ratio of Agricultural Production Loans to Consumer Credit Chargeoffs and Delinquency
-0.2
0
0.2
0.4
0.6
0.8
1
1.2
1991
Q1
1991
Q4
1992
Q3
1993
Q2
1994
Q1
1994
Q4
1995
Q3
1996
Q2
1997
Q1
1997
Q4
1998
Q3
1999
Q2
2000
Q1
2000
Q4
2001
Q3
2002
Q2
2003
Q1
2003
Q4
2004
Q3
2005
Q2
2006
Q1
2006
Q4
2007
Q3
Quarter
Rat
io
ChargeoffDelinquencyPoly. (Delinquency)Poly. (Chargeoff)
Up to the fourth quarter of 2004 the delinquency rate on agricultural production loans was always higher than consumer mortgage loans (Figure 4-1). This was as high as 149% in 2003, and between 1990 and 2003 the average was 121%. There is nothing critical about this since the timing and sequencing of cash flows in agriculture do not always match the terms of loan repayment. However in 2004 this trend reversed itself and delinquencies in agricultural loans fell dramatically so that in 2007 the delinquency rate is only half of that on consumer mortgages. More critically charge offs of agricultural production loans were twice that of consumer mortgages averaging 206% between 1990 and 2003. However this too reversed itself starting in 2003 where now in 2007 the charge off rates of agricultural loans is only 41% of charge offs on consumer loans. In terms of total consumer loans including credit cards and non revolving loans for auto and improvements, the delinquency rate and charge off rates in agriculture have always been lower (Figure 4-2). Delinquency rates peaked in 1991 at about 91% of consumer loans but has fallen steadily since so that today the delinquency rate relative to all consumer loans is only 0.366. The charge off ratio is much lower. The peak charge off ratio was 0.238 in late 1990, as farmers were coming off the collapse in the 1980s. Since then, the decline and the prudential use of agricultural credit has resulted in a charge off ratio of only 0.05 in 2007. In other words a consumer loan is nearly 20 times more likely to charged off by a commercial lender that an
FIGURE 4-2. AGRICULTURAL PRODUCTION LOAN CHARGE OFFS AND DELINQUENCY COMPARED TO ALL CONSUMER LOANS

2008 Outlook Handbook Page 4-7
C. G. Turvey Finance
agricultural production loan. Two qualifications to this are required. The first is that the farm production loans do not include FSA loans but data we have for 2005 indicate that FSA delinquencies and charge offs are no worse than consumers. In other words, the most severe distresses in agriculture are no worse that the average of consumers. The second qualification is that only production credit is considered. This may not be critical. First, charge offs on agricultural production loans will most surely in most cases take place before charge offs on farm mortgages so the farm mortgage charge off rate will be much lower than consumer mortgages as presented here. Second, consumer credit includes not only mortgages but also credit cards and other non-revolving credit sources. It may be the case that a farmer has a delinquency on a personal credit card, but most commercial farms now operate off lines of credit from which cards are paid as well as equipment purchases and repairs and inputs and so on. It is therefore possible that a farmer can have both a consumer loan and a production loan, so at best we can say that the ratios so presented are lower bounds. Even so, we are seeing in 2007 not only a continued parity with the non-farm sector in terms of income but overall improvement in credit quality. Outlook on Interest Rates Short term interest rates bottomed out at the lowest level in 50 years in late 2003 and early 2004 and have been rising throughout 2005, 2006 and 2007. The average 2004 prime rate was 4.3% but this increased to 6.19% in 2005, 7.96% in 2006 but has fallen slightly to 7.74% through October 2007 (Figure 4-3). Rates are still historically low and have not been at this level since 2001 and before that 1967. In mid 2005 and continuing through the first part of 2007 the Federal Reserve Board pushed interest rates up from these historic levels in an effort to reach a more neutral monetary policy position and inflation pressure. The current credit crisis in sub prime lending has given pause to these increases and it is expected that prime rates will fall further and hold steady throughout 2008. On a calendar year basis, short term rates averaged 1.4% in 2004, increased to 3.22% for 2005, and averaged around 4.75% for 2006 and currently hovers around 3.9% (Figure 4-4).
FIGURE 4-3. ANNUAL AVERAGE SHORT TERM INTEREST RATES
0
5
10
15
20
1968 1973 1978 1983 1988 1993 1998 2003
Perc
ent
Prime Rate Major Banks
3 Month Treasury Bills

Page 4-8 2008 Outlook Handbook
_______________________________________________________________________________________ Finance C.G. Turvey
FIGURE 4-4. MONTHLY SHORT TERM INTEREST RATES
0
1
2
3
4
5
6
7
8
9
10
1993 1994 1995 1996 1997 1998 1999 2000 2001 2002 2003 2004 2005 2006 2007
Perc
ent
Prime Rate Major Banks
3 Month Treasury Bills
High quality corporate bonds continue to be at their lowest level since the 1960’s (Figure 4-5). As of October 2007 the spread between Aaa Corporate and 10-year government bonds was 1.13% a spread larger than the 0.78% spread observed in 2006. This increase in the spread indicates an increase in the riskiness of corporate bonds relative to government bonds. However, the Aaa rate actually fell from 5.99% in October 2006 to 5.66% in October 2007. The 10-year bonds have shown a slight decrease from 4.73% in October 2006 to 4.53% in October 2007 (Figure 4-6). The fact that both long and short run bond rates are declining suggests that rates should be falling or at least stabilizing in 2008.
3 Month Treasury Bills
2006 2007
Jan. 4.24 4.98
Feb. 4.43 5.03
Mar. 4.51 4.94
Apr. 4.60 4.87
May 4.72 4.73
June 4.79 4.61
July 4.95 4.82
Aug. 4.96 4.20
Sept 4.81 3.89
Oct. 4.92 3.90
Nov. 4.94
Dec. 4.85
FIGURE 4-5. ANNUAL LONG TERM INTEREST RATES
0
2
4
6
8
10
12
14
16
1967 1972 1977 1982 1987 1992 1997 2002
Perc
ent
Corporate Aaa Bonds(Moody's)
U.S. Gov't Bonds 10 Year Constant Maturities

2008 Outlook Handbook Page 4-9
C. G. Turvey Finance
FIGURE 4-6. MONTHLY LONG TERM INTEREST RATES
0
2
4
6
8
10
12
14
16
1993 1994 1995 1996 1997 1998 1999 2000 2001 2002 2003 2004 2005 2006 2007
Per
cent
Corporate Aaa Bonds(Moody's)
U.S. Gov't Bonds10 Year Constant Maturities
FIGURE 4-7. CONTRACT AND REAL INTEREST RATES
-5
0
5
10
15
20
1970 1973 1976 1979 1982 1985 1988 1991 1994 1997 2000 2003 2006
Perc
ent
Prime Rate
Real Prime
Inflation continues to be of concern. The 2006 inflation rate was 3.5% and this has fallen to 3.2% in 2007. The real (inflation adjusted) prime rate has consequently remained reasonably constant at 4.46% in 2006 and 4.54% in 2007 (Figure 4-7).
U.S. Govt. Bonds
10 Year Constant Maturity
2006 2007 Jan. 4.42 4.76
Feb. 4.57 4.72 Mar. 4.72 4.56
Apr. 4.99 4.69 May 5.11 4.75 June 5.11 5.10 July 5.09 5.00 Aug. 4.88 4.67 Sept 4.72 4.52 Oct. 4.73 4.53 Nov. 4.60 Dec. 4.56

Page 4-10 2008 Outlook Handbook
_______________________________________________________________________________________ Finance C.G. Turvey
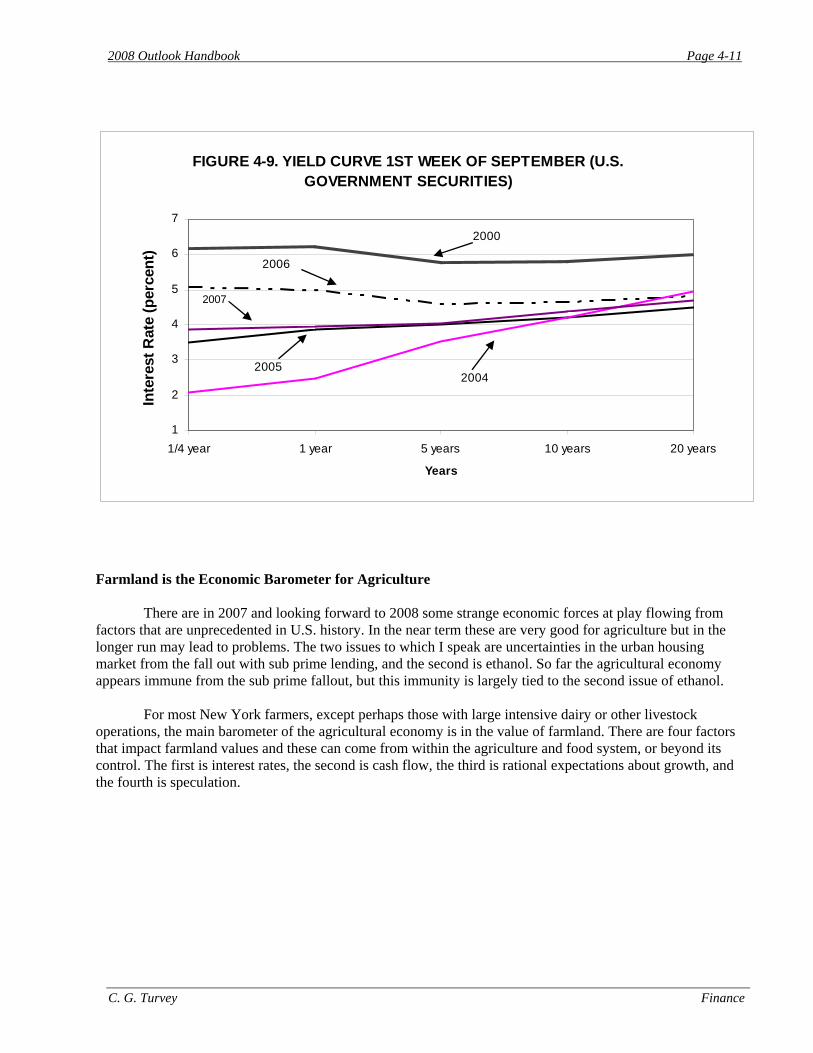
The inverted bond yield curve that was observed in the fall of 2006 has normalized indicating a certain resilience in short term to long term risks (Figures 4-8 and 4-9). As with 2007 there are many uncertainties in the market making it difficult to predict what interest rates are going to do in 2008. However, while the inverted curve of 2006 suggested a reduction in short term rates in 2007, money markets may cause a slight rise in 2008. This may not be much. The spread between 3-month and 1-year t-bills is only 0.06% and between 1-year and 5-year treasury bills the spread is only 0.09%. This is low relative to current inflation rates and may be indicative of lower expected market risks. Continued federal spending on the Iraq war and homeland security, coupled with reductions in tax revenue is placing significant pressure on the current account. Current account spending is being financed largely through bond issues to foreign governments. As indicated previously the crisis in the current housing market, which was of major concern in Outlook 2007, needs to be resolved. New York State has taken action and soon a White House strategy freezing teaser rates will be considered.
The current spread between the prime rate and the 90-day Treasury bill rate is about 3.84% above the average spread of about 3.5%. Given the current yield curve, 90 day rates will probably not exceed 5% if current economic conditions persist, but could rise further with inflation or any deterioration in the economy. Historically agricultural loan rates (operating and mortgage loans) have been about 1.32% above prime. This suggests that in 2007 interest rates on agricultural loans will likely settle in the range of about 9.06%, given current prime rates of 7.74%.
FIGURE 4-8. LONG AND SHORT TERM REAL INTEREST RATES
-6
-4
-2
0
2
4
6
8
10
1967 1972 1977 1982 1987 1992 1997 2002 2007
Per
cent
U.S. Treasury Notes and BondsConstant Maturities - 10 year
3 Month Treasury Bills
2008 Outlook Handbook Page 4-11
C. G. Turvey Finance
FIGURE 4-9. YIELD CURVE 1ST WEEK OF SEPTEMBER (U.S. GOVERNMENT SECURITIES)
1
2
3
4
5
6
7
1/4 year 1 year 5 years 10 years 20 years
Years
Inte
rest
Rat
e (p
erce
nt)
2005
2000
2006
2004
2007
Farmland is the Economic Barometer for Agriculture There are in 2007 and looking forward to 2008 some strange economic forces at play flowing from factors that are unprecedented in U.S. history. In the near term these are very good for agriculture but in the longer run may lead to problems. The two issues to which I speak are uncertainties in the urban housing market from the fall out with sub prime lending, and the second is ethanol. So far the agricultural economy appears immune from the sub prime fallout, but this immunity is largely tied to the second issue of ethanol. For most New York farmers, except perhaps those with large intensive dairy or other livestock operations, the main barometer of the agricultural economy is in the value of farmland. There are four factors that impact farmland values and these can come from within the agriculture and food system, or beyond its control. The first is interest rates, the second is cash flow, the third is rational expectations about growth, and the fourth is speculation.

Page 4-12 2008 Outlook Handbook
_______________________________________________________________________________________ Finance C.G. Turvey
Sub Prime and Interest Rates What is happening in the urban/residential housing market is beyond the control of any farmer, but its fallout will likely have an impact. The sub prime housing market has two components. The first is a low entry interest rate that would allow homeowners, many of whom are low to middle income, purchase homes that would not ordinarily be affordable. In some instances the mortgages were designed as interest only and with high loan to value ratios this required that house prices would need to continuously rise on the future. The security for these loans was not in ability to pay but in unproven capital gains. In time, of course, nothing is given away. To compensate for low entry interest rates the sub prime lenders had to eventually increase or adjust the interest rate and this is where the economy is at today, except with the additional complication of a downturn in housing prices. To counter hundreds of thousands of foreclosures and to provide an offset to stock market volatility, monetary policy has moved to decrease interest rates. A decrease in interest rates makes the present value worth of cash flows from agriculture increase and hence an increase in the bid price for farmland. The outlook for interest rates is discussed in more detail presently. The fourth factor identified above is speculation. Speculation in this context is tied to the development option to convert agricultural land into residential lots. The demand for housing in terms of housing starts features in this option, but so does the price of houses. The greater the demand for housing and the more that people are willing or able to pay for the houses, the greater will be the option value capitalized into farmland values. The value of this option increases with house prices and housing demand, and decreases with commuting distance. Nonetheless, to a large extent any inflation or deflation in urban land markets can have significant impacts on farmland prices. In many localities suffering from sub prime foreclosures and forced sale of housing the increased supply will cause a precipitous decline in residential home values. This in turn will reduce the development option and hence land prices. Whether or not the sub prime housing market will have a large impact in rural New York remains to be seen. Governor Spitzer has authorized a program through partnerships with Fannie Mae, mortgage lenders, and mortgage insurance companies, the State of New York Mortgage Agency to offer at-risk homeowners the ability to refinance their current mortgages with 30 or 40-year fixed-rate mortgages at competitive interest rates. This will stem the tide and slow the decline in house prices. Furthermore, much of the subprime activity has not taken place in agricultural areas of New York but in Connecticut, New Jersey and New York City. However, in March 2007 Senator Charles Schumer issued a report that indicated that as many as 50,000 homes in upstate New York were also at risk to foreclosure.

2008 Outlook Handbook Page 4-13
C. G. Turvey Finance
The Ethanol Factor One of the determining factors in the housing market is tied to increased costs in energy. For many sub prime borrowers increases in heating costs and gasoline took many hundreds of dollars away from debt servicing. But it is this same energy crisis that is providing the 2007 boon to agriculture. Oil price rises have now made the processing of ethanol profitable, and this has led to spectacular increases in the price of corn. As land is put into corn, land is taken out of soybeans and other crops and the expectation of fewer soybean acres has led to an impressive increase in the price of soybeans. Benefits on margin are being offset by other factors such as labor shortages, higher energy and fertilizer costs and higher rental rates, but the rise in commodity prices appears, at least in the short run, to more than offset cost increases leading to improved cash flow and net farm incomes. The betterment in cash flow will ultimately be capitalized into the price of farmland which will increase equity for landowners.
Table 4.7: 2007 Outlook on Corn, Soybeans, Milk and Ethanol
Futures Contract Commodity Price Forecasts 2007-2009 Month or Nearby Corn Soybeans Class III Milk Ethanol December 2007 3.87 10.96 20.16 1.93 March 2008 4.04 11.07 16.8 1.758 May 4.15 11.14 16.06 1.738 July 4.24 11.18 16.1 1.73 September 4.29 10.6 16.32 1.749 December 4.35 10.27 15.79 1.749 March 2009 4.41 10.26 15.1 1.835 May 4.44 10.22 15.24 1.835 July 4.47 10.3 15.25 1.835 December 4.31 9.62 15.35 1.835 Source: CBOT and CME
To emphasize the price effects determining the next year's income and financial situation in New York, Table 4-7 lists CBOT and CME futures prices for corn, soybeans, Class III milk and Ethanol. The prices represent the November 27th closing prices on futures contracts through December 2009. In October/November 2006 most of the prices languished; Corn was about $2.90/bu., soybeans about $6.30/bu, Class III milk about $13/cwt and ethanol about $1.65/gallon. As demand for ethanol rose with rising gas prices and more ethanol plants were put to paper its price rose to $1.93/gallon. Corn prices rose rapidly to $4.30 and settling in November 2007 to $3.87. But the prices are expected to rise to $4.35 by December 2008 and stay well above $4/bu into 2009. The response to adjustment from soybeans to corn and an anticipated increase in soybeans moved soybeans to nearly $11.00 today and staying above this until the 2008 harvest. The impact on milk prices, which affects New York farmers perhaps more than corn and soybeans, was swift. As corn prices rose so did feed costs. In order to maintain supply the costs would have to be passed on to processors and consumers. Alternatively the increased cost would reduce production and raise prices through supply and demand forces.

Page 4-14 2008 Outlook Handbook
_______________________________________________________________________________________ Finance C.G. Turvey
The Growth Factor The third factor is growth and it is this factor that is critical to the longevity of farmland price increases. The question is to what extent the current set of circumstances are sustainable in the long term? Growth can be positive as it is at present but it can also be negative. What is the rational expectation? When one considers corn, soybeans, milk and ethanol the four commodities are now highly correlated in a way that is new to the agricultural economy, and this can be very dangerous if the correlations are transitory. For example, alternative technologies to corne can, on speculation alone, drive down corn prices; or stable supplies in oil can drive down the price of oil making ethanol less valuable; or an increase in petroleum refining capacity or a reduction in petrol demand from energy conservation can also reduce the value of ethanol. But there is another factor that can operate within or outside the above uncertainties and that is loss of political support for ethanol. While some agricultural economists view ethanol as the panacea for agriculture’s woes, others are more circumspect. For one, the adjustment in corn acreage and the removal of corn from the food supply drives up the price of a major foodstuff, while the reduction in acreage planted to other grains and oilseeds also drives up those prices. Food inflation is politically regressive, and pressure may be placed on the next administration to remove or reduce the ethanol subsidy. Additionally, the increase in the price of commodities will also lead to adjustments from international competitors who will respond by increasing acreage of high priced crops which will ultimately drive prices down as imports fill the void. The point is, that if the current growth factors are capitalized into farmland values, farmers down the road will with high probability become disappointed. Outlook on Farmland Prices Movement in farmland values are shown in Table 4.8 for the Northeast, New York, the Corn Belt and the USA. Between 2003 and 2007 cropland values in New York increased from $1,390 to $1,920/acre an increase of 32.3% and a 5.3% increase between 2006 and 2007. Compare this to the Corn Belt with an increase in land prices of 49.4% since 2003 and 13.8% in the past year. Clearly there is a capitalization effect. Cash rents, in theory at least, capture the value of the marginal product from farming on a per acre basis. Cash rents in New York have increased only 5% since 2003 while increases in the Corn Belt and the Northeast increased by about 13%. If we consider the spread between a 32% increase in cropland values to a 5% increase in its productive value, we can see the capitalization and speculative effect. This is perhaps better represented in the lower panel which calculates the Value to rent ratio. In New York the ratio ranges from 37.6 to 49.2. To interpret, the latter number suggests that if the cash rents fully represent per acre profitability it would take 49 years to pay of an acre of farmland purchased for $1,920 in 2007. The impact of the development option can be seen in New York and the Northeast with the ratio in the Northeast (largely influenced by New Jersey, Delaware and Maryland). If we were to capitalize rents in New York at the same rate as average U.S. rents (3.69%) the value of farmland in New York would fall to $1,055/acre. In other words the development option included in the price of New York farms is as high as $864.70/acre.

2008 Outlook Handbook Page 4-15
C. G. Turvey Finance
Table 4.8: Farmland Values and Cash Rents
Real Estate $/acre 2003 2004 2005 2006 2007
NE 3200 3550 4110 4550 5000NY 1700 1780 1920 2050 2150Corn belt 2130 2300 2720 3050 3450USA 1270 1360 1650 1900 2160
Crop Land $/acre 2003 2004 2005 2006 2007
NE 3400 3800 4390 5040 5450NY 1390 1470 1530 1820 1920Corn belt 2270 2450 2880 3240 3720USA 1660 1770 2110 2390 2300
Cash Rent $/acre
NE 42 44.5 46 47 48NY 37 40 41 39 39Corn belt 110 114 117 119 126USA 73 76.5 78 79.5 85
Rent to Value Ratio
NE 80.95 85.39 95.43 107.23 113.54NY 37.57 36.75 37.32 46.67 49.23Corn belt 20.64 21.49 24.62 27.23 29.52USA 22.74 23.14 27.05 30.06 27.06 Source: USDA ERS Conclusions The outlook for 2008 is a good one for agriculture. Still farmers should be wary of immediate and future risks. Over the past several years much of the equity gains in agriculture have been due to farm real estate prices. The caution here is that much of the gains in commodity prices in the past year may be illusory, a combination of events and structural change that can be taken away very quickly. Commodities generally follow a random walk and can trend down just as easily as they can trend up depending on many factors. The warning here is that farmers should resist capitalizing recent gains into the long-term values of farm land. In the short run it appears that any waning in the urban housing market has not had a significant impact on farmland prices, but the impact is inevitable if foreclosures increase, increasing the supply of houses; decreasing the number of housing starts, and reducing the development option of farmland values.

Notes

T.M. Schmit and W.G. Tomek Grain and Feed
Chapter 5. Grain and Feed Todd M. Schmit, Assistant Professor, and Bill Tomek, Professor Emeritus
The growing demand for grains and oilseeds, relative to available supplies, is raising the average level of commodity prices and increasing price variability. Biofuel processors’ demands are a well-known, though still relatively recent factor influencing prices. Another source of increased demand for farm commodities is the growing income and population in China and India.
Prices are influenced not just by current economic conditions, but also by expected supplies and demands. Given the uncertainty about future economic and crop conditions, it is clear why prices will continue to vary. News arrives in markets every day about the many, world-wide factors influencing prices of commodities. Thus, it is difficult to provide helpful outlook statements, except to say that price levels will remain high relative to historical experience, and will vary substantially from day to day. Wheat
After a short crop last year, U.S. production of wheat in 2007-8 rebounded to near the level of two years ago (Table 5-1). Global wheat production is also larger this year relative to last, but expected supply is small relative to expected use. Wheat production is down in Australia and Europe, reflecting adverse weather conditions, especially in Australia. Year-end inventories for the world are forecast to be 17.4% of use, which is relatively small for the world as a whole.
For the U.S., the ending wheat inventory is projected to be 312 million bushels, the smallest level in almost 60 years. The stocks-to-use ratio is expected to be 13.6%, down from 26.5% just two years ago (Table 5-1). Wheat prices for December 2007 futures on the Chicago Board of Trade hit an all-time high this Fall of over $9.50 per bushel. Prices have since declined from the record levels, as high prices discouraged export demand. Nonetheless, the farm-level price of wheat is forecast to average over $6 per bushel for the current marketing year. This compares with $4.26 last year and $3.42 two years ago.
With stocks small relative to use, daily price changes are likely to be especially large. The December futures contract on the Chicago Board of Trade has experienced some “limit moves” of 30 cents per day. Unexpected news about exports, the size of next year’s crop in the U.S. and abroad, and other factors will have dramatic effects on prices. Prices of contracts for future delivery suggest that the average level of wheat prices will remain high relative to historical experience. New crop futures (July 2008 through May 2009) are trading over $6.50 per bushel, as are futures contracts for the 2009-10 year. If other crop prices remain high, as they likely will, wheat prices will need to remain high in order to maintain acres in wheat production in forthcoming years. An increase in acres planted to wheat would have to be attracted from other crops. This is, of course, true for other crops as well. Markets must work to find an equilibrium among supplies and demands for all crops within the context of a relatively fixed supply of cultivatable land.
Corn
When farmers made planting decisions last Spring, they expected corn prices to be high at harvest, and accordingly they increased the acres planted. Thus, acres harvested for corn for grain this Fall are estimated to be over 86 million, up from 70.6 million in 2006 (Table 5-2), and with a relatively good yield, production is estimated to be 13.2 billion bushels. This is a record crop, and with a carryover of 1.3 billion, total supply will be about 14.5 billion bushels.

Page 5-2 2008 Outlook Handbook
Grain and Feed T.M. Schmit and W.G. Tomek
TABLE 5-1. U.S. SUPPLY AND DEMAND BALANCE SHEET FOR WHEATa
2005-06 2006-07E 2007-08F Supply: Harvested Acres (million) 50.1 46.8 51.0 Yield (bushels per acre) 42.0 38.7 40.5
(Million Bushels) Beginning Stocks 540 571 456 Production 2,105 1,812 2,067 Imports 81 122 90 Total Supply 2,726 2,505 2,613 Use:
Food Seed Feed & Residual
915 78
160
934 81
125
940 86
125
Total Domestic Use 1,152 1,140 1,151 Exports 1,003 909 1,150 Total Use 2,155 2,049 2,301 Ending Stocks 571 456 312
Stocks/Use Ratio 26.5% 22.3% 13.6%
Avg. farm price, U.S., $bu. 3.42 4.26 6.10
Avg. farm price, NYS, $bu. 3.34 4.03 -
aData from USDA, “World Agricultural Supply and Demand Estimates,” (November 9,2007) WASDE-452.
This supply is needed in the sense that a record demand exists. The demand for corn for food and industrial uses is projected to jump over a billion bushels, much of this related to increased use for ethanol production (Table 5-2). Exports are also projected to increase over 200 million bushels, and corn used for animal feed is expected to be up about 50 million bushels. The net effect is that the ending inventory on August 31, 2008 is forecast to be nearly 600 million bushels more than this past August 31. The stocks-to-use ratio is thus forecast to be 15.1%, which is in line with historical experience. Over the 13 year period, 1994-5 to 2006-7, the ratio has been below 15% five times (one of which was 2006-7).
As an aside, the estimated use of corn for feed in 2006-7 looks small. Since it is computed as a residual (total supply minus exports, food and industrial uses, and ending inventories), this number may have a large error. If, for example, the crop size for 2006-7 were revised upward, other things equal, feed use would increase. Some observers believe that this will happen in January when the USDA makes its “final” estimate for the 2006-7 crop. If this happens, the forecast of feed use for the current marketing year would increase, thereby reducing the forecast of ending stocks. To the degree that the market does not anticipate such a revision–and it is uncertain–prices would rise. This uncertainty will not be resolved until the January report is released.
While U.S. ending stocks are forecast to be near normal, the stocks-to-use ratio world-wide continues to decline (Table 5-3). The huge U.S. crop has the consequence that world production is up in 2007-8. But, the carry-in of inventory for 2007-8 is small by historical standards.

2008 Outlook Handbook Page 5-3
T.M. Schmit and W.G. Tomek Grain and Feed
TABLE 5-2. U.S. SUPPLY AND DEMAND BALANCE SHEET FOR CORNa 2005-06 2006-07E 2007-08F Supply: Harvested Acres (million) 75.1 70.6 86.1 Yield (bushels per acre) 148.0 149.1 153.0
(Million Bushels) Beginning Stocks 2,114 1,967 1,304 Production 11,112 10,535 13,168 Imports 9 12 15 Total Supply 13,237 12,514 14,487 Use: Feed & Residual 6,155 5,598 5,650 Food, Seed and Industrial 2,981 3,488 4,590 Ethanol for Fuelb 1,603 2,117 3,200 Total Domestic Use 9,136 9,086 10,240 Exports 2,134 2,125 2,350 Total Use 11,270 11,210 12,590 Ending Stocks 1,967 1,304 1,897
Stocks/Use Ratio 17.5% 11.6% 15.1%
Avg. farm price, U.S., $bu. 2.00 3.04 3.50
Avg. farm price, NYS, $bu. 2.29 3.30 - aData from USDA, World Agricultural Outlook Board, (November 9, 2007) “World Agricultural Supply and Demand Estimates.” WASDE - 452 bEthanol for fuel is included in the food, seed, and industrial category and presented for illustrative purposes.
TABLE 5-3. WORLD SUPPLY AND DEMAND BALANCE SHEET FOR CORNa 2005-06 2006-07E 2007-08F
(Million Metric Tons) Supply: Beginning Stocks 130.68 123.02 104.98 Production 696.36 703.45 768.22 Imports 79.47 89.22 90.49
Use: Feed, Domestic 476.31 471.33 481.50 Total, Domestic 704.03 721.48 762.82 Exports 80.93 91.79 91.89
Ending Stocks 123.02 104.98 110.39 Stocks/Use Ratio 17.5% 14.6% 14.5% aData from USDA, World Agricultural Outlook Board, (November 9, 2007) “World Agricultural Supply and Demand Estimates.” WASDE - 452

Page 5-4 2008 Outlook Handbook
Grain and Feed T.M. Schmit and W.G. Tomek
The stocks-to-use ratio this past year for the world was 14.6%, and is projected to be 14.5% at the end of the current marketing year. These ratios are small relative to historical experience. The increased demand reflects not just ethanol use, but also increased demand for corn as livestock feed, especially in countries like India and China where income and population, and hence meat and dairy demand, are growing.
Production of corn, and other feed grains, is having a difficult time keeping pace with the growing demand. The market expects these demands to continue to grow in future years, and this is an important factor determining prices for current and future delivery (Table 5-4). Interestingly, the prices for forthcoming crop years (2008, 2009, 2010) are higher than current prices. In “normal” years, new crop harvest-time futures prices would be below the storage-month prices for the current year, but the market appears willing to pay some firms to carry inventory from this year to the next. The price of December 2008 futures is approximately 45 cents per bushel higher than for December 2007 delivery. The market clearly expects that the future demand for corn is going to be difficult to balance with supply.
TABLE 5-4 FUTURES PRICES FOR CORN CHICAGO BOARD OF TRADE, NOV.9, 2007
Contract Month - $ per bu. - December 2007 3.8675 March 2008 4.04 May 2008 4.1375 July 2008 4.225 September 2008 4.2575 December 2008 4.315 December 2009 4.315
If one examines the historical relationship of the farm price of corn to the stocks-to-use ratio in the U.S. (Figure 5-1), it is clear that the price in 2006-7 was high relative to the historical relationship, and this is forecast to be true for 2007-8 as well. The relationship is shifting up and to the right. Apparently, the market wants larger inventories relative to use, given the upward trend in total use.
Are there factors that could result in lower prices? The answer is yes, though the probability of returning to the historical relation depicted in Figure 5-1 is small. If a world-wide recession occurs, then the demand for livestock products would decrease, reducing the demand for feed grains. Unexpected increases in feed grain production in other countries would also reduce the demand for U.S. exports. Political instability is still another factor that might influence corn exports, hence corn prices. And surprise data revisions could cause prices to rise or fall.
In recent months, the gasoline refining sector has not had adequate infrastructure to use all of the
ethanol that was being produced. Thus, notwithstanding the increase in oil and gasoline prices, ethanol prices declined to the $1.50 to $1.60 per gallon range. As this is written, ethanol prices are showing signs of recovery, but they are still well below historical highs. A question is, how rapidly can refiners increase their capacity to use the ethanol that is being produced? To the degree that ethanol supply exceeds demand, there could be some downward pressure on corn prices in the short run. Presumably the capacity to use ethanol will improve.
The bottom line for corn, like wheat, is that prices are likely to remain at high levels by historical standards, but it is possible for prices to vary in a considerable range over the current marketing year.

2008 Outlook Handbook Page 5-5
T.M. Schmit and W.G. Tomek Grain and Feed
FIGURE 5-1. RELATIONSHIP BETWEEN CORN PRICES AND THE STOCKS-TO-USE RATIO, U.S.,1994-2006.
1.50
1.70
1.90
2.10
2.30
2.50
2.70
2.90
3.10
3.30
3.50
0.0% 5.0% 10.0% 15.0% 20.0% 25.0%
Stocks/Use Ratio
$'s
per B
ushe
l
2006/07
Soybeans
The increase in area planted to corn came at the expense of other crops, especially soybeans. Thus, harvested acres for soybeans are estimated to be 62.8 million this year compared with 74.6 million last year (Table 5-5). The national average yield is also down over one bushel per acre from last to this year. So, production in Fall 2007 is estimated to be about 2.6 billion bushels compared with 3.188 billion in 2006.
The smaller U.S. crop is somewhat offset by the upward trend in soybean production in the Southern hemisphere, particularly Brazil. However, the increase in production elsewhere will not completely offset the smaller U.S. crop. U.S. exports are forecast to decline about 150 million bushels, but domestic crushing of soybeans is expected to change little from year to year. Data about soybean use for biofuel is sketchy; at current prices, the margin on processing beans to fuel oil looks slim. In any case, the stocks-to-use ratio is expected to decline in both the U.S. and the world. The U.S. ratio of 7.1%, forecast for August 31, 2008, is relatively small. The world’s stocks are also somewhat smaller than normal (Table 5-6).
Thus, it is not surprising that soybean prices are high. The mid-point of the USDA price forecast for soybeans for the 2007-8 crop is $9.00 per bushel (Table 5-5); this number represents the national, farm-level average for the marketing year. As reported in Table 5-7, futures market prices, for delivery on the Illinois waterway, range from $10.56 per bushel (in January) to $10.74 (in July). If an average basis is subtracted from the futures prices, the implied national, farm-level price is somewhat above the $9.00 forecast of the USDA. NYS prices of soybeans have typically run a little below the national average.
New crop futures prices (for November 2008 and November 2009) are somewhat below current prices, but still high relative to historical experience. The consensus of traders in markets appears to be that relative to spring 2007, some acreage will move away from corn and back into soybeans. We will not have a reasonable indication of farmers’ intentions to plant, however, until March and April.

Page 5-6 2008 Outlook Handbook
Grain and Feed T.M. Schmit and W.G. Tomek
TABLE 5-5. SUPPLY AND DEMAND BALANCE SHEET FOR SOYBEANSa
2005-06 2006-07E 2007-08F
Supply: Harvested Acres (millions) 71.3 74.6 62.8 Yield (bushels per acre) 43.0 42.7 41.3
(Million Bushels)
Beginning Stocks 256 449 573 Production 3,063 3,188 2,594 Imports 3 9 6 Total Supply 3,322 3,647 3,173
Use: Crushings 1,739 1,806 1,825 Exports 940 1,118 975 Seed 93 78 86 Residual 101 71 77 Total Use 2,873 3,074 2,963 Ending Stocks 449 573 210 Stocks/Use Ratio 15.6% 18.6% 7.1% Avg. farm price, U.S., $bu. 5.66 6.43 9.00 Avg. farm price, NYS, $bu. 5.20 6.17 - aData from USDA, World Agricultural Outlook Board, (November 9, 2007) “World Agricultural Supply and Demand Estimates.” WASDE 452
TABLE 5-6. WORLD SUPPLY AND USE BALANCE SHEET FOR SOYBEANSa
2005-06 2006-07E 2007-08F
(Million Metric Tons)
Supply: Beginning Stocks 47.46 52.94 62.08 Production 220.44 235.77 220.81 Imports 64.18 68.96 75.20
Use: Crush, Domestic 185.03 195.41 203.07 Total, Domestic 215.21 224.91 233.53 Exports 63.92 70.68 75.22
Ending Stocks 52.94 62.08 49.35 Stocks/Use Ratio 24.6% 27.6% 21.1% aData from USDA, World Agricultural Outlook Board, (November 9, 2007) “World Agricultural Supply and Demand Estimates.” WASDE 452

2008 Outlook Handbook Page 5-7
T.M. Schmit and W.G. Tomek Grain and Feed
With a small inventory of soybeans, prices are going to be especially sensitive to unexpected news about supplies or demands. How good will the crop in Brazil and Argentina be this Spring? Will there be surprises in international markets, like China? Etc. To get some sense of orders of magnitude, using data for 2006-7, world production of soybeans was 235.8 million metric tons. Of this amount, the U.S. produced 86.8 million, Brazil 59 million, and Argentina 47.2 million. China imported 28.75 million metric tons, or 12% of world production. Put another way, the beginning inventory for the 2006-7 marketing year was 52.9 million tons, and China’s imports were more than half of beginning inventories. To re-emphasize, when inventories are small relative to demand, shocks to the market have large price impacts.
Like soybeans, meal prices are expected to decline somewhat in the 2008-9 crop year relative to current prices (Table 5-7). Futures prices for delivery this year have been as high as $295 per ton, but as of November 12 were about $285 for July delivery. Quotes for delivery in December 2008 were about $250 per ton as of November 12. But, like soybeans, meal prices are likely to be volatile.
TABLE 5-7. FUTURES PRICES FOR SOYBEANS AND SOYBEAN MEAL THE CHICAGO BOARD OF TRADE, NOV. 9, 2007
Contract Month Beans Meal $ per bu. $ per ton January 2008 10.56
281.80
March 2008 10.705 286.70 May 2008 10.7225 286.70 July 2008 10.74 286.70 August 2008 10.57 279.00 September 2008 10.15 269.00 November 2008 9.895 252.50 (Dec) November 2009 9.45 243.00 (Dec)
In summary, corn and soybean meal prices are going to remain high, and are likely to be highly variable around the average. Procuring feed at favorable prices is going to be a challenge. Given the expected volatility of prices, futures market quotes are a good way to keep informed about changes in aggregate market expectations. Evidence from the research literature suggests that futures markets provide as good quality forecasts as statistical models, but that all forecasts are inaccurate beyond three or four months into the future. In technical terms, futures prices are unbiased forecasts of delivery month prices, but have large standard errors of forecast–large confidence intervals. The research evidence also suggests that some experts can add information to that contained in futures quotes, especially information about regional conditions, and for the “best” forecast, one should combine futures quotes with expert analysis. Of course, futures prices are available continuously while other forecasts are available much less frequently. Feed Costs
As mentioned above, recent expansions of the U.S. biofuels industry and corresponding increased demands for grains and oilseeds is affecting the structure of agricultural commodity markets. These changes have substantially different implications for crop and livestock operations across the country. In states such as New York, higher grain prices may provide some opportunities to expand cash crop production, but for dairy and other livestock producers, management adjustments will be required to respond to the anticipated higher and more variable feed costs, and to take advantage of supplies of alternative energy by-product feeds.

Page 5-8 2008 Outlook Handbook
Grain and Feed T.M. Schmit and W.G. Tomek
Combined with the existing higher fuel and energy prices, higher feed costs for dairy and livestock producers are having immediate impacts on farm profitability. This was particularly so for dairy producers in 2006 when high feed costs were concurrent with low milk prices. While increases in milk prices in 2007 have provided some reprieve from tighter operating margins, some producers are utilizing current increases in milk revenues to compensate or “catch up” from these recent tight margin periods. Given the expectation that corn and soybean meal prices will remain high (and highly variable) for the next year, there remains substantial interest in evaluating the outlook for future livestock feed prices, the availability of lower-priced biofuels by-products as feed ingredients, and in identifying potential risk management strategies producers can use to assist in the financial management of their operations.
While the potential increased supplies of biofuels’ by-product feeds, primarily corn distillers dried grains with solubles (DDGS), may provide a lower-priced feed ingredient, several limitations and barriers will need to be addressed to minimize the impact of increased grain and oilseed prices. The ultimate effect on overall feed costs will vary by livestock sector, given varying feedstock prices and the degree of feasible ration adjustments. Ration adjustments will be limited by nutritional considerations, nutrient management implications, and availability of a quality and consistent product. The degree of feasible substitutability of these by-product feeds in livestock rations will also depend on the relative prices of various feed ingredient components. Even so, it is clear that higher grain prices will result in higher feed costs. Biofuels Production in NYS
The Renewable Fuels Association reported in October 2007 that 131 corn-based fuel ethanol plants were in production in the U.S., with capacity of 6.9 billion gallons per year. Another 83 are under construction or expanding and, if completed as planned, would add another 6.6 billion gallons of capacity. Over the last four years alone, U.S. ethanol production has increased nearly 40% each year. Since one bushel of corn produces about 2.75 gallons of ethanol, these plants represent a significant demand for corn.
Biodiesel processing, while at an earlier stage of development, currently is produced from 105 plants in the U.S. with production capacity of 864 million gallons per year. Another 85 plants are under construction or expanding that would add another 1.7 billion gallons of capacity per year. According to the National Biodiesel Board, U.S. biodiesel sales increased from 75 million gallons in 2005 to 250 million gallons in 2006, a 133% increase over this one year period! To a large extent in the U.S., these plants utilize soybeans for the oil input, implying related feed market effects through soybean and soybean meal price adjustments. These adjustments are concurrent to those already experienced through adjustments being captured in corn markets. Perhaps more important, the availability of local crushing capacity will likely dictate industry development as current capacity is insufficient to sustain industry growth.
Corn ethanol and biodiesel facilities are no longer confined to the Corn Belt. Plant development beyond traditional areas is proposed in such states as WA, CA, GA, and NY, to name a few. Four corn ethanol plants are moving forward with developmentor construction plans in New York (Table 5-8). Combined, these plants will produce an anticipated 265 million gallons per year (mgy) of ethanol and require 107 million bushels (mbu) of corn. Planned local sourcing of corn represents 200,000 acres, or 37% of 2007 harvested corn grain acres in NYS. Similarly, two biodiesel plants are expected to produce 5 mgy requiring around 4.8 mbu of soybeans (Table 5-8). While the anticipated amount of local crop sourcing is not available, the feedstock acreage equivalent based on 2007 NYS harvested acres of soybeans is in excess of 50%. Such local demands for corn and soybeans will likely result in considerable impacts on local prices and price variability.

2008 Outlook Handbook Page 5-9
T.M. Schmit and W.G. Tomek Grain and Feed
TABLE 5-8. CURRENT AND/OR PROPOSED CORN ETHANOL AND BIODIESEL PLANTS IN NEW YORK, 2007 a
Plant / Location
Plant Type
Fuel Production
Feedstock Requirment
Planned Local Sourcing
Northeast Biofuels, LLC Fulton, Oswego County
Dry Mill Corn Ethanol 100 mgy 41 mbu 10 mbu
78K acres
Cilion, Inc (CA) Caledonia, Livingston County
Dry Mill Corn Ethanol 55 mgy 22 mbu 4.6 mbu
36K acres
Western NY Energy, LLC Shelby, Orleans County
Dry Mill Corn Ethanol 50 mgy 20 mbu 4 mbu b
31K acres
Empire Biofuels, LLC (Cilion, Inc) Romulus, Seneca County
Dry Mill Corn Ethanol 60 mgy 24 mbu 6 mbu b
46K acres
Total Corn Ethanol 265 mgy 107 mbu 24.6 mbu 191K acres
NextGen Fuel, LLC Fulton, Oswego County Biodiesel 5 mgy 2.4 mbu 52K acres c
Empire AgriFuel & Morrisville State College Cortlandville, Cortland County
Biodiesel 5 mgy 2.4 mbu 52K acres c
Total Biodiesel 10 mgy 4.8 mbu 104K acres 2007 Corn Grain Harvested 540K acres (123 bu/acre) Planned Ethanol Acreage 37% 2007 Soybeans Harvested 210K acres (38 bu/acre) Plant Acreage Equivalent 51% a Sources: Renewable Fuels Association (www.ethanolrfa.org), authors’ estimates, and New York Agricultural Statistic Service (crop plantings). b Estimates of local sourcing not available, estimated at 25%. C Local sourcing data not available; sourcing for biodiesel plants are expressed as the plant needs acreage equivalent.
Outlook for Livestock Feed Costs
To better quantify anticipated feed costs for dairy and livestock producers in NYS (and the Northeast), we need to look at the relation of input prices to feed costs. Specifically, we can estimate the technical relationships between ingredient prices and feed prices for various livestock sectors in the Northeast. Then, given these estimates, we can use estimates of future grain and feed ingredient prices to estimate the potential effect on feed costs. Prices of futures contracts for corn and soybean meal (above) will be utilized as our source of expected changes in commodity prices. Given an uncertain future, such information can serve as a useful tool for planning production and feeding decisions; however, with the understanding that these prices reflect current information and expectations for the future, both of which can, and likely will, change with time.
The prices of four complete livestock feeds -- dairy (18% protein), hog (14-18% protein), broilers, and layers -- for the Northeast U.S. are plotted against years in Figure 5-2. The prices have clearly trended upward over the last 22 years, and the year-to-year changes have some correlation. Presumably these correlations are related importantly to the common influences of ingredient costs. Corn prices are perhaps the single most important driver of feed costs, but related ingredient prices also contribute to the variation.

Page 5-10 2008 Outlook Handbook
Grain and Feed T.M. Schmit and W.G. Tomek
The price of a feed can be decomposed into its cost components and a profit margin. If complete information were available for all these components, then an identity would exist at any point in time between the feed price and its cost components; however, such information is unavailable, particularly for changes over time. For example, suppose the price of a mixed feed (PF) at a particular point in time depends on the prices of two commodity inputs (PY and PX), and Y and X are used in a 0.6 and 0.4 proportion, then for a point in time, PF = 0.6PY + 0.4PX. If this is known, then no estimation is required. But, in practice, the right-hand side is more complex, and the technical coefficients may vary with the price levels.
FIGURE 5-2. NORTHEAST FEED COSTS BY LIVESTOCK SECTOR, APRIL, 1986-2007
100
150
200
250
300
350
1986
1987
1988
1989
1990
1991
1992
1993
1994
1995
1996
1997
1998
1999
2000
2001
2002
2003
2004
2005
2006
2007
Year
$ P
er T
on
Dairy Hog Broiler Layer
Source: Agricultural Prices, USDA
In this context, regression models can provide insights into the price relationships, but should be viewed as descriptive of historical average technical relationships. The regression approach also permits a comparison of impacts of higher commodity prices across livestock sectors (e.g., dairy and poultry), and regression models allow us to estimate future feed prices conditional on possible future ingredient costs. Basically, the models attempt to capture the effects of the changes in major cost components on feed prices, with the omitted costs captured by a trend variable and the residual.
Specifically, we use the historical prices for representative complete mixed-feeds (Figure 5-2), along with
principal commodity inputs and feed ingredients in the Northeast region, and estimate their technical relationships.1 The availability of ethanol by-products as feedstocks, primarily corn distillers dried grains with solubles (DDGS), will also be considered in relation to substitutability of other feedstock products (like corn and soybean meal). Feed prices are reported regionally by the National Agricultural Statistics Service (NASS), USDA and collected annually during April using farm establishment surveys. As such, the numbers reported above
1 While becoming less common in livestock production enterprises as a whole, historical prices are available for complete feeds; i.e., feeds supplying energy, protein, and vitamins/minerals. It is more common today to work with protein supplements at high crude protein levels and purchase and blend other feed ingredients (e.g., corn grain). As we are considering changes in prices of feed components for both energy and protein, complete feed costs are utilized.

2008 Outlook Handbook Page 5-11
T.M. Schmit and W.G. Tomek Grain and Feed
(Figure 5-2) represent an average for the Northeast region. Commodity input and ingredient prices were obtained from the weekly magazine Feedstuffs and are wholesale prices FOB Buffalo, NY.
While the feed ingredients reflect the major feedstock components to livestock rations, DDGS also represents a by-product produced from corn ethanol dry milling. Growing ethanol production implies a larger supply and potentially lower prices for this by-product. Likewise, increased demand for soybean oil for use in biodiesel production implies lower prices for soybean meal, given increased crushing activity and supply of meal, all else held constant. The differential cost impacts across livestock sectors is important given that corn DDGS can be utilized more readily by ruminants (i.e., dairy cows) than non-ruminants (i.e., hogs and poultry).
We apply projected prices for corn and soybean meal based on Chicago Board of Trade (CBOT) settlement prices for corn and soybean meal futures contracts on November 9, 2007 (see above). The results, conditional on market information November 9th, provide current estimates of future feed cost levels. The predicted feed costs across livestock sectors for several levels of CBOT corn and SBM contract prices are reported in Table 5-9. The top of Table 5-9 shows the increases in feed costs from 2006 to 2007. Corn (in particular) and soybean meal prices both increased substantially. Corn DDGS prices also increased 13% from $124 to $140 per ton, thus not reflecting the ‘over-supply’ condition (yet), as expected by many industry analysts that would put downward pressure on its price. Resulting feed cost increases ranged from 13% to over 18%, or $35 to $40 per ton, across livestock sectors - a dramatic increase in a one-year time span. Note that while the nutritional feasibility to incorporate corn DDGS into livestock rations is one factor in determining feed cost increases, the relative proportions of ingredients in rations varies by livestock sector and will also affect changes in feed costs.
YearCorn Price
($/bu)SBM Price
($/ton)Dairy Feed
($/ton)Hog Feed
($/ton)Broiler Feed
($/ton)Layer Feed
($/ton)2006 $2.45 $194.90 $210.41 $275.35 $279.37 $241.462007 $4.05 $229.00 $249.17 $310.22 $326.88 $281.99
% Change 65.31% 17.50% 18.42% 12.66% 17.00% 16.78%Contract Year (Corn / SBM) December January2007 / 2008 $4.12 $261.80 $255.34 $316.05 $338.66 $281.922008 / 2009 $4.57 $232.50 $255.41 $320.80 $334.27 $286.352009 / 2010 $4.57 $223.00 $256.48 $324.89 $336.18 $289.62
2007 / 2008 $4.12 $261.80 $254.59 $315.02 $338.66 $281.342008 / 2009 $4.57 $232.50 $249.87 $313.90 $334.27 $281.302009 / 2010 $4.57 $223.00 $250.95 $317.99 $336.18 $284.58
2007 / 2008 $4.12 $261.80 -0.30% -0.33% na -0.20%2008 / 2009 $4.57 $232.50 -2.17% -2.15% na -1.76%2009 / 2010 $4.57 $223.00 -2.16% -2.12% na -1.74%
a Future corn and SBM prices are based on CBOT contract settlement prices for November 9, 2007. Contract prices were adjusted for average NYS differentials; i.e. plus $0.25/bu on corn and minus $20/ton on SBM.b The historical price correlation of corn to DDGS was computed from the annual NASS, USDA data, 1986-2007.c The negative price correlation of corn to DDGS is computed from price predictions in "FAPRI 2007 U.S. and World Agricultural Outlook," FAPRI Staff Report 07-FSR, January 2007.d The DDGS pricing cost savings reflects the difference between the estimated and historical price correlations. Note that DDGS prices were not included in the Broiler equation due to a lack of statistical significance.
Historical Correlation (Corn to DDGS = 0.45) b
Estimated Correlation (Corn to DDGS = -0.82) c
DDGS Pricing Cost Savings d
TABLE 5-9. PREDICTED NORTHEAST FEED COSTS AND POTENTIAL CORN DDGS COST SAVINGS. a

Page 5-12 2008 Outlook Handbook
Grain and Feed T.M. Schmit and W.G. Tomek
The next section of Table 5-9 shows computed livestock feed prices based on future December and January corn and soybean meal contracts, respectively. Due to a lack of sufficient futures trading on corn DDGS, we compute its implied price based on the historical price correlation between it and corn. While corn DDGS has been available and utilized in rations for many years, it has been typically in short supply. Hence, the correlation between the two prices is positive; i.e., when corn price goes up, corn DDGS prices will also increase. Using historical corn and corn DDGS prices in New York, this correlation was estimated to be 0.45. Based on this relationship, feed costs across livestock sectors would remain 3% to 5% above current levels for the next few years, even with expected decreases in soybean meal prices. The largest relative increase is in the hog sector due mostly to a higher proportion of corn fed in the diet.
The dramatic growth in ethanol production is resulting in a larger supply of corn DDGS; each bushel of corn used in ethanol production produces about 17 pounds of corn DDGS. Larger supplies of DDGS are expected to reduce its price and, therefore, make it a relatively more preferable feed ingredient. But, its use is limited by nutritional constraints (particularly for non-ruminants). Whether or not the historically positive price correlation between corn and corn DDGS will continue depends on the growth in supply relative to demand, and it does appear likely that supply will grow relative to demand. If corn DDGS prices do drop, then this correlation could decline and become negative. We explore these correlation relationships in the other two sections of Table 5-9.
Utilizing national crop-year predicted price data from FAPRI’s 2007 U.S. and World Agricultural Outlook report (FAPRI Staff Report 07-FSR), we compute the expected price correlation coefficient between corn and corn DDGS over the crop years 2006/2007 through 2016/2017. Indeed, using this data as a reasonable proxy for future pricing conditions, we compute a price correlation coefficient of -0.82. It is this inverse relationship that has the potential to partially offset increases in livestock feed costs from rising corn prices. In fact, this level of negative correlation is indeed quite large, compared with historical relationships.
Utilizing the same expected prices for corn and soybean meal based on futures contract settlement prices, we compute the implied price of corn DDGS and apply these prices to our feed cost model. As corn prices between December 2007 and December 2009 are expected to increase, corn DDGS prices are expected to fall. The resulting computed feed costs are in the next section of Table 5-9, followed by the percentage changes in feed costs relative to the historical correlation scenario. Based on the historical utilization of feed ingredient components and relative prices, offsetting corn DDGS price impacts are expected to be limited, at around 2%, at least in the short run.2 While the cost savings appear lower for the nonruminant sectors, the differences are minimal.
What does this say about feed cost affects with an increasing supply of lower-priced corn DDGS? Given historical utilization rates, little if any costs savings are forecasted, even with relatively strong negative price correlations. Certainly, the technical relationships estimated will likely change with time and a ready supply of corn DDGS feedstocks. Limited supplies in earlier periods may have physically limited actual utilization levels, even though relative prices may have indicated otherwise.
Even so, much of the current concern over this ‘new’ feedstock may also limit its utilization. Issues of poor quality corn DDGS feedstocks are common, as well as considerable variation in product components across plants or even at the same plants across time. Such issues will severely limit its utilization by livestock producers and feed dealers, even if the supply is readily available. Biofuel refineries realize this, of course, and are working to address these deficiencies. Improved plant production and handling techniques, and marketing and branding of higher quality by-product components will drive utilization and, perhaps, larger feed cost savings than estimated here.
2 Note that the price of corn DDGS was excluded from the broiler equation due to poor statistical results. As a result, there are no differences in feed costs between the two scenarios.

2008 Outlook Handbook Page 5-13
T.M. Schmit and W.G. Tomek Grain and Feed
In summary, higher and more variable corn and soybean meal prices will translate into the same effects on livestock feed costs. Based on historical utilization of corn DDGS, reductions to this rise in feed costs are likely to be minimal, at least in the short run. In particular, if past conditions hold between corn and corn DDGS prices, we anticipate dairy feed costs to remain $6 to $7 per ton above those realized early in 2007 for the next one to two years. At best, even if the inverse pricing relationship materializes, dairy feed costs are expected to remain at the higher levels currently being experienced by dairy producers.

Notes

Chapter 6. Dairy — Markets and PolicyMark W. Stephenson, Senior Extension Associate
2008 Dairy Outlook
Positive Factors:• Tremendous growth in export opportunities• Adequate volume and quality of forage in the Northeast
Negative Factors:• Higher feed and other factor costs• Soft domestic economy
Uncertainties:• Farm Bill• Expansion of Ethanol production
Percent ChangeItem 2006 2007 2008 06-07 07-08
Number of milk cows (thousand head) 638 627 628 -1.7 0.2
Milk per cow (lbs.) 18,879 19,200 19,300 1.7 0.5
Total milk production (million lbs.) 12,045 12,065 12,100 0.2 0.3
Blended milk price ($/cwt.) 13.65 19.94 19.25 46.1 -3.5
New York Dairy Situation and Outlook2006 Projected 2007, and Estimated 2008
a
a Northeast federal order statistical uniform price for farms shipping milk to Suffolk County, MA (Boston).
2008 Outlook Handbook Page 6-1
M.W. Stephenson Dairy—Markets & Policy

Tabl
e 6-
1. U
.S. M
ilk S
uppl
y an
d U
tiliz
atio
n, 2
000–
2008
2000
2001
2002
2003
2004
2005
2006
2007
2008
Sup
ply
Cow
s N
umbe
rs (t
hous
.)9,
206
9,11
59,
137
9,08
49,
010
9,04
19,
112
9,14
89,
206
Pro
duct
ion/
cow
(lbs
)18
,201
18,1
3918
,612
18,7
4818
,958
19,5
7719
,951
20,2
6020
,643
Pro
duct
ion
167.
616
5.5
169.
817
0.3
170.
817
7.0
181.
818
5.3
190.
0Fa
rm U
se1.
31.
31.
21.
21.
11.
11.
11.
11.
1M
arke
tings
166.
316
4.2
168.
516
9.1
169.
717
5.9
180.
718
4.2
189.
0
Beg
inni
ng C
omm
erci
al S
tock
s6.
16.
86.
19.
98.
37.
28.
09.
59.
9Im
ports
4.4
5.7
5.1
5.0
5.3
4.6
5.0
4.8
4.7
Tota
l Sup
ply
176.
817
6.8
179.
818
4.1
183.
318
7.7
193.
719
8.5
203.
6
Util
izat
ion
Com
mer
cial
Dis
appe
aran
ce16
9.2
169.
616
9.6
174.
617
6.2
179.
718
4.2
188.
619
4.3
End
ing
Com
mer
cial
Sto
cks
6.8
7.0
9.9
8.3
7.2
8.0
9.5
9.9
9.3
DE
IP0.
40.
10.
00.
10.
10.
00.
00.
00.
0N
et R
emov
als
(exc
ludi
ng D
EIP
)0.
50.
10.
31.
1-0
.20.
00.
00.
00.
0
Tota
l Use
176.
817
6.8
179.
818
4.1
183.
318
7.7
193.
719
8.5
203.
6c*a
**
b
2008 Outlook Handbook Page 6-2
M.W. Stephenson Dairy—Markets & Policy
Sour
ce:
Dai
ry S
ituat
ion
and
Out
look
, Milk
Pro
duct
ion,
and
Dai
ry M
arke
t New
s, U
.S. D
epar
tmen
t of A
gric
ultu
re.
Not
e th
at to
tal m
ay n
ot a
dd
exac
tly d
ue to
roun
ding
.
* Le
ap y
ear.
a Rev
ised.
b Bas
ed o
n pr
elim
inar
y U
SDA
data
and
Cor
nell
estim
ates
.c P
roje
cted
by
Mar
k St
ephe
nson
.

The Dairy Situation
It seems like good novels, good movies or good television shows nowadays have multiple themes running through them. Clever authors keep our attention by keeping our brain confused with more than one story until they pull all of the sub-plots together into a single whole ending. I don’t pretend to be that kind of author, but this year’s dairy situation and outlook lends itself to multiple sub-plots.
All I can say is “Wow”! 2007 has been a most remarkable year and is easily evidenced by a simple chart of the class III milk price. Milk prices have never been higher than in 2007 although they approached this peak back in 2004. The difference between the 2004 highs and 2007’s is that in the earlier year, the price spiked for two months and then retreated to more “normal” levels. I think that we will find that the 2007 price peak is more persistent and that the dairy environment is permanently altered.
Twenty years ago milk price forecasting was really quite easy. They only question to be answered was what price support adjustments were expected and even that was made easy in the 1980s with the target price tied firmly to parity. Ten years ago, price forecasting was considerably more difficult. We had to begin to better understand the underlying factors of our domestic supply and demand. This was complicated by a market that wasn’t used to the volatility and probably overacted at times to market information. Today, you have many more things to keep your eyes on as the U.S. dairy sector has firmly entered the global arena as a serious exporter of dairy products.
Class III Milk Price
$8.00
$10.00
$12.00
$14.00
$16.00
$18.00
$20.00
$22.00
Jan-00 Jan-01 Jan-02 Jan-03 Jan-04 Jan-05 Jan-06 Jan-07
2008 Outlook Handbook Page 6-3
M.W. Stephenson Dairy—Markets & Policy

The Milk Supply
There are three major factors that have influenced the milk supply in 2007: ethanol, various factor costs, and replacement animals.
Ethanol screamed onto the scene in 2006. There were several reasons why ethanol became a factor then. The first major reason was that crude oil prices hit $40 per barrel. With $100 per barrel prices starring us in the face, $40 seems tame by comparison. Yet, that threshold price was needed for alternate fuels to be strongly considered. Another reason they were considered was because the federal government said they would be with the Renewable Fuel Standard. This law required 4 billion gallons of renewable fuel to be used in the petroleum supply in 2006 and increasing to 7.5 billion by 2012. We currently have an ethanol capacity of approximately 6.4 billion gallons per year and that capacity would be doubled with the plants currently under construction. In 2007, we produced about 4.8 billion gallons of ethanol. Another reason that ethanol has been adopted is because of the Blender’s Credit. This is a credit of 51¢ per gallon of ethanol that is blended into gasoline making ethanol use even more attractive.
Ethanol’s impact on dairy may be somewhat complex but the major themes include:
• lower energy prices—maybe—with the marginal impact of 4.8 billion gallons of renewable petroleum.
• higher corn and other feed prices with certainty
• higher land prices as more corn is grown
• additional supplies of by-product feeds in distillers grains
Some of these items, like lower energy prices and distillers grains, should be a positive factor to dairy producers bottom lines. Higher land prices is a bonus on the balance sheet for farms but it is a significant drawback to producers looking to expand with a land base. But, without a doubt, higher feed prices is an unavoidable cost to the dairy industry.
My informal estimate from talking with producers across the country is that ethanol has added about $1.00 per hundredweight to the cost on well-managed, traditional farms. By traditional farms, I am talking about farms with enough land base to grow at least their forage needs. By well-managed, I mean farms that have reformulated rations to look for lower cost options. Well-managed farms who purchase most of their feeds, including forages, have costs that are about $1.50 per hundredweight higher. And, for most other farms, the impact is probably closer to $2.00 per hundredweight.
Concentrate feeds have been a significant increase in producers costs but they are not the only item. Hay and other forage prices are about 75 percent higher than they were a few years ago. Diesel fuel prices to farmers have virtually tripled over the last 3-4 years. Energy related prices, like fertilizer, are about double what they were a few years ago. And, as the Fed has raised rates, interest rates to farmers are about 50 percent higher than they were in 2004.
All of these items, including ethanol’s impact on feed, have probably increased the cost of producing milk between $2.00-3.00 per hundredweight across the country. In my estimation, these increases in costs should be viewed as more-or-less permeant with the implication that we shouldn’t expect milk production to be similar to previous levels at previous milk prices—milk prices will have to be
2008 Outlook Handbook Page 6-4
M.W. Stephenson Dairy—Markets & Policy

$2.00-$3.00 higher to compensate for these additional costs.
2006 was a year with lower milk prices and higher costs of production. Dairy farms drew significantly on credit reserves to maintain business levels. Those credit reserves needed to be restored and the $6.00 higher milk prices that we received in 2007 has more than compensated for the $2.00-$3.00 increased costs.
The record high milk price of 2007 has been a signal to dairy producers to make more milk. It took them a little while to feel as though they were ready. The first half of the year we saw modest increases in milk production of about 1 percent over year-earlier levels. The second half however, saw 3-4 percent increases. These increases were possible because we have replacement heifers in the pipeline.
The U.S. closed the borders to live animal imports from Canada in May 2003 after bovine spongiform encephalopathy (BSE) incidents in the U.S. and Canada. Before that time, the U.S. dairy industry carried about 40 percent of its dairy herd as replacement heifers. Additional replacement needs were met with imports of Canadian heifers. Since that time, U.S. dairy producers have been increasing the number of heifers that are being raised domestically. These additional heifers provide the wherewithal
to expand production when the milk price signals that more milk is needed.
2008 Outlook Handbook Page 6-5
M.W. Stephenson Dairy—Markets & Policy
Indices of Prices Paid by Farmers
50
100
150
200
250
300
Jan-99 Jan-00 Jan-01 Jan-02 Jan-03 Jan-04 Jan-05 Jan-06 Jan-07
Diesel Fuel
Fertilizer
Hay & Forages
Interest
Percent Heifers
37.50%
38.00%
38.50%
39.00%
39.50%
40.00%
40.50%
41.00%
41.50%
42.00%
42.50%
43.00%
2000 2001 2002 2003 2004 2005 2006 2007
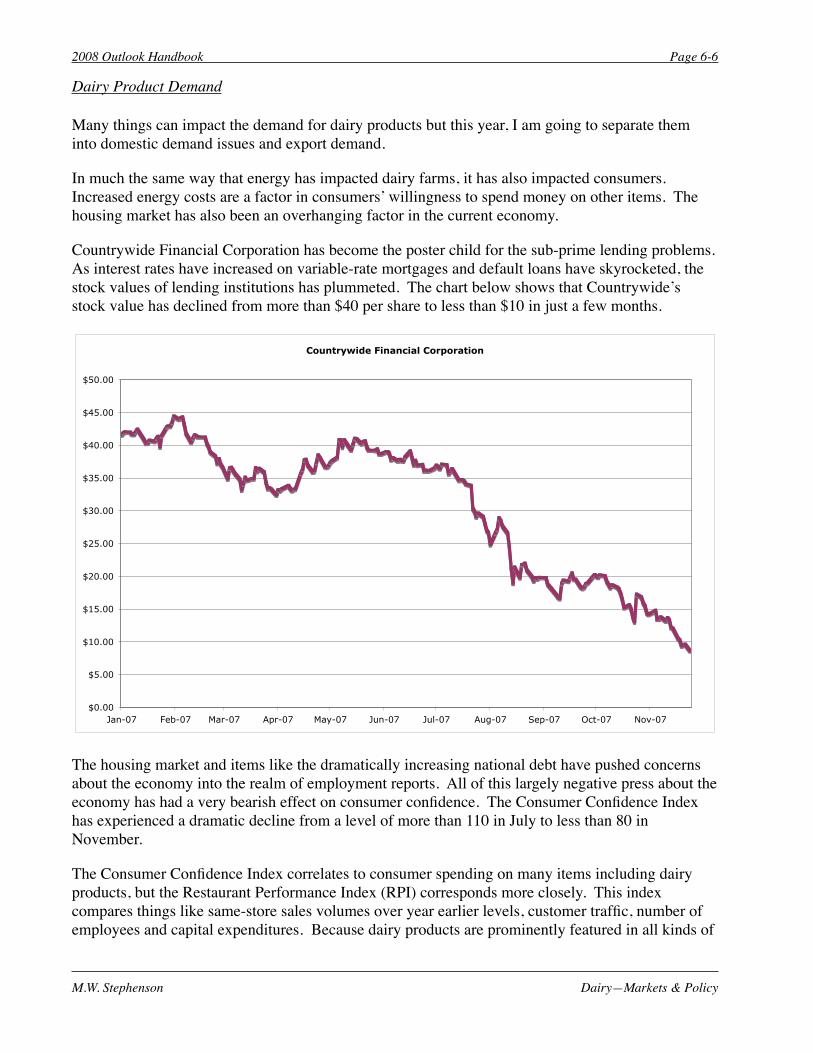
Dairy Product Demand
Many things can impact the demand for dairy products but this year, I am going to separate them into domestic demand issues and export demand.
In much the same way that energy has impacted dairy farms, it has also impacted consumers. Increased energy costs are a factor in consumers’ willingness to spend money on other items. The housing market has also been an overhanging factor in the current economy.
Countrywide Financial Corporation has become the poster child for the sub-prime lending problems. As interest rates have increased on variable-rate mortgages and default loans have skyrocketed, the stock values of lending institutions has plummeted. The chart below shows that Countrywide’s stock value has declined from more than $40 per share to less than $10 in just a few months.
Countrywide Financial Corporation
$0.00
$5.00
$10.00
$15.00
$20.00
$25.00
$30.00
$35.00
$40.00
$45.00
$50.00
Jan-07 Feb-07 Mar-07 Apr-07 May-07 Jun-07 Jul-07 Aug-07 Sep-07 Oct-07 Nov-07
The housing market and items like the dramatically increasing national debt have pushed concerns about the economy into the realm of employment reports. All of this largely negative press about the economy has had a very bearish effect on consumer confidence. The Consumer Confidence Index has experienced a dramatic decline from a level of more than 110 in July to less than 80 in November.
The Consumer Confidence Index correlates to consumer spending on many items including dairy products, but the Restaurant Performance Index (RPI) corresponds more closely. This index compares things like same-store sales volumes over year earlier levels, customer traffic, number of employees and capital expenditures. Because dairy products are prominently featured in all kinds of
2008 Outlook Handbook Page 6-6
M.W. Stephenson Dairy—Markets & Policy

restaurants from fast food to casual dining to fine dining, the RPI is a fairly good indicator of domestic dairy product demand.
You can see from the chart that although there is volatility around the trend, the RPI has been falling since 2004. The index is constructed in such a way that an index value greater than 100 is considered expansionary while values less than 100 imply that the industry is in contraction. As of October, it appears that the industry is headed into a time of contraction.
For many decades, exports amounted to about 1-2 percent of domestic production and imports were about the same—imports and exports were about a wash. Today the story is quite different.
In June of 2003, the European Union (EU) adopted new Common Agricultural Policy (CAP) reforms. These reforms included the cessation of subsidies for exports of dairy products. This has had the effect of lowering EU milk production and making exports less attractive from the 27 countries of the EU. Oceania (Australia and New Zealand) has also been involved in a three-year drought. The drought has been particularly pervasive for Australia. The combined effect of CAP reforms and drought in Oceania has been a short supply of traded dairy products around the world.
At the same time as the major world exporters were supplying fewer products, the world was demanding more. Strong economic growth in China (8-9 percent GDP for several years) has provided their population with the wherewithal to upgrade their diet and dairy products feature prominently in that goal. China’s premier, Wen Jiabao, said that China has set a goal of each child having one-half liter of milk each day. By their own estimation, $1.00 invested in a school milk program will return $2.27 in Gross Domestic Product. The surging Chinese demand for milk and dairy products is partially being met by a dramatic growth in their own milk production (up 39 percent last year), but also from increased imports. It is also true that oil exporting countries have experienced tremendous increases in wealth as world oil prices have tripled in the past year. Many of the oil exporting countries are also importers of dairy products.
Global short supplies and strong demand have yielded higher world prices for dairy products. This is coming at the time that the value of the U.S. dollar has plunged against major world currencies. Weakening exchange rates has the effect of making product sourced from the U.S. look relatively
2008 Outlook Handbook Page 6-7
M.W. Stephenson Dairy—Markets & Policy
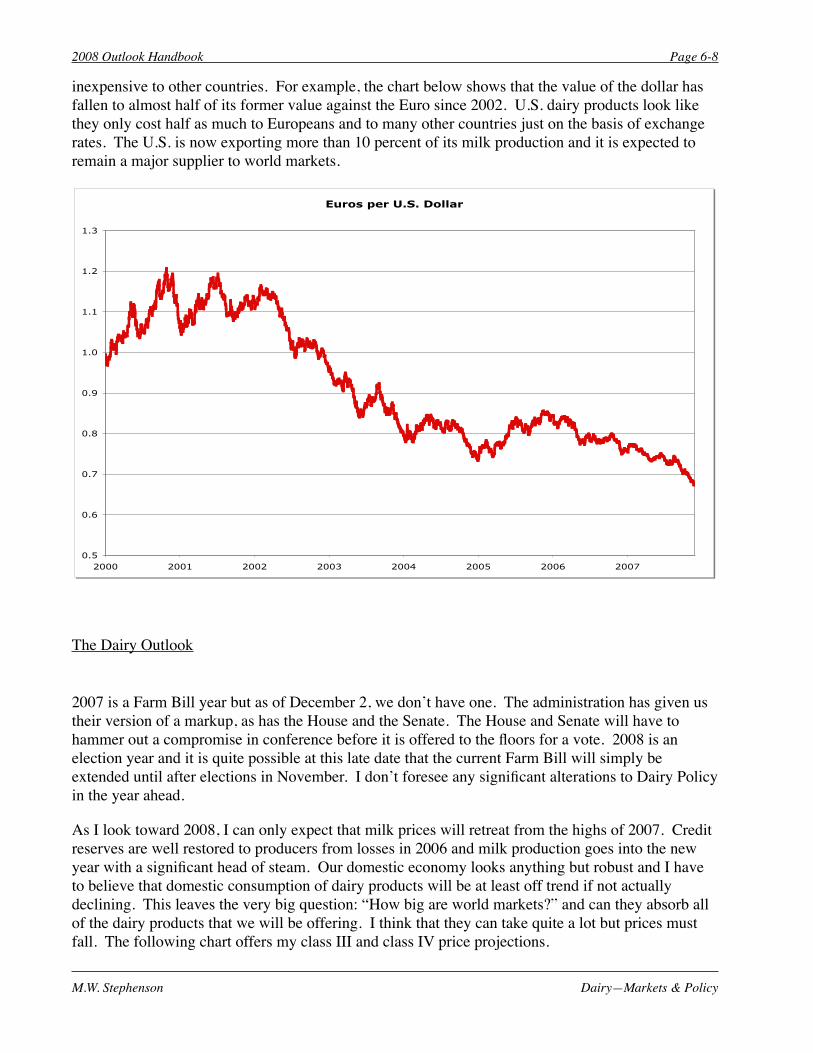
inexpensive to other countries. For example, the chart below shows that the value of the dollar has fallen to almost half of its former value against the Euro since 2002. U.S. dairy products look like they only cost half as much to Europeans and to many other countries just on the basis of exchange rates. The U.S. is now exporting more than 10 percent of its milk production and it is expected to remain a major supplier to world markets.
Euros per U.S. Dollar
0.5
0.6
0.7
0.8
0.9
1.0
1.1
1.2
1.3
2000 2001 2002 2003 2004 2005 2006 2007
The Dairy Outlook
2007 is a Farm Bill year but as of December 2, we don’t have one. The administration has given us their version of a markup, as has the House and the Senate. The House and Senate will have to hammer out a compromise in conference before it is offered to the floors for a vote. 2008 is an election year and it is quite possible at this late date that the current Farm Bill will simply be extended until after elections in November. I don’t foresee any significant alterations to Dairy Policy in the year ahead.
As I look toward 2008, I can only expect that milk prices will retreat from the highs of 2007. Credit reserves are well restored to producers from losses in 2006 and milk production goes into the new year with a significant head of steam. Our domestic economy looks anything but robust and I have to believe that domestic consumption of dairy products will be at least off trend if not actually declining. This leaves the very big question: “How big are world markets?” and can they absorb all of the dairy products that we will be offering. I think that they can take quite a lot but prices must fall. The following chart offers my class III and class IV price projections.
2008 Outlook Handbook Page 6-8
M.W. Stephenson Dairy—Markets & Policy

$10.00
$12.00
$14.00
$16.00
$18.00
$20.00
$22.00
$24.00
Jan-0
7
Feb-0
7
Mar
-07
Apr-
07
May
-07
Jun-0
7
Jul-
07
Aug-0
7
Sep
-07
Oct
-07
Nov-
07
Dec
-07
Jan-0
8
Feb-0
8
Mar
-08
Apr-
08
May
-08
Jun-0
8
Jul-
08
Aug-0
8
Sep
-08
Oct
-08
Nov-
08
Dec
-08
Actual Class IIIProjected Class IIIActual Class IVProjected Class IV
My projections have the class III price averaging about $1.90 lower than in 2007 but the class IV price is only about 50¢ lower. For the Northeast, this means that only the 22 percent of our milk going into class III will experience the $1.90 drop and the rest will be priced off of class IV.
Class IV being the “higher of” has regional implications. I am expecting that the Northeast and Southeast will have a decline in the statistically uniform price of less than $1.00 per hundredweight while regions like the Upper Midwest and West may have price declines of more like $1.50 per hundredweight. The west in particular will face the double whammy of a greater decline in milk prices and, because of more purchased feed, a greater increase in the cost of production. This will put much more pressure on the margins of western milk production.
Although 2008 will be a lower milk price year, I am currently not forecasting a bad price year. Cheese regions will take the largest decline in prices and for some regions, the largest decline in margins. I do think that cheese demand will be less as a result of a sluggish domestic economy and that cheese production will be lower. Less cheese production implies less whey available for export in a market that has strong demand for milk proteins. These would have to be met with additional skim milk powder (SMP) production. More SMP would mean more butter production and butter prices will have to fall to clear the markets.
2008 will not be a bad price year on the farm, but it will be a year of uncertainty. If anything, I think that my forecast has more downside potential than upside.
2008 Outlook Handbook Page 6-9
M.W. Stephenson Dairy—Markets & Policy

Tabl
e 6-
2. N
atio
nal F
arm
Pric
es fo
r Milk
; CC
C P
urch
ase,
Who
lesa
le, a
nd R
etai
l Pric
es fo
r Che
ddar
Che
ese,
But
ter,
and
Non
fat D
ry M
ilk; a
nd S
elec
ted
Ret
ail P
rice
Indi
ces,
199
7–20
07.
1997
1998
1999
2000
2001
2002
2003
2004
2005
2006
2007
Farm
Milk
($/c
wt.)
All
Milk
(ave
. fat
)13
.34
15.5
014
.38
12.4
015
.04
12.1
812
.55
16.1
315
.19
12.9
718
.95
Cla
ss II
I (3.
5%)
12.0
514
.20
12.4
39.
7413
.10
10.4
211
.42
15.3
914
.05
11.8
917
.96
Sup
port
(3.5
%)
10.1
09.
959.
809.
809.
809.
809.
809.
809.
809.
809.
80M
ilk P
rice:
Fee
d P
rice
Val
ue2.
383.
343.
593.
053.
392.
602.
613.
103.
242.
562.
81M
ILC
pay
men
ts0.
000.
000.
000.
000.
061.
211.
090.
220.
040.
610.
07
Che
ddar
Che
ese,
Blo
cks
($/lb
.)C
CC
Pur
chas
e1.
130
1.11
51.
100
1.12
21.
131
1.13
11.
131
1.13
11.
131
1.13
11.
131
Who
lesa
le, N
CE
/Chi
cago
Mer
cant
ile E
xcha
nge
1.30
81.
569
1.40
41.
149
1.43
91.
182
1.31
71.
649
1.49
21.
239
1.75
9
But
ter (
$/lb
.)C
CC
Pur
chas
e, G
rade
A o
r hig
her,
Chi
cago
0.65
00.
650
0.65
00.
668
0.85
50.
855
1.05
01.
050
1.05
01.
050
1.05
0W
hole
sale
, Gr.
AA
, Chi
cago
Mer
c. E
xcha
nge
1.15
91.
769
1.22
91.
177
1.66
31.
106
1.14
51.
817
1.54
91.
236
1.37
2
Non
fat D
ry M
ilkC
CC
Pur
chas
e, U
nfor
tifie
d ($
/lb.)
1.04
71.
028
1.01
01.
010
0.90
00.
900
0.80
00.
800
0.80
00.
800
0.80
0W
hole
sale
, Cen
tral S
tate
s1.
100
*1.0
691.
031
1.01
51.
004
0.92
80.
838
0.85
80.
985
1.00
11.
810
Ret
ail P
rice
Indi
ces
(198
2–84
=100
.0)
1997
1998
1999
2000
2001
2002
2003
2004
2005
Who
le M
ilk14
2.9
147.
915
6.2
156.
916
5.9
162.
116
2.5
183.
418
4.9
181.
620
5.4
Che
ese
147.
715
2.3
162.
616
2.8
167.
617
0.0
169.
418
0.8
183.
318
0.8
191.
8A
ll D
airy
Pro
duct
s14
5.5
150.
815
9.6
160.
716
7.1
168.
116
7.9
180.
218
2.4
181.
419
4.9
All
Food
157.
716
1.1
164.
616
8.4
173.
617
6.8
180.
518
6.6
191.
219
5.7
203.
3A
ll C
onsu
mer
Pric
es16
0.5
163.
016
6.6
172.
217
7.1
179.
918
4.0
188.
919
5.3
201.
620
7.2
c
ba
Sour
ce:
Dai
ry S
ituat
ion
and
Out
look
, Dai
ry M
arke
t New
s, an
d Fe
dera
l Milk
Ord
er M
arke
t Sta
tistic
s, U
.S. D
epar
tmen
t of A
gric
ultu
re.
a Re
vise
d.b
Estim
ated
by
Mar
k St
ephe
nson
.c
Milk
Inco
me
Loss
Con
tract
pay
men
ts be
gan
in O
ctob
er o
f 200
1.
2008 Outlook Handbook Page 6-10
M.W. Stephenson Dairy—Markets & Policy

The Northeast Dairy Situation and Outlook
Jan-06 Feb-06 Mar-06 Apr-06 May-06 Jun-06 Jul-06 Aug-06 Sep-06 Oct-06 Nov-06 Dec-06 TotalCT 31615 29277 32262 30905 31621 28983 27950 27450 26968 27703 27512 29829 352,075
ME 47,618 42,635 47,212 46,537 49,425 48,151 48,317 48,182 45,997 46,278 44,455 47,149 561,956
MD 82,103 74,356 81,587 91,303 87,669 75,274 69,694 67,463 65,785 68,143 66,322 72,626 902,325
MA 22976 20750 22828 22511 23560 22081 21702 20950 20083 19970 19414 20754 257,579
NJ 15,077 14,041 15,217 14,674 14,936 13,357 12,707 12,559 12,413 12,593 12,290 13,153 163,017NY 836,825 773,266 854,576 830,165 871,403 823,484 829,853 782,732 743,416 754,943 732,023 775,128 9,607,814PA 670,603 622,669 724,844 691,817 706,596 622,092 629,894 592,851 584,107 594,777 589,217 624,765 7,654,232
VT 223,650 205,496 228,169 220,687 228,441 215,459 215,066 211,075 201,472 205,968 199,869 210,684 2,566,036
VA 12,769 11,700 13,300 12,908 13,097 11,317 10,892 6,462 6,935 7,212 7,144 8,321 122,057
Other Regional* 26,385 24,095 26,898 25,629 26,362 24,782 24,301 24,088 22,725 23,281 22,550 23,641 294,737
Other States** 16,455 15,246 17,014 16,037 17,373 15,656 15,962 15,821 15,928 15,907 15,935 17,754 195,088
Total 1,986,076 1,833,531 2,063,907 2,003,173 2,070,483 1,900,636 1,906,338 1,809,633 1,745,829 1,776,775 1,736,731 1,843,804 22,676,916
* Includes data for the states of New Hampshire, and Rhode Island.** Represents restricted data for the states of Delaware, Indiana, Iowa, Michigan, North Carolina, Ohio, West Virginia, and Wisconsin.
Receipts of Producer Milk by State, 1000s PoundsNortheast Federal Milk Marketing Order
Source: Northeast Monthly Federal Milk Order Market Statistics .
Dairy producer numbers have declined for many years as remaining farms have become larger. The Northeast is about 8 billion pounds of milk net deficit in total production. This can make pooling milk on this order attractive to distant producers. Producers from states as far away as Ohio, Michigan, Delaware, West Virginia and even North Carolina, Indiana and Iowa have pooled milk on this order.
It may be of interest to anticipate that New York will lose it status as the number 3 milk producing state in 2008 to Idaho.
Jan-06 Feb-06 Mar-06 Apr-06 May-06 Jun-06 Jul-06 Aug-06 Sep-06 Oct-06 Nov-06 Dec-06 TotalCT 153 153 150 150 149 151 147 144 143 143 142 141 147
ME 359 357 357 354 358 354 352 355 351 343 341 340 352
MD 551 513 537 550 524 543 544 525 519 532 527 513 532
MA 175 173 174 179 177 174 173 173 170 170 168 169 173
NJ 112 113 115 112 112 112 114 112 111 112 110 107 112NY 5,468 5,442 5,416 5,394 5,403 5,342 5,322 5,314 5,291 5,277 5,258 5,233 5,347PA 6,153 6,129 6,141 6,112 6,032 6,088 6,135 6,079 5,993 5,946 5,992 6,012 6,068
VT 1,175 1,169 1,163 1,166 1,164 1,157 1,150 1,144 1,138 1,137 1,136 1,128 1,152
VA 123 117 113 109 107 102 107 71 98 84 72 124 102
Other Regional* 155 154 153 151 150 151 151 151 150 148 148 146 151
Other States** 127 121 138 135 150 145 161 154 155 167 163 180 150
Total 14,551 14,441 14,457 14,412 14,326 14,319 14,356 14,222 14,119 14,059 14,057 14,093 14,284
* Includes data for the states of New Hampshire, and Rhode Island.** Represents restricted data for the states of Delaware, Indiana, Iowa, Michigan, North Carolina, Ohio, West Virginia, and Wisconsin.
Northeast Federal Milk Marketing OrderNumber of Producers by State
Source: Northeast Monthly Federal Milk Order Market Statistics .
2008 Outlook Handbook Page 6-11
M.W. Stephenson Dairy—Markets & Policy

Jan-06 Feb-06 Mar-06 Apr-06 May-06 Jun-06 Jul-06 Aug-06 Sep-06 Oct-06 Nov-06 Dec-06Class I Utilization 45.0% 44.3% 45.3% 41.5% 43.2% 44.3% 42.7% 48.8% 52.1% 51.6% 52.3% 49.0%Class II Utilization 18.6% 18.6% 18.5% 18.8% 19.5% 20.1% 20.1% 23.1% 21.2% 21.5% 20.8% 16.8%Class III Utilization 21.7% 22.2% 21.4% 21.6% 21.6% 22.6% 24.2% 23.2% 22.3% 22.8% 22.5% 22.7%Class IV Utilization 14.7% 14.9% 14.8% 18.2% 15.6% 13.1% 12.9% 4.9% 4.5% 4.2% 4.5% 11.5%
Class I Price $16.63 $16.63 $15.74 $14.47 $14.22 $14.00 $14.59 $14.22 $14.10 $15.67 $15.65 $15.68Class II Price $13.25 $12.62 $11.69 $11.37 $11.13 $11.00 $10.83 $11.16 $11.74 $11.79 $11.98 $12.55Class III Price $13.39 $12.20 $11.11 $10.93 $10.83 $11.29 $10.92 $11.06 $12.29 $12.32 $12.84 $13.47Class IV Price $12.20 $11.10 $10.68 $10.36 $10.33 $10.22 $10.21 $10.64 $11.10 $11.51 $12.11 $12.30
Butterfat Price $1.47 $1.35 $1.26 $1.23 $1.26 $1.24 $1.22 $1.30 $1.42 $1.41 $1.39 $1.35Protein Price $2.40 $2.12 $1.88 $1.92 $1.91 $2.08 $1.98 $1.91 $2.13 $2.08 $2.24 $2.44Other Solids Price $0.19 $0.20 $0.19 $0.15 $0.13 $0.13 $0.13 $0.14 $0.16 $0.20 $0.23 $0.26PPD $1.39 $2.05 $2.32 $1.71 $1.78 $1.37 $1.87 $2.00 $1.14 $1.72 $1.37 $0.95
Class Utilization and PricesNortheast Federal Milk Marketing Order
Source: Northeast Monthly Federal Milk Order Market Statistics .
The graphs below are created from the data above. They illustrate the where the money in the Northeast Federal Order pool is coming from and how it is being paid out. The first graph shows the contribution of processors from the four classes of milk to the pool. The second graph shows the disbursement of the pool dollars to producers in component values and the Producer Price Differential. You can see from the chart that when class III prices are falling, the PPD will become larger. The opposite is true when prices are rising.
Makeup of 2006 Statistically Uniform Price by
Class Prices
$0.00
$2.00
$4.00
$6.00
$8.00
$10.00
$12.00
$14.00
$16.00
Jan-
06
Feb-
06
Mar
-06
Apr-0
6
May
-06
Jun-
06
Jul-0
6
Aug-
06
Sep-
06
Oct
-06
Nov
-06
Dec
-06
Class I
Class II
Class III
Class IV
Location Adjustment
Makeup of 2006 Statistically Uniform Price by Component Values
Northeast Federal MilkMarketing Order
$0.00
$2.00
$4.00
$6.00
$8.00
$10.00
$12.00
$14.00
$16.00
Jan-
06
Feb-
06
Mar
-06
Apr-0
6
May
-06
Jun-
06
Jul-0
6
Aug-
06
Sep-
06
Oct
-06
Nov
-06
Dec
-06
Butterfat Value
Protein Value
Other Solids Value
PPD
2008 Outlook Handbook Page 6-12
M.W. Stephenson Dairy—Markets & Policy

Month 2006 2007 Difference
October 14.04 22.38 8.34November 14.69 21.75 7.06December 15.01 22.08 7.07Fourth Quarter Average 14.58 22.07 7.49
Annual Average 15.64 13.57 -2.07
Month 2007 2008 Difference
January 15.09 21.15 6.06February 15.21 19.84 4.63March 16.08 19.50 3.42First Quarter Average 15.46 20.16 4.70
April 17.02 19.34 2.32May 18.60 19.08 0.48June 20.80 19.13 -1.67Second Quarter Average 18.81 19.18 0.38
July 22.94 18.86 -4.08August 23.14 19.02 -4.12September 22.99 19.12 -3.87Third Quarter Average 23.02 19.00 -4.02
October 22.38 18.95 -3.43November 21.75 18.69 -3.06December 22.08 18.27 -3.81Fourth Quarter Average 22.07 18.64 -3.43
Annual Average 19.84 19.25 -0.59
(dollars per hundredweight)
(dollars per hundredweight)
MILK PRICE PROJECTIONS*Northeast Federal Order Blend Price
3.5 Percent, Suffolk County, MassachusettsLast Quarter 2006-2007, Four Quarters 2007-2008
a
a
aa
a a
a
a
a
aaa
a
* Averages may not add due to rounding.a Projected.
2008 Outlook Handbook Page 6-13
M.W. Stephenson Dairy—Markets & Policy

Notes

W.A. Knoblauch/G.J. Conneman/L.D. Putnam Dairy--Farm Management
Chapter 7. Dairy -- Farm Management Wayne A. Knoblauch, Professor George J. Conneman, Professor
Linda D. Putnam, Extension Support Specialist
Herd Size Comparisons Data from the 240 New York dairy farms that participated in the Dairy Farm Business Summary (DFBS) Project in 2006 have been sorted into eight herd size categories and averages for the farms in each category are presented in Tables 7-1 and 7-2. Note that after the less than 50 cow category, the herd size categories increase by 25 cows up to 100 cows, by 100 cows up to 400 cows, and by 200 cows up to 600 cows. As herd size increases, the net farm income generally increases (Table 7-1). Net farm income without appreciation averaged $5,133 per farm for the less than 50 cow farms and $71,561 per farm for those with more than 600 cows. The rate of return to all capital without appreciation also generally increased as herd size increased. It is more than size of herd that determines profitability on dairy farms. Farms with 600 and more cows averaged $70 net farm income per cow while the less than 50 cow dairy farms averaged $129 net farm income per cow. The 200 to 299 herd size category had the highest net farm income per cow at $323, while the 50 to 74 herd size category had the second highest net farm income per cow at $205. Other factors that affect profitability and their relationship to the size classifications are shown in Table 7-2.
TABLE 7-1. COWS PER FARM AND FARM FAMILY INCOME MEASURES 240 New York Dairy Farms, 2006
Number of Cows
Number
of Farms
Average Number
of Cows
Net Farm Income without
Appreciation
Net Farm Income per Cow
Labor & Management Income per Operator
Return to all Capital
without Appreciation
Under 50 23 40 $5,133 $129 $-19,389 -5.2% 50 to 74 29 62 12,631 205 -13,164 -4.3% 75 to 99 27 86 13,607 158 -19,366 -3.7% 100 to 199 50 141 20,870 147 -23,030 -1.0% 200 to 299 19 247 79,907 323 7,001 2.6% 300 to 399 20 339 60,684 179 -19,018 1.8% 400 to 599 24 477 75,522 158 -21,663 1.8% 600 & over 48 1,021 71,561 70 -76,089 1.9% This year, with low milk prices, net farm income per cow did not exhibit the usual increase as herd size increased. Most herd size categories saw a decrease in operating cost of producing milk from a year earlier (Table 7-2). Net farm income per cow increases as farms become larger if the costs of increased purchased inputs are offset by greater and more efficient output. The farms with more than 600 cows averaged more milk sold per cow than any other size category (Table 7-2). With 24,152 pounds of milk sold per cow, farms in the largest herd size group averaged 18 percent more milk output per cow than the average of all herds in the summary with less than 600 cows. Note: All data in this section are from the New York Dairy Farm Business Summary and Analysis Project unless a specific source is specified. Publications reporting Dairy Farm Business Summary data for New York, six regions of the state, for large herds, small herds, grazing farms, and farms that rent are available from the Department of Applied Economics and Management website: http://aem.cornell.edu/outreach/publications.htm .

2008 Outlook Handbook
Dairy--Farm Management W.A. Knoblauch/G.J. Conneman/L.D. Putnam
Page 7-2
The ability to reach high levels of milk output per cow with a large herd is a major key to high profitability. Three times a day milking (3X) and supplementing with bST are herd management practices commonly used to increase milk output per cow in large herds. Many dairy farmers who have been willing and able to employ and manage the labor required to milk 3X have been successful. Only three percent of the 79 DFBS farms with less than 100 cows used a milking frequency greater than 2X. As herd size increased, the percent of herds using a higher milking frequency increased. Farms with 100 to 200 cows reported 8 percent of the herds milking more often than 2X, the 200-299 cow herds reported 42 percent, 300-399 cow herds reported 70 percent, 400-599 cow herds reported 67 percent, and the 600 cow and larger herds reported 81 percent exceeding the 2X milking frequency.
TABLE 7-2. COWS PER FARM AND RELATED FARM FACTORS 240 New York Dairy Farms, 2006
Number
Average Number
of
Milk Sold
Per Cow
Milk Sold Per Worker
Till- able
Acres
Forage DM Per
Cow
Farm Capital
Per
Cost of Producing Milk/Cwt.
of Cows Cows (lbs.) (cwt.) Per Cow (tons) Cow Operating Total Under 50 40 18,070 3,948 3.9 6.6 $12,192 $11.27 $20.66 50 to 74 62 18,326 4,825 3.5 7.6 9,588 11.23 18.78 75 to 99 86 18,936 5,679 3.0 8.6 9,302 11.38 18.10 100 to 199 141 19,818 7,334 2.8 8.7 9,575 11.66 17.02 200 to 299 247 21,454 9,491 2.3 7.2 7,712 11.07 14.73 300 to 399 339 23,538 9,262 2.3 9.4 8,305 12.08 15.37 400 to 599 477 22,913 9,768 2.3 8.4 7,593 11.80 15.05 600 & over 1,021 24,152 11,393 1.8 7.7 7,246 12.33 14.92 Bovine somatotropin (bST) was used to a greater extent on the large herd farms. bST was used consistently during 2006 on 11 percent of the herds with less than 100 cows, 32 percent of the farms with 100 to 299 cows and on 67 percent of the farms with 300 cows and more. Milk output per worker has always shown a strong correlation with net farm income. The farms with 100 cows or more averaged over 944,900 pounds of milk sold per worker while the farms with less than 100 cows averaged less than 481,800 pounds per worker. In achieving the highest productivity per cow and per worker, the largest farms had the fewest crop acres per cow and below average forage dry matter harvested per cow. However, the larger farms generally purchased more roughage per cow. The largest farms had the most efficient use of farm capital with an average investment of $7,246 per cow. The 19 farms with 200-299 cows had the lowest total cost of producing milk at $14.73 per hundredweight. The 48 farms with more than 600 cows held their average total costs of producing milk to $14.92 per hundredweight, $2.18 below the $17.10 average for the remaining 192 dairy farms. The lower average costs of production plus a similar milk price gave the managers of the largest dairy farms profit margins (milk price less total cost of producing milk) that averaged $2.22 per hundredweight above the average of the other 192 DFBS farms. All herd size categories averaged a negative profit margin in 2006. Ten-Year Comparisons The total cost of producing milk on DFBS farms has increased $0.66 per hundredweight over the past 10 years (Table 7-3). In the intervening years, total cost of production decreased 1997 through 1999, increased in 2000 and 2001, fell in 2002, again increased in 2003 and 2004, and decreased in 2005 and 2006. It is interesting to note that costs of production decrease in low milk price years and increase in high milk price years. Over the past 10 years milk sold per cow increased 12 percent and cows per worker increased 13 percent on DFBS farms (Table 7-4). Farm net worth has increased significantly, while percent equity has been fairly stable.

2008 Outlook Handbook
W.A. Knoblauch/G.J. Conneman/L.D. Putnam Dairy--Farm Management
Page 7-3

2008 Outlook Handbook
Dairy--Farm Management W.A. Knoblauch/G.J. Conneman/L.D. Putnam
Page 7-4

2008 Outlook Handbook
W.A. Knoblauch/G.J. Conneman/L.D. Putnam Dairy--Farm Management
Page 7-5
Dairy Operations and Milk Cow Inventory
TABLE 7-5. NUMBER OF DAIRY FARMS AND MILK COWS BY SIZE OF HERD
New York State, 2006 a, b
Size of Herd
Farms
Milk Cows
Number of Cows
Number
% of Total
Number
% of Total
1 - 29
1,300
20.3%
16,000
2.5%
30-49
1,300
20.3%
51,000
8.0%
50-99
2,300
35.9%
153,000
24.0%
100-199
920
14.4%
128,000
20.0%
200-399
310
4.9%
85,000
13.3%
400-699
160
2.5%
80,000
12.5%
700-999
60
0.9%
48,000
7.5%
1000-1499
30
0.5%
37,000
5.8%
1500 or more
20
0.3%
40,000
6.4%
Total
6,400
100.0%
638,000
100.0%
aThis information on number of farms and number of cows by size of herd is derived from several sources: - Dairy Statistics as published by the New York Agricultural Statistics Services for 2006. - CAFO (Concentrated Animal Feeding Operations) permit reports for 2006. Some small CAFO farms (farms with 200
to 700 milk cows) have not applied for or updated the permit. Estimates for these farms were made so as to reflect the total number of dairy farms in New York State.
b The author wishes to thank everyone who provided some data as well as providing valuable advice and perspectives: Lee Telega, Jacqueline Lendrum, Karl Czymmek, Wayne Knoblauch, Jason Karszes and B. F. Stanton. However, any errors, omissions or misstatements are solely the responsibility of the author, Professor George Conneman, e-mail [email protected].
In 2006, there were 6,400 dairy farms in New York State, and 638,000 milk cows as reported by
the NYASS. The table above was prepared based on the NYASS data plus the CAFO permit filing for additional herd size categories.
Ninety-one percent of the farms (less than 200 cows per farm) had 55 percent of the milk cows.
The remaining nine percent of the farms had nearly 45 percent of the cows. About 1.7 percent of the farms (those with 700 or more cows) had 20 percent of the cows. Farms with over 200 cows represent nearly 9 percent of total herds and had 45 percent of the total cows.
Farms with less than 50 cows represent 41 percent of all farms but only 10 percent of the cows. Farms with 1,500 or more cows represent 0.3 percent of the farms but kept 6 percent of the cows.

2008 Outlook Handbook
Dairy--Farm Management W.A. Knoblauch/G.J. Conneman/L.D. Putnam
Page 7-6

2008 Outlook Handbook
W.A. Knoblauch/G.J. Conneman/L.D. Putnam Dairy--Farm Management
Page 7-7
TABLE 7-7. FORTY YEARS OF CHANGES ON DAIRY FARMS
New York State, 1965 to 2005 Year
Item 1965 1975 1985 1995 2005 SIZE OF DAIRY BUSINESS Number of dairy farms 30,500 22,000 16,500 10,000 6,700
Farms with:
Less than 50 cows 25,450 14,350 9,550 4,300 2,700
200 or more cows 50 150 300 400 610
Number of milk cows (thousand head)
1,090 905 942 710 648
Total milk production (billion pounds)
11.0 10.0 11.7 11.6 12.1
Cows per farm 36 41 57 71 97
PRODUCTIVITY Milk sold per cow, lbs. 10,100 11,000 12,400 16,300 18,700
Milk sold per farm, lbs. 361,000 455,000 709,000 1,160,000 1,806,000
Worker equivalent per farm 2.0 2.2 2.5 2.7 3.0
Milk sold per worker, lbs. 180,000 207,000 284,000 430,000 602,000
Cows per worker 18 19 23 26 32
Price of milk, $/cwt. $4.39 $8.75 $12.80 $13.00 $15.90
Hay, all, per acre, tons 1.9 2.2 2.4 2.2 2.0 Hay, alfalfa, per acre, tons NA 2.6 2.8 2.7 2.5 Corn silage, per acre, tons 12.6 12.9 14.0 15.0 16.5 Corn grain, per acre, bushels 70 82 97 108 123 Sources: New York Agricultural Statistics Service; Cornell Producer Panel of Dairy Farms; estimates by G. J. Conneman
During the past 40 years (1965 to 2005) there have been dramatic changes on New York dairy farms in the number of farms, milk cows, production levels and efficiency of operations. The number of dairy farms decreased from 30,500 in 1965 to 6,700 in 2005, a decrease of 78 percent. The average size of farm increased from 36 cows to 97 cows. The number of dairy cows in 2005 was 648,000 head, a decrease of 41 percent from 1965. However, the total amount of milk produced increased from 11.0 billion pounds to 12.1 billion pounds as production per cow moved from 10,100 to 18,700 pounds, an increase of 85 percent in production per cow. Efficiency of production (as measured by milk sold per worker) increased from 180,000 pounds to 602,000 pounds, more than a tripling; cows per worker increased from 18 to 32 during the 40-year period. The number of farms with less than 50 cows decreased from 25,450 to 2,700; those with 200 or more cows increased from 50 to 610.

2008 Outlook Handbook
Dairy--Farm Management W.A. Knoblauch/G.J. Conneman/L.D. Putnam
Page 7-8
TABLE 7-8. COMPARISON OF FARM BUSINESS SUMMARY DATA
Same 53 New York Dairy Farms, 1997- 2006 Selected Factors
1997
1998
1999
2000
Milk receipts per cwt. milk $13.75 $15.74 $15.28 $13.45 Size of Business Average number of cows 281 301 318 338 Average number of heifers 206 229 236 251 Milk sold, cwt. 61,574 65,319 71,452 76,307 Worker equivalent 6.94 7.24 7.62 7.83 Total tillable acres 611 636 667 684 Rates of Production Milk sold per cow, lbs. 21,885 21,709 22,444 22,551 Hay DM per acre, tons 2.8 3.5 3.3 3.7 Corn silage per acre, tons 16 22 17 15 Labor Efficiency Cows per worker 41 42 42 43 Milk sold per worker, lbs. 887,238 902,200 937,695 974,546 Cost Control Grain & concentrate purchased as % of milk sales 33% 25% 24% 27% Dairy feed & crop expense per cwt. milk $5.36 $5.06 $4.76 $4.60 Operating cost of producing cwt. milk $11.62 $11.53 $11.15 $11.30 Total cost of producing cwt. milk $14.19 $14.39 $14.05 $14.20 Hired labor cost per cwt. $2.13 $2.25 $2.34 $2.40 Interest paid per cwt. $0.86 $0.84 $0.74 $0.88 Labor & machinery costs per cow $1,028 $1,109 $1,186 $1,212 Replacement livestock expense $13,013 $15,341 $17,626 $21,448 Expansion livestock expense $18,188 $18,262 $19,128 $33,150 Capital Efficiency Farm capital per cow $6,059 $6,187 $6,410 $6,507 Machinery & equipment per cow $1,085 $1,158 $1,212 $1,251 Real estate per cow $2,461 $2,401 $2,425 $2,399 Livestock investment per cow $1,505 $1,515 $1,548 $1,605 Asset turnover ratio 0.56 0.65 0.63 0.57 Profitability Net farm income without appreciation $74,138 $199,213 $199,889 $70,994 Net farm income with appreciation $80,783 $245,478 $244,050 $124,052 Labor & management income per operator/manager
$14,589
$91,537
$84,268
$1,349
Rate return on: Equity capital with appreciation 2.9% 17.5% 15.1% 4.7% All capital with appreciation 4.8% 13.1% 11.5% 5.8% All capital without appreciation 4.4% 10.6% 9.8% 3.4% Financial Summary, End Year Farm net worth $988,466 $1,160,451 $1,280,068 $1,298,955 Change in net worth with appreciation $18,055 $174,364 $134,609 $21,559 Debt to asset ratio 0.43 0.41 0.40 0.42 Farm debt per cow $2,627 $2,582 $2,653 $2,666 Farms participating in the DFBS each of the last 10 years have increased size of business, labor efficiency and milk sold per cow (Table 7-8). All measures of profitability exhibit wide variability from year-to-year and are highly correlated with milk price received.
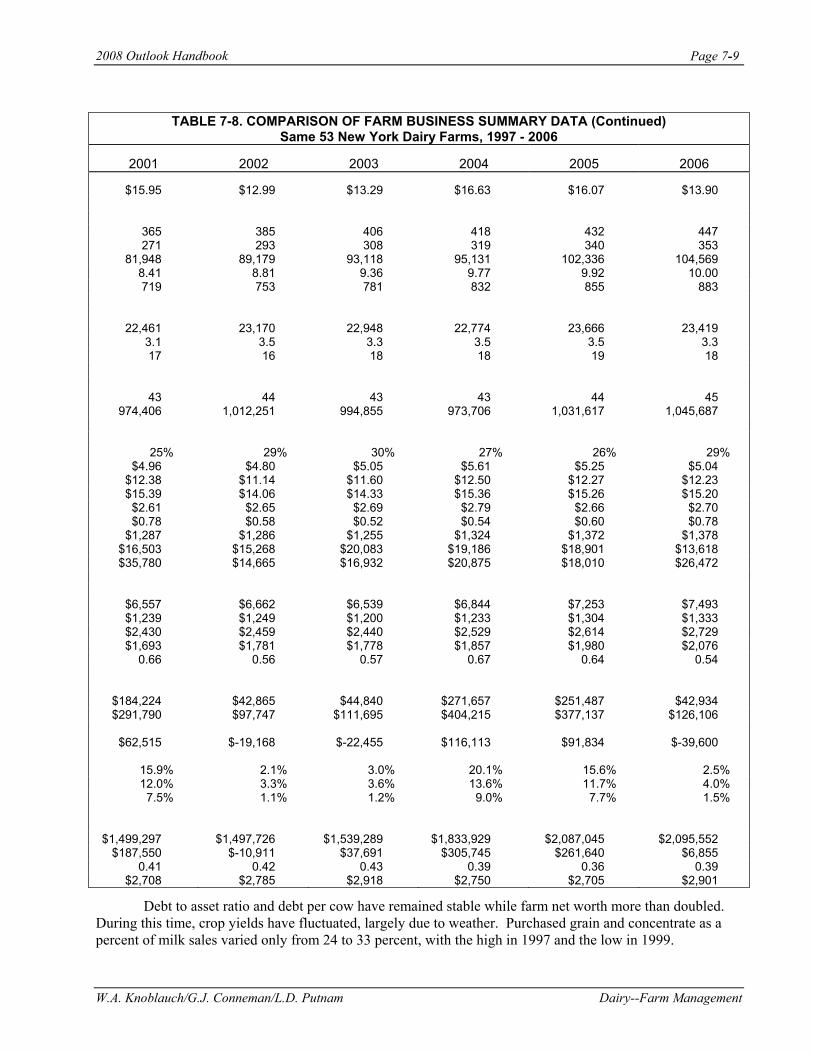
2008 Outlook Handbook
W.A. Knoblauch/G.J. Conneman/L.D. Putnam Dairy--Farm Management
Page 7-9
TABLE 7-8. COMPARISON OF FARM BUSINESS SUMMARY DATA (Continued)
Same 53 New York Dairy Farms, 1997 - 2006
2001
2002
2003
2004
2005
2006 $15.95 $12.99 $13.29 $16.63 $16.07 $13.90 365 385 406 418 432 447 271 293 308 319 340 353 81,948 89,179 93,118 95,131 102,336 104,569 8.41 8.81 9.36 9.77 9.92 10.00 719 753 781 832 855 883 22,461 23,170 22,948 22,774 23,666 23,419 3.1 3.5 3.3 3.5 3.5 3.3 17 16 18 18 19 18 43 44 43 43 44 45 974,406 1,012,251 994,855 973,706 1,031,617 1,045,687 25% 29% 30% 27% 26% 29% $4.96 $4.80 $5.05 $5.61 $5.25 $5.04 $12.38 $11.14 $11.60 $12.50 $12.27 $12.23 $15.39 $14.06 $14.33 $15.36 $15.26 $15.20 $2.61 $2.65 $2.69 $2.79 $2.66 $2.70 $0.78 $0.58 $0.52 $0.54 $0.60 $0.78 $1,287 $1,286 $1,255 $1,324 $1,372 $1,378 $16,503 $15,268 $20,083 $19,186 $18,901 $13,618 $35,780 $14,665 $16,932 $20,875 $18,010 $26,472 $6,557 $6,662 $6,539 $6,844 $7,253 $7,493 $1,239 $1,249 $1,200 $1,233 $1,304 $1,333 $2,430 $2,459 $2,440 $2,529 $2,614 $2,729 $1,693 $1,781 $1,778 $1,857 $1,980 $2,076 0.66 0.56 0.57 0.67 0.64 0.54 $184,224 $42,865 $44,840 $271,657 $251,487 $42,934 $291,790 $97,747 $111,695 $404,215 $377,137 $126,106 $62,515
$-19,168
$-22,455
$116,113
$91,834
$-39,600
15.9%
2.1%
3.0%
20.1%
15.6%
2.5%
12.0% 3.3% 3.6% 13.6% 11.7% 4.0% 7.5% 1.1% 1.2% 9.0% 7.7% 1.5% $1,499,297 $1,497,726 $1,539,289 $1,833,929 $2,087,045 $2,095,552 $187,550 $-10,911 $37,691 $305,745 $261,640 $6,855 0.41 0.42 0.43 0.39 0.36 0.39 $2,708 $2,785 $2,918 $2,750 $2,705 $2,901
Debt to asset ratio and debt per cow have remained stable while farm net worth more than doubled. During this time, crop yields have fluctuated, largely due to weather. Purchased grain and concentrate as a percent of milk sales varied only from 24 to 33 percent, with the high in 1997 and the low in 1999.

2008 Outlook Handbook
Dairy--Farm Management W.A. Knoblauch/G.J. Conneman/L.D. Putnam
Page 7-10
TABLE 7-9. COMPARISON OF DAIRY FARM BUSINESS DATA BY REGION 240 New York Dairy Farms, 2006
Item
Western & Central Plateau Region
Western & Central
Plain Region
Northern New York
Central Valleys
Northern Hudson &
South-eastern
New York Number of farms 44 63 34 42 57 ACCRUAL EXPENSES Hired labor $72,688 $431,362 $190,630 $124,605 $138,584 Feed 147,890 654,989 356,861 222,701 248,472 Machinery 59,790 239,206 117,219 100,673 98,616 Livestock 97,834 454,894 252,333 151,483 193,070 Crops 26,300 102,076 51,465 52,760 44,333 Real estate 24,678 105,121 53,321 46,086 36,869 Other 56,470 240,217 120,182 87,952 81,002 Total Operating Expenses $485,650 $2,227,865 $1,142,012 $786,261 $840,946 Expansion livestock 14,960 21,236 24,255 6,466 12,925 Extraordinary expense 2,197 105 0 326 815 Machinery depreciation 29,916 109,100 68,644 49,409 35,043 Building depreciation 16,519 81,478 50,406 25,025 21,273 Total Accrual Expenses $549,242 $2,439,783 $1,285,318 $867,486 $911,002 ACCRUAL RECEIPTS Milk sales $477,809 $2,131,837 $1,121,973 $767,903 $756,154 Livestock 60,938 211,594 131,508 66,531 88,088 Crops 18,937 70,680 26,911 14,158 -237 Government receipts 33,571 63,149 30,478 39,184 35,457 All other 11,034 46,170 20,329 17,261 16,343 Total Accrual Receipts $602,289 $2,523,430 $1,331,198 $905,037 $895,805 PROFITABILITY ANALYSIS Net farm income (w/o appreciation) $53,047 $83,646 $45,881 $37,550 $-15,197 Net farm income (w/ appreciation) $94,560 $201,168 $181,685 $88,605 $25,306 Labor & management income $2,040 $-58,071 $-43,462 $-42,021 $-95,105 Number of operators 1.47 1.70 1.61 1.78 1.59 Labor & mgmt. income/operator $1,388 $-34,159 $-26,995 $-23,607 $-59,815 BUSINESS FACTORS Worker equivalent 4.19 13.79 8.21 6.05 6.66 Number of cows 156 659 352 248 234 Number of heifers 125 520 284 206 199 Acres of hay cropsa 213 596 443 299 297 Acres of corn silagea 140 490 295 232 214 Total tillable acres 373 1,184 800 619 545 Pounds of milk sold 3,415,923 15,521,478 8,295,244 5,385,004 5,339,152 Pounds of milk sold/cow 21,945 23,565 23,545 21,715 22,821 Tons hay crop dry matter/acre 2.9 3.6 3.2 3.0 2.9 Tons corn silage/acre 19.8 20.3 19.6 16.8 13.8 Cows/worker 37 48 43 41 35 Pounds of milk sold/worker 814,932 1,125,969 1,010,588 890,819 802,176 % grain & conc. of milk receipts 31% 27% 29% 28% 32% Feed & crop expense/cwt. milk $5.09 $4.87 $4.90 $5.11 $5.48 Fertilizer & lime/crop acre $27.16 $33.81 $21.16 $29.89 $35.49 Machinery cost/tillable acre $273 $318 $263 $278 $281 aExcludes farms that do not harvest forages.

2008 Outlook Handbook
W.A. Knoblauch/G.J. Conneman/L.D. Putnam Dairy--Farm Management
Page 7-11
FIGURE 7-1. PERCENT CHANGE IN MILK PRODUCTION Five Regions in New York, 1996-2006
TABLE 7-10. MILK PRODUCTION & AVERAGE COST OF PRODUCING MILK Five Regions of New York
Regiona Item 1 2 3 4 5 Milk Productionb (million pounds) 1996 2,103.6 3,123.5 2,179.7 2,682.2 1,416.5 2006 1,971.5 3,971.0 2,418.5 2,390.0 1,294.0 Percent change -6.3% +27.1% +11.0% -10.9% -8.6% 2006 Cost of Producing Milkc ($ per hundredweight milk) Operating cost $11.01 $11.97 $11.54 $12.17 $13.38 Total cost 15.46 14.68 14.81 16.34 16.92 Average price received 13.99 13.73 13.53 14.26 14.16 Return per cwt. to operator labor, management & capital
$1.37
$0.49
$0.50
$0.61
$-0.43
aSee Figure 7-1 for region descriptions. bSource: New York Agricultural Statistics Service, Milk-County Estimates. c From Dairy Farm Business Summary data.

2008 Outlook Handbook
Dairy--Farm Management W.A. Knoblauch/G.J. Conneman/L.D. Putnam
Page 7-12
Farm Business Charts The Farm Business Chart is a tool which can be used in analyzing a business by drawing a line through the figure in each column which represents the current level of management performance. The figure at the top of each column is the average of the top 10 percent of the 240 farms for that factor. The other figures in each column are the average for the second 10 percent, third 10 percent, etc. Each column of the chart is independent of the others. The farms which are in the top 10 percent for one factor would not necessarily be the same farms which make up the top 10 percent for any other factor. The cost control factors are ranked from low to high, but the lowest cost is not necessarily the most profitable. In some cases, the "best" management position is somewhere near the middle or average. Many things affect the level of costs, and must be taken into account when analyzing the factors.
TABLE 7-11. FARM BUSINESS CHART FOR FARM MANAGEMENT COOPERATORS
240 New York Dairy Farms, 2006 Size of Business Rates of Production Labor Efficiency
Worker Equiv- alent
No. of
Cows
Pounds
Milk Sold
Pounds
Milk Sold Per Cow
Tons
Hay Crop DM/Acre
Tons Corn
Silage Per Acre
Cows Per
Worker
Pounds Milk Sold
Per Worker
28.1 1,334 32,838,030 26,422 5.7 26 63 1,408,635 16.3 709 16,957,054 24,798 4.1 22 51 1,164,573 11.0 477 10,783,772 23,910 3.7 20 47 1,039,317 7.6 331 7,448,566 23,018 3.4 19 42 954,496 5.2 214 4,585,983 22,109 3.1 18 39 826,233 4.0 146 2,847,092 20,965 2.7 17 36 731,278 3.4 110 2,130,985 19,752 2.4 16 33 650,759 2.8 81 1,531,301 18,425 2.2 14 30 585,305 2.1 60 1,068,877 16,623 1.9 12 26 478,008 1.5 40 670,582 12,981 1.3 9 20 321,457
Cost Control
Grain
Bought Per Cow
% Grain is of Milk
Receipts
Machinery Costs
Per Cow
Labor & Machinery
Costs Per Cow
Feed & Crop Expenses Per Cow
Feed & Crop Expenses Per
Cwt. Milk $405 17% $340 $951 $570 $3.30 622 23 464 1,148 800 4.11 706 26 530 1,255 884 4.48 782 27 573 1,336 988 4.76 842 29 621 1,396 1,061 4.99 892 30 658 1,462 1,125 5.17 945 31 702 1,544 1,174 5.36 1,006 33 760 1,679 1,255 5.70 1,057 36 855 1,849 1,325 6.24 1,221 42 1,139 2,320 1,501 7.37

2008 Outlook Handbook
W.A. Knoblauch/G.J. Conneman/L.D. Putnam Dairy--Farm Management
Page 7-13
The next section of the Farm Business Chart provides for comparative analysis of the value and costs of dairy production. The profitability section shows the variation in farm income by decile and enables a dairy farmer to determine where he or she ranks by using several measures of farm profitability. Remember that each column is independently established and the farms making up the top decile in the first column will not necessarily be on the top of any other column. The dairy farmer who ranks at or near the top of most of these columns is in a very enviable position.
TABLE 7-11. (CONTINUED) FARM BUSINESS CHART FOR
FARM MANAGEMENT COOPERATORS 240 New York Dairy Farms, 2006
Milk Receipts Per Cow
Milk Receipts Per Cwt.
Operating Cost Milk Production
Per Cow
Operating Cost Milk Production
Per Cwt.
Total Cost Milk Production
Per Cow
Total Cost Milk Prod. Per Cwt.
$3,700 $15.39 $1,328 $8.24 $2,373 $12.93 3,413 14.56 1,738 9.69 2,865 14.08 3,274 14.26 2,026 10.30 3,118 14.66 3,163 14.00 2,231 10.74 3,306 15.28 3,061 13.83 2,369 11.27 3,444 15.83 2,909 13.68 2,564 11.93 3,546 16.43 2,720 13.54 2,707 12.44 3,712 17.35 2,565 13.40 2,901 12.94 3,839 18.55 2,338 13.24 3,131 13.62 4,062 20.16 1,808 12.88 3,465 15.95 4,500 24.96
Profitability
Net Farm Income Without Appreciation
Net Farm Income With Appreciation
Labor & Management Income
Total
Per Cow
Operations Ratio
Total
Per Cow
Per Farm
Per Operator
$322,100 $811 0.23 $580,521 $1,156 $152,400 $103,004 140,266 557 0.16 251,067 777 43,564 25,997 85,016 444 0.12 162,504 628 12,316 7,456 51,109 344 0.10 103,202 523 -3,736 -2,485 32,171 214 0.06 69,484 416 -18,707 -13,358 18,126 125 0.03 45,567 309 -37,164 -26,146 4,697 34 0.01 29,036 228 -62,910 -45,584 -16,215 -80 -0.02 15,548 100 -88,972 -65,273 -41,972 -194 -0.06 -5,920 -40 -137,571 -96,575 -183,853 -653 -0.25 -76,486 -442 -368,899 -215,708

2008 Outlook Handbook
Dairy--Farm Management W.A. Knoblauch/G.J. Conneman/L.D. Putnam
Page 7-14
Financial Analysis Chart The farm financial analysis chart is designed just like the farm business chart on the previous pages and may be used to measure the financial health of the farm business.
TABLE 7-12. FINANCIAL ANALYSIS CHART 240 New York Dairy Farms, 2006
Liquidity (repayment)
Planned Debt
Payments Per Cow
Available for
Debt Service Per Cow
Cash Flow Coverage
Ratio
Debt Coverage
Ratio
Debt Payments as Percent
of Milk Sales
Debt Per Cow
Working
Capital as % of Total Expenses
Current Ratio
$70 $916 6.08 5.75 2% $ 355 44% 21.29 207 677 1.62 1.69 7 1,144 29 4.45 309 570 1.29 1.31 10 1,735 22 2.97 372 518 1.04 1.09 12 2,217 17 2.24 414 451 0.85 0.92 14 2,531 14 1.86
465 371 0.75 0.71 16 2,867 10 1.62 536 290 0.64 0.50 18 3,221 7 1.36 605 186 0.50 0.34 21 3,581 2 1.08 689 90 0.25 0.01 24 4,197 -4 0.80 872 -323 -1.12 -1.67 34 5,299 -18 0.42
Solvency Operational Ratios Debt/Asset Ratio Operating Interest Depreciation
Leverage Percent Current & Long Expense Expense Expense Ratioa Equity Intermediate Term Ratio Ratio Ratio 0.03 97% 0.03 0.00 0.65 0.00 0.02 0.16 87 0.11 0.00 0.72 0.02 0.05 0.23 82 0.17 0.02 0.76 0.03 0.05 0.33 76 0.25 0.13 0.79 0.04 0.06 0.45 69 0.29 0.22 0.81 0.04 0.07
0.57 64 0.33 0.31 0.83 0.05 0.08 0.65 61 0.39 0.42 0.85 0.06 0.09 0.85 54 0.48 0.56 0.88 0.07 0.10 1.14 47 0.56 0.68 0.92 0.07 0.12 2.38 34 0.79 0.89 1.09 0.11 0.17
Efficiency (Capital) Profitability Percent Rate of Return with
Appreciation on: Asset
Turnover (ratio)
Real Estate Investment Per Cow
Machinery Investment Per Cow
Total Farm Assets
Per Cow
Change in Net Worth
With Appreciation Equity Investmentb 0.73 $1,452 $596 $5,471 $370,169 16% 12% 0.60 2,183 872 6,557 125,206 9 8 0.54 2,529 1,087 7,001 70,554 5 5 0.50 2,859 1,305 7,418 35,165 3 4 0.46 3,176 1,508 7,851 14,111 1 3
0.43 3,572 1,681 8,564 3,977 -1 2 0.38 4,041 1,899 9,460 -7,539 -2 0 0.35 4,658 2,211 10,346 -23,182 -5 -2 0.30 5,572 2,670 11,680 -62,442 -10 -4 0.21 8,469 3,845 15,097 -254,438 -27 -11
aDollars of debt per dollar of equity, computed by dividing total liabilities by total equity. bReturn on all farm capital (no deduction for interest paid) divided by total farm assets.

2008 Outlook Handbook
W.A. Knoblauch/G.J. Conneman/L.D. Putnam Dairy--Farm Management
Page 7-15
Prices Paid by New York Dairy Farmers and Values of Inventory Items
The prices dairy farmers pay for a given quantity of goods and services has a major influence on farm production costs. The astute manager will keep close watch on unit costs and utilize the most economical goods and services. The table below shows average prices of selected goods and services used on New York dairy farms.
TABLE 7-13. PRICES PAID BY NEW YORK FARMERS FOR SELECTED ITEMS, 1994 - 2006
Year
Mixed Dairy Feed
16% Proteina
Fertilizer, Urea
45-46%Na
Seed Corn,
Hybridb
Diesel Fuela
Tractor 50-59 PTOb
Wage Rate
All Hired Farm
Workersc ($/ton) ($/ton) ($/80,000 Kernels) ($/gallon) ($) ($/hour)
1994 181 233 73.40 0.853 19,800 6.96 1995 175 316 77.10 0.850 20,100 6.92 1996 226 328 77.70 1.020 20,600 7.19 1997 216 287 83.50 0.960 21,200 7.63 1998 199 221 86.90 0.810 21,800 7.63 1999 175 180 88.10 0.750 21,900 8.12 2000 174 201 87.50 1.270 21,800 8.74 2001 176 270 92.20 1.260 22,000 8.72 2002 178 232 92.00 1.028 21,900 9.26 2003 194 283 102.00 1.516 21,300 9.93 2004 207 299 105.00 1.400 21,500 9.96 2005 190 365 111.00 2.020 23,400 9.88 2006 239 403 118.00 2.355 23,700 10.35 SOURCE: NYASS, New York Agricultural Statistics. USDA, NASS, Agricultural Prices. aNortheast region average. bUnited States average. cNew York and New England combined.
Inflation, farm profitability, supply and demand all have a direct impact on the inventory values on New York dairy farms. The table below shows year-end (December) prices paid for dairy cows (replacements), an index of these cow prices, an index of new machinery prices (U.S. average), the average per acre value of farmland and buildings reported in January, and an index of the real estate prices.
TABLE 7-14. VALUES AND INDICES OF NEW YORK DAIRY FARM INVENTORY ITEMS, 1991 - 2006
Dairy Cows Machinerya Farm Real Estateb Year Value/Head 1977=100 1977=100 Value/Acre 1977=100 1991 1,040 210 219 1,095 187 1992 1,090 220 226 1,139 194 1993 1,100 222 235 1,237 211 1994 1,100 222 249 1,260 215 1995 1,010 204 258 1,280 218 1996 1,030 208 268 1,260 215 1997 980 198 276 1,250 213 1998 1,050 212 286 1,280 218 1999 1,250 253 294 1,340 228 2000 1,250 253 301 1,430 244 2001 1,600 323 312 1,520 259 2002 1,400 283 320 1,610 274 2003 1,300 263 325 1,700 290 2004 1,580 319 351 1,780 303 2005 1,690 341 373 1,920 327 2006 1,550 313 392 2,050 349 SOURCE: NYASS, New York Agricultural Statistics and New York Crop and Livestock Report. USDA, ASB, Agricultural Prices. aUnited States average; 1995 - 2006 are estimated due to discontinuation of 1977=100 series. bNew York average for 2000 – 2006 excludes Native American reservation land.

Notes

C.J. Regelbrugge, T.R. Maloney Immigration Issues
Chapter 8. Immigration Issues Craig Regelbrugge, Vice President for Government Relations ANLA
Thomas R. Maloney, Senior Extension Associate
What’s Next for Immigration Reform? An Industry Perspective By Craig J. Regelbrugge, Vice President for Government Relations American Nursery & Landscape Association National Co-chair, Agriculture Coalition for Immigration Reform
Thank you for the opportunity to address your conference to share a national perspective of American labor intensive agriculture on the immigration reform issue. These perspectives reflect my experience as co-chairman of the Agriculture Coalition for Immigration Reform, a national ad-hoc coalition of over 300 producer associations representing all facets of labor-intensive agriculture such as fruit and vegetables, nursery and greenhouse, dairy, and Christmas trees. Obviously, each of these sectors is an important contributor to the agricultural economy of the state of New York. I will first share some general observations that create a context, then to touch on the status and the outlook for reform.
While Tom Maloney may go into greater Empire State-specific data, allow me to share some details on the demographics of the farm labor force in America. The startling bottom line is as follows: government surveys coupled with other anecdotal evidence combine to suggest that a significant majority – likely over 70% -- of farmworkers in America lack proper work authorization and immigration status. The unstable foundation upon which the future success of much of our agricultural productivity rests constitutes nothing short of a national emergency. How might we best address the crisis? Before elaborating, it is important that we learn from our history. A defining chapter was written in the mid-1980’s.
Shortly after the passage of the Immigration Reform and Control Act of 1986, the Department of Labor (DOL) conducted its first National Agricultural Worker Survey (NAWS). Among other things, the survey asked seasonal agricultural workers whether they were authorized to work in the United States. In the first survey, in 1989, 7% of U.S. seasonal agricultural workers said they were unauthorized. By the 1990-91 survey the figure was 16%. By 1992-93 it was 28%. By 1994-95 it was 37%. By the 1997-98 survey it was 52%. A straight-line extrapolation to 2005 of the statistics from 1989 through 1998 suggests the percentage of U.S. farm workers who were unauthorized to work in 2005 was 76%. Those numbers may be somewhat lower in full-time occupations such as dairy, but it is believed that even a majority of the dairy industry labor force lacks proper immigration status.
Even more shocking are the implications of NAWS data regarding the new workers entering the industry for the first time. In the 1994-95 NAWS, 70 % of new entrants into the U.S. agricultural work force admitted that they were unauthorized to work. A special but unpublished tabulation for the eastern half of the U.S. by Dr. Dan Carroll of the DOL revealed that an astounding 99% of new labor force entrants into the agricultural work force in the eastern states in 1998-99 were unauthorized to work in the United States. So again, the startling reality is that each year, one out of six farm workers is new to the agricultural sector, and virtually every single one of them is unauthorized. This is the applicant pool sustaining American agriculture.
The phenomenon I just described is largely a policy failure of the IRCA legislation, and of our Congress. Under IRCA, an estimated 1.2 million farmworkers legalized. However, many of those workers soon found employment in other industries offering more desirable (less seasonal, less intermittent, less difficult, or higher-paying) jobs. Let me be clear – I reject outright the old-school economic view that simply raising wages would have somehow enabled American agriculture to retain most of these workers, or attract

2008 Outlook Handbook Page 8-2
Immigration Issues C.J. Regelbrugge, T.R. Maloney
other domestic workers in sufficient numbers to meet the need. Increasing global competition aside, there are underlying structural realities in agriculture, such as seasonality or intermittent work and the vagaries of climate, that define the work and often translate to lower annual income than might be obtained in less seasonal industries where the hourly rate may be equivalent or even lower.
In short, the policy failure of IRCA was Congress’ failure to put into place a long term strategy for accessing a legal agricultural labor force when insufficient domestic workers are available. That failure has been manifested in the increasing reliance on unauthorized workers ever since. Put another way, our country has reaped what Congress has sown.
Are these unauthorized immigrant workers taking American jobs? The agricultural sector operates in a competitive and vibrant American economy characterized by low unemployment and historically high levels of education. The rational way to describe what is happening is this: most farm work is relatively entry-level, and given the structural realities I have already described, many farmworkers do not make a career out of field or livestock labor. This leads to somewhat of a churning effect in the farm labor force. Moreover, the creation of millions more jobs in the American economy than there are Americans to fill them has left agriculture overwhelmingly reliant on an illegal labor force. Meanwhile, the only available temporary worker program, known as H-2A, is hobbled by bureaucracy and only provides two percent of the labor force nationally. New York is slightly more reliant on H-2A than the nation; 4.6% of Empire State job opportunities were certified to be filled by H-2A in 2006.
There is another important dynamic worth noting at this time. Call it the “rest of the story.” For many years, agricultural employers after completing the I-9 process have turned a blind eye to a worker’s immigration status. They have rewarded and promoted the best workers. Over time, this has led to a significant presence of unauthorized workers in skilled, year-round, and even supervisory positions across agricultural sectors. This is clearly the reality in dairy but it goes to other sectors as well. It is essential that policymakers understand this reality. So-called “solutions” that would force these workers to leave the country to apply for a legal status, or relegate these workers to a future as temporary or seasonal workers, would essentially eviscerate the backbone and kick out the career ladder for nurseries, dairies, and other types of operations reliant on such experienced workers.
I would like to offer a few more points of important perspective before touching on legislation. First, some have criticized agriculture for failing to mechanize. Great strides have been made toward mechanization, and it could be said that the easy work is done. But the more important consideration is not mechanization, it is labor productivity. The fact that agricultural employment has actually declined between 1990 and 2006 while output has grown is a direct reflection of labor productivity gains. Automation and mechanization are part of the picture, yet so are innovations like the development of dwarf fruit trees that simplify the harvest.
From 1990 through 2002 labor productivity in U.S. agriculture increased 29%. Aggregate agricultural output increased 15.4% while total labor input decreased by 9.2%. So the notion that the influx of illegal aliens into the agricultural workforce has caused labor productivity to stagnate, and that farmers have relied on hiring illegal workers rather than adopting labor-saving technological innovations, is not supported by the data.
The crop diversity, nature and array of work tasks, site variability, environmental conditions and other factors that define American agriculture also explain why mechanization is not a one-size-fits-all or complete solution. Furthermore, limited profit margins in agriculture are not conducive to self-funded efforts. Where mechanization does offer promise, the needed research is expensive, speculative, and long-term. It will require a sustained public/private research partnership in order to reap significant gains.

Page 8-3 2008 Outlook Handbook
C.J. Regelbrugge, T.R. Maloney Immigration Issues
Some have gone so far as to criticize agriculture for locating in remote rural areas far from population centers, suggesting that this has driven labor shortages. Such criticisms fall somewhere between the curious and the absurd. Agricultural productivity in most specialty crop sectors is linked to the productivity of the land. Factors like soil, favorable climate, and availability of resources such as water are key. Production close to urbanizing areas is generally not competitive and sustainable due to high land costs, with a few notable exceptions in the higher-value specialty crop industries. Is an Immigration Solution Within Reach?
Addressing the worsening farm labor crisis will require a multifaceted effort that is centered on enactment of major immigration reform legislation. An administrative effort now underway by the Bush Administration to achieve some H-2A reforms could provide some welcomed improvements, but even if successful, cannot alone address the depth and breadth of the crisis. A large-scale shift to H-2A will require substantial transition time for capacity-building. On-farm capacity includes needed infrastructure such as farmworker housing. Housing is capital-intensive and subject to local approval processes that can take considerable time. Government agency capacity also needs expansion, notably at the U.S. consulates that play a major role issuing visas. At present, even with very low H-2A use rates, weeks of delay are often encountered processing workers.
Legislative reform is essential. Agriculture is comparatively well-positioned in the contentious and so-far unproductive Congressional debate, both in terms of lawmaker awareness of the problem, and time-tested legislative proposals. Representatives of labor intensive agriculture first began to push for reform in the mid-1990’s, when Congress began considering harsh, anti-employer enforcement measures. Early efforts focused on overhauling the 50-year-old H-2A agricultural temporary worker program to make it more responsive and affordable. However, those efforts became partisan and subsequently failed for that reason. Employer advocates learned that neither party can successfully enact legislation on its own. Rather, bipartisan collaboration is needed.
In 2000, employer and worker advocates came together to seek common ground. Several years of negotiation resulted in the landmark legislation known as the Agricultural Job Opportunity, Benefits, and Security Act, or AgJOBS. First introduced in 2003, AgJOBS was reintroduced in the 110th Congress as S.340 and H.R. 371. Both bills have attracted broad bipartisan support despite the controversial nature of the immigration reform issue.
AgJOBS is a two-part proposal. Think of it as “long term solution” and “transition strategy.” The long-term solution is H-2A reform. AgJOBS cuts red tape, simplifies the program, makes it more affordable, and addresses concerns over the balance of employee rights and employer protections.
The transition strategy is an “earned adjustment” program that would allow experienced and trusted farmworkers who are unauthorized to earn legal status over a period of years subject to strict conditions. A primary condition is a commitment to remain working in agriculture for at least three to five years.
AgJOBS enjoys the support of literally hundreds of national, regional and state producer associations whose members are engaged in labor-intensive agriculture. Nursery, fruit and vegetable, dairy, Christmas tree, livestock, and other interests are at the table. It also enjoys the support of labor, civil rights, community, and religious groups across the political spectrum.
AgJOBS passed the Senate last year when Sen. Dianne Feinstein (D-CA) added AgJOBS as an amendment to S.2611, the Comprehensive Immigration Reform Act of 2006. However, the House of Representatives failed to act on any bill that went beyond punitive and anti-employer enforcement measures. Earlier this year, the essential provisions of AgJOBS were incorporated into the comprehensive bill debated in the Senate in May and June. The bill was huge, complicated, and mischaracterized. It ultimately failed.

2008 Outlook Handbook Page 8-4
Immigration Issues C.J. Regelbrugge, T.R. Maloney
Few immigration and Congressional analysts see any chance of comprehensive immigration reform
coming back before the November 2008 elections. Many declare the issue dead until 2009 at the earliest. Others see some possibility for enactment of a few narrower measures this year or in the first quarter of 2008. Elements of a smaller package might include AgJOBS, a limited H-2B returning worker visa cap exemption, some H-1B program expansion, and some enforcement elements.
Meanwhile, the industry is and should be deeply concerned about two other developments. First is the federal Department of Homeland Security (DHS) “social security no-match” rule published last August. The rule would provide guidelines for employers who receive letters reporting data problems on their tax filings to take affirmative steps to resolve those matches or terminate workers. Failure to follow the guidelines would subject employers to serious legal liability. Adherence would, practically speaking, require employers to fire their most experienced workers, and not to re-hire returning seasonal workers. While the rule’s implementation has been delayed by litigation in federal district court, DHS is seeking to republish the rule under the court’s oversight. It could be implemented within the first half of 2008.
Secondly, the continued failure of Congress to act is prompting many states and localities to rush to fill the vacuum. Many state or local initiatives target employers and the hiring process, and are creating a chaotic situation. The Costs of Delay or Failure
The situation in agriculture is bad and deteriorating and agriculture needs relief. At profound risks are farms, farm employment, and literally millions jobs in the upstream and downstream economy that depend upon agricultural production and would likely cease to exist if major elements of American agriculture move offshore.
Already, we are seeing the impacts of labor scarcity. In extreme localized examples, crop loss is being experienced. For example, in 2006, one quarter of the pear crop in Lake County, CA was lost due to labor shortages. This past spring, in one county in western Michigan, an estimated one million pounds of asparagus stalks were mowed off due to lack of harvester labor. Even where crop loss hasn’t been profound, a certain labor force “triage” is underway. Examples include reduced planting, reduced harvest, decisions to switch to less profitable but lower labor crops, deferring some essential tasks such as pruning, and even shifting production offshore.
Here in the state, the Farm Credit Associations of New York recently revised an analysis that forecasts the impact of an immigration “enforcement-only” policy in the state. In short, the analysis concluded that: • Over 800 New York farms are severely vulnerable to failure or severely curtailed operations; • Those farms have total sales of at least $700 million which are at risk; • 750,000 acres of farmland would be at risk of conversion to less-labor-intensive (and less profitable)
crops, or even conversion out of agricultural use; • Employment impacts would extend beyond the farm to farm-related businesses in the upstream and
downstream economy. An estimated 15,823 jobs that depend on the farm sector could be lost.
Fortunately, through years of hard work by industry leaders here in state of New York, support for federal legislative reform has been cultivated among many of your elected representatives, including your two U.S. Senators and the majority of your Republican House members. We can only hope that this support can be leveraged into long-overdue Congressional action before the costs to American agriculture are both high and irreversible.
Thank you for this opportunity to address you today.
Page 8-5 2008 Outlook Handbook
C.J. Regelbrugge, T.R. Maloney Immigration Issues
Immigration Issues and Their Impact on New York Agriculture Thomas R. Maloney, Senior Extension Associate
In recent years immigration issues across the United States have received much attention from the media, policy makers and the public. Failed attempts by Congress to enact comprehensive immigration reform and increased immigration enforcement activities have heightened concerns over illegal immigration. At the center of the debate is concern over what to do about an estimated eight million unauthorized individuals who are living and working in the United States.
New York was drawn into the national immigration debate on September 21, 2007 when Governor
Elliot Spitzer announced motor vehicle rule changes that would allow illegal immigrants to receive New York driver’s licenses. The plan immediately received considerable protest from county clerks across New York State who administer county motor vehicle departments. The decision also drew national media attention and Governor Spitzer was accused of rewarding illegal immigrants with New York driver’s licenses. After several weeks of pressure from opponents the Governor changed his proposal to a three tier system. The opposition continued and finally on November 6, 2007 the proposal was withdrawn all together. The New York driver’s license experience is one example of how contentious the immigration debate has become.
The purpose of this paper is to discuss immigration issues as they relate to New York farms and the
immigrants, mostly Hispanic, who work on those farms.
Status of Immigrants in New York Agriculture
Commercial agriculture in New York State continues to be an important economic force and many aspects of New York’s agricultural industry rely heavily on the work of immigrants. New York ranks third nationally in milk production, behind California and Wisconsin. In 2006 the value of milk produced on New York dairy farms totaled $1.61 billion. It is estimated that one third of New York’s milk production comes from dairy farms that employ Hispanic workers. New York’s dairy employers began to hire Mexican and Guatemalan workers in the mid 1990’s and their numbers have increased steadily since.
The value of production from New York’s apple industry was approximately $197 million in 2006.
Apple farm employers rely heavily on immigrant workers for hand harvest, pruning and other labor intensive production practices. Farmer-owned fruit packing facilities also rely heavily on the immigrant workforce.
New York ranks fifth nationally in fresh vegetable production. Much like fruit, the hand harvest of
vegetables as well as other field operations are done predominantly by immigrant workers. New York ranks third in wine and juice grape production behind California and Washington. New
York’s value of juice and wine grape production was estimated at $37 million in 2006. While most of the grape crop is harvested mechanically many of the field operations, including pruning and tying, are done by immigrant crews throughout the winter season.
Floriculture sales in New York State ranked fifth nationally in 2005 totaling $200 million. This
industry is also heavily dependent on immigrant workers, especially on Long Island.

2008 Outlook Handbook Page 8-6
Immigration Issues C.J. Regelbrugge, T.R. Maloney
Presence of Illegal Immigrants
Measuring the number of agricultural workers in New York has always been difficult for several reasons. The majority of farms are family businesses with considerable family labor, both paid and unpaid. The seasonal agricultural workforce can be difficult to count because of its mobility and only a minimum of agricultural labor statistics are routinely recorded.
The presence of illegal immigrants in New York agriculture is especially difficult to estimate because
unauthorized workers tend to keep a low profile and frequently present fraudulent documents to their employers. However, there have been numerous attempts to compile evidence of the number of unauthorized workers in the United States. The most notable work is conducted by the Pew Hispanic Center in Washington, D.C. In 2006 the Center estimated there were 11.5 million unauthorized immigrants in the country and that 8 million of them were gainfully employed. A 2004 Cornell study of 111 dairy workers in New York reported indirectly that Hispanic dairy workers in the State are likely not authorized to work in the United States. Workers in this study were not asked directly if they had entered the United States legally, nor did they directly state as part of the survey that they were in the country illegally. However, when asked to select from a list of the greatest challenges in coming to the United States, two-thirds of the workers surveyed said crossing the border was one of their top three challenges. In a survey recently conducted by the Fiscal Policy Institute entitled “Working for a Better Life”, it was estimated that about one of every six (or 16%) of all immigrants in New York, (including New York City) were here illegally.
So, while estimates of the level of illegal immigration in New York agriculture are difficult to make
there is ample evidence that unauthorized workers have a considerable presence in New York’s agricultural workforce. It is important to note that those immigrant agricultural workers with fraudulent documents, are treated like other workers on the payroll and have social security and other taxes deducted from their pay checks. H-2A Workers in New York Agriculture The H-2A program is a longstanding national program that makes provisions for seasonal agricultural workers and is often used by fruit and vegetable growers. Employers apply for workers through the New York State Department of Labor. Increasingly, the application process should be started early to ensure the workers will be available on time. Despite its longevity, only a small percentage of seasonal workers in New York agriculture come through the H-2A program. Many farm employers are reluctant to participate in the program because of the substantial paperwork and the high wage rates required by the program. The AgJOBS bill, if enacted, would help to solve these problems. In 2006 the hourly wage rate (referred to as the Adverse Effect Wage Rate) set by the H-2A program in New York was $9.17 and for 2007 it was $9.50. As labor supplies tighten and enforcement concerns increase, more New York growers are looking at the H-2A program to recruit authorized workers despite the high cost and excess paperwork. The increase in H-2A workers in recent years is shown in the table below. Currently the majority of H-2A workers in New York State are coming from Jamaica and Mexico and to a lesser extent from Guatemala and Egypt.
H-2A Workers in New York at Peak Season Year Number of Workers
2002 1,413 2003 1,704 2004 1,825 2005 1,742 2006 2,105 Source: Reports of Domestic Migrant-Seasonal Foreign Hired Agricultural Workers 1999-2006, New York State Department of Labor

Page 8-7 2008 Outlook Handbook
C.J. Regelbrugge, T.R. Maloney Immigration Issues
Labor Supplies
Reports from around the State indicate that labor supplies in 2007 turned out to be sufficient to accomplish most field operations and other agricultural work. There have been occasional reports that a crew has a few less workers than in previous years or it takes a little longer to harvest the crop because of a slightly reduced workforce. Additionally, reports suggest that a softening in the construction industry has also helped to ease pressure on agricultural labor supplies. Across the State there have been no reports of measurable economic losses due to a shortage of labor. Concerns over immigration enforcement activities however, are a much bigger issue.
Immigration Enforcement
Agricultural employers and the news media report an increase in enforcement activities, detentions and deportations around the State. The results have been extreme nervousness on the part of some growers that they will not have sufficient labor during critical harvest periods. The same nervousness exists on larger New York dairy farms. Anxiety has been even higher among the workers, who fear detention, deportation and especially the possibility of a criminal record that would threaten their long term options for living in the United States.
As a result of immigration enforcement activities, New York’s farm managers are beginning to make choices they would not otherwise make. Managers are very concerned that the day could come that a crop must be harvested or the cows have to be milked and there are no workers available. They are beginning to make strategic business decisions based on those concerns, including holding off expansion plans and exploring alternative labor pools.
Agricultural workers are also making choices based on the immigration enforcement pressure they
feel. There are increasing reports that employees are reluctant to come to New York because of its location along the Canadian border, with a high concentration of immigration enforcement officials. Agricultural workers who are presently working in New York State are reporting a much higher visibility of enforcement officials and are altering their activities within the community in an attempt to be less visible. Workers are also spending much longer in the United States before returning home for a visit because the Mexican border has become more dangerous and difficult to cross. Management Response to Enforcement Issues Often the farm manager’s first response to enforcement issues is to keep the workers on the farm as much as possible to reduce potential contact with law enforcement. Agricultural employers are increasingly forced to make emergency staffing plans in their businesses in the event that they are left short handed as a result of an immigration enforcement raid. Employers who think about emergency staffing ahead of time are less likely to have the business completely disrupted in the event of an immigration inspection. Some employers are also thinking for the first time about retaining the counsel of an immigration attorney. Immigration attorneys are increasingly being consulted regarding employer rights and immigrant worker detention issues. Employers are also considering alternative staffing. More growers are using the H-2A program and some employers have considered recruiting foreign workers through the J-1 visa training program. Agricultural recruiting services for New York agriculture may become more important. New York State has two firms that recruit farm workers for a fee and these firms may increasingly be called upon to help provide not only regular staffing but emergency staffing as well.
2008 Outlook Handbook Page 8-8
Immigration Issues C.J. Regelbrugge, T.R. Maloney
Strategic Issues Most New York agricultural employers agree that immigration reform is needed and most do not appear to have a strong preference between agricultural immigration legislation such as the AgJOBS bill or comprehensive immigration reform. The most important thing on the minds of New York farmers who employ immigrant workers is that there be a mechanism to recruit immigrant employees who hold an authentic work visa. In the long term, if immigration issues are not resolved, some employers may be forced to reconsider how to attract and retain local workers to do agricultural work. Employers have been so satisfied with the Hispanic workforce that most are reluctant to even consider the local workforce again at this point. Involvement by farmers in the immigration policy process at the national level is becoming a bigger priority in New York State.
Some farm owners are holding off expansion plans and others report they are considering a change in their crop mix to take advantage of less labor intensive crops. With greater frequency, farm managers are considering trading capital for labor by considering investments in labor saving technology and equipment. Examples include robotic milking equipment in the dairy industry and platform harvesting equipment in the apple industry. The University’s Role
As the discussion over immigration continues, agricultural employers are increasingly concerned that policymakers and the public do not understand the critical staffing issues that agricultural producers face. Agricultural employers and the groups that represent them are concerned that they are not effectively telling the story of agriculture and the critical role that agricultural workers play. One of the roles of the University is to conduct research on agricultural labor and to use research-based knowledge about agricultural labor to tell the story in a factual way. Currently the Department of Applied Economics and Management is working with the New York State Agricultural Statistics Service on three surveys that will help improve the understanding of agricultural labor issues in the State of New York. By February 2008 data will have been collected from the New York dairy, vegetable and fruit industries specifically addressing issues of immigration, labor supply and the number of agricultural workers required in the State.

N. Bills, D. Kay, and G. Poe Agriculture and the Environment
Chapter 9. Agriculture and the Environment
Trends in New York Agriculture and Highlights the Role of Equine in Rural Land Use
Nelson Bills, Professor, AEM David Kay, Extension Associate, Development Sociology
Gregory Poe, Associate Professor, AEM
Our discussion in last year’s Agribusiness Economic Outlook handbook chronicled the development
of state and local farmland protection policy, discussed water quality issues for New York agriculture, and showcased concerns and new directions for the upcoming 2007 Farm Bill. This year, the Congress delayed action on farm legislation and a bill is not yet being discussed in a conference committee. Thus, at that writing, we are not entirely sure that the Congress will complete its work on new farm legislation by December 31. Indeed, some voices in Washington are calling for an extension of existing law through 2009.
The direction of Federal farm programs for conservation and the authorities granted the USDA to
fund them are absolutely critical elements in the emergent policy mosaic. By necessity, we save these issues for another day and instead turn our attention to recent new information on the dynamics of rural land use in New York State. Doing so allows us to highlight the results of the most recent statewide survey of New York State equine operations. As the discussion unfolds, we will emphasize that the equine industry, while not always ingrained in policy discussions over rural land use, wields increasing amounts of influence over the use of land and generates very substantial economic benefits as well. As a prelude for that discussion, we review broad trends in land use and farm commodity production by updating some information provided in this chapter in years past. I. Land Use and Farm Production in New York
New York's land resources are key ingredients for agricultural commodity production. Crop and livestock production has always been a predominant feature of the New York State landscape. After the American Civil War, New York State led the nation in farmland acreage. As late as a century ago, about three-fourths of the State land base was counted as land in farms. But during much of the twentieth century, agricultural lands in New York, indeed throughout the Northeast, have slowly been converted or reverted to alternate uses and, due to consolidation and other socio-economic trends, the number of farms has declined. Some of the acreage released from farm use has been converted to a developed use, but millions of acres sprouted brush, then small trees and, over time, woodland that can again reclaim the title of forest. Corresponding trends in farm numbers and farm acreage in New York are shown in Figure 9-1.

Page 9-2 2008 Outlook Handbook
Agriculture and the Environment N. Bills, D. Kay, and G. Poe
FIGURE 9-1. FARMS AND LAND IN FARMS, NEW YORK, 1969-2006
1969
1974
1978
1982
1987
1992
1997
1997
-adj.20
0220
0320
0420
0520
060
10,000
20,000
30,000
40,000
50,000
60,000
Farms
1969
1974
1978
1982
1987
1992
1997
1997
-adj.20
0220
0320
0420
0520
060
2,000
4,000
6,000
8,000
10,000
12,000
Acres (1,000)
Source: 2002 Census of Agriculture and USDA-NASS.
For 2006 The USDA farm estimate for New York is 35,000 farms, down 600 farms (just under 2%) from the number reported in 2005. The farmland base--acreage used for crops, pasture, and support land-- has stabilized in the early 2000s at about 7.5 million acres across New York State.1
The value of crops and livestock produced on these farms hovered in the $3 billion range during the
1990s and into this decade. Receipts spiked upward in 2004, led by a sharp increase in receipts in New York’s lynchpin dairy sector and downward in 2005 largely for the same reasons. In 2006, New York State crop sectors rebounded with gross receipts topping $1.5 billion but reduced receipts for poultry and livestock, according to USDA estimates dampened those increases and brought total gross receipts in at about $3.7 billion (Figure 9-2). Farm businesses also support industries that process raw farm commodities and supply inputs needed for commercial farm production. Statistics of these data are less frequently reported. In 2004, the value of gross output originating on New York farms and with businesses classified as agricultural services or food manufacturing totaled $23.3 billion.
1 Some of these land-use developments are masked by changes in data management. For the 2002 Census of Agriculture, the USDA adopted new measures to correct for under-counting of farm operations. As indicated in Figure 9-1 these adjustments led to a notable rise, for calendar 2002, of approximately 20% in the estimated number of farm operations and a corresponding, but lesser, increase (8%) in estimated farm acreage.

2008 Outlook Handbook Page 9-3
N. Bills, D. Kay, and G. Poe Agriculture and the Environment
FIGURE 9-2. VALUE OF FARM MARKETINGS, NEW YORK, 1980-2006*
1980
1985
1990
1995
2000
2003
20
0420
0520
060
1,000
2,000
3,000
4,000
Current dollars (Mil.)
Crops Livestock and products
*2006 estimates are preliminary and subject to revision
Source: Derived from data published by the U.S. Dept. of Commerce, Bureau of Economic Analysis, and USDA-NASS
New York State has not conducted a comprehensive inventory of land uses since the late 1960s, making for a good deal of uncertainty over the status of overall land use. Two USDA agencies—the Economic Research Service (ERS) and the Natural Resources Conservation Service (NRCS)—attempt to fill that void with published estimates of land use and land cover. Because of budget considerations, the Federal land-use estimates are either dated, published only for multistate areas, or both. Widely circulated trend data estimated in a consistent manner by ERS since the late 1940s are shown in Figure 9-3. They showed land-use estimates through 2002 and indicate that, as in years past, forest cover predominates for New York State as a whole; more than six of every 10 acres are classified as forest by the USDA. USDA crop and pasture estimates track the census data reported above and show marginal decreases in both categories moving into this decade. This USDA data series uses a conservative estimate of urbanized land, using Census definitions. Urbanized land by Census definition includes incorporated cities and villages with a population of 2,500 or more and adjacent densely populated territory. In 2002, slightly more than 2.5 million acres fell into this urban land category as shown in Figure 9-3. Although dated, USDA estimates from the 1997 NRCS National Resources Inventory (NRI) are more expansive in definition and put urban and built-up acreage in the range of 3.2 million acres nearly 10 years ago.

Page 9-4 2008 Outlook Handbook
Agriculture and the Environment N. Bills, D. Kay, and G. Poe
FIGURE 9-3. MAJOR USES OF LAND, NEW YORK, 1945-2002
43% 45% 48% 48% 48% 59% 59% 58% 63% 64% 64%61% 61%
27% 28% 26%23% 22% 21% 20% 20% 19% 17% 15% 14% 15%
1945 1949 1954 1959 1964 1969 1974 1978 1982 1987 1992 1997 20020
5,000
10,000
15,000
20,000
25,000
30,000
Acres (1,000)
All other usesUrban/transport
Forest & parks Pasture Cropland
Source: USDA-ERS.
II. The 2005 New York State Equine Survey
This year we highlight the results of a statewide equine survey, conducted for the 2005 calendar year by the USDA – NASS New York Field Office. This survey is important because equine are not fully represented in descriptions of New York State food and agriculture. Typically such descriptions focus on commodity production while equine operations often feature the production of services. In sharp contrast, the equine industry is of increasing economic importance over time as rural communities change and adapt to new economic and social circumstances. Equine operations also represent an increasingly important category of land use, but one that is largely excluded from Federal statistics on commodity agriculture.
Background Because the information base for production agriculture provides limited information on farm and
food services, clarifying the current economic position of the equine sector and its impact on the rural landscape poses unique educational challenges. A long-term perspective on this issue is useful. Generations ago, equine were a constant reality in the life of every American; there was little question about the landscape presence of equine and their economic significance. Equine were the principal power source on farms and provided transport services throughout the wider American economy. The settlement patterns we live with today were established in large part by the distances horses could travel in a day.
For many years, the USDA helped chronicle the equine presence by supporting a data series that
allocated the US harvested cropland base to major alternate uses (see Figure 9.4). At the turn of the 20th century, not unexpectedly, cropland required to support equine, both horses and mules, made a major imprint on the rural landscape throughout the US. In 1910, just before World War I broke out in Europe, 88 million acres or 27% of the US harvested cropland base was used for this purpose. A well understood transition to the internal combustion engine, both inside and outside production agriculture, triggered major reductions in draft

2008 Outlook Handbook Page 9-5
N. Bills, D. Kay, and G. Poe Agriculture and the Environment
FIGURE 9-4. ACREAGE OF HARVESTED CROPS BY MAJOR END USE, UNITED STATES, 1910-1975
27%27% 25%
22%18%
16%13%
9% 6%3%
0% 0% 0%0%
1910 1915 1920 1925 1930 1935 1940 1945 1950 1955 1963 1965 1970 19750
100
200
300
400
0
Products for domestic use Mules and horses Export
Source: USDA-ERS
and farm equine use after WWI. This transformation released millions of cropland acres in the US from equine support to alternate uses. By the late 1950s, land requirements for this purpose had diminished to a level that prompted the USDA to discontinue an accounting of cropland requirements generated by equine.
But these technological developments and USDA decisions on data management hardly signaled the
demise of the American equine sector. Indeed, a significant transformation was underway in the years after WWII. Anecdotal reports of growing equine populations, centered not on power sources for transport but on sport and a variety of other service uses, became increasingly common. Reports of this sort squared very directly with casual observations, especially along the densely populated and increasingly affluent Eastern Seaboard of the US. More and more Americans were combining their quest for rural living with horse farming for recreational and/or part-time employment. Commercial breeding and training operations were proliferating as well. All of these activities were, once again, increasing the footprint of equine on the rural landscape.
Quantitative assessments of the equine presence, however, were problematic if not largely absent
from the rural land policy scene. Also absent were core data needed to inform discussions on how equine play into structural change in agriculture and food production. In the aftermath of dropping the aforementioned national cropland requirement estimates, USDA data providers largely fell silent and generated little, if any, information on equine during the 1960s, 1970s, and 1980s. The Census Bureau’s 5-year Census of Agriculture, always the linchpin source of information on farming in the US, continued to report equine inventories but only on operations that had sufficient commodity production and sales (equine sales included) to meet the Census definition of a farm.
This reporting practice was increasingly at odds with developments on the ground for operations
centered on equine.These operations were recognized as farms by the general populace and by input suppliers but were not necessarily organized for-profit. Similarly, they were not necessarily organized to sell farm

Page 9-6 2008 Outlook Handbook
Agriculture and the Environment N. Bills, D. Kay, and G. Poe
FIGURE 9-5. EQUINE OPERATING REVENUES, NEW YORK STATE, 2005
$158
$118
$75
$61
$33
Services
Equine Sales
Training
Winnings
Breeding
Operating Revenues
$0 $50 $100 $150
Dollars (Mil.)Source: 2005 NYS Equine Survey
commodities (including horses and other equine) but concentrated on the provision of services-boarding, riding, training, etc.-instead.
The most recent 2002 Census of Agriculture continues past practice and reports on farms by type of enterprise but equine operations are still marginalized in these reports because of narrow definitions of service income that date to the 1950s. The landscape implications of these reporting practices are very pronounced. Although New York State, along with other parts of the Northeast, has realized a long term and widely discussed downward trend in farm numbers and land in farms (see Figure 9-1), but these decreases have been moderated by the emergence of new farm organizations/business models not presently counted in the mainstay Census of Agriculture. The New York State Department of Agriculture and Markets was among the first to begin the process of acquainting policymakers with these developments. The Commissioner, working in conjunction with the New York State Agricultural Statistics Service, first investigated equine operations in the late 1970s and conducted New York’s first modern equine survey in 1988 (New York Agricultural Statistics Service, 1989). New York State conducted a third statewide survey covering calendar year 2000.
At the national level, the American Horse Council has subsequently funded two national assessments
of the US equine sector. The first was published in 1996 while results from the second appeared in 2005. This decade has bought a steady stream of state level equine surveys as well, especially in states along the Eastern Seaboard. Other Northeast states with the recent surveys include Delaware, Maryland, Maine, New Hampshire, New Jersey, Pennsylvania, and West Virginia.

2008 Outlook Handbook Page 9-7
N. Bills, D. Kay, and G. Poe Agriculture and the Environment
2005 Survey Highlights
New York’s most recent statewide survey covers calendar year 2005. The results show 197,000 equine of all types in New York on December 31, 2005, up 17 percent from the 168,000 on hand September 1, 2000. Race horse breeds totaled 50,200 head, up 20 percent from 2000, while other light horses increased to 113,400, a 13 percent increase. All light horse breeds combined totaled 163,600, up 15 percent. Draft horse breeds increased from 11,500 head in 2000 to 12,100 in 2005, an increase of five percent, while donkeys and mules rose 40 percent to a total of 3,500 head. Ponies posted a 3 percent decrease to 11,200 head, continuing the trend begun in 1988. A new category of Miniature Horses was added to the 2005 Equine Survey for the first time for a total of 6,600 head.
These survey results, as expected, provide dramatic contrasts with established farm statistics. The
2002 Census reported fewer than 5,000 farms with revenues coming principally from sales of animal specialties, including equine. These farms accounted for about 325,000 farmland acres. Equine inventory reported on those farms was 42,600 head, with equine sales valued at $14 million. The 2005 New York State Equine Survey, on the other hand, indicated there were an estimated 33,000 equine operations, with nearly 987,000 acres used for support of equine. Survey tabulations indicated total equine-related assets of $10.4 billion on December 31, 2005, an increase of 69 percent since the 2000 survey. The value of land, fences, and buildings accounted for $7.08 billion, or 68 percent of the total assets. This value included $296 million for the 2,900 indoor arenas in New York. Equine on hand, at $1.83 billion, accounted for 18 percent of the assets. Vehicles, equipment, tack, and equine feed and supplies on hand, at $1.45 billion, accounted for the remaining 14 percent.
On the revenue side, operations counted in the 2005 survey generated receipts in excess of $445
million. Of this amount, $118 million was attributed to sales of equine (see Figure 9-5). This compares to
FIGURE 9-6. EQUINE OPERATING EXPENDITURES, NEW YORK STATE, 2005
$182$169
$156$83
$74$70
$57$56
$52$39
$35$34
$32$31$31
$120
FeedLabor
BoardingProperty Taxes
VeterinaryMaintenance and Repairs
TrainingHay
FarrierInterest
Utilities and FuelsRent and Leases
Bedding Shipping and Travel
InsuranceAll other
Operating expense
$0 $50 $100 $150 $200Dollars (Mil.)
Source: 2005 NYS Equine Survey

Page 9-8 2008 Outlook Handbook
Agriculture and the Environment N. Bills, D. Kay, and G. Poe
about $15 million reported in the last Census of Agriculture. In addition, equine operations generate substantial revenues from vending services. These revenues, including training fees, totaled $327 million. Comparing Figure 9-2 with Figure 9-5 helps put the equine industry in perspective. Combining data from the two figures suggests that the equine sector adds an additional 10 to 11% in receipts when included in the New York State farm and food sectors.
On the farm expenditures side, New York equine owners and operators spent a total of $2.06 billion
during 2005 for operating and capital expenses, an increase of nearly three times above the 2000 total of $704 million. About $1.22 billion of the total was for operating expenses--see Figure 9-6. The leading operating expenses and amounts spent were: feed, $182 million (hay purchases, a separate category in the survey, amounted to another $56 million); hired labor, $169 million; and boarding $156 million. Operating expenses averaged $5,594 per equine. Additional expense categories are shown in Figure 9-6.
Again, it is useful to put these expenditures in perspective through comparisons with operating
expenses reported for commodity agriculture. According to estimates reported by the USDA, total operating expenses for commodity agriculture in New York State were $3.41 billion in calendar 2005. After acknowledging double counting, this suggests that the New York State equine sector boosts the direct economic impact of New York State food and agriculture, using the metric of cash production expenditures, by roughly 30%.

W.L. Uva Vegetables
Chapter 10. Vegetables Wen-fei L. Uva, Former Senior Extension Associate
The value of New York vegetable production (including principal vegetables for fresh and processing
markets, potatoes, and dry beans) set a record in 2006 and totaled $453 million (Figure 10-1). It surpassed the previous high of $442 million set in 2001. New York now ranked fifth in the nation for the value of principal fresh market vegetables. The increase in value came despite an erratic weather pattern during the growing season that started with a warm, dry spring, followed by monsoonal rains and ending with a cool, wet fall. Total planted acreage remained similar to 2005.
According to Dr. Steve Reiners, a vegetable specialist at Cornell University, 2007 realized a very dry
production season. Western New York was especially dry, while Eastern New York, the Capital District, for example, picked up more rain but also had some localized hail events that caused problems. With irrigation, the combination of heat and sunlight resulted in excellent quality vegetables and good prices.
FIGURE 10-1. VALUE OF PRODUCTION OF PRINCIPAL VEGETABLES FOR FRESH MARKET AND PROCESSING, POTATOES, AND DRY BEANS, NEW YORK, 1997-2006
172203 210
330 335310
285 282 289
33943
50 45
43 43
2834 33 34
37
63
68 61
52 59
6563
4364
71
14
11 8
75
710
7
6
6
0
50
100
150
200
250
300
350
400
450
500
1997 1998 1999 2000 2001 2002 2003 2004 2005 2006
$ M
illio
n
Principal vegetables for fresh market Principal vegetables for processingPotatoes Dry beans
Source: New York Agricultural Statistics, 2007 Annual Bulletin.

Page 10-2 2008 Outlook Handbook
Vegetables W.L. Uva
Table 10-1 compares production value per acre for selected principal vegetable crops produced in New York from 2004 to 2006. Tables 10-2 through 10-4 show production values, production levels, and average farm prices for major vegetable crops produced in New York from 2004 to 2006 and compare them with U.S. production.
Fresh Market Vegetables The top four fresh market vegetables produced in New York were sweet corn, cabbage, snap beans,
and onions. Tomatoes generated the highest per acre value ($15,380) in three consecutive years (Table 10-1). Four crops had increased production values between 2005 and 2006 (Table 10-2) – snap beans (up 109 percent), cucumbers (up 73 percent), sweet corn (up 25 percent) and tomatoes (up 43 percent).
During the 2006 growing season, the state saw some excessively hot weather in July. The combination of heat and rain negatively affected crops such as onions, but gave New York record-high yields of sweet corn and tomatoes.
Processed Vegetables, Potatoes, and Dry Beans
The production of New York processing vegetables was valued at $37 million in 2006, 11 percent higher than 2005. The 2006 value of processing snap beans, green peas, and cabbage for kraut increased 18 percent, 17 percent, and 3 percent, respectively, from the year before (Table 10-2). Total New York acreage is estimated to be down 5 percent in 2006 from 2005.
The 2006 value of potato production in New York was $70.7 million, 11 percent higher than in 2005.
New York potato growers harvested an estimated 19.0 thousand acres, down 5.5 percent from a year earlier. Production totaled 5.7 million hundredweight (cwt.), up 9 percent from the 5.23 million cwt. produced in 2005. The price was up 2% in 2006 from the year before. In 2006, production of dry beans in New York totaled 239,000 cwt., down 15 percent from 2005. Acres harvested totaled 18,000 acres, down 500 acres from a year before. The 2006 dry bean production in New York was valued at $6.0 million, almost the same as 2002. 2007 was the first season that Allen Canning Company began producing products in New York. Allen Canning Company took over for Birds Eye which is now just repacking products in New York. Things seem to be going well. However, some growers decided to switch from growing processing vegetables to field corn for ethanol production. The high price for grain corn did seem to drive up the price processing vegetable growers received.

2008 Outlook Handbook Page 10-3
W.L. Uva Vegetables
TABLE 10-1. VALUE PER ACRE OF PRODUCTION FOR SELECTED PRINCIPAL VEGETABLE CROPS IN NEW YORK, 2004-2006
2004 2005 2006 Change 2005-2006
Vegetables for Fresh Market ------ dollars/acre------- %
Sweet corn 2,140 2,147 2,820 31%
Cabbage 3,992 6,800 6,101 -10%
Onions 4,161 3,530 3,740 6%
Snap beans 1,843 2,844 4,673 64%
Cucumbers 5,244 3,396 6,593 94%
Tomatoes 9,525 10,728 15,380 43%
Pumpkins 4,030 4,140 3,424 -17%
Squash 9,246 6,775 7,854 16%
Cauliflower 920 3,721 5,025 35%
Vegetables for Processing
Sweet corn 453 531 518 -2%
Snap beans 637 604 757 25%
Green peas 650 574 768 34%
Cabbage for kraut 2,000 1,837 1,327 -28%
Fall Potatoes 2,228 3,172 3,720 17%
Dry Beans 293 262 332 27%
Source: New York Agricultural Statistics, 2007 Annual Bulletin.

Page 10-4 2008 Outlook Handbook
Vegetables W.L. Uva
TABLE 10-2. VALUE OF PRODUCTION, SELECTED VEGETABLE CROPS, NEW YORK AND UNITED STATES, 2004-2006
New York United States
NY as% of U.S.
2004 2005 2006p % Change2005-2006 2004 2005 2006p
% Change 2005-2006 2006
--- ($ million) --- % --- ($ million )--- % %
Vegetables for Fresh Market
Sweet Corn 59.9 60.5 75.6 25% 537.5 596.7 619.1 4% 12%
Cabbage 42.3 66.6 64.1 -4% 322.4 326.0 354.9 9% 18%
Onions 54.1 48.0 43.8 -9% 671.6 848.8 962.0 13% 5%
Snap Beans 14.0 23.0 48.1 109% 261.0 300.6 324.3 8% 15%
Cucumbers 24.1 15.3 26.4 73% 204.1 223.2 250.2 12% 11%
Tomatoes 22.9 21.5 30.8 43% 1,429.7 1,598.8 1,596.3 0% 2%
Pumpkins 25.4 21.9 18.8 -14% 92.7 103.7 101.3 -2% 19%
Squash 37.9 29.1 28.3 -3% 222.7 214.5 229.4 7% 12%
Cauliflower 0.9 3.3 2.8 -16% 188.0 197.4 248.4 26% 1%
Vegetables for Processing
Sweet Corn 8.6 9.3 8.9 -5% 214.0 217.1 206.0 -5% 4%
Snap Beans 13.0 12.8 15.1 18% 131.9 114.6 123.2 7% 12%
Green Peas 11.7 11.4 13.4 17% 99.3 101.7 99.6 -2% 13%
Cabbage for Kraut 4.0 3.9 4.0 3% 4.0 3.9 4.0 3% 100%
Potatoes 42.8 63.8 70.7 11% 2,575 2,991 - - -
Dry Beans 6.9 6.0 6.0 -1% 453 516 518 0% 1%
P Preliminary.
Sources: ERS, USDA, Vegetables and Melons Situation and Outlook Yearbook, 2007. New York Agricultural Statistics, 2007 Annual Bulletin.

2008 Outlook Handbook Page 10-5
W.L. Uva Vegetables
TABLE 10-3. PRODUCTION OF SELECTED VEGETABLE CROPS,
NEW YORK AND UNITED STATES, 2004-2006
New York United States NY as % of U.S.
2004 2005 2006 % Change 2005-2006 2004 2005 2006
% Change 2005-2006 2006
--- (Million cwt ) --- % --- (Million cwt) --- % %
Vegetables for Fresh Market
Sweet Corn 2.80 2.68 3.22 20% 27.9 27.0 26.7 -1% 12%
Cabbage 3.71 4.61 4.62 0% 25.0 24.3 25.7 6% 18%
Onions 5.20 3.81 3.86 1% 83.1 73.5 73.1 -1% 5%
Snap Beans 0.19 0.30 0.59 96% 5.8 5.5 6.4 15% 9%
Cucumbers 0.87 0.54 0.76 41% 10.1 9.7 9.9 2% 8%
Tomatoes 0.36 0.36 0.40 11% 38.1 38.3 36.8 -4% 1%
Pumpkins 0.82 0.80 0.80 0% 10.2 10.8 10.2 -5% 8%
Squash 0.94 0.80 0.76 -5% 7.8 8.3 9.5 14% 8%
Cauliflower 0.03 0.10 0.07 -36% 6.1 6.2 7.1 15% 1%
Vegetables for Processing --- (1,000 tons) --- % --- (1,000 tons) --- % %
Sweet Corn 110.2 116.2 115.2 -1% 2968 3175 3086 -3% 4%
Snap Beans 66.3 69.0 73.7 7% 836 819 786 -4% 9%
Green Peas 34.3 29.7 38.7 30% 398 383 410 7% 9%
Cabbage for Kraut 80.0 75.9 72.3 -5% 80 76 72 -5% 100%
--- (1,000 cwt) --- % --- (Million cwt) --- % %
Fall Potatoes 5,184 5,226 5,700 9% 456 424 435 3% 1%
Dry Beans 247 282 239 -15% 18 27 24 -9% 1%
Sources: NASS, USDA, Agricultural Statistics 2007, Vegetables and Melons. New York Agricultural Statistics, 2007.

Page 10-6 2008 Outlook Handbook
Vegetables W.L. Uva
TABLE 10-4. AVERAGE FARM PRICES OF MAJOR VEGETABLE CROPS,
NEW YORK AND UNITED STATES, 2004-2006 New York United States
2004 2005 2006 % Change 2005-2006 2004 2005 2006
% Change2005-2006
--- ($/cwt) --- % --- ($/cwt) --- %
Vegetables for Fresh Market
Sweet Corn 21.4 22.6 23.5 4% 19.3 22.1 23.2 5%
Cabbage 12.8 15.9 15.4 -3% 12.9 13.4 13.8 3%
OnionS 12.1 15.2 13.5 -11% 8.1 11.5 13.2 14%
Snap Beans 73.7 76.8 82.0 7% 45.2 54.2 51.0 -6%
Cucumbers 27.6 28.3 34.7 23% 20.2 23.0 25.2 10%
Tomatoes 63.5 59.6 76.9 29% 37.6 41.8 43.3 4%
Pumpkins 31.0 27.6 23.6 -14% 9.1 9.6 9.9 3%
Squash 40.2 36.6 37.4 2% 28.7 25.7 24.2 -6%
Cauliflower 36.8 32.2 42.0 30% 30.8 32.0 35.0 9%
Vegetables for Processing --- ($/ton) --- % --- ($/ton) --- %
Sweet Corn 77.7 80.4 77.3 -4% 72.1 68.4 66.8 -2%
Snap Beans 195.0 186.0 204.0 10% 158.0 140.0 157.0 12%
Green Peas 343.0 385.0 345.0 -10% 250.0 266.0 243.0 -9%
Cabbage for Kraut 50.5 50.8 55.1 8% 50.5 50.8 55.1 9%
--- ($/cwt) --- % --- ($/cwt) --- %
Fall Potatoes 8.25 12.20 12.40 2% 5.65 7.05 - -
Dry Beans 27.90 21.40 25.00 17% 25.70 18.50 20.00 8%
Source: ERS, USDA, Vegetables and Melons Situation and Outlook, 2007. New York Agricultural Statistics, 2007 Annual Bulletin .

2008 Outlook Handbook Page 10-7
W.L. Uva Vegetables
Consumption of Fresh-Market Vegetables
In 2006, per capita use of fresh-market vegetables (excluding melons, potatoes, sweet potatoes and mushrooms) declined 2 percent to 172.8 pounds. There were several notable changes in vegetable consumption from a year ago. These changes included a 21 percent gain in fresh-market cauliflower use to 1.8 pounds. Fresh-market snap bean consumption rose 17 percent to a record 2.1 pounds. Despite various low-carb diets, consumers continue to be drawn to the improved quality and value offered by today’s new varieties. TABLE 10- 5. U.S. PER CAPITA UTILIZATION OF SELECTED FRESH MARKET VEGETABLES Item Average 1999-2004 2005 2006 2007b ---- Pounds/ person ---- Lettuce, all 31.5 31.6 29.7 29.5
Iceberg/head 22.2 21.0 18.7 18.4
Leaf /romaine 9.3 10.6 11.0 11.2
Tomatoes 19.6 20.2 19.9 20.4
Onions 20.3 21.0 20.2 20.4
Carrots 8.9 8.8 8.7 8.8
Sweet Corn 9.2 8.8 8.6 9.0
Cabbage 8.3 8.1 8.5 8.2
Bell Peppers 6.9 7.1 7.7 7.8
Cucumbers 6.4 6.3 6.4 6.4
Broccoli 6.1 5.6 5.7 5.8
Snap Beans 1.9 1.8 2.1 2.0
Cauliflower 1.6 1.5 1.8 1.9
Asparagus 1.1 1.1 1.1 1.2
Totala 171.3 173.2 172.8 173.5 a Total excludes melons, potatoes, sweet potatoes, and mushrooms. b 2007 figures are projected estimates. Source: ERS, USDA, Vegetable and Melons Situation and Outlook, 2007.
Industry Outlook
The short-term outlook for vegetables is for continuing growth in demand for fresh, locally grown and organic produce. Dietary concerns will continue to expand the demand for fruits and vegetables, but food safety issues can pose a threat to this growth unless the industry can address this challenge.
Other big concerns for growers today are labor availability and fuel costs. Pending immigration legislation could impact growers if labor supplies are restricted. Rising energy prices increased the cost of production and the cost of delivering produce to market. However, it should impact imports more than local production. A growing consumer demand for local produce and the negative impact of higher energy prices on imports should help eastern growers to be more competitive in the market.

Notes

W.L. Uva Ornamentals
Chapter 11. Ornamentals
Wen-fei L. Uva, Former Senior Extension Associate
In 2006, the commercial sales value of New York floriculture production totaled $206.6 million, a 3
percent increase from the year before, and once again ranked New York 5th in the nation. Nursery crops sold totaled $202.5 million, representing a 12 percent jump from the $181.3 million sold in 2005. The open ground area used to produce floriculture crops in the state was 503 acres, up 4 percent from 2005, and greenhouse space increased 8 percent to 20.8 million square feet in 2006.
TABLE 11-1. GROWER CASH RECEIPTS OF FLORICULTURE AND NURSERY CROPS, NEW YORK, 2001-2006
2001 2002 2003 2004 2005 2006p --- Million dollars --- Floriculturea, b
172.9 186.9 194.9 183.0 200.7 206.6
Nurseryc 142.9 153.7 159.6 172.4 181.3 202.4
Floriculture and nursery crops 315.8 340.6 354.5 355.4 382.0 409.0
a Includes growers with $10,000 or more in floriculture sales. b Includes ornamental plants without woody stems, grouped into bedding/garden plants, cut cultivated greens, cut
flowers, potted flowering plants, indoor foliage plants, and propagative floriculture material. c Includes ornamental plants and trees with woody stems, including broadleaf evergreens, coniferous evergreens,
deciduous shade trees, deciduous flowering trees, deciduous shrubs and other ornamentals, fruit and nut plants for home use, cut and to-be-cut Christmas trees, and propagation material or lining-out stock. Also includes other ornamental crops not classified as floriculture.
p Preliminary.
Source: Floriculture and Nursery Crops Situation and Outlook Yearbook, Economic Research Service, USDA, various years.
When reading the published U.S. floriculture and nursery crop statistics, it should be noted that only 15 states were surveyed by USDA in 2006, compared to 36 in the past. The 2004 and 2005 data in Table 11-2 were adjusted to include only the 15 states surveyed in 2006 for comparison. The 15 states selected in the USDA survey accounted for 75 percent of cash receipts received by greenhouse and nursery crop farmers in 2006. Producers in these 15 states with at least $100,000 of floriculture sales received a total of $3.8 billion from floriculture crops in 2006, a 3.4 percent decrease compared to 2005. All floriculture crop groups experienced lower sales except cut flowers, herbaceous perennials, and cut cultivated greens, which together accounted for 27 percent of total grower sales in 2006.

Page 11-2 2008 Outlook Handbook
Ornamentals W.L. Uva
TABLE 11-2. WHOLESALE VALUES OF FLORICULTURE PRODUCTION, BY GROWER SIZEa, NEW YORK AND UNITED STATES, 2004-2006b
New York U.S. 2004 2005 2006p 2004 2005 2006p
------ Million dollars ------ Small growers 25.3 22.6 21.3 116.6 94.9 160.9 Large growers 157.7 178.1 185.3 3994.9 4052.7 3834.9 All growers 183.0 200.7 206.6 4111.4 4147.6 3995.8 a Small growers have between $10,000 and $100,000 in annual floriculture sales; large growers have at least $100,000. b Wholesale value of sales of growers with at least $10,000 in annual floriculture sales. Growers are located in the 15 surveyed states,
including California, Florida, Hawaii, Illinois, Maryland, Michigan, New Jersey, New York, North Carolina, Ohio, Oregon, Pennsylvania, South Carolina, Texas, and Washington.
p Preliminary.
Source: Floriculture Crop, National Agricultural Statistic Service (NASS), USDA, 2007.
In 2006, bedding and garden plants continued to top the list of floriculture commodity categories in
New York, and sales by operations with $100,000 or more annual sales decreased 0.8 percent to $109.1 million from the year before. Potted flowering plants were second with sales valued at $50.3 million, an increase of 0.7 percent. New York cut flower production saw increases of 8 percent in production value ($2.9 million) in 2006. Wholesale value of foliage plants in New York was $5.5 million in 2006, an increase of 74 percent from 2005.
TABLE 11-3. GROWING AREA FOR FLORICULTURE CROPS IN NEW YORKa, 2001-2006p
Year
Total greenhouse
cover
Shade and temporary
cover
Total covered
area
Covered area per grower
Open ground
Total covered &
open ground
-- 1,000 square feet -- --- acres --- 2001 18,649 604 19,253 75 858 1,300 2002 17,279 510 17,789 70 453 861 2003 18,065 634 18,699 76 455 884 2004 19,767 625 20,392 80 516 984 2005 19,207 499 19,706 78 483 935 2006p 20,758 460 21,218 87 503 990
a Includes operations with $100,000+ in annual floriculture sales. Crops include cut flowers, cut cultivated greens, potted flowering plants, potted foliage plants, bedding and garden plants, and propagative materials. Total may not add due to rounding.
p Preliminary.
Source: Floriculture Crops, NASS, USDA, various years.

2008 Outlook Handbook Page 11-3
W.L. Uva Ornamentals
TABLE 11-4. VALUE OF FLORICULTURE PRODUCTION BY PLANT CATEGORY, NEW YORK, 2001-2006
2001 2002 2003 2004 2005 2006p 5-yr. avg.
2001-2005
2006 vs.
5-yr. avg.
2006vs.
2005 --- Million dollars --- % % Bedding/garden
plantsa 97.4 99.3 107.5 101.1 110.0 109.1 103.0 6% -0.8% Potted flowering
plantsa 4.5 5.6 5.0 4.7 2.7 2.9 4.5 -35% 8.3% Cut flowersa
40.2 47.9 43.1 40.2 49.9 50.3 44.3 14% 0.7% Foliage plantsa
2.5 3.9 4.1 3.5 3.1 5.5 3.4 60% 74.1% Propagative materialsa 6.0 5.4 9.0 8.2 12.3 17.5 8.2 114% 41.8% Grower sales
$10,000-$99,999 (Unspecified crops) 22.4 25.0 26.3 25.3 22.6 21.3 24.3 -12% -5.5%
Totalb 172.9 186.9 194.9 183.0 200.7 206.6 187.7 10% 2.9% a Sales by operations with annual sales of $100,000 or more. b Total reported crops includes categories not listed – cut cultivated greens and propagative materials. p Preliminary. Source: Floriculture and Nursery Crops, Situation and Outlook Yearbook, Economic Research Service, USDA, various years.
Higher freight costs (largely by air), higher energy, and fertilizer costs, plus the depreciation of the U.S. dollar resulted in higher import prices. That helped U.S. growers to be more competitive in the market. However, ornamental industry growth could be hampered by higher energy costs and housing market slowdowns in 2007. While well-managed firms will weather tighter profits, smaller firms could face exit or consolidation. Service-oriented firms, like landscapers and retail centers, however, may be better positioned for growth in 2007.
Over the past few years, homeowners have developed different attitudes about gardening activities. Much of this is related to shifting demographic dynamics, such as the aging baby boomer generation and a younger homeowner who has different ideas about how to spend discretionary income. The Baby Boomers have been the driving force behind the huge growth in gardening activities over past decades. Now, as the leading edge of this generation approaches 60, these former do-it-yourself gardeners have become more service-focused. Dollars that used to be spent at the local garden center have been reallocated to the lawn and garden service segment such as lawn and landscaping companies. Homeowners in the 25-40 age bracket seem more interested in using available discretionary dollars for activities other than gardening, such as travel or other leisure-related activities.
As the industry approaches maturation, annual retail gains in the lawn and garden industry slows. Households are committing fewer discretionary household dollars at the local garden center. Today’s garden center is faced with having to target other market segments to sell goods and services. Business models need to be tweaked or changed in order to remain competitive in a changing industry environment. First, the industry needs to find ways to expand services that appeal to a service-oriented generation. Second, retailers must target new groups of consumers, such as first-time homebuyers, condominium dwellers or the ethnic consumer. Third, retailers must recognize they can no longer expect the same kind of robust growth they

Page 11-4 2008 Outlook Handbook
Ornamentals W.L. Uva
experienced in the past. Today, growth in retail revenues is going to track with overall population gains and general economic growth. Businesses in the industry must find better ways to reach out to today’s savvy consumers if they are going to survive this changing market.
