new technologies: products and additives
TRANSCRIPT
New Technologies: Products and Additives
Dale Leikam … pinch hitting for
Bryan Hopkins
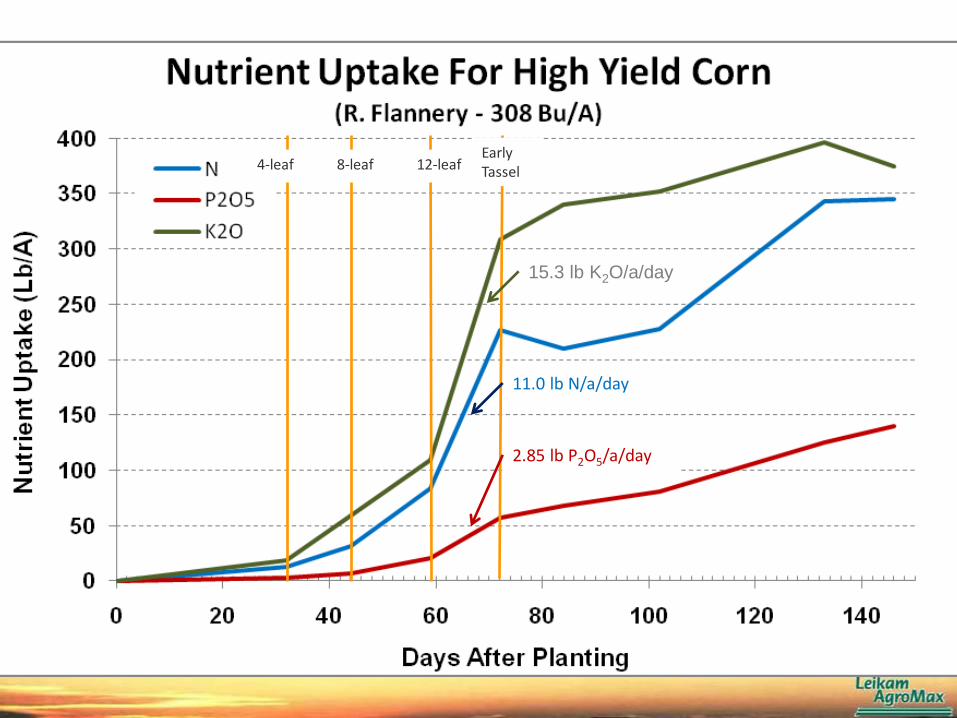
4-leaf 8-leaf 12-leaf Early Tassel
15.3 lb K2O/a/day
11.0 lb N/a/day
2.85 lb P2O5/a/day

Higher Yields & High Population: Impact on Root Mass & Nutrient Uptake?
42K 36K 30K 24K

Ph
osp
ho
rus
Up
take
Law of The Minimum
Ge
ne
tics
Nit
roge
n
Bo
ron
Ph
osp
ho
rus
Mag
nes
ium
Pla
nt
Sta
nd
/Un
ifo
rmit
y
Zin
c
Po
tass
ium
Sulf
ur
Pla
nt
Po
pu
lati
on
100 Bu/A
150 Bu/A
200 Bu/A
250 Bu/A
50 Bu/A
300 Bu/A
Po
tass
ium
Su
pp
ly p
er D
ay
350 Bu/A

Evaluation Of New Technologies
We Should Be Somewhat Skeptical
Has The Company Invested In Product Research?
Research with Universities, Private Contractors and In-
House Personnel
Does It Make Sense?
But Keep In Mind That New Ground Has Is Continually
Being Broken
Is It Benefiting from Past Inputs/Management?
For Example, Nutrient Soil Tests That Have Been
Previously Been Built

Evaluation Of New Technologies
• We Should Also Be Open Minded, Willing To
Sometimes Change Our Ingrained Viewpoints
and Progressive
Everything Is New At Some Time
Internet, N-Serve, GPS, Fungicides
Things Are Not Necessarily The Same As Before
Yield Levels Are Much Higher
Companies Invest Huge Amounts Of Dollars In
Research and Development
Research with Universities, Private Contractors and
In-House Personnel
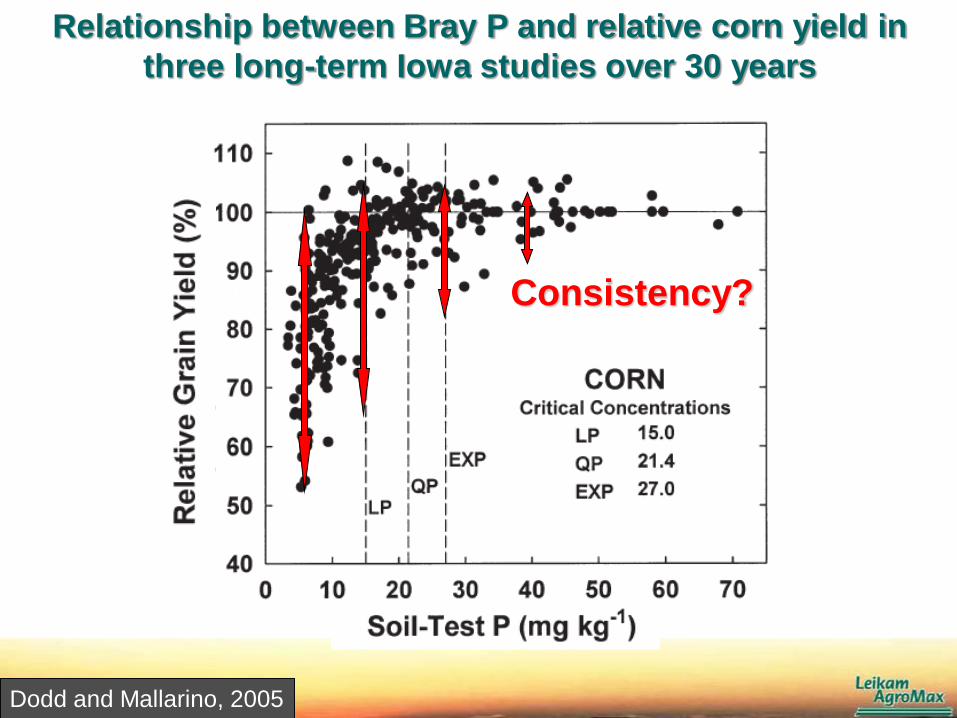
Relationship between Bray P and relative corn yield in
three long-term Iowa studies over 30 years
Dodd and Mallarino, 2005
Consistency?

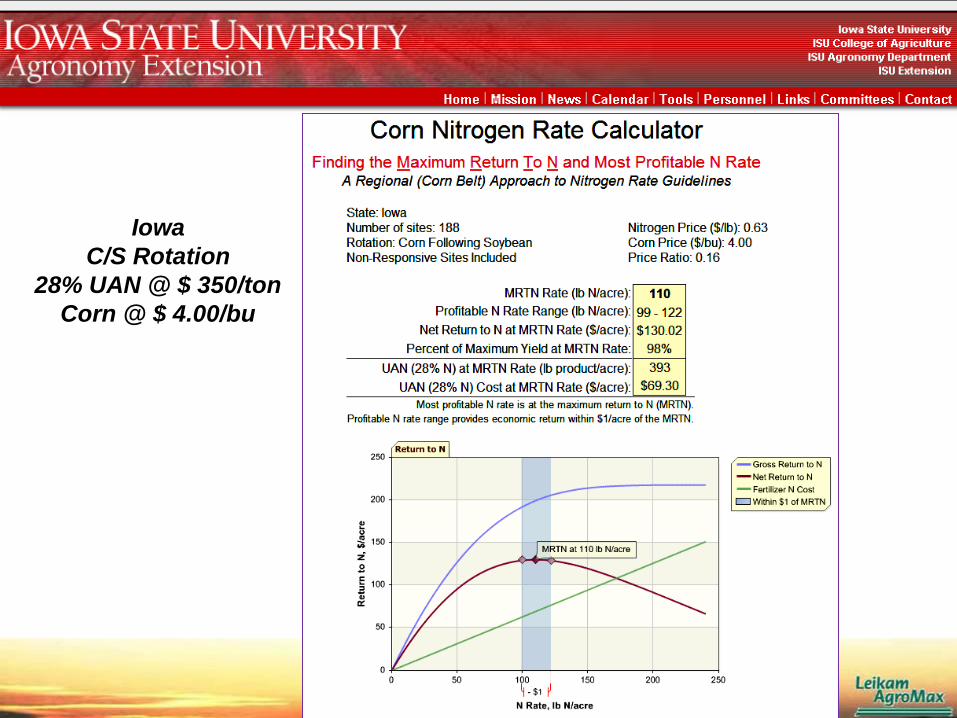
Iowa
C/S Rotation
28% UAN @ $ 350/ton
Corn @ $ 4.00/bu

Consistency
and/or
Predictability?
N-Serve, Instinct & DCD
Nitrification Inhibitors


Instinct Encapsulated Nitrapyrin
UAN solution and liquid
manure
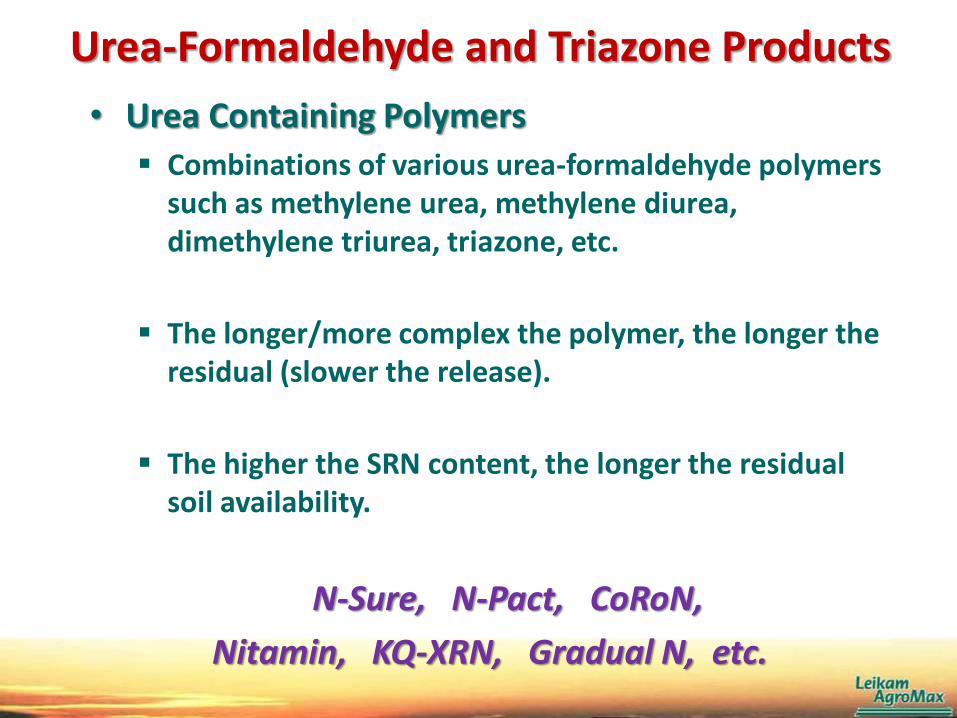
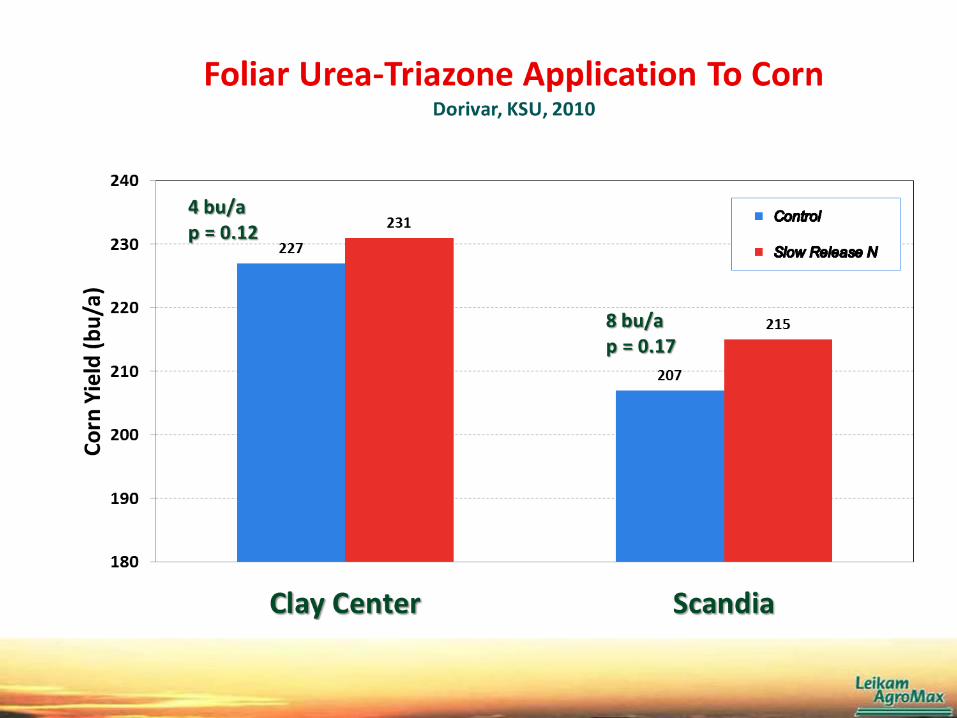
Urea-Formaldehyde and Triazone Products
• Urea Containing Polymers
Combinations of various urea-formaldehyde polymers such as methylene urea, methylene diurea, dimethylene triurea, triazone, etc.
The longer/more complex the polymer, the longer the residual (slower the release).
The higher the SRN content, the longer the residual soil availability.
N-Sure, N-Pact, CoRoN,
Nitamin, KQ-XRN, Gradual N, etc.

Urea Formaldehyde Condensate Products
C
NH 2
NH
O
C
H H
OH
Monomethylene Urea (MMU)
C
NH NH
O
C
H H
OH
C
H H
OH
Methylene Diurea (DMU)
+ C
NH 2
NH 2
O
Urea
C
H H
O
Formaldehyde

Triazone Formation
NH2H2N
O
HH
O
NH3+ +
N
N
N
O
HH
R
R = H, CH2 NHCONH2
Urea Formaldehyde Ammonia
Triazone
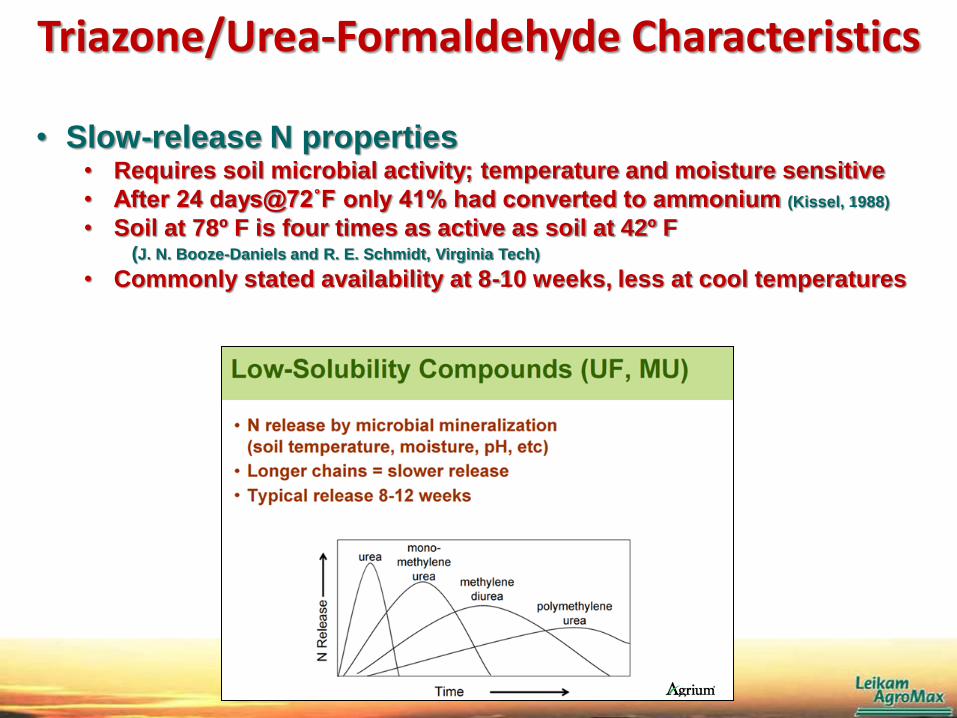
Triazone/Urea-Formaldehyde Characteristics
• Slow-release N properties • Requires soil microbial activity; temperature and moisture sensitive
• After 24 days@72˚F only 41% had converted to ammonium (Kissel, 1988)
• Soil at 78º F is four times as active as soil at 42º F (J. N. Booze-Daniels and R. E. Schmidt, Virginia Tech)
• Commonly stated availability at 8-10 weeks, less at cool temperatures

• Less leaf burn potential than urea or other N sources
Triazone/Urea-Formaldehyde Characteristics
• Remains on leaf tissue in liquid phase longer than urea • Potential foliar absorption is greater than for urea alone
(Clapp and Parham, Fertilizer Research, Vol. 28, 1991)
• Less initial potential for N volatilization than urea • Potentially important for unincorporated soil application
Triazone/Urea-Formaldehyde Characteristics

N-Sure®
K. Nelson, P. Motavalli and B. Burdick
University of Missouri
GRADUAL-N
Triazone,
Methylene Urea,
Urea
Formaldehyde,
etc.
N-Pact

Effect Of CoRoN on Corn Kristi Thompson, University of Wisconsin-River Falls
Control
CoRon
CoRon 25-0-0-0.5B @ V6 to V8 (~25% SRN)
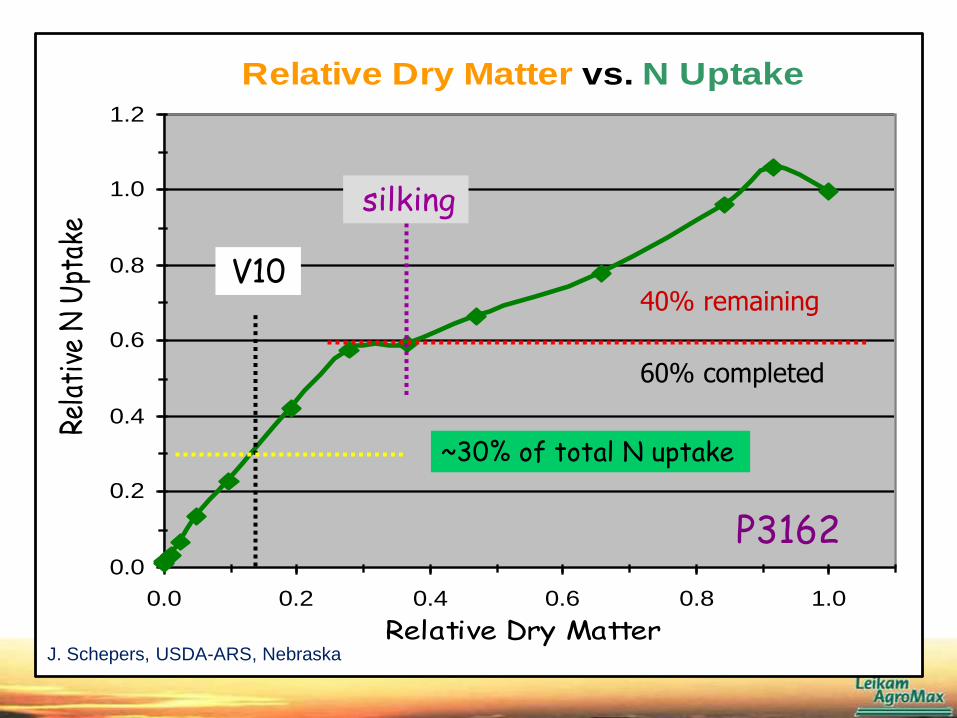
Relative Dry Matter vs. N Uptake
0.0
0.2
0.4
0.6
0.8
1.0
1.2
0.0 0.2 0.4 0.6 0.8 1.0
Relative Dry Matter
Rela
tive
N U
ptak
e ,
V10
~30% of total N uptake
P3162
silking
60% completed
40% remaining
J. Schepers, USDA-ARS, Nebraska

Agrotain (NBPT)
Primary use is on surface applied urea
Combined with DCD (Agrotain Plus/Super U) slows nitrification when urea or UAN are incorporated into soil.
• Disrupts urease activity from 7 to 14 days and decreases potential volatilization loss.
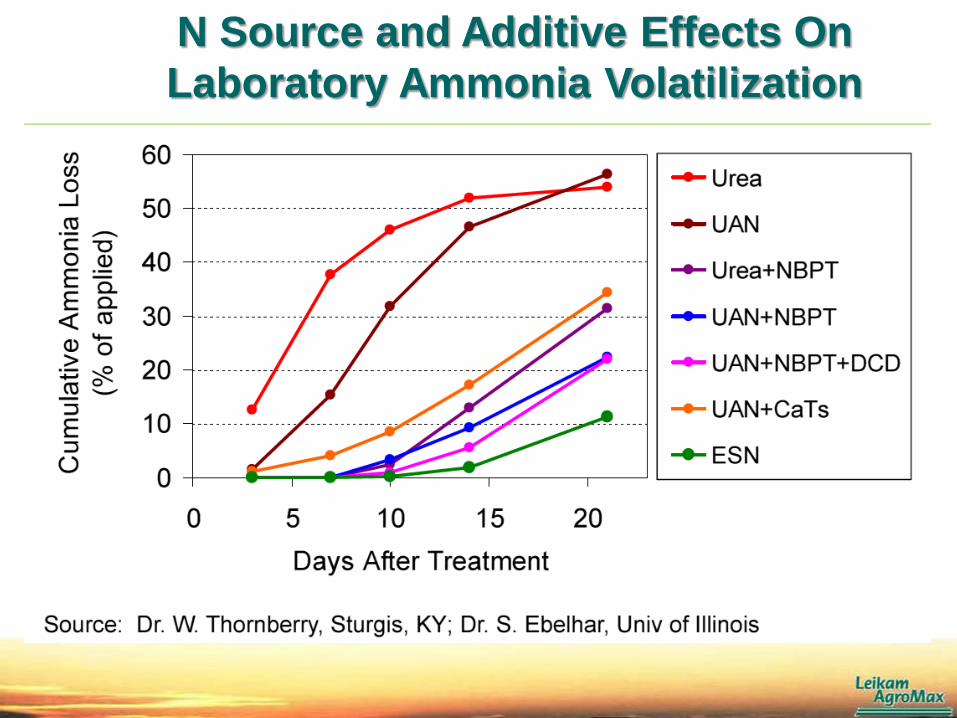
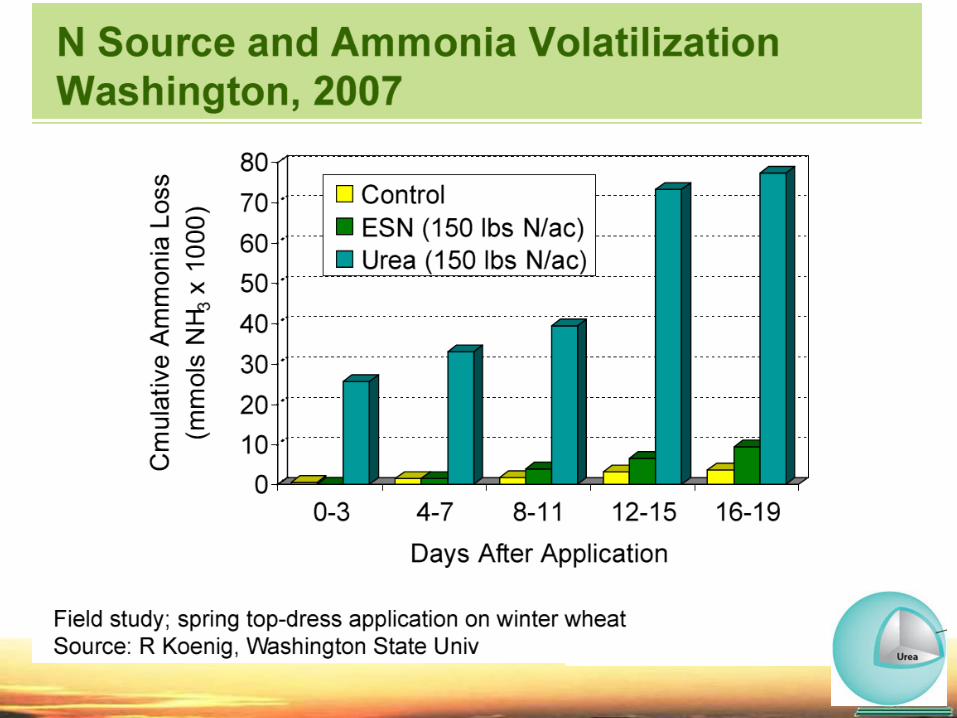
N Source and Additive Effects On
Laboratory Ammonia Volatilization

Treatment N Rate (lb/acre)
100 200
yield (bu/acre)
AGROTAIN Urea 110.8 116.0
Urea 102.1 107.3
Ammonium Nitrate
98.8 99.0
--------------------------------------------------------------------------------
Utilization of AGROTAIN Treated Urea In A Corn
Cropping System In Alabama
AUBURN UNIVERSITY (ALABAMA) - C. W. Wood, C. G. Cummings, R. Duffield

Nitrogen and Agrotain Effects On No-Till Corn

TREATMENTS YIELD BU/A
Check P&K only 77.5
Urea (46-0-0) 150.5
Urea with AGROTAIN 176.5
30% UAN Solution Broadcast 166.9
30% UAN Solution Injected 173.9
UAN with AGROTAIN 182.3
UAN with AGROTAIN & DCD 173.7
UAN with 8-0-0-9 (ammonium sulfate) 185.4
SuperU 176.8
1994 Nitrogen Source Study on No-till corn, Poplar Hill Research and
Education Facility, University of Maryland
No-till corn into a small grain (wheat) double cropped soybean stubble.
All liquid materials were broadcast between rows when corn was 12" tall.
F. R. Mulford, Mryland

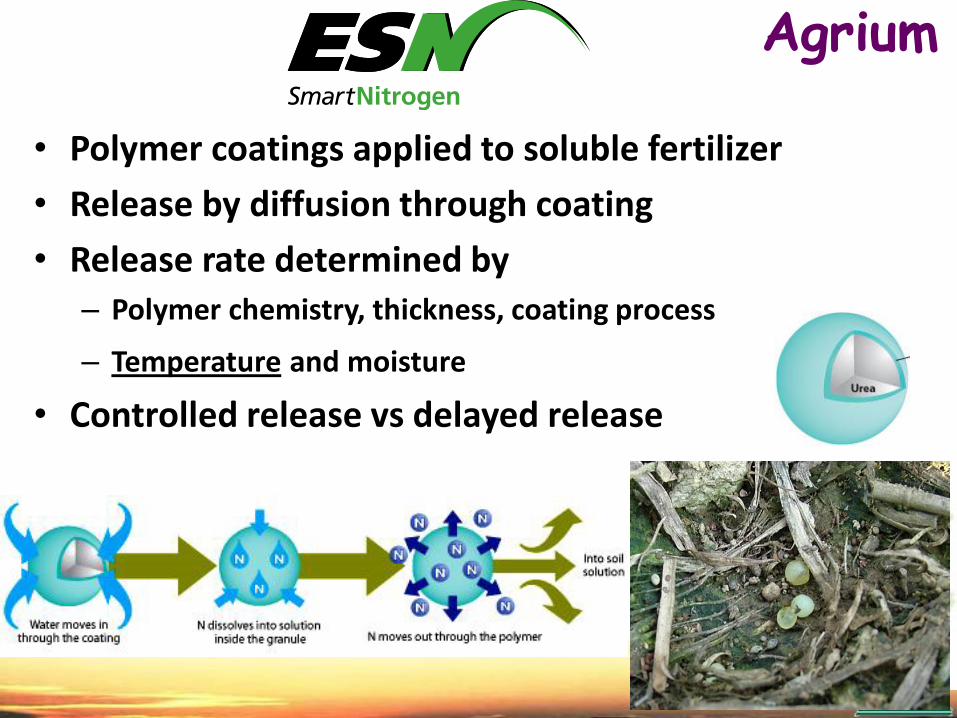
Agrium
• Polymer coatings applied to soluble fertilizer
• Release by diffusion through coating
• Release rate determined by – Polymer chemistry, thickness, coating process
– Temperature and moisture
• Controlled release vs delayed release
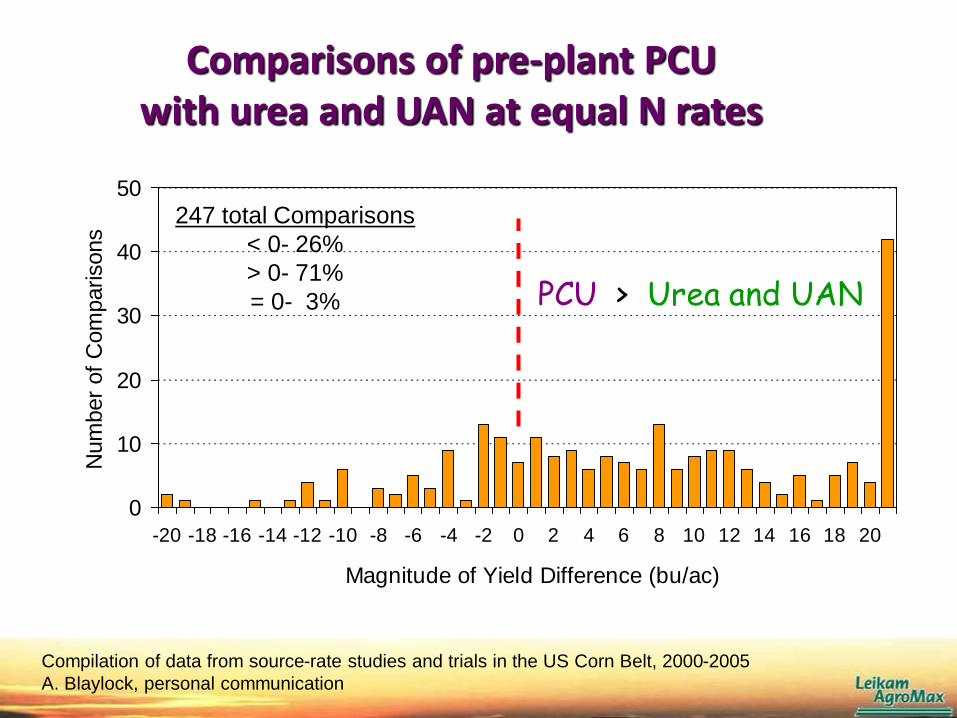
Comparisons of pre-plant PCU with urea and UAN at equal N rates
0
10
20
30
40
50
-20 -18 -16 -14 -12 -10 -8 -6 -4 -2 0 2 4 6 8 10 12 14 16 18 20
Magnitude of Yield Difference (bu/ac)
Num
ber
of
Com
parisons
Compilation of data from source-rate studies and trials in the US Corn Belt, 2000-2005
A. Blaylock, personal communication
247 total Comparisons
< 0- 26%
> 0- 71%
= 0- 3%
PCU > Urea and UAN
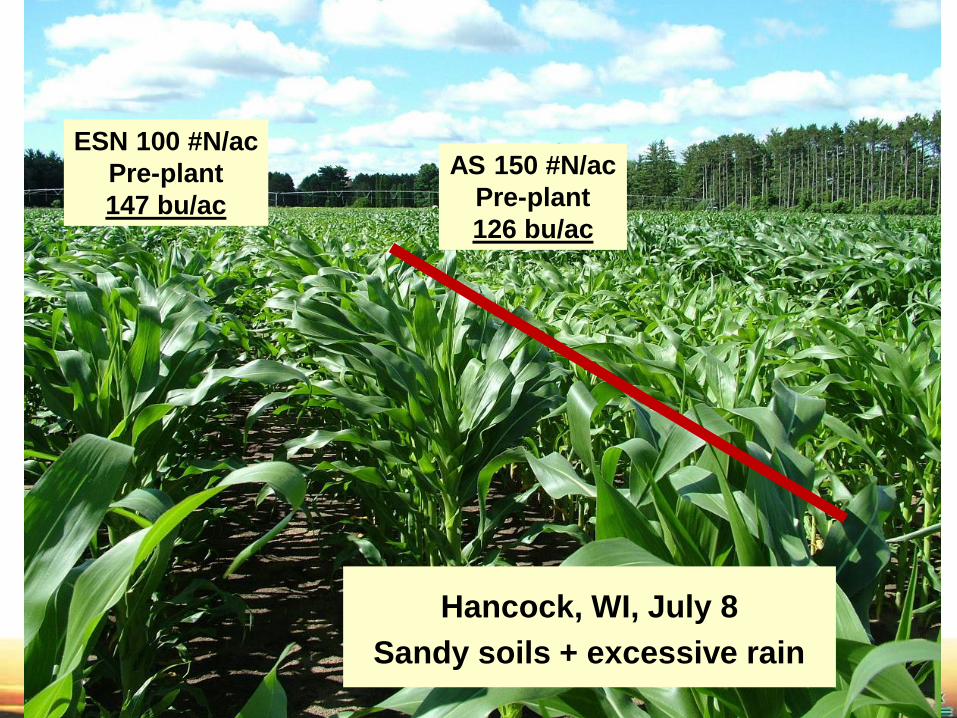
ESN 100 #N/ac
Pre-plant
147 bu/ac
AS 150 #N/ac
Pre-plant
126 bu/ac
Hancock, WI, July 8
Sandy soils + excessive rain
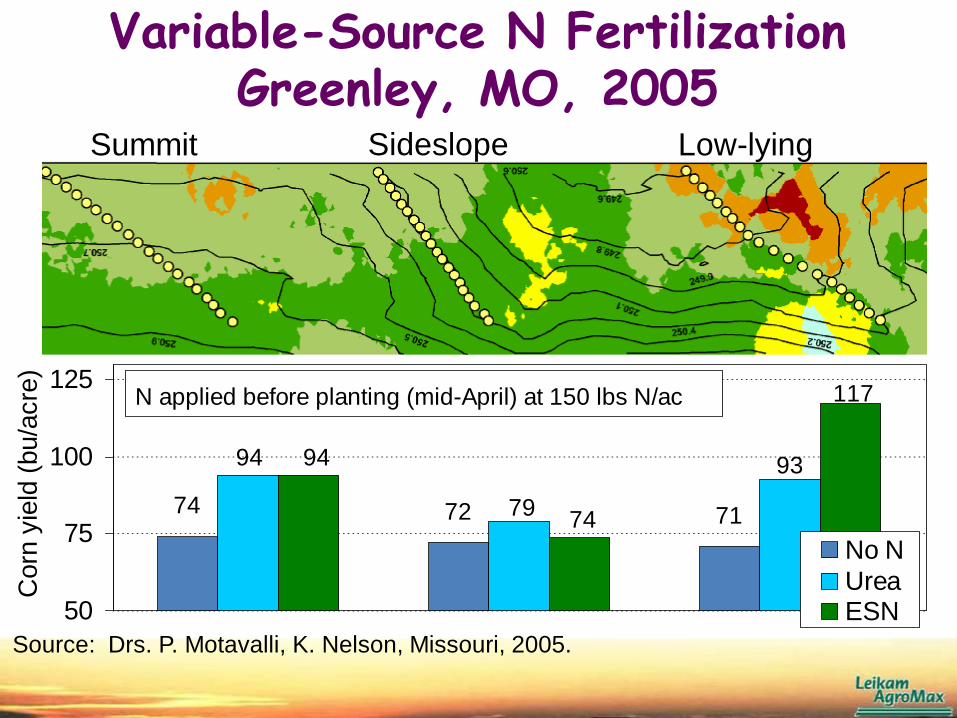
Variable-Source N Fertilization Greenley, MO, 2005
717274
93
79
94
117
74
94
50
75
100
125
Corn
yie
ld (
bu/a
cre
)
No N
UreaESN
N applied before planting (mid-April) at 150 lbs N/ac
Summit Sideslope Low-lying
Source: Drs. P. Motavalli, K. Nelson, Missouri, 2005.

NutriSphere-N • Thought to complex
multivalent cations removing them from biochemical processes.
– Combines with Ni to reduce urease activity.
– Combines with Fe and Cu to reduce micro-organism metabolic activity delaying nitrification.


N Treatment vs. Total Marketable
Recommended N Rate Yield Yield- - % of recommended - -
100% At Emergence 341 281
100% with NSN At Emergence 394 318
85% with NSN At Emergence 405 313
100% Split 376 276
- - - cwt/a - - -
Nutrisphere-N Potato Research StudyBryan Hopkins, Univ. of Idaho, 2006
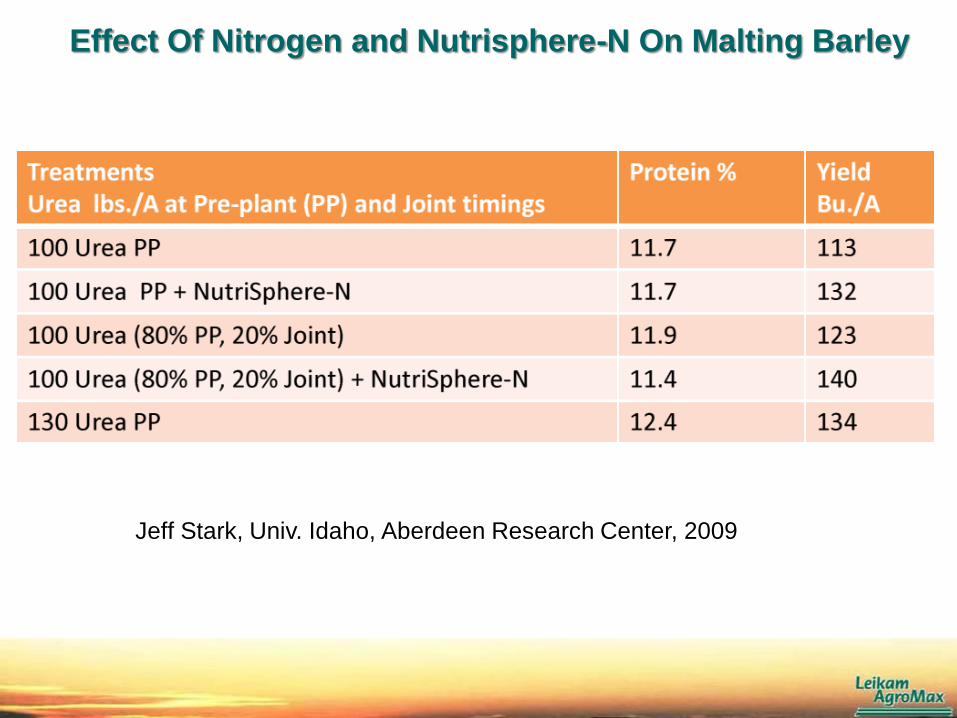
Effect Of Nitrogen and Nutrisphere-N On Malting Barley
Jeff Stark, Univ. Idaho, Aberdeen Research Center, 2009

NC STATE UNIVERSITY NC STATE UNIVERSITY
5000
5500
6000
6500
7000
7500
8000
8500
9000
9500
10000
0 90 130 180
Bio
ma
ss,
(lb
s a
cre
-1 )
N Applied (lb N acre-1)
UAN at Plant
UAN+Nutrisphere at Plant
UAN at Sidedress
UAN+Nutrisphere at Sidedress

“…. The addition of Nutrisphere-N to the N sources
increased yields by 8.5 bu/a on average across N rates
and sources. The addition of Nutrisphere-N to AS and
ASN gave both an agronomic and economic response.”
S.A. Ebelhar & C.D. Hart
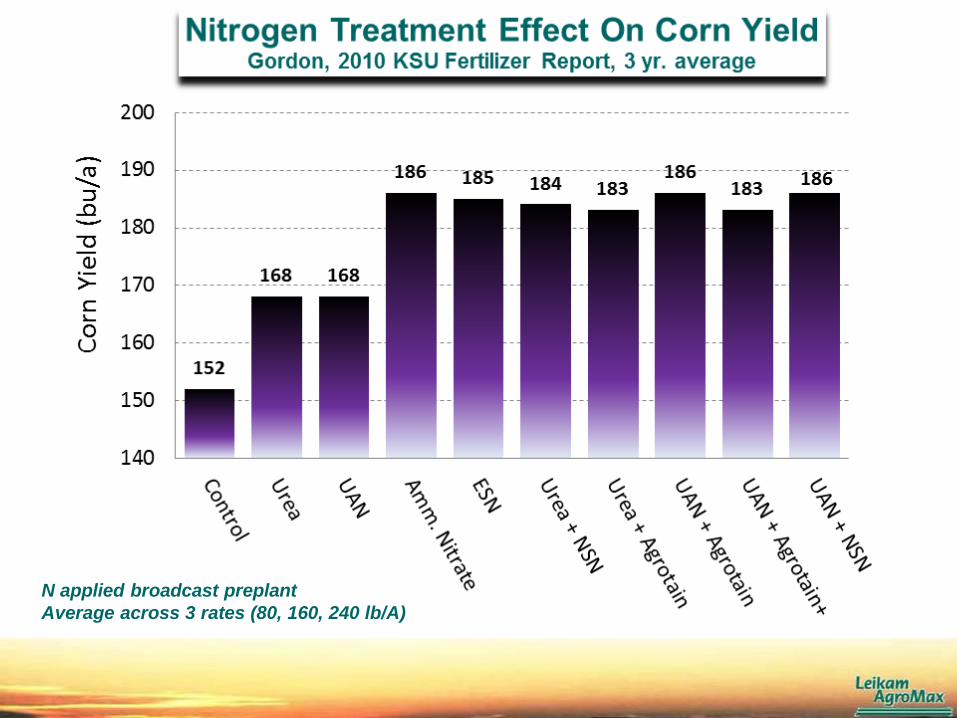
N applied broadcast preplant
Average across 3 rates (80, 160, 240 lb/A)

MicroEssentials granules, containing N, P, S and
Zn (SZ), eliminate component segregation to
ensure uniform distribution of nutrients.

Treatment
Yield
--- bu/acre ---
ME SZ Advantage
--- bu/acre ---
MicroEssentials SZ 53.7
MAP 48.7 + 5.0
DAP 48.2 + 5.5
Four-Year Fertility Study
21 locations
Locations: IA, IL, IN, MN, SD, NE, ND, WI, ON, MB
Soybean Yield Results
Note: Nutrient rates equalized across plots for each year.
P2O5 rate: 40 lbs/acre
All differences are significant at the O.1 level
Treatment
Yield
--- bu/acre ---
ME SZ Advantage
--- bu/acre ---
MicroEssentials SZ 155.9
DAP + ZnSO4 (Zn @ 1.8 #/a) 149.2 + 6.7
DAP + ZnSO4 (Zn @ 5 #/a) 153.2 + 2.7
DAP (Check) 150.6 + 5.3
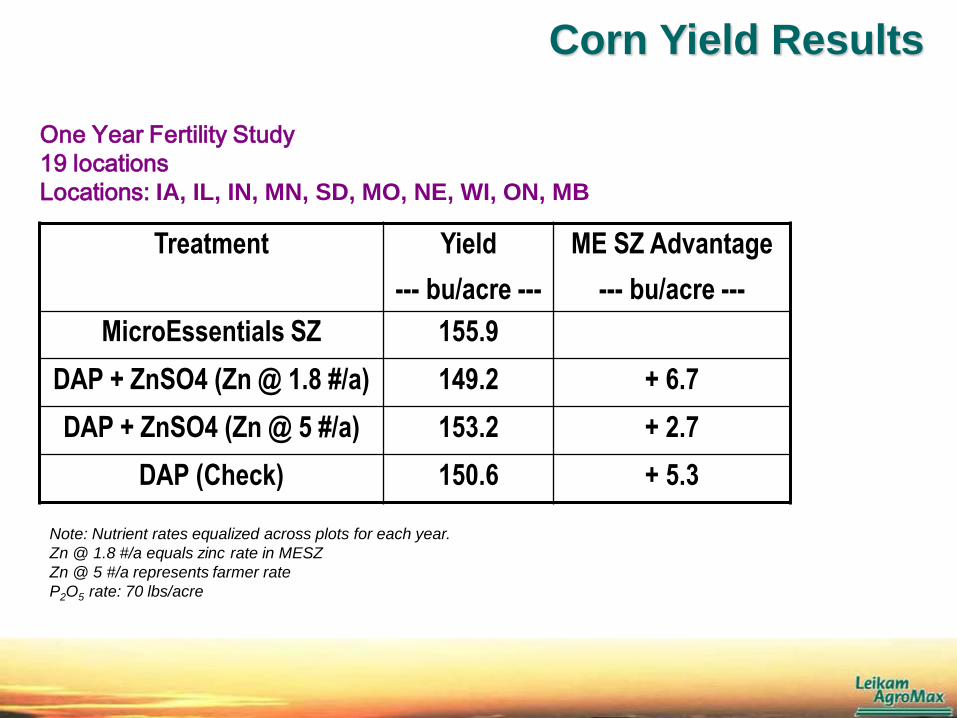
One Year Fertility Study
19 locations
Locations: IA, IL, IN, MN, SD, MO, NE, WI, ON, MB
Corn Yield Results
Note: Nutrient rates equalized across plots for each year.
Zn @ 1.8 #/a equals zinc rate in MESZ
Zn @ 5 #/a represents farmer rate
P2O5 rate: 70 lbs/acre

MicroEssentials SZ for complete soil coverage
Zinc as granules in bulk
blend through broadcast
application (5 lbs/A Zn).
0.66 granules/sq ft
Typical Zinc Blend MicroEssentials SZ
Zinc incorporated in
phosphate fertilizer (65 lbs/A
P2O5 and 1.6 lbs/A Zn).
8.0 granules/sq ft

Check
MES
Z
DAP+
ZnSO4
So
il Z
n (
pp
m)
1.65
1.70
1.75
1.80
1.85
1.90
1.95
2.00
Check
MES
Z
DAP+
ZnSO4
So
il Z
n C
V (
%)
10
20
30
40
50
60
B B
A
Soil Zn: MESZ improves Zn distribution
There was no difference between MESZ and the blend on soil
available Zn.
MESZ resulted in a significantly more uniform Zn distribution
compared to the blend, even at 1/5 of the Zn rate.
Letters indicate significant differences (p<0.1)

Letters indicate significant differences (p<0.1)
Check
MES
Z
DAP+
ZnSO4
P U
pta
ke
(m
g/p
lan
t)
7
8
9
10
11
12
13
C
A
B
P fertilizer application increased P uptake.
MESZ increased P uptake by 17% compared to the blend.
Plant P Uptake
Check
MES
Z
DAP+
ZnSO4
Pla
nt
P U
pta
ke
CV
(%
)
0
10
20
30
40
50

MESZ in storage
DAP in
storage

AVAIL
• An extremely high cation
exchange capacity – about
1800 meq/100 gms.
• Structure is very specific to
attracting and adsorbing
multivalent cations.
• Polymer affects only very
small portion of soil
volume

Cation Adsorption Strength Cations with greater adsorption strengths are held on exchange sites more
tightly, are more difficult to replace and are released into the soil water solution less easily than others.
Adsorption Ionic Radius
Cation Strength (picometer)
1. Hydrogen Strongest 25
2. Aluminum 53
Iron* 77
Nickel* 83
Copper* 87
3. Calcium 114
4. Magnesium √ 86 √
5. Potassium 152
6. Ammonium ---
7. Sodium √ Weakest 116 √
√ Hydrated ion radius affects adsorption strength
0
10
20
30
40
50
60
70
80
90
100
0 1 2 3 4
Days after germination
Root
len
gth
(m
m)
0 umol Al
200 umol Al
400 umol Al
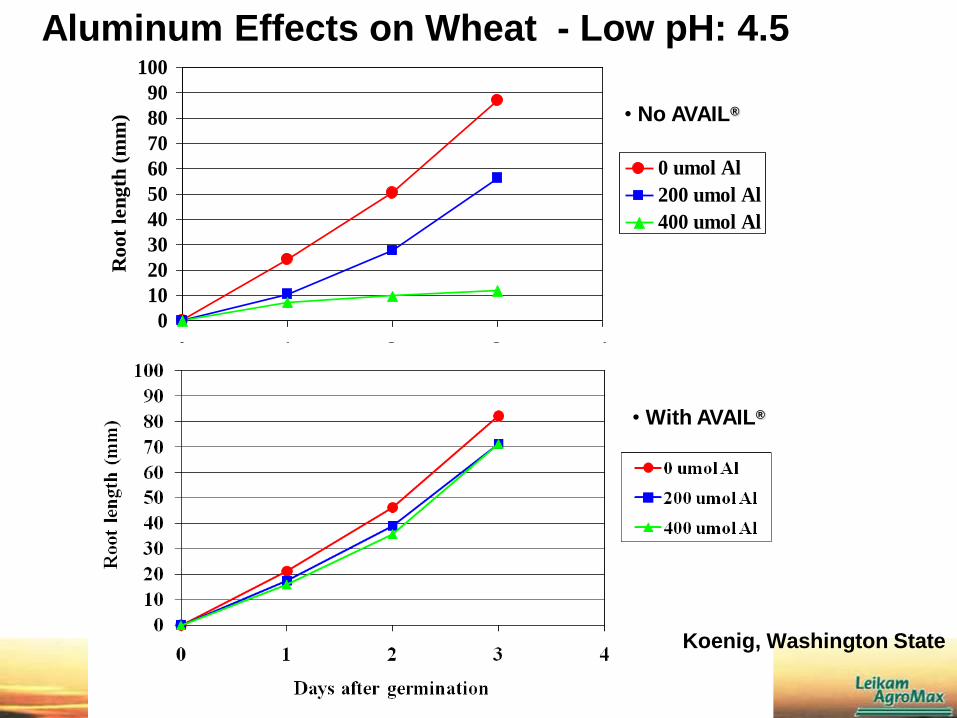
• No AVAIL®
Aluminum Effects on Wheat - Low pH: 4.5
• With AVAIL®
Koenig, Washington State

Avail Effects On Potato Yields B. Hopkins, Univ. of Idaho, 2004
‘Other trials conducted in Idaho in 2005-2006 showed similar results, with
significant potential to improve potato yields grown on calcareous soils (Jeff
Stark, University of Idaho, personal communication)’
Bryan Hopkins, March, 2008 Crop Management
With Avail
Without Avail
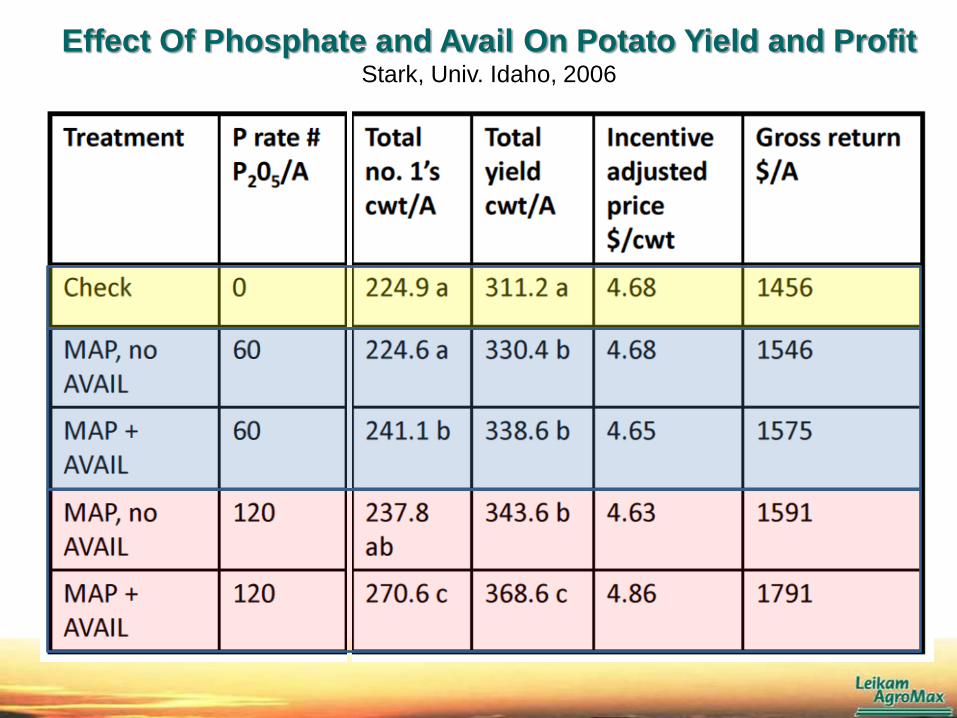
Effect Of Phosphate and Avail On Potato Yield and Profit Stark, Univ. Idaho, 2006
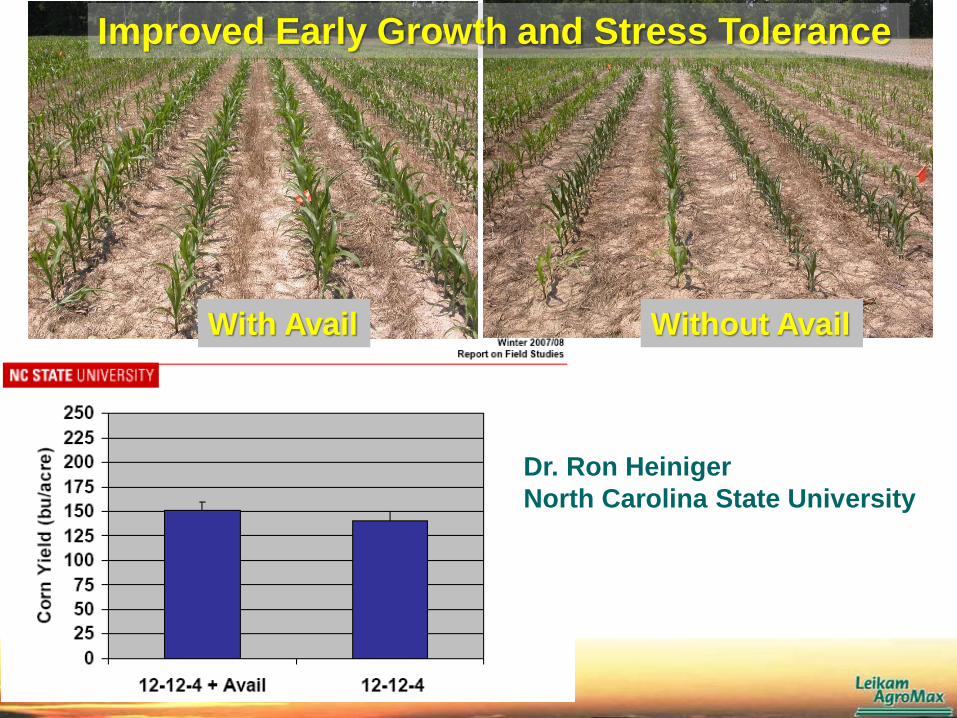
Dr. Ron Heiniger
North Carolina State University
With Avail Without Avail
Improved Early Growth and Stress Tolerance

Hard water +
AVAIL + 10-34-0
[AVAIL] = 0.5% v/v
Hard water Hard water +
10-34-0
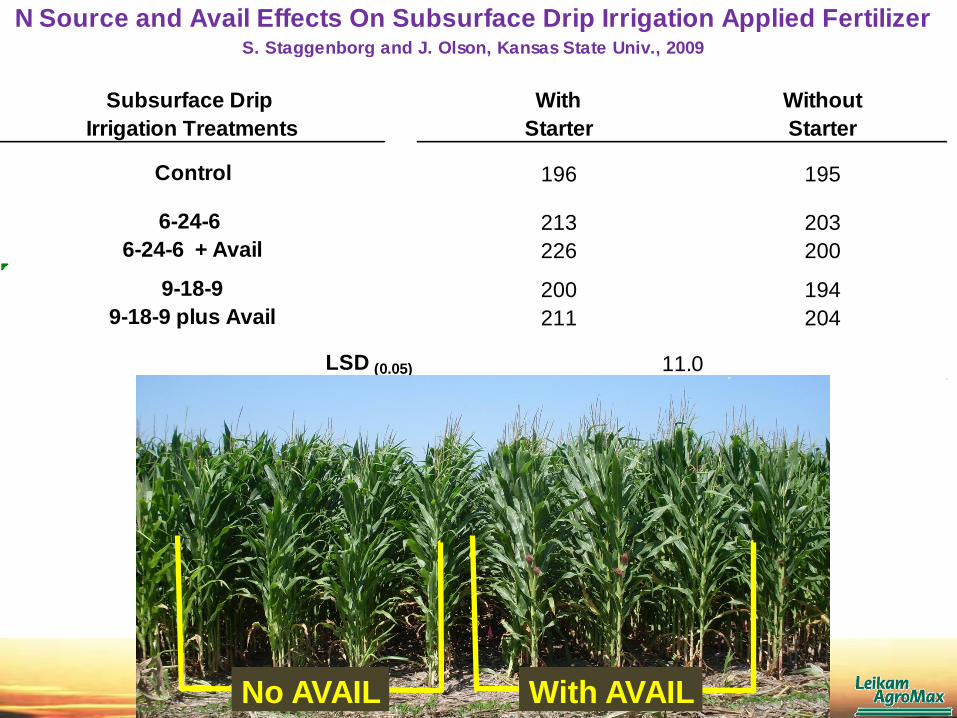
Subsurface Drip With Without
Irrigation Treatments Starter Starter
Control 196 195
6-24-6 213 203
6-24-6 + Avail 226 200
9-18-9 200 194
9-18-9 plus Avail 211 204
LSD (0.05) 11.0
N Source and Avail Effects On Subsurface Drip Irrigation Applied FertilizerS. Staggenborg and J. Olson, Kansas State Univ., 2009
No AVAIL With AVAIL

Plant Nutrition & Humic Substances
Bryan G. Hopkins & Jeff Stark
University of Idaho College of Agriculture and Life Sciences

UI Research on Humic Acid • 0, 15, & 30 gallons/a of 10-34-0
• 3 inches to the side of seed
• With and without Humic Acid
– 1:10 ratio of humic acid to 10-34-0
• check
• 15 gal 10-34-0 + 1.5 gal HA
• 30 gal 10-34-0 + 3.0 gal HA
• 3 years
• Calcareous soil
• Medium soil test P
• Russet Burbank
0
50
100
150
200
250
300
350
400
450
lbs.-P2O5/a
Tuber Yield,
cwt./a
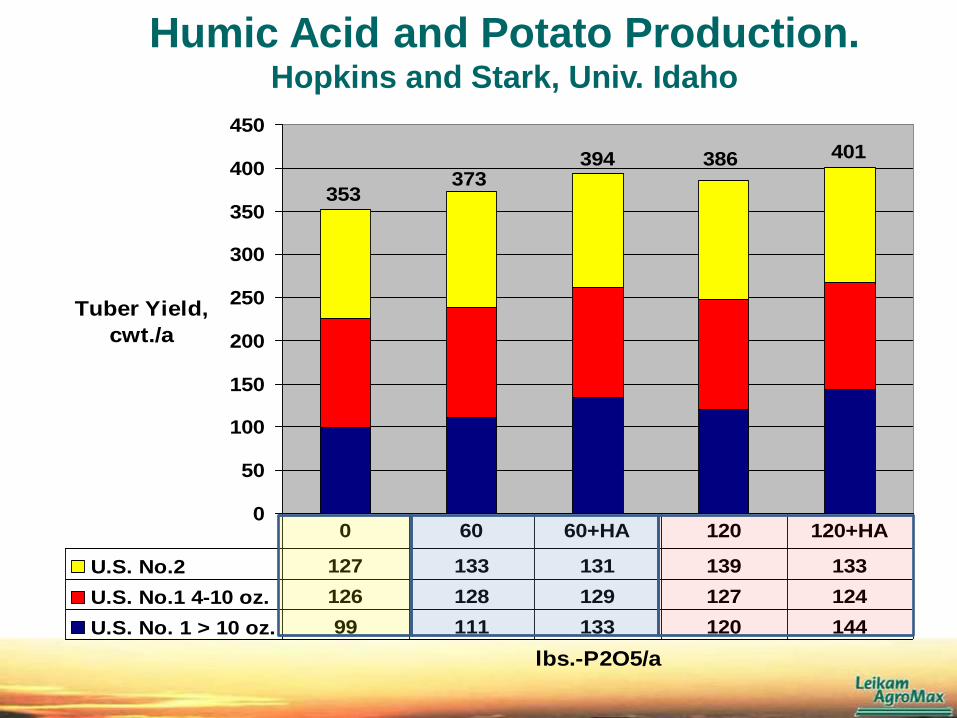
U.S. No.2 127 133 131 139 133
U.S. No.1 4-10 oz. 126 128 129 127 124
U.S. No. 1 > 10 oz. 99 111 133 120 144
0 60 60+HA 120 120+HA
353
401386394373
Humic Acid and Potato Production. Hopkins and Stark, Univ. Idaho
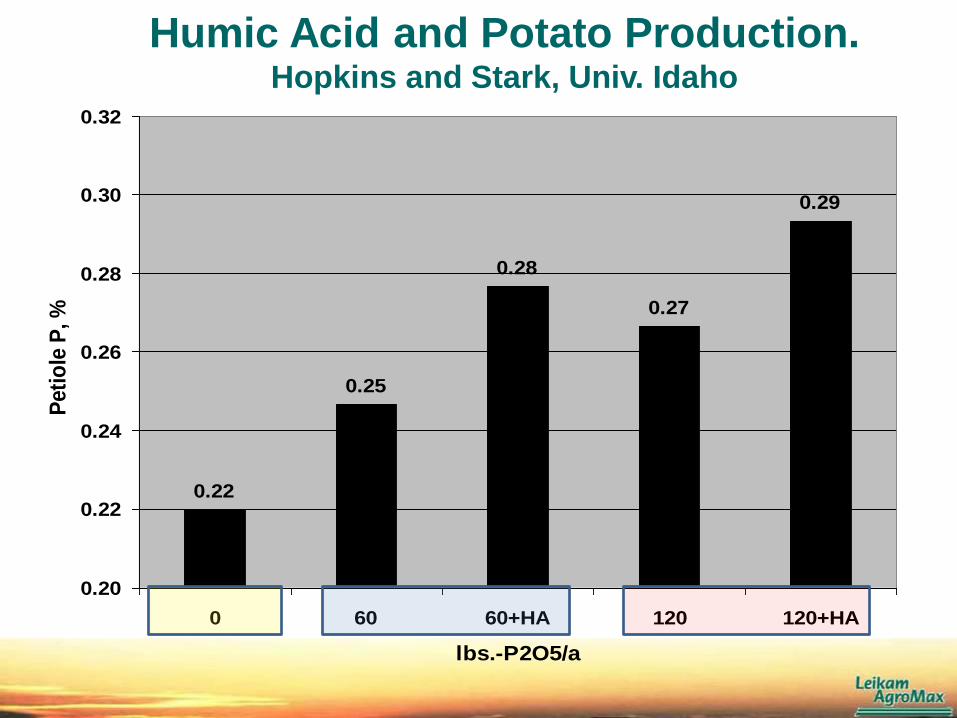
0.22
0.25
0.28
0.27
0.29
0.20
0.22
0.24
0.26
0.28
0.30
0.32
0 60 60+HA 120 120+HA
lbs.-P2O5/a
Peti
ole
P, %
Humic Acid and Potato Production. Hopkins and Stark, Univ. Idaho

“ University research has documented positive responses to
P fertilizer additives that may enhance P solubility and plant
uptake, such as liquid polymer stabilizers and humic
materials. Consider evaluating these materials on a portion
of the field receiving fertilizer P.”

Winfield Solutions & Croplan Genetics
190
200
210
220
230
240
Check
Max in
-ZM
B
Adv ZN
Adv ZN +
ZMB
bu
/a
Hybrid 1
Hybrid 2
2008 Corn Seed Treatment Burwell Ne. 1.7 ppm DTPA ZN Sandy Loam soil

: Ekiz et al., 1998, J. Plant Nutr.
11 mg Zn kg-1
52 mg Zn kg-1
30 mg Zn kg-1
Effect od Seed Zn on Growth of Wheat in Central Anatolia

Traditional Program Enhanced Program
208 bu/a 274 bu/a
Additional P, S, Zn (MEZ) 7 18
Additional Sidedress N 16 24
Higher Plant Population -15 14
Fungicide Application -4 12
Genetics - Triple Stack 8 27
University of Illinois and Mosaic
Yield Increase Attributed To Individual New Practice:
- - - - - - bu/a - - - - -
Traditional Program - University of Illinois Recommendations Without Any Enhanced Input
Enhanced Program - University of Illinois Recommendations Plus All Enhanced Inputs
Interaction Of New Technologies/Practices With Corn Yield
