new realities - international economic development … · entirely new funding sources, ... the...
TRANSCRIPT

NEW REALITIESfor Funding Economic
Development Organizations

International Economic Development Council
IEDC is the world’s largest membership organization serving the economic development
profession, with over 4,300 members and a network of over 25,000 economic development
professionals and allies. From public to private, rural to urban, and local to international, our
members represent the entire range of economic development experience. Through a range of
services including conferences, training courses, webinars, publications, research and technical
assistance efforts, we strive to provide cutting-edge knowledge to the economic development
community and its stakeholders. For more information, visit www.iedconline.org.
Paul Krutko, FM
President and CEO
Ann Arbor SPARK
Chairman of the Board
Jay C. Moon, CEcD, FM
President and CEO
Mississippi Manufacturers Association
Immediate Past Chairman of the Board
Jeffrey A. Finkle, CEcD
President and CEO
International Economic Development Council
© Copyright 2013 International Economic Development Council

Economic Development Research Partners (EDRP)
The EDRP Program is the “think tank” component of IEDC, designed to help economic
development professionals weather the challenges and grab opportunities from economic
changes affecting our communities. EDRP members are leaders in the field of economic
development, working through this program to improve the knowledge and practice of the
profession.
IEDC would like to thank the Economic Development Research Partners program for providing
the impetus and resources for this project.
Ronnie Bryant President and CEO Charlotte Regional Partnership EDRP Co-Chair
Bill Sproull President and CEO Richardson Economic Development Partnership EDRP Co-Chair
Bill Allen Los Angeles County Economic Development Corporation
Darrell Auterson President and CEO York County Economic Alliance
Dee Baird President and CEO Cedar Rapids Metro Economic Alliance
Dyan Brasington Vice President, Economic & Community Outreach Towson University
John Chaffee President and CEO Economic Development Council of North Carolina’s Eastern Region
Tim Chase President and CEO Wichita Falls Chamber of Commerce and Industry
Kurt Chilcott President and CEO CDC Small Business Finance Corporation
Amy Clickner Chief Executive Officer Lake Superior Community Partnership
Denny Coleman President and CEO St. Louis County Economic Council
JoAnn Crary President Saginaw Future, Inc.
J. Vann Cunningham Asst. Vice President, Economic Development BNSF Railway Company
Don Cunningham Lehigh Valley Economic
Development Corporation
Jim Damicis Senior Vice President Camoin & Associates, Inc.
Richard (Buzz) David President and CEO Amarillo Economic Development Corporation
Julie Engel President and CEO Greater Yuma Economic Development Corporation
Michael Finney President and CEO Michigan Economic Development Corporation
Kurt Foreman Executive Vice President Greater Oklahoma City Partnership
Jim Fram Senior Vice President, Economic Development Tulsa Metro Chamber
Bob Geolas President and CEO Research Triangle Foundation of North Carolina
Crystal Gettys Interim Director Lincoln Economic Development Association
Dan Gunderson Executive Director Baltimore County Department of Economic Development
Mark James Vice President, Economic and Business Development American Electric Power
Steve Johnson Executive Vice President St. Louis Regional Chamber & Growth Association
Michael Jordan Executive Director Fay-Penn Economic Development Council
Ronald Kitchens President & CEO
Southwest Michigan First
Paul Krutko President and CEO Ann Arbor SPARK
Tom Kucharski President and CEO Buffalo Niagara Enterprise
Michael Langley President and CEO Minneapolis Saint Paul Regional Economic Development Partnership
Susan Mazarakes-Gill Executive Director Longview Economic Development Corporation
Tracye McDaniel President & CEO Choose New Jersey
Kenny McDonald Chief Economic Officer Columbus 2020!
Tim Miles President North Louisiana Economic Partnership
Janet Miller Chief Economic Development & Marketing Officer Nashville Area Chamber of Commerce
Jay Moon President and CEO Mississippi Manufacturers Association
Diedre Myers Director Oklahoma Department of Commerce, Office of Business Location
Allison Thompson Executive Director Cedar Hill Economic Development Corporation
Kim Walesh Chief Strategist City of San Jose, Office of Economic Development
Scott Walker CEO Midland Tomorrow
Rick Weddle President and CEO Metro Orlando Economic Development Commission
Frederick Welch Vice President, Economic Development Greater Houston Partnership
Roy Williams President and CEO Greater Oklahoma City Chamber
Greg Wingfield President and CEO Greater Richmond Partnership, Inc.

Primary Author
Swati A. Ghosh
Contributing Author
Dana Crater
Research Support
Aaron Chafetz
Jeremy Sowders
Editors
Louise Anderson
Tye Libby
Liz Thorstensen
Design Support
Mishka Parkins
International Economic Development Council
734 15th Street NW, Suite 900
Washington, DC 20005
202.223.7800
www.iedconline.org

Acknowledgements
IEDC would like to thank the Economic Development Research Partners (EDRP) program for
providing the impetus and resources for this research.
In particular, we would like to acknowledge the Funding Economic Development Organizations
Task Force for their guidance in the paper’s development: Allison Thompson, Chair, and
members JoAnn Crary, Julie Engel, Buzz David and Jim Damicis. This paper would not be possible
without their contributions and expertise.
We also would like to thank all the economic development professionals and industry experts
who took the time and effort to interview with us and provide input. Although too numerous to
be thanked individually, we recognize that this paper would be incomplete without their
contributions.
Finally, we would like to thank Jeffrey A. Finkle, President and CEO of IEDC, for his oversight of
this project.

Table of Contents
Executive Summary .......................................................................................... 1
Introduction ..................................................................................................... 3
I. Broad Trends in EDO Finance ......................................................................... 7
Organizations’ Geographic Area of Focus Affects Funding Streams ........................................... 7
Funding Streams Vary by Organization Structure ....................................................................... 8
Funding Streams Change Over Time ......................................................................................... 15
Funding Streams Vary by Region ............................................................................................... 18
Organizational Structures Vary by Region ................................................................................. 18
II. Public Funding Sources ................................................................................ 20
Federal Funding ......................................................................................................................... 22
State Funding ............................................................................................................................. 25
Local Resources are the Backbone of EDO Funding .................................................................. 30
III. Private Funding ........................................................................................... 34
In-Kind Contributions ................................................................................................................ 38
Membership Dues ..................................................................................................................... 40
Foundations Grants ................................................................................................................... 42
Charitable Donations ................................................................................................................. 46
Fee-for-Service Contracts and Management Fees .................................................................... 49
Real Estate ................................................................................................................................. 55
Interest on Investments ............................................................................................................ 58
Other Sources of Revenue ......................................................................................................... 59
Conclusions ..................................................................................................... 62
Appendix A – Survey Questionnaire ................................................................. 64
Appendix B – Descriptions of Funding Streams ................................................ 70

1
Executive Summary
Funding for economic development organizations (EDOs) is changing in response to several
global, national and local shifts. Reduced public funding, enhanced scrutiny, increased
accountability demands, changes in foundation funding preferences, the Great Recession, and
the weak global economy are the major issues that EDOs are responding to. Not only are
funding mechanisms impacted, but also EDO structures and their business practices.
This paper examines various public and private funding streams that EDOs utilize and shifts in
these funding streams. It is part of a series of research papers under the theme, Adapting and
Thriving: New Realities for Economic Development Organizations, sponsored by IEDC’s Economic
Development Research Partners (EDRP) Program. A majority of the data presented in the study
comes from a survey IEDC conducted in summer 2012. Additional research through interviews,
case study development, and internet research contributed to the paper as well. Select
international examples are also included.
Several Factors Impact EDOs’ Sources of Funding
The geographic area of focus, the size of the community and the organization’s structure all
impact the types of funding that an organization typically receives. Funding streams also change
with the region and time. EDOs constantly need to evaluate their options for different funding
mechanisms and explore new and innovative ways to bring in additional revenues.
In an effort to access additional funding streams, especially from the private sector, many EDOs
have changed from public organizations to public-private partnerships or even private
organizations. The City of Annapolis, Maryland terminated its Department of Economic Affairs
within the city government and established the new Annapolis Economic Development
Corporation, a public-private partnership in an effort to boost efficiency and effectiveness.
Public Funding Streams are Declining, but Remain Important
This is no news to economic development organizations. However, public funding continues to
be a valuable revenue stream for EDOs, especially where authorized by the state government to
levy additional optional taxes dedicated to economic development, such as in Texas and
Nebraska.
The nature of support from public agencies is changing too. Increasingly more funds are
attached to specific programs, with pre-defined deliverables and timelines, and in most cases,
such funds only constitute a portion of the project budget, requiring EDOs and their partners to
explore other ways to make up for the shortfalls in the budget.
2
Accountability and transparency are also of increasing concern among public agencies
supporting economic development efforts. EDOs are required to report back more frequently
and future funding is based on performance-based metrics. The city government and several
other public sector investors signed separate contracts with the Laramie Economic Development
Corporation (Laramie, Wyoming) citing to boost accountability and transparency in the use of
funds.
In addition, economic developers continually need to educate public decision makers about the
importance and impact of economic development programs to keep their community
competitive and secure future public funding.
Private Funding Streams Are Saving the Day
It appears that the historic ratio of public to private funding for EDOs has reversed in recent
years. Whereas a few decades ago, 70 percent of EDO funding came from public sources and 30
percent from private sources; the opposite is now true. In-kind contributions and fee-for-service
contracts are two revenue streams that are more commonly used by EDOs now.
With the enhanced reliance on private funding streams, EDOs are also adapting their business
practices in significant ways. They need to spend more time on fundraising activities than they
have historically done and develop skills in areas such as grant writing. EDO staff members need
to identify opportunities and develop partnerships with other organizations in the community to
leverage their resources and deliver programs effectively. Hospitals, utility companies, and law
firms are a few examples of organizations that EDOs now partner with on a regular basis.
Not Many Unique Funding Sources Exist
One of the objectives of the study was to find examples of EDOs that are utilizing unique or
entirely new funding sources, or using known funding sources in a new way. The research shows
that not many such cases exist. What is new and unique for a particular EDO, in most cases, has
been used by others in the industry for some time. A few examples of unique funding sources
for EDOs include additional car rental taxes, fees from waste management services, and funding
through foreign trade zones.
In summary, each EDO must find its own unique mix of funding sources based on their mission,
services, and programs. They need to be smart about the use of resources and nimble enough to
adapt to changing situations.

3
Introduction
Economic development organizations (EDOs) are critical to maintain and grow globally
competitive communities. They operate in a complex and dynamic 21st century economic
landscape that is impacted by shifts in local, national, and global markets. Not only do they need
to ensure that their communities attract, retain, and grow successful businesses and talented
people, they need to do so with reduced public funding, enhanced scrutiny, and accountability
concerns from private investors while engaging a broad range of stakeholders in every aspect of
their work. The combined effect of these forces is impacting the way EDOs are structured, the
way they are financed, and the way they conduct business.
Funding for economic development organizations historically came from public sources. It still
does for a sizeable number of the EDOs in the United States, and public funding continues to be
the model in much of Canada, Europe, and Australia. However, increasingly more EDOs are
exploring ways of bringing in additional revenues from non-public sources and adapting their
business practices to meet investor demands. Nimble EDOs today are adjusting organizational
structures, program offerings, funding mechanisms, and staffing plans to continue to serve their
communities and make their organizations more competitive.
The Great Recession – which started in December 2007, lasted 18 months, and has been
followed by a weak recovery so far – exposed numerous vulnerabilities across the economy.
Several shifts were in play in the economic development industry for some years even before the
onset of the recession, such as increased private sector engagement and funding. The recession
set in motion additional shifts, and in some cases increased their pace. Ultimately, their
combined impact will only be known in a few years. The American Recovery and Reinvestment
Act (ARRA, commonly known as the Stimulus Package) of 2009 provided short-term support to
EDO budgets during the recession and immediately following it. Its impact on the long term EDO
business practices is tenuous at best.
This research, sponsored by IEDC’s Economic Development Research Partners (EDRP) program, is
part of a series of research papers under the theme, Adapting and Thriving: New Realities for
Economic Development Organizations. The series aims to explore ways in which EDOs are
responding to global economic changes. The first paper in the series, New Realities for Economic
Development Organizations, was published in May 2011 and identified six major shifts in the
economic development industry and how EDOs have adapted with new business practices and
strategies. EDO funding practices are one of the shifts examined in the paper.

4
This paper builds on that research, focusing on shifts in organizational funding streams and their
impact on the way economic development organizations operate. Trends and shifts in economic
development programs and services are not part of this paper.
Research Methodology
A majority of the data presented in this paper comes from a survey IEDC conducted in summer
2012 to explore EDO funding streams and changes they have undergone in the past five years. (A
copy of the survey questionnaire is provided in Appendix A.)
The survey collected data on funding from federal, state, local, and private sources, as well as
their contribution to EDO budgets. Funding data are analyzed in regard to respondent
characteristics, such as the organization’s geographic area of focus, organization structure,
community type, and population size, to identify trends. Additional research conducted to
supplement survey information included case studies, interviews with fundraising consultants,
senior leaders of EDOs, and other economic development professionals, and internet research.
The paper tries to discount the effects of the federal stimulus package on EDO budgets by
analyzing shifts at two points in time: before the onset of the recession (five years ago) and after
the recession ended (two years ago).
The survey was aimed at identifying new or unique funding sources that EDOs are now using to
cope with economic shifts, as well as innovative ways of using existing funding streams. Such
examples, though few, are shared as case studies.
The study also examines trends in EDO financing in Canada, the United Kingdom, Europe, and
Australia. These are highlighted as case studies in the paper, since the survey did not receive
enough responses from foreign EDOs to draw broad conclusions about EDO financing practices
abroad.
For ease of understanding, different funding mechanisms are grouped together as described in
Table 1 below. For additional information on funding streams, please refer to Appendix B.
Table 1: Grouping of Funding Streams by Major Funding Category
Type of Funding Description Funding Streams
Federal Funding streams from federal government agencies that go directly to EDOs
Grants, loans, allocations, other
State Funding streams from state government agencies going directly to EDOs
Grants, loans, allocations, other

5
Local Funding streams from local government agencies going to EDOs
Local income tax, sales tax, general fund allocations, taxing district, other
Private All non-government funding streams utilized by EDOs
In-kind contribution, foundation grants, charitable donations, management fees, real estate, interest on investment, other
Data Limitations
As is common in survey methodologies with a self-selecting or volunteer sample, the data
collected from the IEDC survey has a few limitations.
Invitations for the survey were sent to IEDC members and promoted through various
economic development related LinkedIn groups. At this time, we are not aware of a
database of EDOs nationally (or globally) that would allow for a comparison of survey
respondents with the “universe” of EDOs. Therefore, it is difficult to determine if we
have a representative sample.
The data include more responses from small to medium-size communities (43 percent
of the responding organizations are from communities with 25,000 – 200,000 and
200,000 – 500,000 population) than very small (less than 25,000 population) or large
communities (more than 500,000 population).
A large percentage of the respondents identified themselves as representing rural
communities (30 percent). The data may be slightly skewed as a result.
Both public-private partnerships and private organizations accept public funding in
different forms. However, organization structures are defined differently across the
country in terms of characteristics such as governance and ratio of public to private
funding. As such, respondent choices to survey questions vary based on their own
understanding of such terms and phrases.
In spite of these limitations, the information gathered provides valuable insights into funding
streams available to EDOs today. Economic development experts consulted for this study agreed
with the general trends and practices discussed in this study.
IEDC received responses from close to 250 different EDOs throughout the United States.
Respondents include a mix of urban, rural, and suburban communities as well as those of small,
medium, and large sizes. Table 2 and Table 3 below illustrate these characteristics.
6
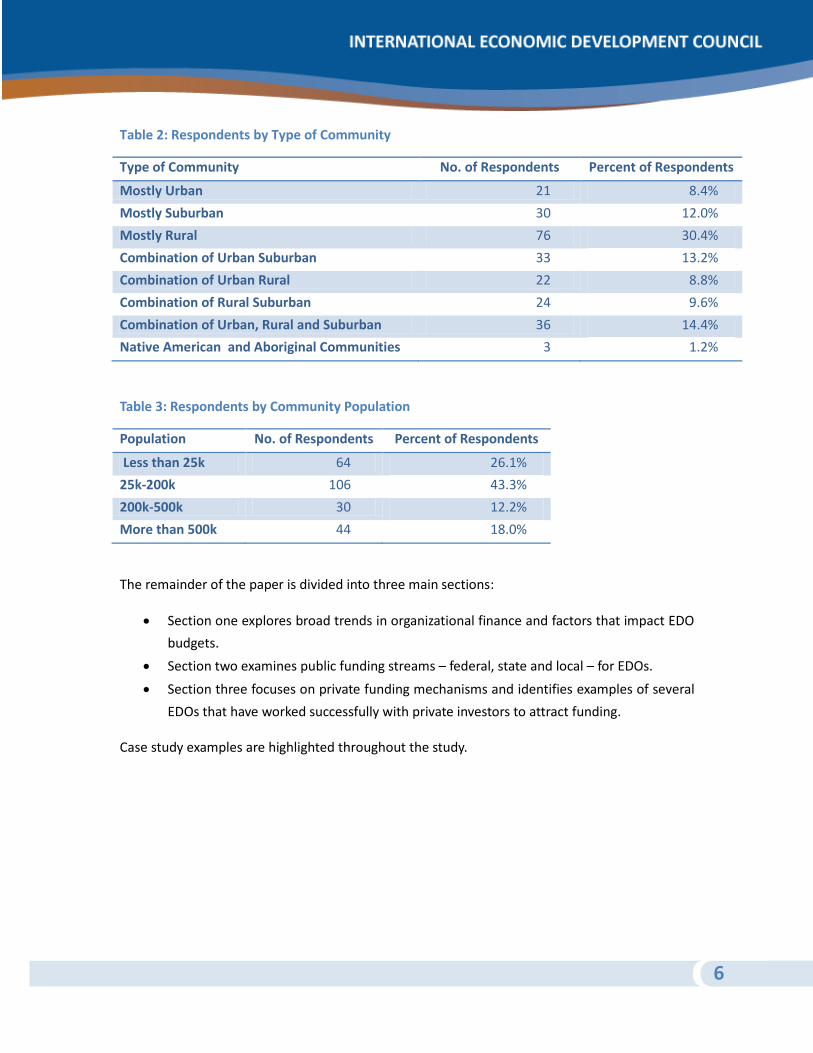
Table 2: Respondents by Type of Community
Type of Community No. of Respondents Percent of Respondents
Mostly Urban 21 8.4%
Mostly Suburban 30 12.0%
Mostly Rural 76 30.4%
Combination of Urban Suburban 33 13.2%
Combination of Urban Rural 22 8.8%
Combination of Rural Suburban 24 9.6%
Combination of Urban, Rural and Suburban 36 14.4%
Native American and Aboriginal Communities 3 1.2%
Table 3: Respondents by Community Population
Population No. of Respondents Percent of Respondents
Less than 25k 64 26.1%
25k-200k 106 43.3%
200k-500k 30 12.2%
More than 500k 44 18.0%
The remainder of the paper is divided into three main sections:
Section one explores broad trends in organizational finance and factors that impact EDO
budgets.
Section two examines public funding streams – federal, state and local – for EDOs.
Section three focuses on private funding mechanisms and identifies examples of several
EDOs that have worked successfully with private investors to attract funding.
Case study examples are highlighted throughout the study.

7
I. Broad Trends in EDO Finance
This section discusses the overarching trends and observations that emerge from the survey
data. These cover changes in funding mechanisms by organizations’ geographic area of focus and
organizational structure, as well as trends in different parts of the country.
Organizations’ Geographic Area of Focus Affects Funding Streams
The geographic area of focus for an organization (the level at which it operates, e.g., city, county,
state, etc.) impacts its sources of funding. Table 4 below shows the number of survey
respondents by type of organization.
Table 4: Respondents by Geographic Area of Focus for Organization
Geographic Area of Focus No. of Respondents Percent of Respondents
State or Provincial 14 5.7%
County 87 35.5%
Municipality 83 33.9%
Regional 40 16.3%
Multiple States 5 2.0%
Sub-Local 16 6.5%
Figure 1 below provides details on funding sources by organizations’ geographic area of focus.
Survey Findings
State governments are the biggest recipients of federal funding, followed by regional
organizations. It also reflects the fact that a significant portion of survey respondents
described themselves as rural communities (30 percent). Federal funding for such
communities is typically funneled through state level programs rather than direct
disbursement.
More than 90 percent of regional organizations receive private funding. Large regional
organizations often have more resources to devote to fundraising activities (such as
grant proposals, entries to competitions, etc.) to raise capital from private sources than
other types of EDOs.
At the same time, almost 80 percent of EDOs operating at the sub-local level, such as
downtown merchants associations, receive private funding. Most of this is comprised of
contributions from local businesses and organizations.

8
Figure 1: EDO Funding by Organizations’ Geographic Area of Focus
Funding Streams Vary by Organization Structure
The legal structure of the organization – public, private, or public-private partnership – also
affects the types of funding that an organization can receive. Almost half the survey respondents
defined their organization as public entities, with the other half divided between public-private
partnerships and private organizations. Table 5 below shows the survey results by organization
structure.
Table 5: Respondents by Organizational Structure
Organizational Structure No. of Respondents Percent of Respondents
Public 125 50.0%
Private 49 19.6%
Public-Private Partnerships (PPP) 71 28.4%

9
Figure 2: EDO Funding Sources by Type of Organization
Survey Findings
Among public funding streams, local funding comprises the largest proportion for all
types of organizations. Public entities receive more federal funding than the other two
groups.
Interestingly, all types of organizations receive all types of funding. However, not all sub-
categories of funding are available to all types of organizations. For example, in a
majority of the cases, only nonprofit organizations with the IRS 501(c)(3) designation are
able to receive grants from foundations.
Public-Private Partnerships
Public EDOs have dominated the economic development landscape for decades. While
completely private EDOs are still uncommon, public-private partnerships (PPP) have ascended in
the wake of declining public funds for economic development. Budgetary flexibility is one of the
main reasons why communities have utilized the PPP model for economic development
purposes. While public-private partnerships are more widespread in the United States, there are
a few PPPs emerging in Canada and Australia.
PPPs receive funds from both public and private entities, though there are limitations on certain
types of funding streams and activities that the PPP can receive or be engaged in. For example, a

10
vast number of PPPs in the United States are 501(c)(3) nonprofit organizations.1 These types of
organizations are tax exempt and can receive charitable donations, but cannot use more than 15
percent of their revenues for lobbying activities. Similar restrictions apply to other tax-exempt
nonprofit designations such as 501(c)(4), 501(c)(6), and 501(c)(12).
Survey Findings
Nationally, over 80 percent of public-private partnerships receive local funding, which
represents their second-largest source of revenue after private funding.
Less than 20 percent receive state or federal dollars. Most of the local funding comes in
the form of allocations from local governments and allied agencies.
Among private funding streams, membership dues and in-kind contributions are the
largest funding sources (received by 86 and 50 percent of respondents respectively).
Long term relationships with members and working with partners can have a tangible
impact on EDO budgets.
Public-Private Partnerships Abroad
While public-private partnerships are more widespread in the United States, there are a few
PPPs emerging in Canada and Australia. The United Kingdom is moving to a public private
partnership model for local economic development throughout the country.
Canada’s Technology Triangle (CTT)
CTT is a regional EDO that markets the Waterloo region around the globe and connects
entrepreneurs and growing businesses to the data and resources they need to succeed. Located
in Ontario to the west of Toronto, the triangle includes the cities of Cambridge, Kitchener, and
Waterloo and the townships of North Dumfries, Wellesley, Wilmot, and Woolwich. Currently the
regional population is around 550,000. CTT’s funding is approximately 53 percent public and 47
percent private.
Before CTT was founded in 1987, there was significant competition between the local EDOs.
Several EDOs came together under the idea of a PPP to promote the region, leading to more
collaboration across multiple jurisdictions. For the first 10 years, there was no staff – only a
team of volunteers. Currently there are 10 employees at CTT. As the organization has grown, a
new focus on Foreign Direct Investment (FDI) and research has emerged.
1 Private EDOs can also be structured as a 503(c)(3) nonprofit organization and are subject to the same limitations
regarding lobbying activities.

11
The partnership is a triple helix composed of representatives from the public sector, the private
sector, and institutions in the region. A board of directors—made up of six public partners, four
chambers of commerce and technology associations, two university presidents, one community
college president, and ten private businesses—governs the partnership. While some of the
board members are paying partners, the board of directors is not a pay-to-play structure.
There are three different categories of partners who have long-term commitments to the
organization: community, municipal, and corporate. Each of the eight municipal and 22
corporate partners provides financial support to the organization. The 10 community partners
do not necessarily provide funding.
A major challenge for the organization is showing a suitable return on investment for its funding
partners. Although CTT does not guarantee a return on investment, it is important that they
meet expectations in order to secure funding for coming years.
Project-Based PPPs in Australia
Public-private partnerships are slowly being created in Australia for economic development
purposes, though they tend to be project specific rather than serve in a variety of economic
development functions. For example, there is a partnership between the Marine Alliance and
Mornington Peninsula Shire Council (MPSC) to conduct research on the local marine sector. The
private funding from the Marine Alliance allows MPSC to hire a private consultant to conduct
some of the research.
Other experiments of working with PPPs have not been successful. For example, there are
public-private partnerships for road improvements and maintenance; however, they have
received mixed reception.
Major Shifts to PPPs in UK
Economic development organizations in UK are undergoing significant shifts in their funding
mechanisms. The Coalition Government took office in May 2010 and put in place an entirely
new structure of EDOs, known as local economic partnerships (LEPs), with an emphasis on
engaging the private sector in a way that they had not been engaged in the past. Some industry
experts contend that the model is based on the success of PPPs in the U.S., though it is facing
some major challenges in implementation.
LEPs replace regional EDOs that were almost entirely funded through public funds, a majority of
which came from the central government. LEP jurisdictions are more aligned with economic
regions, rather than political boundaries, to better address economic development challenges.
12
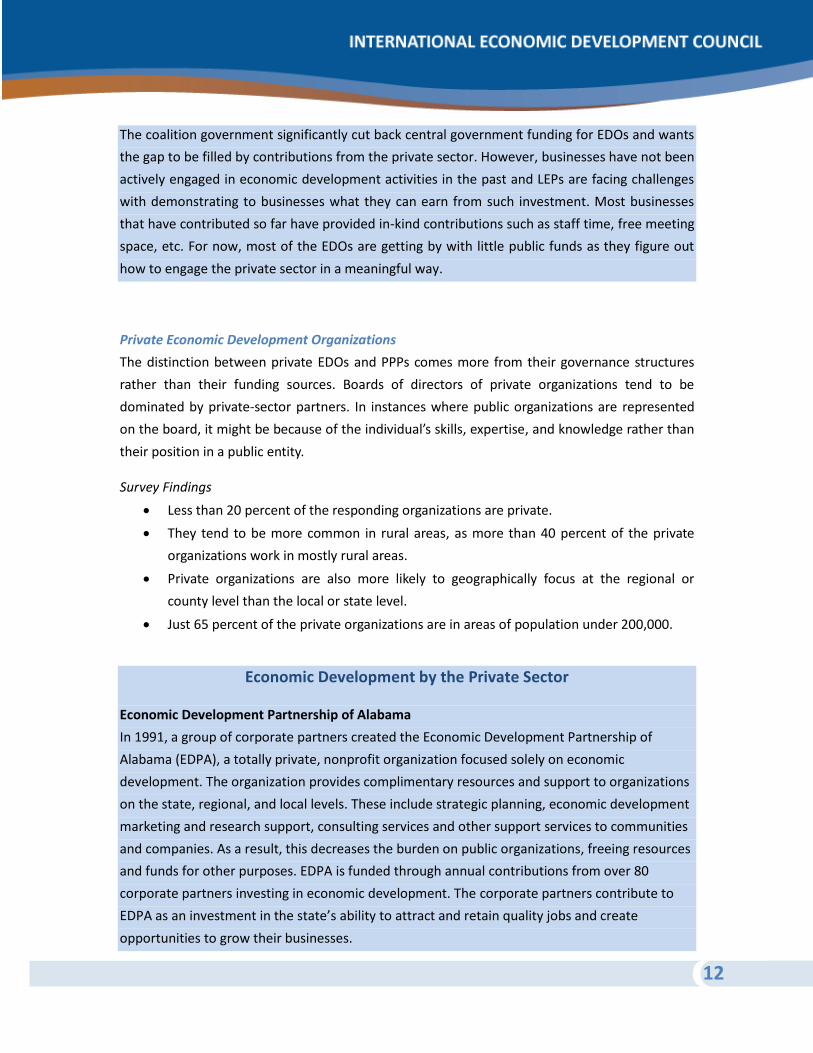
The coalition government significantly cut back central government funding for EDOs and wants
the gap to be filled by contributions from the private sector. However, businesses have not been
actively engaged in economic development activities in the past and LEPs are facing challenges
with demonstrating to businesses what they can earn from such investment. Most businesses
that have contributed so far have provided in-kind contributions such as staff time, free meeting
space, etc. For now, most of the EDOs are getting by with little public funds as they figure out
how to engage the private sector in a meaningful way.
Private Economic Development Organizations
The distinction between private EDOs and PPPs comes more from their governance structures
rather than their funding sources. Boards of directors of private organizations tend to be
dominated by private-sector partners. In instances where public organizations are represented
on the board, it might be because of the individual’s skills, expertise, and knowledge rather than
their position in a public entity.
Survey Findings
Less than 20 percent of the responding organizations are private.
They tend to be more common in rural areas, as more than 40 percent of the private
organizations work in mostly rural areas.
Private organizations are also more likely to geographically focus at the regional or
county level than the local or state level.
Just 65 percent of the private organizations are in areas of population under 200,000.
Economic Development by the Private Sector
Economic Development Partnership of Alabama
In 1991, a group of corporate partners created the Economic Development Partnership of
Alabama (EDPA), a totally private, nonprofit organization focused solely on economic
development. The organization provides complimentary resources and support to organizations
on the state, regional, and local levels. These include strategic planning, economic development
marketing and research support, consulting services and other support services to communities
and companies. As a result, this decreases the burden on public organizations, freeing resources
and funds for other purposes. EDPA is funded through annual contributions from over 80
corporate partners investing in economic development. The corporate partners contribute to
EDPA as an investment in the state’s ability to attract and retain quality jobs and create
opportunities to grow their businesses.

13
Columbus 2020
Established by the Columbus Partnership Initiative, Columbus 2020 focuses solely on a regional
economic development strategy. The Columbus Partnership Initiative is made up of 43 CEOs
from the leading corporations and institutions within the Columbus region. It is a membership-
based nonprofit organization. Columbus 2020 is a private 501(c)(3) organization that functions
like a corporate foundation and is funded via an annual fundraising campaign.
For private investors, there is a $5,000 minimum investment. However, it is not a pay-to-play
model. A formula is utilized for public-sector investment. Currently there are over 250 investors
from around the Columbus region. This unique model allows investors to know that they are
investing in the organization for the sole purpose of supporting the economic development
strategy development and implementation. The strategy allows other organizations within the
region to focus on other initiatives.
Organizational Structures Change Over Time
In addition to adopting different funding mechanisms, EDOs also are adapting their
organizational structures to deliver better services and products to their stakeholders.
Survey Findings
Less than 18 percent of respondents reported any change in their organizational
structure in the past five years.
Structural changes occurred due to a variety of reasons. Organizations faced reduced
funding and staffing levels, which resulted in reduced services; mergers of different
departments within local governments, as well as mergers of different organizations;
expanded scopes of work; changes from public structure to public-private partnerships
and vice versa; changes in board structures; and enhanced emphasis on private-sector
participation, among others. Some of these changes can happen without changes to the
organizational structure.
Privatizing a Municipal Economic Development Department: Annapolis
Economic Development Corporation
The City of Annapolis (pop. 33,880) is the state capital of Maryland and the county seat. The
largest employers are public entities including the state government, Anne Arundel County
government, City of Annapolis government and the United States Naval Academy. In addition to
government, other local industry clusters include tourism, retail, and maritime.
14
In December 2009, Joshua Cohen was sworn in as mayor. As part of his transition plan, Mayor
Cohen created a bipartisan “Idea Team” to explore areas for government effectiveness and
efficiency. One of the committees explored economic development and found that the current
Department of Economic Affairs was not working effectively. The department managed all
economic development activities plus the Main Street organization, the arts district, and the
sister city program. The City Council passed an ordinance to create the Annapolis Economic
Development Corporation (AEDC) as a 501(c)(3) organization. (A copy of the ordinance can be
found at
http://www.annapolis.gov/Government/Council/Adopted/Ordinances/O1210.pdf.)
As a result of the ordinance, the city terminated the Department of Economic Affairs and laid off
its staff. Mayor Cohen created a working group that created the private corporation and hired
the new president and CEO in January of 2011. A 12-member board of directors also was
nominated to oversee the organization. The Mayor nominates the chairman and three directors;
four represent the Annapolis & Anne Arundel County Conference & Visitors Bureau, the
Annapolis and Anne Arundel County Chamber of Commerce, and the Annapolis city manager;
and the final four are from the local business community.
The original Department of Economic Affairs had a budget of approximately $500,000. As part of
the ordinance, AEDC has to request funding annually from the city council. The first year, the
city provided $400,000 in funding, followed by $385,000 in the second year and $450,000 in the
third year. The goal is for the organization eventually to become self sufficient. Another goal is
to obtain a multi-year grant from the city to aid the organization with long-term planning. There
is currently no memorandum of understanding or contract between AEDC and the city.
The majority of the city’s private employers are small businesses with fewer than 200
employees and are unable to provide significant financial support. AEDC has received up to
$2,000 in private funding and sponsorships for specific events. They also receive several in-kind
donations, including subsidized rent, meeting rooms, and coffee and donuts for meetings, which
have provided substantial savings to the organization.
Practicing Economic Development in Rural Illinois: Sullivan Chamber and
Economic Development
Sullivan, Illinois is a small town (pop. 4,326) located north of Lake Shelbyville on the border of
Illinois’ Amish Country. Surrounded by farms, there are two manufacturing plants and a number
of small businesses in the downtown square. The Sullivan Chamber and Economic Development

15
(SCED) was established in 2011 as a 501(c)(6) from the merger of Sullivan Area Economic
Development Corporation and the local chamber of commerce. The idea of the merger came
about as the two organizations started to see overlaps in their work. SCED manages economic
development, tourism, city beautification efforts, and the chamber membership. Their budget
for 2013 is just under $162,000. A tax increment financing (TIF) district provides $70,000 of that
total.
Since the merger, the organization has increased its membership by over 100 members in just
over a year, resulting in an increase of $18,000 in membership dues. The merged organization
allows for larger, more professional events; an annual visitors guide; monthly newsletter and a
weekly e-newsletter; and stronger regional relationships. The additional membership dues and
merger have allowed the new organization to decrease its administrative expenses and support
two full-time staff members: a chamber administrator who addresses the day-to-day issues and
an economic development coordinator who supports economic development initiative
Funding Streams Change Over Time
The section below covers the changes in funding streams over the past five years. Modifications
to funding streams in the past two years are cited with the individual funding streams.
Approximately one-third of EDOs reported an increase in their overall funding level and an equal
number reported either a decrease or no change. While these results are difficult to interpret,
the survey did find significant shifts in specific funding streams in the past five years, and those
impacts on EDOs budgets have been far reaching.
Survey Findings
Funding declined most dramatically among grants from the federal and state levels
(Figure 3 and Figure 4). In both instances, twice as many respondents experienced a
decrease in these funding streams as experienced an increase.
Decreases in allocations from the state and federal levels also far surpassed increases in
these funding sources. Only a handful of EDOs saw an increase in allocations from the
state and federal governments.
Loans, at both the federal and state levels, stayed relatively unchanged.
The largest decline at the local level was due to cutbacks in local allocations (Figure 5).
Local economic development income taxes and taxing district revenues largely stayed
the same.
Further, in spite of the economic downturn, more than 40 percent of respondents said
they have seen an increase in local sales tax collections in the past five years.

16
Figure 3: Federal Funding Change – Past Five Years
Figure 4: State Funding Change – Past Five Years

17
Figure 5: Local Funding Change – Past Five Years
The funding landscape looks much different when it comes to private sources.
Figure 6: Private Funding Change – Past Five Years
Survey Findings
Almost three-fourths of the organizations report either an increase in private funding or
no change.

18
In-kind contributions were the type of private support that increased the most, with
more than twice as many respondents seeing an increase versus a decrease (Figure 6).
Interest on investments was the only private funding source that declined for more EDOs
than it increased.
Funding Streams Vary by Region
Table 6 depicts the distribution of funding sources for EDOs by region. Though the pattern is
similar across regions, a few trends are worth mentioning.
State funding for economic development is much more prevalent among EDOs on the
east coast than in other parts of the country. State funding tends to be much lower in
the Midwest and South.
Private funding also is relatively higher among eastern states than other parts of the
country. At the same time, local funding is much lower in these states.
Federal funding is less prevalent among EDOs in the Midwest and South.
Table 6: Percent of EDOs that Receive a Particular Funding Source by Region
Federal State Local Private
East 31% 34% 50% 69%
Midwest 24% 18% 75% 66%
South 23% 16% 72% 60%
West 34% 27% 71% 67%
Note: Cells depict the percent of EDOs in the region receiving that particular funding source
Some of these observations reflect the way EDOs have evolved in different parts of the country
to respond to varying local needs in different ways, and it is certain that their funding streams
and structures will continue to evolve.
Organizational Structures Vary by Region
Organizational structures vary by region, too. Figure 7 below shows that public entities comprise
the majority of EDOs across the country.
Survey Findings
The West has more private organizations than other regions, while the Midwest has
more public-private partnerships.

19
Nearly a third of EDOs in California and half in Arizona are private organizations.
In the Midwest, eight of the 12 states have an above average number of PPPs (the
national average is 28 percent). Iowa and Wisconsin stand out in this region; 50 percent
or more of their EDOs are structured as public-private partnerships (see Table 7).
Figure 7: Organization Structure by Region
Table 7: States in the Midwest with Above Average Share of PPPs
State % PPPs
National Average 28%
Iowa 60%
Wisconsin 50%
Michigan 42%
Kansas 40%
Missouri 36%
North Dakota 33%
Indiana 31%
Illinois 29%
The following sections explore each funding source in more detail, starting with public funding
sources.

20
II. Public Funding Sources
Public funding remains an important part of EDO budgets across the country and much of the
rest of the developed world. Though there is heightened need and pressure for greater private-
sector involvement in and contribution to EDOs, survey results show that public funding is still
very important for a majority of EDOs.
Public funding can be in the form of loans, grants, or allocations from federal, state, and local
governments, as well as local taxes (in some cases enabled through state legislation), special
districts, and other contributions from local government.
Survey Findings
More than 90 percent of EDOs surveyed receive public funding from federal, state, or
local governments.
Less than 7 percent of respondents reported that they are purely privately funded.
EDOs, on average, collect public funding from nine different public sources, ranging from
grants to tax revenues and loans from federal, state, and local sources.
It is well known that public funding for economic development has declined over the past
several years. But while certain types of public funding sources have seen a sharp decline (e.g.,
grants and allocations from federal and state governments), some public funding sources have
gained in use over the same period. Local sales tax is one such example. This is discussed in more
detail later in the paper.
An increasing number of communities are looking for direct funding streams (discussed in detail
under state funding mechanisms) such as Ohio’s conveyance fees, Indiana’s economic
development income tax (EDIT), and the local option sales tax in Texas. These fees and taxes
provide EDOs with a steady revenue stream. However, implementing new taxes and fees
(whether at the state or local level) is often politically difficult.
EDOs may also have to compete for grant funding designated for specific programs (such as
disaster recovery efforts, small business development, or workforce training) from public
sources. This highlights the need for economic development professionals to broaden their skills
to include grant writing and proposal development, even when working for public-sector
organizations.
21
Additional Survey Findings
Organizations receive public funding in a variety of ways. Just under 25 percent of
organizations receive it in one of two formula-based ways: per capita (15 percent of
organizations) or ratio to private funding (7.3 percent).
Approximately 20 percent of organizations compete for grants from public agencies for
program-related projects.
In 63 percent of organizations that receive public funding, money is allocated on an ad
hoc basis at the public entity’s discretion. This can create uncertainty for EDOs when
planning and undertaking long-term programs or projects. Therefore, it is important for
EDOs to develop additional revenue streams to lessen their dependence on public
sources.
Support from Utility Companies for Economic Development Organizations
Access to utility funding for economic development depends largely on the way utility
companies are structured, which varies by state in the U.S. Some states regulate utility
companies through a public utility commission (also known as a public service commission).
Other states are deregulated. The United States Energy Information Administration provides a
map with the status of each state’s utilities at
http://www.eia.gov/cneaf/electricity/page/restructuring/restructure_elect.html.
Where regulated by state law, the public utility commission determines the use of operating
funds and rate structures. This extends to funding for economic development. Appointed
commission members – the decision makers on operating budgets – generally understand the
significance of economic development programs and may allow the operating expenses to be
covered in the rate base2. In deregulated states, funding for economic development is
determined by the rate base, company operating budget and shareholders.
Pat Sims, Manager of Community Development at Georgia Power, recommends that economic
developers have a “good relation[ship] with the regulating body, legislature and elected officials
so they understand the importance of economic development and allow funding for economic
development organizations. As cities are cutting funding, it is important to educate [such
stakeholders] about the importance of continued economic development.”
2 Commissions may provide guidelines on how the funds may be spent by the utility. In certain instances, the funds may
only be used for projects or programs and may not be used for operations.

22
Leveraging Utility Funding: Chesterfield County Economic Development Alliance
In 1996, the South Carolina legislature passed the Rural Development Act (RDA), which allows
utilities in South Carolina to direct up to $300,000 of their annual gross-receipts tax obligation to
infrastructure related economic development projects in the local communities they serve.3 The
funds can be used for specific permitted uses including strategic planning, speculative-building
development, professional development for local economic developers, industrial park
development, road development and other infrastructure needs.
Chesterfield County, with rural county with a population of 46,000, is one such example of a
community that has taken advantage of RDA funds to develop an economic development
strategic plan. The strategic plan was completed in 2009. Unfortunately, the plan’s strategies
were based on assumptions of pre-recession conditions, so the strategic plan had to be updated
— using additional local RDA funds — to address the realities of the recession.
Federal Funding
Approximately 30 percent of respondents reported receiving federal funding as a part of their
EDO budgets. For the majority of organizations, federal funding accounts for less than 20
percent of the organizational budgets. Federal dollars for economic development have shifted
over the past several decades and with the overall decline in public funding, most communities
are well attuned to looking for resources elsewhere. Figure 8 shows the budget distribution by
different types of federal resources. Grants are the most common type of federal funding;
almost 75 percent of the EDOs that receive federal funding reported receiving federal grants, as
shown in Table 8.
Table 8: Distribution of Different Types of Federal Funding
Type of Funding % of Respondents
Loans 17.8%
Grants 72.6%
Allocations 31.5%
Other 23.3%
3 Blue Ridge Electric Cooperative. (n.d.) Economic Development. Retrieved January 15, 2013, from
http://www.blueridge.coop/economic_development/

23
Figure 8: Types of Federal Funding as a Proportion of EDO Budgets
Other types of federal funding include project-specific grants or provisions, also known as
earmarks. Earmarks are funds that Congress provides directly to specific projects or programs.4
Federal earmarks have come under fire in recent years as they tend to circumvent the typical
allocation process based on merit or competitive needs. In 2010, a moratorium was placed on all
federal earmarks. This moratorium has been extended through FY2013.
Survey Findings
Federal loan amounts largely stayed the same between the past five and past two years.
However, more organizations reported declining federal grants over the past five and
two years as compared to federal loans and allocations.
Less than 20 percent of the organizations reported an increase in overall federal funding
over the past five and two years.
It also appears that larger communities are more successful at attracting federal funding.
More than 50 percent of the respondents with populations greater than 500,000
received federal funding, as opposed to less than 20 percent of respondents in
communities with less than 25,000 residents. This can be explained partly by the fact
that smaller communities receive federally allocated resources (such as Community
Development Block Grant – CDBG – funds from the U.S. Department of Housing and
Urban Development) through their states rather than directly from federal government
4 United States Office of Management and Budget. (n.d.) Earmarks. Retrieved January 15, 2013, from
http://earmarks.omb.gov/earmarks-public/

24
agencies. Yet, knowing that the vast majority of EDOs receive federal dollars through
competitive grants, it seems likely that larger EDOs have the resources and skills
required to develop quality proposals for grant competitions, which may not be the case
with smaller communities. It is also likely that the federal government directs more
funding to regional organizations in support of efforts to boost regional cooperation and
economic development strategies. However, additional data and research are needed to
confirm these hypotheses.
EDOs in predominantly urban areas are less successful at attracting federal funding as
compared to regional EDOs or even those operating in primarily rural areas. Less than 20
percent of EDOs in mostly urban and mostly suburban areas receive federal funding. On
the other hand, close to 50 percent of EDOs operating in a mix of urban, suburban, and
rural areas (i.e., regional EDOs) receive federal funding.
Federal Government Support for Local Economic Development in Other
Countries
The federal or national-level government continues to be the primary funding mechanism for
economic development organizations outside the United States. Our study examines Australia,
Canada, the United Kingdom, and the rest of Europe. Each is discussed briefly below.
Australia
The Commonwealth of Australia is highly supportive of economic development at the state and
local levels. There are approximately 640 local economic development councils in Australia that
are spread across the six states and two mainland territories. Support for economic
development is included in the national constitution. State constitutions mandate public funding
of economic development councils as well, though the amount of public funding a local
economic development council receives depends on the size, scale, and goals of the
municipality. As a result, huge differences exist throughout the country in the funding levels of
economic development councils. Some local economic development councils in large urban
areas may have only one part-time employee, whereas another in a rural small town may have
three to four employees. Part of the decision depends on the importance placed on economic
development initiatives by the municipal government.
On the regional level, the Commonwealth has created a regional development fund of $1 billion
(AUD) for infrastructure improvements. The country is divided into 50 committees covering all
municipalities. The committees are made up of state- and commonwealth-appointed members
for a period of three years of unpaid service. The purpose of the committee is to charter a
regional plan. Each committee reaches out to its municipalities to identify up to three

25
infrastructure projects within the region that meet the goals of the regional plan. These projects
are reviewed by the committee and then proposed to the state and commonwealth
governments for consideration and funding. Each round of grants has a different focus and
grants range in price from $50,000 to $25 million. As part of this program, each committee
receives a small operating budget from the commonwealth and state which includes funding for
one staff person per committee.
Due to the Commonwealth’s support for economic development, there are a number of grant
programs for which communities and organizations can apply. State economic development
departments receive their own support through taxes and funds from the Commonwealth. For
example, the State of Victoria receives $500 million for infrastructure, investment promotion,
marketing, and other broad responsibilities.
With the dependence on public funding comes the potential for fluctuations in state and federal
budgets from year to year that impact EDO budgets in return. For instance, there was an
expectation for a budget surplus in 2012. However, due to a decrease in mining revenues,
budgets are forecast to decrease in 2013.
European Union
Economic development activities and organizations throughout much of Europe are publically
funded. The European Union (EU) has a large economic development fund called the European
Regional Development Fund (ERDF) that regional development authorities (RDAs) can apply for
funding for specific projects and programs. Most countries provide additional support for EDOs
and key projects from the national government, the regional government, or both.
Municipalities are able to raise some funds locally as well. Funding for economic development
has been abundant for the past several years. Since the global economic downturn, EDOs have
started looking at ways to supplement their budgets in different ways, such as fee-for-service
contracts, managing loan programs, engaging in real estate investment, etc.
State Funding
State funding for economic development is a slightly different story than federal funding.
Survey Findings
The number of organizations receiving state funding is slightly lower than those
receiving federal funding (27 percent versus nearly 30 percent, respectively).

26
Like federal funding, a large majority of the organizations receive state funding in the
form of grants (65 percent) and allocations (35 percent).
State funding is not a large portion of the organizational budget and typically constitutes
less than 20 percent (see Figure 9). This shows that most EDOs rely heavily on local
governments for public funding support.
Table 9: Distribution of Different Types of State Funding
Type of Funding % of Respondents
Loans 16.7%
Grants 65.2%
Allocations 34.8%
Other 15.2%
Figure 9: Types of State Funding as a Proportion of EDO Budgets
Just like federal funding, states can provide earmarks to local economic development agencies
and organizations. However, the number and amount of earmarks varies by state. State
legislatures pass bills with earmarks for local projects included. These can be controversial when
they conflict with projects that state agencies deem to be most pressing.
Other types of state funding for economic development organizations include fees for services,
sales tax allocations, state turnbacks, and special legislative appropriations, among others. Only
15 percent of the respondents indicated receiving funds through these state funding streams.

27
Direct Funding Streams from State Governments
A variety of different types of state funding other than grants, loans, and allocations can be
grouped together as direct funding streams. These are different from state earmarks. We classify
direct funding streams as monies dedicated for economic development purposes and provided
directly to economic development organizations or programs. These include state turnbacks,
which are funds collected by the states but turned back to the community for economic
development purposes, and local option sales taxes for economic development (where allowed
by state legislatures). Direct funding steams from states are very important sources of funds for
economic development programs in communities that receive them. Below are several examples
showcasing different types of direct funding streams from states.
1. Missouri’s Local Option Sales Tax for Economic Development – The state legislature
passed a law in 1995 providing localities the option of enacting up to a half percent sales
tax on all retail sales within the municipality. In order to utilize this at the local level,
majority of the municipality’s citizens must approve the retail sales tax. The use of the
tax revenue is overseen by an economic development tax board. Eligible uses for the tax
revenues include staff, project administration and facilities. For more information, please
visit http://www.missouridevelopment.org/.
2. Local Option Municipal Economic Development Tax in Nebraska – The state of Nebraska
has a similar program that was created by law in 1991 and modified several times since
then. The law allows cities and villages to collect and appropriate local tax dollars
(sales/property tax) after voter approval. The law requires an economic development
plan to be created first and approved by the voters along with the tax rate. A guide to
the law can be found at http://www.neded.org/files/assist/LB840Guide.pdf.
3. Local Option Sales Tax in Texas – Through the Development Corporation Act of 1979,
Texas cities are able to adopt a sales tax to fund economic development organizations
and projects. The law defines what projects are eligible. Type A is for developing
industries, which funds industrial development projects such as business infrastructure,
manufacturing, research and development, BRAC (Base Realignment and Closure), job
training classes, and public transportation. Type B focuses on all of Type A activities in
addition to cultivating community assets such as parks, museums, sports facilities, and
affordable housing. Type B includes more administrative restrictions than Type A.
Additional information can be found at
http://www.texasahead.org/tax_programs/typeab/.
4. Sales and Use Taxes for Counties in Wyoming – Wyoming passed a law that allows
counties to charge up to one percent sales and uses tax (increased by quarter percent

28
increments) for economic development purposes. The amount varies by county. A four
percent lodging tax, increased in increments of one percent, is permitted for local travel
and tourism promotion. Detailed information available at
http://www.wyotax.org/sales_and_use_tax.aspx.
5. Specialty License Fees in Massachusetts - In Massachusetts, the legislature allowed a fee
from a specialty license plate to support economic development initiatives in the Cape
Cod region. Additional information can be found at
http://www.capecodedc.org/licenseplategrantsintroduction.htm.
Spotlight Arkansas: State Turn-back Funds
The State of Arkansas created a municipal aid fund also known as the state turnback fund to
support economic development organizations and activities at the local level. Once the state
revenues have been appropriated to different programs, the remaining funds can be set aside
for counties and municipalities through a legislature-created per capita rate. The amount of
funding the local government receives is based on the county or municipal population.
However, the legislation only dictates that the state legislature may provide these turnback
funds; they are not mandated by law. Thus, they are not guaranteed annually. Local
governments typically separate these monies into two funds: one for streets and one for general
purposes, which may include economic development initiatives.
Another turnback fund is financed through property taxes. Arkansas law requires counties to
facilitate the certification of all delinquent properties to the Office of the Land Commissioner.
For two additional years, the commissioner’s office will then attempt to collect the tax and fines
from the property owner. If there is no attempt by the property owner to redeem the property,
the property becomes eligible for public auction. The state auctions the property and the funds
return to the county through the state turnback fund, which may be used for economic
development activities.
Lastly, Arkansas communities are allowed to institute an advertising and promotion tax.
Communities can choose to institute a tax on hotels rooms and prepared foods of up to 3
percent. The state collects all taxes and then returns the special tax to the community. The tax
revenues can be used only for specific purposes, such as advertising and promotion of the city,
venue development (such as a convention center or stadium), and tourist attractions.

29
Different types of state funding streams other than grants, allocations, and loans include:
Contracts for services,
Tourism,
Local dues,
Membership dues,
Sales tax,
State turn back, and
Special legislative appropriations.
Additional Survey Findings
Similar to federal funding, grants and allocations from state governments have
decreased over the past five years and two years, although state loans have largely
remained unchanged.
EDOs operating in medium to large communities appear to be the biggest recipients of
state funding. Well over 40 percent of EDOs in population centers of more than 500,000
people and over 35 percent of EDOs in communities of 200,000 and 500,000 populations
receive state funding as opposed to less than 20 percent in communities with 25,000 to
200,000 populations and less than 25 percent in less than 25,000 populations. Given
that state funding is distributed primarily through competitive grants, it can be
concluded that larger EDOs have better resources to pursue competitive funding
opportunities.
Regional EDOs (those working in areas with a mix of urban, suburban, and rural areas)
are more successful at attracting both state and federal funding. Less than 20 percent of
mostly urban areas receive federal funding as compared to almost 50 percent of regional
EDOs.
The Curious Case of State Economic Development Organizations
The budgets of state-level EDOs can be complicated. State EDOs receive and disburse funds for
economic development projects and programs. They can receive funding from federal
government agencies, other state agencies, local governments, and private contributors
(depending upon their structure), although they typically disburse funds to local and regional
EDOs only or invest in special economic development programs and projects directly through
earmarks.
As discussed earlier, organizational structures impact the revenue streams available for
economic development. In 2011, five state governments transferred control of their economic
development agencies to public-private partnerships or quasi-public organizations. The driving

30
force behind these decisions appears to be interest in attracting more private business and
foundation funding for state economic development initiatives. Previously, only seven states had
some form of privatized economic development efforts.
State economic development organizations that are quasi-public or public-private partnerships
receive partial funding from the state general fund and may receive additional funding from
corporations, nonprofits, and the federal government. At Enterprise Florida, for example,
investors contribute a minimum of $50,000 annually in exchange for the opportunity to have
input into business policies and strategies aimed at making Florida competitive. The Economic
Development Corporation of Utah (EDCUtah), a public-private partnership, receives part of its
revenues from both public- and private-sector investor memberships. The Utah Governor’s
Office of Development contracts with EDCUtah for the state’s business recruitment activities.
Although each state office releases its publicly funded budgets on government websites, details
of private funding typically are not released.
Local Resources are the Backbone of EDO Funding
Local resources are by far the most prevalent funding mechanism for economic development
organizations.
Survey Findings
Not only do more than 80 percent of respondents receive local funding for economic
development activities, but local resources comprise a significant portion of their
budgets.
For more than 55 percent of responding EDOs that receive local funding, local sources
comprise between 81 and 100 percent of their budgets.
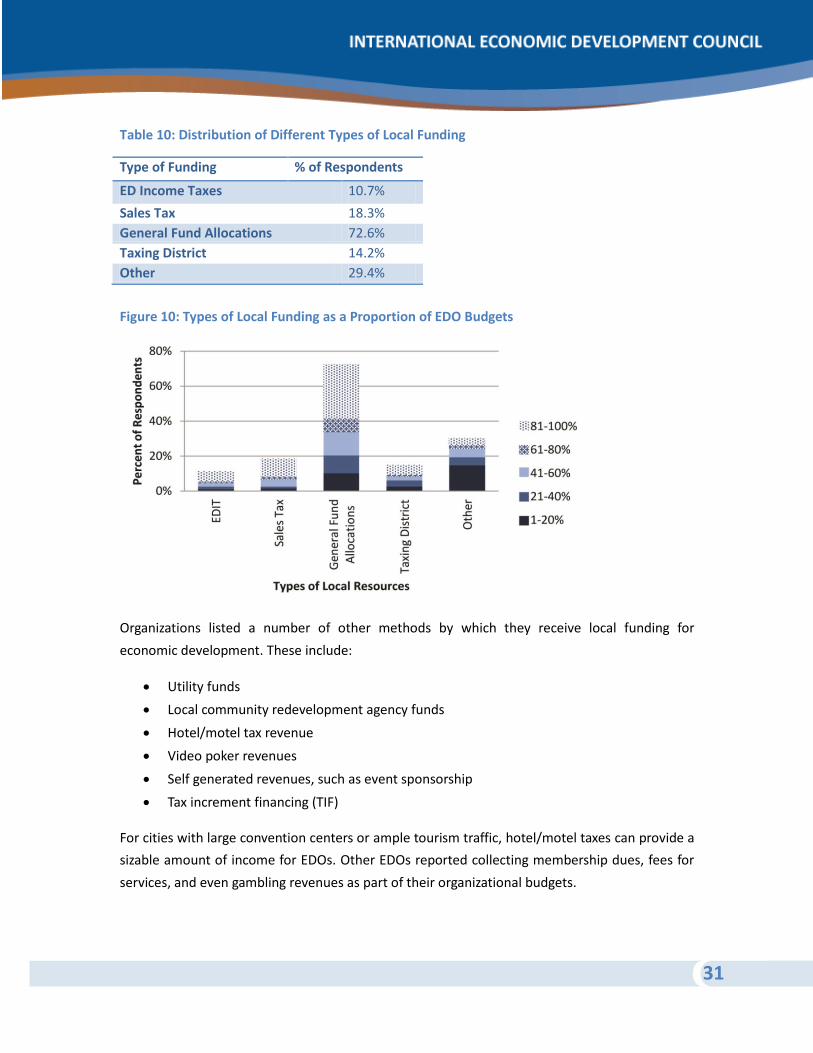
General fund allocations are the biggest source of local public funding for EDOs. Figure
10 illustrates that general fund allocations surpass all other forms of local financing.
In states that allow local option taxes for economic development purposes, such as
Texas, the option provides between 81-100 percent of the budget for over half the
organizations. More than 85 percent of the organizations attribute at least 40 percent of
their budget to local option taxes. Examples of states that allow local option taxes for
economic development purposes were discussed earlier under state funding.
31
Table 10: Distribution of Different Types of Local Funding
Type of Funding % of Respondents
ED Income Taxes 10.7%
Sales Tax 18.3%
General Fund Allocations 72.6%
Taxing District 14.2%
Other 29.4%
Figure 10: Types of Local Funding as a Proportion of EDO Budgets
Organizations listed a number of other methods by which they receive local funding for
economic development. These include:
Utility funds
Local community redevelopment agency funds
Hotel/motel tax revenue
Video poker revenues
Self generated revenues, such as event sponsorship
Tax increment financing (TIF)
For cities with large convention centers or ample tourism traffic, hotel/motel taxes can provide a
sizable amount of income for EDOs. Other EDOs reported collecting membership dues, fees for
services, and even gambling revenues as part of their organizational budgets.

32
Car Rental Tax funds 75% of Organization’s Budget
The Northern Kentucky Tri-County Economic Development Corporation (NKY Tri-ED) is a
nonprofit regional organization serving Boone, Campbell, and Kenton counties. They have
benefited from a car rental tax on short-term car rentals at the Cincinnati/Northern Kentucky
International Airport (CVG) since 1994.
From 1987-1993, the NKY Tri-ED had a budget of approximately $350,000. Working in
partnership with CVG leaders, NKY Tri-ED explored short-term rental car fees as a means for
funding economic development activities in the region. In 1994, legislation was passed by the
Kentucky General Assembly enabling a three percent tax on all short-term car rentals in Boone,
Campbell, and Kenton counties. The counties collect the funds and then reallocate the revenues
to NKY Tri-ED. Through an inter-local cooperation agreement among the three counties, all
revenues from the short-term rental car tax are shared with NKY Tri-Ed.
Since inception of the tax, NKY Tri-ED receives approximately $1.8 million annually, or
approximately 72 percent of its budget, from the car tax revenue. Boone County provides
approximately 95 percent of the tax revenues, where Cincinnati/Northern Kentucky
International Airport (CVG) is located. The funds may be used for economic development
purposes including staff, operations, and programs.
Over 40 percent of the organizations that receive local funding saw their local sales tax dollars
increase over the past five years, though they remained largely the same over the past two
years. As the economy recovers from the economic downturn and consumer spending picks up,
it is likely that local sales tax dollars will start increasing. Only 20 percent of respondents
reported that their sales tax dollars decreased over the last five years. The remaining 40 percent
indicated no change. Local income taxes dedicated to economic development, as well as special
taxing districts, remained largely unchanged over the last five years.
EDOs large and small receive significant local funding. However, it appears that the largest EDOs
(those serving areas with populations greater than 500,000) do not receive as much local
funding as their smaller counterparts. Rural and urban EDOs (as opposed to regional EDOs) also
receive more local funding. In contrast to federal and state funding, local funding tends to be
allocated based on ad hoc budget allocations from general funds rather than competitive grants.
The resources and skills that prove helpful for larger EDOs in attracting federal and state funding
may not give them an advantage over smaller EDOs when it comes to local funding.

33
Foreign Trade Zone: Supporting Economic Development in McAllen, Texas
Situated on the Mexican border, the McAllen Economic Development Corporation (MEDC) in
McAllen, Texas, manages the McAllen Foreign Trade Zone, a profitable industrial park that
contributes significantly to the MEDC organizational budget. The FTZ was established in 1973
but was not actively used until MEDC took over its operations in 1987, when the MEDC was
formed to serve as the main economic development agency for the city.
After assuming management, the MFTZ saw an increase in demand and occupancy. Eventually,
the companies moving into the zone began to demand third-party logistics assistance. In
response, MEDC created a separate company, FTZ Logistics, to assist companies within the
industrial park and in Mexico with third-party logistics. The newest entity to be established is
FTZ Intermodal, Inc., which is in the process of developing an intermodal park. The revenues for
MFTZ, FTZ Logistics, and FTZ Intermodal, Inc. all are reinvested in the individual entity first and
then revenues above budget are donated to MEDC.
These four entities function separately but are located in the same building, which is owned by
MFTZ. MEDC leases the space from MFTZ and pays rent on a monthly basis. As a way to save
overhead expenses, the receptionist, accounting department, management team, and
marketing department are shared. A contract created between the organizations to outlines the
division and percentage of salaries and benefits that are paid by MEDC and the FTZ.
The city continues to contribute to MEDC’s budget, as its interest in being involved in economic
development remains. However, as the city’s revenues decreased, its budget became strained
and some of the economic development funding shifted to other agencies. Over the past six
years, MEDC received a set amount of funding from the city and fills the holes with in-kind
contributions from the other entities. For example, a marketing program may be sponsored by
the FTZ as a contribution to MEDC. Currently, 15 percent of the revenues come from non-city
sources. The city of McAllen does participate in Texas’s local-option half-cent sales tax. Because
MEDC receives financial support from the three other entities, it is able to dedicate the half-cent
sales tax revenues towards training programs, infrastructure, strategic planning, and other
programs and projects.
The next section of the report covers private funding sources, trends, and examples of
communities and EDOs that have adapted their business models and practices to work better
with private investors.

34
III. Private Funding
Utilizing private sources represents a growing trend in EDO financing. Sixty percent of the
respondents reported receiving private funds for their EDOs. Economic development experts
agree that this finding represents a reversal of the traditional ratio of public-to-private funding
for economic development activities. A few decades ago, 70 percent of EDO funding came from
public sources and 30 percent came from private sources, whereas now the opposite is true.
Private funding sources range from in-kind contributions to fees for service and real estate
incomes. Nearly half of the organizations that collect private funding receive membership dues.
An equally large source of private support is in-kind contributions including, but not limited to,
staff time, office space, radio ads, legal services, etc. Figure 11 shows the distribution of different
types of private funding sources in EDO budgets. Just under 30 percent of EDOs receive private
funding from additional sources such as fees for service, royalties, and impact fees (Figure 11).
Figure 11: Utilization of Different Types of Private Funding
Examples of other kinds of private funding sources include:
Advertising, event, and project sponsorships,
Licensing of proprietary software,
Training fees,
Royalties, and
Impact fees.

35
Many organizations look to private sources to diversify funding streams as public funds decline.
It also requires EDO staff to become more proficient in private fundraising skills and delivering
programs and services that EDOs may not traditionally provide. Care must be taken when
deciding which private funding sources an organization should seek.
Fundraising Campaigns
Fundraising campaigns are events or projects dedicated to raising private funds for an EDO. They
are becoming more common given the increased focus on private funding sources. Campaigns
bring in funds annually or every two, three, or five years, depending on the organization’s needs.
Following the recession, many corporations are earmarking their contributions to nonprofits for
specific projects.
Recommendations on Fundraising
Create a strategic plan in advance of a fundraising campaign. It should be holistic and
focused regionally. Ideally, the plan should build on past fundraising efforts and expand the
scope to a reasonable extent.
Be very careful about who you reach out to for funding. It is critical to have true alignment
between the mission and objectives of the funder and your organization. For example,
although in some instances religious organizations have contributed to economic
development programs, their mission in creating jobs is usually different (i.e. focused more
on structurally under employed or unemployed people) than those of EDOs that tend to
focus more on high-skill jobs.
Ask for funds for specific initiatives. With funders conscious about where their money is
going and how it is used, general funding campaigns no longer work.
Include your board of directors as part of the campaign, especially top-level representation.
They will be able to ask their peers and colleagues for donations at a higher level.
When necessary, encourage a pay-to-play mentality. For certain levels of contributions, the
contributor can join the board of directors, leadership, or industry council.
Meet with your local utilities. Many utilities have funds set aside specifically for economic
development.
Do not be afraid to ask the unlikely funders. Hospitals, convenience stores, grocery stores,
media, car dealers, and newspapers are all potential funders. Madison, South Dakota, a
town of less than 7,000 people, received a $50,000 donation from a local Dairy Queen.

36
Establishing a Public-Private Partnership: Chesterfield County Economic
Development Alliance
Chesterfield County, South Carolina is a rural county with a population of 46,000. There are
eight towns located within the county, but there is no central town. The county operated an
economic development organization, but there were no EDOs at the local level. Instead, towns
had chambers of commerce and some tourism organizations. The strategic plan created with
local RDA funding recommended the county create an economic development alliance that is
funded by both the private sector and the municipalities. A feasibility study was conducted and
it was determined that there was enough proposed funding available for a five-year campaign
for a public-private partnership. The county council in a private meeting unanimously agreed to
the creation of an economic alliance for Chesterfield County.
The Chesterfield County Economic Development Alliance was created in 2012 as a 501(c)(3)
after two years of research and strategic planning. Over $1 million was raised during this two-
year fundraising campaign, which was enough to fund the new organization for five years. The
county economic development employees staff the alliance, which is governed by a board of
directors. As the organization is starting from scratch, they have created a pay-to-play scenario
where businesses who pay $10,000 per year and local chambers of commerce who invest
$5,000 annually receive a role on the board of directors. Each local municipality involved in the
alliance commit one person to participate on the mayors’ committee. From an established
mayor’s committee, one representative is chosen to participate on the board of directors. The
municipalities are the only public funds invested into the Alliance. The formula chosen was each
town would pay $1-$2 per capita based on population. When final, the board of directors will
consist of fifteen members.
Crowdfunding
Collaboration is changing the way businesses, projects, and programs are funded. Crowdfunding
is a financing strategy in which individual investors contribute varying amounts of money to fund
a project, program, or business idea. Multiple Internet platforms have sprung up to support
crowdfunding efforts locally, regionally, nationally, and even internationally. Expectations and
actual returns on investment vary by type and size of project.
There are two types of crowdfunding opportunities. Most commonly, a person or organization
makes a donation or pledge without expectation of significant monetary return. There are some
who prefer to be an investor, where they are able to invest up to $1 million annually.

37
Many communities and organizations are exploring different strategies for crowdfunding. Some
examples of crowdfunded projects include.5
• Fundraising for the Sister Cities Program in Los Angeles, California
• Economic Development Investment Fund in Sarasota, Florida raised funds to develop an
incubator in a building they purchased.
• Handmade in America in Western North Carolina supports programs that focus on artist
entrepreneurship, small town revitalization and infrastructure.
• Flint, Michigan’s Farmers Market raised funds to expand the market to two suburban
neighborhoods where many residents lack transportation.
• The arts community Springville, New York raised funds to open a coffee shop and
develop arts space to help revitalize downtown.
• Valentine, Nebraska raised funds to attract and support a movie to be filmed in the
community (as a marketing vehicle and to support a budding arts community).
Crowdfunding for economic development projects and programs is very new and untested.
Many communities and experts are experimenting with using crowdfunding to meet community
match requirements for federal grants.
Crowdfunding for Economic Development
Neighbor.ly, a Kansas City company, is a civic crowdfunding platform for municipal, county, and
metro-conglomerate governments; public-private partnerships; institutes; and private and
nonprofit organizations that are civically focused. Public projects can be listed on their website
for raising funds. Neighbor.ly engages actively in the fundraising campaigns and assures investors
that the contributions made through its platform will be used for the intended projects. It has
been successful in funding a number of projects to date and has several others open for
investment on its website. For more information, please visit www.neighbor.ly.
Another example of crowdfunding for economic development projects is Rally St. Louis. In
December 2011, an article from Forbes magazine, entitled “St. Louis Doesn’t Suck,” went viral.
The attention and feedback eventually led to a grassroots campaign called Rally St. Louis. The
campaign is building momentum locally by gathering or “crowdsourcing” ideas from local
citizens on what will improve the quality of life in the region and then crowdfunding the top
ideas for implementation. First, the public submits ideas and then has the opportunity to vote on
the ideas submitted. Each month, the three ideas with the most votes will be evaluated and the
5 Examples retrieved on November 15, 2012, from www.indiegogo.com.

38
next steps for implementation will be determined. These ideas will then move to a crowdfunding
platform, where the public can provide donations to help fund the projects. Projects that reach
funding goals will be implemented in the community with the funds raised. Local and regional
economic development organizations are participating on the board of directors. The campaign
is fairly young – the first call for ideas opened on November 14, 2012 and voting commenced on
December 1, 2012. For more information on Rally St. Louis, visit http://www.rallystl.org/.
In the following section, each private funding mechanism is discussed in more detail. Advice is
included for practitioners who want to add these as a part of their organizational budget.
In-Kind Contributions
Although in most cases cash is king, in-kind contributions are a valuable source of EDO support.
An in-kind contribution is any service, good, or property that is donated in place of a monetary
contribution. Leading examples include staff time and services (such as printing, postage, etc.).
Organizations should accept in-kind contributions when they match an item within their budget
or otherwise fits within the organizational mission. If the contribution is not replacing an item
located within the budget, the donation can lead to additional costs that negate the purpose of
the donation. Sometimes, in-kind donations can be made when a local firm is unable to
contribute to the EDO financially. For example, an engineering firm may be able to contribute
services instead of cash – but will only do so if asked.
Survey Findings
Almost 45 percent of EDOs receiving private funding accept in-kind contributions.
These organizations represent all types and sizes of communities.
All three types of organizations – public, private, and public-private partnerships –
receive in-kind contributions.
Almost 50 percent of PPPs receive in-kind contributions as compared to less than 35
percent of private organizations. Even public organizations, although only 7 percent,
indicate receiving in-kind contributions.
As shown in Figure 12 below, for most responding organizations (70 percent), in-kind
contributions account for less than 20 percent of their budget.
About 10 percent of organizations rely on in-kind contributions for 80-100 percent of
their budget. These were primarily organizations operating in smaller communities with
populations under 200,000.
Levels of in-kind contributions largely stayed the same over the past five years and the
past two years.

39
Figure 12: Distribution of In-Kind Contributions as a Percent of EDO Budgets
According to the survey, organizations currently receive the following types of in-kind
contributions.
Media and news services
Printing
Website
Offices
Phones, computers, and other office equipment
Internet service and free Wi-Fi for visitors center
Meeting space
Advertising and marketing services
Professional services such as legal, auditing, engineering, and accounting
Vehicle usage, airline tickets, and hotel rooms
Food and beverage services
Country and health club memberships
Business consulting and consulting fees
Time—advisory boards, volunteering, interns, and staff
Event sponsorships
Gift certificates and promotions
Educational trainings and colleges
Organizational membership dues
Research trades

40
A Wealth of Resources and Services: Utility Companies Offer In-Kind
Contributions
Most U.S. utility companies promote economic development efforts in their service areas. These
initiatives vary by company but may include grants, sponsorships, memberships, and services. A
number of utility companies also have economic development departments with staff available
to work with local economic development organizations.
Many of the economic development services that utilities offer can be included as in-kind
contributions to replace items already in your budget. Your local utility may offer the following
services.
Community profiles
Industry studies and research software
Engineering services
Shovel-ready certification
Available property and spec building databases
Visualization and presentation technologies
GIS databases, site optimization software, and workforce analysis
Strategic planning facilitation
Transportation and logistics studies
Customized research services
Preparation of Request for Proposals (RFPs)
Coordination of site visits and meetings
Developing mailing lists and prospect research
Photographic renderings and 3-D models
Workshops and special programming
Business retention and expansion services, including visits and sample surveys
Leadership training
Community assessments
Tourism development tools
Membership Dues
Dues allow key stakeholders to contribute to, and benefit from, membership organizations.

41
Survey Findings
Over 40 percent of the respondents receive membership dues.
They are among the largest sources of private funding for EDOs.
They also tend to make up a significant portion of the budget: 60 percent of
organizations reported that between 20 and 60 percent of their budget comes from
membership dues (Figure 13).
Figure 13: Distribution of Membership Dues as a Percent of EDO Budgets
Setting a membership dues structure that all members are satisfied with, however, can be tricky.
Organizations must ensure that all paying members feel that they make an equitable
contribution and receive just benefits in return. In many organizations, members with larger
budgets and operations pay a higher rate than members smaller in size. In such instances, it is
crucial to use certain common criteria to determine the dues structure. According to Steve
Carey, CAE, at Associations Now magazine, commonly used criteria include total revenue, total
sales, units of production, number of employees, number of plants, total assets or square
footage, payroll/salary, and total income. Other categories to consider are total population,
percentage of budget, and type of organization.
Those charged higher rates typically receive additional benefits. Some organizations charge
private businesses or consultants higher membership dues because of their business interests.
Unfortunately, there is no standard formula to use in setting membership dues. Rates are
typically established after trying various formulae and relying on trial and error.
Dues also can be structured so that all members contribute the same amount to the
organization. When the base rate is the same, organizations tend to feel they are getting equal

42
treatment. This can be especially useful when organizations choose to offer the same level of
services and benefits to all members, or where there could be issues with one member paying
more than another member in the same industry or among competitors.
It is important that organizations clearly describe what benefits are received at each level of
membership. It is equally important that EDOs offer only those benefits that they are capable of
delivering, and also delivering everything that’s promised. Benefits may include a position on the
board of directors or leadership committee; a regular newsletter with potential advertisement
space; and access to educational programs, technical support, and expertise.
When setting the amount of dues to be collected, it is important to figure out what non-dues
income the organization will receive through other sources to cover expenses and contribute to
a reserve fund.
Inevitably, there comes a time when dues must be increased to meet inflation rates. When
considering increasing dues, communicate clearly, early in the process, and give members the
opportunity to provide feedback. Be sure to use multiple communication vehicles to ensure you
are reaching all of your current members. With dues increases, it is essential that membership
benefits do not decrease. For relatively large dues increases, organizations should increase the
benefits so that members see the increase as justified and adding value.
Foundations Grants
Foundations are typically regulated in the United States by the IRS under section 501(c)(3) of the
tax code. Organizations must use the grants to further a cause that provides a public benefit and
not serve private interest. Although economic development is not included within the tax code,
many economic development activities fit clearly within the tax code descriptions:6
Relief of the poor and distressed or the underprivileged;
Advancement of education and science;
Erection or maintenance of public buildings, monuments, or works;
Lessening of the burdens of government; and
6 Nober, Jane C. “Economic Development: A Legal Guide for Grantmakers”. Council on Foundations, Washington DC
page 5.

43
Promotion of social welfare by organizations designed to accomplish any of the above
purposes or…to lessen neighborhood tensions…eliminate prejudice or discrimination…or
to combat community deterioration.
Survey Findings
Foundation grants comprise the smallest portion of private funding for EDOs. Only 20
percent of the respondents said they receive foundation funding.
For two-thirds of these respondents, it comprises less than 20 percent of their budget
(Figure 14).
Fundraising experts point to a growing trend among EDOs to change their designation to
501(c)(3) status in order to be eligible for foundation grants. Although 501(c)(6) organizations
are also eligible for grants, many foundations only provide grants to 501(c)(3) organizations.
Figure 14: Distribution of Foundation Grants as a Percent of EDO Budgets
Foundation funding has declined since the recession. Over 40 percent of the respondents report
a decline in the past two years. In comparison to the past five years, an equal number of
respondents (37.5 percent) indicated an increase and decrease in foundation funding. As interest
on investments sharply declined during the recession, many foundations had to curtail their
grant-making activities. As the economy improves, it is likely that foundation funding will bounce
back.

44
Types of Foundations
Foundations typically fall into one of six different categories. While there are many similarities
among the types of foundations, each has distinguishing characteristics. Below is a broad
description of the different types of foundations found in the United States.
General purpose foundations (also known as independent foundations) – General
purpose foundations are considered the industry standard. General purpose foundations
are nongovernmental nonprofits with a board of directors’ governance structure and a
large, trained professional staff. They mostly include the larger well known foundations
that have relatively few grant-making restrictions. Typically, they provide 50 percent of
all grants awarded annually.7 Examples of general purpose foundations include the F.B.
Heron Foundation, Kellogg Foundations, and Ford Foundation.
Family foundations – Family foundations make up majority of the private foundations in
the United States. Families set up the foundations with funds mostly derived from
members of their family through gifts or bequests. The family members often serve on
the board of directors or as officers and take a significant role in making grant decisions.
Typically, these grant decisions reflect the interests of the family and go to programs or
causes of their choice. While majority of family foundations are small and informal
organizations, they can vary in size, grant-making interests, and style of organization.
Legally, these foundations are similar to general purpose foundations. Examples of
family foundations include the Bill & Melinda Gates Foundation and the Z. Smith
Reynolds Foundation.
Community foundations – Community foundations tend to be supported and operated
within a set geographical area (e.g., a city, region or state). Traditionally, these
foundations address local needs and provide community leadership. Community
foundations are typically created as a public endowment with many donors. The
structure can include a cluster of smaller funds that are named for individual donors and
may be dedicated to specific purposes. While community foundations may be classified
by the IRS as private foundations, the majority are public charities that raise significant
funding from the public. Examples of community foundations include the Cleveland
Foundation, the Calhoun County Community Foundation, and the Maine Community
Foundation.
7 Illinois Department of Human Services. (n.d.) Funding Tips-Types of Foundation. Retrieved on August 12, 2012, from
http://www.dhs.state.il.us/page.aspx?item=4806

45
Corporate foundations – Corporate foundations are separate legal entities that
businesses use for philanthropic giving and for promoting corporate citizenship. These
foundations are typically structured with board of director governance that may include
members of the corporation board, contributions committee, other staff members, and
members of the community.
Corporate foundations typically make grants in the communities where they have
operations. The corporation funds them via a system called “pay in and pay out.” At
times when profits are high, the corporation will donate more money than the
foundation disburses. When corporate profits are low, foundations typically maintain or
decrease their grant amounts.
Corporate foundations are similar to corporate giving programs, yet are regulated as
private foundations. Corporate giving programs are administered through the corporate
affairs, marketing, public relations, or human resources offices and go directly from the
company to the nonprofit. They also are more closely tied to a company’s profits and are
not held to the same reporting standards as a foundation. Corporate giving is part of the
company’s operational budget and is not tax deductible. Some corporations will have
both a foundation and a corporate giving program, as corporate giving programs have
more flexibility than foundations. Examples of corporate foundations include Wells Fargo
Foundation, Verizon Foundation, and Lowe’s Companies Foundation.
Special purpose foundation – Special purpose foundations are similar to independent
foundations except in that they limit their grants to a specific field of research or a
particular activity. An example is the Susan G. Komen for the Cure foundation for breast
cancer.
Operating foundations – Operating foundations are more common in Europe than the
United States. Rather than making grants to other institutions, they typically fund their
own research and activities. There are two types of operating foundations. The first type
is a financial endowment that uses proceeds to support programs, projects, and
activities, such as the Russell Sage Foundation. The second type includes non-monetary
foundations such as private museums, hospitals, private universities, and research
institutes such as Johns Hopkins University. Their grants may include in-kind
contributions of land or works of art, for example.

46
Expert Advice for Applying for Corporate Foundation Grants
Nancy Williams, former director of national giving programs for the Verizon Foundation,
provided the following advice for organizations seeking grants from private foundations.
Make sure the foundation’s mission is aligned with your organization’s mission. A
foundation may give grants only in certain focus areas. For example, the Duane Reade
Charitable Foundation’s mission is to improve the quality of healthcare in New York. The
foundation’s website should provide its priority giving mission.
Carefully research the foundation before submitting a grant request. The grant proposal
should match the foundation’s area of interest and relate to the foundation.
Always check the foundation’s position on making contact. It is always helpful to make a
connection at the foundation with someone who can answer questions and check the
status of the application. Historically, foundations were relation-based organizations.
However, organizations increasingly are applying to foundations without making contact
first. It is important to note that a relationship with the foundation does not guarantee a
grant.
The description of the project should be well thought out and described. It is not enough
to say that a project is focused on education and therefore connected to the
foundation’s mission in supporting education initiatives. Detailed information provides
the reviewer a clear picture of the project and how the funds will be spent.
Always provide a method to measure results of the grant, even if the application does
not request benchmarks. The project needs to be measurable and show an outcome.
Some organizations are more focused on benchmarks than others.
When completing the application, address: (1) what the project is; (2) why the
organization is committed to the project; (3) what the projected outcomes are; and (4)
why the organization is asking for money. Always be clear on what activities and
expenses the grant will fund. Having a plan first will help answer these questions.
It can be helpful if one of the company’s leaders or employees is on your organization’s
board of directors.
It is okay to reach out to several foundations, businesses or corporations for financial
support for a project. Be creative in identifying potential funding partners for a project.
Charitable Donations
Some economic development organizations can accept charitable donations from private
contributors. Charitable donations – which are monetary, as opposed to in-kind contributions –

47
typically, can be deducted from the donor’s personal or organizational taxes. However, in order
for an organization to accept charitable donations, it must be set up as a tax-exempt nonprofit
per the IRS. For EDOs, this is typically the 501(c)(3) designation, though other types of nonprofit
designations – such as 501(c)(4), 501(c)(6), and 501(c)(12) – also can accept charitable donations
to varying extents.8
Survey Findings
Almost 30 percent of the organizations surveyed receive charitable donations as a part
of their budgets.
While they account for less than 20 percent of the budget for almost half the EDOs,
about one-third of the organizations report that 20 to 40 percent of budget comes from
charitable donations, and 80 to 100 percent of the budget for more than 10 percent of
the organizations (Figure 15).
Charitable donations have stayed largely the same in the past five years and the past
two years.
Figure 15: Distribution of Charitable Donations as a Percent of EDO Budgets
Fiscal Sponsorship
If an EDO wants to accept charitable donations but does not have a tax-exempt status, donations
can be routed through a fiscal sponsor. A fiscal sponsor is a 501(c)(3) organization that agrees to
accept charitable donations on behalf of a project or organization that is not tax-exempt. The
8 Louthian, R. & Friedlander, M. (1992). ECONOMIC DEVELOPMENT CORPORATIONS: Charity Through the Back
Door. United States Internal Revenue Service. EO CPE Text. Retrieved from: http://www.irs.gov/pub/irs-
tege/eotopicg92.pdf

48
sponsor assumes responsibility for the legal and administrative aspects of the project. By law,
the sponsor cannot be used as a pass-through organization. The sponsor can charge an
administrative fee to the project for its services.
The benefit of a fiscal sponsorship is that a fledging organization can concentrate on building its
programs and services without the administrative infrastructure. Organizations can raise money
immediately through fiscal sponsorship without awaiting their 501(c)(3) designation. Some
organizations retain a fiscal sponsor to accomplish their goals without becoming an incorporated
entity as their permanent funding structure. The downside is the project surrenders some of its
administrative decision-making and may be absorbed into the sponsoring organization.
According to a Tides Center field scan, the projects may have the following types of missions.9,10
Arts and culture
Environmental/sustainable growth
Youth development
Education/training
Human services/social services
Economic opportunity/community economic development
Social justice and political advocacy
International development
Transportation
Disaster relief
Festivals and events
The Work Around: Fiscal Sponsorships for Northeast Indiana Regional
Partnership
Northeast Indiana clearly has roots in the history of the Midwest’s “rust belt.” The region has
experienced business closures including the loss of headquarter operations. However, what
remained was a leadership and entrepreneurial legacy of the former headquarter executives.
Many leaders from the chief industries decided to remain in Northeast Indiana and either
started or purchased companies. As a part of the culture of giving back to the community, many
9 Based in New York City and San Francisco, The Tides Center is a non-profit organization that work and support
American non-profit infrastructure and social service delivery. They have fostered fiscal sponsorships for over 230 groups
in the United States. www.tides.org 10
Green, R., Kvaternik J., & Alarcon, I. (2006) Fiscal Sponsorship Field Scan. San Francisco: LaFrance Associates, LLC.
Retrieved from http://www.tides.org/fileadmin/user/pdf/WP_FiscalSponsorFieldScan.pdf.

49
of the individuals started private foundations. The private and community foundations in the
region have combined assets of over $1.5 billion and make charitable contributions of
approximately $102 million.
The Northeast Indiana Regional Partnership (NIRP), located in Fort Wayne, Indiana, represents
10 counties with an approximate total regional population of 700,000. At its creation in 2006 as
a regional marketing organization, their funding goals were to receive 50 percent of their
funding from the private sector, 30 percent from foundations, and 20 percent from the public
sector.
As part of the creation of NIRP, the founders began a fundraising campaign raising over $2
million from the local private foundations as individual contributions in growing business
investment and the economy of the region. The founders of the organization had expected that
the funds will be used directly to support regional marketing efforts. However, in working with
their legal counsel, the founders realized that the IRS will not view these are charitable
donations. Instead, the foundation investments were best utilized to build the capacity of the
region for economic development. In response, the founders created the Northeast Indiana
Fund (Fund), a separate 501(c)(3) organization to support NIRP and complement their efforts to
grow the region. The founders were able to repurpose a previously inactive 501(c)(3) IRS
designated organization identified within the region. By repurposing an inactive IRS designation
and tying it to the regional partnership, it saved them time and resources in developing the
fund.
The fund is fully funded through charitable investments from foundations. Initially, the fund had
narrow purposes such as third party vendor data and charitable research. Eventually, the fund
expanded its services to include educational forums and strategic initiatives. The fund also
provides grants to local economic development organizations within the region. A list of projects
completed can be found at http://www.neindiana.com/about-us/northeast-indiana-fund. All
uses of investments in the fund must be used for capacity building. NIRP continues to focus on
maintaining 30 percent of their funding from foundation grants, which are directed through the
fund.
Fee-for-Service Contracts and Management Fees
Like the name suggests, fee-for-service contracts allow EDOs to charge a nominal fee for services
provided. They typically work for organizations that have the staff resources to administer
additional services and programs.

50
Survey Findings
About a quarter of the respondents reported using such funding mechanisms for their
EDOs.
For close to 70 percent of such organizations, less than 20 percent of their budget is
attributed to these additional services (Figure 16).
Over one-third of the respondents indicated an increase in fee-for-service contracts and
management fees over the past five years and two years. EDOs are trying new and
creative ways to support their economic development activities.
Figure 16: Distribution of Management Fees as a Percent of EDO Budgets
According to the Understanding Fee-for-Service Models white paper, sponsored by the U.S.
Department of Health and Human Services, there are four major types of fee-for-service models:
mandatory fees, voluntary donations and requested fees, membership programs, and hybrid
approaches.11 Each of these is described below in further detail.
Mandatory fees – These are predetermined fees that an EDO charges for services
provided. When an EDO acts as an administrator or manager for another organization,
facility, or program, they may be referred to as management fees. Such fees may be
charged for managing programs such as:
11
Compassion Capital Fund National Resource Center. (2011). Understanding Fee for Service Models. United States
Department of Health and Human Services, Office of the Administration for Children and Families, Office of Community
Services. Retrieved from http://strengtheningnonprofits.org/resources/guidebooks/Understanding_Fee-for-
service_Models.pdf

51
‒ Loan programs (e.g., revolving loan funds, small business loans, equity investment
funds),
‒ Industrial bond financing programs,
‒ Community Development Block Grants (CDBG),
‒ Tax abatement programs, and
‒ Other organizations or programs in the community, such as the downtown business
association or industry-focused groups.
Voluntary donations and requested fees – As a segue into charging for services –
especially new services or programs in which demand may be untested – EDOs can start
by offering services on a voluntary payment basis. Customers are informed of the costs
related to the delivery of the service or program and a donation or fee is requested, but
payment is not mandatory. Relatively few examples exist of EDOs taking such an
approach.
Membership programs – Services and programs are tiered and fees are charged based
on those categories of service. Membership dues structures are discussed in detail
earlier in this paper.
Hybrid approaches – This blends two or more of the approaches mentioned above.
Fee-for-service contracts are increasing in use among EDOs. Examples include:
Providing market research services to local entrepreneurs to help them grow their
business as part of an economic gardening strategy;
Grant-writing support to community organizations that may not have the resources or
capacity to undertake such work;
Business consultation; and
Marketing and advertising support to local businesses.
Many EDOs subsidize costs related to the delivery of these services by seeking grant funding or
supplementing with public funding.
Perhaps the most common example of fee-for-service contracts in economic development is
when local governments contract with a nonprofit economic alliance or a chamber of commerce
to perform economic development services. The contracts for these services usually are
approved by the local governing body (e.g., city council or county commission). These contracts
are typically short-term and must be renewed annually or with a change of elected officials.

52
Adapting to Thrive: Southwest Michigan First
Southwest Michigan First (SMF), the regional economic development agency for eight counties
comprising the southwest Michigan region, was established in 1999 to help create wealth and
jobs in the community. SMF originally depended heavily on public funding. Recognizing a
number of shifts happening all around, ranging from overall decline in public funding to lower
foundation revenues and weak economic situation of the State of Michigan, the organization
leadership realized that it was no longer feasible to be dependent on public funding. The
recession further pushed SMF to look for other models to reinvent their organization.
The organization viewed one such opportunity to be in the funding models created by high
growth church associations such as the Willow Creek Association based in the Chicago suburb of
South Barrington, Illinois. The subject of a Harvard Business School case study, Willow Creek’s
strategies include being consultants and service providers to both faith based groups as well as
other companies. It now serves as the model for similar faith-based groups around the globe.
SMF saw an opportunity in providing affordable consulting services, which would leverage skills
and capacity already in house. In a mid-tier, small metro region, it is often not easy to find an
affordable consultant. Local businesses and organizations across the region faced this challenge.
There are few consultants in the region and the costs to bring an outside consultant can be
prohibitively high. In response to the demand, SMF started offering consulting services at
competitive rates. These services include developing marketing materials and other creative
services; diversity training; growing, consulting and mentoring small businesses; developing and
offering training for leadership development; and helping companies acquire research data on
specific areas. Many of the services are offered for a fee in addition to the traditional economic
development services.
The profits from the services are reinvested into the organization. As a result, the organization
has managed to reduce their dependence on public funding to less than one percent. SMF has
chosen not to geographically restrict these services. Staff provides consulting services and
speeches across the nation.
Showing Return on Investment: Fee-for-Service Contracts in Laramie, Wyoming
Laramie, Wyoming (pop. 30,816) is the county seat for Albany County and home to the
University of Wyoming. Laramie Economic Development Corporation (LEDC) is a nonprofit
organization responsible for economic development initiatives for the city of Laramie and

53
Albany County. LEDC is funded through contributions and sponsorships from local businesses,
grants, and fee-for-service contracts.
Like many organizations, LEDC’s public funding depended on annual renewals, with separate
negotiations with each major investor. Public investors – the City of Laramie, Invinson Memorial
Hospital, and the University of Wyoming – demanded accountability and transparency for their
investments.
In 2009, after several years of working with the city manager, the city and LEDC signed a
contract to recognize LEDC as the economic development arm for the city. The contract outlines
that LEDC is responsible for encouraging economic development activities within the city,
market the city and region to attract and retain businesses, maintain generally accepted
accounting procedures and practices for the funds, and provide an annual written financial and
transaction report of the uses made of the funds received. This annually reviewed contract
allows LEDC to work closely with the city’s planning and administrative departments. In order
allay concerns about accountability and transparency, the organization provides an annual
report and regular financial reports to the city council.
When Invinson Memorial Hospital heard about the contract between LEDC and the City of
Laramie, the board of directors started exploring ideas of developing a separate contract. The
hospital knew that some of its administration and medical staff did not understand marketing
and investment. Through a three year contract, LEDC conducts return on investment modeling
and provides other business services to the hospital.
Lastly, LEDC created a memorandum of understanding (MOU) with the University of Wyoming
after the university showed interest. LEDC helps recruit and support business for the university
operated incubator, helps businesses who graduate from the incubator find spaces to locate
locally, and assist business directly with finding employees. In exchange, LEDC charges the
University for its Services. LEDC in becoming more engaged with the university and participates
on board of directors and other panels. The MOU is valid for three years and is not guaranteed
to be renewed.
Currently, LEDC does not have any private fee-for-service contracts. LEDC does not want to
create any exclusive agreements with private sector members that can potentially exclude or
compete with other members.
54
Contract Services for Research: Anchorage Economic Development Corporation
Anchorage Economic Development Corporation (AEDC) is an economic development
membership organization in Anchorage, Alaska (pop: 300,000). The organization has relied on
municipal government funding for up to 45 percent of its budget in the past. Today, less than 18
percent of their budget comes from the local government and less than five percent from the
state.
In 2011, the City of Anchorage approved a grant to provide seed money for AEDC to hire a
researcher to update the city’s demographic information. As part of the contract, AEDC was
required to find additional funding to sustain the position in the long-term as well as annually
update the city’s demographics for no cost.
In January, 2012, AEDC began to offer research services on a contract basis as a strategy to (1)
provide an additional service for their members; (2) meet a broad range of internal needs, and
(3) increase private revenues while not competing with members through a niche service. The
organization hired a recent graduate with a master’s degree in urban planning who wanted to
return to Anchorage to work as the research coordinator. It is important that the organization
has the right tools in place before offering such services.
The coordinator completes general research for free for members and prospective companies.
More in-depth research is completed for the hourly rate of $100 an hour for a maximum of 50
hours worth of research as AEDC does not want to compete with local members who provide
specialized research services.
Once the research demands exceed that threshold, the coordinator contracts the research out to
local firms to competitively bid on the project. The coordinator manages the research on behalf
of the client for a management fee and ensures the work provided by the research firms is
efficient and a high quality product.
It was important to build a relationship with the research firms and reassure them that AEDC
was not trying to compete; rather, it was providing new opportunities to contract.
In the first year, in addition to the City of Anchorage, AEDC received contracts from Alaska
International Airport and some local companies. For the second year, AEDC is working on
finalizing some larger projects. AEDC is on track to generate the revenues needed to sustain and
grow the position.

55
Real Estate
Economic development organizations can leverage opportunities in real estate to simultaneously
drive job creation, revitalize abandoned and/or blighted areas, and finance their operations.
Survey Findings
Almost 25 percent of the respondents utilize real estate as a funding mechanism for
their organizational budget.
Nearly 35 percent of the organizations indicate that 80-100 percent of their budget
comes from real estate (Figure 17). Several EDOs are structured solely around real estate
activity in their communities and are heavily involved in all stages of the real estate
process from land development to project/development management, construction
management, and leasing/rental management.
Figure 17: Distribution of Real Estate as a Percent of EDO Budgets
Although the real estate market was severely impacted during the Great Recession, survey
results indicate that income from real estate investments either increased or stayed the same for
the majority of the respondents both before and after the economic downturn. Less than 20
percent of the organizations indicate a decline in real estate income before and after the most
recent recession.
Land can be acquired in a variety of ways including donation, purchase, eminent donation, and
condemnation. Organizations can sell the land for a profit to benefit local economic
development or can develop the land for a return on investment. In case of latter, organizations
can charge fees to manage the design, construction, lease, or sale of the property.

56
Some communities benefit from a turnkey building available for sale to potential companies
looking to relocate or expand. This model is often seen in industrial parks. Other organizations
can earn a better return on investment by retaining, leasing, and managing the development.
This model is often seen in incubators and commercial centers. The extent to which the EDO is
involved in the real estate process is determined by local factors.
Many EDOs are involved in the development and management of public facilities such as
convention centers, performing arts centers, arenas, and stadiums. As job generators, economic
development organizations may manage, lease, or be affiliated with the facility. This role may
lead to additional revenue to fund economic development initiatives.
Addressing Challenges, Gaining Revenue: Union County Development
Association
Union County, Iowa is centrally located between Omaha, Nebraska and Des Moines, Iowa. It is a
small community with a population of just over 12,500. Union County Development Association
(UCDA), a 501(c)(6) organization, manages the economic development efforts for the county.
Their budget is comprised of three main sources of revenues: one third public funding, one third
from private investors, and one third from real estate assets generating revenue.
The umbrella of services offered by UCDA (formerly the Creston Development Company – CDC)
is a response to local conditions, a story that is common in many rural communities around the
country. In addition to performing the traditional economic development functions, UCDA also
serves as a developer of public housing and leases industrial properties. Being a small
community, and the nearest urban center (Des Moines) located over an hour away, Union
County faced significant challenges in attracting real estate developers to build decent housing
for middle management in existing businesses. Options for low-income housing were also
limited. Inadequate housing stock could have severely impacted their ability to retain talent and
hinder local business growth.
Recognizing this challenge, the CDC started purchasing and assembling land to be developed
into housing for local businesses. This resulted in a housing development with 54 lots, of which
only ten remain for sale. When UCDA was established in 1997, the land was transferred to them
and became an asset for the organization, as the sale of land has generated significant revenues.
Even though UCDA owned the land, gathering funds to pay for public housing was not an easy
task. A tax increment finance district was created to pay for the development. Additionally, in
partnership with the local utility, a deal was agreed upon for the local utility to lay the
infrastructure in return for a percentage of the profit when the land is sold – an example of their

57
outside-the-box thinking. UCDA is now working with the local carpentry program at the
community college to build the houses on the vacant lots.
After witnessing the success of this housing development, the City of Creston, Iowa is working
on a similar development with 72 lots with assistance and support from UCDA. For the new
development, the plan is that UCDA will collect a service fee on the sale of each lot and in return
will provide all marketing efforts and act as the covenant review committee for the new
subdivision.
UCDA also owns and leases industrial properties. It served as the landlord when two local were
unable to purchase their building. The businesses now occupy the building through long term
leases with UCDA. Similar models can be found in Lenox and Fairfield, Iowa.
How a Redevelopment Authority Became Self-Sufficient: City of Corry and Erie
County, Pennsylvania
Corry is a small community with a population just under 6,000 in northwest Pennsylvania. It is
the second largest city in Erie County. There are currently four organizations that work together
on economic development efforts within Corry and more broadly, Erie County: the Erie County
Redevelopment Authority (ECRDA), the Redevelopment Authority of the City of Corry (RACC),
the Corry Area Industrial Development Corporation (CAIDC), and the Corry Industrial Benefit
Association (CIBA). CIBA was established as a 501(c)(3) to receive donations for the
organizations. All four organizations are fully self-sufficient.
In 1990, Corry Industrial Center opened as a full-service incubator within an industrial park. The
industrial park was part of an enterprise zone, which made the incubator eligible for grants from
the state and federal government to create a revolving loan fund, which were provided through
RACC. The organization used the grants to make loans and received interest payments from the
loans. Upon repayment, the funds are repurposed to make new loans. The fund grew with
interest payments on the loans. Eventually, the redevelopment authority of the City of Corry
stopped requesting grants from the state and federal government. In 2003, ECRDA applied and
was approved to expand the enterprise zone to cover all industrial and commercially zoned
areas in Erie County excluding the cities of Corry and Erie. As a result, a new revolving loan fund
was created through grants from the state and federal government. The county redevelopment
fund also uses the interest from the revolving loan to pay for organizational operations. Through
an industrial bond, the county provided a onetime payment of $8 million towards the revolving
loan fund. Interest rates for the loans are set by the current market. The community has a less

58
than one percent default rate. As part of the loan process, RACC works with the company to
help ensure they do not default on the loan, even if that means providing a grace period or
working together to develop a plan that enables the business to repay.
Another source of revenues for the redevelopment organizations is the leasing of real estate. As
the companies within the Corry Industrial Center grew, it quickly became time for the first
businesses to graduate from the incubator. In an effort to help them relocate locally, RACC
obtained a vacant building. The property was leased to a manufacturing tenant for a period of
ten years at market rate, and after ten years, it sold for one million dollars. As part of the
contract to purchase the building, the owners were asked to donate ten percent of the sales
price back to the CIBA. After the first building, RACC has obtained, leased, managed, and sold
several other properties, gradually building a real estate portfolio exceeding 500,000 square
feet. The organization typically requests the buildings as a donation to the community whenever
possible though has paid up to the appraised value for a building. In return, RACC provides to
local businesses triple net leases at market rate. For some businesses, this provides an
opportunity to make improvements to the building as a tax write-off rather than amortize
depreciation. Real estate has shown a direct link to the revolving loans, which in turn provides
revenues for the organization. RACC receives a majority of its funding from interest on loans
than on real estate sales and leases. In less than 20 years, the organizations have grown from an
asset value of $1 million to just over $30 million, while keeping a small staff of five people
extremely busy.
Interest on Investments
Much like the concept of using the collection of equity shares as a funding source, economic
development organizations use interest collected from financial institutions and lending
mechanisms to fund their budgets. When depositing money into a checking account or putting
reserves into a Certificate of Deposit (CD), money market, or pension account, organizations are
taking advantage of the interest rates provided by the financial institution.
Survey Findings
Almost 30 percent of the respondents gain interest on their investments that is
channeled back into their budget.
Although not a significant source of funding for most EDOs – 80 percent of the
organizations reported that interest constitutes less than 20 percent of their budget – it
provides precious funds that the organization can utilized in any way (Figure 18). Grants,

59
loans, and several other types of funding typically need to be dedicated towards specific
programs and services, but interest on investments are much more flexible.
Interest on investment income started declining deeply even before the onset of the
recent recession and has not bounced back in the past two years.
Figure 18: Distribution of Interest on Investment as a Percent of EDO Budgets
Organizations can also get creative to maximize their income from such sources. In response to
the survey, the Development Corporation of Abilene, Inc. in Abilene, Texas noted that the
organization pools its reserves with other municipal reserves to obtain a higher interest rate. By
strategically investing their funds, organizations are able to secure a considerable return on
investment to finance their operations.
When economic development organizations become lenders themselves through revolving loan
funds and other small business financing programs, they receive interest payments with
repayment of loans. These interest payments are then being used to finance the operations of
processing the loan program. Federal community development block grants can be set up with
repayment to ensure a small interest rate is included in most transactions. The Greenville Area
Development Corporation in Greenville, South Carolina delayed the disbursement of pass-
through grants to earn interest payments to support their budget.
Other Sources of Revenue
Other sources of revenue for EDOs include:
Application fees for programs such as a facade improvement programs.

60
Special events like fundraising campaigns for economic development efforts. These
events such as a wine tasting, golf outing, and lunch with an elected official provide
registration fees that provide revenues to the organization. Along with registration fees,
a number of organizations receive sponsorships for the events that contribute to their
budgets.
Workshops, classes, and training programs are also providing additional funds through
registration fees and sponsorships.
Creating a Revenue Generation Cycle: Kahnawake Economic Development
Commission
In many instances, EDOs need to be managed like a business with an acute focus on revenue
streams. Kahnawake is home to approximately 8,000 aboriginal people, who are part of the
Mohawk Nation, located south of Montreal in Québec. The Kahnawake Economic Development
Commission’s (KEDC) success comes from developing a revenue generation cycle such that
revenues from one project are invested into future projects, while supporting the overall
economic development strategy on the reservation.
The initial challenge in creating a revenue generation cycle was obtaining the startup capital. The
tribe transferred 50 percent of their data center to KEDC along with the responsibility to manage
the business. KEDC used the income generated from this operation to invest into two
commercial buildings. A portion is currently being invested in a wind farm. They also lease two
cell towers and three billboards, which generate close to $90,000 annually, and help pay for
internships for college students along with scholarships. KEDC created a virtuous cycle to
develop new products. With an entrepreneurial mindset, their success has been based on not
trying to do too many projects at one time; rather building up each project one at a time.
In summary, below is advice from consultants and experts on using different types of private
funding streams.
Expert Advice on Private Funding Sources
Organizations should seek in-kind contributions for costs or services already included in their
budgets, such as requesting an engineering firm to provide some services for free if the
services will be undertaken in the next fiscal year. Items that can benefit from in-kind

61
contributions should be identified and included in fundraising campaigns from the
beginning.
Develop local industry councils where members of the local industry (ex. manufacturing)
have to pay to play.
Organizations that have highly qualified research staff can charge for research projects and
data.
Make sure the foundation grants match the organization’s mission.
Those organizations that rely on sale of real estate property for income should make sure
that it comprises only a small portion of their budget. Once the asset is depleted through
sale, the organization is left to either look for other resources or purchase more.
For cash-strapped city councils and communities, fee-for-service contracts allow them to
offer economic development programs and services locally by outsourcing key components
to other EDOs on a contract basis. Such arrangements tend to be more common at the
county and city levels.
Corporate giving is often now managed through a foundation arm that is setup to manage
grants. In many cases, such foundations give out grants only to 501(c)(3) organizations, and
EDOs are changing their legal status in order to be eligible for these funds. EDOs should also
consider partnering with other community organizations or economic alliances that may
have a 501(c)(3) status already.

62
Conclusions
Funding for economic development organizations is changing and impacting EDO business
practices. Nimble EDOs are experimenting with various ways of maintaining budgets and thereby
offering lessons for others who follow. The main conclusions from the study are discussed below.
One Size Does Not Fit All
Local, regional, and state laws and regulations limit an EDO’s ability to utilize different types of
funding. The organizational structure (public, private, or public-private partnership) further
impacts their ability. What works in one community may not necessarily work in other
communities.
Local Relationships are Vital to Success
Whether EDOs receive local government funding or not, local-level relationships with a variety of
other organizations, institutions, and businesses are very important. In-kind contributions and
charitable donations can have tangible impact on EDOs’ budgets, and organizations are more
likely to benefit from these funding streams at the local and regional level. The Northeast
Indiana Regional Partnership raised $2 million and worked with local foundations to find ways
for them to contribute to the region’s economic growth.
Accountability in the Use of Funds is Increasing
Both public and private-sector investors are attaching performance metrics to their funding for
specific projects and programs. EDOs need to spend adequate time and effort tracking the
impact of their work in order to secure future funding. Laramie Economic Development
Corporation in Wyoming risked losing major public sector investors over concerns of
accountability and transparency in the use of funds. They were able to retain them by signing
separate contracts with each investor that required more frequent and regular reporting as well
as feedback from the investors.
Funds are tied to Projects and Programs
More and more economic development funding is tied to projects and programs with specific
outcomes or deliverables. This is true for funding from public, private, and nonprofit sectors.
Fundraising Activities Are Important for All EDOs
Nearly all EDOs need to devote a portion of their time to fundraising activities. Even for those
that are fully financed through public funds, it is important to educate investors and keep them
apprised of the importance of EDOs and the need for continued public funding. When it comes
to engaging the private sector, EDOs should be able to identify and build mutually beneficial

63
relationships with a wide variety of potential investors. In some cases this means developing
quality proposals and grant requests for competitive funding. In other cases this can be
identifying opportunities for fee-for service-contracts or other partnering agreements.
Understand All Possible Funding Sources
It is important that EDOs are aware of and understand different funding streams in their
community and beyond. EDOs can work with partner organizations and stakeholders to develop
creative ways of accessing funds that may not seem like options. The McAllen (Texas) Economic
Development Council worked with partners to bring in additional revenues when the new FTZ
entities were established.
Raising Funds is a Never-Ending Job
Whether the organizations are funded privately or publicly, they cannot rest on the
achievements of the past decades or even the last few months. Funding streams can change
quickly and EDOs need to adapt to these changes with equal agility. EDOs always need to be the
lookout for new opportunities for funding, projects, and partnerships and assess their skills and
resources regularly in order to be successful at taking advantage of new opportunities.
Southwest Michigan First found a gap in the services delivered in the community and built a
consulting program to fill that gap, while bringing in a new revenue stream to their organization.
Not Many Unique Funding Sources Exist
The survey asked respondents for examples of new or unique funding sources that they have
started using in recent years. Interestingly, the results show that EDOs are not implementing
many completely new funding mechanisms. A funding mechanism might be new to an individual
organization, but it is likely not new to the economic development industry.

64
Appendix A – Survey Questionnaire
What size population does your organization represent?
o Population less than 25,000
o Population between 25,000 and 200,000
o Population between 200,000 and 500,000
o Population greater than 500,000
Please select the category that best describes your organization
o State or Provincial
o County, Parish, Regional/Municipal District (Canada)
o Municipality
o Regional
o Multiple states or provinces
o Sub-local (ex. Downtown organizations, business improvement districts, neighborhood
development organizations)
Please select the category that best describes your community
o Mostly urban
o Mostly suburban
o Mostly rural
o Combination of urban and suburban
o Combination of urban and rural
o Combination of rural and suburban
o Combination urban, suburban and rural
o Native American or Aboriginal Tribe
How is your organization structured?
o Public entity
o Private organization
o Public-private partnership

65
Has your organization’s structure changed in the past five years?
o Yes
o No
Please explain
Does your organization receive revenue from public sources?
(Public funding includes all sources of federal, state/provincial, and local government funding
including grants, loans, allocations, etc.)
o Yes
o No
What methodology is uses to determine the amount of public funding received by your
organization? Check all that apply.
o Per capita allocation
o Ratio to private funding
o Competitive grant process
o Other, please specify
What percentage of your budget is from federal sources?
1-20% 21-40% 41-60% 61-80% 81-100% N/A Please list programs
Loans o o o o o o
Grants o o o o o o
Allocations o o o o o o
Others o o o o o o
What percentage of your budget is from state/provincial sources?
1-20% 21-40% 41-60% 61-80% 81-100% N/A Please list programs
Loans o o o o o o
Grants o o o o o o

66
Allocations o o o o o o
Others o o o o o o
What percentage of your budget is from local sources?
1-20% 21-40% 41-60% 61-80% 81-100% N/A Please list programs
Economic
Development
Income Tax (EDIT)
o o o o o o
Sales taxes o o o o o o
General Fund
Allocations o o o o o o
Taxing districts o o o o o o
Other o o o o o o
How has the level of public revenue changed in the past five years?
Increased Decreased Stayed the
Same
N/A
Federal grants o o o o
Federal loans o o o o
Federal allocations o o o o
State/Provincial grants o o o o
State/provincial loans o o o o
State/provincial allocations o o o o
Local economic development income
tax o o o o
Local sales tax o o o o
Local general fund allocation o o o o
Local taxing district o o o o
Other sources of public funding o o o o

67
How has the level of public revenue changed in the past two years?
Increased Decreased Stayed the
Same
N/A
Federal grants o o o o
Federal loans o o o o
Federal allocations o o o o
State/Provincial grants o o o o
State/provincial loans o o o o
State/provincial allocations o o o o
Local economic development income
tax o o o o
Local sales tax o o o o
Local general fund allocation o o o o
Local taxing district o o o o
Other sources of public funding o o o o
Does your organization receive revenue from private sources?
(Private funding includes in-kind contributions, membership dues, foundation grants, charitable
donations, management fees, real estate transaction fees, interest on investment, and other
private sources)
o Yes
o No
What methodology is used to determine the amount of private sector funding received by your
organization? Check all that apply.
o Pre-set investment levels
o Ratio to public funding
o Fundraising campaigns
o Other, please specify

68
What percentage of your budget is from private sources?
1-20% 21-40% 41-60% 61-80% 81-100% N/A Please list programs
In-kind
contributions o o o o o o
Membership dues o o o o o o
Foundation grants o o o o o o
Charitable
donations o o o o o o
Management fees o o o o o o
Real estate o o o o o o
Interest on
investments o o o o o o
Others o o o o o o
How has the level of private revenue changed in the past five years?
Increased Decreased Stayed the
Same
N/A
In-kind contributions o o o o
Membership dues o o o o
Foundation grants o o o o
Charitable donations o o o o
Management fees o o o o
Real estate o o o o
Interest on investments o o o o
Others o o o o

69
How has the level of private revenue changed in the past two years?
Increased Decreased Stayed the
Same
N/A
In-kind contributions o o o o
Membership dues o o o o
Foundation grants o o o o
Charitable donations o o o o
Management fees o o o o
Real estate o o o o
Interest on investments o o o o
Others o o o o
Does your organization receive other types of revenue?
o Yes, please explain
o No
Please provide your organization’s information
Name
Company
City/Town
State/Province
Country
Phone
Email Address
May we contact you for additional information or a case study?
o Yes
o No

70
Appendix B – Descriptions of Funding Streams
Grants from Federal, State and Local Government Agencies
Grants are monies provided by government agencies in support of a public purpose. They do not
need to be repaid to the granting agency. Most agencies provide grants for specific projects.
While grants are typically not available for operational expenses, most agencies allow a portion
of the grant to be used for administration, including general and administrative expenses.
There are currently 26 federal agencies that provide grants. In 2002, as part of President Bush’s
Fiscal Year Management Agenda, an E-Grants Initiative was created as a central clearinghouse of
all federal grants available at www.grants.gov. Most state governments provide grants for
economic development purposes too.
Loans from Federal, State and Local Government Agencies
Loans are funds that need to be repaid within a certain amount of time and may require some
interest payment as well. Government agencies have two roles in providing loans – as the lender
and as the guarantor. As the lender, the government will provide a short term loan directly to
the organization or business. In the role of the guarantor, the government provides its full faith
and credit guarantee for the loan from a private or non-profit lender. State and local
governments’ credit worthiness is measured by credit ratings from major credit rating agencies.
For the federal government, it is generally accepted that the U.S. government will not default on
a loan.
Allocations from Federal, State and Local Government Agencies
Allocations are mostly formula based budgetary allocations to organizations for specific public
purposes. Not all government agencies provide allocations anymore, especially at the federal
and state level. At the federal level, the U.S. Economic Development Administration (EDA) is
among the few federal agencies that provide allocations for economic development purposes.
Earmarks
Earmarks are funds appropriated by the legislature for specific projects. According to the Office
of Management and Budget, earmarks are "funds provided by the [U.S.] Congress for projects,
programs, or grants where the purported congressional direction (whether in statutory text,
report language, or other communication) circumvents otherwise applicable merit-based or
competitive allocation processes, or specifies the location or recipient, or otherwise curtails the

71
ability of the executive branch to manage its statutory and constitutional responsibilities
pertaining to the funds allocation process.”12
The use of federal earmarks by legislators has become increasingly controversial. In 2010, a
moratorium was established on earmarks, which has been extended to 2013.
Business Improvement Districts
A Business Improvement District (BIDs) is a private organization funded by a publicly authorized
assessment on businesses and/or property owners located within set geographically defined
area. The revenue generated by the assessment is used for operating the organization and
supporting programs and projects within the district. Neighborhood Improvement Districts,
Community Improvement Districts and Public Improvement Districts similarly provide funding
through assessments.
Joint Economic Development Districts
In 1993, the state of Ohio passed legislation allowing for Joint Economic Development Districts
(JEDD) to be formed. A JEDD is created in a situation when a township either has run out of
industrial land or infrastructure capability and a neighboring (contiguous) city, village or another
township has readily available either industrial land or infrastructure capability. An agreement is
made between the two entities to share the benefits of commercial and industrial development
within the district. As an additional benefit, townships under Ohio law are traditionally not
allowed to collect income tax. However, within a JEDD, the township may receive a share of the
revenues obtained from income taxes. The Ohio State University Extension created a fact sheet
on JEDDs at http://ohioline.osu.edu/cd-fact/1560.html.
Tax Increment Financing Districts
Tax Increment Financing (TIF) is a mechanism to capture the future tax benefits of real estate
improvements to pay the present cost of those improvements. It is perhaps the best financing
tool available for area redevelopment because it can be used to channel funding, or tax
increment, toward improvements in targeted districts where development would not otherwise
occur. Forty-nine states and the District of Columbia allow tax increment financing districts—a
set geographically defined area that is outlined in local legislation that includes a period for
incremented financing.
There are two strategies for making improvements—either the EDOs pay for improvements
directly as they go from incremented tax revenues or the municipality issues general obligation
12
Office of Management and Budget (OMB), http://earmarks.omb.gov/earmarks-public/

72
funds. Organizations can designate a portion of the incremented tax revenues for operational
expenses such as staffing, facilities and indirect costs. It is important to note that TIF districts
are known as community reinvestment areas (CRA) in Florida; tax allocation districts (TAD) in
Georgia; revenue allocation districts (RAD) in New Jersey; and tax increment reinvestment zone
(TIRZ) in Texas.