new prediction methods for co evaporation inside tubes ... documents/presentations and... · the...
TRANSCRIPT
1
New prediction methods for CO2 evaporation inside tubes: Part II ⎯ An updated general flow boiling heat transfer model based on flow patterns
Lixin Cheng a, Gherhardt Ribatski a, b, John R. Thome a,∗
a Laboratory of Heat and Mass Transfer (LTCM), Faculty of Engineering (STI), École Polytechnique Fédérale de Lausanne (EPFL), Lausanne, CH-1015, Switzerland
b Department of Mechanical Engineering, Escola de Engenharia de São Carlos (EESC), University of São Paulo (USP), São Carlos, SP, 13566-590, Brazil
Abstract
Corresponding to the updated flow pattern map presented in part I of this study, a general flow pattern based flow
boiling heat transfer model was developed for CO2 on the basis of the Cheng-Ribatski-Wojtan-Thome flow boiling heat
transfer model [1]. Compared to that model, the updated flow boiling model is applicable to a wider range of
conditions: tube diameters from 0.6 to 10 mm, mass velocities from 50 to 1500 kg/m2s, heat fluxes from 1.8 to 46
kW/m2 and saturation temperatures from -28 to 25 °C (reduced pressures from 0.21 to 0.87). In addition, a heat transfer
correlation for mist flow was newly proposed and heat transfer in the bubbly flow regime was added to the model. The
updated model was compared to an extensive experimental database of 1108 data points, including 790 new data points
in addition to the 318 data points used in the previous Cheng-Ribatski-Wojtan-Thome model [1]. Good agreement
between the predicted and experimental data was found, with 71.4% of the entire database and 83.2% of the database
without the dryout and mist flow data were predicted within ±30%.
Keywords: Model; Flow patterns; Flow boiling; Heat transfer; Macro-channel; Micro-channel; CO2
∗ Corresponding author. Tel.: +41 21 693 5981; fax: +41 21 693 5960.
E-mail addresses: [email protected] (L. Cheng), [email protected] (G. Ribatski), [email protected] (J.R. Thome).

2
1. Introduction
As pointed out in part I of this study, the flow boiling heat transfer characteristics of CO2 are quite different from
those of the conventional refrigerants. Due to its low critical temperature (Tcrit = 31.1°C) and high critical pressure (pcrit
= 73.8 bar), CO2 is utilized at much higher operating pressures compared to other conventional refrigerants. The higher
operating pressures result in high vapor densities, very low surface tensions, high vapor viscosities and low liquid
viscosities. High pressures and low surface tensions have major effects on nucleate boiling heat transfer characteristics
and previous experimental studies have suggested a clear dominance of nucleate boiling heat transfer even at very high
mass flux [1, 2]. Therefore, CO2 has much higher heat transfer coefficients than those of conventional refrigerants at
the same saturation temperature and the available heat transfer correlations generally underpredict the experimental
data of CO2. In addition, previous experimental studies have demonstrated that dryout trends occur earlier at moderate
vapor qualities in CO2, particularly at high mass flux and high temperature conditions [1, 2].
Thome and Ribatski [2] conducted an overall review of flow boiling heat transfer and two-phase flow of CO2 in
the literature and they found that not one of the available prediction methods was able to predict the experimental data
of CO2 well. Therefore, they suggested that a new flow boiling heat transfer prediction method should be developed
and the flow boiling heat transfer model should include CO2 effects on the annular to mist flow transition in order to
more accurately predict heat transfer coefficients at moderate/high vapor qualities. In response, Cheng et al. [1]
proposed a new flow boiling heat transfer model and flow pattern map for carbon dioxide evaporating inside horizontal
tubes. The new flow boiling heat transfer model and flow pattern map were developed according to the model by
Wojtan et al. [3, 4], which is an updated version of the Kattan-Thome-Favrat flow pattern map and flow boiling heat
transfer model [5-7]. The Cheng-Ribatski-Wojtan-Thome flow boiling heat transfer model [1] is a flow pattern based
flow boiling heat transfer model which relates the flow patterns to the corresponding heat transfer mechanisms, thus,
different from the numerous empirical models, such as the correlations of Chen [8], Shah [9], Gungor and Winterton
[10], Kandlikar [11], Liu and Winterton [12], etc., which do not include flow pattern information. The
Cheng-Ribatski-Wojtan-Thome flow boiling heat transfer model is applicable to a wide range of conditions: tube
diameters (equivalent diameters for non-circular channels) from 0.8 to 10 mm, mass fluxes from 170 to 570 kg/m2s,
heat fluxes from 5 to 32 kW/m2, saturation temperatures from –28 to 25oC (the corresponding reduced pressures are
from 0.21 to 0.87). The model reasonably predicts the database and it covers channel diameters found in most of CO2
flow boiling applications. However, their model is limited by its parameter ranges from being applicable to some
important applications, for example the mass velocity ranges from 50 to 1500 kg/m2s in CO2 automobile air
conditioning systems. In addition, the heat fluxes in some applications go beyond the maximum value in the

3
Cheng-Ribatski-Wojtan-Thome flow boiling heat transfer model. Furthermore, the model does not extrapolate well to
these conditions. Therefore, it is necessary to update the model for CO2 to cover a wider range of conditions.
In the present study, a new flow boiling heat transfer model was developed by modifying the
Cheng-Ribatski-Wojtan-Thome model. By incorporating the updated new flow pattern map developed in part I of this
study, the new model is physically related to the flow regimes of CO2 evaporation, and thus correspondingly the new
heat transfer model has been extended to a wider range of conditions. The proposed model predicted reasonably well an
extensive experimental database derived from the literature.
2. CO2 flow boiling heat transfer database and comparisons
2.1 Selection of CO2 flow boiling heat transfer data
Thirteen independent experimental studies from different laboratories have been carefully selected to form the
present database for flow boiling heat transfer of CO2. These comprise 13 experimental studies containing six studies
(Knudsen and Jensen [13], Yun et al. [14], Yoon et al. [15], Koyama et al. [16], Pettersen [17] and Yun et al. [18]) used in
the Cheng-Ribatski-Wojtan-Thome flow boiling heat transfer model [1] and seven new studies (Gao and Honda [19, 20],
Tanaka et al. [21], Hihara [22], Shinmura et al. [23], Zhao et al. [24, 25], Yun et al. [26. 27] and Jeong et al. [28]). The
details of the test conditions of the database are summarized in Table 1. The channels tested include single circular
channels and multi-channels with circular and rectangle cross-sections for a wide range of test conditions, using either
electrical or fluid heating. The data were taken from tables where available or by digitizing the heat transfer data from
graphs in these publications. All together, 1124 (1108 data points were used in this study) heat transfer data points
including the heat transfer data (total 334 data points and 318 data points were used) in our previous study [1] and new
heat transfer data (790 data points) were obtained. Special care was taken in order to extract experimental data in the
dryout region and mist flow since these are important regimes in the design of CO2 evaporators.
In the present study, the physical properties of CO2 have been obtained using the REFPROP of NIST [29]. For
non-circular channels, equivalent diameters rather than hydraulic diameters were used. Using an equivalent diameter
gives the same mass flux as in the non-circular channel and thus correctly reflects the mean liquid and vapor velocities,
something using a hydraulic diameter does not. The equivalent diameter is calculated with Eq. (1) in part I. The heat flux
of the original perimeter is applied to the perimeter of the equivalent channels using the perimeter ratio.
2.2 Analysis of the flow boiling heat transfer database

4
An extensive literature survey on flow boiling heat transfer related to macro-scale channels when D > 3 mm and
micro-scale channels when D ≤ 3 mm was conducted. Such a distinction between macro- and micro-scale by the
threshold diameter of 3 mm is adopted due to the lack of a well-established theory, as pointed out by Cheng et al. [1] and
Thome and Ribatski [2]. In order to develop a general flow boiling heat transfer prediction model, extensive comparisons
of the data available in the literature were made. However, some of the data available have not been selected due to
various reasons. By carefully analysing the experimental data, we have found that only 13 papers (4 papers related to
macro-scale and 9 papers related to micro scale), including the 6 papers used in our previous study [1], are useful.
Therefore, a database including the experimental data from these papers for flow boiling heat transfer have been set up as
the first step in this study. Experimental data in some papers were discharged or ignored because: i) the same data were in
more than one paper by the same authors; ii) some necessary information of the experimental conditions, viz. saturation
temperature, vapor quality or tube length was missing; iii) some data showed extremely strange parametric trends; iv)
some data were physically unreasonable; v) the uncertainties of some data were very large; and vi) some data were only
presented in correlated form and could not be extracted. Discussion of some data has already been presented in our
previous study [1]. Thus, below only some of the new data sets are discussed here.
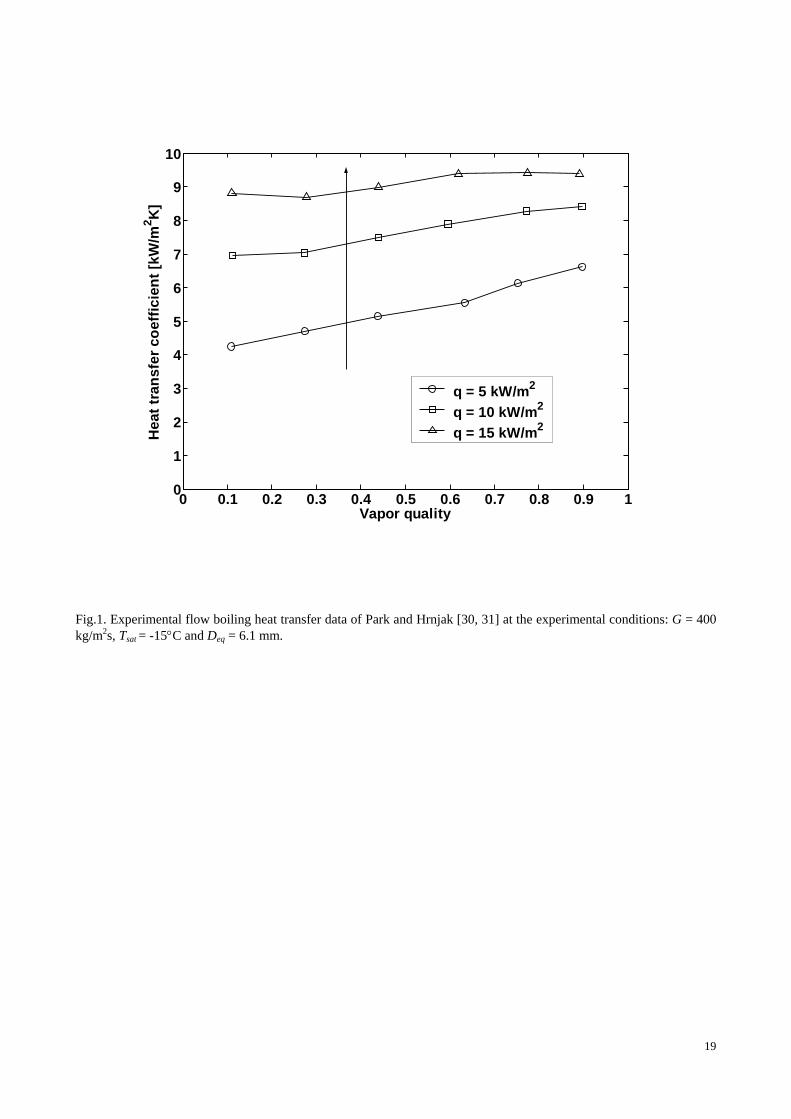
Fig. 1 shows the experimental heat transfer data of Park and Hrnjak [30, 31] at a mass velocity of 400 kg/m2s, a
saturation temperature of -15 °C and a tube diameter of 6.1 mm at heat fluxes of 5, 10 and 15 kW/m2. According to this
study, the heat transfer coefficient increases with increasing heat flux, a trend which is reasonable. In many other
experimental studies, dryout in flow boiling of CO2 occurs at significantly lower vapor qualities (earlier) than for
conventional refrigerants such as R-22, R-134a and so on, while the Park-Hrnjak data do not show any dryout
(characterized by a sharp fall off in heat transfer), even at a vapor quality around 0.9. In addition, their heat transfer
data are significantly different in value from comparable data for 6 mm and 10.06 mm tubes in two other earlier studies
[13, 14], both aspects which were not addressed in their paper. Therefore, the Park-Hrnjak data have been excluded
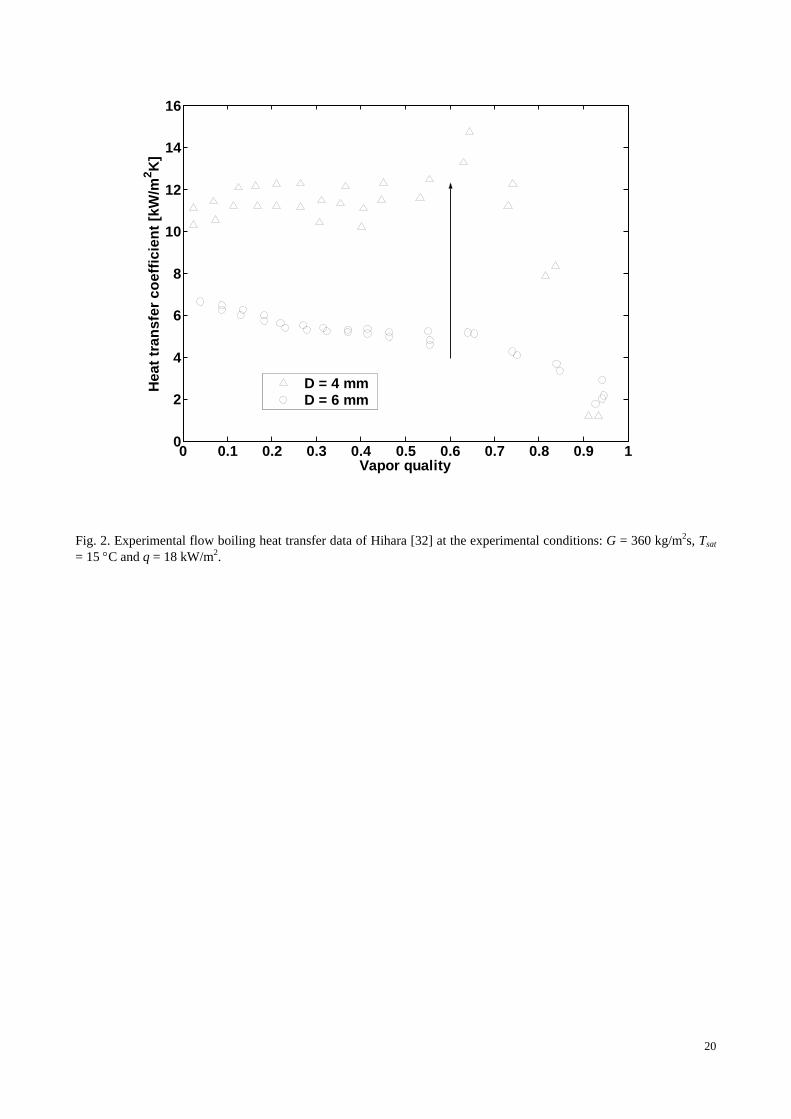
from the present database. Fig. 2 shows the experimental heat transfer data of Hihara [32] at a mass velocity of 360
kg/m2s, a saturation temperature of 15 °C and a heat flux of 18 kW/m2 with two different tube diameters, 4 and 6 mm.
It shows that the flow boiling heat transfer coefficients of the 4 mm tube are twice those of the 6 mm tube. In addition,
the trends of the heat transfer coefficients are totally different. As both diameters are in the range of macro-scale, it
seems unreasonable that the diameter can have such a dramatic effect on the heat transfer values and trends. Therefore,
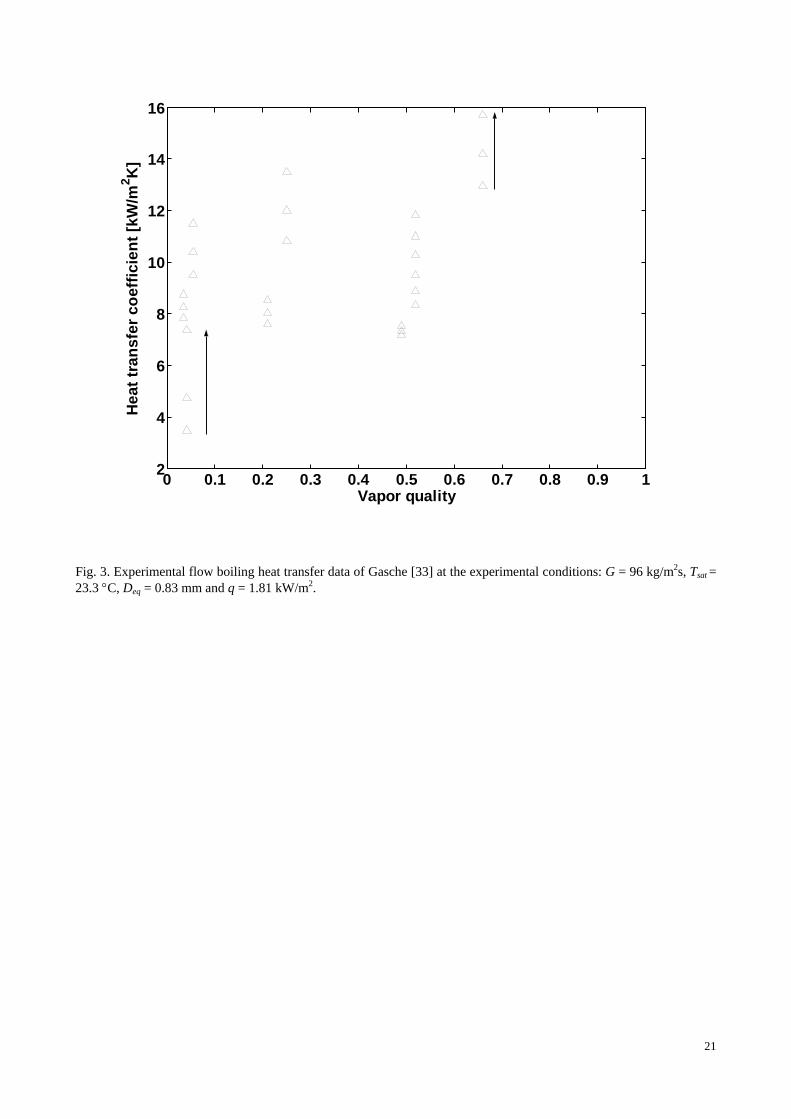
the experimental data of Hihara have been excluded. Fig. 3 shows the experimental heat transfer data of Gasche [33] at
a mass velocity of 96 kg/m2s, a saturation temperature of 23.3 °C, a tube diameter of 0.8 mm and a heat flux of 1.81
kW/m2. For the same test conditions, the heat transfer coefficients change by more than 2 times in magnitude. Hence,
his experimental data have been excluded. As already pointed out in part I, the two-phase pressure drop data of Wu et
al. [34] seem to be incorrect, and so do their flow boiling heat transfer data since the local saturation temperature is
deduced from the pressure drop. Therefore, their experimental heat transfer data have been excluded as well.
Although some anomalous data have already been excluded as pointed out earlier, the heat transfer data in the
database show still some different behaviors at similar test conditions. Some of the analysis can be found in our
previous study [1] and therefore, none is presented in here. In all, the experimental data from the different studies still
show somewhat different heat transfer trends and thus will affect the accuracy of the new general flow boiling heat
transfer model developed for CO2 in the present study since no conclusive reasons for the contradicting trends could be
found and it is not possible to say which study is right.
3. Updated flow boiling heat transfer model for CO2
To develop a general flow boiling heat transfer prediction method, it is important that the method is not only
numerically accurate but that it also captures correctly the trends in the data. Most importantly, the flow boiling heat
transfer mechanisms should be related to the corresponding flow patterns and be physically explained according to flow
pattern transitions. Accordingly, an updated general flow boiling heat transfer model was developed using the updated
flow pattern map for CO2 developed in part I of this study. Corresponding to the updated flow pattern map, the updated
flow boiling model has been extended to a wider range of conditions: tube diameters from 0.6 to 10 mm, mass
velocities from 50 to 1500 kg/m2s, heat fluxes from 1.8 to 46 kW/m2 and saturation temperatures from -28 to +25 °C
(reduced pressures from 0.21 to 0.87). Several new modifications were implemented in the updated heat transfer model.
A new dryout inception vapor quality correlation (Eq. (20) in part I) was updated and a new dryout completion vapor
quality correlation (Eq. (25) in part I) was newly developed in the present study. Accordingly, the flow boiling heat
transfer correlation in the dryout region was updated. In addition, a new mist flow heat transfer correlation for CO2 was
developed based on the CO2 data. With these modifications, a new general flow boiling heat transfer model for CO2
was developed to meet a wider range of conditions.
The Kattan-Thome-Favrat [5-7] general equation for the local flow boiling heat transfer coefficients htp in a
horizontal tube is used:
( )2
2dry V dry wet
tp
h hh
θ π θ
π
+ −= (1)
where θdry is the dry angle defined in part I. The dry angle θdry defines the flow structures and the ratio of the tube
perimeter in contact with liquid and vapor. In stratified flow, θdry equals the stratified angle θstrat which is calculated 5

with Eq. (13) in part I. In annular and intermittent flows, θdry = 0. For stratified-wavy flow, θdry varies from zero up to
its maximum value θstrat. Stratified-wavy flow has been subdivided into three subzones (slug, slug/stratified-wavy and
stratified-wavy) to determine θdry.
For slug zone (Slug), the high frequency slugs maintain a continuous thin liquid layer on the upper tube perimeter.
Thus, similar to the intermittent and annular flow regimes, one has:
0dryθ = (2)
For stratified-wavy zone (SW), the following equation is proposed:
0.61
wavydry strat
wavy strat
G GG G
θ θ⎛ ⎞−
= ⎜⎜ −⎝ ⎠⎟⎟ (3)
For slug-stratified wavy zone (Slug+SW) and bubbly flow, the following interpolation between the other two
regimes is proposed for x < xIA:
0.61
wavydry strat
IA wavy strat
G Gxx G G
θ θ⎛ ⎞−
= ⎜⎜ −⎝ ⎠⎟⎟ (4)
The vapor phase heat transfer coefficient on the dry perimeter hV is calculated with the Dittus-Boelter [35] correlation assuming tubular flow in the tube:
0.8 0.40.023Re Pr VV V V
kh
D= (5)
where the vapor phase Reynolds number ReV is defined as follows:
VV
GxDReμ ε
= (6)
The heat transfer coefficient on the wet perimeter hwet is calculated with an asymptotic model that combines the
nucleate boiling and convective boiling heat transfer contributions to flow boiling heat transfer by the third power:
( )1/ 33 3wet nb cbh h h= + (7)
The nucleate boiling heat transfer coefficient hnb is calculated with the Cheng-Ribatski-Wojtan-Thome nucleate
boiling correlation for CO2 [1]:
( ) 0.550.0063 0.5 0.5810131 lognb r rh p p M q−−= − − (8)
The Cheng-Ribatski-Wojtan-Thome nucleate boiling heat transfer suppression factor for CO2 is applied to reduce the
nucleate boiling heat transfer contribution due to the thinning of the liquid film [1]:
If x < xIA, S = 1 (9)
If x ≥ xIA, 2.22
1 1.14 10.00753 IA
DS δδ
⎛ ⎞⎛ ⎞= − −⎜ ⎟⎜ ⎟⎝ ⎠ ⎝ ⎠
(10)
Furthermore, if D > 7.53 mm, then set D = 7.53 mm. 6

The convective boiling heat transfer coefficient hcb is calculated with the following correlation assuming an annular
liquid film flow:
0.69 0.40.0133Re Pr Lcb L
kh δ δ
= (11)
where the liquid film Reynolds number Reδ is:
( )( )
4 11L
G xReδ
δμ ε
−=
− (12)
The void fraction ε is calculated with Eq. (8) in paper part I and the liquid film thickness δ is calculated with the
expression proposed by El Hajal et al. [36]:
2 22 2 2
L
dry
AD Dδπ θ
⎛ ⎞= − −⎜ ⎟ −⎝ ⎠ (13)
where AL, based on the equivalent diameter, is cross-sectional area occupied by liquid-phase shown in Fig. 1 in part I.
When the liquid occupies more than one-half of the cross-section of the tube at low vapor quality, this expression
would yield a value of δ > D/2, which is not geometrically realistic. Hence, whenever Eq. (13) gives δ > D/2, δ is set
equal to D/2 (occurs when ε < 0.5).
Combining the Cheng-Ribatski-Wojtan-Thome nucleate boiling heat transfer correlation for CO2 (Eq. 8) and the
Cheng-Ribatski-Wojtan-Thome nucleate boiling heat transfer suppression factor correlation (Eqs. 9 and 10), the flow
boiling heat transfer coefficient on the wet perimeter is calculated as follows:
( )1/ 33 3
wet nb cbh Sh h⎡ ⎤= +⎣ ⎦ (14)
The heat transfer coefficient in mist flow is calculated by the new correlation developed in this study, which is a
modification of the correlation by Groeneveld [37] for water and old refrigerants:
8 1.97 1.06 1.832 10 Re Pr VM H V
kh
D−= × Y − (15)
where the homogeneous Reynolds number ReH and the correction factor Y are calculated as follows:
( )1VH
V L
GDRe x xρ
μ ρ⎡ ⎤
= + −⎢ ⎥⎣ ⎦
(16)
( )0.4
1 0.1 1 1L
V
Yρρ
x⎡ ⎤⎛ ⎞
= − − −⎢ ⎥⎜ ⎟⎢ ⎥⎝ ⎠⎣ ⎦
(17)
The heat transfer coefficient in the dryout region is calculated by a linear interpolation as
( ) ( ) ( )didryout tp di tp di M de
de di
x xh h x h x h x
x x− ⎡ ⎤= − −⎣ ⎦−
(18)
7
8
where htp(xdi) is the two-phase heat transfer coefficient calculated with Eq. (1) at the dryout inception quality xdi and
hM(xde) is the mist flow heat transfer coefficient calculated with Eq. (15) at the dryout completion quality xde. Dryout
inception quality xdi and dryout completion quality xde are respectively calculated with Eqs. (20) and (25) in part I. If xde
is not defined at the mass velocity being considered, it is assumed that xde = 0.999.
Corresponding to the bubbly flow regime in the updated flow pattern map, a heat transfer model for bubbly flow
was added. In the absence of any data, the heat transfer coefficients in bubbly flow regime are calculated by the same
method as that in the intermittent flow. First, Eq. (4) is used to calculate the dry angle θdry. Then, Eq. (1) is used to
calculate the local flow boiling heat transfer coefficients.
4 Comparisons of the updated heat transfer model to the database
The updated general flow boiling heat transfer model was compared to the database in Table 1. As the updated
model predicts the heat transfer data used in our previous study [1] similar to the Cheng-Ribtiski-Wojtan-Thome flow
boiling heat transfer model, those comparisons are not shown in this study but are included in the statistical analysis in
Table 2. For low mass velocities, both the Cheng-Ribatski-Wojtan-Thome and the new general flow boiling heat
transfer models may be used. However, for high mass velocities, only the new general flow boiling heat transfer model
is applicable. Figs. 4 to 10 show the comparisons of the predictions by the updated flow boiling heat transfer model to
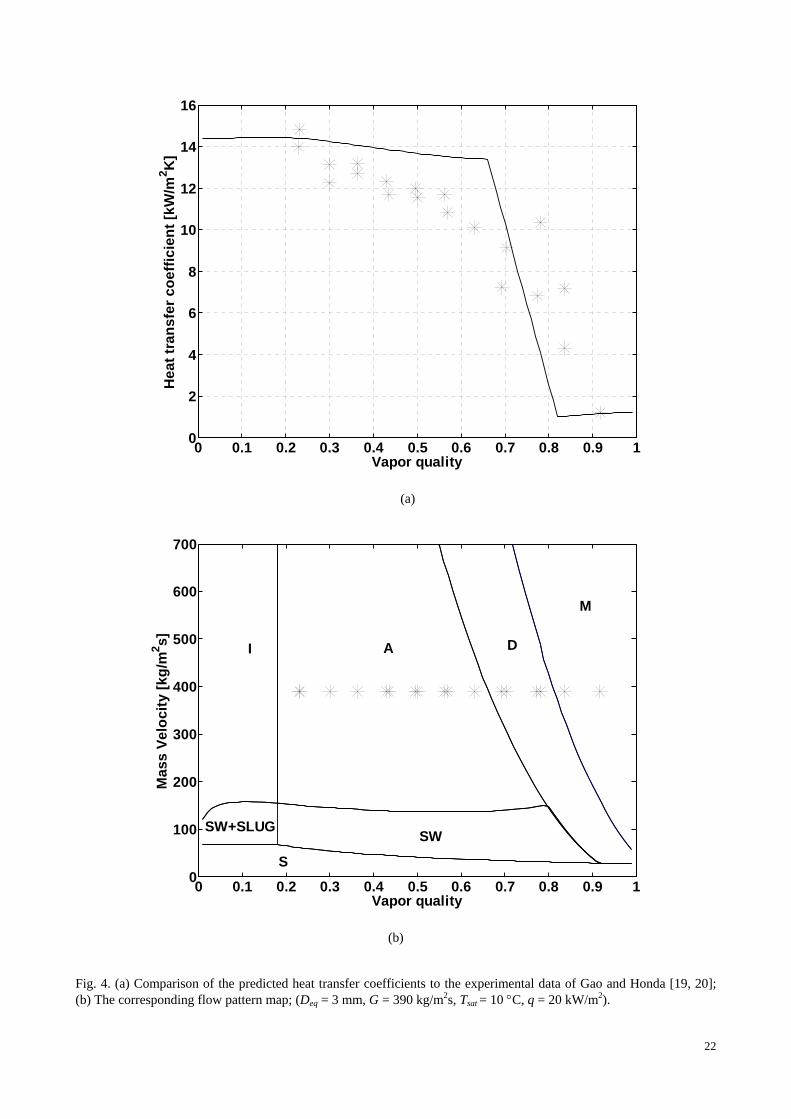
the new flow boiling heat transfer database and the corresponding flow pattern maps. Fig. 4 shows the comparison of
the predicted flow boiling heat transfer coefficients to the experimental heat transfer data of Gao and Honda [19, 20].
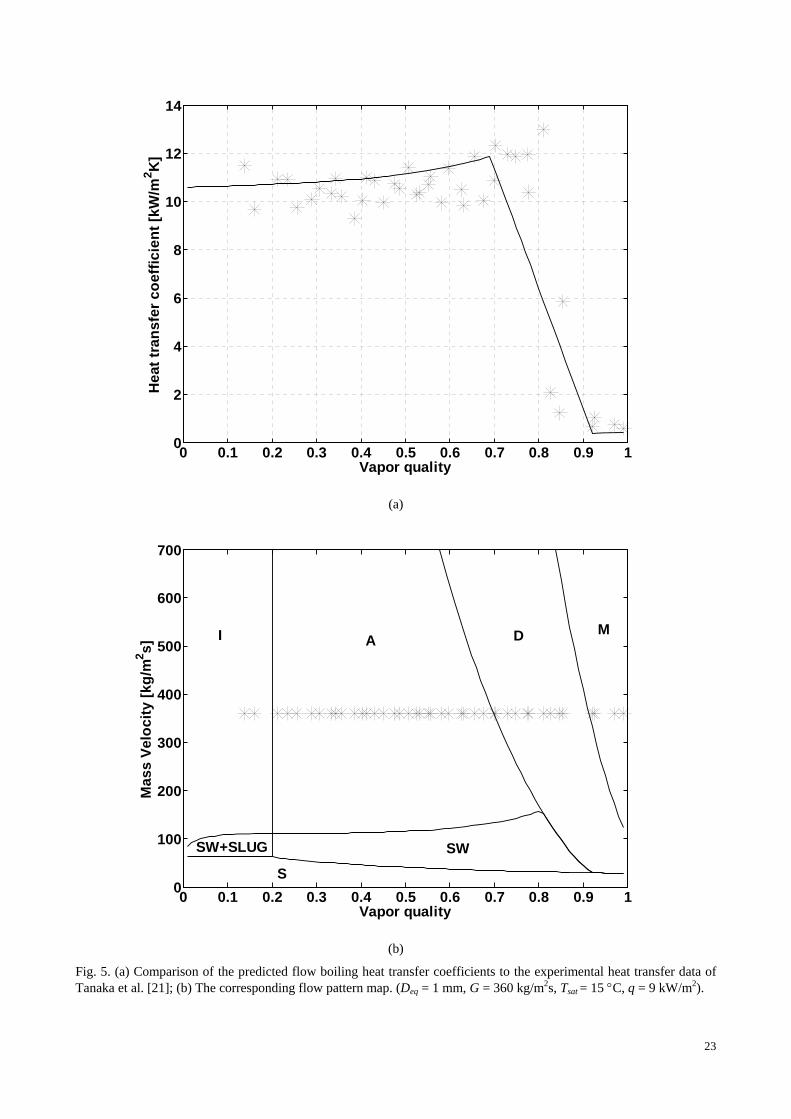
Fig. 5 shows the comparison of the predicted flow boiling heat transfer coefficients to the experimental heat transfer
data of Tanaka et al. [21]. Fig. 6 shows the comparison to the data of Hihara [22]. Fig. 7 shows the comparison to the
data of Shinmura et al. [23]. Fig. 8 shows the comparison to the data of Zhao et al. [24, 25]. Fig. 9 shows the
comparison to the data of Yun et al. [26, 27]. Finally, Fig. 10 shows the comparison to the data of Jeong et al. [28].
According to these figures, the new general flow boiling heat transfer model not only captures the heat transfer trends
well but also predicts the experimental heat transfer data well.
Fig. 11 (a) shows the comparison of the updated CO2 flow boiling heat transfer model to the new flow boiling heat
transfer data in the database and Fig. 11 (b) shows the comparison of the predicted flow boiling heat transfer
coefficients to the new flow boiling heat transfer data without the harder to predict (and harder to accurately measure)
heat transfer data in the dryout and mist flow regimes. The new general flow boiling heat transfer model predicts these
data reasonably well. Also note that many of the experimental data sets have a level of scatter ranging from 10 to 40%
9
themselves, which reflects the larger experimental errors when measuring large heat transfer coefficients and values
near sharp transitions such as dryout.
Three criteria were used to analyze the accuracy of the flow boiling heat transfer model: the standard deviation, the
mean error and the percent of data predicted within ±30%. In the error analysis, the entire data point set, the new data
points and the data points in our previous study [1] were respectively analyzed. The statistical analysis of the predicted
results is presented in Table 2, where 71.4% of the entire database including both the new data and the previous data
(total of 1108 data points) and 83.2% of these data without the dryout and mist flow data are predicted within ±30%.
Furthermore, 70.1% of the new experimental data (790 data points) and 84.7% of the new data without the dryout and
mist flow data (484 data points) are predicted within ±30%. Comparing the updated CO2 flow boiling heat transfer
model to the previous version, it can be seen in Table 2 that the database considered in the previous study [1] is
reasonably predicted by both versions.
For such a wide range of experimental data from different laboratory studies, the predictions are quite reasonable
and encouraging. However, for the heat transfer in some regions such as stratified-wavy flow, dryout and mist flow,
due to the lack of experimental data and the lower accuracy of such data points, the predicted results are not always
satisfactory. It is important to highlight here the importance of accurate predictions for dryout and mist flow regions
since they are typical working conditions in micro-scale channels of automobile air-conditionings and are confronted
over large ranges of vapor qualities, contrary to stratified flow which is rarely observed. To provide more accurate heat
transfer predictions for flow boiling of CO2, more experimental data covering wide ranges of interest in practical
applications are needed and it is suggested that more carefully designed experiments of flow boiling of CO2 be
conducted in the future.
5. Conclusions
A general flow pattern based flow boiling heat transfer model was developed for CO2 on the basis of the
Cheng-Ribatski-Wojtan-Thome flow boiling heat transfer model [1] by incorporating the updated flow pattern map
presented in part I. Corresponding to the flow pattern map, the general flow boiling heat transfer model is applicable to
a wider range of conditions: tube diameters from 0.6 to 10 mm, mass velocities from 50 to 1500 kg/m2s, heat fluxes
from 1.8 to 46 kW/m2 and saturation temperatures from -28 to 25 °C (reduced pressures from 0.21 to 0.87). In addition,
a heat transfer correlation in mist flow was newly proposed and a heat transfer correlation for bubbly flow was added.
The general flow boiling heat transfer model was compared to an extensive experimental database (a total of 1108 data
points including the 318 data points used in the Cheng-Ribatski-Wojtan-Thome flow boiling heat transfer model [1])

10
and good agreement between the predicted and experimental data has been found, where 71.4% of the entire
experimental database and 83.2% of these data without the dryout and mist flow data are predicted within ±30%.
Acknowledgements
The Laboratory of Heat and Mass Transfer (LTCM) at École Polytechnique Fédérale de Lausanne (EPFL) wishes
to thank Valeo Engine Cooling in France for its financial and technical support on this CO2 heat transfer and flow
project. The constructive discussion and suggestions with Mr. Lorenzo Consolini of LTCM in the development of the
CO2 flow boiling heat transfer model are greatly appreciated.
Nomenclature
AL cross-sectional area occupied by liquid-phase, m2
cp specific heat at constant pressure, J/kgK
D internal tube diameter, m
Deq equivalent diameter, m
Dh hydraulic diameter, m
G total vapor and liquid two-phase mass flux, kg/m2s
h heat transfer coefficient, W/m2K
k thermal conductivity, W/mK
M molecular weight, kg/kmol
N number of data points
Pr liquid phase Prandtl number [cpμ/k]
p pressure, Pa
pr reduced pressure [p/pcrit]
q heat flux, W/m2
ReH homogeneous Reynolds number {(GD/μV )[x+ρV/ρL(1-x)]}
ReV vapor phase Reynolds number [GxD/(μVε)]
Reδ liquid film Reynolds number [4G(1-x)δ/(μL (1-ε))]
S nucleate boiling suppression factor
T temperature, oC

x vapor quality
Y correction factor
Greek symbols
δ liquid film thickness, m
ε cross-sectional vapor void fraction
ε average deviation, %
ε mean deviation, %
μ dynamic viscosity, Ns/m2
θ angle of tube perimeter, rad
ρ density, kg/m3
σ standard deviation, %
Subscripts
cb convection boiling
crit critical
de dryout completion
di dryout inception
dry dry
dryout dryout region
IA intermittent flow to annular flow
L liquid
mist mist flow
nb nucleate boiling
sat saturation
tp two-phase flow
V vapor
wet on the wet perimeter
11

12
References
[1] L. Cheng, G. Ribatski, L. Wojtan, J.R. Thome, New flow boiling heat transfer model and flow pattern map for
carbon dioxide evaporating inside horizontal tubes, Int. J. Heat Mass Transfer 49 (2006) 4082-4094.
[2] J.R. Thome, G. Ribatski, State-of-the art of flow boiling and two-phase flow of CO2 in macro- and micro-channels,
Int. J. Refrigeration 28 (2006) 1149-1168.
[3] L. Wojtan, T. Ursenbacher, J.R. Thome, Investigation of flow boiling in horizontal tubes: Part I – A new diabatic
two-phase flow pattern map, Int. J. Heat Mass Transfer (2005), 2955-2969.
[4] L. Wojtan, T. Ursenbacker, J.R. Thome, Investigation of flow boiling in horizontal tubes: Part II – Development of
a new heat transfer model for stratified-wavy, dryout and mist flow regimes, Int. J. Heat Mass Transfer (2005),
2970-2985.
[5] N. Kattan, J.R. Thome, D. Favrat, Flow boiling in horizontal tubes. Part 1: Development of a diabatic two-phase
flow pattern map, J. Heat Transfer 120 (1998) 140-147.
[6] N. Kattan, J.R. Thome, D. Favrat, Flow boiling in horizontal tubes: Part 2-New heat transfer data for five
refrigerants, J. Heat Transfer 120 (1998) 148-155.
[7] N. Kattan, J.R. Thome, D. Favrat, Flow boiling in horizontal tubes: Part-3: Development of a new heat transfer
model based on flow patterns, J. Heat Transfer 120 (1998) 156-165.
[8] J.C. Chen, Correlation for boiling heat transfer to saturated fluids in cobvective flow, Ind. Chem. Eng. Des. Dev. 5
(1966) 322-339.
[9] M.M. Shah, Chart correlation for saturated boiling heat transfer: equations and further study, ASHRAE Trans. 88
(1982) 185-196.
[10] K.E. Gungor, R.H.S. Winterton, A general correlation for flow boiling in tubes abd annuli, In. J. Heat Mass
Transfer 29 (1986) 351-358.
[11] S.G. Kandlikar, A general correlation for saturated two-phase flow boiling heat transfer inside horizontal and
vertical tubes, ASME J. Heat Transfer 112 (1990) 219-228.
[12] Z. Liu, R.H.S. Winterton, A general correlation for saturated and subcooled flow boiling in tubes abd annuli based
on a nucleate pool boiling equation, Int. J. Heat Mass Transfer 34 (1991) 2759-2766
[13] H.J. Knudsen, R.H. Jensen, Heat transfer coefficient for boiling carbon dioxide. In Workshop Proceedings - CO2
Technologies in Refrigeration, Heat Pumps and Air Conditioning Systems, Trondhein, Norway, 1997, pp.
319-328.
13
[14] R. Yun, Y. Kim, M.S. Kim, Y. Choi, Boiling heat transfer and dryout phenomenon of CO2 in a horizontal smooth
tube, Int. J. Heat Mass Transfer 46 (2003) 2353-2361.
[15] S.H. Yoon, E.S. Cho, Y.W. Hwang, M.S. Kim, K. Min, Y. Kim, Characteristics of evaporative heat transfer and
pressure drop of carbon dioxide and correlation development, Int. J. Refrigeration 27 (2004) 111-119.
[16] S. Koyama, K. Kuwahara, E. Shinmura, S. Ikeda, Experimental study on flow boiling of carbon dioxide in a
horizontal small diameter tube. IIR Commission B1 Meeting, Paderborn, Germany, 2001, pp. 526-533.
[17] J. Pettersen, Flow vaporization of CO2 in microchannel tubes, Exp. Thermal and Fluid Sci. 28 (2004) 111-121.
[18] R. Yun, Y. Kim, M.S. Kim, Convective boiling heat transfer characteristics of CO2 in microchannels, Int. J. Heat
Mass Transfer 48 (2005) 235-242.
[19] L. Gao, T. Honda, Effects of lubricant oil on boiling heat transfer of CO2 inside a horizontal smooth tube, in: 42nd
National Heat Transfer Symposium of Japan, 2005, pp. 269-270.
[20] L. Gao, T. Honda, An experimental study on flow boiling heat transfer of carbon dioxide and oil mixtures inside a
horizontal smooth tube, in: IIR 2005 Vicenza Conference-Thermophysical Properties and Transfer Processes of
Refrigerants, Vicenza, Italy, 2005, pp. 237-243.
[21] S. Tanaka, H. Daiguji, F. Takemura, E. Hihara, Boiling heat transfer of carbon dioxide in horizontal tubes, in: 38th
National Heat Transfer Symposium of Japan, 2001, pp. 899-900.
[22] E. Hihara, Heat transfer characteristics of CO2, in: Workshop Proceedings - Selected Issues on CO2 as working
Fluid in Compression Systems, Trondheim, Norway, 2000, pp. 77-84.
[23] E. Shinmura, K. Take, S. Koyama, Development of high-performance CO2 evaporator, in: JSAE Automotive
Air-Conditioning Symposium, 2006, pp. 217-227.
[24] Y. Zhao, M. Molki, M. M. Ohadi, S.V. Dessiatoun, Flow boiling of CO2 in microchannels, ASHRAE
Transactions, Vol. 106, Part I, 2000, pp. 437-445.
[25] Y. Zhao, M. Molki, M.M. Ohadi, Heat transfer and pressure drop of CO2 flow boiling in microchannels, in:
Proceedings of the ASME Heat Transfer Division, Vol. 2, 2000, pp. 243-249.
[26] R. Yun, C. Choi, Y. Kim, Convective boiling heat transfer of carbon dioxide in horizontal small diameter tubes, in:
IIR/IIF-Commission B1, B2, E1 and E2-Guangzhou, China, 2002, pp.293-303.
[27] R. Yun, Y. Kim, M.S. Kim, Flow boiling heat transfer of carbon dioxide in horizontal mini tubes, Int. J. Heat Fluid
Flow 26 (2005) 801-809.
[28] S. Jeong, E. Cho, H. Kim, Evaporative heat transfer and pressure drop of in a microchannel tube, in: Proceedings
of the 3nd International Conference on Microchannels and minichannels, 2005, Toronto, Ontario, Canada, Part B,
pp. 103-108.
14
[29] REFPROP. NIST Refrigerant Properties Database 23, Gaithersburg, MD, 1998, Version 6.01
[30] C. Y. Park, P. S. Hrnjak, Flow boiling heat transfer of CO2 at low temperatures in a horizontal smooth tube, J. Heat
Transfer 127 (2005) 1305-1312.
[31] C.Y. Park, P.S. Hrnjak, Evaporation of CO2 in a horizontal smooth tube, in: IIR 2005 Vicenza
Conference-Thermophysical Properties and Transfer Processes of Refrigerants, Vicenza, Italy, 2005, pp. 225-236.
[32] E. Hihara, Fundamental technology for carbon dioxide operated heat pumps, in: JSAE Automotive
Air-Conditioning Symposium, 2006, pp.243-262.
[33] J.L. Gasche, Carbon doxide evaporation in a single micro-channel, J. of the Braz. Soc. of Mech. Sci. & Eng. 28,
(1) (2006) 69-83.
[34] X.M. Wu, H.Y. Zhao, W.C. Wang, L. Jing, L. Zhang, Experimental study on evaporating heat transfer of CO2 in
thin tube, J. Engineering Thermophysics (Gong Cheng Re Wu Li Xue Bao), 26 (2005) 823-825.
[35] F.W. Dittus, L.M.K. Boelter, Heat transfer in automobile radiator of the tubular type, Univ. Calif. Publ. Eng. 2(13)
(1930) 443-461.
[36] J. El Hajal, J.R. Thome, A. Cavallini, Condensation in horizontal tubes, part 2: New heat transfer model based on
flow regimes, Int. J. of Heat and Mass Transfer 46(18) (2003) 3365-3387.
[37] D.C. Groeneveld, Post dry-out heat transfer at reactor operating conditions, ANS Topical Meeting on Water
Reactor Safety, Salt Lake City, 1973.

15
List of table captions
Table 1. Database of CO2 flow boiling heat transfer
Table 2. Statistical analysis of the predictions of flow boiling heat transfer coefficients
.
¨

16
List of figure captions
Fig.1. Experimental flow boiling heat transfer data of Park and Hrnjak [30, 31] at the experimental conditions: G = 400 kg/m2s, Tsat = -15°C and Deq = 6.1 mm. Fig. 2. Experimental flow boiling heat transfer data of Hihara [32] at the experimental conditions: G = 360 kg/m2s, Tsat
= 15 °C and q = 18 kW/m2.
Fig. 3. Experimental flow boiling heat transfer data of Gasche [33] at the experimental conditions: G = 96 kg/m2s, Tsat = 23.3 °C, Deq = 0.833 mm and q = 1.81 kW/m2. Fig. 4. (a) Comparison of the predicted heat transfer coefficients to the experimental data of Gao and Honda [19, 20]; (b) The corresponding flow pattern map; (Deq = 3 mm, G = 390 kg/m2s, Tsat = 10 °C, q = 20 kW/m2). Fig. 5. (a) Comparison of the predicted flow boiling heat transfer coefficients to the experimental heat transfer data of Tanaka et al. [21]; (b) The corresponding flow pattern map. (Deq = 1 mm, G = 360 kg/m2s, Tsat = 15 °C, q = 9 kW/m2).
Fig. 6. (a) Comparison of the predicted heat transfer coefficients to the experimental data of Hihara [22]; (b) The corresponding flow pattern map. (Deq = 1 mm, G = 720 kg/m2s, Tsat = 15 °C, q = 18 kW/m2). Fig. 7. (a) Comparison of the predicted heat transfer coefficients to the experimental data of Shinmura et al. [23]; (b) The corresponding flow pattern map. (Deq = 0.6 mm, G = 400 kg/m2s, Tsat = 5.83 °C, q = 20 kW/m2). Fig. 8. (a) Comparison of the predicted heat transfer coefficients to the experimental data of Zhao et al. [24, 25]; (b) The corresponding flow pattern map. (Deq = 1.15 mm, G = 300 kg/m2s, Tsat = 10 °C, q = 11 kW/m2). Fig. 9. (a) Comparison of the predicted heat transfer coefficients to the experimental data of Yun et al. [26, 27]; (b) The corresponding flow pattern map. (Deq = 2 mm, G = 1500 kg/m2s, Tsat = 5 °C, q = 30 kW/m2). Fig. 10. (a) Comparison of the predicted heat transfer coefficients to the experimental data of Jeong et al. [28]; (b) The corresponding flow pattern map. (Deq = 2.3 mm, G = 450 kg/m2s, Tsat = 10 °C, q = 8 kW/m2). Fig. 11. Comparison of the predicted flow boiling heat transfer coefficients to the new data in the database (1- Gao and Honda [19, 20], 2- Tanaka et al. [21], 3-Hihara [22], 4-Shinmura et al. [23], 5-Zhao et al. [24, 25], 6-Yun et al. [26, 27], 7-Jeong et al. [28]). (a) Comparison of the predicted results to the entire new database; (b) Comparison of the predicted results to the new data without the dryout and mist flow data.

17
Table 1 Database of flow boiling heat transfer for CO2
∗ The data used in the previous study [1] and the values in the brackets are hydraulic diameters, for circular channels, the hydraulic diameter equals to equivalent diameter.
Data source Channel configuration and material
Equivalent diameter Deq (mm)
Saturation temperature Tsat (°C)
Reduced pressure pr
Mass flux G (kg/m2s)
Heat flux q (kW/m2)
Data points
Heating method
*Knudsen and Jensen [13]
Single circular tube, stainless steel
10.06 -28 0.21 80 8, 13 16 Heated by condensing R-22 vapor
*Yun et al. [14] Single circular tube, stainless steel
6 5, 10 0.54, 0.61 170, 240, 340 10, 15, 20 53 Electrical heating
*Yoon et al. [15]
Single circular tube, stainless steel
7.35 0, 5. 10, 15, 20
0.47, 0.54, 0.61, 0.69 0.78
318 12.5, 16.4, 18.6 127 Electrical heating
*Koyama et al. [16]
Single circular tube, stainless steel
1.8 0.26, 9.98, 10.88 0.47, 0.61, 0.62 250, 260 32.06 36 Electrical heating
*Pettersen [17]
Multi-channel with 25 circular channels, aluminium
0.8 0, 10, 20, 25 0.47, 0.61, 0.78, 0.87 190, 280, 380, 570 5, 10, 15, 20 46 Heated by water
*Yun et al. [18]
Multi-channels with rectangle channels
1.52 (1.14)∗ 1.74 (1.53)∗
1.81 (1.54)∗
5 0.54 200, 300, 400 10, 15, 20 56 Electrical heating
Gao and Honda [19, 20]
Single circular tube, stainless steel
3 -7, 10 0.39, 0.61
236, 390, 393, 590, 786, 1179
10, 20, 21 150 Electrical heating
Tanaka et al. [21] Single circular tube, Stainless steel
1 15 0.69 360 9, 18, 36 119 Electrical heating
Hihara [22] Single circular tube, stainless steel
1 15 0.69 720, 1440 9, 18, 36 150 Electrical heating
Shinmura et al. [23] Multi-ciruclar channels, aluminum
0.6 5.83 0.55 400 10, 20 48 Heated by hot water
Zhao et al. [24, 25] Multi-triangle channels, aluminum
1.15 (0.86)∗ 10 0.61 300 11 11 Electrical heating
Yun et al. [26, 27] Single circular channel
0.98, 2 5, 10 0.54, 0.61 1000, 1500 7.2, 7.3, 15.9, 16.2, 20, 26, 26.5, 30, 36, 46
224 Electrical heating
Jeong et al. [28] Multi rectangle channels, aluminum
2.3 (2)∗ 0, 5, 10 0.47, 0.54, 0.61 450, 600, 750 4, 8, 12 88 Electrical heating
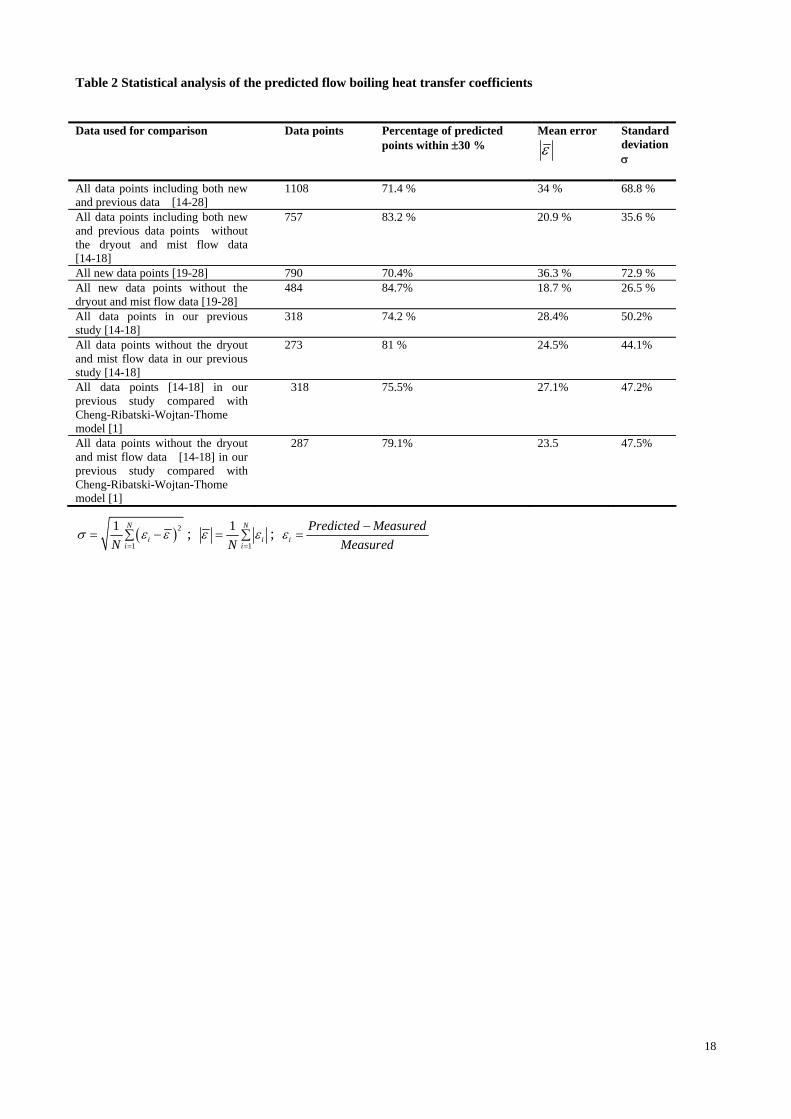
Table 2 Statistical analysis of the predicted flow boiling heat transfer coefficients
Data used for comparison
Data points Percentage of predicted points within ±30 %
18
Mean error
ε
Standard deviation σ
All data points including both new and previous data [14-28]
1108 71.4 % 34 % 68.8 %
All data points including both new and previous data points without the dryout and mist flow data [14-18]
757 83.2 % 20.9 % 35.6 %
All new data points [19-28] 790 70.4% 36.3 % 72.9 % All new data points without the dryout and mist flow data [19-28]
484 84.7% 18.7 % 26.5 %
All data points in our previous study [14-18]
318 74.2 % 28.4% 50.2%
All data points without the dryout and mist flow data in our previous study [14-18]
273 81 % 24.5% 44.1%
All data points [14-18] in our previous study compared with Cheng-Ribatski-Wojtan-Thome model [1]
318 75.5% 27.1% 47.2%
All data points without the dryout and mist flow data [14-18] in our previous study compared with Cheng-Ribatski-Wojtan-Thome model [1]
287 79.1% 23.5 47.5%
( )2
1
1 N
iiN
σ ε ε=
= −∑ ; 1
1 N
iiN
ε ε=
= ∑ ; iPredicted Measured
Measuredε −=
0 0.1 0.2 0.3 0.4 0.5 0.6 0.7 0.8 0.9 10
1
2
3
4
5
6
7
8
9
10
Vapor quality
Hea
t tra
nsfe
r coe
ffici
ent [
kW/m
2 K]
q = 5 kW/m2
q = 10 kW/m2
q = 15 kW/m2
Fig.1. Experimental flow boiling heat transfer data of Park and Hrnjak [30, 31] at the experimental conditions: G = 400 kg/m2s, Tsat = -15°C and Deq = 6.1 mm.
19
0 0.1 0.2 0.3 0.4 0.5 0.6 0.7 0.8 0.9 10
2
4
6
8
10
12
14
16
Vapor quality
Hea
t tra
nsfe
r coe
ffici
ent [
kW/m
2 K]
D = 4 mmD = 6 mm
Fig. 2. Experimental flow boiling heat transfer data of Hihara [32] at the experimental conditions: G = 360 kg/m2s, Tsat
= 15 °C and q = 18 kW/m2.
20
0 0.1 0.2 0.3 0.4 0.5 0.6 0.7 0.8 0.9 12
4
6
8
10
12
14
16
Vapor quality
Hea
t tra
nsfe
r coe
ffici
ent [
kW/m
2 K]
Fig. 3. Experimental flow boiling heat transfer data of Gasche [33] at the experimental conditions: G = 96 kg/m2s, Tsat = 23.3 °C, Deq = 0.83 mm and q = 1.81 kW/m2.
21
0 0.1 0.2 0.3 0.4 0.5 0.6 0.7 0.8 0.9 10
2
4
6
8
10
12
14
16
Vapor quality
Hea
t tra
nsfe
r coe
ffici
ent [
kW/m
2 K]
(a)
0 0.1 0.2 0.3 0.4 0.5 0.6 0.7 0.8 0.9 10
100
200
300
400
500
600
700
Vapor quality
Mas
s Ve
loci
ty [k
g/m
2 s] AI
SWSW+SLUG
S
D
M
(b)
Fig. 4. (a) Comparison of the predicted heat transfer coefficients to the experimental data of Gao and Honda [19, 20]; (b) The corresponding flow pattern map; (Deq = 3 mm, G = 390 kg/m2s, Tsat = 10 °C, q = 20 kW/m2).
22
0 0.1 0.2 0.3 0.4 0.5 0.6 0.7 0.8 0.9 10
2
4
6
8
10
12
14
Vapor quality
Hea
t tra
nsfe
r coe
ffici
ent [
kW/m
2 K]
(a)
0 0.1 0.2 0.3 0.4 0.5 0.6 0.7 0.8 0.9 10
100
200
300
400
500
600
700
Vapor quality
Mas
s Ve
loci
ty [k
g/m
2 s] AI
SWSW+SLUG
S
D M
(b)
Fig. 5. (a) Comparison of the predicted flow boiling heat transfer coefficients to the experimental heat transfer data of Tanaka et al. [21]; (b) The corresponding flow pattern map. (Deq = 1 mm, G = 360 kg/m2s, Tsat = 15 °C, q = 9 kW/m2).
23

0 0.1 0.2 0.3 0.4 0.5 0.6 0.7 0.8 0.9 10
2
4
6
8
10
12
14
16
18
Vapor quality
Hea
t tra
nsfe
r coe
ffici
ent [
W/m
2 K]
(a)
0 0.1 0.2 0.3 0.4 0.5 0.6 0.7 0.8 0.9 10
100
200
300
400
500
600
700
800
900
1000
Vapor quality
Mas
s Ve
loci
ty [k
g/m
2 s]
AI
SWSW+SLUGS
D M
(b)
Fig. 6. (a) Comparison of the predicted heat transfer coefficients to the experimental data of Hihara [22]; (b) The corresponding flow pattern map. (Deq = 1 mm, G = 720 kg/m2s, Tsat = 15 °C, q = 18 kW/m2).
24

0 0.1 0.2 0.3 0.4 0.5 0.6 0.7 0.8 0.9 10
2
4
6
8
10
12
14
16
18
20
Vapor quality
Hea
t tra
nsfe
r coe
ffici
ent [
kW/m
2 K]
(a)
0 0.1 0.2 0.3 0.4 0.5 0.6 0.7 0.8 0.9 10
100
200
300
400
500
600
700
Vapor quality
Mas
s Ve
loci
ty [k
g/m
2 s] AI
SWSW+SLUG
S
D M
(b)
Fig. 7. (a) Comparison of the predicted heat transfer coefficients to the experimental data of Shinmura et al. [23]; (b) The corresponding flow pattern map. (Deq = 0.6 mm, G = 400 kg/m2s, Tsat = 5.83 °C, q = 20 kW/m2).
25

0 0.1 0.2 0.3 0.4 0.5 0.6 0.7 0.8 0.9 10
2
4
6
8
10
12
14
Vapor quality
Hea
t tra
nsfe
r coe
ffici
ent [
kW/m
2 K]
(a)
0 0.1 0.2 0.3 0.4 0.5 0.6 0.7 0.8 0.9 10
100
200
300
400
500
600
700
Vapor quality
Mas
s Ve
loci
ty [k
g/m
2 s] AI
SWSW+SLUG
S
D M
(b)
Fig. 8. (a) Comparison of the predicted heat transfer coefficients to the experimental data of Zhao et al. [24, 25]; (b) The corresponding flow pattern map. (Deq = 1.15 mm, G = 300 kg/m2s, Tsat = 10 °C, q = 11 kW/m2).
26

0 0.1 0.2 0.3 0.4 0.5 0.6 0.7 0.8 0.9 12
4
6
8
10
12
14
16
18
20
Vapor quality
Hea
t tra
nsfe
r coe
ffici
ent [
kW/m
2 K]
(a)
0 0.1 0.2 0.3 0.4 0.5 0.6 0.7 0.8 0.9 10
200
400
600
800
1000
1200
1400
1600
Vapor quality
Mas
s Ve
loci
ty [k
g/m
2 s]
A
I
SWSW+SLUGS
D M
B
(b)
Fig. 9. (a) Comparison of the predicted heat transfer coefficients to the experimental data of Yun et al. [26, 27]; (b) The corresponding flow pattern map. (Deq = 2 mm, G = 1500 kg/m2s, Tsat = 5 °C, q = 30 kW/m2).
27

0 0.1 0.2 0.3 0.4 0.5 0.6 0.7 0.8 0.9 11
2
3
4
5
6
7
8
9
10
11
12
Vapor quality
Hea
t tra
nsfe
r coe
ffici
ent [
kW/m
2 K]
(a)
0 0.1 0.2 0.3 0.4 0.5 0.6 0.7 0.8 0.9 10
100
200
300
400
500
600
700
Vapor quality
Mas
s Ve
loci
ty [k
g/m
2 s]
AI
SWSW+SLUG
S
D
M
(b)
Fig. 10. (a) Comparison of the predicted heat transfer coefficients to the experimental data of Jeong et al. [28]; (b) The corresponding flow pattern map. (Deq = 2.3 mm, G = 450 kg/m2s, Tsat = 10 °C, q = 8 kW/m2).
28

0 5 10 15 20 25 300
5
10
15
20
25
30
Experimental heat transfer coefficient [kW/m2K]
Pred
icte
d he
at tr
ansf
er c
oeffi
cien
t [kW
/m2 K
] 1234567
+30%
-30%
(a)
0 5 10 15 20 25 300
5
10
15
20
25
30
Experimental heat transfer coefficient [kW/m2K]
Pred
icte
d he
at tr
ansf
er c
oeffi
cien
t [kW
/m2 K
] 1234567
+30%
-30%
(b)
Fig. 11. Comparison of the predicted flow boiling heat transfer coefficients to the new data in the database (1- Gao and Honda [19, 20], 2- Tanaka et al. [21], 3-Hihara [22], 4-Shinmura et al. [23], 5-Zhao et al. [24, 25], 6-Yun et al. [26, 27], 7-Jeong et al. [28]). (a) Comparison of the predicted results to the entire new database; (b) Comparison of the predicted results to the new data without the dryout and mist flow data.
29