new mexico state university staffing...
TRANSCRIPT

1Copyright © 2014 Deloitte Development LLC. All rights reserved.
New Mexico State UniversityStaffing StudyOpportunities for Cost Reduction Report
September 14, 2015

2Copyright © 2014 Deloitte Development LLC. All rights reserved.
Table of ContentsI. Executive Summary
Purpose of the DocumentProject Scope and ApproachCurrent State OverviewKey Observations and Opportunities
II. Functional Area Analysis
Human ResourcesProcurementITGeneral AdministrationFinanceStudent Administrative Services Facility Services
AdvancementCommunicationsOperational Management Research Development, Compliance and AdministrationEducational ProgramsAuxiliary ServicesResearch, Scholarship and Creative Activities
Appendix

Executive Summary
4Copyright © 2014 Deloitte Development LLC. All rights reserved.
Purpose of DocumentThe points outlined below provide important context for reading this document. This document “Opportunities for Cost Reduction Report” is a deliverable output of Phase I of NMSU’s Staffing Study project developed by
Deloitte Consulting in close consultation with University leadership and the NMSU Support Team.
This document is one of three outputs from this 10-week study. The other two deliverables include: 1. NMSU and Peer Benchmarking Report, 2. Business Cases and Recommendations Report.
The goal of the Staffing Study was to analyze staffing for administrative functions at NMSU’s Las Cruces campus to identify opportunities for operational expenditure reductions and resource reallocations.
The scope of this initial assessment included 14 Administrative Functions – General Administration, Operational Management, Advancement, Finance, Human Resources, Information Technology, Procurement, Facility Services, Auxiliary Services, Communications, StudentAdministrative Services, Research Administration, Research, Public Service and Scholarly and Creative Activities, and Educational Programs. These areas were selected in collaboration with University leadership and the NMSU Support Team.
Contents include an Executive Summary with information on Project Overview and Scope, the University’s current state operating model, a summary analysis of staffing levels within core administrative functions, a summary of key findings and observations, and a list of identified opportunities to improve operational effectiveness and efficiency.
In addition to the Executive Summary, there is more detailed analysis on staffing levels, labor costs, operating models, and management coverage for each of the in-scope functions that follows in the body of this document.
Inputs for this initial assessment include– data from a detailed activity analysis (as reported by managers) to determine how employees spend their time supporting the in-scope functions; university-wide organizational charts; and financial and human resources data generated from NMSU systems. In certain cases where possible, benchmarks were also used to assess University performance against standards.
This is intended to provide directional input to understand and identify potential opportunities to further explore in more detail in the remaining Phase I deliverables.
Decisions about opportunities to implement should be made after careful consideration of this deliverable and future Phase I deliverables which will include more detailed business cases for selected opportunities. These business cases will contain additional information on the associated complexities, risks, costs and implementation timeframes for the opportunities selected for this additional analysis.

Project Scope and Approach

6Copyright © 2014 Deloitte Development LLC. All rights reserved.
The NMSU Staffing Study was a 10-week project focused on analyzing key staffing metrics internally and in relation to peers
Analyze staffing for administrative support functions on the Las Cruces campus to identify opportunities for operational expenditure reductions and resource reallocations. Support the best alignment of non-faculty staffing with the core mission of the University and Vision
2020 Strategic Plan within the available financial structure. Survey 3 peer institutions (Montana State University, Utah State University, University of New Mexico)
to understand Staffing levels (at the FTE level) and budget data for in-scope process and to document key demographic, operational, and technology information to normalize data for comparison. Use other, comparable national benchmark data sources for additional comparison where needed.
A final report containing analysis and findings related to non-faculty staffing levels at NMSU to document the Current State Operating Model and Improvement Opportunities. A summary Benchmarking report of findings to compare NMSU to each of the peer institutions and to
comparable, national benchmarking data. Business Cases for Select Improvement Opportunities.
Project Goals & Objectives
Project Outputs
Step 1 – Assess Current Organization Gather and review as-is organizational data (e.g. employee HR/Fin data by function, key transactional
data by function). Conduct detailed analysis of employee-level engagement for core activities within a function. Compare current state assessment to peer institutions and national Higher Education Benchmarks. Document service delivery model and identify opportunity areas for consideration.Step 2 – Identify Organizational Improvement Opportunities Identify opportunities for cost reduction through improvements to service delivery model, business
processes, policies, and the implementation of enabling technologies. Create a business case and develop recommendations
Project Scope
7Copyright © 2014 Deloitte Development LLC. All rights reserved.
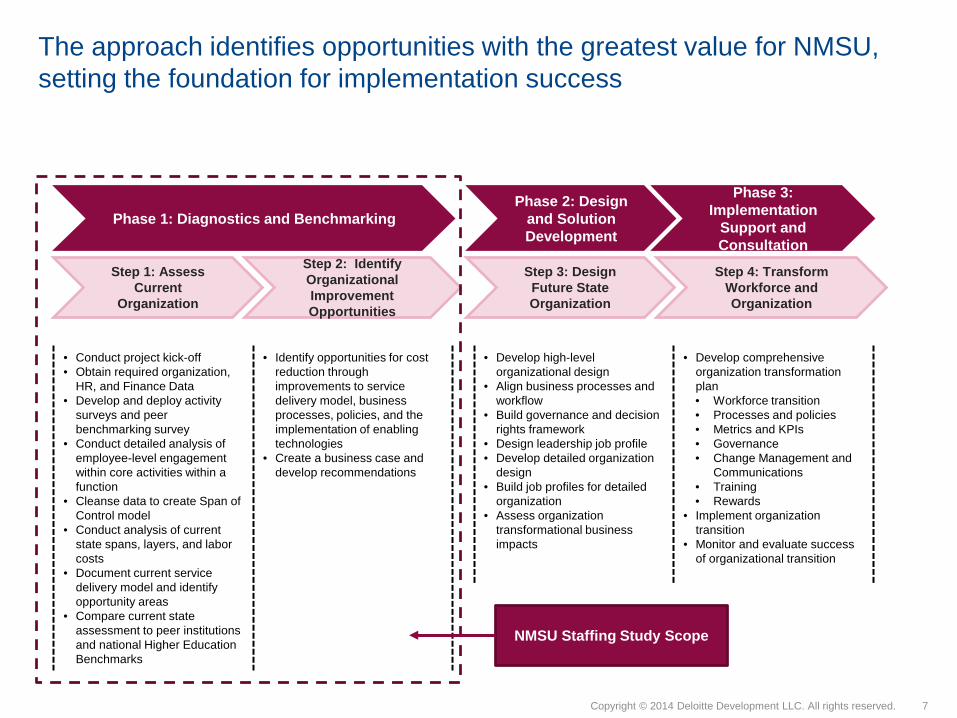
The approach identifies opportunities with the greatest value for NMSU, setting the foundation for implementation success
Phase 1: Diagnostics and Benchmarking
Step 1: Assess Current
Organization
Step 2: Identify Organizational Improvement Opportunities
• Conduct project kick-off• Obtain required organization,
HR, and Finance Data• Develop and deploy activity
surveys and peer benchmarking survey
• Conduct detailed analysis of employee-level engagement within core activities within a function
• Cleanse data to create Span of Control model
• Conduct analysis of current state spans, layers, and labor costs
• Document current service delivery model and identify opportunity areas
• Compare current state assessment to peer institutions and national Higher Education Benchmarks
• Identify opportunities for cost reduction through improvements to service delivery model, business processes, policies, and the implementation of enabling technologies
• Create a business case and develop recommendations
• Develop high-level organizational design
• Align business processes and workflow
• Build governance and decision rights framework
• Design leadership job profile• Develop detailed organization
design• Build job profiles for detailed
organization• Assess organization
transformational business impacts
• Develop comprehensive organization transformation plan• Workforce transition• Processes and policies• Metrics and KPIs• Governance• Change Management and
Communications• Training• Rewards
• Implement organization transition
• Monitor and evaluate success of organizational transition
Phase 2: Design and Solution Development
Step 3: Design Future State Organization
Step 4: Transform Workforce and Organization
Phase 3: Implementation
Support and Consultation
NMSU Staffing Study Scope
8Copyright © 2014 Deloitte Development LLC. All rights reserved.
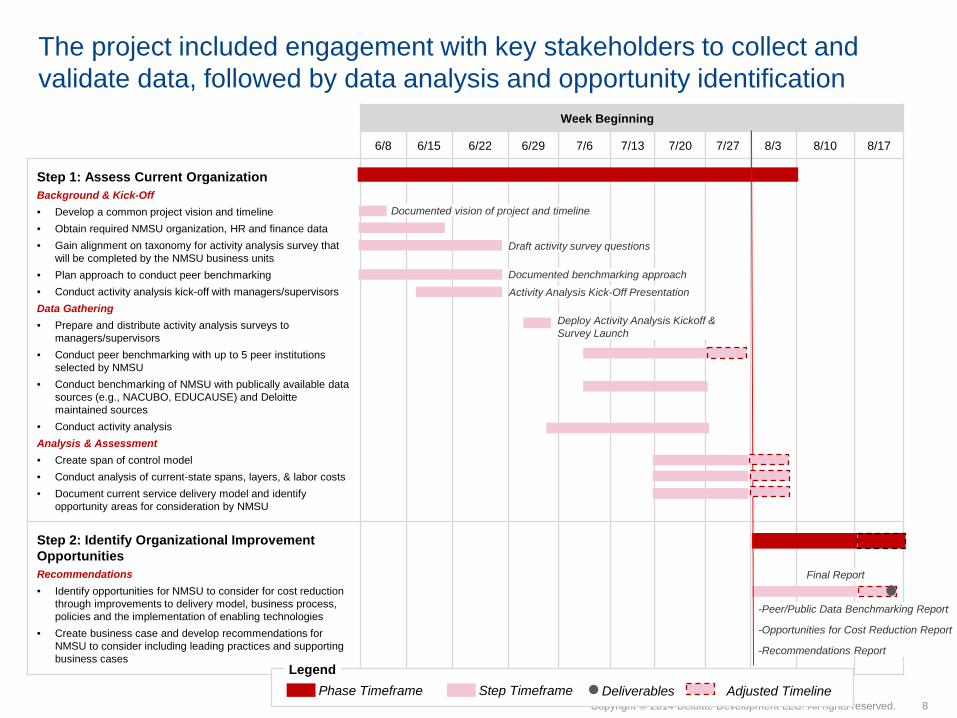
Week Beginning
6/8 6/15 6/22 6/29 7/6 7/13 7/20 7/27 8/3 8/10 8/17
Step 1: Assess Current OrganizationBackground & Kick-Off• Develop a common project vision and timeline• Obtain required NMSU organization, HR and finance data• Gain alignment on taxonomy for activity analysis survey that
will be completed by the NMSU business units• Plan approach to conduct peer benchmarking• Conduct activity analysis kick-off with managers/supervisorsData Gathering• Prepare and distribute activity analysis surveys to
managers/supervisors• Conduct peer benchmarking with up to 5 peer institutions
selected by NMSU• Conduct benchmarking of NMSU with publically available data
sources (e.g., NACUBO, EDUCAUSE) and Deloitte maintained sources
• Conduct activity analysisAnalysis & Assessment• Create span of control model• Conduct analysis of current-state spans, layers, & labor costs• Document current service delivery model and identify
opportunity areas for consideration by NMSU
Step 2: Identify Organizational Improvement OpportunitiesRecommendations• Identify opportunities for NMSU to consider for cost reduction
through improvements to delivery model, business process, policies and the implementation of enabling technologies
• Create business case and develop recommendations for NMSU to consider including leading practices and supporting business cases
Documented benchmarking approach
Draft activity survey questions
LegendDeliverablesPhase Timeframe Step Timeframe
Documented vision of project and timeline
Activity Analysis Kick-Off Presentation
Deploy Activity Analysis Kickoff & Survey Launch
-Peer/Public Data Benchmarking Report
-Opportunities for Cost Reduction Report
-Recommendations Report
Final Report
Adjusted Timeline
The project included engagement with key stakeholders to collect and validate data, followed by data analysis and opportunity identification
Current State Overview
10Copyright © 2014 Deloitte Development LLC. All rights reserved.
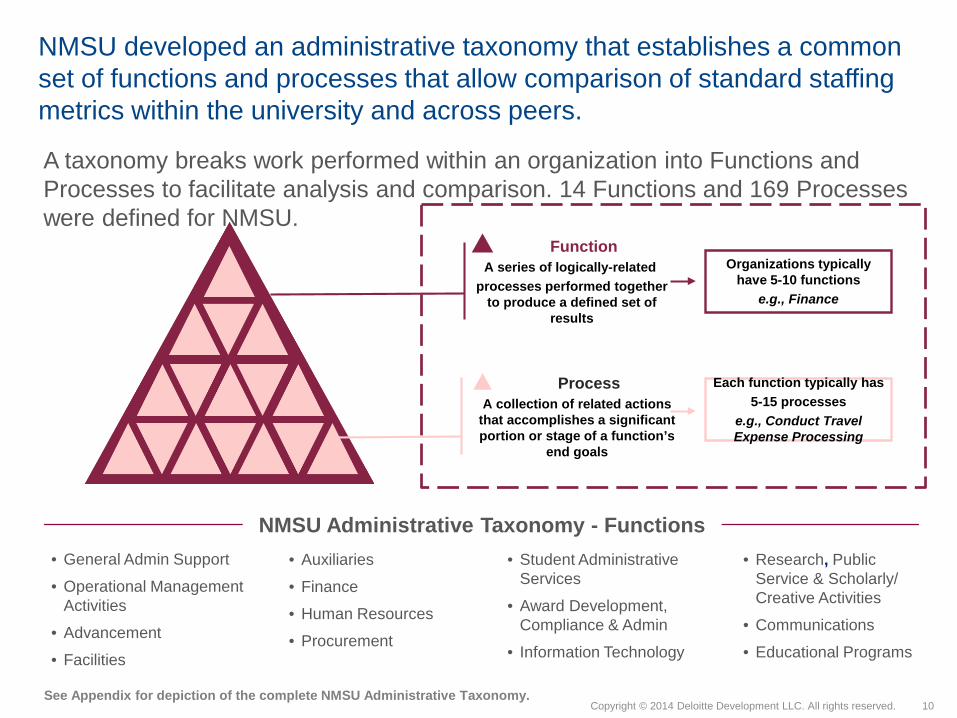
A taxonomy breaks work performed within an organization into Functions and Processes to facilitate analysis and comparison. 14 Functions and 169 Processes were defined for NMSU.
NMSU developed an administrative taxonomy that establishes a common set of functions and processes that allow comparison of standard staffing metrics within the university and across peers.
FunctionA series of logically-related
processes performed together to produce a defined set of
results
Each function typically has 5-15 processes
e.g., Conduct Travel Expense Processing
Organizations typically have 5-10 functions
e.g., Finance
See Appendix for depiction of the complete NMSU Administrative Taxonomy.
NMSU Administrative Taxonomy - Functions• Research, Public
Service & Scholarly/ Creative Activities
• Communications
• Educational Programs
• Student Administrative Services
• Award Development, Compliance & Admin
• Information Technology
• Auxiliaries
• Finance
• Human Resources
• Procurement
• General Admin Support
• Operational Management Activities
• Advancement
• Facilities
ProcessA collection of related actions
that accomplishes a significant portion or stage of a function’s
end goals

11Copyright © 2014 Deloitte Development LLC. All rights reserved.
In half of the functions a majority of the work is performed by the centralized Division. However, there is also considerable “fragmentation”* of work across many core functions which means that these functions are also being performed decentrally throughout many divisions.
% of Centralized FTEs vs. Non Centralized by Function
*For some functions, such as Operational Management, fragmentation is an expected model for providing service. In other functions, it may indicate potential opportunities for new operating models that support greater efficiency. Each function must be analyzed separately to make this determination.
22%
22%
36%
38%
38%
40%
45%
50%
57%
57%
66%
75%
80%
99%
78%
78%
64%
62%
62%
60%
55%
50%
43%
43%
34%
25%
20%
1%
0% 10% 20% 30% 40% 50% 60% 70% 80% 90% 100%
Operational Management Activities
Procurement
Educational Programs
General Admin Support
Human Resources
Research Development, Compliance, and Administration
Information Technology
Finance Activities
Research, Public Service, and Scholarly and Creative Activities
Advancement
Student Administrative Services
Communications / University Relations
Facilities Services
Auxiliaries
Percent of Centralized FTE Percent of Non Centralized FTE

12Copyright © 2014 Deloitte Development LLC. All rights reserved.
% of time spent in Function
Another outcome of this fragmentation is that staff divisions spend time supporting work across both centralized and decentralized functions. This can create an environment of many “generalists” without specialized skills or training which can result in efficiency and compliance issues.
In many divisions, a significant percentage of FTE time is spent supporting work outside of the core mission of the division
% of Centralized FTEs vs. Non Centralized by Divsion
8%14%
17%23%23%
33%44%
47%55%
67%68%69%
74%77%
80%82%82%84%
92%86%
83%77%77%
67%56%
53%45%
33%32%31%
26%23%
20%18%18%16%
0% 10% 20% 30% 40% 50% 60% 70% 80% 90% 100%
Ag Experiment StationCooperative Extension Service
President OfficeAcademic Administration
CollegesHonors College/Crimson School Program
Institutional AnalysisVice President Research
Human ResourcesAudit Services
Student Affairs and Enrollment Mgmt.Procurement
Auxiliary ServicesUniversity Communications
Information TechnologyFacilities and Services
Senior VP for Admin and FinanceUniversity Advancement VP Office
Percent FTE Completing Centralized Work Percent FTE Completing Non Centralized Work
13Copyright © 2014 Deloitte Development LLC. All rights reserved.
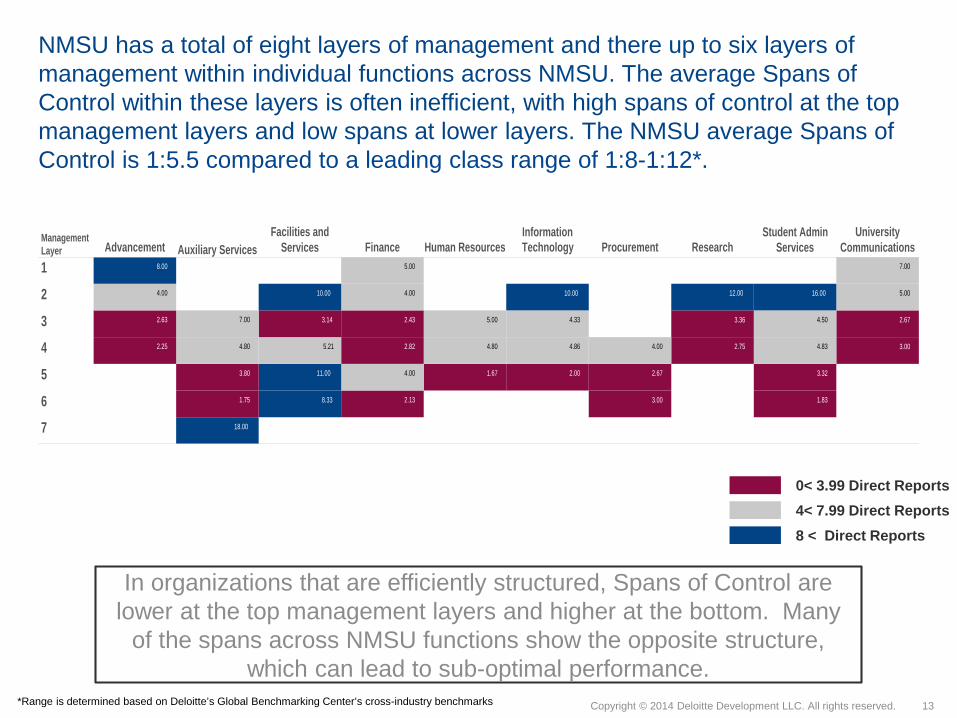
NMSU has a total of eight layers of management and there up to six layers of management within individual functions across NMSU. The average Spans of Control within these layers is often inefficient, with high spans of control at the top management layers and low spans at lower layers. The NMSU average Spans of Control is 1:5.5 compared to a leading class range of 1:8-1:12*.
0< 3.99 Direct Reports4< 7.99 Direct Reports
In organizations that are efficiently structured, Spans of Control are lower at the top management layers and higher at the bottom. Many
of the spans across NMSU functions show the opposite structure, which can lead to sub-optimal performance.
*Range is determined based on Deloitte’s Global Benchmarking Center’s cross-industry benchmarks
ManagementLayer Advancement Auxiliary Services
Facilities andServices Finance Human Resources
InformationTechnology Procurement Research
Student AdminServices
UniversityCommunications
1
2
3
4
5
6
7
3.00
2.67
5.00
7.00
1.83
3.32
4.83
4.50
16.00
2.75
3.36
12.00
3.00
2.67
4.00
2.00
4.86
4.33
10.00
1.67
4.80
5.00
2.13
4.00
2.82
2.43
4.00
5.00
8.33
11.00
5.21
3.14
10.00
18.00
1.75
3.80
4.80
7.00
2.25
2.63
4.00
8.00
8 < Direct Reports

Key Observations and Opportunities
15Copyright © 2014 Deloitte Development LLC. All rights reserved.
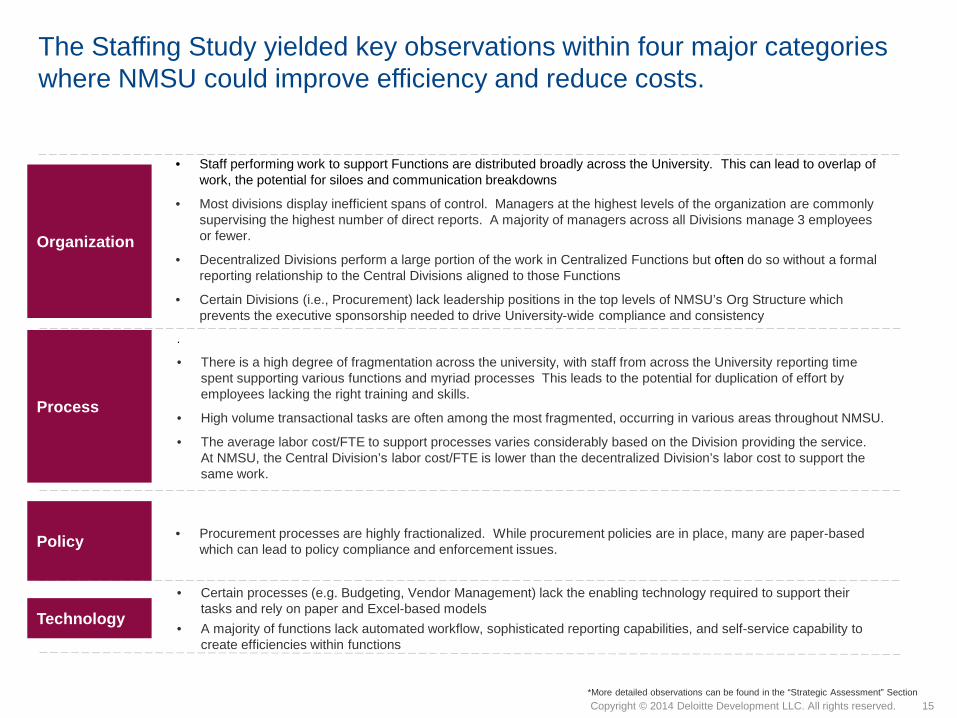
The Staffing Study yielded key observations within four major categories where NMSU could improve efficiency and reduce costs.
Organization
• Staff performing work to support Functions are distributed broadly across the University. This can lead to overlap of work, the potential for siloes and communication breakdowns
• Most divisions display inefficient spans of control. Managers at the highest levels of the organization are commonly supervising the highest number of direct reports. A majority of managers across all Divisions manage 3 employees or fewer.
• Decentralized Divisions perform a large portion of the work in Centralized Functions but often do so without a formal reporting relationship to the Central Divisions aligned to those Functions
• Certain Divisions (i.e., Procurement) lack leadership positions in the top levels of NMSU’s Org Structure which prevents the executive sponsorship needed to drive University-wide compliance and consistency
Technology• Certain processes (e.g. Budgeting, Vendor Management) lack the enabling technology required to support their
tasks and rely on paper and Excel-based models• A majority of functions lack automated workflow, sophisticated reporting capabilities, and self-service capability to
create efficiencies within functions
.
• There is a high degree of fragmentation across the university, with staff from across the University reporting time spent supporting various functions and myriad processes This leads to the potential for duplication of effort by employees lacking the right training and skills.
• High volume transactional tasks are often among the most fragmented, occurring in various areas throughout NMSU.
• The average labor cost/FTE to support processes varies considerably based on the Division providing the service. At NMSU, the Central Division’s labor cost/FTE is lower than the decentralized Division’s labor cost to support the same work.
Process
Policy • Procurement processes are highly fractionalized. While procurement policies are in place, many are paper-based which can lead to policy compliance and enforcement issues.
*More detailed observations can be found in the “Strategic Assessment” Section
16Copyright © 2014 Deloitte Development LLC. All rights reserved.
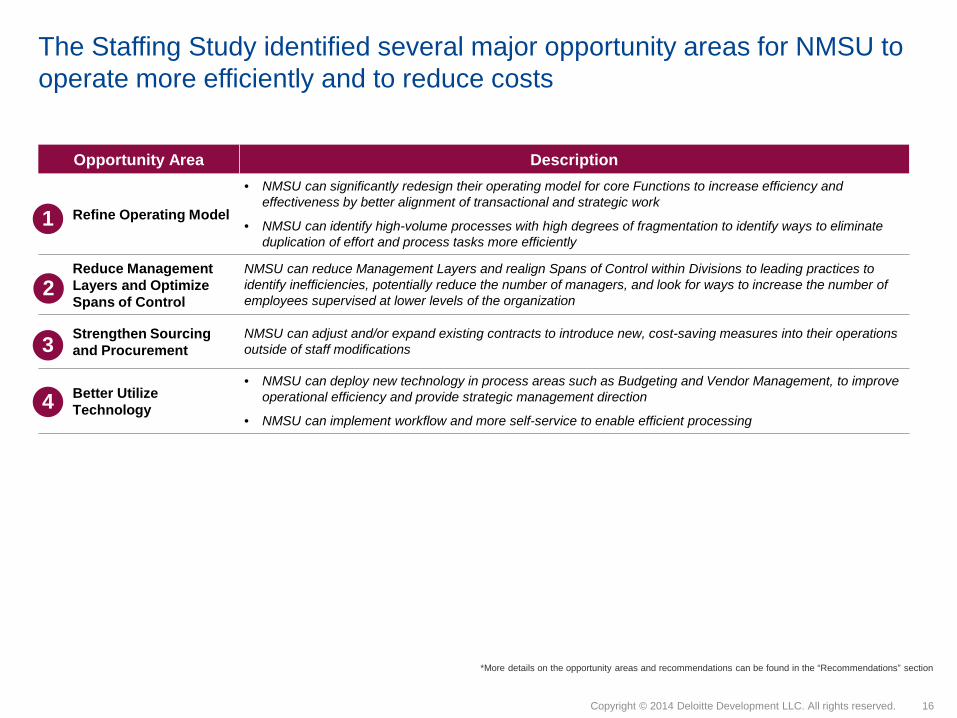
The Staffing Study identified several major opportunity areas for NMSU to operate more efficiently and to reduce costs
Opportunity Area Description
Refine Operating Model
• NMSU can significantly redesign their operating model for core Functions to increase efficiency and effectiveness by better alignment of transactional and strategic work
• NMSU can identify high-volume processes with high degrees of fragmentation to identify ways to eliminate duplication of effort and process tasks more efficiently
Reduce Management Layers and Optimize Spans of Control
NMSU can reduce Management Layers and realign Spans of Control within Divisions to leading practices to identify inefficiencies, potentially reduce the number of managers, and look for ways to increase the number of employees supervised at lower levels of the organization
Strengthen Sourcing and Procurement
NMSU can adjust and/or expand existing contracts to introduce new, cost-saving measures into their operations outside of staff modifications
Better Utilize Technology
• NMSU can deploy new technology in process areas such as Budgeting and Vendor Management, to improve operational efficiency and provide strategic management direction
• NMSU can implement workflow and more self-service to enable efficient processing
1
2
3
4
*More details on the opportunity areas and recommendations can be found in the “Recommendations” section

17Copyright © 2014 Deloitte Development LLC. All rights reserved.
Through estimation of potential value and implementation timeline, the following key opportunities were identified
Opportunity
1 Leverage more support staff versus professional staff across key functions to reduce total operating costs
2 Consolidate management responsibilities university-wide by reducing the number of management layers from six to four
3 Establish a university-wide span of control policy that eliminates all span of control relationships that are less than 3:1 (staff: manager)
4 Assess labor cost per FTE to further validate if the results from the benchmarking effort are accurate
5 Standardize coverage ratios of administrative support staff
6 Restructure IT service delivery model for greater efficiency and effectiveness
7 Outsource the Tier-1 help desk
8 Redesign the Finance Operating Model
9 Streamline the HR Operating Model for greater efficiency and effectiveness
10 Centralize Procurement authority and direct control to manage more of NMSU’s total expenditures
11 Source Spend Categories Strategically

Functional Analysis
19Copyright © 2014 Deloitte Development LLC. All rights reserved.
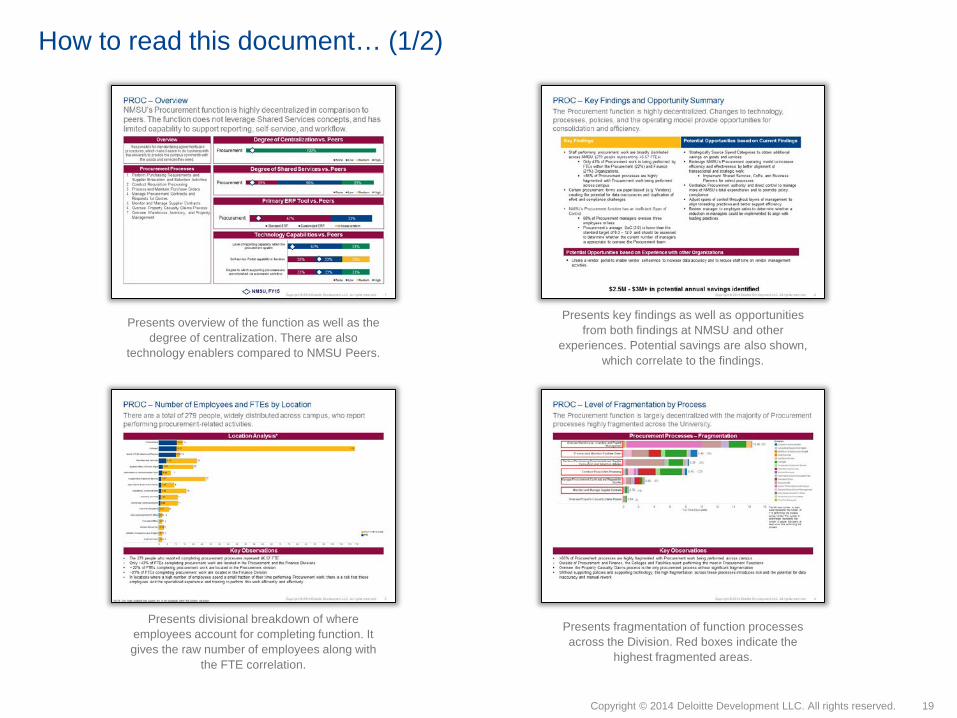
How to read this document… (1/2)
Presents overview of the function as well as the degree of centralization. There are also
technology enablers compared to NMSU Peers.
Presents key findings as well as opportunities from both findings at NMSU and other
experiences. Potential savings are also shown, which correlate to the findings.
Presents divisional breakdown of where employees account for completing function. It gives the raw number of employees along with
the FTE correlation.
Presents fragmentation of function processes across the Division. Red boxes indicate the
highest fragmented areas.

20Copyright © 2014 Deloitte Development LLC. All rights reserved.
How to read this document… (2/2)
Present labor costs: Bar charts: (1) total salaries of division, (2) labor costs for functional work across
campus, (3) labor cost of functional work occurring in division. Pie Chart: labor cost by funding type
Presents fragmentation of function processes according to labor costs.
Presents average cost per FTE by division for each function.
Presents average Span of Control for each management layer in the Division. The
Chancellor is layer 0; those that report directly to the Chancellor are layer 1; etc.

21Copyright © 2014 Deloitte Development LLC. All rights reserved.
Key Definitions
Term DefinitionSpan of Control (SoC) • Refers to the number of people reporting directly to one
individual. It is the ratio of management to staff in an organization
• Example: A manager who directly manages 5 employees has a SoC ratio of 5:1
Management Layer • Refers to the number of organizational levels having supervisory responsibilities
• We will also be referring to layers as “management levels”• Example: This organization has 3 layers
Activity Analysis • Survey of the level of effort expended by staff within NMSU for each taxonomy process
• % of effort captured at an employee level and aggregated to calculate estimated FTEs for each taxonomy process
• Analysis supported by review of key NMSU operational data and metrics
Fragmentation Analysis • Taxonomy process where 50% or less of the FTEs are not centrally located.
• Fragmentation can be advantageous when local support is required, but problematic when it leads to duplication of effort

Human Resources (HR)

23Copyright © 2014 Deloitte Development LLC. All rights reserved.
25%
50%
75%
75%
50%
25%
Level of reporting capability
Self-service Portal capability in function
Degree to which supporting processes areaccomplished via automated workflow
HR – Overview In comparison to peers, NMSU’s HR function does not leverage leading principles found in a Shared Services model and has limited capability to support reporting, self-service, and workflow.
Human Resources Processes*
Degree of Centralization vs. Peers
1. Manage Applicant Recruiting2. Manage Compensation Planning3. HR, Benefit and Payroll Data Administration4. Perform I-9 Processing5. Perform Visa Processing6. Conduct On Boarding/Out Processing 7. Manage/Execute Leave Administration8. Perform Benefits Administration9. Conduct Employee Relations10.Conduct Labor Relations11.Conduct Performance Management12.Manage Learning and Development13.Oversee Workers' Compensation14.Administer Employee Health & Wellness
Programs15.EEO16.Conduct Position Management, Succession
Management, and Workforce Planning
OverviewResponsible for personnel sourcing and hiring,
applicant tracking, skills development and tracking, benefits administration and compliance
with associated government regulations
Degree of Shared Services vs. Peers
Primary ERP Tool vs. Peers
75% 25%Human ResourcesStandard ERP Customized ERP In-house system
Technology Capabilities vs. Peers
NMSU, FY15

24Copyright © 2014 Deloitte Development LLC. All rights reserved.
HR – Key Findings and Opportunity Summary
Key Findings
Staff performing HR work are distributed broadly across NMSU (266 people representing 54.92 FTEs)
~55% of HR work is being performed by FTEs outside of the HR Organization.
The most broadly fragmented HR processes include: Applicant Recruiting, Performance Management, Learning and Development, Leave Management, On Boarding/Out Processing, and I-9 processing
There is likely overlap and duplication in duties in fragmented processes. Staff performing HR duties without a reporting relationship to Central HR might lack the right skills, training and repetition to perform their HR duties
NMSU’s HR function has an inefficient Span of Control HR’s average SoC (3.0) is lower than the leading class
benchmark of 8:1 – 12:1 and should be assessed to determine whether the current number of managers is appropriate to oversee the HR function
50% of the managers in the HR Function manage 3 or fewer There is a higher Span of Control at the top levels of the HR
Organization which leaves senior leaders managing too many employees
Span of Control at the bottom level of the HR Organization is 50% lower than the Function’s average which leaves too few employees to manage
Potential Opportunities based on Current Findings
Streamline the HR Operating Model for greater efficiency and effectiveness:
Implement Shared Services, CoEs, and Business Partners for select processes
Centralize the university onboarding/orientation process Adjust spans of control throughout layers of management to align to
leading practices and better support efficiency
$1.5M - $3M+ in potential annual savings identified
The HR function is mostly centralized; however, changes to technology, processes, policies, and the operating model provide opportunities for consolidation and efficiency.
Potential Opportunities based on Experience with other Organizations Work to integrate and increase operability between different systems (Fin, Student) and eliminate manual processes and shadow systems (e.g.,
Excel databases). Standardize Job Advertisement Process Revise Payroll Processes and Manual Payroll Controls

25Copyright © 2014 Deloitte Development LLC. All rights reserved.
HR – Number of Employees and FTEs by Location There are a total of 266 people, widely distributed across campus, who report performing HR related activities.
Location Analysis*
Key Observations• The 266 people who reported completing HR processes represent 54.92 FTE. Outside of ~9 FTEs in Student Affairs & Enrollment Management*,~
45% of FTEs completing HR work are located in the HR division. The second highest number of FTEs are reported within Student Affairs (21%). The remainder are distributed broadly across the university.
• In locations where a high number of employees spend a small fraction of their time performing HR, there is a risk that these employees lack the specialized experience and training to perform this work efficiently and effectively
*Note: The majority (~9) of Student Affairs’ 11.57 FTEs are health providers who reported their time against the “Administer Employee Health and Wellness Programs” taxonomy process
in the HR Function.
0 5 10 15 20 25 30 35 40 45 50 55 60 65 70 75
Human Resources
Student Affairs & Enroll Mgmt
Colleges
Auxiliary Services
Senior VP for Admin and Finance
University Communications
Academics Administration
Facilities and Services
Agricultural Experiment Station
Vice Pres Research
Information & Communication Tech
Cooperative Extension Service
Univ Advancement VP Office
President Office
Athletics Compliance and Eligibil
Audit Services 1
1
1
1
2
1
37
51
71
33
14
21
10
6
7
9
21.07
11.57
9.05
0.15
0.05
4.69
1.18
1.73
0.53
0.03
3.30
1.10
0.10
0.34
0.02
0.01
*
Measure NamesCount of EmployeesFTE
*NOTE: Only those locations that support any of the processes within this function are shown.

26Copyright © 2014 Deloitte Development LLC. All rights reserved.
DivisionAcademic Administration
Agricultural Experiment StationAudit Services
Auxiliary ServicesColleges
Cooperative Extension ServiceFacilities and Services
Human Resource
Information & Communication TechPresident Office
Senior VP for Admin and Finance
Student Affairs & Enroll ManagementUniv Advancement VP Office
University CommunicationsVice Pres Research
The left most number on each scale represents the number of FTE performing the process across NMSU. The number in parentheses represents the number of people that spend at least some time performing the process.
While the HR function is largely centralized, six processes are highly fragmented across the university.
HR – Level of Fragmentation by Process
Key Observations• Applicant Recruiting, Learning and Development, Performance Management, On Boarding/Out Processing, Leave Administration, and I-9
processing are the most fragmented processes within HR across the university• In fragmented processes requiring a high degree of specific knowledge around HR laws and policies (e.g. Manage/Execute Leave Administration,
Conduct Performance Management), there is a risk that employees may not have the policy background required to accurately advise employees. It is assumed that decentralized employees logging time in these processes did so to represent the time they spend as managers providing direction rather than as providing central support
• Outside of HR, Finance and the Academic Colleges report performing the most time in the HR Function
0 1 2 3 4 5 6 7 8 9 10Full Time Equivalents
Administer Employee Health & Wellness Programs
Manage Applicant Recruiting
HR, Benefit and Payroll Data Administration
Manage Learning and Development
Conduct Performance Management
EEO
Conduct Employee Relations
Conduct On Boarding/Out Processing
Manage Compensation Planning
Perform Benefits Administration
Manage/Execute Leave Administration
Perform I-9 Processing
Conduct Position Management, SuccessionManagement, and Workforce Planning
Oversee Workers' Compensation
Conduct Labor Relations
Perform Visa Processing
9.44
8.78
5.98
5.43
3.87
3.47
3.14
2.52
2.19
2.02
1.89
1.87
1.39
1.10
0.94
0.90
(36)
(95)
(27)
(53)
(70)
(15)
(22)
(49)
(17)
(7)
(30)
(56)
(31)
(4)
(9)
(16)
*Human Resources Processes – Fragmentation
*The ~9 FTEs within the “Administer Employee Health and Wellness Programs” taxonomy process represent health-care providers within the Student Affairs Division

27Copyright © 2014 Deloitte Development LLC. All rights reserved.
112
$1,480K
141
$2,215K
13
$52K
0M
1M
2M
3M
4M
$3,288.87K
$455.50K
$3,744.37K
0M
1M
2M
3M
4M
$2,625.9K
$238.1K
$2,863.95K
HR – Labor CostNMSU spends ~$2.9.1M on total salaries for the HR Division. However, based on the activity analysis of the actual portion of time that staff spend on HR activities across NMSU, the actual labor cost for staff performing HR work is ~$3.7M.*
Labor Cost: Division vs. Function Labor Cost by Funding Type
Key Observations• The labor cost for HR work is $880K more than what is allocated for personnel in the HR division• ~$660K of this labor cost differential is accounted for by work performed by professional staff outside of HR• ~$220K of this labor cost differential is accounted for work performed by support staff outside of HR• Of the $3.7 M spent on staff performing HR functions, approximately $50K is from restricted sources• The majority of labor cost within the HR function is accounted for by professional staff
*~$800K of this cost comes from 9 FTEs performing the Health and Wellness process mapped to HR in the Functional Taxonomy
** This calculation includes the Salary of staff multiplied by the FTE allocation of time spent on HR.
Restricted Unrestricted – I&G Unrestricted – OthProfessional Support
$1,304.17K
$1,378.58K
Total Salaries for HR Division
Labor Cost for Staff Performing HR Work across
NMSU**
Labor Cost for Staff Performing HR Work from
Division
28Copyright © 2014 Deloitte Development LLC. All rights reserved.
0 100,000 200,000 300,000 400,000 500,000 600,000 700,000 800,000 900,000Cost of Labor
Administer Employee Health & Wellness Programs
Manage Applicant Recruiting
HR, Benefit and Payroll Data Administration
Conduct Performance Management
Manage Learning and Development
EEO
Conduct Employee Relations
Manage Compensation Planning
Perform Benefits Administration
Conduct On Boarding/Out Processing
Manage/Execute Leave Administration
Conduct Position Management, SuccessionManagement, and Workforce Planning
Perform I-9 Processing
Conduct Labor Relations
Oversee Workers' Compensation
Perform Visa Processing
$815.9K
$494.4K
$346.5K
$330.8K
$327.0K
$317.6K
$229.9K
$166.7K
$121.6K
$117.7K
$109.4K
$87.5K
$83.8K
$83.8K
$69.7K
$42.1K
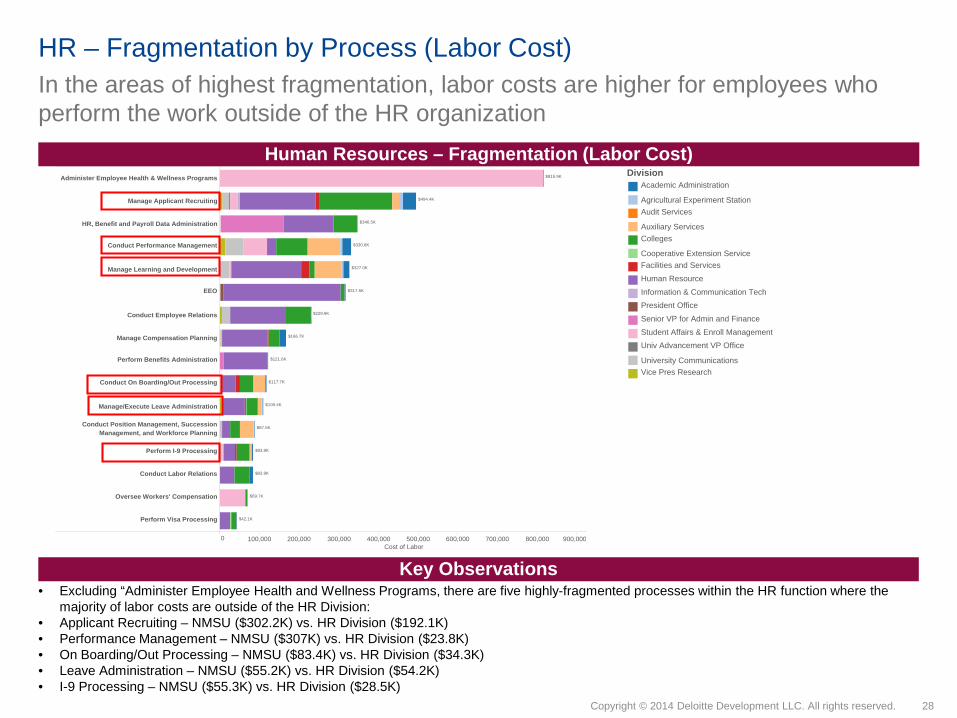
In the areas of highest fragmentation, labor costs are higher for employees who perform the work outside of the HR organization
HR – Fragmentation by Process (Labor Cost)
Human Resources – Fragmentation (Labor Cost)
Key Observations• Excluding “Administer Employee Health and Wellness Programs, there are five highly-fragmented processes within the HR function where the
majority of labor costs are outside of the HR Division:• Applicant Recruiting – NMSU ($302.2K) vs. HR Division ($192.1K)• Performance Management – NMSU ($307K) vs. HR Division ($23.8K)• On Boarding/Out Processing – NMSU ($83.4K) vs. HR Division ($34.3K)• Leave Administration – NMSU ($55.2K) vs. HR Division ($54.2K)• I-9 Processing – NMSU ($55.3K) vs. HR Division ($28.5K)
DivisionAcademic Administration
Agricultural Experiment StationAudit Services
Auxiliary ServicesColleges
Cooperative Extension ServiceFacilities and Services
Human Resource
Information & Communication TechPresident Office
Senior VP for Admin and Finance
Student Affairs & Enroll ManagementUniv Advancement VP Office
University CommunicationsVice Pres Research

29Copyright © 2014 Deloitte Development LLC. All rights reserved.
0K 100K 200K 300K 400K 500K 600K 700K 800KAverage Salary Per FTE
Conduct Performance Management
EEO
Manage Applicant Recruiting
Manage Compensation Planning
Conduct Employee Relations
Manage/Execute Leave Administration
Manage Learning and Development
Perform I-9 Processing
Conduct On Boarding/Out Processing
Conduct Position Management, SuccessionManagement, and Workforce Planning
Conduct Labor Relations
Perform Visa Processing
HR, Benefit and Payroll Data Administration
Perform Benefits Administration
Administer Employee Health & Wellness Programs
Oversee Workers' Compensation
$127.4K$158.1K
$202.9K
$133.1K
$184.0K
$109.0K
$109.5K
$117.0K
$121.1K
$243.4K
$102.5K
$120.7K
$128.0K
$199.1K
$147.8K
$195.0K
$60.7K
$49.0K
$58.1K$74.4K
$51.6K
$57.3K
$80.2K
$51.1K
$57.1K
$54.1K
$59.2K
$48.6K
$73.6K
$66.7K
$54.1K
$66.1K
$49.9K
$50.8K
$53.0K
$53.0K
$53.0K
$53.0K
$79.3K
$88.8K
$57.2K
$65.8K
$60.3K
$55.4K
$65.8K
$66.9K
$68.2K
$50.0K
$69.8K
$58.0K
$53.4K
$53.4K
$97.4K
$49.2K
$63.9K
$97.4K
$79.3K
$86.5K
$64.8K
$52.5K
$76.9K
$80.4K
$68.4K
$47.5K
$81.9K
$64.4K
$77.1K
$70.6K
$66.5K
$76.7K
$71.7K
$97.4K
$64.6K
$63.2K
$63.2K
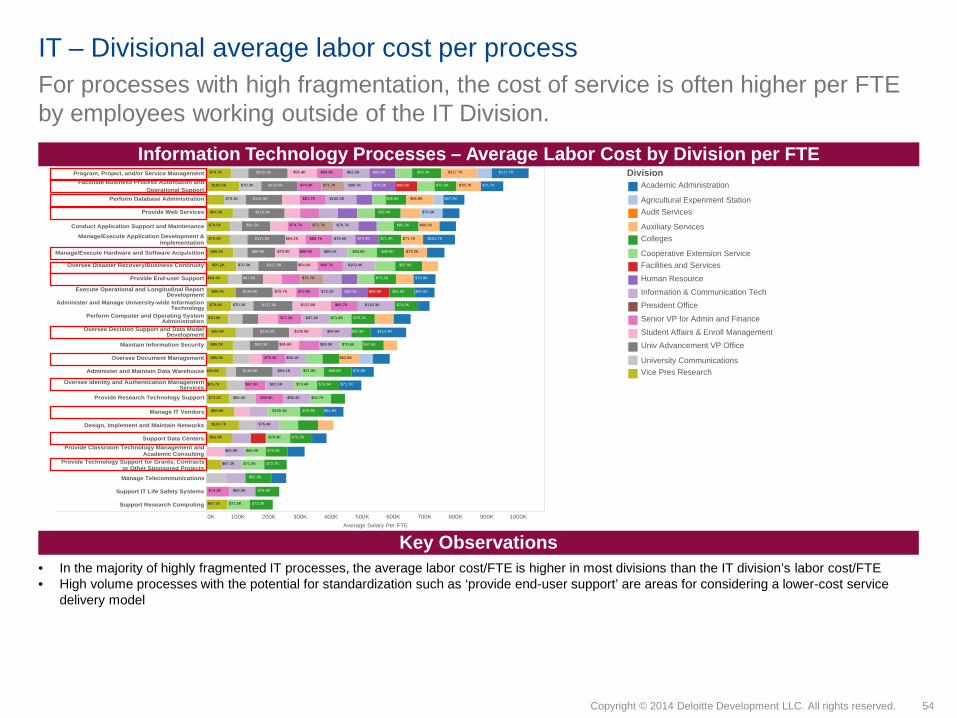
For processes with high fragmentation, the cost of service is often higher per FTE for employees working outside of the HR Division.
HR – Divisional average labor cost per process
Human Resources Processes – Average Labor Cost by Division per FTE
Key Observations• In the processes with the highest fragmentation (Applicant Recruiting, Performance Management, Leave Administration, Learning/Development, I-
9 Processing, On Boarding/Out Processing), the average labor cost/FTE is higher in most divisions than the HR division’s labor cost/FTE. • Where standard processes are being performed at differing labor rates across NMSU, there is a potential opportunity to deliver the same services
at a lower-cost
DivisionAcademic Administration
Agricultural Experiment StationAudit Services
Auxiliary ServicesColleges
Cooperative Extension ServiceFacilities and Services
Human Resource
Information & Communication TechPresident Office
Senior VP for Admin and Finance
Student Affairs & Enroll ManagementUniv Advancement VP Office
University CommunicationsVice Pres Research

30Copyright © 2014 Deloitte Development LLC. All rights reserved.
Management Layer
Span of ControlAvg. SoC=3.9
Number of Managers
1 0
2 0
3 2
4 5
5 3
6 0
NMSU’s HR function has opportunities to improve Span of Control (SoC) and possibly reduce its number of managers as indicated by an average staff to manager ratio of 3.9:1, which is below the leading class benchmark range of 8:1-12:1
HR – Span of Control and Management Layers
Key Observations• HR’s SoC is an inverted pyramid instead of leading class pyramid which has increasing SoC at lower levels of the organization• HR’s vertical structure, with higher SoC at the top level could indicate inefficiencies related to roles and responsibilities and organizational
communications• 50% of the HR managers in the HR function manage 3 employees or less
Span of Control by Layer*
None
None
5.0
4.8
1.7
*Span of Control by Layer: Management layers represent the reporting distance from layer 0; the Chancellor is the only individual at layer 0. Those that report directly to the Chancellor are in management layer 1, etc. “None” is shown in a Function when there is no manager in a particular layer. HR is not a standalone division at NMSU. For this analysis, HR management layers begin at level 3 because HR leadership rolls up under the Office of the EVP/Provost.
31Copyright © 2014 Deloitte Development LLC. All rights reserved.
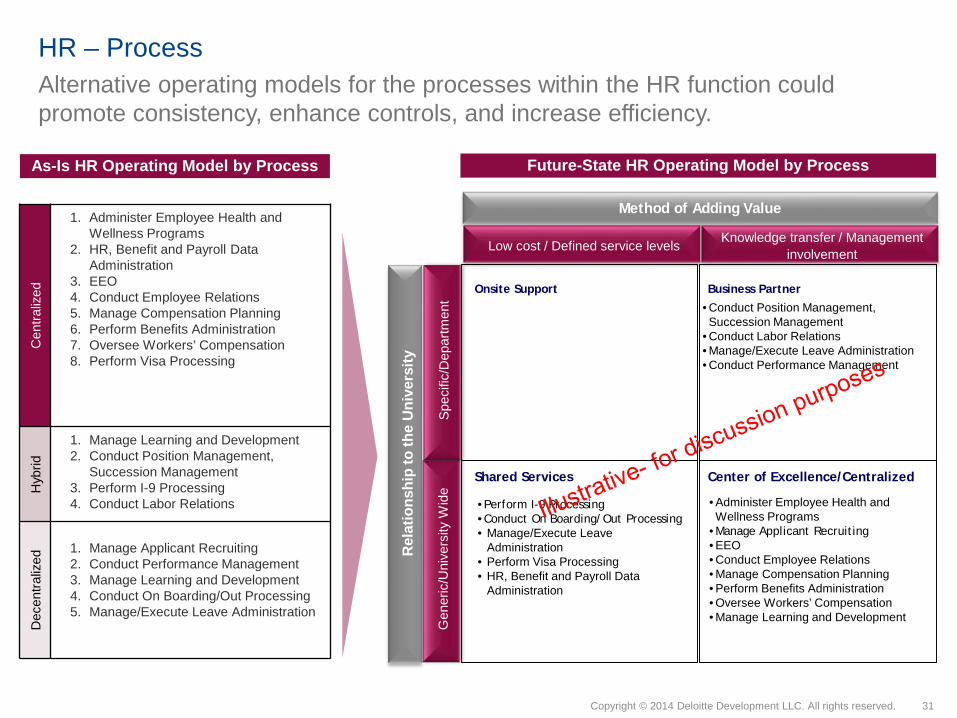
Alternative operating models for the processes within the HR function could promote consistency, enhance controls, and increase efficiency.
HR – Process C
entra
lized
1. Administer Employee Health and Wellness Programs
2. HR, Benefit and Payroll Data Administration
3. EEO4. Conduct Employee Relations5. Manage Compensation Planning6. Perform Benefits Administration7. Oversee Workers’ Compensation8. Perform Visa Processing
Hyb
rid
1. Manage Learning and Development2. Conduct Position Management,
Succession Management3. Perform I-9 Processing4. Conduct Labor Relations
Dec
entra
lized
1. Manage Applicant Recruiting2. Conduct Performance Management3. Manage Learning and Development4. Conduct On Boarding/Out Processing5. Manage/Execute Leave Administration
Rel
atio
nshi
p to
the
Uni
vers
ity
Method of Adding Value
Low cost / Defined service levels Knowledge transfer / Management involvement
Center of Excellence/CentralizedShared Services
Business PartnerOnsite Support
• Perform I-9 Processing• Conduct On Boarding/Out Processing• Manage/Execute Leave
Administration• Perform Visa Processing• HR, Benefit and Payroll Data
Administration
• Administer Employee Health and Wellness Programs
• Manage Applicant Recruiting• EEO• Conduct Employee Relations• Manage Compensation Planning• Perform Benefits Administration• Oversee Workers’ Compensation• Manage Learning and Development
Gen
eric
/Uni
vers
ity W
ide
Spec
ific/
Dep
artm
ent
As-Is HR Operating Model by Process Future-State HR Operating Model by Process
• Conduct Position Management, Succession Management
• Conduct Labor Relations• Manage/Execute Leave Administration• Conduct Performance Management
32Copyright © 2014 Deloitte Development LLC. All rights reserved.
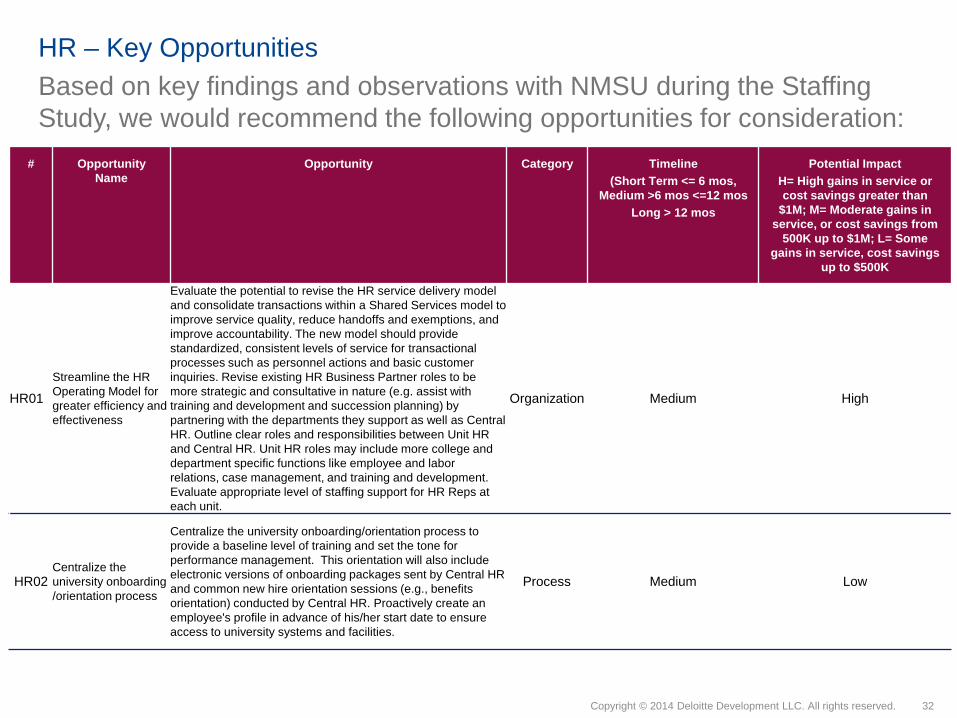
HR – Key OpportunitiesBased on key findings and observations with NMSU during the Staffing Study, we would recommend the following opportunities for consideration:
# Opportunity Name
Opportunity Category Timeline(Short Term <= 6 mos,
Medium >6 mos <=12 mosLong > 12 mos
Potential ImpactH= High gains in service or cost savings greater than
$1M; M= Moderate gains in service, or cost savings from
500K up to $1M; L= Some gains in service, cost savings
up to $500K
HR01Streamline the HR Operating Model for greater efficiency and effectiveness
Evaluate the potential to revise the HR service delivery model and consolidate transactions within a Shared Services model to improve service quality, reduce handoffs and exemptions, and improve accountability. The new model should provide standardized, consistent levels of service for transactional processes such as personnel actions and basic customer inquiries. Revise existing HR Business Partner roles to be more strategic and consultative in nature (e.g. assist with training and development and succession planning) by partnering with the departments they support as well as Central HR. Outline clear roles and responsibilities between Unit HR and Central HR. Unit HR roles may include more college and department specific functions like employee and labor relations, case management, and training and development. Evaluate appropriate level of staffing support for HR Reps at each unit.
Organization Medium High
HR02Centralize the university onboarding /orientation process
Centralize the university onboarding/orientation process to provide a baseline level of training and set the tone for performance management. This orientation will also include electronic versions of onboarding packages sent by Central HR and common new hire orientation sessions (e.g., benefits orientation) conducted by Central HR. Proactively create an employee's profile in advance of his/her start date to ensure access to university systems and facilities.
Process Medium Low

33Copyright © 2014 Deloitte Development LLC. All rights reserved.
HR – Key Opportunities, cont’dBased on practices observed at other universities, we would also recommend the following opportunities for consideration in HR:
# Opportunity Name
Opportunity Category Timeline(Short Term <= 6 mos,
Medium >6 mos <=12 mosLong > 12 mos
Potential ImpactH= High gains in service or cost
savings greater than $1M; M= Moderate gains in service, or cost savings from
500K up to $1M; L= Some gains in
service, cost savings up to $500K
HR03Standardize Job Advertisement Process
Develop a standard and consistent process, managed by Central HR, for developing and placing job advertisements Process Short Low
HR04Implement HR System Improvements
Work to integrate and increase operability between different systems (Fin, Student) and eliminate manual processes and shadow systems (e.g., Excel databases). Enable electronic workflow to greatly reduce paper processing. Develop greater capability for user self-service to improve access to information and reduce costs.
Technology Long Medium

Procurement (PROC)
35Copyright © 2014 Deloitte Development LLC. All rights reserved.
33%
33%
67%
33%
33%
33%
33%
33%
Level of reporting capability within theprocurement system
Self-service Portal capability in function
Degree to which supporting processes areaccomplished via automated workflow
Technology Capabilities vs. Peers
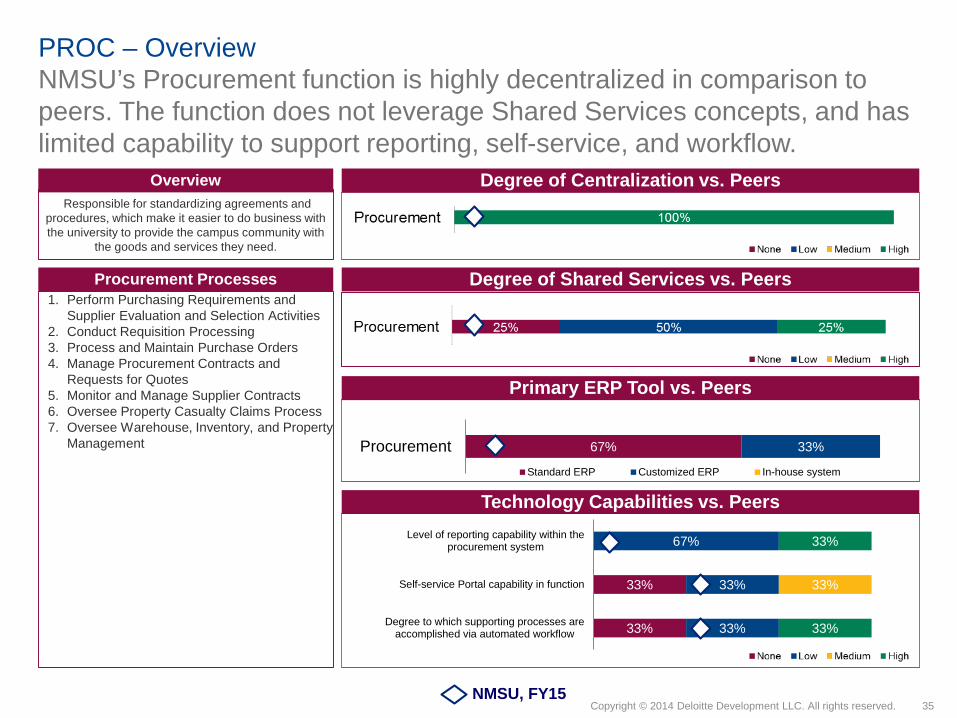
PROC – Overview NMSU’s Procurement function is highly decentralized in comparison to peers. The function does not leverage Shared Services concepts, and has limited capability to support reporting, self-service, and workflow.
Procurement Processes1. Perform Purchasing Requirements and
Supplier Evaluation and Selection Activities2. Conduct Requisition Processing3. Process and Maintain Purchase Orders4. Manage Procurement Contracts and
Requests for Quotes5. Monitor and Manage Supplier Contracts6. Oversee Property Casualty Claims Process7. Oversee Warehouse, Inventory, and Property
Management
OverviewResponsible for standardizing agreements and
procedures, which make it easier to do business with the university to provide the campus community with
the goods and services they need.
Degree of Centralization vs. Peers
Degree of Shared Services vs. Peers
Primary ERP Tool vs. Peers
67% 33%ProcurementStandard ERP Customized ERP In-house system
NMSU, FY15

36Copyright © 2014 Deloitte Development LLC. All rights reserved.
PROC – Key Findings and Opportunity Summary
Key Findings
Staff performing procurement work are broadly distributed across NMSU. (279 people representing 46.57 FTEs)
Only 43% of Procurement work is being performed by FTEs within the Procurement (22%) and Finance (21%) Organizations.
>85% of Procurement processes are highly fragmented with Procurement work being performed across campus
Certain procurement forms are paper-based (e.g. Vendors) creating the potential for data inaccuracies and duplication of effort and compliance challenges
NMSU’s Procurement function has an inefficient Span of Control
60% of Procurement managers oversee three employees or less
Procurement’s average SoC (3.0) is lower than thestandard target of 8.0 – 12.0 and should be assessed to determine whether the current number of managers is appropriate to oversee the Procurement team
Potential Opportunities based on Current Findings
Strategically Source Spend Categories to obtain additional savings on goods and services
Redesign NMSU’s Procurement operating model to increase efficiency and effectiveness by better alignment of transactional and strategic work:
Implement Shared Services, CoEs, and Business Partners for select processes
Centralize Procurement authority and direct control to manage more of NMSU’s total expenditures and to promote policy compliance
Adjust spans of control throughout layers of management to align to leading practices and better support efficiency
Review manager to employee ratios to determine whether a reduction in managers could be implemented to align with leading practices.
$2.5M - $3M+ in potential annual savings identified
The Procurement function is highly decentralized. Changes to technology, processes, policies, and the operating model provide opportunities for consolidation and efficiency.
Potential Opportunities based on Experience with other Organizations Create a vendor portal to enable vendor self-service to increase data accuracy and to reduce staff time on vendor management
activities.

37Copyright © 2014 Deloitte Development LLC. All rights reserved.
0 5 10 15 20 25 30 35 40 45 50 55 60 65 70 75 80 85 90 95 100 105 110 115
Procurement
Colleges
Senior VP for Admin and Finance
Facilities and Services
Student Affairs & Enroll Mgmt
Information & Communication Tech
Cooperative Extension Service
Agricultural Experiment Station
Academics Administration
Auxiliary Services
University Communications
Vice Pres Research
Univ Advancement VP Office
President Office
Human Resources
Athletics Compliance and Eligibil
Audit Services 2
2
2
2
27
7
12
113
14
22
20
16
11
11
9
6
3
10.33
10.21
9.78
2.08
1.38
0.89
1.07
0.16
0.16
4.40
0.30
0.20
0.04
2.42
1.42
1.42
0.31
PROC – Number of Employees and FTEs by Location There are a total of 279 people, widely distributed across campus, who report performing procurement-related activities.
Location Analysis*
Key Observations
Measure NamesCount of EmployeesFTE
• The 279 people who reported completing procurement processes represent 46.57 FTE• Only ~43% of FTEs completing procurement work are located in the Procurement and the Finance Divisions• ~ 22% of FTEs completing procurement work are located in the Procurement division • ~21% of FTEs completing procurement work are located in the Finance Division• In locations where a high number of employees spend a small fraction of their time performing Procurement work, there is a risk that these
employees lack the specialized experience and training to perform this work efficiently and effectively
*NOTE: Only those locations that support any of the processes within this function are shown.

38Copyright © 2014 Deloitte Development LLC. All rights reserved.
0 2 4 6 8 10 12 14 16 18Full Time Equivalents
Oversee Warehouse, Inventory, and PropertyManagement
Process and Maintain Purchase Orders
Perform Purchasing Requirements and SupplierEvaluation and Selection Activities
Conduct Requisition Processing
Manage Procurement Contracts and Requests forQuotes
Monitor and Manage Supplier Contracts
Oversee Property Casualty Claims Process
16.40
9.45
8.39
8.19
2.82
0.78
0.54
The left most number on each scale represents the number of FTE performing the process across NMSU. The number in parentheses represents the number of people that spend at least some time performing the process.
The Procurement function is largely decentralized with the majority of Procurement processes highly fragmented across the University.
PROC – Level of Fragmentation by Process
Key Observations• >85% of Procurement processes are highly fragmented with Procurement work being performed across campus• Outside of Procurement and Finance, the Colleges and Facilities report performing the most in Procurement Functions• Oversee the Property Casualty Claims process is the only procurement process without significant fragmentation• Without supporting policies and supporting technology, the high fragmentation across these processes introduces risk and the potential for data
inaccuracy and manual rework
Procurement Processes – Fragmentation(65)
(138)
(80)
(123)
(57)
(16)
(6)
39Copyright © 2014 Deloitte Development LLC. All rights reserved.
0M
1M
2M
3M
$1,093.80K
$1,022.48K
$2,116.27K
0M
1M
2M
3M
$471.8K
$290.1K
$761.91K
139
$1,251K
107
$727K
33
$145K
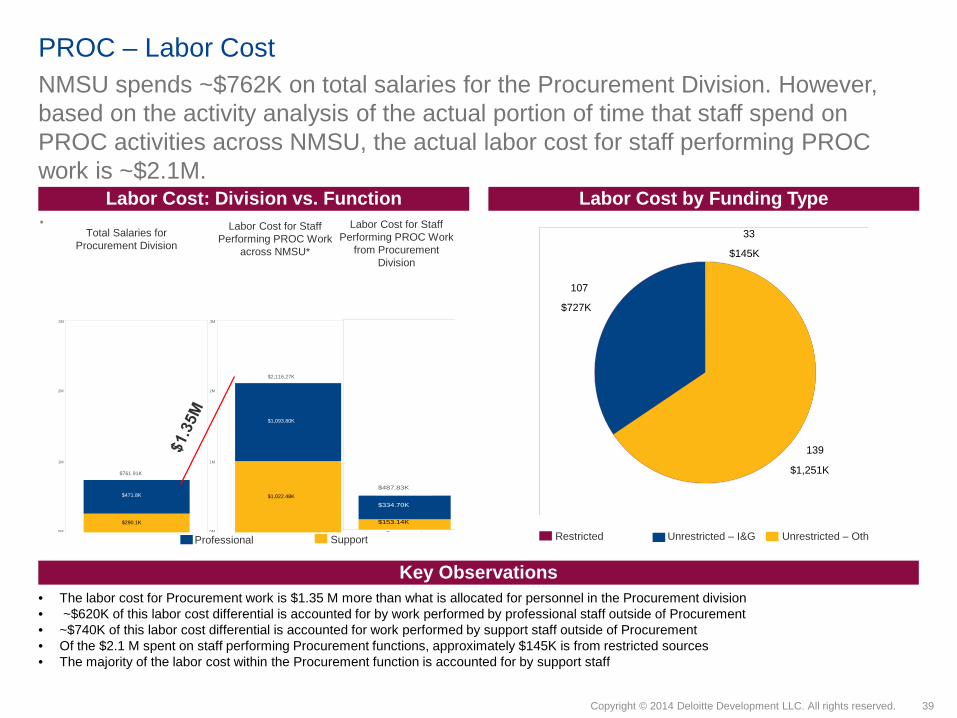
PROC – Labor CostNMSU spends ~$762K on total salaries for the Procurement Division. However, based on the activity analysis of the actual portion of time that staff spend on PROC activities across NMSU, the actual labor cost for staff performing PROC work is ~$2.1M.
.Labor Cost: Division vs. Function Labor Cost by Funding Type
Key Observations• The labor cost for Procurement work is $1.35 M more than what is allocated for personnel in the Procurement division• ~$620K of this labor cost differential is accounted for by work performed by professional staff outside of Procurement• ~$740K of this labor cost differential is accounted for work performed by support staff outside of Procurement• Of the $2.1 M spent on staff performing Procurement functions, approximately $145K is from restricted sources• The majority of the labor cost within the Procurement function is accounted for by support staff
Restricted Unrestricted – I&G Unrestricted – OthProfessional SupportProcurement
$334.70K
$153.14K
$487.83K
Total Salaries for Procurement Division
Labor Cost for Staff Performing PROC Work
across NMSU*
Labor Cost for Staff Performing PROC Work
from Procurement Division
40Copyright © 2014 Deloitte Development LLC. All rights reserved.
0 100,000 200,000 300,000 400,000 500,000 600,000 700,000 800,000Cost of Labor
Oversee Warehouse, Inventory, and PropertyManagement
Perform Purchasing Requirements and SupplierEvaluation and Selection Activities
Process and Maintain Purchase Orders
Conduct Requisition Processing
Manage Procurement Contracts and Requests forQuotes
Monitor and Manage Supplier Contracts
Oversee Property Casualty Claims Process
$705.6K
$423.7K
$396.0K
$345.6K
$174.0K
$45.1K
$26.1K
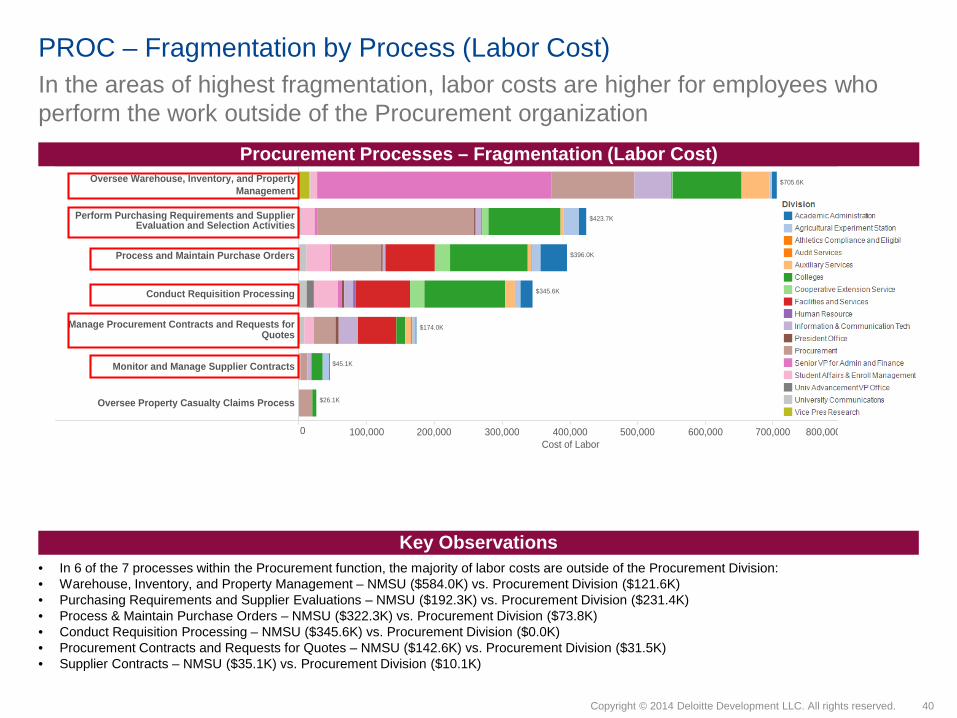
In the areas of highest fragmentation, labor costs are higher for employees who perform the work outside of the Procurement organization
PROC – Fragmentation by Process (Labor Cost)
Procurement Processes – Fragmentation (Labor Cost)
Key Observations• In 6 of the 7 processes within the Procurement function, the majority of labor costs are outside of the Procurement Division:• Warehouse, Inventory, and Property Management – NMSU ($584.0K) vs. Procurement Division ($121.6K)• Purchasing Requirements and Supplier Evaluations – NMSU ($192.3K) vs. Procurement Division ($231.4K)• Process & Maintain Purchase Orders – NMSU ($322.3K) vs. Procurement Division ($73.8K)• Conduct Requisition Processing – NMSU ($345.6K) vs. Procurement Division ($0.0K)• Procurement Contracts and Requests for Quotes – NMSU ($142.6K) vs. Procurement Division ($31.5K)• Supplier Contracts – NMSU ($35.1K) vs. Procurement Division ($10.1K)

41Copyright © 2014 Deloitte Development LLC. All rights reserved.
0K 50K 100K 150K 200K 250K 300K 350K 400K 450K 500K 550K 600K 650K 700K 750KAverage Salary Per FTE
Manage Procurement Contracts and Requests forQuotes
Process and Maintain Purchase Orders
Perform Purchasing Requirements and SupplierEvaluation and Selection Activities
Oversee Warehouse, Inventory, and PropertyManagement
Conduct Requisition Processing
Monitor and Manage Supplier Contracts
Oversee Property Casualty Claims Process
$103.6K
$139.8K
$112.5K
$100.7K
$110.9K
$62.4K
$47.0K
$48.0K
$57.4K
$76.6K
$74.4K
$84.6K
$68.7K
$48.8K
$58.6K
$47.6K
$54.2K
$50.6K
$75.5K
$48.1K$50.9K
$50.9K
$50.9K
$61.1K
$55.1K
$55.1K
$55.0K
$46.6K
$63.4K
$51.3K
$51.3K
$51.3K
$57.2K
$48.2K
$50.0K
$46.3K
$48.8K
$58.7K$55.5K
$46.4K
$83.8K
$65.9K
$55.7K
$63.7K
For processes with high fragmentation, the cost of service is often higher per FTE for employees working outside of the Procurement Division.
PROC – Divisional average labor cost per process
Procurement Processes – Average Labor Cost by Division per FTE
Key Observations• In the highly fragmented processes, labor costs/FTE are higher outside of Procurement and Finance for employees performing similar work• For the Purchase Requirements and Supplier Management process, the labor cost/FTE within Communications is nearly three times higher than
the labor cost/FTE within Procurement for that process• For the Oversee Warehouse, Inventory, and Property Management process, the labor cost/FTE within Academic Administration is more than three
times higher than the labor cost/FTE within Procurement for that process
42Copyright © 2014 Deloitte Development LLC. All rights reserved.
Management Layer
Span of ControlAvg. SoC=3.0
Number of Managers
1 1 0
2 2 0
3 3 0
4 4 1
5 5 3
6 6 1
None
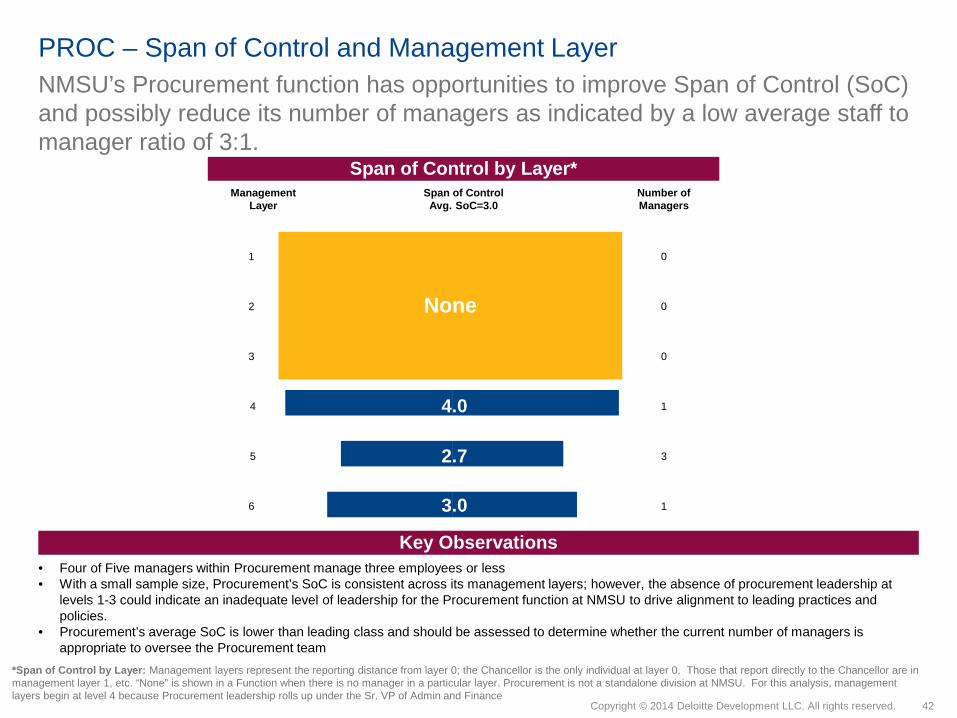
NMSU’s Procurement function has opportunities to improve Span of Control (SoC) and possibly reduce its number of managers as indicated by a low average staff to manager ratio of 3:1.
PROC – Span of Control and Management Layer
Key Observations• Four of Five managers within Procurement manage three employees or less• With a small sample size, Procurement’s SoC is consistent across its management layers; however, the absence of procurement leadership at
levels 1-3 could indicate an inadequate level of leadership for the Procurement function at NMSU to drive alignment to leading practices and policies.
• Procurement’s average SoC is lower than leading class and should be assessed to determine whether the current number of managers is appropriate to oversee the Procurement team
Span of Control by Layer*
3.0
4.0
2.7
*Span of Control by Layer: Management layers represent the reporting distance from layer 0; the Chancellor is the only individual at layer 0. Those that report directly to the Chancellor are in management layer 1, etc. “None” is shown in a Function when there is no manager in a particular layer. Procurement is not a standalone division at NMSU. For this analysis, management layers begin at level 4 because Procurement leadership rolls up under the Sr. VP of Admin and Finance

43Copyright © 2014 Deloitte Development LLC. All rights reserved.
PROC – Process C
entra
lized
1. Oversee Property Casualty Claims Process
Hyb
rid
1. Perform Purchasing Requirements and Supplier Evaluation and Selection Activities
Dec
entra
lized
1. Conduct Requisition Processing2. Process and Maintain Purchase Orders3. Manage Procurement Contracts and
Requests for Quotes4. Monitor and Manage Supplier
Contracts5. Oversee Warehouse, Inventory, and
Property Management
Rel
atio
nshi
p to
the
Uni
vers
ity
Method of Adding Value
Low cost / Defined service levels Knowledge transfer / Management involvement
Center of Excellence/CentralizedShared Services
Business PartnerOnsite Support
• Oversee Property Casualty Claims Process
• Perform Purchasing Requirements and Supplier Evaluation and Selection Activities
• Manage Procurement Contracts and Requests for Quotes
• Oversee Warehouse, Inventory, and Property Management
Gen
eric
/Uni
vers
ity W
ide
Spec
ific/
Dep
artm
ent
As-Is PROC Operating Model by Process Future-State PROC Operating Model by Process
Alternative operating models for the processes within the Procurement function could promote consistency, enhance controls, and increase efficiency.
• Conduct Requisition Processing• Process and Maintain Purchase Orders• Manage Procurement Contracts and Requests for Quotes
• Monitor and Manage Supplier Contracts

44Copyright © 2014 Deloitte Development LLC. All rights reserved.
PROC– Key Opportunities
# Opportunity Name
Opportunity Category Timeline(Short Term <= 6 mos,
Medium >6 mos <=12 mosLong > 12 mos
Potential ImpactH= High gains in service or cost savings greater than
$1M; M= Moderate gains in service, or cost savings from
500K up to $1M; L= Some gains in service, cost savings
up to $500K
Proc01
Centralize Procurement authority and direct control to manage more of NMSU’s total expenditures
Strengthen the central Procurement function by investing in the resources needed to lead strategic sourcing, contract management, and supplier relationship management for categories of spend (e.g. office supplies) across the university. Work with vendors to renegotiate pricing and contracts and establish clear and enforceable purchasing policies across the university and actively manage spending and track savings.
Organization Medium High
Proc02 Strategically source spend categories
Conduct a Spend Analysis to better determine purchasing patterns and levels of expenditure throughout the university. Organize procurement spend into logical, market-facing groupings (Categories) and strategically source via these groupings. Assign accountability for broader categories to individuals within the Procurement organization.
Process Short High
Based on key findings and observations with NMSU during the Staffing Study, we would recommend the following opportunities for consideration:
45Copyright © 2014 Deloitte Development LLC. All rights reserved.
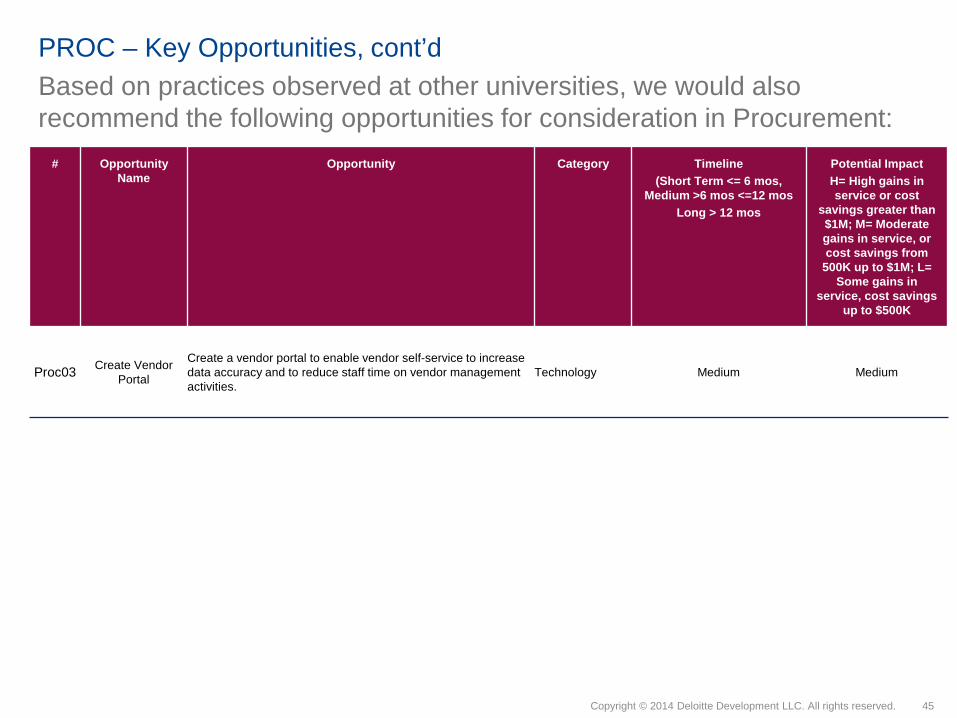
PROC – Key Opportunities, cont’d
# Opportunity Name
Opportunity Category Timeline(Short Term <= 6 mos,
Medium >6 mos <=12 mosLong > 12 mos
Potential ImpactH= High gains in service or cost
savings greater than $1M; M= Moderate gains in service, or cost savings from
500K up to $1M; L= Some gains in
service, cost savings up to $500K
Proc03 Create Vendor Portal
Create a vendor portal to enable vendor self-service to increase data accuracy and to reduce staff time on vendor management activities.
Technology Medium Medium
Based on practices observed at other universities, we would also recommend the following opportunities for consideration in Procurement:

Information Technology (IT)
47Copyright © 2014 Deloitte Development LLC. All rights reserved.
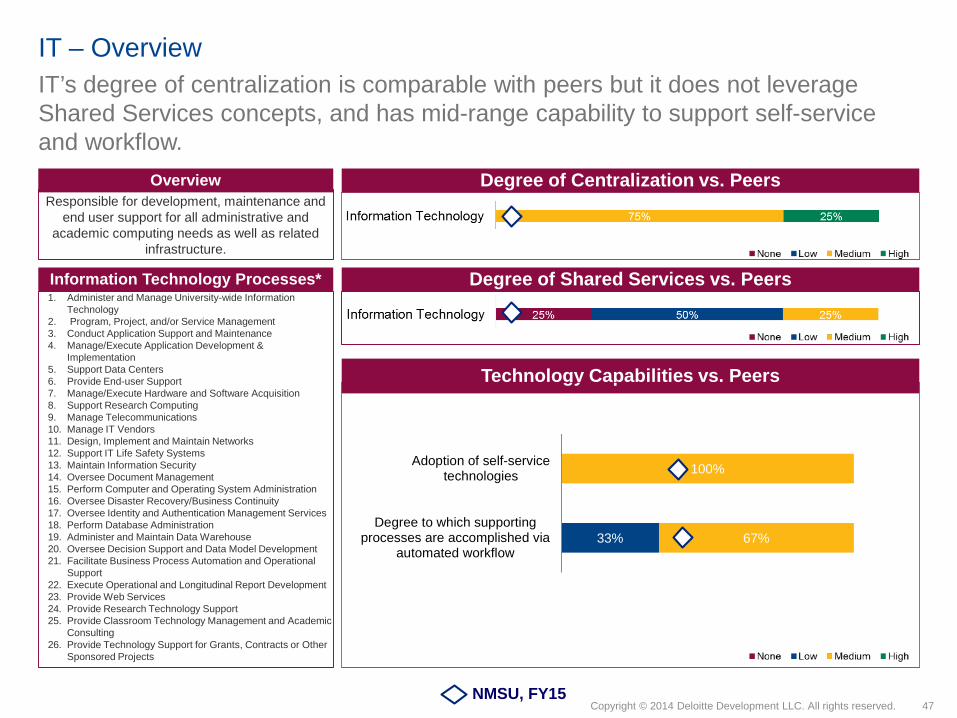
33%
100%
67%
Adoption of self-servicetechnologies
Degree to which supportingprocesses are accomplished via
automated workflow
IT – Overview IT’s degree of centralization is comparable with peers but it does not leverage Shared Services concepts, and has mid-range capability to support self-service and workflow.
Information Technology Processes*1. Administer and Manage University-wide Information
Technology2. Program, Project, and/or Service Management3. Conduct Application Support and Maintenance4. Manage/Execute Application Development &
Implementation5. Support Data Centers6. Provide End-user Support7. Manage/Execute Hardware and Software Acquisition8. Support Research Computing9. Manage Telecommunications10. Manage IT Vendors11. Design, Implement and Maintain Networks 12. Support IT Life Safety Systems13. Maintain Information Security14. Oversee Document Management15. Perform Computer and Operating System Administration 16. Oversee Disaster Recovery/Business Continuity17. Oversee Identity and Authentication Management Services18. Perform Database Administration19. Administer and Maintain Data Warehouse20. Oversee Decision Support and Data Model Development21. Facilitate Business Process Automation and Operational
Support22. Execute Operational and Longitudinal Report Development23. Provide Web Services24. Provide Research Technology Support25. Provide Classroom Technology Management and Academic
Consulting26. Provide Technology Support for Grants, Contracts or Other
Sponsored Projects
OverviewResponsible for development, maintenance and
end user support for all administrative and academic computing needs as well as related
infrastructure.
Degree of Centralization vs. Peers
Degree of Shared Services vs. Peers
Technology Capabilities vs. Peers
NMSU, FY15
48Copyright © 2014 Deloitte Development LLC. All rights reserved.
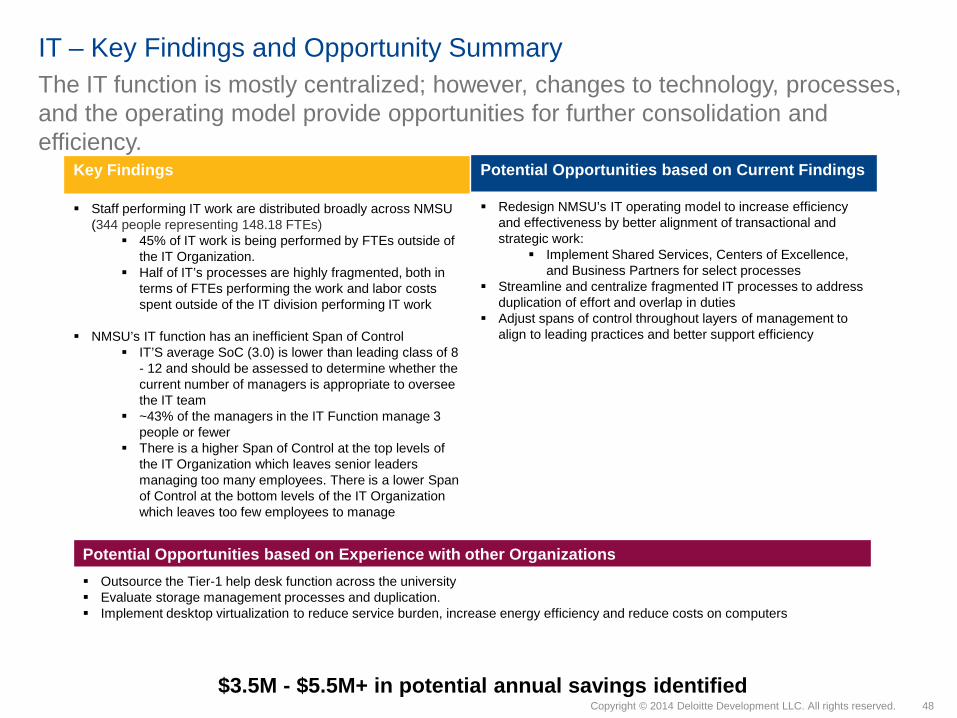
IT – Key Findings and Opportunity Summary
Key Findings
Staff performing IT work are distributed broadly across NMSU (344 people representing 148.18 FTEs)
45% of IT work is being performed by FTEs outside of the IT Organization.
Half of IT’s processes are highly fragmented, both in terms of FTEs performing the work and labor costs spent outside of the IT division performing IT work
NMSU’s IT function has an inefficient Span of Control IT’S average SoC (3.0) is lower than leading class of 8
- 12 and should be assessed to determine whether the current number of managers is appropriate to oversee the IT team
~43% of the managers in the IT Function manage 3 people or fewer
There is a higher Span of Control at the top levels of the IT Organization which leaves senior leaders managing too many employees. There is a lower Span of Control at the bottom levels of the IT Organization which leaves too few employees to manage
Potential Opportunities based on Current Findings
Redesign NMSU’s IT operating model to increase efficiency and effectiveness by better alignment of transactional and strategic work:
Implement Shared Services, Centers of Excellence, and Business Partners for select processes
Streamline and centralize fragmented IT processes to address duplication of effort and overlap in duties
Adjust spans of control throughout layers of management to align to leading practices and better support efficiency
$3.5M - $5.5M+ in potential annual savings identified
The IT function is mostly centralized; however, changes to technology, processes, and the operating model provide opportunities for further consolidation and efficiency.
Potential Opportunities based on Experience with other Organizations Outsource the Tier-1 help desk function across the university Evaluate storage management processes and duplication. Implement desktop virtualization to reduce service burden, increase energy efficiency and reduce costs on computers

49Copyright © 2014 Deloitte Development LLC. All rights reserved.
0 5 10 15 20 25 30 35 40 45 50 55 60 65 70 75 80 85 90 95 100 105 110 115
Information & Communication Tech
Colleges
Senior VP for Admin and Finance
Student Affairs & Enroll Mgmt
Academics Administration
Cooperative Extension Service
Vice Pres Research
Auxiliary Services
University Communications
Univ Advancement VP Office
Human Resources
Facilities and Services
Athletics Compliance and Eligibil
Agricultural Experiment Station
Procurement 1
2
3
4
19
26
99
44
30
28
19
12
29
13
15
20.15
15.45
13.85
81.78
11.33
15.36
8.35
1.95
4.28
4.00
3.00
0.30
0.20
4.84
0.34
IT – Number of Employees and FTEs by Location There are a total of 344 people, widely distributed across campus, who report performing IT-related activities.
Location Analysis*
Key Observations
Measure NamesCount of EmployeesFTE
• The 344 people who reported completing IT processes represent 184.84 FTE• ~ 55% of FTEs completing IT work are located in the IT division. • Combined with Finance’s 15 IT FTEs and Student Affairs’ 15 FTEs, ~75% of the FTEs completing IT work are located within three centralized
divisions• HR and Facilities Services are two locations where a high number of employees spend a small fraction of their time performing IT work. There is a
risk that these employees spending time providing services that could be performed centrally rather than performing more specialized duties in support of their unit
*NOTE: Only those locations that support any of the processes within this function are shown.

50Copyright © 2014 Deloitte Development LLC. All rights reserved.
0 5 10 15 20 25 30 35Full Time Equivalents
Provide End-user Support
Conduct Application Support and Maintenance
Manage/Execute Application Development &Implementation
Perform Computer and Operating SystemAdministration
Program, Project, and/or Service ManagementFacilitate Business Process Automation and
Operational Support
Design, Implement and Maintain Networks
Maintain Information Security
Execute Operational and Longitudinal ReportDevelopment
Perform Database Administration
Provide Web Services
Manage/Execute Hardware and Software Acquisition
Support Data Centers
Manage Telecommunications
Oversee Decision Support and Data ModelDevelopment
Administer and Manage University-wide InformationTechnology
Oversee Document Management
Provide Classroom Technology Management andAcademic Consulting
Oversee Disaster Recovery/Business Continuity
Administer and Maintain Data Warehouse
Provide Research Technology Support
Support IT Life Safety Systems
Provide Technology Support for Grants, Contractsor Other Sponsored Projects
Oversee Identity and Authentication ManagementServices
Manage IT Vendors
Support Research Computing
33.59
22.37
18.88
14.22
13.13
9.18
7.58
7.38
6.66
6.30
5.79
4.44
4.28
4.01
3.99
3.53
3.29
3.08
2.87
2.14
1.89
1.85
1.41
1.40
1.08
0.84
DivisionAcademic Administration
Agricultural Experiment StationAudit Services
Auxiliary ServicesColleges
Cooperative Extension ServiceFacilities and Services
Human Resource
Information & Communication TechPresident Office
Senior VP for Admin and Finance
Student Affairs & Enroll ManagementUniv Advancement VP Office
University CommunicationsVice Pres Research
The left most number on each scale represents the number of FTE performing the process across NMSU. The number in parentheses represents the number of people that spend at least some time performing the process.
The IT function is a hybrid between centralized and decentralized; half of its processes are highly fragmented across the university.
IT – Level of Fragmentation by Process
Key Observations• 50% of IT processes are highly fragmented with IT work being performed across campus• High fragmentation across processes indicates the likelihood and duplication of work that could be better delivered by skilled IT professionals
working centrally • Outside of IT, Finance and Student Affairs report performing the most in IT Functions• Classroom Technology Management, IT Life Safety Systems, and Research Computing are the least fragmented IT functions
Information Technology Processes – Fragmentation(150)
(121)(81)
(59)(87)
(77)(35)
(63)(44)
(55)(51)
(65)(49)(23)(21)(34)
(51)(27)(46)
(14)(24)(29)
(19)(27)(18)
(12)

51Copyright © 2014 Deloitte Development LLC. All rights reserved.
0M
1M
2M
3M
4M
5M
6M
7M
8M
9M
10M
11M
12M
13M
14M
15M
$11,842.26K
$1,706.92K
$13,549.17K
0M
1M
2M
3M
4M
5M
6M
7M
8M
9M
0M
1M
2M
3M
4M
5M
$7,859.3K
$942.1K
$8,801.42K
195
$9,460K
135
$3,829K
14
$277K
IT – Labor CostNMSU spends ~$8.8M on total salaries for the IT Division. However, based on the activity analysis of the actual portion of time that staff spend on IT activities across NMSU, the actual labor cost for staff performing IT work is ~$13.5M.
Labor Cost: Division vs. Function Labor Cost by Funding Type
Key Observations• The labor cost for IT work is $4.75M more than what is allocated for personnel in the IT division• ~$4M of this labor cost differential is accounted for by work performed by professional staff outside of IT• ~$750K of this labor cost differential is accounted for work performed by support staff outside of IT• Of the $13.5 M spent on staff performing IT functions, approximately $275K is from restricted sources• The majority of labor cost within the IT function is accounted for by professional staff
Restricted Unrestricted – I&G Unrestricted – OthProfessional Support
$5,802.31K
$6,497.24K
Total Salaries for IT Division
Labor Cost for Staff Performing IT Work across
NMSU*
Labor Cost for Staff Performing IT Work from
IT Division
52Copyright © 2014 Deloitte Development LLC. All rights reserved.
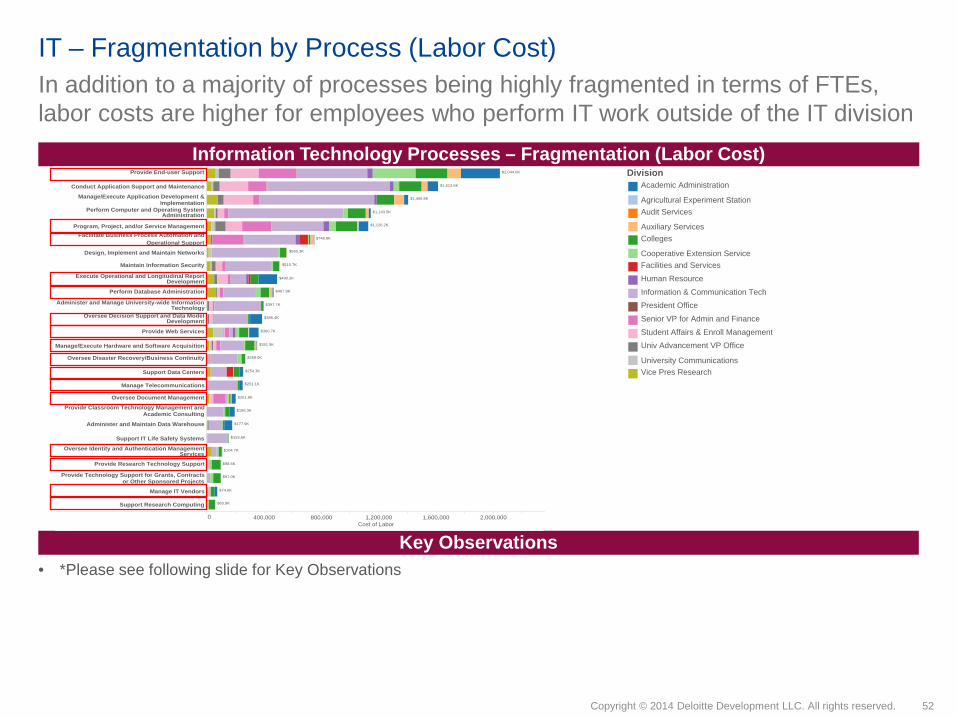
In addition to a majority of processes being highly fragmented in terms of FTEs, labor costs are higher for employees who perform IT work outside of the IT division
IT – Fragmentation by Process (Labor Cost)
Information Technology Processes – Fragmentation (Labor Cost)
Key Observations• *Please see following slide for Key Observations
DivisionAcademic Administration
Agricultural Experiment StationAudit Services
Auxiliary ServicesColleges
Cooperative Extension ServiceFacilities and Services
Human Resource
Information & Communication TechPresident Office
Senior VP for Admin and Finance
Student Affairs & Enroll ManagementUniv Advancement VP Office
University CommunicationsVice Pres Research
0 400,000 800,000 1,200,000 1,600,000 2,000,000Cost of Labor
Provide End-user Support
Conduct Application Support and Maintenance
Manage/Execute Application Development &Implementation
Perform Computer and Operating SystemAdministration
Program, Project, and/or Service ManagementFacilitate Business Process Automation and
Operational Support
Design, Implement and Maintain Networks
Maintain Information Security
Execute Operational and Longitudinal ReportDevelopment
Perform Database Administration
Administer and Manage University-wide InformationTechnology
Oversee Decision Support and Data ModelDevelopment
Provide Web Services
Manage/Execute Hardware and Software Acquisition
Oversee Disaster Recovery/Business Continuity
Support Data Centers
Manage Telecommunications
Oversee Document Management
Provide Classroom Technology Management andAcademic Consulting
Administer and Maintain Data Warehouse
Support IT Life Safety Systems
Oversee Identity and Authentication ManagementServices
Provide Research Technology Support
Provide Technology Support for Grants, Contractsor Other Sponsored Projects
Manage IT Vendors
Support Research Computing
$2,044.6K
$1,613.5K
$1,406.8K
$1,143.5K
$1,126.2K
$748.9K
$560.3K
$510.7K
$490.2K
$467.8K
$397.7K
$386.4K
$360.7K
$351.9K
$269.0K
$254.3K
$251.1K
$201.8K
$196.3K
$177.9K
$153.6K
$104.7K
$98.5K
$97.0K
$74.6K
$60.9K

53Copyright © 2014 Deloitte Development LLC. All rights reserved.
There are 12 processes within the IT function where the majority of labor costs are outside of the IT Division.
Key Observations
IT – Fragmentation by Process (Labor Cost) – cont’d.
Process NMSU $ IT Division $Facilitate Business Process Automation & Operational Support $391.7K $357.2K
Operational & Longitudinal Report Development $384.2K $106.1K
Provide Web Services $336.0K $24.7K
Perform Database Administration $247.2K $220.6K
Oversee Document Management $185.9K $15.9K
Manage/Execute Hardware & Software Acquisition $185.5K $166.5K
Support Data Centers $145.6K $108.7K
Provide Research Technology Support $94.1K $4.4K
Technology Support for Grants, Contracts or other Sponsored Projects
$78.2K $18.9K
Identity & AuthenticationManagement Services $68.1K $36.7K
Manage IT Vendors $65.7K $9.0K
Support Research Computing $60.9K $0.0K
54Copyright © 2014 Deloitte Development LLC. All rights reserved.
0K 100K 200K 300K 400K 500K 600K 700K 800K 900K 1000KAverage Salary Per FTE
Program, Project, and/or Service ManagementFacilitate Business Process Automation and
Operational SupportPerform Database Administration
Provide Web Services
Conduct Application Support and Maintenance
Manage/Execute Application Development &Implementation
Manage/Execute Hardware and Software Acquisition
Oversee Disaster Recovery/Business Continuity
Provide End-user Support
Execute Operational and Longitudinal ReportDevelopment
Administer and Manage University-wide InformationTechnology
Perform Computer and Operating SystemAdministration
Oversee Decision Support and Data ModelDevelopment
Maintain Information Security
Oversee Document Management
Administer and Maintain Data Warehouse
Oversee Identity and Authentication ManagementServices
Provide Research Technology Support
Manage IT Vendors
Design, Implement and Maintain Networks
Support Data CentersProvide Classroom Technology Management and
Academic ConsultingProvide Technology Support for Grants, Contracts
or Other Sponsored Projects
Manage Telecommunications
Support IT Life Safety Systems
Support Research Computing
$117.7K
$118.3K
$103.4K
$101.7K
$105.3K
$117.7K
$113.4K
$100.3K
$122.8K
$105.9K
$125.3K
$116.9K
$116.9K
$116.9K
$121.5K
$127.0K
$116.9K
$127.0K
$116.9K
$116.9K
$105.6K
$103.7K
$93.3K
$70.3K
$65.9K
$82.4K
$80.2K
$71.4K
$88.8K
$87.5K
$71.2K
$81.5K
$74.0K
$75.7K
$61.9K
$67.6K
$88.8K
$70.5K
$76.8K
$70.3K
$70.4K
$72.7K
$82.9K
$76.6K
$73.3K
$93.8K
$71.8K
$70.6K
$71.0K
$73.4K
$64.7K
$78.3K
$66.6K
$71.5K
$71.5K
$69.9K
$69.9K
$83.6K
$75.3K
$74.3K
$82.3K
$82.5K
$89.7K
$79.7K
$75.6K
$88.1K
$73.1K
$87.2K
$94.6K
$69.0K
$66.1K
$94.1K
$91.5K
$88.4K
$76.4K
$65.9K
$67.3K
$83.5K
$71.7K
$71.7K
$71.7K
$84.9K
$76.6K
$81.7K
$74.7K
$85.7K
$68.9K
$80.7K
$72.9K
$86.7K
$77.3K
$76.3K
$67.9K
$88.8K
$73.3K
$95.4K
$64.2K
$75.5K
$64.6K
$75.7K
$71.7K
$67.2K
$65.6K
$70.9K
$64.2K
$71.5K
$71.7K
$91.5K
$61.9K
$88.9K
$70.3K
$67.8K
$78.7K
$86.8K
$66.5K
$92.0K
$71.7K
$70.3K
$70.3K
$70.3K
$70.3K
$84.4K
$79.7K
$73.2K
$84.3K
$74.5K
$75.6K
$86.2K
$95.2K
$69.3K
$95.0K
$79.6K
$70.5K
$93.6K
$86.0K
$86.0K
$62.8K
$65.7K
$73.2K
$88.8K
$62.8K
$81.6K
$67.1K
For processes with high fragmentation, the cost of service is often higher per FTE by employees working outside of the IT Division.
IT – Divisional average labor cost per process
Information Technology Processes – Average Labor Cost by Division per FTE
Key Observations• In the majority of highly fragmented IT processes, the average labor cost/FTE is higher in most divisions than the IT division’s labor cost/FTE• High volume processes with the potential for standardization such as ‘provide end-user support’ are areas for considering a lower-cost service
delivery model
DivisionAcademic Administration
Agricultural Experiment StationAudit Services
Auxiliary ServicesColleges
Cooperative Extension ServiceFacilities and Services
Human Resource
Information & Communication TechPresident Office
Senior VP for Admin and Finance
Student Affairs & Enroll ManagementUniv Advancement VP Office
University CommunicationsVice Pres Research
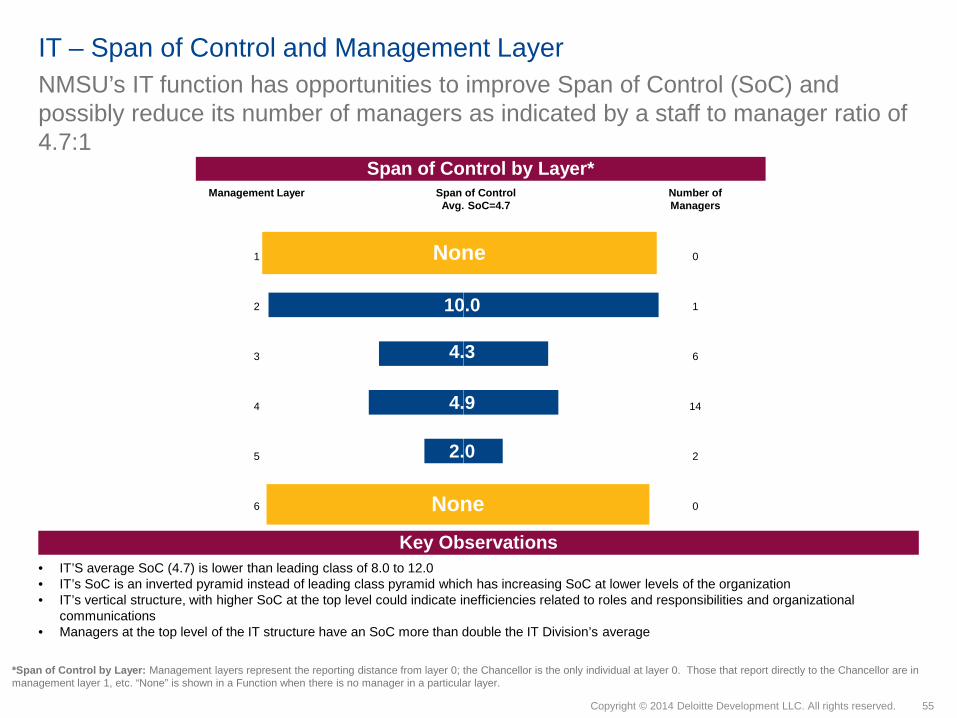
55Copyright © 2014 Deloitte Development LLC. All rights reserved.
Management Layer Span of ControlAvg. SoC=4.7
Number of Managers
1 0
2 1
3 6
4 14
5 2
6 0
NMSU’s IT function has opportunities to improve Span of Control (SoC) and possibly reduce its number of managers as indicated by a staff to manager ratio of 4.7:1
IT – Span of Control and Management Layer
Key Observations• IT’S average SoC (4.7) is lower than leading class of 8.0 to 12.0• IT’s SoC is an inverted pyramid instead of leading class pyramid which has increasing SoC at lower levels of the organization• IT’s vertical structure, with higher SoC at the top level could indicate inefficiencies related to roles and responsibilities and organizational
communications• Managers at the top level of the IT structure have an SoC more than double the IT Division’s average
Span of Control by Layer*
None
None
10.0
4.9
2.0
4.3
*Span of Control by Layer: Management layers represent the reporting distance from layer 0; the Chancellor is the only individual at layer 0. Those that report directly to the Chancellor are in management layer 1, etc. “None” is shown in a Function when there is no manager in a particular layer.
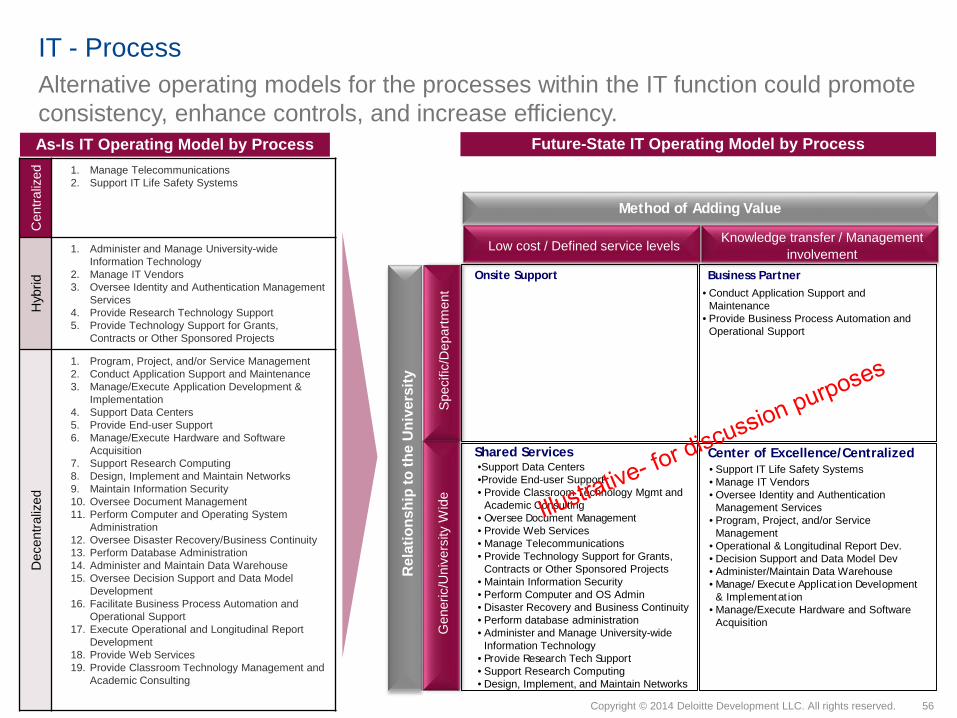
56Copyright © 2014 Deloitte Development LLC. All rights reserved.
Cen
traliz
ed 1. Manage Telecommunications2. Support IT Life Safety Systems
Hyb
rid
1. Administer and Manage University-wide Information Technology
2. Manage IT Vendors3. Oversee Identity and Authentication Management
Services4. Provide Research Technology Support5. Provide Technology Support for Grants,
Contracts or Other Sponsored Projects
Dec
entra
lized
1. Program, Project, and/or Service Management2. Conduct Application Support and Maintenance3. Manage/Execute Application Development &
Implementation4. Support Data Centers5. Provide End-user Support6. Manage/Execute Hardware and Software
Acquisition7. Support Research Computing8. Design, Implement and Maintain Networks 9. Maintain Information Security10. Oversee Document Management11. Perform Computer and Operating System
Administration 12. Oversee Disaster Recovery/Business Continuity13. Perform Database Administration14. Administer and Maintain Data Warehouse15. Oversee Decision Support and Data Model
Development16. Facilitate Business Process Automation and
Operational Support17. Execute Operational and Longitudinal Report
Development18. Provide Web Services19. Provide Classroom Technology Management and
Academic Consulting
Rel
atio
nshi
p to
the
Uni
vers
ity
Method of Adding Value
Low cost / Defined service levels Knowledge transfer / Management involvement
Center of Excellence/CentralizedShared Services
Business PartnerOnsite Support
•Support Data Centers•Provide End-user Support• Provide Classroom Technology Mgmt and
Academic Consulting• Oversee Document Management• Provide Web Services• Manage Telecommunications• Provide Technology Support for Grants,
Contracts or Other Sponsored Projects• Maintain Information Security • Perform Computer and OS Admin• Disaster Recovery and Business Continuity• Perform database administration• Administer and Manage University-wide
Information Technology• Provide Research Tech Support• Support Research Computing• Design, Implement, and Maintain Networks
• Support IT Life Safety Systems• Manage IT Vendors• Oversee Identity and Authentication
Management Services• Program, Project, and/or Service
Management• Operational & Longitudinal Report Dev.• Decision Support and Data Model Dev• Administer/Maintain Data Warehouse• Manage/Execute Application Development & Implementation
• Manage/Execute Hardware and Software AcquisitionG
ener
ic/U
nive
rsity
Wid
eSp
ecifi
c/D
epar
tmen
t
As-Is IT Operating Model by Process Future-State IT Operating Model by Process
• Conduct Application Support and Maintenance
• Provide Business Process Automation and Operational Support
Alternative operating models for the processes within the IT function could promote consistency, enhance controls, and increase efficiency.
IT - Process
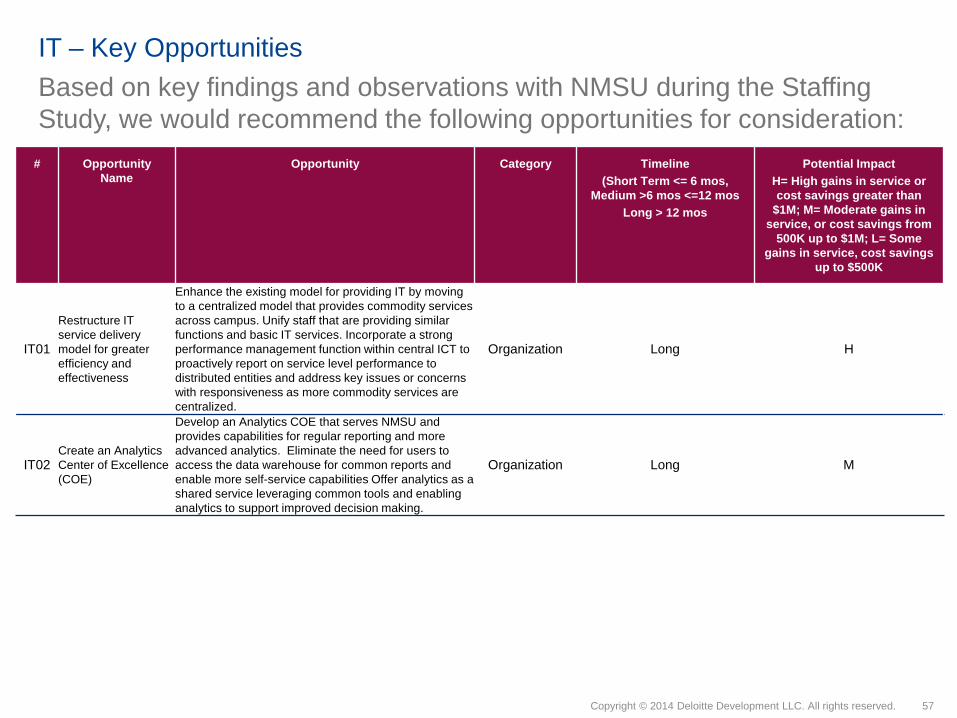
57Copyright © 2014 Deloitte Development LLC. All rights reserved.
IT – Key Opportunities
# Opportunity Name
Opportunity Category Timeline(Short Term <= 6 mos,
Medium >6 mos <=12 mosLong > 12 mos
Potential ImpactH= High gains in service or cost savings greater than
$1M; M= Moderate gains in service, or cost savings from
500K up to $1M; L= Some gains in service, cost savings
up to $500K
IT01
Restructure IT service delivery model for greater efficiency and effectiveness
Enhance the existing model for providing IT by moving to a centralized model that provides commodity services across campus. Unify staff that are providing similar functions and basic IT services. Incorporate a strong performance management function within central ICT to proactively report on service level performance to distributed entities and address key issues or concerns with responsiveness as more commodity services are centralized.
Organization Long H
IT02Create an Analytics Center of Excellence (COE)
Develop an Analytics COE that serves NMSU and provides capabilities for regular reporting and more advanced analytics. Eliminate the need for users to access the data warehouse for common reports and enable more self-service capabilities Offer analytics as a shared service leveraging common tools and enabling analytics to support improved decision making.
Organization Long M
Based on key findings and observations with NMSU during the Staffing Study, we would recommend the following opportunities for consideration:
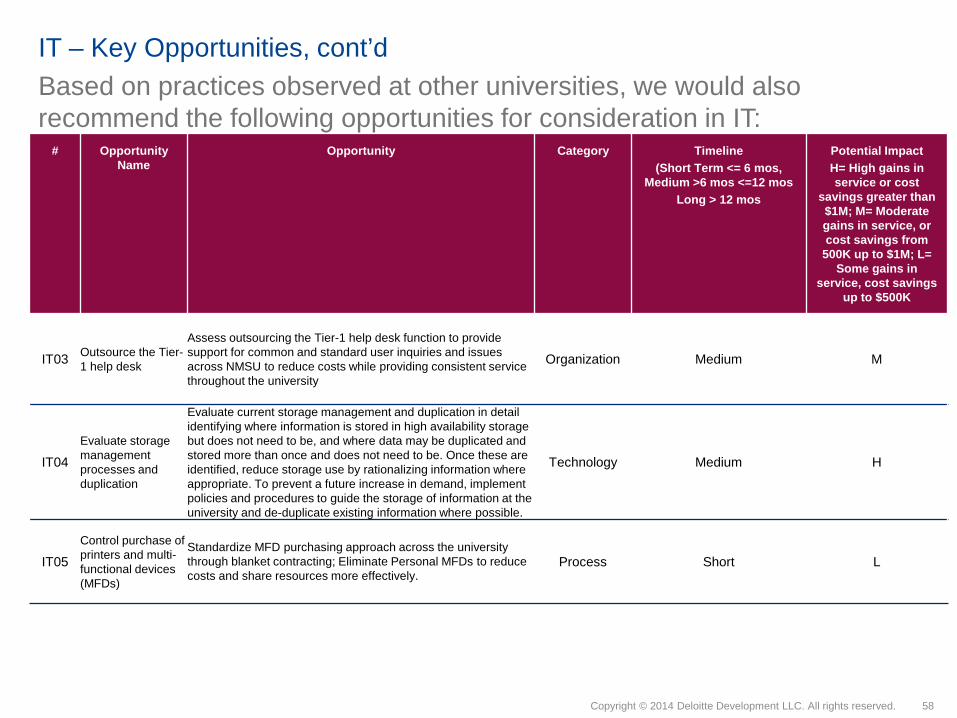
58Copyright © 2014 Deloitte Development LLC. All rights reserved.
IT – Key Opportunities, cont’d
# Opportunity Name
Opportunity Category Timeline(Short Term <= 6 mos,
Medium >6 mos <=12 mosLong > 12 mos
Potential ImpactH= High gains in service or cost
savings greater than $1M; M= Moderate gains in service, or cost savings from
500K up to $1M; L= Some gains in
service, cost savings up to $500K
IT03 Outsource the Tier-1 help desk
Assess outsourcing the Tier-1 help desk function to provide support for common and standard user inquiries and issues across NMSU to reduce costs while providing consistent service throughout the university
Organization Medium M
IT04Evaluate storage management processes and duplication
Evaluate current storage management and duplication in detail identifying where information is stored in high availability storage but does not need to be, and where data may be duplicated and stored more than once and does not need to be. Once these are identified, reduce storage use by rationalizing information where appropriate. To prevent a future increase in demand, implement policies and procedures to guide the storage of information at the university and de-duplicate existing information where possible.
Technology Medium H
IT05Control purchase of printers and multi-functional devices (MFDs)
Standardize MFD purchasing approach across the university through blanket contracting; Eliminate Personal MFDs to reduce costs and share resources more effectively.
Process Short L
Based on practices observed at other universities, we would also recommend the following opportunities for consideration in IT:

59Copyright © 2014 Deloitte Development LLC. All rights reserved.
IT – Key Opportunities, cont’d
# Opportunity Name
Opportunity Category Timeline(Short Term <= 6 mos,
Medium >6 mos <=12 mosLong > 12 mos
Potential ImpactH= High gains in service or cost
savings greater than $1M; M= Moderate gains in service, or cost savings from
500K up to $1M; L= Some gains in
service, cost savings up to $500K
IT06Rationalize application portfolio
Conduct an applications Portfolio TCO audit to identify which applications should be rationalized, virtualized or retired. Rationalize and consolidate applications and retire shadow systems. Design a federated application management approach that enables some local control over necessary unique applications, and central control over enterprise wide applications.
Technology Long M
Based on practices observed at other universities, we would also recommend the following opportunities for consideration in IT:

General Admin (GA)
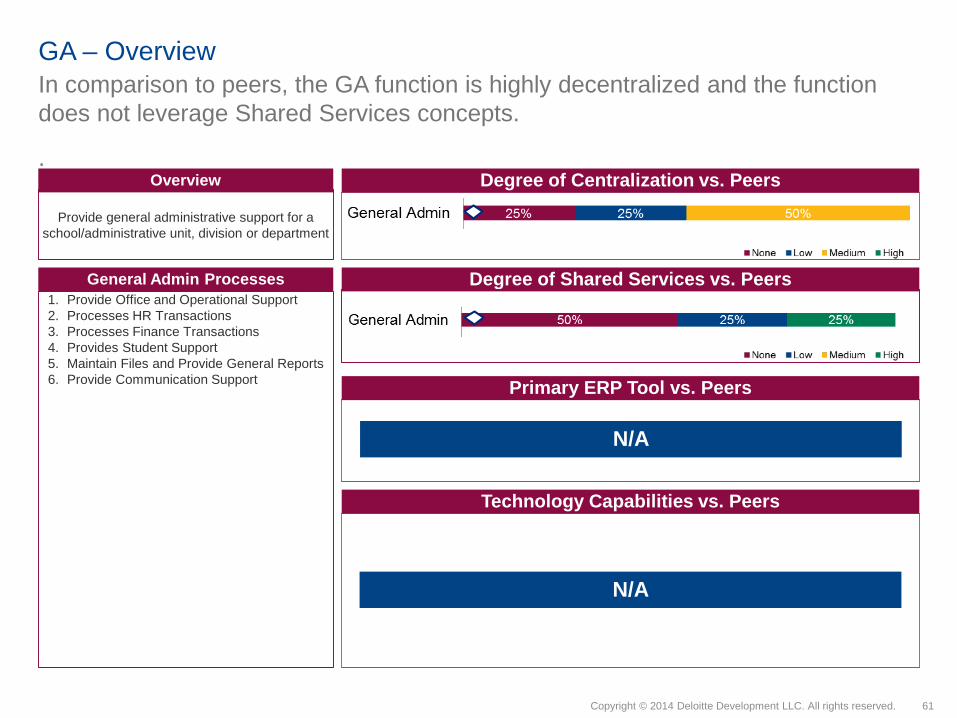
61Copyright © 2014 Deloitte Development LLC. All rights reserved.
GA – Overview In comparison to peers, the GA function is highly decentralized and the function does not leverage Shared Services concepts.
.
General Admin Processes1. Provide Office and Operational Support2. Processes HR Transactions3. Processes Finance Transactions4. Provides Student Support5. Maintain Files and Provide General Reports6. Provide Communication Support
Overview
Provide general administrative support for a school/administrative unit, division or department
Degree of Centralization vs. Peers
Degree of Shared Services vs. Peers
Primary ERP Tool vs. Peers
Technology Capabilities vs. Peers
N/A
N/A

62Copyright © 2014 Deloitte Development LLC. All rights reserved.
GA – Key Findings and Opportunity Summary
Key Findings
Staff performing GA work are distributed broadly across NMSU (897 people representing 426.27 FTEs)
For GA processes where work is being performed by employees at a higher level of the organization, the average labor cost/FTE is significantly higher
For the Divisions in scope for this study, NMSU employs ~400 Admin/Fiscal Assistants, including ~260 in Schools and ~140 in Administrative Units
Across NMSU’s divisions, the Total Staff:Admin Assistant coverage ratios vary with an average of 8.89 in the schools(ranges 1.5:1 to 23:1) and 9.74 in the Administrative Units (ranges 2.29:1 to 41.63:1)
Across NMSU’s divisions, the average coverage ratio of Faculty:Admin Assistants is 3.33 with 7 Divisions falling below the average
Across NMSU’s divisions, the average coverage ratio of Exec Staff:Admin Assistants is 0.62 with 16 falling below the average
In Divisions where employees performing GA work serve as managers, there is an inefficient Span of Control
50% of the managers in the GA Function manage 3 people or fewer
Potential Opportunities based on Current Findings
Review support model for processes in the GA function to confirm work is being performed by the right levels of the organization
Balance coverage ratios based on the type, volume, and nature of work performed except in exceptional or special circumstances, such as geographic limitations (e.g., in multiple buildings, across campuses)
$1M- $1M+ in potential annual savings identified
GA is an area with considerable fragmentation and the potential for overlap and duplication of duties.
Potential Opportunities based on Experience with other Organizations Focus administrative staff on providing core administrative support; transition portions of Finance and HR processes
into an alternative (e.g. shared service) operating model

63Copyright © 2014 Deloitte Development LLC. All rights reserved.
GA – Number of Employees and FTEs by Location There are a total of 897 people, widely distributed across campus, who report performing General Admin related activities.
Location Analysis*
Key Observations
Measure NamesCount of EmployeesFTE
• The 897 people who reported completing GA processes represent 426.27 FTE• For the purposes of this study ~400 staff members are classified as Administrative Assistants. The number of FTEs to
this function (426.27) are higher than the number of staff who typically do this work. Other professional/support staff, potentially at a higher cost, are required to provide support.
*NOTE: Only those locations that support any of the processes within this function are shown.

64Copyright © 2014 Deloitte Development LLC. All rights reserved.
The left most number on each scale represents the number of FTE performing the process across NMSU. The number in parentheses represents the number of people that spend at least some time performing the process.
DivisionAcademic Administration
Ag Experiment StationAudit Services
Auxiliary ServicesColleges
Cooperative Extension ServiceFacilities and Services
Honors College/Crimson Sch PgmHuman ResourcesInformation TechnologyPresident OfficeProcurementSenior VP for Admin & FinanceStudent Affairs & Enroll MgmtUniv Advancement VP Office
University CommunicationsVice Pres Research
Where decentralized units perform work to support centralized Functional areas (HR, Fin), there is an opportunity to transition portions of this work into a shared services model
GA – Level of Fragmentation by Process
General Admin Processes - Fragmentation
Key Observations• The decentralized units reporting the largest % of FTEs in Gen Admin processes are the Colleges and Cooperative Extension Service. Their work
in HR and Finance could be a candidate for Shared Services• The centralized units reporting the largest % of FTEs in Gen Admin processes are Student Affairs and Facility Services
0 10 20 30 40 50 60 70 80 90 100 110 120 130 140 150 160 170 180 190 20Full Time Equivalents
Provide Office and OperationalSupport
Maintain Files and ProvideGeneral Reports
Provide CommunicationSupport
Processes FinanceTransactions
Provides Student Support
Processes HR Transactions
180.49
72.83
57.12
55.40
36.82
22.70

65Copyright © 2014 Deloitte Development LLC. All rights reserved.
• Note: NMSU’s employment and position data was used to track coverage ratios for administrative support across the University. Admin Assistants were identified by the following job titles: Admin Assistant (General, Associate, Intermediate, Sr, Special/Executive: Fiscal Assistant (Intermediate, Assoc., Sr.) and a coverage ratio was calculated for Administrative Assistants: All Other Division Staff
Divisions below the dotted line have coverage ratios (e.g. the # of staff supported by an admin) below the NMSU average
GA – Coverage Ratio The average coverage ratio of Admin Assistants to total Division staff is 11.33:1. 18 of 26 Divisions fall below that average.
Division All Staff Admin Asst Facilities and Services 326.50 5.00Auxiliary Services 136.50 5.50Library 66.00 3.00Senior VP for Admin and Finance 120.50 7.00Information & Communication Tech 101.50 6.00Univ Advancement VP Office 50.00 4.00Agricultural Experiment Station 128.50 10.50Arts and Sciences College 494.50 41.50NMSU Average 114.08 11.94Health and Social Services College 98.50 9.50Education College 222.50 24.00Student Affairs & Enroll Management 204.00 22.50Exec Vice President and Provost 80.00 9.00Human Resource 38.50 4.50Engineering College 169.00 20.00Agricultural,Consumer & Env Sci Col 233.50 28.00Institutional Analysis 8.00 1.00Business College 95.50 12.00University Communications 64.50 8.50Vice Pres Research 62.00 10.50Procurement 13.00 3.00Cooperative Extension Service 231.50 66.00Graduate School 8.00 2.50General Counsel Office 3.00 1.00Government Affairs Office 2.50 1.00President Office 7.00 3.00Honors College 1.00 2.00
Coverage Ratio: All Division Staff: Admin Assistants Divisional Breakdown

66Copyright © 2014 Deloitte Development LLC. All rights reserved.
GA – Key OpportunitiesBased on key findings and observations with NMSU during the Staffing Study, we would recommend the following opportunities for consideration:
# Opportunity Name
Opportunity Category Timeline(Short Term <= 6 mos,
Medium >6 mos <=12 mosLong > 12 mos
Potential Annual SavingsH= High gains in service or cost savings greater than
$1M; M= Moderate gains in service, or cost savings from
500K up to $1M; L= Some gains in service, cost savings
up to $500K
GA01Standardize coverage ratios of administrative support staff
Develop and implement standard coverage ratios at NMSU based on the type, volume, and nature of the work performed
Organization Long H

Finance

68Copyright © 2014 Deloitte Development LLC. All rights reserved.
67%
67%
67%
33%
33%
33%
Level of reporting capability within thefinancial system
Self-service Portal capability in function
Degree to which supporting processes areaccomplished via automated workflow
Finance – Overview The Finance Division’s level of centralization is comparable to peers, but it does not leverage Shared Services concepts and has low capability to support financial reporting, self service, and workflow.
Finance Processes1. Execute Accounts Payable2. Conduct Accounts Receivable3. Manage/Execute University-Level Budgeting4. Perform Department-Level Budgeting5. Perform Debt Management Accounting6. Perform Central Accounting7. Perform General Accounting8. Perform External Financial Reporting9. Perform Rate Development and Review10.Conduct Travel Expense Processing11.Support External Audit12.Conduct Internal Audit13.Plan/Execute Tax Considerations14.Perform Treasury Activities15.Perform Bursar/Collection Activities16.Perform Risk Management 17.Administer Research Accounting 18.Manage/Execute Payroll, Time, and
Attendance Administration
Overview
The Finance function is responsible for the overall integrity of the university's fiscal activities
Degree of Centralization vs. Peers
Degree of Shared Services vs. Peers
Primary ERP Tool vs. Peers
Technology Capabilities vs. Peers
67% 33%FinanceStandard ERP Customized ERP In-house system
NMSU, FY15

69Copyright © 2014 Deloitte Development LLC. All rights reserved.
Potential Opportunities based on Experience with other Organizations
Optimize use of technology and further integration of systems throughout core administrative functions (i.e. HR, IT, Finance andProcurement) to streamline workflow, reduce manual processing, and increase accuracy
Develop and implement approach for utilizing data analytics to drive decision making through out the organization.
Finance – Key Findings and Opportunity Summary
Key Findings
Staff performing Finance work are distributed broadly across NMSU. (422 people represent 149.67 FTEs)
51% of Finance work is being performed by FTEs outside of the Finance Organization.
The most broadly distributed Finance processes include: General Accounting, Dept-Level Budgeting, Accounts Payable, T&E Processing, and Accounts Receivable
NMSU’s Finance function has an inefficient Span of Control Finance’s average SoC (3.1) is lower than standard
ranges of 8:1 – 12:1 The 65% of the managers in the Finance Function
manage 3 people or fewer There is a higher Span of Control at the top levels of
the Finance Organization which leaves senior leaders managing too many employees
There is a lower Span of Control at the bottom levels of the Finance Organization which leaves too few employees to manage
NMSU has limited tools for budgeting, planning, and forecasting. Most units, including centrally, utilize Microsoft Excel
Potential Opportunities based on Current Findings
Redesign NMSU’s Finance operating model to increase efficiency and effectiveness by better alignment of transactional and strategic work:
Implement Shared Services, CoEs, and Business Partners for select processes
Adjust spans of control throughout layers of management to align to leading practices and better support efficiency
Implement planning, budgeting and forecasting software to streamline processes and to enhance data visibility and strategic planning
Reduce siloed operations, and clarify roles and responsibilities.
$2.5M - $3M in potential annual savings identified
The Finance function operates under a centralized/decentralized hybrid model. Changes to technology, processes, and the operating model provide opportunities for further consolidation and efficiency.
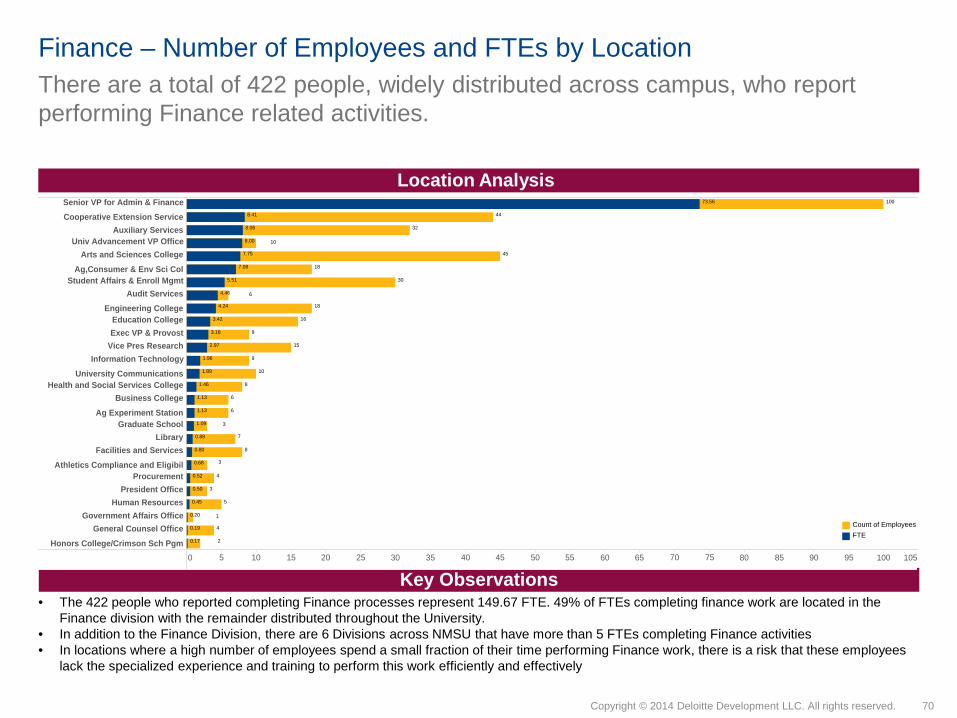
70Copyright © 2014 Deloitte Development LLC. All rights reserved.
Finance – Number of Employees and FTEs by Location There are a total of 422 people, widely distributed across campus, who report performing Finance related activities.
Location Analysis
Key Observations
420
0 5 10 15 20 25 30 35 40 45 50 55 60 65 70 75 80 85 90 95 100 105
Senior VP for Admin & FinanceCooperative Extension Service
Auxiliary ServicesUniv Advancement VP Office
Arts and Sciences CollegeAg,Consumer & Env Sci Col
Student Affairs & Enroll MgmtAudit Services
Engineering CollegeEducation CollegeExec VP & Provost
Vice Pres ResearchInformation Technology
University CommunicationsHealth and Social Services College
Business CollegeAg Experiment Station
Graduate SchoolLibrary
Facilities and ServicesAthletics Compliance and Eligibil
ProcurementPresident Office
Human ResourcesGovernment Affairs Office
General Counsel OfficeHonors College/Crimson Sch Pgm 2
1
3
3
6
10
100
44
32
45
18
30
18
16
15
10
9
9
8
6
6
7
8
4
3
5
4
73.56
7.75
0.45
7.08
1.89
1.09
0.89
0.68
0.19
2.97
1.13
1.13
0.17
8.06
4.46
3.16
1.96
1.46
8.00
0.80
0.50
0.20
4.24
3.42
0.52
8.41
5.51
Measure NamesCount of EmployeesFTE
• The 422 people who reported completing Finance processes represent 149.67 FTE. 49% of FTEs completing finance work are located in the Finance division with the remainder distributed throughout the University.
• In addition to the Finance Division, there are 6 Divisions across NMSU that have more than 5 FTEs completing Finance activities• In locations where a high number of employees spend a small fraction of their time performing Finance work, there is a risk that these employees
lack the specialized experience and training to perform this work efficiently and effectively
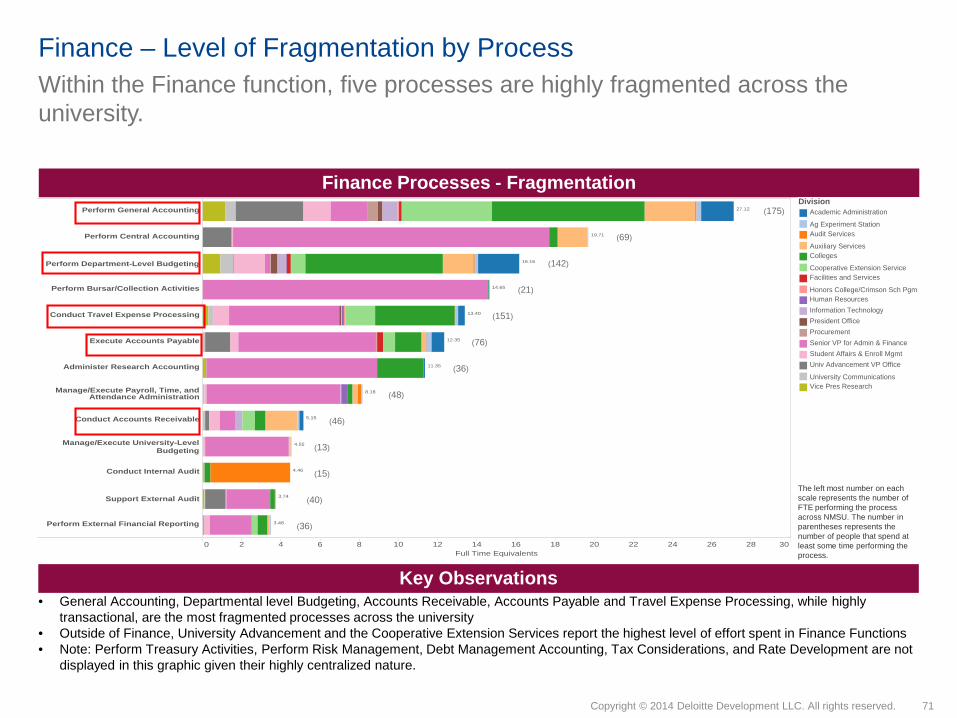
71Copyright © 2014 Deloitte Development LLC. All rights reserved.
Within the Finance function, five processes are highly fragmented across the university.
Finance – Level of Fragmentation by Process
Finance Processes - Fragmentation
Key Observations• General Accounting, Departmental level Budgeting, Accounts Receivable, Accounts Payable and Travel Expense Processing, while highly
transactional, are the most fragmented processes across the university• Outside of Finance, University Advancement and the Cooperative Extension Services report the highest level of effort spent in Finance Functions• Note: Perform Treasury Activities, Perform Risk Management, Debt Management Accounting, Tax Considerations, and Rate Development are not
displayed in this graphic given their highly centralized nature.
The left most number on each scale represents the number of FTE performing the process across NMSU. The number in parentheses represents the number of people that spend at least some time performing the process.
DivisionAcademic Administration
Ag Experiment StationAudit Services
Auxiliary ServicesColleges
Cooperative Extension ServiceFacilities and Services
Honors College/Crimson Sch PgmHuman ResourcesInformation TechnologyPresident OfficeProcurementSenior VP for Admin & FinanceStudent Affairs & Enroll MgmtUniv Advancement VP Office
University CommunicationsVice Pres Research
0 2 4 6 8 10 12 14 16 18 20 22 24 26 28 30Full Time Equivalents
Perform General Accounting
Perform Central Accounting
Perform Department-Level Budgeting
Perform Bursar/Collection Activities
Conduct Travel Expense Processing
Execute Accounts Payable
Administer Research Accounting
Manage/Execute Payroll, Time, andAttendance Administration
Conduct Accounts Receivable
Manage/Execute University-LevelBudgeting
Conduct Internal Audit
Support External Audit
Perform External Financial Reporting
27.12
19.71
16.16
14.65
13.40
12.35
11.35
8.18
5.15
4.55
4.46
3.74
3.48
(175)
(69)
(142)
(21)
(151)
(76)
(36)
(48)
(46)
(13)
(15)
(40)
(36)

72Copyright © 2014 Deloitte Development LLC. All rights reserved.
Finance – Labor CostNMSU spends $8.1M on total salaries for the Finance Division. However, based on the activity analysis of the actual portion of time that staff spend on Finance activities across NMSU, the actual labor cost for staff performing Finance work is ~$8.5M.
Labor Cost: Division vs. Function Labor Cost by Funding Type
Key Observations• The actual labor cost for Finance work is ~$415K more than what is allocated for personnel in the Finance division• ~$285K of this labor cost differential is accounted for by work performed by support staff outside of Finance• ~$130K of this labor cost differential is accounted for by work performed by Professional staff outside of Finance• Of the $8.5M spent on staff performing Finance functions, approximately $260K is from restricted sources• The majority of Finance function is being performed by professional staff
* This calculation includes the Salary of staff multiplied by the FTE allocation of time spent on finance.
143
$1,946K
253
$6,357K
26
$257K
0M
1M
2M
3M
4M
5M
6M
7M
8M
9M
10M
$6,365.22K
$2,143.53K
$8,508.75K
0M
1M
2M
3M
4M
5M
6M
7M
8M
9M
0M
$6,282.6K
$1,860.3K
$8,142.94K
Restricted Unrestricted – I&G Unrestricted – OthProfessional Support
$3,096.21K
$1,030.63K
$4,126.84K
Total Salaries for Finance Division
Labor Cost for Staff Performing Finance Work
across NMSU*
Labor Cost for Staff Performing Finance Work
from Finance Office
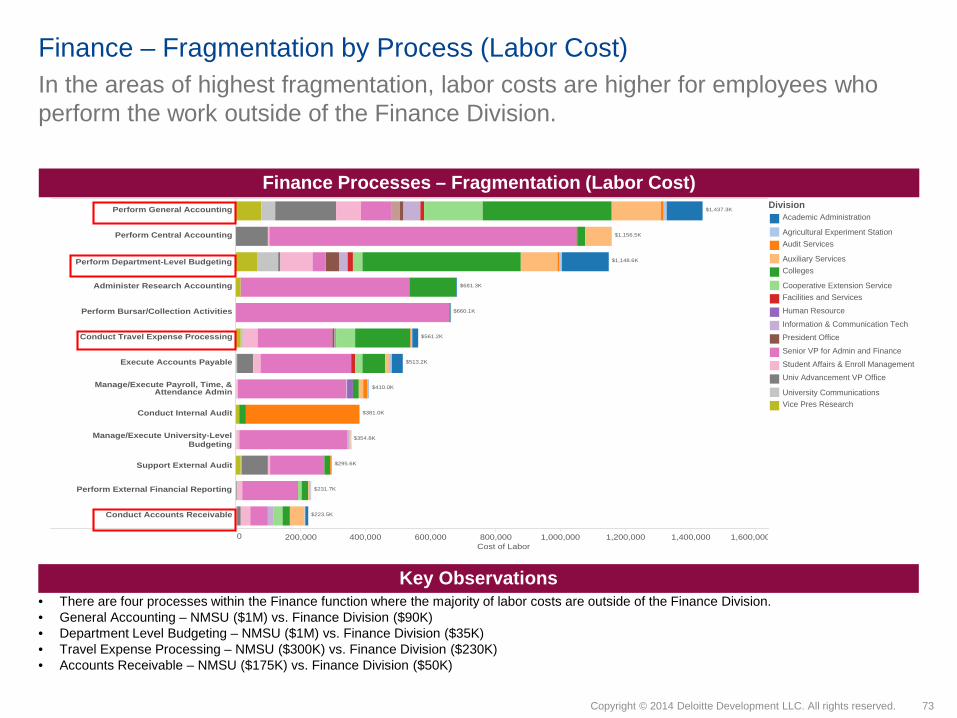
73Copyright © 2014 Deloitte Development LLC. All rights reserved.
In the areas of highest fragmentation, labor costs are higher for employees who perform the work outside of the Finance Division.
Finance – Fragmentation by Process (Labor Cost)
Finance Processes – Fragmentation (Labor Cost)
Key Observations• There are four processes within the Finance function where the majority of labor costs are outside of the Finance Division. • General Accounting – NMSU ($1M) vs. Finance Division ($90K)• Department Level Budgeting – NMSU ($1M) vs. Finance Division ($35K) • Travel Expense Processing – NMSU ($300K) vs. Finance Division ($230K) • Accounts Receivable – NMSU ($175K) vs. Finance Division ($50K)
DivisionAcademic Administration
Agricultural Experiment StationAudit Services
Auxiliary ServicesColleges
Cooperative Extension ServiceFacilities and Services
Human Resource
Information & Communication TechPresident Office
Senior VP for Admin and Finance
Student Affairs & Enroll ManagementUniv Advancement VP Office
University CommunicationsVice Pres Research
0 200,000 400,000 600,000 800,000 1,000,000 1,200,000 1,400,000 1,600,000Cost of Labor
Perform General Accounting
Perform Central Accounting
Perform Department-Level Budgeting
Administer Research Accounting
Perform Bursar/Collection Activities
Conduct Travel Expense Processing
Execute Accounts Payable
Manage/Execute Payroll, Time, &Attendance Admin
Conduct Internal Audit
Manage/Execute University-LevelBudgeting
Support External Audit
Perform External Financial Reporting
Conduct Accounts Receivable
$1,437.3K
$1,156.5K
$1,148.6K
$681.3K
$660.1K
$561.2K
$513.2K
$410.0K
$381.0K
$354.8K
$295.6K
$231.7K
$223.5K

74Copyright © 2014 Deloitte Development LLC. All rights reserved.
Perform Department-Level BudgetingPerform Risk Management
Perform General Accounting
Support External AuditExecute Accounts Payable
Perform Rate Development and ReviewConduct Travel Expense Processing
Manage/Execute Payroll, Time, & Attendance AdminPerform External Financial Reporting
Manage/Execute University-Level BudgetingConduct Accounts Receivable
Perform Central AccountingConduct Internal Audit
Administer Research AccountingPerform Debt Management Accounting
Plan/Execute Tax ConsiderationsPerform Bursar/Collection Activities
Perform Treasury Activities
$137.4K
$105.9K
$115.3K
$122.4K
$139.6K
$109.8K
$173.4K
$112.0K
$109.4K
$137.4K
$100.7K$133.2K
$286.9K
$111.5K
$157.0K
$103.8K
$133.4K$101.0K
$126.0K
$159.7K
$124.6K
$171.6K
$67.4K
$53.2K
$71.2K
$69.2K
$72.3K
$50.6K
$65.8K
$50.4K
$70.7K
$57.7K
$62.9K
$60.2K
$59.1K
$75.4K
$75.7K
$74.4K
$50.9K
$58.9K
$50.9K
$58.1K
$64.2K
$85.7K
$67.5K
$59.8K
$48.4K
$48.8K
$51.3K
$68.9K
$53.6K
$97.4K
$66.7K$49.4K
$75.7K
$74.4K
$48.5K
$80.2K
$78.2K
$63.9K
$58.6K
$59.8K
$78.7K
$83.0K
$48.6K
$63.4K
$46.4K
$55.4K
$60.5K
$57.1K
$53.3K
$54.3K
$72.2K
$53.7K
$69.1K
$80.0K
$54.1K
$77.9K
$58.7K
$66.8K
$79.7K
$86.3K
$77.8K
$77.4K
$84.6K
$84.6K
$94.2K
$77.4K
$72.9K $73.6K
$68.2K $58.8K
$48.0K
$49.1K
$67.7K
$73.4K
For processes with high fragmentation, the cost of service is often higher per FTE for employees working outside of the Finance Division.
Finance – Divisional average labor cost per process
Finance Processes – Average Labor Cost by Division per FTE
Key Observations• In four of the processes with the highest fragmentation (Perform General Accounting, Execute Accounts Payable, Conduct Travel Expense
Processing, Perform Central Accounting), the average labor cost/FTE is higher in most divisions than the Finance Division’s labor cost/FTE. • For each process, when represented, Audit Services typically reports the highest average labor cost/FTE• Where standard processes are being performed at differing labor rates across NMSU, there is a potential opportunity to deliver the same services
at a lower-cost
DivisionAcademic Administration
Ag Experiment StationAudit Services
Auxiliary ServicesColleges
Cooperative Extension ServiceFacilities and Services
Honors College/Crimson Sch PgmHuman ResourcesInformation TechnologyPresident OfficeProcurementSenior VP for Admin & FinanceStudent Affairs & Enroll MgmtUniv Advancement VP Office
University CommunicationsVice Pres Research

75Copyright © 2014 Deloitte Development LLC. All rights reserved.
NMSU’s Finance function has opportunities to improve Span of Control (SoC) and possibly reduce its number of managers as indicated by six levels of managers and staff to manager ratio of 3:1, which is below the standard range of 8:1 to 12:1..
Finance - Span of Control and Management Layer
Key Observations• Finance’s SoC is an inverted pyramid instead of leading class pyramid which has increasing SoC at lower levels of the organization• Finance’s vertical structure, with higher SoC at the top level could indicate inefficiencies related to roles and responsibilities and organizational
communications• 65% of the managers in the Finance Function manage 3 people or less, • A culture of working supervisors is often a driver of low span of control
Span of Control by Layer*Management Layer Span of Control Number of Managers
Avg. SoC = 3:1
*Span of Control by Layer: Management layers represent the reporting distance from layer 0; the Chancellor is the only individual at layer 0. Those that report directly to the Chancellor are in management layer 1, etc. “None” is shown in a Function when there is no manager in a particular layer.
5.0
4.0
2.4
2.8
4.0
2.1
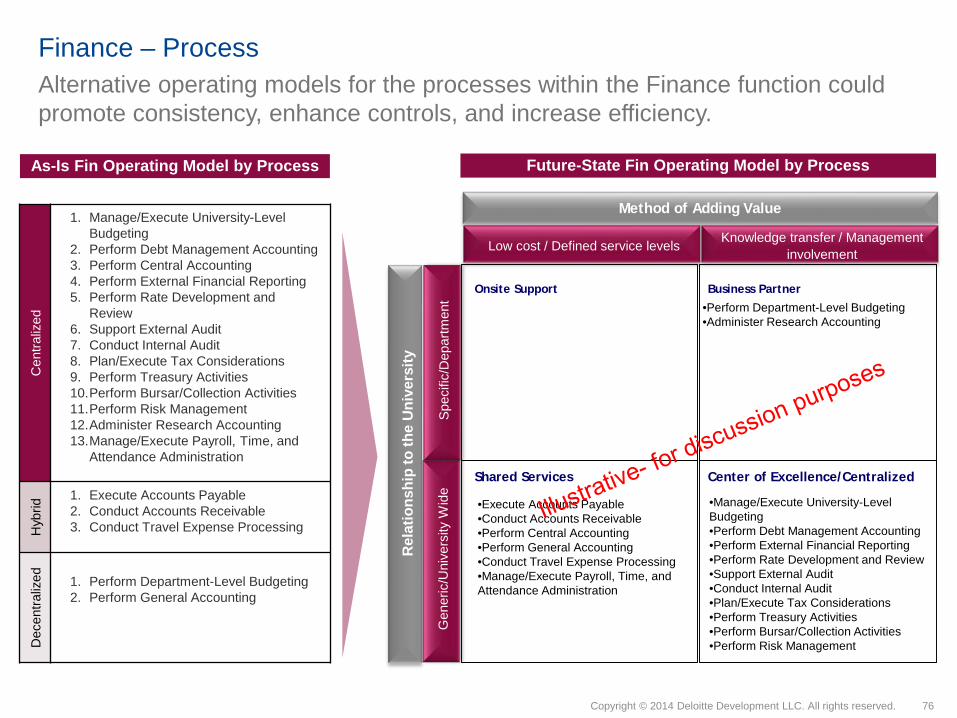
76Copyright © 2014 Deloitte Development LLC. All rights reserved.
Alternative operating models for the processes within the Finance function could promote consistency, enhance controls, and increase efficiency.
Finance – Process C
entra
lized
1. Manage/Execute University-Level Budgeting
2. Perform Debt Management Accounting3. Perform Central Accounting4. Perform External Financial Reporting5. Perform Rate Development and
Review6. Support External Audit7. Conduct Internal Audit8. Plan/Execute Tax Considerations9. Perform Treasury Activities10.Perform Bursar/Collection Activities11.Perform Risk Management 12.Administer Research Accounting 13.Manage/Execute Payroll, Time, and
Attendance Administration
Hyb
rid
1. Execute Accounts Payable2. Conduct Accounts Receivable3. Conduct Travel Expense Processing
Dec
entra
lized 1. Perform Department-Level Budgeting
2. Perform General Accounting
Rel
atio
nshi
p to
the
Uni
vers
ity
Method of Adding Value
Low cost / Defined service levels Knowledge transfer / Management involvement
Center of Excellence/CentralizedShared Services
Business PartnerOnsite Support
•Execute Accounts Payable•Conduct Accounts Receivable•Perform Central Accounting•Perform General Accounting•Conduct Travel Expense Processing•Manage/Execute Payroll, Time, and Attendance Administration
•Manage/Execute University-Level Budgeting•Perform Debt Management Accounting•Perform External Financial Reporting•Perform Rate Development and Review•Support External Audit•Conduct Internal Audit•Plan/Execute Tax Considerations•Perform Treasury Activities•Perform Bursar/Collection Activities•Perform Risk Management
Gen
eric
/Uni
vers
ity W
ide
Spec
ific/
Dep
artm
ent
As-Is Fin Operating Model by Process Future-State Fin Operating Model by Process
•Perform Department-Level Budgeting•Administer Research Accounting

77Copyright © 2014 Deloitte Development LLC. All rights reserved.
Finance – Key OpportunitiesBased on key findings and observations with NMSU during the Staffing Study, we would recommend the following opportunities for consideration:
# Opportunity Name
Opportunity Category Implementation Timeline(Short Term <= 6 mos, Medium >6 mos <=12
mosLong > 12 mos
Potential ImpactH= High gains in service or cost
savings greater than $1M; M= Moderate gains in service, or cost savings from 500K up to
$1M; L= Some gains in service, cost savings up to $500K
FN01Redesign the
Finance Operating Model
Streamline and Centralize how finance transactional activities are delivered through the implementation of shared services. Additional centralization may also occur through the development of a Business Partner model.
Organization Medium M
FN02Procure and Implement
Budgeting System
Automate budget formulation to reduce manual reconciliations, develop outyear projections, and perform what-if scenarios.
Technology Medium H
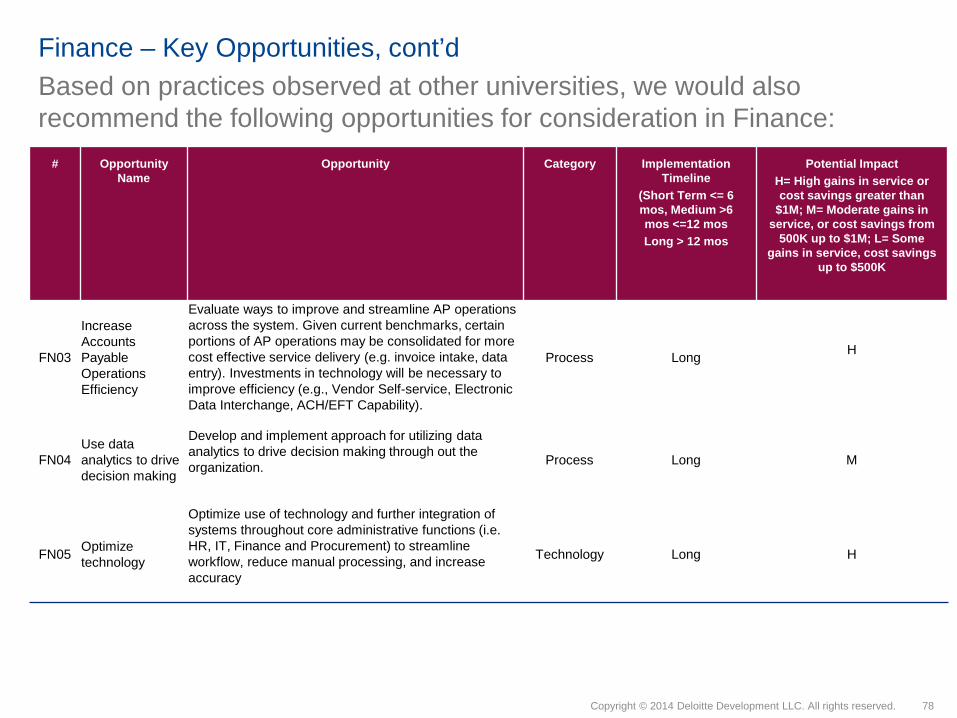
78Copyright © 2014 Deloitte Development LLC. All rights reserved.
Finance – Key Opportunities, cont’dBased on practices observed at other universities, we would also recommend the following opportunities for consideration in Finance:
# Opportunity Name
Opportunity Category Implementation Timeline
(Short Term <= 6 mos, Medium >6 mos <=12 mosLong > 12 mos
Potential ImpactH= High gains in service or cost savings greater than
$1M; M= Moderate gains in service, or cost savings from
500K up to $1M; L= Some gains in service, cost savings
up to $500K
FN03
Increase Accounts Payable Operations Efficiency
Evaluate ways to improve and streamline AP operations across the system. Given current benchmarks, certain portions of AP operations may be consolidated for more cost effective service delivery (e.g. invoice intake, data entry). Investments in technology will be necessary to improve efficiency (e.g., Vendor Self-service, Electronic Data Interchange, ACH/EFT Capability).
Process Long H
FN04Use data analytics to drive decision making
Develop and implement approach for utilizing data analytics to drive decision making through out the organization. Process Long M
FN05 Optimizetechnology
Optimize use of technology and further integration of systems throughout core administrative functions (i.e. HR, IT, Finance and Procurement) to streamline workflow, reduce manual processing, and increase accuracy
Technology Long H

Student Administrative Services (SAS)

80Copyright © 2014 Deloitte Development LLC. All rights reserved.
SAS – Overview
SAS Processes*1. Conduct Student Recruitment2. Manage/Execute Applications Processing and
Admissions3. Onboard Students4. Advise Students5. Enroll Students6. Coordinate Student Employment7. Plan/Maintain Academic Calendar8. Plan/Execute Commencement9. Manage/Maintain Student Records10. Promote Financial Aid11. Support Financial Aid, Grants, Loans, Work-
Study, Scholarships12. Process Financial Aid, Grants, Loans, Work-
Study, Scholarships13. Provide Career Services14. Manage Student Health and Wellness Programs15. Oversee Student Conduct16. Coordinate Crisis Response and Behavioral
Intervention17. Manage Student Life Activities18. Provide Academic Support19. Develop and Maintain Course Catalogs20. Manage Classroom Scheduling and Utilization21. Support International Studies
OverviewThe SAS function has overall responsibility for admissions, enhancing campus life and aiding
students in their development beyond the classroom.
Degree of Centralization vs. Peers
Degree of Shared Services vs. Peers
Primary ERP Tool vs. Peers
Technology Capabilities vs. Peers
75% 25%Student Administrative ServicesStandard ERP Customized ERP In-house system
NMSU, FY15
The SAS Division’s level of centralization is comparable to peers but it does not leverage Shared Services concepts and has limited capability to support self service and workflow.
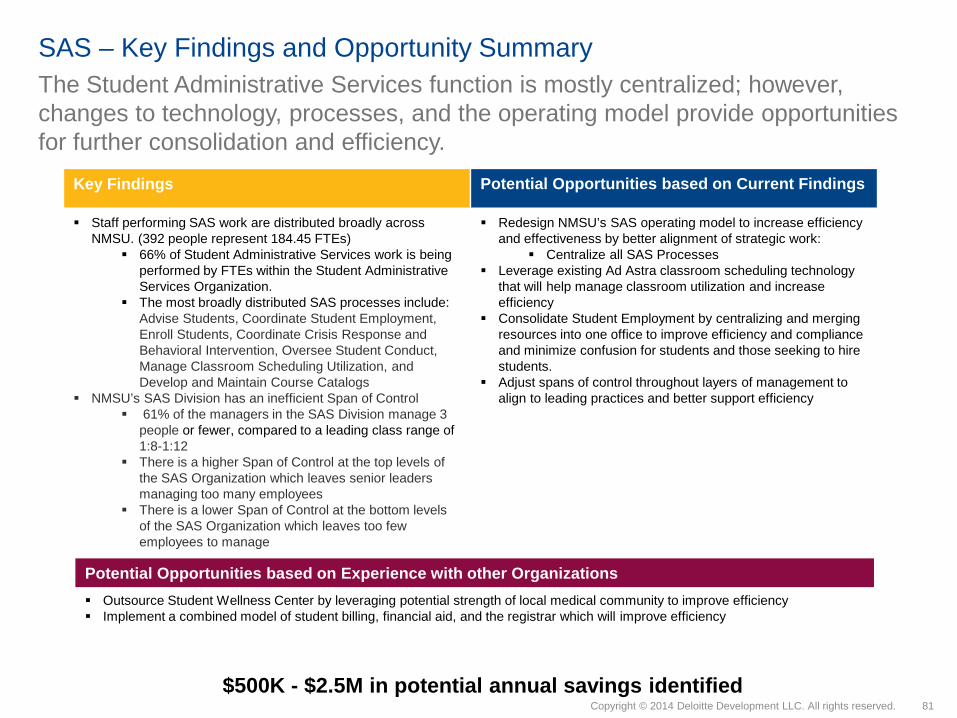
81Copyright © 2014 Deloitte Development LLC. All rights reserved.
SAS – Key Findings and Opportunity Summary
Key Findings
Staff performing SAS work are distributed broadly across NMSU. (392 people represent 184.45 FTEs)
66% of Student Administrative Services work is being performed by FTEs within the Student Administrative Services Organization.
The most broadly distributed SAS processes include: Advise Students, Coordinate Student Employment, Enroll Students, Coordinate Crisis Response and Behavioral Intervention, Oversee Student Conduct, Manage Classroom Scheduling Utilization, and Develop and Maintain Course Catalogs
NMSU’s SAS Division has an inefficient Span of Control 61% of the managers in the SAS Division manage 3
people or fewer, compared to a leading class range of 1:8-1:12
There is a higher Span of Control at the top levels of the SAS Organization which leaves senior leaders managing too many employees
There is a lower Span of Control at the bottom levels of the SAS Organization which leaves too few employees to manage
Potential Opportunities based on Current Findings
Redesign NMSU’s SAS operating model to increase efficiency and effectiveness by better alignment of strategic work:
Centralize all SAS Processes Leverage existing Ad Astra classroom scheduling technology
that will help manage classroom utilization and increase efficiency
Consolidate Student Employment by centralizing and merging resources into one office to improve efficiency and compliance and minimize confusion for students and those seeking to hire students.
Adjust spans of control throughout layers of management to align to leading practices and better support efficiency
$500K - $2.5M in potential annual savings identified
The Student Administrative Services function is mostly centralized; however, changes to technology, processes, and the operating model provide opportunities for further consolidation and efficiency.
Potential Opportunities based on Experience with other Organizations Outsource Student Wellness Center by leveraging potential strength of local medical community to improve efficiency Implement a combined model of student billing, financial aid, and the registrar which will improve efficiency

82Copyright © 2014 Deloitte Development LLC. All rights reserved.
SAS – Number of Employees and FTEs by Location There are a total of 392 people, widely distributed across campus, who report performing Student Administrative Services related activities.
Location Analysis*
Key Observations
Measure NamesCount of EmployeesFTE
• The 392 people who reported completing Student Administrative Services processes represent 184.45 FTE. 66% of FTEs completing Student Administrative Services work are located in the Student Administrative Services Division
• Combined, the colleges account for 39.02 FTEs (21%) completing SAS processes• In locations where a high number of employees spend a small fraction of their time performing SAS work, there is a risk that these employees lack
the specialized experience and training to perform this work efficiently and effectively
*NOTE: Only those locations that support any of the processes within this function are shown.
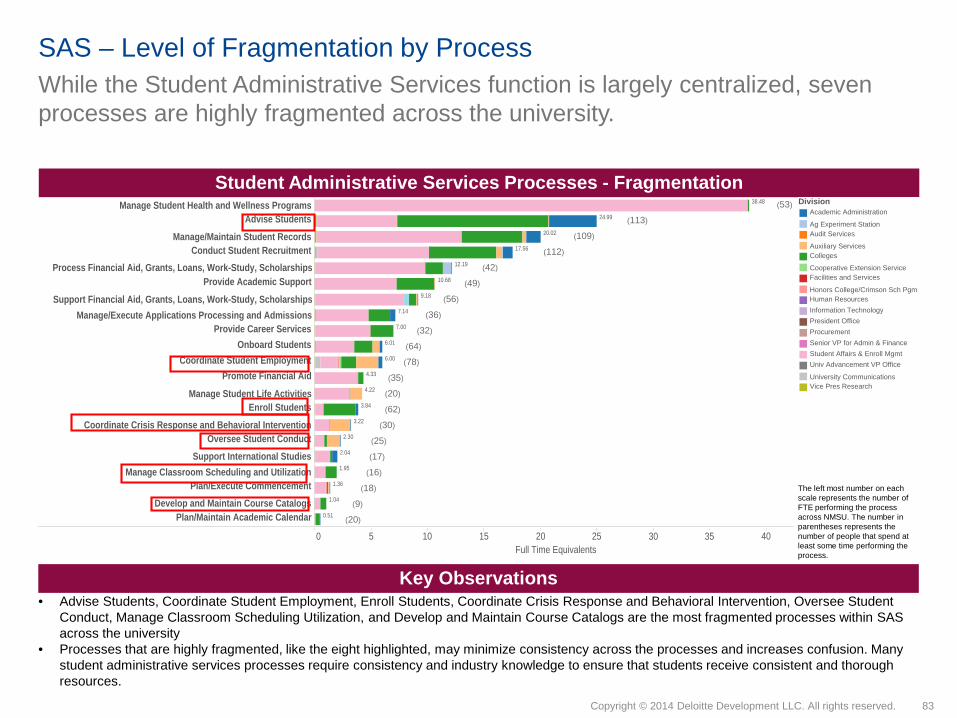
83Copyright © 2014 Deloitte Development LLC. All rights reserved.
While the Student Administrative Services function is largely centralized, seven processes are highly fragmented across the university.
SAS – Level of Fragmentation by Process
Student Administrative Services Processes - Fragmentation
Key Observations• Advise Students, Coordinate Student Employment, Enroll Students, Coordinate Crisis Response and Behavioral Intervention, Oversee Student
Conduct, Manage Classroom Scheduling Utilization, and Develop and Maintain Course Catalogs are the most fragmented processes within SAS across the university
• Processes that are highly fragmented, like the eight highlighted, may minimize consistency across the processes and increases confusion. Many student administrative services processes require consistency and industry knowledge to ensure that students receive consistent and thorough resources.
The left most number on each scale represents the number of FTE performing the process across NMSU. The number in parentheses represents the number of people that spend at least some time performing the process.
DivisionAcademic Administration
Ag Experiment StationAudit Services
Auxiliary ServicesColleges
Cooperative Extension ServiceFacilities and Services
Honors College/Crimson Sch PgmHuman ResourcesInformation TechnologyPresident OfficeProcurementSenior VP for Admin & FinanceStudent Affairs & Enroll MgmtUniv Advancement VP Office
University CommunicationsVice Pres Research
0 5 10 15 20 25 30 35 40Full Time Equivalents
Manage Student Health and Wellness ProgramsAdvise Students
Manage/Maintain Student RecordsConduct Student Recruitment
Process Financial Aid, Grants, Loans, Work-Study, ScholarshipsProvide Academic Support
Support Financial Aid, Grants, Loans, Work-Study, ScholarshipsManage/Execute Applications Processing and Admissions
Provide Career ServicesOnboard Students
Coordinate Student EmploymentPromote Financial Aid
Manage Student Life ActivitiesEnroll Students
Coordinate Crisis Response and Behavioral InterventionOversee Student Conduct
Support International StudiesManage Classroom Scheduling and Utilization
Plan/Execute CommencementDevelop and Maintain Course Catalogs
Plan/Maintain Academic Calendar
38.48
24.99
20.02
17.56
12.19
10.68
9.18
7.14
7.00
6.01
6.00
4.33
4.22
3.84
3.22
2.30
2.04
1.95
1.36
1.04
0.51
(32)
(64)
(78)
(35)
(20)
(62)
(30)
(25)
(17)
(16)
(18)
(9)
(20)
(36)
(56)
(49)
(42)
(112)
(109)
(113)
(53)
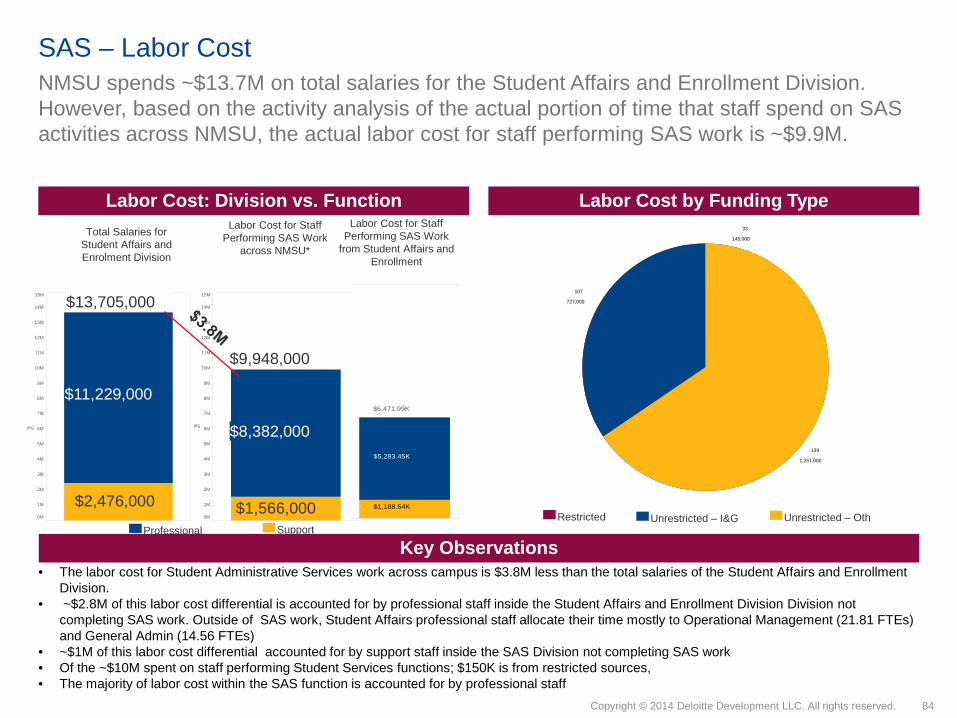
84Copyright © 2014 Deloitte Development LLC. All rights reserved.
0M
1M
2M
3M
4M
5M
6M
7M
8M
9M
10M
11M
12M
13M
14M
15MSal
11,229,000
2,476,000
13,705,000
0M
1M
2M
3M
4M
5M
6M
7M
8M
9M
10M
11M
12M
13M
14M
15MSal
8,382,000
1,566,000
9,948,000
SAS – Labor CostNMSU spends ~$13.7M on total salaries for the Student Affairs and Enrollment Division. However, based on the activity analysis of the actual portion of time that staff spend on SAS activities across NMSU, the actual labor cost for staff performing SAS work is ~$9.9M.
Labor Cost: Division vs. Function Labor Cost by Funding Type
Key Observations• The labor cost for Student Administrative Services work across campus is $3.8M less than the total salaries of the Student Affairs and Enrollment
Division. • ~$2.8M of this labor cost differential is accounted for by professional staff inside the Student Affairs and Enrollment Division Division not
completing SAS work. Outside of SAS work, Student Affairs professional staff allocate their time mostly to Operational Management (21.81 FTEs) and General Admin (14.56 FTEs)
• ~$1M of this labor cost differential accounted for by support staff inside the SAS Division not completing SAS work• Of the ~$10M spent on staff performing Student Services functions; $150K is from restricted sources, • The majority of labor cost within the SAS function is accounted for by professional staff
$11,229,000
$2,476,000 $1,566,000
$8,382,000
$13,705,000
$9,948,000
Restricted Unrestricted – I&G Unrestricted – OthProfessional Support
139
1,251,000
107
727,000
33
145,000
$5,283.45K
$1,188.54K
$6,471.99K
Total Salaries for Student Affairs and Enrolment Division
Labor Cost for Staff Performing SAS Work
across NMSU*
Labor Cost for Staff Performing SAS Work
from Student Affairs and Enrollment
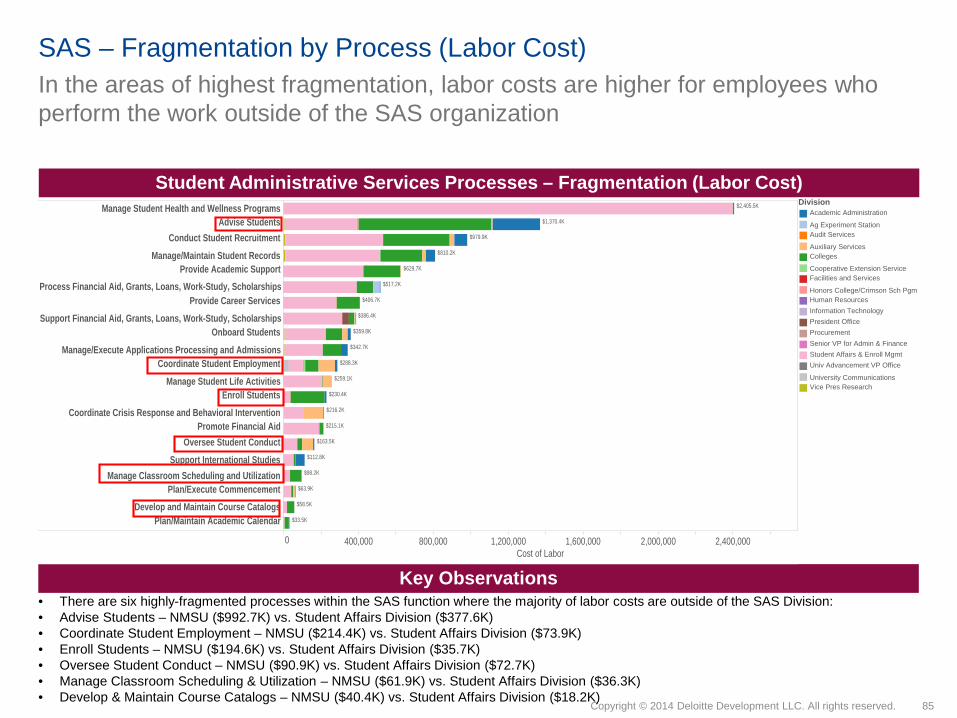
85Copyright © 2014 Deloitte Development LLC. All rights reserved.
In the areas of highest fragmentation, labor costs are higher for employees who perform the work outside of the SAS organization
SAS – Fragmentation by Process (Labor Cost)
Student Administrative Services Processes – Fragmentation (Labor Cost)
Key Observations• There are six highly-fragmented processes within the SAS function where the majority of labor costs are outside of the SAS Division:• Advise Students – NMSU ($992.7K) vs. Student Affairs Division ($377.6K)• Coordinate Student Employment – NMSU ($214.4K) vs. Student Affairs Division ($73.9K)• Enroll Students – NMSU ($194.6K) vs. Student Affairs Division ($35.7K)• Oversee Student Conduct – NMSU ($90.9K) vs. Student Affairs Division ($72.7K)• Manage Classroom Scheduling & Utilization – NMSU ($61.9K) vs. Student Affairs Division ($36.3K)• Develop & Maintain Course Catalogs – NMSU ($40.4K) vs. Student Affairs Division ($18.2K)
DivisionAcademic Administration
Ag Experiment StationAudit Services
Auxiliary ServicesColleges
Cooperative Extension ServiceFacilities and Services
Honors College/Crimson Sch PgmHuman ResourcesInformation TechnologyPresident OfficeProcurementSenior VP for Admin & FinanceStudent Affairs & Enroll MgmtUniv Advancement VP Office
University CommunicationsVice Pres Research
0 400,000 800,000 1,200,000 1,600,000 2,000,000 2,400,000Cost of Labor
Manage Student Health and Wellness ProgramsAdvise Students
Conduct Student RecruitmentManage/Maintain Student Records
Provide Academic SupportProcess Financial Aid, Grants, Loans, Work-Study, Scholarships
Provide Career ServicesSupport Financial Aid, Grants, Loans, Work-Study, Scholarships
Onboard StudentsManage/Execute Applications Processing and Admissions
Coordinate Student EmploymentManage Student Life Activities
Enroll StudentsCoordinate Crisis Response and Behavioral Intervention
Promote Financial AidOversee Student Conduct
Support International StudiesManage Classroom Scheduling and Utilization
Plan/Execute CommencementDevelop and Maintain Course Catalogs
Plan/Maintain Academic Calendar
$2,405.5K
$1,370.4K
$979.9K
$810.2K
$629.7K
$517.2K
$406.7K
$386.4K
$359.8K
$342.7K
$288.3K
$259.1K
$230.4K
$216.2K
$215.1K
$163.5K
$112.8K
$98.2K
$63.9K
$58.5K
$33.5K

86Copyright © 2014 Deloitte Development LLC. All rights reserved.
For processes with high fragmentation, the cost of service is often higher per FTE for employees working outside of the SAS Division.
SAS – Divisional average labor cost per process
Student Administrative Services Processes – Average Labor Cost by Division per FTE*
Key Observations• In the processes with the highest fragmentation (Advise Students, Coordinate Student Employment, Enroll Students, Coordinate Crisis Response
and Behavioral Intervention, Oversee Student Conduct, Manage Classroom Scheduling Utilization, and Develop and Maintain Course Catalogs), the average labor cost/FTE is higher in most divisions than the Student Administrative Services division’s labor cost/FTE.
• Where standard processes are being performed at differing labor rates across NMSU, there is a potential opportunity to deliver the same services at a lower-cost, although these opportunities are likely limited because of the smaller differential in average labor costs for SAS work across divisions
Conduct Student Recruitment
Advise Students
Coordinate Student Employment
Provide Career Services
Oversee Student Conduct
Coordinate Crisis Response and Behavioral Int..Plan/Execute Commencement
Enroll Students
Plan/Maintain Academic Calendar
Onboard Students
Manage/Maintain Student Records
Support International Studies
Manage/Execute Applications Processing and ..
Support Financial Aid, Grants, Loans, Work-St..Process Financial Aid, Grants, Loans, Work-St..
Provide Academic Support
Manage Student Life Activities
Develop and Maintain Course CatalogsPromote Financial Aid
Manage Classroom Scheduling and Utilization
Manage Student Health and Wellness Programs
$108.9K
$139.8K
$132.3K
$201.8K
$201.8K
$201.8K
$65.9K
$94.2K
$55.6K
$59.8K
$40.0K
$99.2K
$77.0K
$47.0K
$47.0K
$31.5K
$31.5K
$47.1K
$50.3K
$62.8K
$45.0K
$53.0K
$55.3K
$67.3K
$50.4K
$55.8K
$62.2K
$62.8K
$46.9K
$59.4K
$52.9K
$54.3K
$60.7K
$53.8K
$78.0K
$63.3K
$66.7K
$55.1K
$41.6K
$65.7K
$50.7K
$45.7K
$54.3K
$60.0K
$43.7K
$75.8K
$46.8K
$62.4K
$51.4K
$41.7K
$40.7K
$27.3K
$43.8K $72.6K
$60.7K
$43.3K $38.1K
$43.3K
$98.0K
$59.3K
$52.0K
$54.3K
$48.0K
$56.8K
$85.5K
$83.4K
$39.8K
$47.6K
$38.6K
$64.4K
$39.5K
$39.1K
$44.2K
$39.9K
$40.1K
$58.5K
$66.7K
$36.3K
$49.8K
$38.6K
$62.5K
$38.6K
$45.5K
$54.3K
$89.0K
$47.1K
$42.7K
$47.1K
$47.1K
$47.1K
$47.1K
$46.1K
$46.4K
$47.1K
$47.1K
$42.7K
$42.7K
$47.1K
$47.1K
$47.1K
DivisionAcademic Administration
Agricultural Experiment StationAudit Services
Auxiliary ServicesColleges
Cooperative Extension ServiceFacilities and Services
Human Resource
Information & Communication TechPresident Office
Senior VP for Admin and Finance
Student Affairs & Enroll ManagementUniv Advancement VP Office
University CommunicationsVice Pres Research

87Copyright © 2014 Deloitte Development LLC. All rights reserved.
16.0
4.8
1.8
4.5
3.3
16.0
4.8
1.8
4.5
3.3
Management Layer
Span of ControlAvg. SoC=4.1
Number of Managers
1 0
2 1
3 10
4 18
5 22
6 6
NMSU’s Student Affairs and Enrollment Division has opportunities to improve SoC and possibly reduce its number of managers as indicated by an average staff to manager ratio of 4.1:1, which is below the range of the standard range of 8:1-12:1.
SAS - Span of Control and Management Layers
Key Observations• Student Affairs and Enrollment Management SoC is an inverted pyramid instead of leading class pyramid which has increasing SoC at lower
levels of the organization• Student Affairs and Enrollment Management’s vertical structure, with higher SoC at the top level could indicate inefficiencies related to roles and
responsibilities and organizational communication• 61% of the Student Affairs and Enrollment Management managers in the SAS Division manage 3 employees or less, compared to leading class
spans of 1:8-1:12
Span of Control by Layer
NONE
16.0
4.5
4,8
3.3
1.8
*Span of Control by Layer: Management layers represent the reporting distance from layer 0; the Chancellor is the only individual at layer 0. Those that report directly to the Chancellor are in management layer 1, etc. “None” is shown in a Function when there is no manager in a particular layer.

88Copyright © 2014 Deloitte Development LLC. All rights reserved.
NMSU should centralize the majority of its Student Administrative Services processes, which will improve efficiency and maximize the university’s resources.
SAS – Process C
entra
lized
1. Manage/Execute Applications Processing and Admissions
2. Onboard Students3. Plan/Maintain Academic Calendar4. Plan/Execute Commencement5. Promote Financial Aid6. Support Financial Aid, Grants, Loans,
Work-Study, Scholarships7. Process Financial Aid, Grants, Loans,
Work-Study, Scholarships8. Provide Career Services9. Manage Student Health and Wellness
Programs10. Manage Student Life Activities11. Provide Academic Support12. Support International Studies
Hyb
rid 1. Manage/Maintain Student Records2. Conduct Student Recruitment
Dec
entra
lized
1. Advise Students2. Enroll Students3. Oversee Student Conduct4. Manage Classroom Scheduling and
Utilization5. Coordinate Student Employment6. Develop and Maintain Course Catalogs7. Coordinate Crisis Response and
Behavioral Intervention
Rel
atio
nshi
p to
the
Uni
vers
ity
Method of Adding Value
Low cost / Defined service levels Knowledge transfer / Management involvement
Center of Excellence/CentralizedShared Services
Business PartnerDepartmental/Onsite Support
•All SAS processes, except those listed in Onsite Support, should be centralized, but utilize liaisons where needed.
Gen
eric
/Uni
vers
ity W
ide
Spec
ific/
Dep
artm
ent
As-Is SAS Operating Model by Process Future-State SAS Operating Model by Process
•Onboard Students•Advise Students•Enroll Students•Conduct Student Recruitment

89Copyright © 2014 Deloitte Development LLC. All rights reserved.
SAS – Key OpportunitiesBased on key findings and observations with NMSU during the Staffing Study, we would recommend the following opportunities for consideration:
# Opportunity Name Opportunity Category
Impact Timeline(Short Term <= 6 mos, Medium >6 mos <=12
mosLong > 12 mos
Potential Impact H= High gains in service or cost
savings greater than $1M; M= Moderate gains in service, or cost savings from 500K up to $1M; L=
Some gains in service, cost savings up to $500K
SAS01 Consolidate Student Employment
Centralize and merge student employment into one office to improve consistency. Organization Short L
SAS02Implement Classroom
Scheduling Tool
NMSU has purchased classroom scheduling software. Identify the responsible organizational unit and key staff members that should be trained to use the software to inform scheduling and obtain efficiencies including better utilization of existing classroom space and avoidance of new building costs.
Technology Medium M
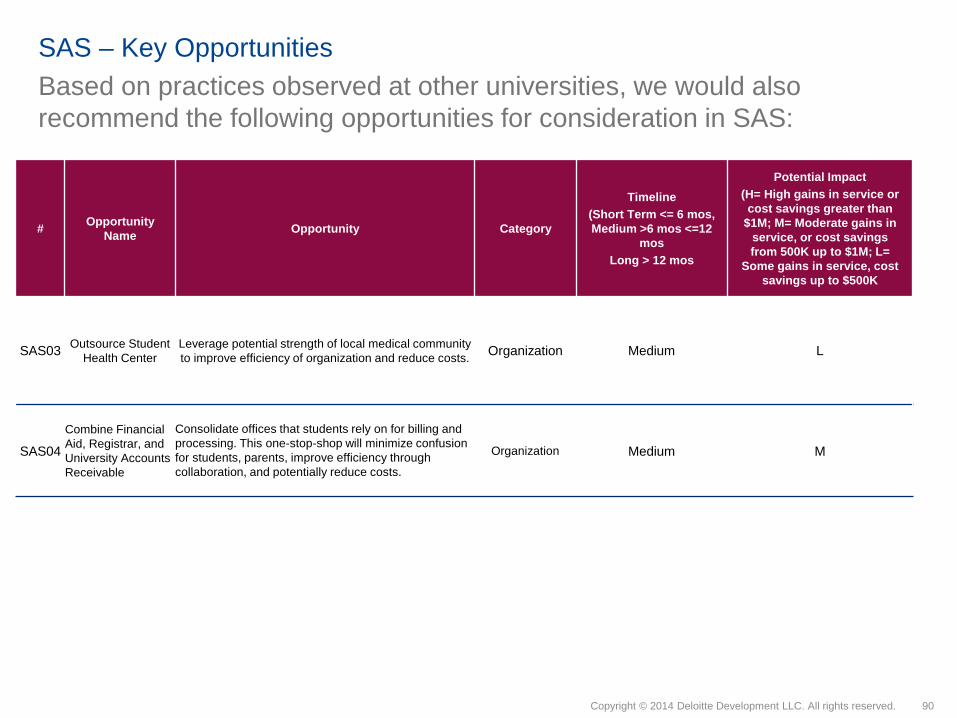
90Copyright © 2014 Deloitte Development LLC. All rights reserved.
SAS – Key Opportunities
# Opportunity Name Opportunity Category
Timeline(Short Term <= 6 mos, Medium >6 mos <=12
mosLong > 12 mos
Potential Impact(H= High gains in service or cost savings greater than
$1M; M= Moderate gains in service, or cost savings from 500K up to $1M; L=
Some gains in service, cost savings up to $500K
SAS03 Outsource Student Health Center
Leverage potential strength of local medical community to improve efficiency of organization and reduce costs. Organization Medium L
SAS04
Combine Financial Aid, Registrar, and University Accounts Receivable
Consolidate offices that students rely on for billing and processing. This one-stop-shop will minimize confusion for students, parents, improve efficiency through collaboration, and potentially reduce costs.
Organization Medium M
Based on practices observed at other universities, we would also recommend the following opportunities for consideration in SAS:

Facility Services (FS)

92Copyright © 2014 Deloitte Development LLC. All rights reserved.
50%
25%
25%
50%
25%
25%
Work Management System
Utilities Management SystemStandard ERP Customized ERP In-house system
50% 25%
25%
25%
50%
50%
75%
50%
25%
25%
Level of reporting capability used in the WorkManagement System
Level of reporting capability used in the UtilitiesManagement System
Self-service Portal capability in function
Degree to which supporting processes areaccomplished via automated workflow
FS – Overview
Facility Services Processes1. Perform Facility Development and
Renovation Administration2. Perform Maintenance3. Manage Grounds4. Manage Environmental Services 5. Oversee Utilities 6. Confirm Regulatory Compliance7. Oversee Management and Development of
Real Estate
Overview
Overall responsibility to operate, maintain and support the University’s grounds, building
maintenance, and waste management programs.
Degree of Centralization vs. Peers
Degree of Shared Services vs. Peers
Primary ERP Tool vs. Peers
Technology Capabilities vs. Peers
NMSU, FY15
The Facilities Services Division’s level of centralization is comparable to peers but it does not leverage shared services concepts and has limited capability to support self-service.
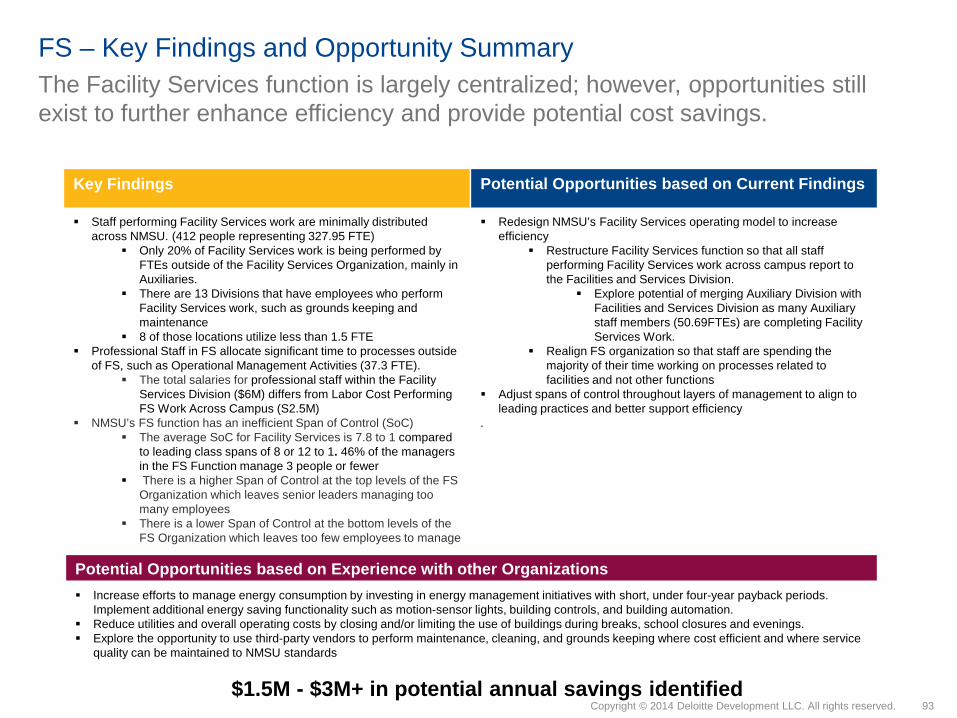
93Copyright © 2014 Deloitte Development LLC. All rights reserved.
FS – Key Findings and Opportunity Summary
Key Findings
Staff performing Facility Services work are minimally distributed across NMSU. (412 people representing 327.95 FTE)
Only 20% of Facility Services work is being performed by FTEs outside of the Facility Services Organization, mainly in Auxiliaries.
There are 13 Divisions that have employees who perform Facility Services work, such as grounds keeping and maintenance
8 of those locations utilize less than 1.5 FTE Professional Staff in FS allocate significant time to processes outside
of FS, such as Operational Management Activities (37.3 FTE). The total salaries for professional staff within the Facility
Services Division ($6M) differs from Labor Cost Performing FS Work Across Campus (S2.5M)
NMSU’s FS function has an inefficient Span of Control (SoC) The average SoC for Facility Services is 7.8 to 1 compared
to leading class spans of 8 or 12 to 1. 46% of the managers in the FS Function manage 3 people or fewer
There is a higher Span of Control at the top levels of the FS Organization which leaves senior leaders managing too many employees
There is a lower Span of Control at the bottom levels of the FS Organization which leaves too few employees to manage
Potential Opportunities based on Current Findings
Redesign NMSU’s Facility Services operating model to increase efficiency
Restructure Facility Services function so that all staff performing Facility Services work across campus report to the Facilities and Services Division.
Explore potential of merging Auxiliary Division with Facilities and Services Division as many Auxiliary staff members (50.69FTEs) are completing Facility Services Work.
Realign FS organization so that staff are spending the majority of their time working on processes related to facilities and not other functions
Adjust spans of control throughout layers of management to align to leading practices and better support efficiency
.
$1.5M - $3M+ in potential annual savings identified
The Facility Services function is largely centralized; however, opportunities still exist to further enhance efficiency and provide potential cost savings.
Potential Opportunities based on Experience with other Organizations Increase efforts to manage energy consumption by investing in energy management initiatives with short, under four-year payback periods.
Implement additional energy saving functionality such as motion-sensor lights, building controls, and building automation. Reduce utilities and overall operating costs by closing and/or limiting the use of buildings during breaks, school closures and evenings. Explore the opportunity to use third-party vendors to perform maintenance, cleaning, and grounds keeping where cost efficient and where service
quality can be maintained to NMSU standards

94Copyright © 2014 Deloitte Development LLC. All rights reserved.
20 40 60 80 100 120 140 160 180 200 220 240 260 280 300
Facilities and Services
Auxiliary ServicesAg Experiment Station
Ag,Consumer & Env Sci ColEngineering College
Student Affairs & Enroll MgmtPresident Office
Arts and Sciences College
University CommunicationsVice Pres Research
LibraryExec VP & Provost
General Counsel Office
2
3
6
4
2
5
56
286
18
15
13
0.03
263.52
50.69
2.65
0.15
4.68
0.89
1.30
1.20
0.70
0.22
1.81
0.11
FS – Number of Employees and FTEs by Location There are a total of 412 people, mainly centralized and minimally distributed across campus, who report performing Facility Services related activities.
Location Analysis*
Key Observations
Measure NamesCount of EmployeesFTE
• The 412 people who reported completing Facility Services processes represent 327.95 FTEs. This function is largely centralized as 263.52 of 327.95 FTEs (80%) are located in the Facility Services Department.
• The second highest concentration of FTEs (15%) are reported within Auxiliary Services. Within Auxiliary Services, 38.05 of 50.69 FTEs (75%) are located in Residential Life and Housing.
• 8 of the 13 locations that have staff completing Facility Services processes only utilize less than 1.5 FTEs
*NOTE: Only those locations that support any of the processes within this function are shown.
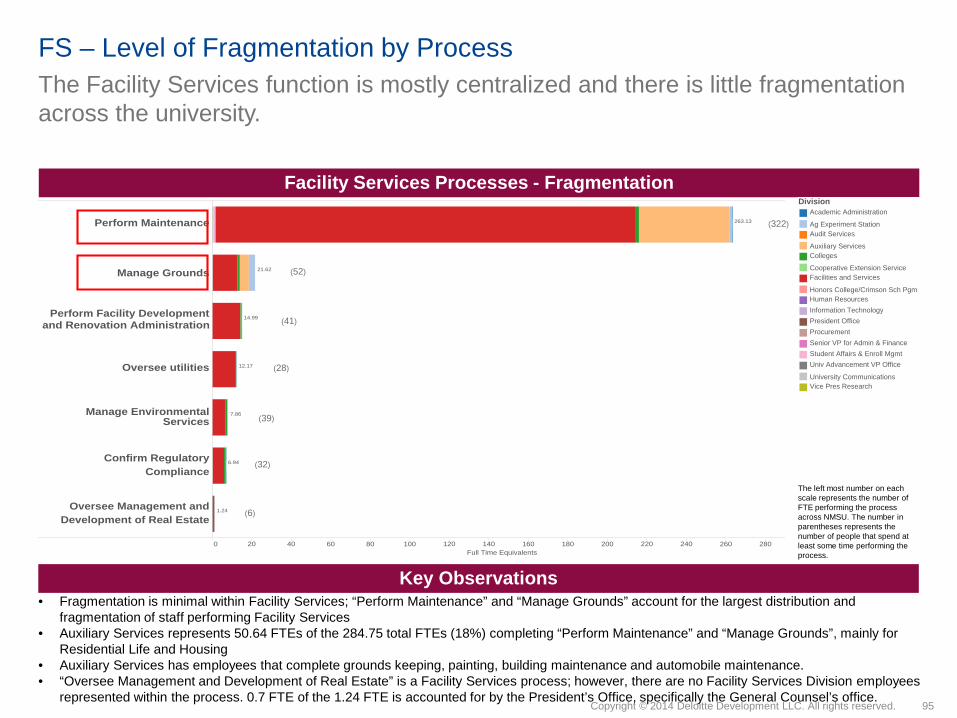
95Copyright © 2014 Deloitte Development LLC. All rights reserved.
0 20 40 60 80 100 120 140 160 180 200 220 240 260 280Full Time Equivalents
Perform Maintenance
Manage Grounds
Perform Facility Developmentand Renovation Administration
Oversee utilities
Manage EnvironmentalServices
Confirm RegulatoryCompliance
Oversee Management andDevelopment of Real Estate
263.13
21.62
14.99
12.17
7.86
6.94
1.24
The Facility Services function is mostly centralized and there is little fragmentation across the university.
FS – Level of Fragmentation by Process
Facility Services Processes - Fragmentation
Key Observations• Fragmentation is minimal within Facility Services; “Perform Maintenance” and “Manage Grounds” account for the largest distribution and
fragmentation of staff performing Facility Services• Auxiliary Services represents 50.64 FTEs of the 284.75 total FTEs (18%) completing “Perform Maintenance” and “Manage Grounds”, mainly for
Residential Life and Housing• Auxiliary Services has employees that complete grounds keeping, painting, building maintenance and automobile maintenance. • “Oversee Management and Development of Real Estate” is a Facility Services process; however, there are no Facility Services Division employees
represented within the process. 0.7 FTE of the 1.24 FTE is accounted for by the President’s Office, specifically the General Counsel’s office.
The left most number on each scale represents the number of FTE performing the process across NMSU. The number in parentheses represents the number of people that spend at least some time performing the process.
DivisionAcademic Administration
Ag Experiment StationAudit Services
Auxiliary ServicesColleges
Cooperative Extension ServiceFacilities and Services
Honors College/Crimson Sch PgmHuman ResourcesInformation TechnologyPresident OfficeProcurementSenior VP for Admin & FinanceStudent Affairs & Enroll MgmtUniv Advancement VP Office
University CommunicationsVice Pres Research
(322)
(52)
(41)
(28)
(39)
(32)
(6)

96Copyright © 2014 Deloitte Development LLC. All rights reserved.
FS – Labor CostNMSU spends ~$15M on total salaries for the Facility and Services Division. However, based on the activity analysis of the actual portion of time that staff spend on FS activities across NMSU, the actual labor cost for staff performing FS work is ~$12.4M.
Labor Cost: Division vs. Function Labor Cost by Funding Type
Key Observations• ~$15M is spent on total salaries for the Facilities and Services Division; however, the actual labor cost for staff performing Facility Services work
across campus is ~$12.4M.• ~$3.6M of this labor cost differential is accounted for by professional staff. Professional staff within the Facility Services Division spend significant
time on non Facility Services processes. Outside of FS process work, Facility Services professional staff allocate their time mostly to Operational Management (37.3 FTE)
• ~$1M of the labor costs differential is due to the increase in labor costs for support staff outside the FS Division. • Of the $12.4M spent on staff performing Facility Services Function, approximately $125K is from restricted sources.
* This calculation includes the Salary of staff multiplied by the FTE allocation of time spent on Facility Services.
137
$4,096K
261
$8,227K
14
$124K
0M
1M
2M
3M
4M
5M
6M
7M
8M
9M
10M
11M
12M
13M
14M
15M
16M
$2,502.79K
$9,944.31K
$12,447.09K
0M
1M
2M
3M
4M
5M
6M
7M
8M
9M
0M
1M
2M
3M
4M
5M
6M
$6,096.0K
$8,981.1K
$15,077.09K
Restricted Unrestricted – I&G Unrestricted – OthProfessional Support
$1,970.02K
$8,088.47K
$10,058.49K
Total Salaries for Facility and Services Division
Labor Cost for Staff Performing FS Work across
NMSU*
Labor Cost for Staff Performing FS Work from Facility Services Division

97Copyright © 2014 Deloitte Development LLC. All rights reserved.
The one process that has the most significant FTE count outside the Facility Services Division, Perform Maintenance, is also the most costly.
FS – Fragmentation by Process (Labor Cost)
Facility Services Processes – Fragmentation (Labor Cost)
Key Observations• Corresponding with the fragmentation by FTEs, “Perform Maintenance” is the highest cost of the Facility Services processes. The labor cost for
this process represents 69% of all Facility Services labor costs. • While “Perform Facility Development and Renovation Administration” accounts for the third most FTEs in a Facility Services Process, it has the
second highest labor cost. This process captures the work of project managers and engineers. These staff (project managers and engineers) earn more than other facility workers.
DivisionAcademic Administration
Ag Experiment StationAudit Services
Auxiliary ServicesColleges
Cooperative Extension ServiceFacilities and Services
Honors College/Crimson Sch PgmHuman ResourcesInformation TechnologyPresident OfficeProcurementSenior VP for Admin & FinanceStudent Affairs & Enroll MgmtUniv Advancement VP Office
University CommunicationsVice Pres Research
0 500,000 1,000,000 1,500,000 2,000,000 2,500,000 3,000,000 3,500,000 4,000,000 4,500,000 5,000,000 5,500,000 6,000,000 6,500,000 7,000,000 7,500,000 8,000,000 8,500,000 9,000,000 9,500,000Cost of Labor
Perform Maintenance
Perform Facility Developmentand Renovation Administration
Manage Grounds
Oversee utilities
Manage EnvironmentalServices
Confirm RegulatoryCompliance
Oversee Management andDevelopment of Real Estate
$8,908.5K
$1,165.1K
$662.0K
$566.0K
$514.1K
$466.3K
$165.1K
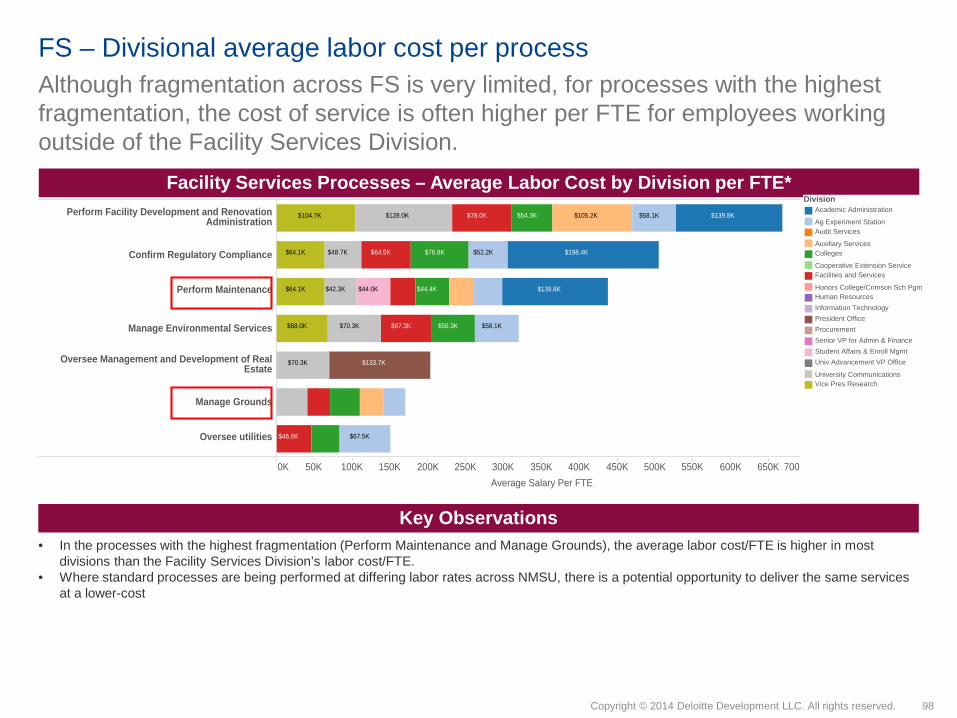
98Copyright © 2014 Deloitte Development LLC. All rights reserved.
Although fragmentation across FS is very limited, for processes with the highest fragmentation, the cost of service is often higher per FTE for employees working outside of the Facility Services Division.
FS – Divisional average labor cost per process
Facility Services Processes – Average Labor Cost by Division per FTE*
Key Observations• In the processes with the highest fragmentation (Perform Maintenance and Manage Grounds), the average labor cost/FTE is higher in most
divisions than the Facility Services Division’s labor cost/FTE. • Where standard processes are being performed at differing labor rates across NMSU, there is a potential opportunity to deliver the same services
at a lower-cost
0K 50K 100K 150K 200K 250K 300K 350K 400K 450K 500K 550K 600K 650K 700KAverage Salary Per FTE
Perform Facility Development and RenovationAdministration
Confirm Regulatory Compliance
Perform Maintenance
Manage Environmental Services
Oversee Management and Development of RealEstate
Manage Grounds
Oversee utilities
$139.8K
$198.4K
$139.8K
$105.2K
$133.7K
$128.0K$104.7K $58.1K
$52.2K
$58.1K
$67.5K
$54.3K
$76.8K
$44.4K
$56.3K
$78.0K
$64.5K
$67.3K
$46.6K
$44.0K
$48.7K
$42.3K
$70.3K
$70.3K
$64.1K
$64.1K
$68.0K
DivisionAcademic Administration
Ag Experiment StationAudit Services
Auxiliary ServicesColleges
Cooperative Extension ServiceFacilities and Services
Honors College/Crimson Sch PgmHuman ResourcesInformation TechnologyPresident OfficeProcurementSenior VP for Admin & FinanceStudent Affairs & Enroll MgmtUniv Advancement VP Office
University CommunicationsVice Pres Research

99Copyright © 2014 Deloitte Development LLC. All rights reserved.
10.0
11.0
5.2
8.3
3.1
10.0
11.0
5.2
8.3
3.1
Management Layer Span of ControlAvg. SoC=7.8
Number of Managers
1 0
2 1
3 7
4 14
5 21
6 3
NMSU’s Facility Service Division has opportunities to improve Span of Control (SoC) as indicated by it’s top level of management having 10 direct reports.
FS - Span of Control and Management Layer
Key Observations• Excluding the top layer of Facility Services management, the SoC is a pyramid that has increasing span of Control at lower levels of the
organization. • 46% of the Facility Service managers in the Facility Services function manage 4 people or less.
Span of Control by Layer
NONE
10.0
3.1
5.2
11.0
8.3
*Span of Control by Layer: Management layers represent the reporting distance from layer 0; the Chancellor is the only individual at layer 0. Those that report directly to the Chancellor are in management layer 1, etc. “None” is shown in a Function when there is no manager in a particular layer.

100Copyright © 2014 Deloitte Development LLC. All rights reserved.
Alternative operating models for the processes within the FS function could promote consistency and increase efficiency.
FS – Process C
entra
lized
1. Perform Facility Development and Renovation Administration
2. Manage Environmental Services 3. Oversee utilities 4. Confirm Regulatory Compliance
Hyb
rid
1. Perform Maintenance2. Manage Grounds
Dec
entra
lized 1. Oversee Management and Development of
Real Estate
Rel
atio
nshi
p to
the
Uni
vers
ity
Method of Adding Value
Low cost / Defined service levels Knowledge transfer / Management involvement
Center of Excellence/CentralizedShared Services
Business PartnerOnsite Support
•Perform Maintenance•Manage Grounds•Manage Environmental Services•Perform Facility Development and Renovation Administration•Oversee Utilities •Confirm Regulatory Compliance•Oversee Management and Development of Real Estate
Gen
eric
/Uni
vers
ity W
ide
Spec
ific/
Dep
artm
ent
As-Is FS Operating Model by Process Future-State FS Operating Model by Process

101Copyright © 2014 Deloitte Development LLC. All rights reserved.
FS – Key Opportunities
# Opportunity Name Opportunity Category
Impact Timeline(Short Term <= 6 mos, Medium >6 mos <=12 mos; Long > 12 mos
Potential Impact (H= High gains in service or cost savings greater than $1M; M= Moderate gains in
service, or cost savings from 500K up to $1M; L= Some gains in service, cost savings up to $500K)
FS01Centralize Facilities Staff Across Campus
Centralize the reporting lines of all staff performing FS work into FS Division to increase efficiency and consistency.
People Short Low
Based on key findings and observations with NMSU during the Staffing Study, we would recommend the following opportunities for consideration:

102Copyright © 2014 Deloitte Development LLC. All rights reserved.
FS – Key Opportunities, cont’dBased on practices observed at other universities, we would also recommend the following opportunities for consideration in FS.
# Opportunity Name Opportunity Category
Impact Timeline(Short Term <= 6
mos, Medium >6 mos <=12 mos; Long > 12
mos
Potential Impact (H= High gains in service or cost
savings greater than $1M; M= Moderate gains in
service, or cost savings from 500K up to $1M; L= Some
gains in service, cost savings up to $500K)
FS02
Reduce utilities and operational costs by limiting use of buildings during evenings and
summer
Reduce utilities and operations costs by closing or limiting use of buildings at NMSU during summer breaks and evenings. The temporary closure can enable NMSU to save on cost of utilities, custodial and maintenance services, as well as provide opportunities for renovation or repairs, as required.
Process Short H
FS03
Reduce energy consumption by
investing in energy management
initiatives
Further increase efforts to manage consumption by investing in energy management initiatives with short, under four-year payback periods. Continue to develop and evaluate business cases for energy savings that have payback periods, such as: energy efficient light bulbs, motion sensor switches, building controls and building automation. To fund these initiatives, consider as one of the sources a rebate system that reinvests a percentage of savings each year from energy initiatives back into the energy management fund. Consider creating a Strategic Plan to give the energy management organizations direction.
Financial Short M
FS04Consolidate or Outsource Labor Contracts
Analyze outsourcing and consolidation potential for Facility Services workers (i.e. Cleaning staff, groundskeepers, maintenance workers, etc.).
Organization Long Low
Advancement (ADV)

104Copyright © 2014 Deloitte Development LLC. All rights reserved.
ADV – Overview
Advancement Processes*1. Manage Gift Accounting and Receiving2. Conduct Prospect Research and
Management Activities3. Execute Donations and Stewardship
Reporting4. Execute Comprehensive and Capital
Campaign Fundraising5. Manage Corporate & Foundation Fundraising6. Oversee Annual Giving7. Manage Planned Giving8. Manage Faculty, Staff, Student, Alumni
Relations, donors and friends.9. Manage Donor Relations/Stewardship10.Manage Relations with External
Organizations and/or Individuals11.Coordinate Event Planning12.Facilitate Marketing13.Coordinate Communications14.Manage Donor and Alumni Records15.Manage University Scholarships Inventory16.Manage University and Foundation
Endowments17.Manage Volunteerism
Overview
The Advancement Function is primarily to oversee fundraising and donor engagement.
Degree of Centralization vs. Peers
Degree of Shared Services vs. Peers
Primary ERP Tool vs. Peers
Technology Capabilities vs. Peers
N/A
NMSU, FY15
50%
50%
100%
50%
50%
Level of reporting capability
Self-service Portal capability in function
Degree to which supporting processes areaccomplished via automated workflow
The Advancement Division’s level of centralization is low compared to peers and it does not leverage Shared Services concepts. The function has Medium-to-High capabilities across Technology.

105Copyright © 2014 Deloitte Development LLC. All rights reserved.
ADV – Key Findings and Opportunity Summary
$1M - $1.5M in potential annual savings identified
While the majority of Advancement work is centralized in the Advancement Division, improving the Span of Control within the division may help increase efficiency across the function.
Key Findings
Staff performing Advancement work are distributed broadly across NMSU. (187 people representing 61.45 FTE)
43% of Advancement work is being performed by FTEs outside of the Advancement Organization.
The most broadly distributed Advancement processes include: Coordinate Event Planning and Manage Relations with External Organizations and/or Individuals, Coordinate Communications, Manage Corporate & Foundation Fundraising, and Facilitate Marketing.
NMSU’s Advancement function has a slightly inefficient Span of Control
The average SoC for Advancement is 3.2:1 compared to the leading class range of 8:1 to 12:1
41% of the managers in the Advancement Function manage 3 people or fewer
There is a higher Span of Control at the top levels of the Advancement Organization which leaves senior leaders managing too many employees. The top level of management manages 8 employees.
Potential Opportunities based on Current Findings
Redesign NMSU’s Advancement operating model to increase efficiency and effectiveness by better alignment of transactional and strategic work:
Centralize most Advancement processes that are not already centralized
Strengthen Departmental Onsite Support Implement CoEs
Adjust spans of control throughout layers of management to align to leading practices and better support efficiency
Potential Opportunities based on Experience with other Organizations Increase fundraising capacity by evaluating distribution of all front-line fundraisers (annual giving vs. major gift and unit-based vs. centrally-
based). Explore ways to help focus fundraisers on fundraising rather than administrative processes.
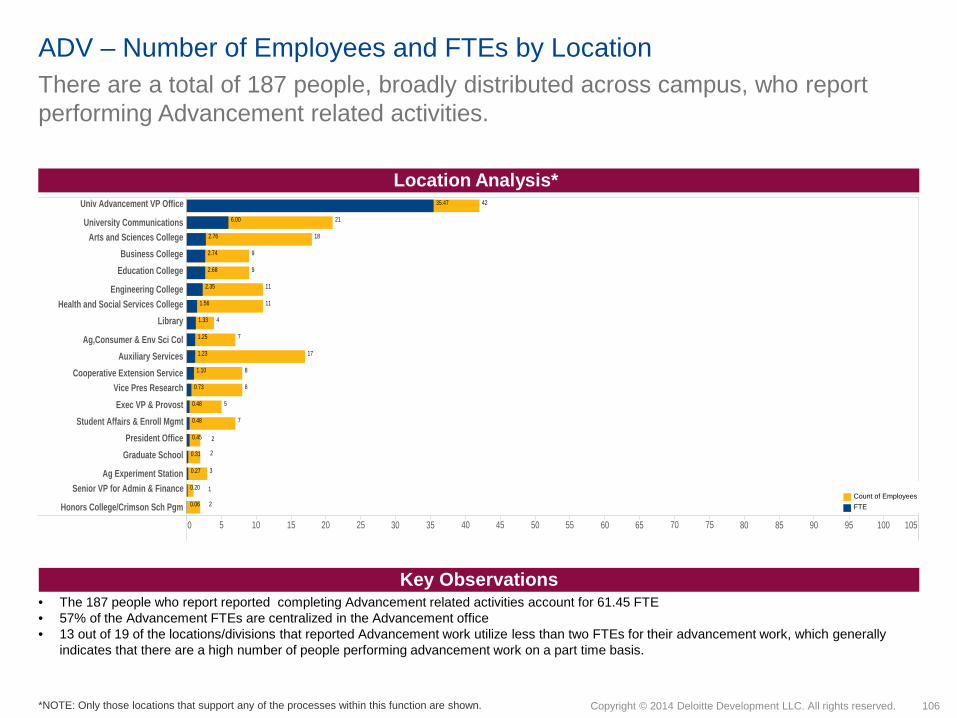
106Copyright © 2014 Deloitte Development LLC. All rights reserved.
0 5 10 15 20 25 30 35 40 45 50 55 60 65 70 75 80 85 90 95 100 105
Univ Advancement VP Office
University CommunicationsArts and Sciences College
Business CollegeEducation College
Engineering CollegeHealth and Social Services College
Library
Ag,Consumer & Env Sci ColAuxiliary Services
Cooperative Extension ServiceVice Pres ResearchExec VP & Provost
Student Affairs & Enroll MgmtPresident Office
Graduate School
Ag Experiment StationSenior VP for Admin & Finance
Honors College/Crimson Sch Pgm 2
1
2
2
42
21
18
11
11
17
9
9
4
7
8
8
5
7
3
35.47
2.35
1.25
0.45
2.68
0.48
0.48
1.33
1.23
0.73
0.27
2.76
1.56
0.06
6.00
1.10
0.20
2.74
0.31
ADV – Number of Employees and FTEs by Location There are a total of 187 people, broadly distributed across campus, who report performing Advancement related activities.
Location Analysis*
Key Observations
Measure NamesCount of EmployeesFTE
• The 187 people who report reported completing Advancement related activities account for 61.45 FTE• 57% of the Advancement FTEs are centralized in the Advancement office• 13 out of 19 of the locations/divisions that reported Advancement work utilize less than two FTEs for their advancement work, which generally
indicates that there are a high number of people performing advancement work on a part time basis.
*NOTE: Only those locations that support any of the processes within this function are shown.
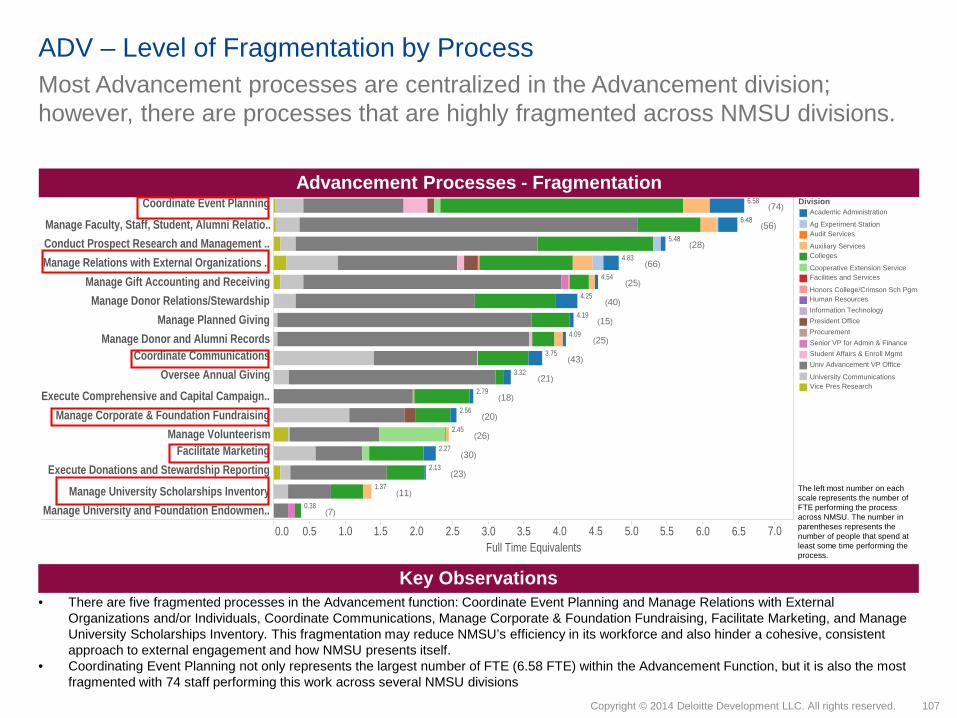
107Copyright © 2014 Deloitte Development LLC. All rights reserved.
0.0 0.5 1.0 1.5 2.0 2.5 3.0 3.5 4.0 4.5 5.0 5.5 6.0 6.5 7.0Full Time Equivalents
Coordinate Event PlanningManage Faculty, Staff, Student, Alumni Relatio..Conduct Prospect Research and Management ..Manage Relations with External Organizations ..
Manage Gift Accounting and ReceivingManage Donor Relations/Stewardship
Manage Planned GivingManage Donor and Alumni Records
Coordinate CommunicationsOversee Annual Giving
Execute Comprehensive and Capital Campaign..Manage Corporate & Foundation Fundraising
Manage VolunteerismFacilitate Marketing
Execute Donations and Stewardship Reporting
Manage University Scholarships InventoryManage University and Foundation Endowmen..
6.58
6.48
5.48
4.83
4.54
4.25
4.19
4.09
3.75
3.32
2.79
2.56
2.45
2.27
2.13
1.37
0.38
Most Advancement processes are centralized in the Advancement division; however, there are processes that are highly fragmented across NMSU divisions.
ADV – Level of Fragmentation by Process
Advancement Processes - Fragmentation
Key Observations• There are five fragmented processes in the Advancement function: Coordinate Event Planning and Manage Relations with External
Organizations and/or Individuals, Coordinate Communications, Manage Corporate & Foundation Fundraising, Facilitate Marketing, and Manage University Scholarships Inventory. This fragmentation may reduce NMSU’s efficiency in its workforce and also hinder a cohesive, consistent approach to external engagement and how NMSU presents itself.
• Coordinating Event Planning not only represents the largest number of FTE (6.58 FTE) within the Advancement Function, but it is also the most fragmented with 74 staff performing this work across several NMSU divisions
The left most number on each scale represents the number of FTE performing the process across NMSU. The number in parentheses represents the number of people that spend at least some time performing the process.
DivisionAcademic Administration
Ag Experiment StationAudit Services
Auxiliary ServicesColleges
Cooperative Extension ServiceFacilities and Services
Honors College/Crimson Sch PgmHuman ResourcesInformation TechnologyPresident OfficeProcurementSenior VP for Admin & FinanceStudent Affairs & Enroll MgmtUniv Advancement VP Office
University CommunicationsVice Pres Research
(74)
(56)
(28)
(66)
(25)
(40)
(15)
(25)
(43)
(21)
(18)
(20)
(26)
(30)
(23)
(11)
(7)

108Copyright © 2014 Deloitte Development LLC. All rights reserved.
0M
1M
2M
3M
4M
5M
6M
Sal
$4,710.30K
$279.28K
$4,989.58K
0M
1M
2M
3M
4M
5M
6M
Sa
$4,227.8K
$404.2K
$4,631.92K
y
ADV – Labor CostNMSU spends ~$4.6M on total salaries for the Advancement Division. However, based on the activity analysis of the actual portion of time that staff spend on ADV activities across NMSU, the actual labor cost for staff performing ADV work is ~$4.9M.
Labor Cost: Division vs. Function Labor Cost by Funding Type
Key Observations
Restricted Unrestricted – I&G Unrestricted – OthProfessional Support
• NMSU spends ~$4.6M on total salaries for the Advancement Division. However, based on the activity analysis of the actual portion of time that staff spend on ADV activities across NMSU, the actual labor cost for staff performing ADV work is ~$4.9M.
• ~$482K of this labor cost differential is accounted for by work performed by professional staff outside of ADV. • ~$125K in labor costs differential is accounted for the Support Staff in the ADV spending time on non ADV activities. • Of the $4.9M spent on performing Advancement functions, approximately $240K is from restricted sources
U i Ad t VP Offi
$2,774.97K
$171.49K
$2,946.46K
77
$2,279K
95
$2,469K
15
$242KTotal Salaries for
Advancement Division
Labor Cost for Staff Performing ADV work across
NMSU*
Labor Cost for Staff Performing ADV Work
from Advancement Division
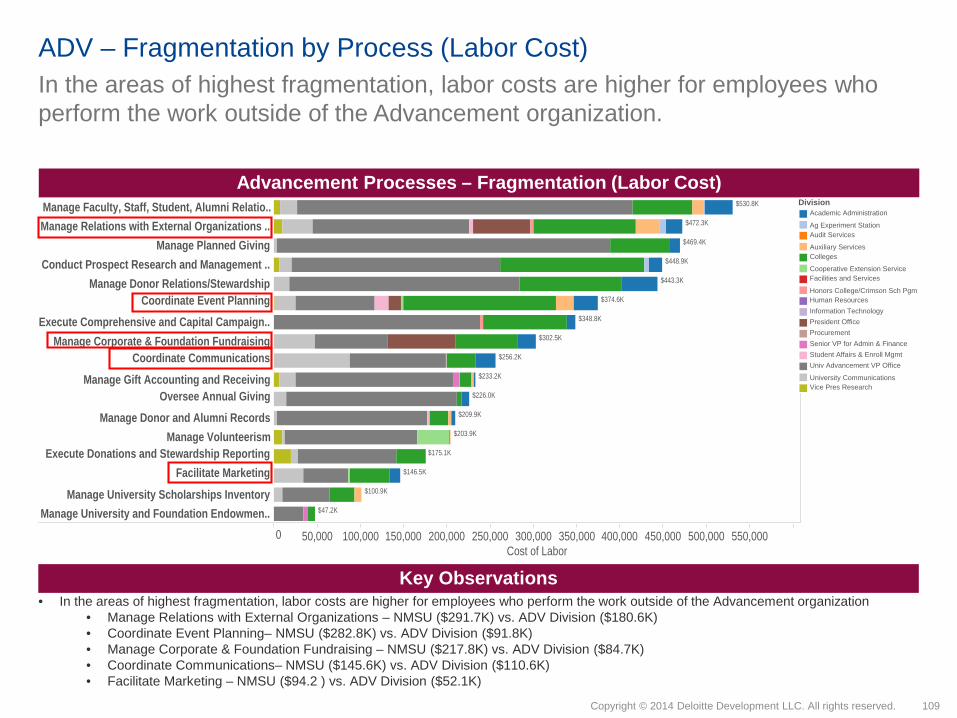
109Copyright © 2014 Deloitte Development LLC. All rights reserved.
0 50,000 100,000 150,000 200,000 250,000 300,000 350,000 400,000 450,000 500,000 550,000Cost of Labor
Manage Faculty, Staff, Student, Alumni Relatio..Manage Relations with External Organizations ..
Manage Planned GivingConduct Prospect Research and Management ..
Manage Donor Relations/StewardshipCoordinate Event Planning
Execute Comprehensive and Capital Campaign..Manage Corporate & Foundation Fundraising
Coordinate CommunicationsManage Gift Accounting and Receiving
Oversee Annual GivingManage Donor and Alumni Records
Manage VolunteerismExecute Donations and Stewardship Reporting
Facilitate Marketing
Manage University Scholarships InventoryManage University and Foundation Endowmen..
$530.8K
$472.3K
$469.4K
$448.9K
$443.3K
$374.6K
$348.8K
$302.5K
$256.2K
$233.2K
$226.0K
$209.9K
$203.9K
$175.1K
$146.5K
$100.9K
$47.2K
In the areas of highest fragmentation, labor costs are higher for employees who perform the work outside of the Advancement organization.
ADV – Fragmentation by Process (Labor Cost)
Advancement Processes – Fragmentation (Labor Cost)
Key Observations• In the areas of highest fragmentation, labor costs are higher for employees who perform the work outside of the Advancement organization
• Manage Relations with External Organizations – NMSU ($291.7K) vs. ADV Division ($180.6K)• Coordinate Event Planning– NMSU ($282.8K) vs. ADV Division ($91.8K) • Manage Corporate & Foundation Fundraising – NMSU ($217.8K) vs. ADV Division ($84.7K) • Coordinate Communications– NMSU ($145.6K) vs. ADV Division ($110.6K)• Facilitate Marketing – NMSU ($94.2 ) vs. ADV Division ($52.1K)
DivisionAcademic Administration
Ag Experiment StationAudit Services
Auxiliary ServicesColleges
Cooperative Extension ServiceFacilities and Services
Honors College/Crimson Sch PgmHuman ResourcesInformation TechnologyPresident OfficeProcurementSenior VP for Admin & FinanceStudent Affairs & Enroll MgmtUniv Advancement VP Office
University CommunicationsVice Pres Research
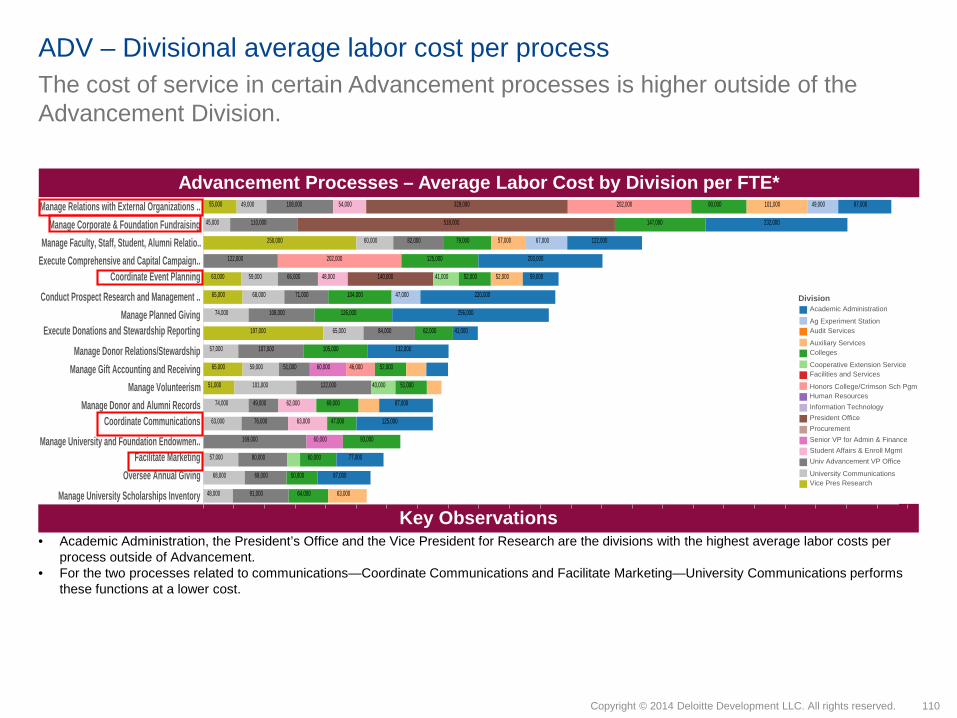
110Copyright © 2014 Deloitte Development LLC. All rights reserved.
The cost of service in certain Advancement processes is higher outside of the Advancement Division.
ADV – Divisional average labor cost per process
Advancement Processes – Average Labor Cost by Division per FTE*
Key Observations• Academic Administration, the President’s Office and the Vice President for Research are the divisions with the highest average labor costs per
process outside of Advancement.• For the two processes related to communications—Coordinate Communications and Facilitate Marketing—University Communications performs
these functions at a lower cost.
Manage Relations with External Organizations ..Manage Corporate & Foundation Fundraising
Manage Faculty, Staff, Student, Alumni Relatio..Execute Comprehensive and Capital Campaign..
Coordinate Event PlanningConduct Prospect Research and Management ..
Manage Planned GivingExecute Donations and Stewardship Reporting
Manage Donor Relations/StewardshipManage Gift Accounting and Receiving
Manage VolunteerismManage Donor and Alumni Records
Coordinate CommunicationsManage University and Foundation Endowmen..
Facilitate MarketingOversee Annual Giving
Manage University Scholarships Inventory
105,000
232,000
122,000
203,000
329,000
220,000
256,000
202,000
132,000
147,000
125,000
202,000 125,000
518,000
104,000
126,000
101,000
140,000
108,000
110,000
122,000
108,000
107,000
122,000
169,000
101,000
250,000
197,000
52,000
63,000
90,000
79,000
52,000
62,000
52,000
51,000
69,000
47,000
60,000
50,000
64,000
41,000
40,000
46,000
93,000
60,000
60,000
54,000
48,000
62,000
63,000
87,000
59,000
82,000
41,000
66,000
71,000
87,000
84,000
77,000
51,000
87,000
49,000
76,000
49,000
80,000
68,000
91,000
49,000
45,000
60,000
59,000
68,000
74,000
65,000
57,000
59,000
67,000
74,000
63,000
57,000
68,000
48,000
55,000
47,000
63,000
65,000
57,000
65,000
51,000
DivisionAcademic Administration
Ag Experiment StationAudit Services
Auxiliary ServicesColleges
Cooperative Extension ServiceFacilities and Services
Honors College/Crimson Sch PgmHuman ResourcesInformation TechnologyPresident OfficeProcurementSenior VP for Admin & FinanceStudent Affairs & Enroll MgmtUniv Advancement VP Office
University CommunicationsVice Pres Research
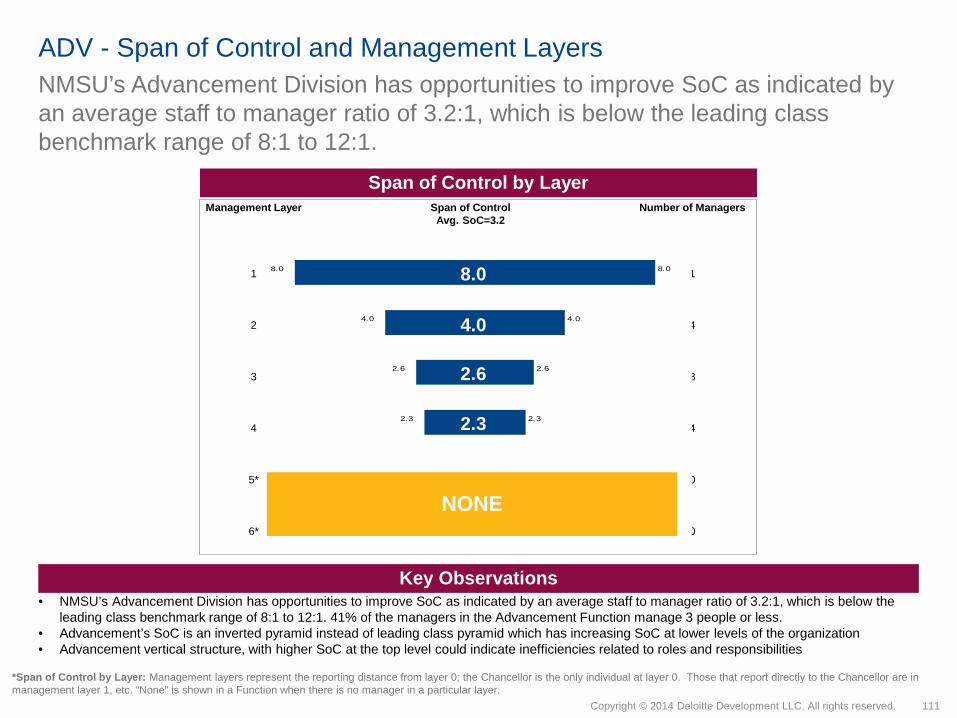
111Copyright © 2014 Deloitte Development LLC. All rights reserved.
Management Layer Span of ControlAvg. SoC=3.2
Number of Managers
1 1
2 4
3 8
4 4
5* 0
6* 0
NMSU’s Advancement Division has opportunities to improve SoC as indicated by an average staff to manager ratio of 3.2:1, which is below the leading class benchmark range of 8:1 to 12:1.
ADV - Span of Control and Management Layers
Key Observations• NMSU’s Advancement Division has opportunities to improve SoC as indicated by an average staff to manager ratio of 3.2:1, which is below the
leading class benchmark range of 8:1 to 12:1. 41% of the managers in the Advancement Function manage 3 people or less.• Advancement’s SoC is an inverted pyramid instead of leading class pyramid which has increasing SoC at lower levels of the organization• Advancement vertical structure, with higher SoC at the top level could indicate inefficiencies related to roles and responsibilities
Span of Control by Layer
8.0
4.0
2.6
2.3
8.0
4.0
2.6
2.3
NONE
*Span of Control by Layer: Management layers represent the reporting distance from layer 0; the Chancellor is the only individual at layer 0. Those that report directly to the Chancellor are in management layer 1, etc. “None” is shown in a Function when there is no manager in a particular layer.
8.0
4.0
2.6
2.3

112Copyright © 2014 Deloitte Development LLC. All rights reserved.
NMSU should centralize many of its Advancement processes to improve efficiency. ADV – Process
Cen
traliz
ed
1. Manage Gift Accounting and Receiving2. Conduct Prospect Research and
Management Activities3. Execute Donations and Stewardship
Reporting4. Execute Comprehensive and Capital
Campaign Fundraising5. Oversee Annual Giving6. Manage Planned Giving7. Manage Faculty, Staff, Student, Alumni
Relations, donors and friends.8. Manage Donor Relations/Stewardship9. Manage Donor and Alumni Records10. Manage University Scholarships Inventory11. Manage University and Foundation
Endowments12. Manage Volunteerism
Hyb
rid
1. Facilitate Marketing2. Coordinate Communications3. Manage Corporate & Foundation Fundraising
Dec
entra
lized 1. Coordinate Event Planning
2. Manage Relations with External Organizations and/or Individuals
Rel
atio
nshi
p to
the
Uni
vers
ity
Method of Adding Value
Low cost / Defined service levels Knowledge transfer / Management involvement
Center of Excellence/ CentralizedShared Services
Business PartnerOnsite Support
•Conduct Prospect Research and Management Activities•Oversee Annual Giving•Manage Planned Giving•Coordinate Event Planning•Facilitate Marketing•Coordinate CommunicationsManage Relations with External Organizations and/or Individuals•Execute Comprehensive and Capital Campaign Fundraising•Manage Corporate & Foundation Fundraising•Manage Faculty, Staff, Student, Alumni Relations, donors and friends.•Manage Volunteerism•Manage University and Foundation EndowmentsG
ener
ic/U
nive
rsity
Wid
eSp
ecifi
c/D
epar
tmen
t
As-Is ADV Operating Model by Process Future-State ADV Operating Model by Process
•Manage Donor Relations/Stewardship•Manage Gift Accounting and Receiving•Execute Donations and Stewardship Reporting•Manage Donor and Alumni Records•Manage University Scholarships Inventory
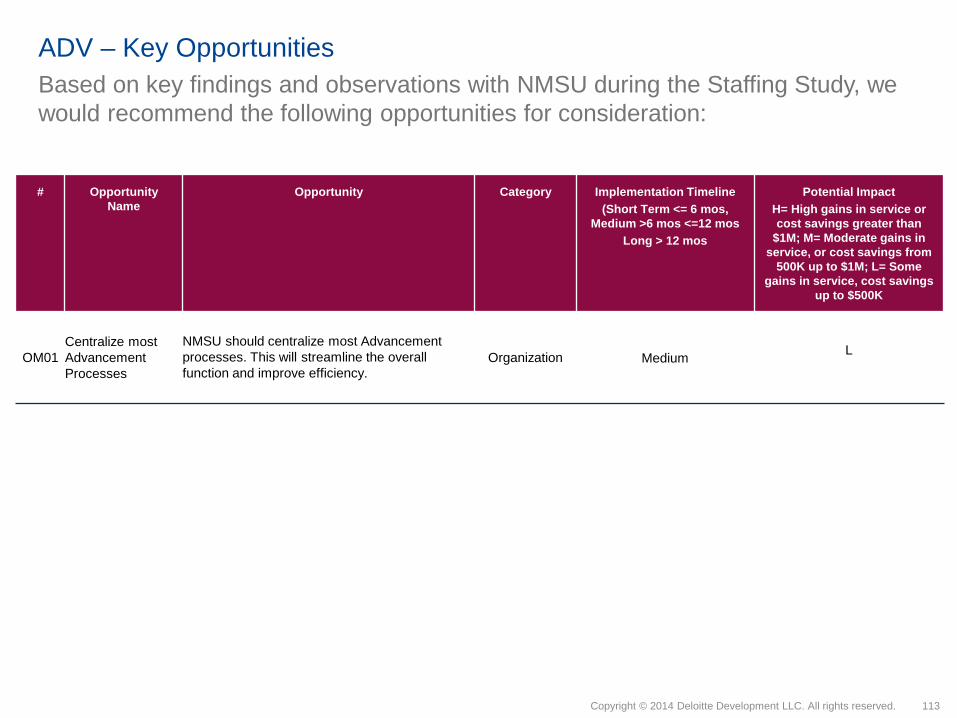
113Copyright © 2014 Deloitte Development LLC. All rights reserved.
ADV – Key OpportunitiesBased on key findings and observations with NMSU during the Staffing Study, we would recommend the following opportunities for consideration:
# Opportunity Name
Opportunity Category Implementation Timeline(Short Term <= 6 mos,
Medium >6 mos <=12 mosLong > 12 mos
Potential ImpactH= High gains in service or cost savings greater than
$1M; M= Moderate gains in service, or cost savings from
500K up to $1M; L= Some gains in service, cost savings
up to $500K
OM01Centralize most AdvancementProcesses
NMSU should centralize most Advancement processes. This will streamline the overall function and improve efficiency.
Organization Medium L

114Copyright © 2014 Deloitte Development LLC. All rights reserved.
ADV – Key Opportunities
# Opportunity Name
Opportunity Category Timeline(Short Term <= 6 mos,
Medium >6 mos <=12 mosLong > 12 mos
Potential ImpactH= High gains in service or cost savings greater than
$1M; M= Moderate gains in service, or cost savings from
500K up to $1M; L= Some gains in service, cost savings
up to $500K
ADV02Increase Fundraising Capacity
Evaluate distribution of all front-line fundraisers (annual giving vs. major gift and unit-based vs. centrally-based) and reassign according to affiliation and capacity of prospect base if needed. Explore ways to help focus fundraisers on fundraising rather than clerical or support staff processes.
Organization Long H
Based on practices observed at other universities, we would also recommend the following opportunities for consideration in Advancement.
Communications / University Relations (CUR)

116Copyright © 2014 Deloitte Development LLC. All rights reserved.
CUR – Overview
CUR Processes*1. Plan & Execute Communications2. Plan & Execute Marketing3. Plan & Execute Cooperative Extension
Services (CES) and Agricultural Experiment Station (AES) Publications
4. Produce Broadcast Television Programs 5. Manage Public TV and Radio Stations6. Develop News Stories and Conduct Media
Relations7. Handle Sports Information Duties8. Provide Strategic Direction for the University
Website
OverviewThe CUR function is responsible for promoting the
college and its faculty, students, programs, and policies to a variety of internal and external
constituents.
Degree of Centralization vs. Peers
Degree of Shared Services vs. Peers
Primary ERP Tool vs. Peers
Technology Capabilities vs. Peers
N/A
N/A
NMSU, FY15
CUR’s level of centralization is comparable to peers, but it does not leverage Shared Services concepts.
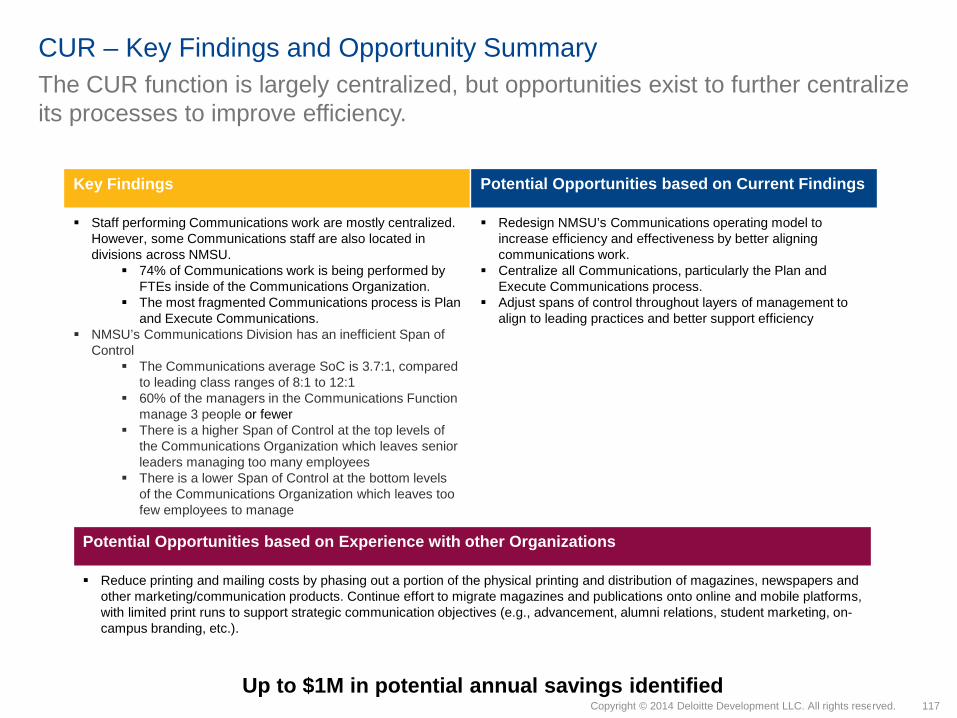
117Copyright © 2014 Deloitte Development LLC. All rights reserved.
Potential Opportunities based on Experience with other Organizations
Reduce printing and mailing costs by phasing out a portion of the physical printing and distribution of magazines, newspapers and other marketing/communication products. Continue effort to migrate magazines and publications onto online and mobile platforms, with limited print runs to support strategic communication objectives (e.g., advancement, alumni relations, student marketing, on-campus branding, etc.).
CUR – Key Findings and Opportunity Summary
Key Findings
Staff performing Communications work are mostly centralized. However, some Communications staff are also located in divisions across NMSU.
74% of Communications work is being performed by FTEs inside of the Communications Organization.
The most fragmented Communications process is Plan and Execute Communications.
NMSU’s Communications Division has an inefficient Span of Control
The Communications average SoC is 3.7:1, compared to leading class ranges of 8:1 to 12:1
60% of the managers in the Communications Function manage 3 people or fewer
There is a higher Span of Control at the top levels of the Communications Organization which leaves senior leaders managing too many employees
There is a lower Span of Control at the bottom levels of the Communications Organization which leaves too few employees to manage
Potential Opportunities based on Current Findings
Redesign NMSU’s Communications operating model to increase efficiency and effectiveness by better aligning communications work.
Centralize all Communications, particularly the Plan and Execute Communications process.
Adjust spans of control throughout layers of management to align to leading practices and better support efficiency
Up to $1M in potential annual savings identified
The CUR function is largely centralized, but opportunities exist to further centralize its processes to improve efficiency.

118Copyright © 2014 Deloitte Development LLC. All rights reserved.
CUR – Number of Employees and FTEs by Location There are a total of 176 people, mainly centralized and broadly distributed across campus, who report performing Communications and University Relations Services related activities.
Location Analysis*
0 10 20 30 40 50 60 70 80 90 100
University CommunicationsColleges
Academics AdministrationCooperative Extension Service
Vice Pres ResearchInformation & Communication Tech
Auxiliary ServicesStudent Affairs & Enroll Mgmt
Senior VP for Admin and FinanceAthletics Compliance and Eligibil
Human ResourcesAgricultural Experiment Station 1
1
1
53
48
17
18
10
8
6
7
6
40.73
1.25
4.88
2.37
1.97
0.03
0.03
0.10
1.64
0.12
1.21
0.61
Key Observations
Measure NamesCount of EmployeesFTE
• The 176 people who reported completing CUR processes represent 54.94 FTEs• ~ 74% of FTEs completing CUR work are located in the CUR division. • There are several locations—the Colleges, Academics Administration, and Vice President for Research—where a high number of employees
spend a small fraction of their time performing CUR work. For example, the Colleges have approximately the same number of people who perform some CUR work as University Communications; however, the colleges’ FTE count only represent 11% of the University Communications Count.
• There is a risk that these employees spend time providing services that could be performed centrally rather than performing more specialized duties in support of their unit
*NOTE: Only those locations that support any of the processes within this function are shown.
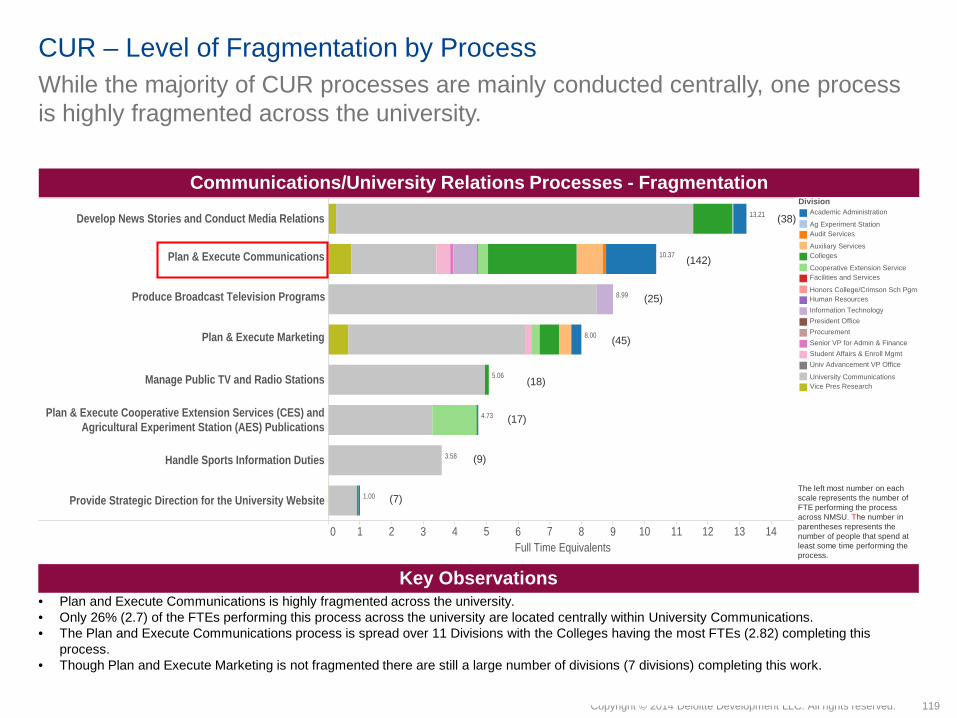
119Copyright © 2014 Deloitte Development LLC. All rights reserved.
While the majority of CUR processes are mainly conducted centrally, one process is highly fragmented across the university.
CUR – Level of Fragmentation by Process
Communications/University Relations Processes - Fragmentation
Key Observations• Plan and Execute Communications is highly fragmented across the university. • Only 26% (2.7) of the FTEs performing this process across the university are located centrally within University Communications.• The Plan and Execute Communications process is spread over 11 Divisions with the Colleges having the most FTEs (2.82) completing this
process. • Though Plan and Execute Marketing is not fragmented there are still a large number of divisions (7 divisions) completing this work.
The left most number on each scale represents the number of FTE performing the process across NMSU. The number in parentheses represents the number of people that spend at least some time performing the process.
DivisionAcademic Administration
Ag Experiment StationAudit Services
Auxiliary ServicesColleges
Cooperative Extension ServiceFacilities and Services
Honors College/Crimson Sch PgmHuman ResourcesInformation TechnologyPresident OfficeProcurementSenior VP for Admin & FinanceStudent Affairs & Enroll MgmtUniv Advancement VP Office
University CommunicationsVice Pres Research
0 1 2 3 4 5 6 7 8 9 10 11 12 13 14Full Time Equivalents
Develop News Stories and Conduct Media Relations
Plan & Execute Communications
Produce Broadcast Television Programs
Plan & Execute Marketing
Manage Public TV and Radio Stations
Plan & Execute Cooperative Extension Services (CES) andAgricultural Experiment Station (AES) Publications
Handle Sports Information Duties
Provide Strategic Direction for the University Website
13.21
10.37
8.99
8.00
5.06
4.73
3.58
1.00
(38)
(142)
(25)
(45)
(18)
(17)
(9)
(7)
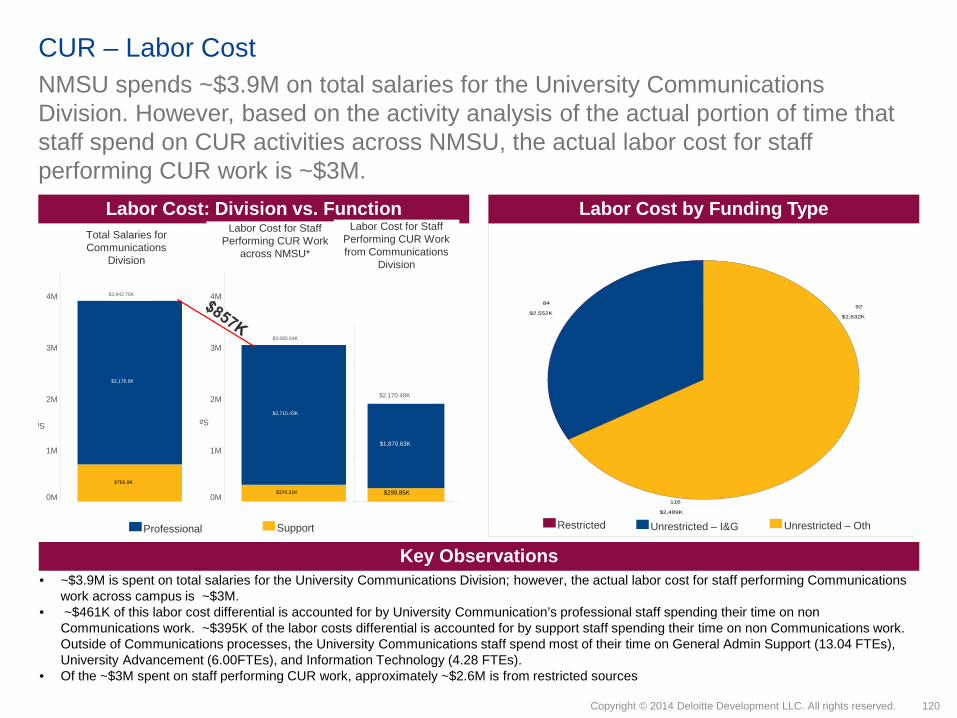
120Copyright © 2014 Deloitte Development LLC. All rights reserved.
84
$2,552K
116
$2,489K
92
$2,632K
0M
1M
2M
3M
4MSa $2,715.43K
$370.21K
$3,085.64K
0M
1M
2M
3M
4MSa
$3,176.9K
$765.9K
$3,942.76K
CUR – Labor CostNMSU spends ~$3.9M on total salaries for the University Communications Division. However, based on the activity analysis of the actual portion of time that staff spend on CUR activities across NMSU, the actual labor cost for staff performing CUR work is ~$3M.
Labor Cost: Division vs. Function Labor Cost by Funding Type
Key Observations• ~$3.9M is spent on total salaries for the University Communications Division; however, the actual labor cost for staff performing Communications
work across campus is ~$3M.• ~$461K of this labor cost differential is accounted for by University Communication’s professional staff spending their time on non
Communications work. ~$395K of the labor costs differential is accounted for by support staff spending their time on non Communications work. Outside of Communications processes, the University Communications staff spend most of their time on General Admin Support (13.04 FTEs), University Advancement (6.00FTEs), and Information Technology (4.28 FTEs).
• Of the ~$3M spent on staff performing CUR work, approximately ~$2.6M is from restricted sources
Restricted Unrestricted – I&G Unrestricted – OthProfessional Support
$1,870.63K
$299.85K
$2,170.48K
Total Salaries for Communications
Division
Labor Cost for Staff Performing CUR Work
across NMSU*
Labor Cost for Staff Performing CUR Work from Communications
Division
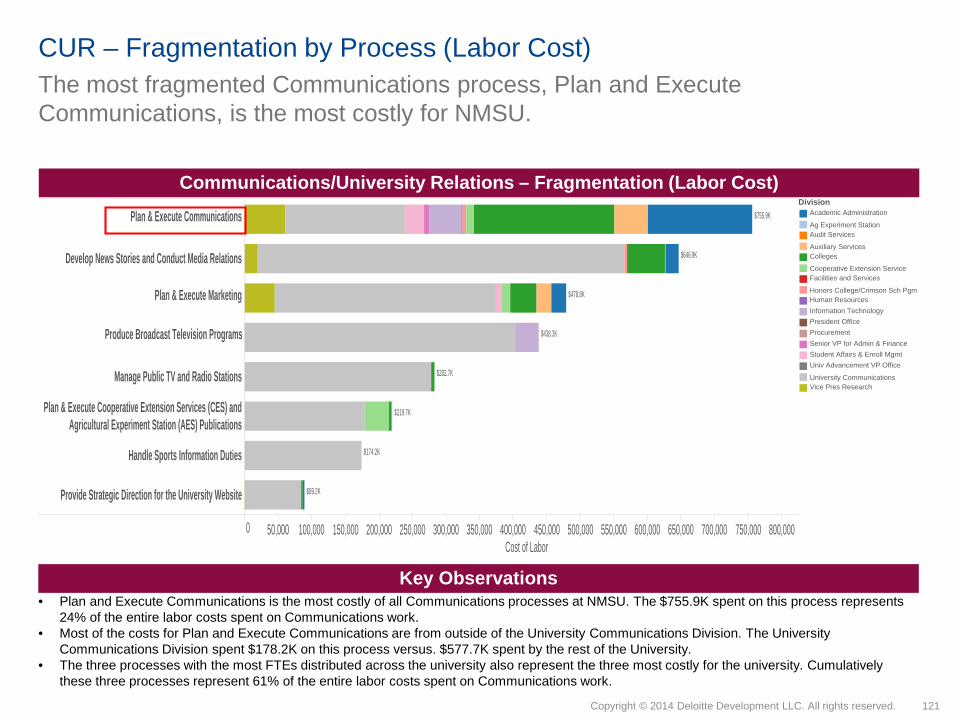
121Copyright © 2014 Deloitte Development LLC. All rights reserved.
The most fragmented Communications process, Plan and Execute Communications, is the most costly for NMSU.
CUR – Fragmentation by Process (Labor Cost)
Communications/University Relations – Fragmentation (Labor Cost)
Key Observations• Plan and Execute Communications is the most costly of all Communications processes at NMSU. The $755.9K spent on this process represents
24% of the entire labor costs spent on Communications work. • Most of the costs for Plan and Execute Communications are from outside of the University Communications Division. The University
Communications Division spent $178.2K on this process versus. $577.7K spent by the rest of the University. • The three processes with the most FTEs distributed across the university also represent the three most costly for the university. Cumulatively
these three processes represent 61% of the entire labor costs spent on Communications work.
DivisionAcademic Administration
Ag Experiment StationAudit Services
Auxiliary ServicesColleges
Cooperative Extension ServiceFacilities and Services
Honors College/Crimson Sch PgmHuman ResourcesInformation TechnologyPresident OfficeProcurementSenior VP for Admin & FinanceStudent Affairs & Enroll MgmtUniv Advancement VP Office
University CommunicationsVice Pres Research
0 50,000 100,000 150,000 200,000 250,000 300,000 350,000 400,000 450,000 500,000 550,000 600,000 650,000 700,000 750,000 800,000Cost of Labor
Plan & Execute Communications
Develop News Stories and Conduct Media Relations
Plan & Execute Marketing
Produce Broadcast Television Programs
Manage Public TV and Radio Stations
Plan & Execute Cooperative Extension Services (CES) andAgricultural Experiment Station (AES) Publications
Handle Sports Information Duties
Provide Strategic Direction for the University Website
$755.9K
$646.9K
$478.8K
$438.3K
$282.7K
$219.7K
$174.2K
$89.2K

122Copyright © 2014 Deloitte Development LLC. All rights reserved.
Plan & Execute Communications
Plan & Execute Marketing
Develop News Stories and Conduct MediaRelations
Provide Strategic Direction for the UniversityWebsite
Plan & Execute Cooperative Extension Services(CES) and Agricultural Experiment Station (AES)
Publications
Produce Broadcast Television Programs
Manage Public TV and Radio Stations
Handle Sports Information Duties
$98.3K
$67.1K
$48.3K
$47.1K
$46.8K
$46.8K
$59.6K
$57.6K
$76.6K
$64.0K
$48.4K
$59.3K
$86.1K
$48.4K
$37.0K
$45.5K
$25.8K
$50.9K$63.0K
$69.9K
$71.6K$67.2K
$45.2K
$66.0K
$59.1K
$48.4K
$94.8K
$54.6K
$47.5K
$56.0K
$48.7K
$84.2K
$70.3K
$78.4K
$48.4K
For Communications processes with the highest fragmentation and most staff distributed across NMSU, the cost of service is often higher per FTE for employees working outside of the University Communications Division.
CUR – Divisional average labor cost per process
Communications/University Relations – Average Labor Cost by Division per FTE
Key Observations• In the processes with the highest fragmentation and staff across the University (Plan and Execute Communications, Plan and Executed Marketing,
and Develop News Stories and Conduct Media Relations), the average labor cost/FTE is higher in most divisions than the University Communications Division’s labor cost/FTE.
• Where standard processes are being performed at differing labor rates across NMSU, there is a potential opportunity to deliver the same services at a lower-cost.
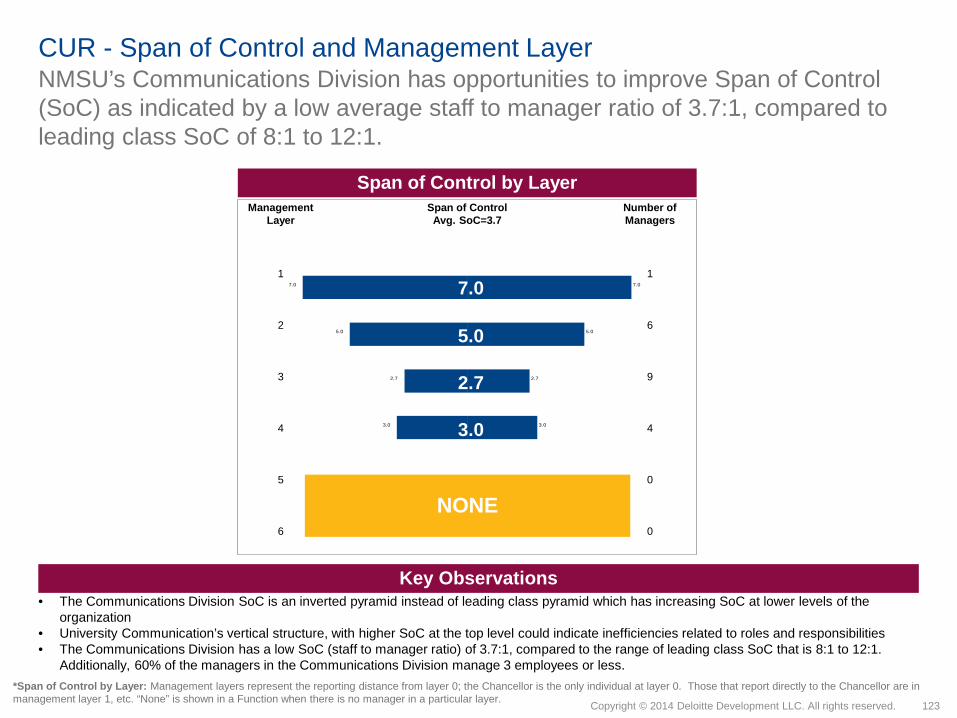
123Copyright © 2014 Deloitte Development LLC. All rights reserved.
2.7
7.0
5.0
3.0
2.7
7.0
5.0
3.0
Management Layer
Span of ControlAvg. SoC=3.7
Number of Managers
1 1
2 6
3 9
4 4
5 0
6 0
NMSU’s Communications Division has opportunities to improve Span of Control (SoC) as indicated by a low average staff to manager ratio of 3.7:1, compared to leading class SoC of 8:1 to 12:1.
CUR - Span of Control and Management Layer
Key Observations• The Communications Division SoC is an inverted pyramid instead of leading class pyramid which has increasing SoC at lower levels of the
organization• University Communication’s vertical structure, with higher SoC at the top level could indicate inefficiencies related to roles and responsibilities • The Communications Division has a low SoC (staff to manager ratio) of 3.7:1, compared to the range of leading class SoC that is 8:1 to 12:1.
Additionally, 60% of the managers in the Communications Division manage 3 employees or less.
Span of Control by Layer
NONE
*Span of Control by Layer: Management layers represent the reporting distance from layer 0; the Chancellor is the only individual at layer 0. Those that report directly to the Chancellor are in management layer 1, etc. “None” is shown in a Function when there is no manager in a particular layer.
7.0
5.0
2.7
3.0
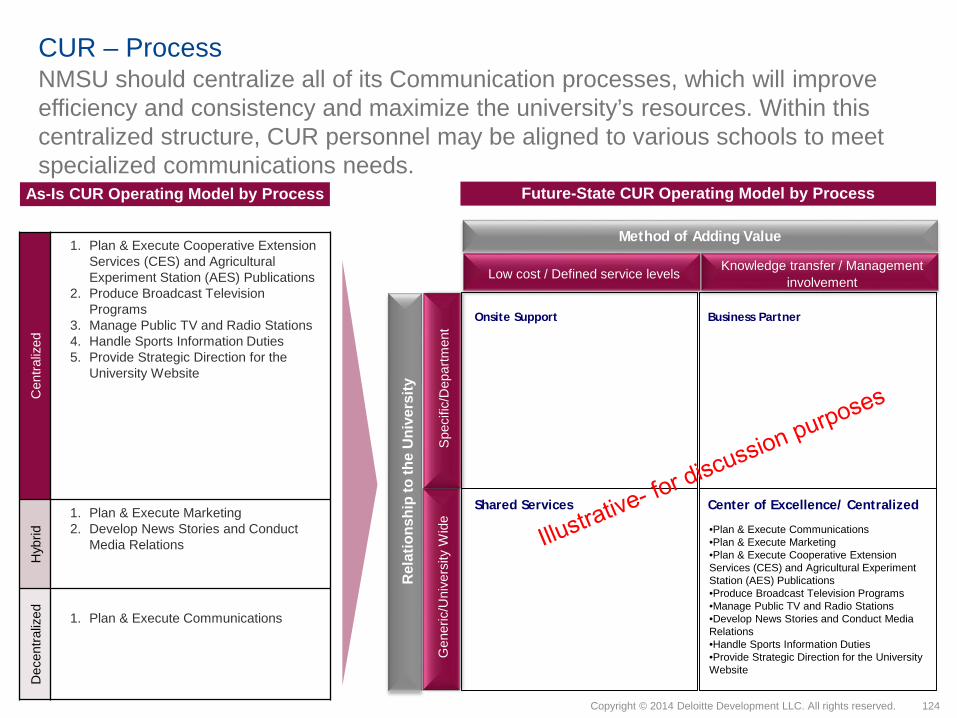
124Copyright © 2014 Deloitte Development LLC. All rights reserved.
NMSU should centralize all of its Communication processes, which will improve efficiency and consistency and maximize the university’s resources. Within this centralized structure, CUR personnel may be aligned to various schools to meet specialized communications needs.
CUR – Process C
entra
lized
1. Plan & Execute Cooperative Extension Services (CES) and Agricultural Experiment Station (AES) Publications
2. Produce Broadcast Television Programs
3. Manage Public TV and Radio Stations4. Handle Sports Information Duties5. Provide Strategic Direction for the
University Website
Hyb
rid
1. Plan & Execute Marketing2. Develop News Stories and Conduct
Media Relations
Dec
entra
lized 1. Plan & Execute Communications
Rel
atio
nshi
p to
the
Uni
vers
ity
Method of Adding Value
Low cost / Defined service levels Knowledge transfer / Management involvement
Center of Excellence/ CentralizedShared Services
Business PartnerOnsite Support
•Plan & Execute Communications•Plan & Execute Marketing•Plan & Execute Cooperative Extension Services (CES) and Agricultural Experiment Station (AES) Publications•Produce Broadcast Television Programs •Manage Public TV and Radio Stations•Develop News Stories and Conduct Media Relations•Handle Sports Information Duties•Provide Strategic Direction for the University Website
Gen
eric
/Uni
vers
ity W
ide
Spec
ific/
Dep
artm
ent
As-Is CUR Operating Model by Process Future-State CUR Operating Model by Process

125Copyright © 2014 Deloitte Development LLC. All rights reserved.
CUR – Key OpportunitiesBased on key findings and observations with NMSU during the Staffing Study, we would recommend the following opportunities for consideration:
# Opportunity Name
Opportunity Category Timeline(Short Term <= 6 mos,
Medium >6 mos <=12 mosLong > 12 mos
Potential ImpactH= High gains in service or cost savings greater than
$1M; M= Moderate gains in service, or cost savings from
500K up to $1M; L= Some gains in service, cost savings
up to $500K
CUR01Consolidate and Streamline planning and execution of Communications
Many departments and divisions produce their own communications. All communications, particularly external communications, should be centralized to improve efficiency as well as consistency.
Organization Short L

126Copyright © 2014 Deloitte Development LLC. All rights reserved.
CUR – Key Opportunities, cont’dBased on practices observed at other universities, we would also recommend the following opportunities for consideration in CUR:
# Opportunity Name
Opportunity Category Timeline(Short Term <= 6 mos,
Medium >6 mos <=12 mosLong > 12 mos
Potential ImpactH= High gains in service or cost savings greater than
$1M; M= Moderate gains in service, or cost savings from
500K up to $1M; L= Some gains in service, cost savings
up to $500K
CUR02
Reduce physical printing of magazines and publications
Many universities spend significant financial resources on physical, paper printing and publications. Reduce printing and mailing costs by phasing out a portion of the physical printing and distribution of magazines, newspapers and other marketing/communication products. Continue effort to migrate magazines and publications onto online and mobile platforms, with limited print runs to support strategic communication objectives (e.g., advancement, alumni relations, student marketing, on-campus branding, etc.).
Process Medium L

Operational Management (OM)
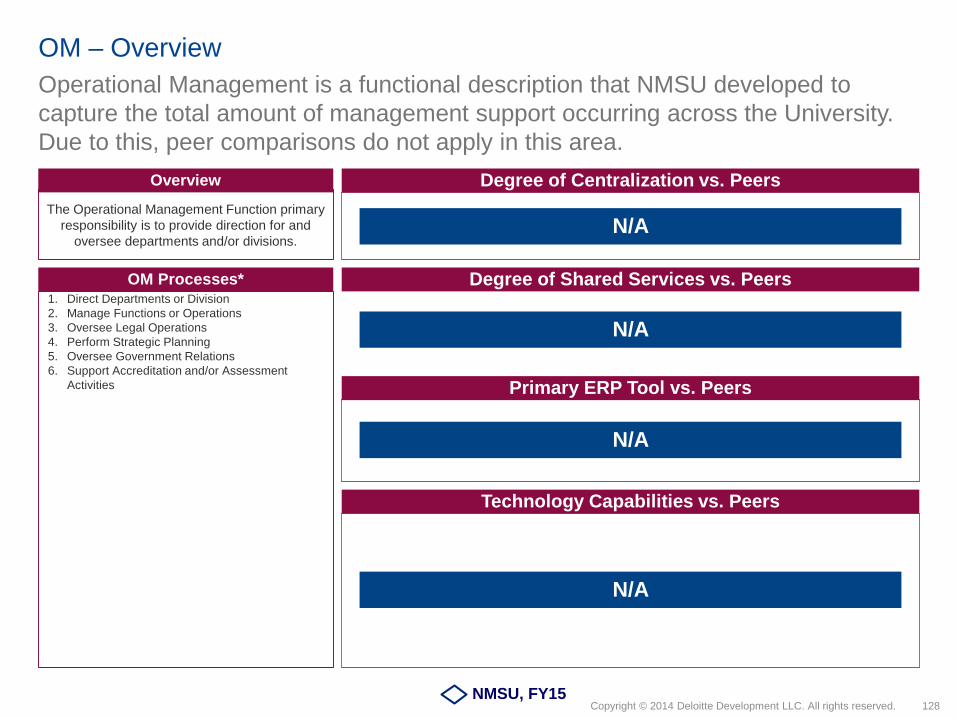
128Copyright © 2014 Deloitte Development LLC. All rights reserved.
OM – Overview Operational Management is a functional description that NMSU developed to capture the total amount of management support occurring across the University. Due to this, peer comparisons do not apply in this area.
OM Processes*1. Direct Departments or Division2. Manage Functions or Operations3. Oversee Legal Operations4. Perform Strategic Planning5. Oversee Government Relations6. Support Accreditation and/or Assessment
Activities
Overview
The Operational Management Function primary responsibility is to provide direction for and
oversee departments and/or divisions.
Degree of Centralization vs. Peers
Degree of Shared Services vs. Peers
Primary ERP Tool vs. Peers
Technology Capabilities vs. Peers
N/A
N/A
NMSU, FY15
N/A
N/A
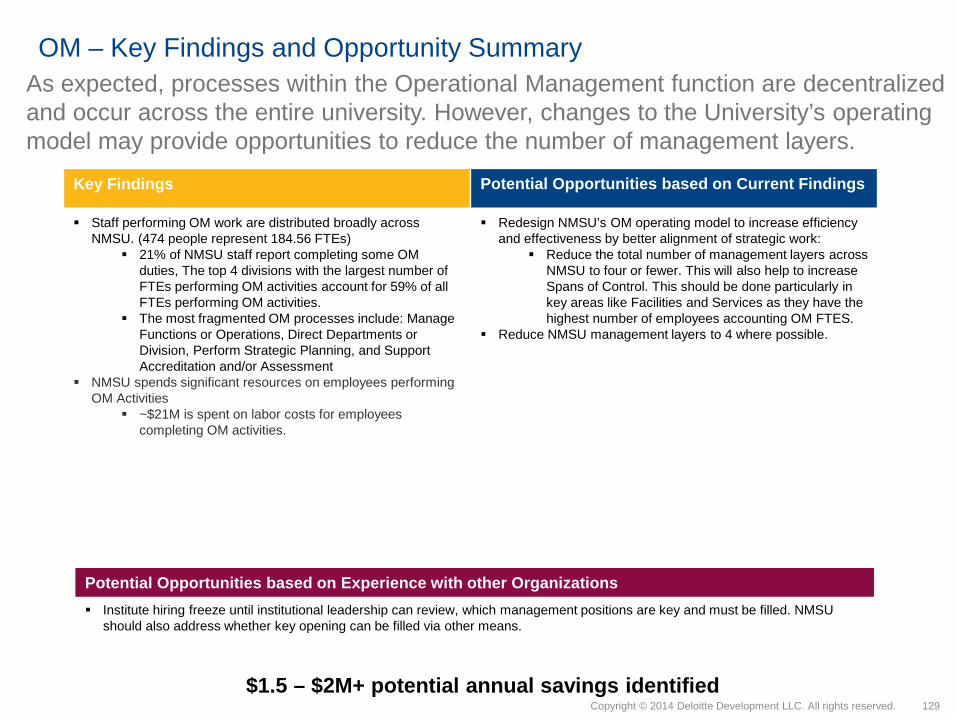
129Copyright © 2014 Deloitte Development LLC. All rights reserved.
OM – Key Findings and Opportunity Summary
Key Findings
Staff performing OM work are distributed broadly across NMSU. (474 people represent 184.56 FTEs)
21% of NMSU staff report completing some OM duties, The top 4 divisions with the largest number of FTEs performing OM activities account for 59% of all FTEs performing OM activities.
The most fragmented OM processes include: Manage Functions or Operations, Direct Departments or Division, Perform Strategic Planning, and Support Accreditation and/or Assessment
NMSU spends significant resources on employees performing OM Activities
~$21M is spent on labor costs for employees completing OM activities.
Potential Opportunities based on Current Findings
Redesign NMSU’s OM operating model to increase efficiency and effectiveness by better alignment of strategic work:
Reduce the total number of management layers across NMSU to four or fewer. This will also help to increase Spans of Control. This should be done particularly in key areas like Facilities and Services as they have the highest number of employees accounting OM FTES.
Reduce NMSU management layers to 4 where possible.
$1.5 – $2M+ potential annual savings identified
As expected, processes within the Operational Management function are decentralized and occur across the entire university. However, changes to the University’s operating model may provide opportunities to reduce the number of management layers.
Potential Opportunities based on Experience with other Organizations Institute hiring freeze until institutional leadership can review, which management positions are key and must be filled. NMSU
should also address whether key opening can be filled via other means.

130Copyright © 2014 Deloitte Development LLC. All rights reserved.
0 10 20 30 40 50 60 70 80 90 100
Facilities and Services
Colleges
Student Affairs & Enroll Mgmt
Academics Administration
Information & CommunicationTech
Auxiliary Services
Senior VP for Admin and Finance
President Office
Human Resources
Vice Pres Research
Cooperative Extension Service
Univ Advancement VP Office
University Communications
Agricultural Experiment Station
Procurement
Audit Services
Athletics Compliance and Eligibil 1
2
8
53
92
69
45
26
42
37
14
10
23
19
20
7
4
11.58
20.67
14.87
13.03
38.52
28.11
21.81
0.25
4.88
3.03
1.23
0.73
3.80
1.70
4.92
4.42
9.01
OM – Number of Employees and FTEs by Location There are a total of 474 people, widely distributed across campus, who report performing OM related activities.
Location Analysis*
Key Observations
Measure NamesCount of EmployeesFTE
• The 474 people who report completing Operation Management activities account for 184.56 FTE total. The 474 people completing some OM processes represents 21% of the entire workforce. (2227 NMSU staff members completed the activity analysis.)
• The top 4 divisions with the largest number of FTEs performing OM activities account for 59% of all FTEs performing OM activities. • Facilities and Services has the highest percentage of FTEs to count of employees who report completing OM activities with 67%. The next highest
is the President’s Office with 64%
*NOTE: Only those locations that support any of the processes within this function are shown.

131Copyright © 2014 Deloitte Development LLC. All rights reserved.
0 10 20 30 40 50 60 70 80 90Full Time Equivalents
Manage Functions or Operations
Direct Departments or Division
Perform Strategic Planning
Support Accreditation and/or AssessmentActivities
Oversee Government Relations
Oversee Legal Operations
88.48
66.07
15.62
6.51
4.70
3.18
Excluding Oversee Government Relations and Oversee Legal Operations, which are primarily completed by the President’s Office, all of OM processes are highly fragmented.
OM – Level of Fragmentation by Process
OM Processes - Fragmentation
Key Observations• 4 of the 6 Operations Management Processes—Manage Functions or Operations, Direct Departments or Division, Perform Strategic Planning, and
Support Accreditation and/or Assessment—are highly fragmented, which is expected as this function allocates time managers and management duties.
• In each of 4 fragmented areas, no division accounts for more than 40% of the work being done in that particular process. • For the three processes with the most FTEs—Manage Functions or Operations, Direct Departments or Division, and Perform Strategic Planning—
the distribution of FTEs is over at least 17 Divisions. • The FTEs performing the process Manage Functions or Operations account for 48% of all FTEs completing OM work.
The left most number on each scale represents the number of FTE performing the process across NMSU. The number in parentheses represents the number of people that spend at least some time performing the process.
(353)
(252)
(259)
(75)
(42)
(18)
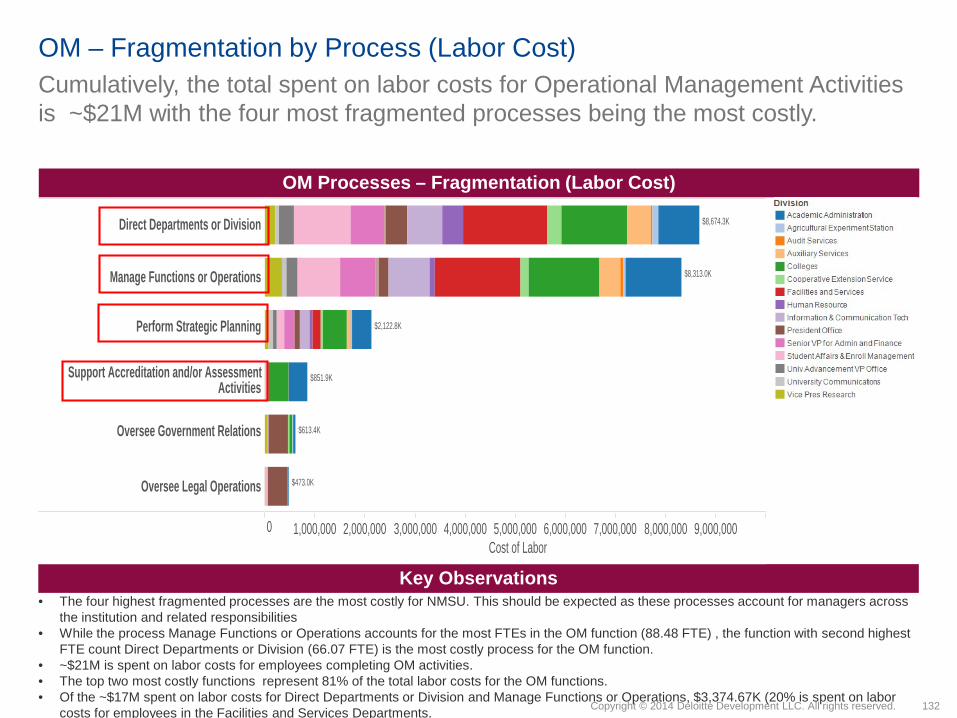
132Copyright © 2014 Deloitte Development LLC. All rights reserved.
Cumulatively, the total spent on labor costs for Operational Management Activities is ~$21M with the four most fragmented processes being the most costly.
OM – Fragmentation by Process (Labor Cost)
OM Processes – Fragmentation (Labor Cost)
Key Observations• The four highest fragmented processes are the most costly for NMSU. This should be expected as these processes account for managers across
the institution and related responsibilities • While the process Manage Functions or Operations accounts for the most FTEs in the OM function (88.48 FTE) , the function with second highest
FTE count Direct Departments or Division (66.07 FTE) is the most costly process for the OM function. • ~$21M is spent on labor costs for employees completing OM activities. • The top two most costly functions represent 81% of the total labor costs for the OM functions.• Of the ~$17M spent on labor costs for Direct Departments or Division and Manage Functions or Operations, $3,374.67K (20% is spent on labor
costs for employees in the Facilities and Services Departments.
0 1,000,000 2,000,000 3,000,000 4,000,000 5,000,000 6,000,000 7,000,000 8,000,000 9,000,000Cost of Labor
Direct Departments or Division
Manage Functions or Operations
Perform Strategic Planning
Support Accreditation and/or AssessmentActivities
Oversee Government Relations
Oversee Legal Operations
$8,674.3K
$8,313.0K
$2,122.8K
$851.9K
$613.4K
$473.0K

133Copyright © 2014 Deloitte Development LLC. All rights reserved.
There is a wide range of average labor cost by Division per FTE for the processes with the highest fragmentation.
OM – Divisional average labor cost per process
OM Processes – Average Labor Cost by Division per FTE*
Key Observations
Perform Strategic Planning
Direct Departments or Division
Manage Functions or Operations
Oversee Government Relations
Oversee Legal Operations
Support Accreditation and/or AssessmentActivities
$168.9K
$177.7K
$254.2K
$176.7K
$196.9K
$155.6K
$196.9K
$137.4K
$161.7K
$145.9K
$182.0K
$222.8K
$180.0K
$176.2K
$189.5K$210.9K
$129.4K$138.0K
$395.7K
$215.6K
$159.9K
$154.7K
$158.9K
$165.9K
$134.7K
$150.0K
$163.1K
$132.5K
$157.3K
$144.5K
• There is a wide range of average labor cost by Division per FTE for the processes with the highest fragmentation, often exceeding $100K. • Perform Strategic Planning – Lowest Cost ($81.3K – Human Resources) vs. Highest Cost ($395.7K – President’s Office) • Direct Departments or Divisions – Lowest Cost ($90.6K – University Communications) vs. Highest Cost ($215.6K – President’s Office) • Manage Functions or Operations – Lowest Cost ($59.3K – Agr. Experiment Station) vs. Highest Cost ($163.1K – University Advancement) • Support Accreditation – Lowest Cost ($43.8K – Human Resources) vs. Highest Cost ($180.0K – the Colleges)
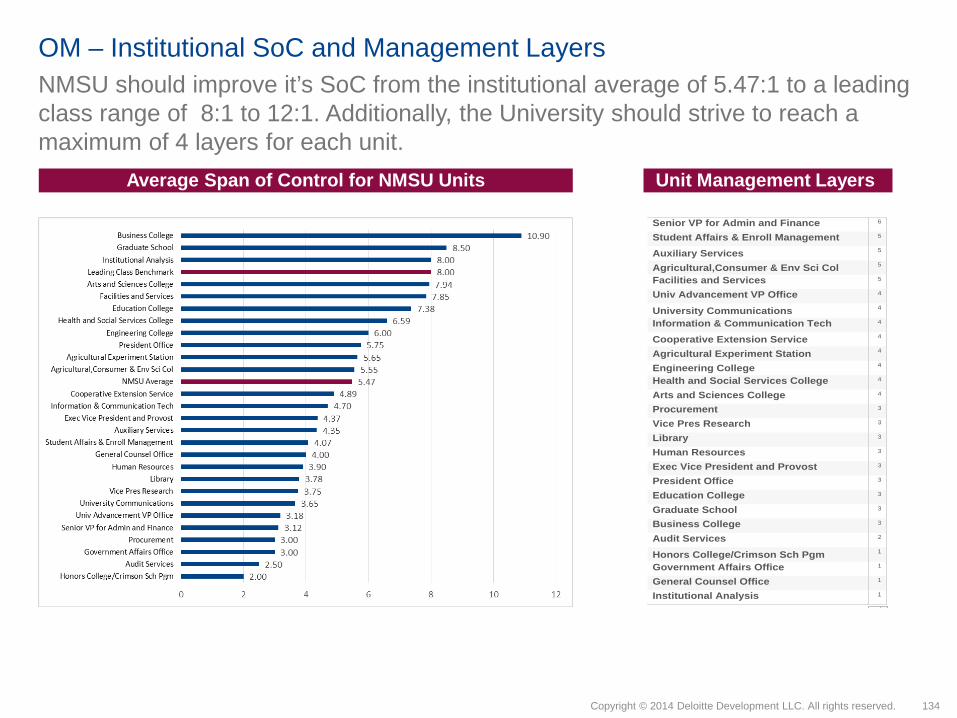
134Copyright © 2014 Deloitte Development LLC. All rights reserved.
NMSU should improve it’s SoC from the institutional average of 5.47:1 to a leading class range of 8:1 to 12:1. Additionally, the University should strive to reach a maximum of 4 layers for each unit.
OM – Institutional SoC and Management Layers
Average Span of Control for NMSU Units
Senior VP for Admin and FinanceStudent Affairs & Enroll ManagementAuxiliary ServicesAgricultural,Consumer & Env Sci ColFacilities and ServicesUniv Advancement VP Office
University CommunicationsInformation & Communication TechCooperative Extension ServiceAgricultural Experiment StationEngineering CollegeHealth and Social Services CollegeArts and Sciences CollegeProcurementVice Pres ResearchLibraryHuman ResourcesExec Vice President and ProvostPresident OfficeEducation CollegeGraduate SchoolBusiness CollegeAudit ServicesHonors College/Crimson Sch PgmGovernment Affairs OfficeGeneral Counsel OfficeInstitutional Analysis 1
1
1
1
2
3
3
3
3
3
3
3
3
3
4
4
4
4
4
4
4
4
5
5
5
5
6
Unit Management Layers

135Copyright © 2014 Deloitte Development LLC. All rights reserved.
OM – Key OpportunitiesBased on key findings and observations with NMSU during the Staffing Study, we would recommend the following opportunities for consideration:
# Opportunity Name
Opportunity Category Implementation Timeline(Short Term <= 6 mos,
Medium >6 mos <=12 mosLong > 12 mos
Potential ImpactH= High gains in service or cost savings greater than
$1M; M= Moderate gains in service, or cost savings from
500K up to $1M; L= Some gains in service, cost savings
up to $500K
OM01 Increase manager spans of control
Increase the average span of control among managers with direct reports in those department with low spans of control. Will support alignment of coverage ratio of managers, staff, faculty and students.
Organization Medium High
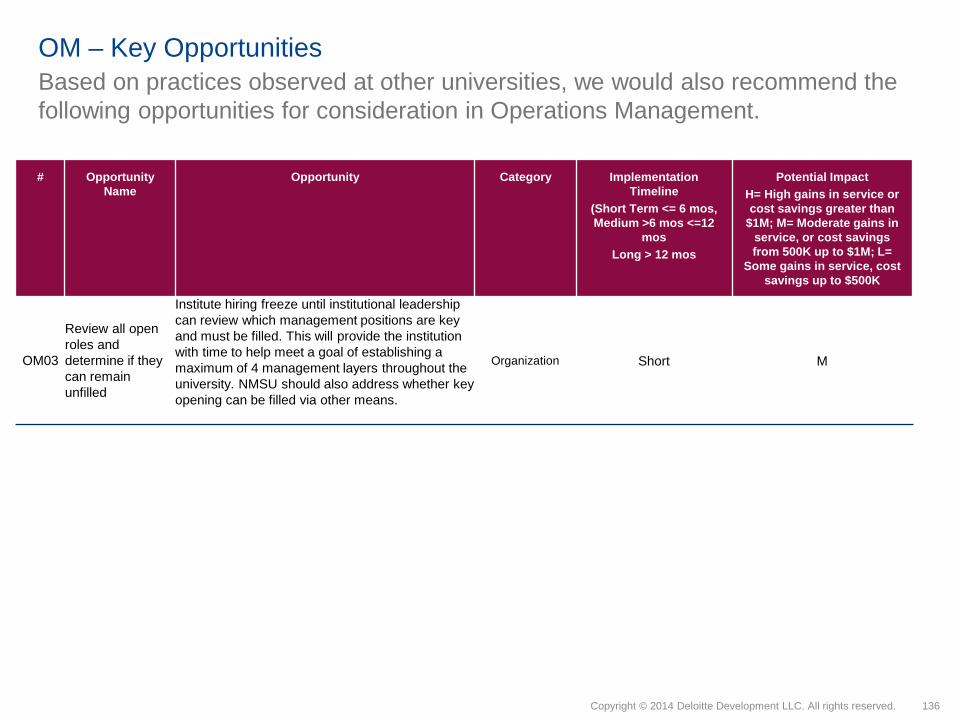
136Copyright © 2014 Deloitte Development LLC. All rights reserved.
OM – Key Opportunities
# Opportunity Name
Opportunity Category Implementation Timeline
(Short Term <= 6 mos, Medium >6 mos <=12
mosLong > 12 mos
Potential ImpactH= High gains in service or cost savings greater than
$1M; M= Moderate gains in service, or cost savings from 500K up to $1M; L=
Some gains in service, cost savings up to $500K
OM03
Review all open roles and determine if they can remain unfilled
Institute hiring freeze until institutional leadership can review which management positions are key and must be filled. This will provide the institution with time to help meet a goal of establishing a maximum of 4 management layers throughout the university. NMSU should also address whether key opening can be filled via other means.
Organization Short M
Based on practices observed at other universities, we would also recommend the following opportunities for consideration in Operations Management.

Research Development, Compliance, and Administration (RCA)

138Copyright © 2014 Deloitte Development LLC. All rights reserved.
RCA – Overview
RCA Processes*1. Identify Grant Funding and Manage Limited
Submissions2. Provide Proposal Development Support3. Support Grant Proposal Preparation, Review and
Submission4. Manage Award Negotiation and Acceptance5. Support Financial Regulatory Management6. Process Awards7. Perform Award Project Management8. Manage Licensing, Commercialization, and
Technology Transfer9. Manage Conflicts of Interest (COI) Related to
Sponsored Activities10. Manage Research Compliance 11. Conduct Subcontractor Procurement
Overview
The overall responsibility for the RCA function is to support the development of proposals,
administer awards, and ensure compliance.
Degree of Centralization vs. Peers
Degree of Shared Services vs. Peers
Primary ERP Tool vs. Peers
Technology Capabilities vs. Peers
50% 50%Research Development, Compliance andAdministration
Standard ERP Customized ERP In-house system
50%
50%
75%
50%
50%
25%
Level of reporting capability within theSponsored Projects System
Self-service Portal capability in function
Degree to which supporting processes areaccomplished via automated workflow
NMSU, FY15
RCA’s level of centralization is comparable to peers, but it does not apply leading principles of Shared Services. RCA’s level of Technology support is on the High end of the range across capabilities.

139Copyright © 2014 Deloitte Development LLC. All rights reserved.
RCA – Key Findings and Opportunity SummaryThe RCA function is mostly a hybrid being performed centrally between the VP of Research and the Colleges; however, changes to technology, processes, and the operating model provide opportunities for further consolidation and efficiency.
Key Findings
Staff performing RCA work are distributed across NMSU in two main areas, the VP for Research and the Colleges. (147 people representing 44.99 FTE)
The two main areas (VP for Research and the Colleges) represent 82% of all the FTEs in the RCA function.
7 of the 9 locations have 4 or fewer FTEs. The VP of Research staff allocate significant time to processes
outside of RCA Outside of RCA activities the VP of Research staff spend
their time on Research, Public Services, and Scholarly and Creative Services (19.02 FTEs), General Admin Support (11.60FTEs), and Information Technology (8.35 FTEs).
NMSU’s RCA function has an inefficient Span of Control (SoC) The average SoC for RCA is 3.75 to 1 compared to leading
class spans ranging from 8:1 to 12:1. Additionally, 63% of the managers in the RCA Function manage 3 people or fewer
There is a higher Span of Control at the top levels of the RCA Organization which leaves senior leaders managing too many employees
There is a lower Span of Control at the bottom levels of the RCA Organization which leaves too few employees to manage
Potential Opportunities based on Current Findings
Redesign NMSU’s RCA operating model to increase efficiency Restructure RCA function so that all staff performing RCA
work across campus report to the VP of Research. Realign RCA organization so that staff are spending the
majority of their time working on processes related to RCA function and not other functions
Build on lessons learned from previous attempt at Shared Services and implement a new pilot of shared services with revamped organizational structure, processes, and policies that will support successful implementation.
Adjust spans to align to leading practices and better support efficiency
$2M+ in potential annual savings identified
Potential Opportunities based on Experience with other Organizations Create a repository of "boiler-plate" information that faculty, researchers, and grant writers can access. Develop a cost/benefit mechanism that can measure quantitative and qualitative costs and benefits of potential awards.

140Copyright © 2014 Deloitte Development LLC. All rights reserved.
0 5 10 15 20 25 30 35 40 45 50 55 60 65 70 75 80
Colleges
Vice Pres Research
Senior VP for Admin andFinance
Academics Administration
Student Affairs & Enroll Mgmt
Agricultural Experiment Station
Cooperative Extension Service
University Communications
Facilities and Services 2
1
77
33
16
7
3
4
4
18.14
18.42
0.35
2.83
0.23
3.80
1.00
0.20
0.02
RCA – Number of Employees and FTEs by Location There are a total of 147 people, widely distributed across campus, who report performing RCA related activities.
Location Analysis*
Key Observations
Measure NamesCount of EmployeesFTE
• The 147 people who report performing Research Development, Compliance, and Administration activities account for 44.99 FTEs. • While there is a substantial differential between the Colleges and Vice President for Research regarding the count of employees who complete
RCA work (33 vs. 77), the number of FTEs is very similar with both having approximately 18 FTEs. • The two main areas (Colleges and VP for Research) represent 82% of all the FTEs in the RCA function. • 7 of the 9 locations have 4 or less FTEs. • Both the colleges and Academics Administration have a high number of people doing RCA work in small quantities, as they both have relatively low
FTEs given the amount of people doing the work. *NOTE: Only those locations that support any of the processes within this function are shown.

141Copyright © 2014 Deloitte Development LLC. All rights reserved.
0 2 4 6 8 10 12 14 16 18 20 22 24
Agricultural,Consumer &Env Sci Col
Engineering College
Health and Social ServicesCollege
Arts and Sciences College
Education College
Business College
16
22
16
13
8
2
7.05
1.55
3.18
2.48
0.39
3.77
RCA – Number of Employees and FTEs by Location (Colleges) There are a total of 77 people, widely distributed across the colleges, who report performing RCA related activities.
Location Analysis*
Key Observations
Measure NamesCount of EmployeesFTE
• The 77 people who report performing Research Development, Compliance, and Administration activities account for 18.42 FTEs. • The 7.05 FTEs located within the Agriculture, Consumer and Environmental Science College represent 38% of all the Colleges’ FTEs completing
RCA work• There are three colleges—Engineering, Arts and Sciences, and Education—that have high employee counts completing some RCA work, but the
FTE count is relatively low. In locations where a high number of employees spend a small fraction of their time performing RCA, there is a risk that these employees lack the specialized experience and training to perform this work efficiently and effectively
*NOTE: Only those locations that support any of the processes within this function are shown.

142Copyright © 2014 Deloitte Development LLC. All rights reserved.
0 1 2 3 4 5 6 7 8 9 10Full Time Equivalents
Support Grant Proposal Preparation, Reviewand Submission
Provide Proposal Development Support
Perform Award Project Management
Manage Research Compliance
Process Awards
Support Financial Regulatory Management
Identify Grant Funding and Manage LimitedSubmissions
Manage Award Negotiation and Acceptance
Manage Licensing, Commercialization, andTechnology Transfer
Manage Conflicts of Interest (COI) Related toSponsored Activities
Conduct Subcontractor Procurement
9.37
8.72
5.93
4.59
4.27
3.49
3.27
2.80
1.43
0.62
0.50
The RCA function is mainly performed by the Colleges or the Office of VP for Research.
RCA – Level of Fragmentation by Process
RCA Processes - Fragmentation
Key Observations• Excluding two processes, Support Financial Regulatory Management and Manage Licensing, Commercialization and Technology Transfer, all of
the RCA processes are predominantly done by the Colleges or the Office of the Vice President for Research. • The two processes with the highest FTE counts are predominantly done by the Colleges. The FTEs located in the College represent 57% of all
FTEs for the two processes. • Manage Licensing, Commercialization, and Technology Transfer is the only RCA process predominantly completed by the Academic
Administration.
The left most number on each scale represents the number of FTE performing the process across NMSU. The number in parentheses represents the number of people that spend at least some time performing the process.
(70)
(72)
(37)
(28)
(26)
(25)
(40)
(22)
(6)
(11)
(7)
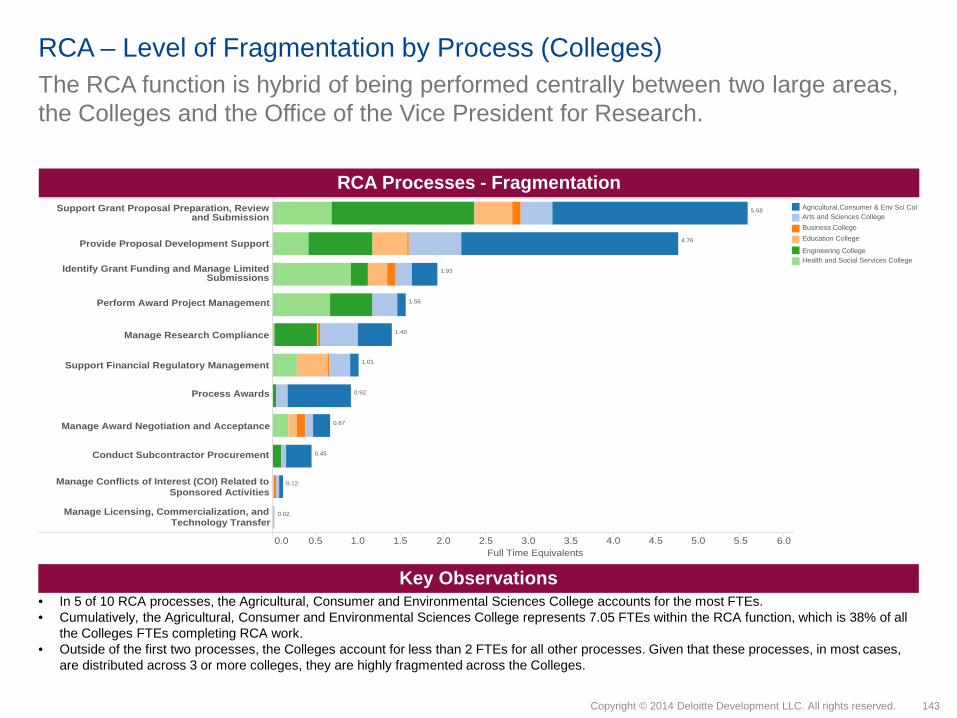
143Copyright © 2014 Deloitte Development LLC. All rights reserved.
The RCA function is hybrid of being performed centrally between two large areas, the Colleges and the Office of the Vice President for Research.
RCA – Level of Fragmentation by Process (Colleges)
RCA Processes - Fragmentation
Key Observations• In 5 of 10 RCA processes, the Agricultural, Consumer and Environmental Sciences College accounts for the most FTEs. • Cumulatively, the Agricultural, Consumer and Environmental Sciences College represents 7.05 FTEs within the RCA function, which is 38% of all
the Colleges FTEs completing RCA work. • Outside of the first two processes, the Colleges account for less than 2 FTEs for all other processes. Given that these processes, in most cases,
are distributed across 3 or more colleges, they are highly fragmented across the Colleges.
0.0 0.5 1.0 1.5 2.0 2.5 3.0 3.5 4.0 4.5 5.0 5.5 6.0Full Time Equivalents
Support Grant Proposal Preparation, Reviewand Submission
Provide Proposal Development Support
Identify Grant Funding and Manage LimitedSubmissions
Perform Award Project Management
Manage Research Compliance
Support Financial Regulatory Management
Process Awards
Manage Award Negotiation and Acceptance
Conduct Subcontractor Procurement
Manage Conflicts of Interest (COI) Related toSponsored Activities
Manage Licensing, Commercialization, andTechnology Transfer
5.58
4.76
1.93
1.56
1.40
1.01
0.92
0.67
0.45
0.12
0.02
Agricultural,Consumer & Env Sci ColArts and Sciences CollegeBusiness CollegeEducation College
Engineering CollegeHealth and Social Services College

144Copyright © 2014 Deloitte Development LLC. All rights reserved.
0M
1M
2M
3M
4M
5M
6M
Sa
$3,256.09K
$3,359.55K
0M
1M
2M
3M
4M
5M
6M
Sa
$4,571.0K
$546.4K
$5,117.46K
RCA – Labor CostNMSU spends ~$5.1M on total salaries for the VP of Research Division. However, based on the activity analysis of the actual portion of time that staff spend on RCA activities across NMSU, the actual labor cost for staff performing RCA work is ~$3.4M.
Labor Cost: Division vs. Function Labor Cost by Funding Type
Key Observations• NMSU spends ~$5.1M on total salaries for the VP of Research Division. However, based on the activity analysis of the actual portion of time that
staff spend on RCA activities across NMSU, the actual labor cost for staff performing RCA work is ~$3.4M. • ~$1.32M of this labor cost differential is accounted for by VP of Research professional staff spending their time on non RCA work. ~$440K of the
labor costs differential is accounted for by support staff spending their time on non RCA work. Outside of RCA processes, the University VP for Research staff spend most of their time on Research, Public Services, and Scholarly and Creative Services (19.02 FTEs), General Admin Support (11.60FTEs), and Information Technology (8.35 FTEs).
• Of the ~$3M spent on staff performing RCA work, approximately ~$303K is from restricted sources
Total Salaries for VP of Research Division
Labor Cost for Staff Performing RCA Work
across NMSU*
* This calculation includes the salary of staff multiplied by the FTE allocation of time spent on RCA
Restricted Unrestricted – I&G Unrestricted – OthProfessional Support
72
$2,112K
42
$944K
33
$303K
Vi P R h
$1,365.90K
$1,395.01K
Labor Cost for Staff Performing RCA Work from VP of Research
Office

145Copyright © 2014 Deloitte Development LLC. All rights reserved.
The two processes with the most FTEs are also the most costly for NMSU.RCA – Fragmentation by Process (Labor Cost)
RCA Processes – Fragmentation (Labor Cost)
Key Observations• Corresponding to the highest FTEs, the top two most costly RCA processes are Support Grant Proposal Preparation, Review and Submission and
Provide Proposal Development Support.• Combined, the top two most costly processes represent 39% of all the labor cost for employees performing RCA work. • The two Divisions that contribute the most cost to RCA functions, which correspond to the FTE counts, are the Office of the VP for
Research($1,395.0K) and the Colleges ($1,357.3K). These two divisions represent 82% of the total labor cost for RCA work being performed across NMSU.
DivisionAcademic Administration
Ag Experiment StationAudit Services
Auxiliary ServicesColleges
Cooperative Extension ServiceFacilities and Services
Honors College/Crimson Sch PgmHuman ResourcesInformation TechnologyPresident OfficeProcurementSenior VP for Admin & FinanceStudent Affairs & Enroll MgmtUniv Advancement VP Office
University CommunicationsVice Pres Research
0 100,000 200,000 300,000 400,000 500,000 600,000 700,000Cost of Labor
Support Grant Proposal Preparation, Reviewand Submission
Provide Proposal Development Support
Manage Research Compliance
Perform Award Project Management
Identify Grant Funding and Manage LimitedSubmissions
Process Awards
Support Financial Regulatory Management
Manage Award Negotiation and Acceptance
Manage Licensing, Commercialization, andTechnology Transfer
Manage Conflicts of Interest (COI) Related toSponsored Activities
Conduct Subcontractor Procurement
$690.0K
$617.1K
$401.3K
$356.1K
$300.3K
$255.3K
$238.1K
$220.4K
$132.7K
$110.9K
$37.2K
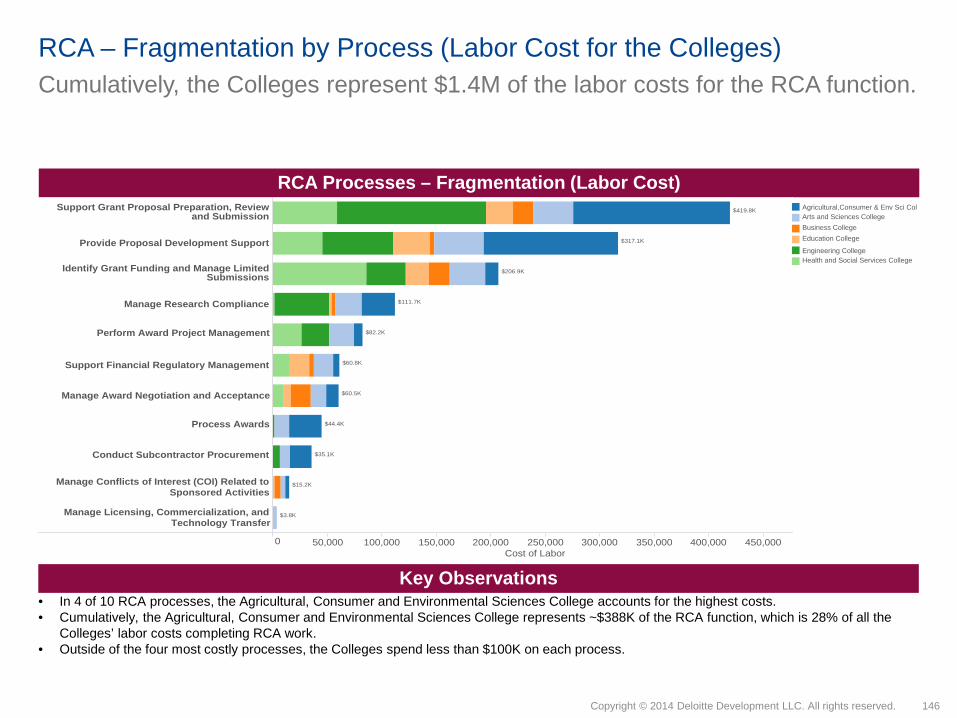
146Copyright © 2014 Deloitte Development LLC. All rights reserved.
Cumulatively, the Colleges represent $1.4M of the labor costs for the RCA function.RCA – Fragmentation by Process (Labor Cost for the Colleges)
RCA Processes – Fragmentation (Labor Cost)
Key Observations• In 4 of 10 RCA processes, the Agricultural, Consumer and Environmental Sciences College accounts for the highest costs. • Cumulatively, the Agricultural, Consumer and Environmental Sciences College represents ~$388K of the RCA function, which is 28% of all the
Colleges’ labor costs completing RCA work. • Outside of the four most costly processes, the Colleges spend less than $100K on each process.
0 50,000 100,000 150,000 200,000 250,000 300,000 350,000 400,000 450,000Cost of Labor
Support Grant Proposal Preparation, Reviewand Submission
Provide Proposal Development Support
Identify Grant Funding and Manage LimitedSubmissions
Manage Research Compliance
Perform Award Project Management
Support Financial Regulatory Management
Manage Award Negotiation and Acceptance
Process Awards
Conduct Subcontractor Procurement
Manage Conflicts of Interest (COI) Related toSponsored Activities
Manage Licensing, Commercialization, andTechnology Transfer
$419.8K
$317.1K
$206.9K
$111.7K
$82.2K
$60.8K
$60.5K
$44.4K
$35.1K
$15.2K
$3.8K
Agricultural,Consumer & Env Sci ColArts and Sciences CollegeBusiness CollegeEducation College
Engineering CollegeHealth and Social Services College

147Copyright © 2014 Deloitte Development LLC. All rights reserved.
Manage Conflicts of Interest (COI) Related toSponsored Activities
Manage Licensing, Commercialization, andTechnology Transfer
Identify Grant Funding and Manage LimitedSubmissions
Support Financial Regulatory Management
Provide Proposal Development Support
Support Grant Proposal Preparation, Reviewand Submission
Manage Award Negotiation and Acceptance
Manage Research Compliance
Process Awards
Perform Award Project Management
Conduct Subcontractor Procurement
$165.4K
$107.2K $142.5K
$126.7K
$188.5K
$128.0K
$128.0K
$128.0K
$199.6K
$277.7K
$58.4K
$58.4K
$32.3K
$32.3K $89.9K
$60.2K
$66.6K
$75.2K
$90.3K
$79.8K
$48.2K
$52.7K
$78.0K
$25.1K
$51.1K
$51.1K
$51.1K
$43.8K
$89.8K
$91.8K
$49.9K
$49.9K
$55.9K
$90.1K
$69.6K
$62.9K
$94.9K
$77.4K $47.0K
$45.3K$56.5K
$59.4K
$79.4K
$70.2K
$75.2K
$91.7K
$70.3K
$66.6K
$42.7K
The two processes with the highest average labor cost per FTE also account for the two smallest FTE totals.
RCA – Divisional average labor cost per process
RCA Processes – Average Labor Cost by Division per FTE*
Key Observations• The average labor costs by per FTE for the two processes Manage Conflicts of Interest Related to Sponsored Activities and Manage Licensing,
Commercialization, and Technology Transfer are significantly higher than all of the other processes. These processes also account for 2 of the 3 lowest FTE counts. Manage Conflicts of Interest represents .62 FTEs and Manage Licensing represents 1.43 FTEs. This generally indicates that highly paid individuals are completing this work.
• When represented, the average labor cost per FTE for the Cooperative Extension Service Division is the lowest.
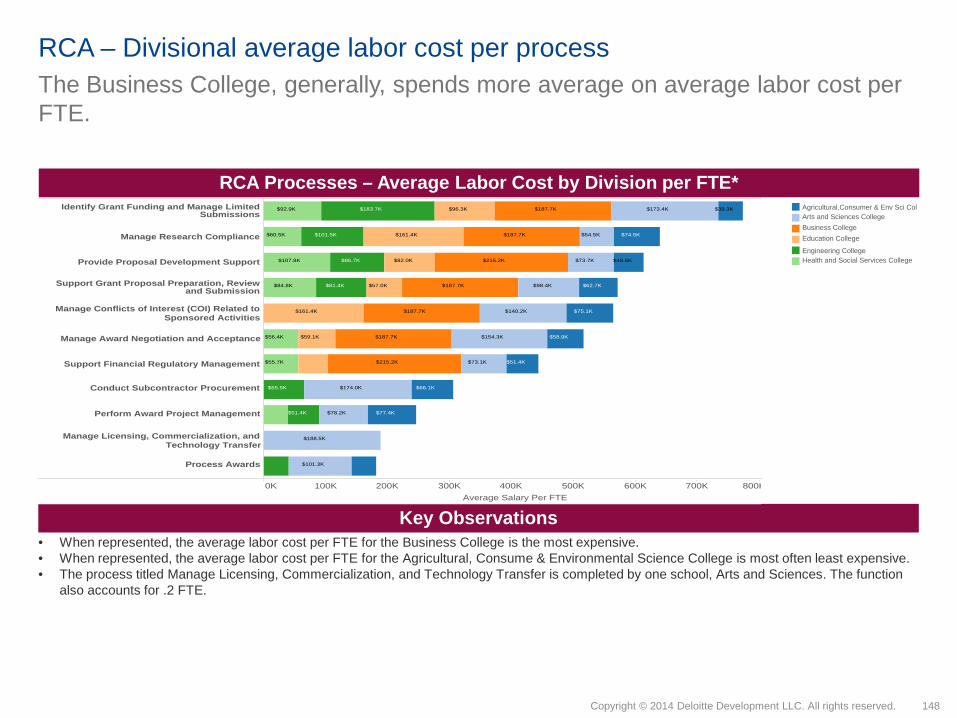
148Copyright © 2014 Deloitte Development LLC. All rights reserved.
The Business College, generally, spends more average on average labor cost per FTE.
RCA – Divisional average labor cost per process
RCA Processes – Average Labor Cost by Division per FTE*
Key Observations• When represented, the average labor cost per FTE for the Business College is the most expensive.• When represented, the average labor cost per FTE for the Agricultural, Consume & Environmental Science College is most often least expensive. • The process titled Manage Licensing, Commercialization, and Technology Transfer is completed by one school, Arts and Sciences. The function
also accounts for .2 FTE.
0K 100K 200K 300K 400K 500K 600K 700K 800KAverage Salary Per FTE
Identify Grant Funding and Manage LimitedSubmissions
Manage Research Compliance
Provide Proposal Development Support
Support Grant Proposal Preparation, Reviewand Submission
Manage Conflicts of Interest (COI) Related toSponsored Activities
Manage Award Negotiation and Acceptance
Support Financial Regulatory Management
Conduct Subcontractor Procurement
Perform Award Project Management
Manage Licensing, Commercialization, andTechnology Transfer
Process Awards
$173.4K
$188.5K
$101.3K
$187.7K
$140.2K
$154.3K
$187.7K
$174.0K
$215.2K
$187.7K
$187.7K
$187.7K
$215.2K
$161.4K
$161.4K
$183.7K
$101.5K
$107.8K
$54.5K
$73.7K
$98.4K
$73.1K
$78.2K
$39.3K
$74.5K
$48.6K
$62.7K
$96.3K
$75.1K
$82.0K
$57.0K
$58.9K$59.1K
$51.4K
$66.1K
$86.7K
$81.4K
$65.5K
$51.4K
$92.9K
$60.5K
$77.4K
$84.8K
$56.4K
$55.7K
Agricultural,Consumer & Env Sci ColArts and Sciences CollegeBusiness CollegeEducation College
Engineering CollegeHealth and Social Services College

149Copyright © 2014 Deloitte Development LLC. All rights reserved.
12.0
3.4
2.8
12.0
3.4
2.8
Management Layer
Span of ControlAvg. SoC=3.75
Number of Managers
1 0
2 1
3 11
4 4
5 0
6 0
NMSU’s Vice President of Research Division has opportunities to improve SoC as indicated by an average staff to manager ratio of 3.75:1, which is below the leading class benchmark range of 8:1 to 12:1
RCA - Span of Control and Management Layers
Key Observations• While the management layers for RCA is good with 3 layers, the SoC of control for the Division is 3.75:1, which is below the leading class
benchmark range of 8:1 to 12:1• The VP of Research Division SoC is an inverted pyramid instead of leading class pyramid which has increasing SoC at lower levels of the
organization• The VP of Research’s vertical structure, with higher SoC at the top level could indicate inefficiencies related to roles and responsibilities. • The top level of management may have too many direct reports with 12. • 63% of the managers within the VP of Research office manage 3 people or less. 4 managers only manage 1 person.
Span of Control by Layer
NONE
NONE
*Span of Control by Layer: Management layers represent the reporting distance from layer 0; the Chancellor is the only individual at layer 0. Those that report directly to the Chancellor are in management layer 1, etc. “None” is shown in a Function when there is no manager in a particular layer.
12.0
3.4
2.8

150Copyright © 2014 Deloitte Development LLC. All rights reserved.
Currently, RCA functions are being performed largely by the VP of Research’s Office or within the Colleges. Creating a revamped version of Shared Services and Centralizing these processes may provide an opportunity to improve efficiency.
RCA – Process C
entra
lized
1. Manage Licensing, Commercialization, and Technology Transfer
Hyb
rid
1. Identify Grant Funding and Manage Limited Submissions
2. Provide Proposal Development Support3. Support Grant Proposal Preparation,
Review and Submission4. Manage Award Negotiation and Acceptance5. Support Financial Regulatory Management6. Process Awards7. Perform Award Project Management8. Manage Conflicts of Interest (COI) Related
to Sponsored Activities9. Manage Research Compliance 10. Conduct Subcontractor Procurement
Dec
entra
lized R
elat
ions
hip
to th
e U
nive
rsity
Method of Adding Value
Low cost / Defined service levels Knowledge transfer / Management involvement
Center of Excellence/CentralizedShared Services
Business PartnerOnsite Support
•Manage Licensing, Commercialization, and Technology Transfer•Manage Conflicts of Interest (COI) Related to Sponsored Activities
Gen
eric
/Uni
vers
ity W
ide
Spec
ific/
Dep
artm
ent
As-Is RCA Operating Model by Process Future-State RCA Operating Model by Process
•Identify Grant Funding and Manage Limited Submissions•Provide Proposal Development Support•Support Grant Proposal Preparation, Review and Submission•Manage Award Negotiation and Acceptance•Support Financial Regulatory Management•Process Awards•Perform Award Project Management•Manage Research Compliance •Conduct Subcontractor Procurement

151Copyright © 2014 Deloitte Development LLC. All rights reserved.
RCA – Key OpportunitiesBased on key findings and observations with NMSU during the Staffing Study, we would recommend the following opportunities for consideration:
# Opportunity Name
Opportunity Category Impact Timeline(Short Term <= 6 mos,
Medium >6 mos <=12 mosLong > 12 mos
Potential Impact
RCA01
Establish Shared Grant and Contract Admin Support Across All Departments
Refine shared centers with grant and contract coordinators to provide support to schools and department and liaise with other NMSU key stakeholders. People Short H
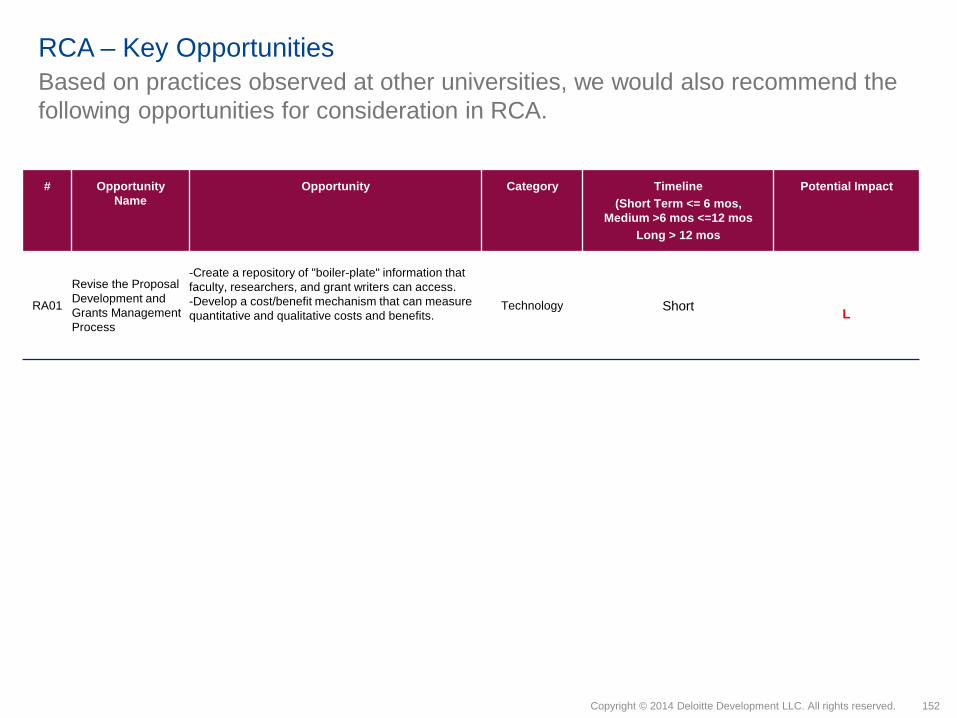
152Copyright © 2014 Deloitte Development LLC. All rights reserved.
RCA – Key Opportunities
# Opportunity Name
Opportunity Category Timeline(Short Term <= 6 mos,
Medium >6 mos <=12 mosLong > 12 mos
Potential Impact
RA01
Revise the Proposal Development and Grants Management Process
-Create a repository of "boiler-plate" information that faculty, researchers, and grant writers can access.-Develop a cost/benefit mechanism that can measure quantitative and qualitative costs and benefits.
Technology Short L
Based on practices observed at other universities, we would also recommend the following opportunities for consideration in RCA.

Educational Programs (EP)
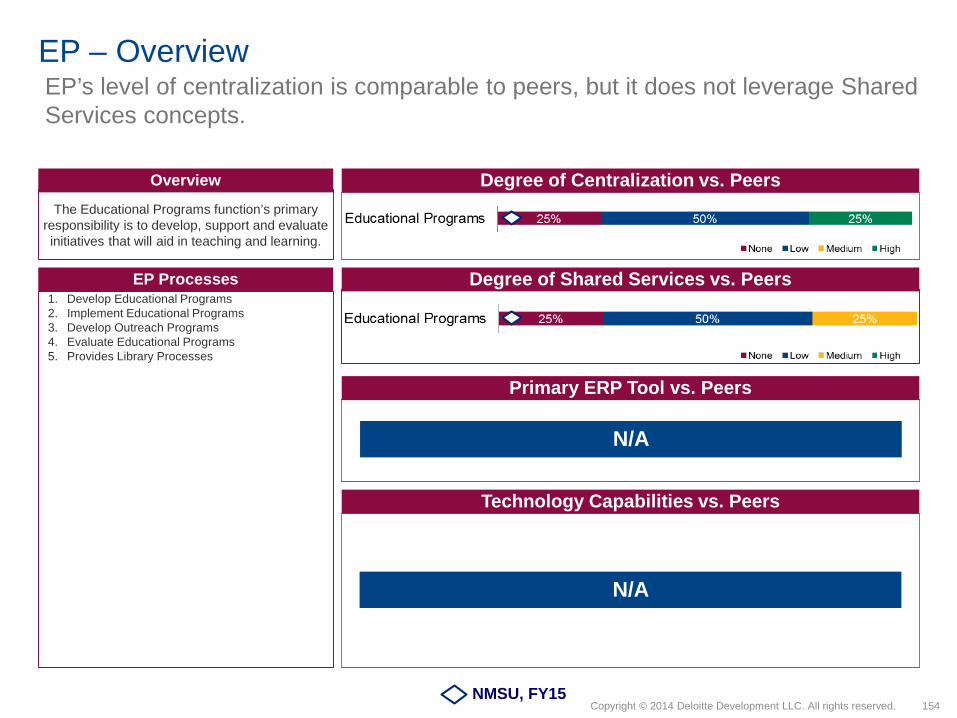
154Copyright © 2014 Deloitte Development LLC. All rights reserved.
EP – Overview
EP Processes1. Develop Educational Programs2. Implement Educational Programs3. Develop Outreach Programs4. Evaluate Educational Programs5. Provides Library Processes
Overview
The Educational Programs function’s primary responsibility is to develop, support and evaluate initiatives that will aid in teaching and learning.
Degree of Centralization vs. Peers
Degree of Shared Services vs. Peers
Primary ERP Tool vs. Peers
Technology Capabilities vs. Peers
N/A
N/A
NMSU, FY15
EP’s level of centralization is comparable to peers, but it does not leverage Shared Services concepts.
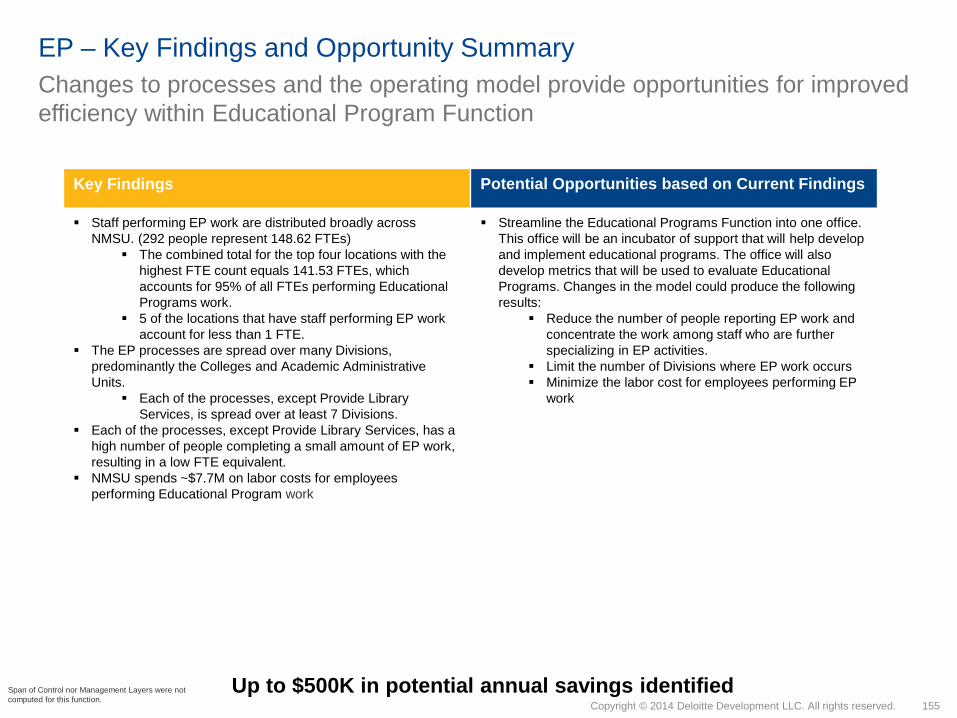
155Copyright © 2014 Deloitte Development LLC. All rights reserved.
EP – Key Findings and Opportunity Summary
Key Findings
Staff performing EP work are distributed broadly across NMSU. (292 people represent 148.62 FTEs)
The combined total for the top four locations with the highest FTE count equals 141.53 FTEs, which accounts for 95% of all FTEs performing Educational Programs work.
5 of the locations that have staff performing EP work account for less than 1 FTE.
The EP processes are spread over many Divisions, predominantly the Colleges and Academic Administrative Units.
Each of the processes, except Provide Library Services, is spread over at least 7 Divisions.
Each of the processes, except Provide Library Services, has a high number of people completing a small amount of EP work, resulting in a low FTE equivalent.
NMSU spends ~$7.7M on labor costs for employees performing Educational Program work
Potential Opportunities based on Current Findings
Streamline the Educational Programs Function into one office. This office will be an incubator of support that will help develop and implement educational programs. The office will also develop metrics that will be used to evaluate Educational Programs. Changes in the model could produce the following results:
Reduce the number of people reporting EP work and concentrate the work among staff who are further specializing in EP activities.
Limit the number of Divisions where EP work occurs Minimize the labor cost for employees performing EP
work
Up to $500K in potential annual savings identified
Changes to processes and the operating model provide opportunities for improved efficiency within Educational Program Function
Span of Control nor Management Layers were not computed for this function.
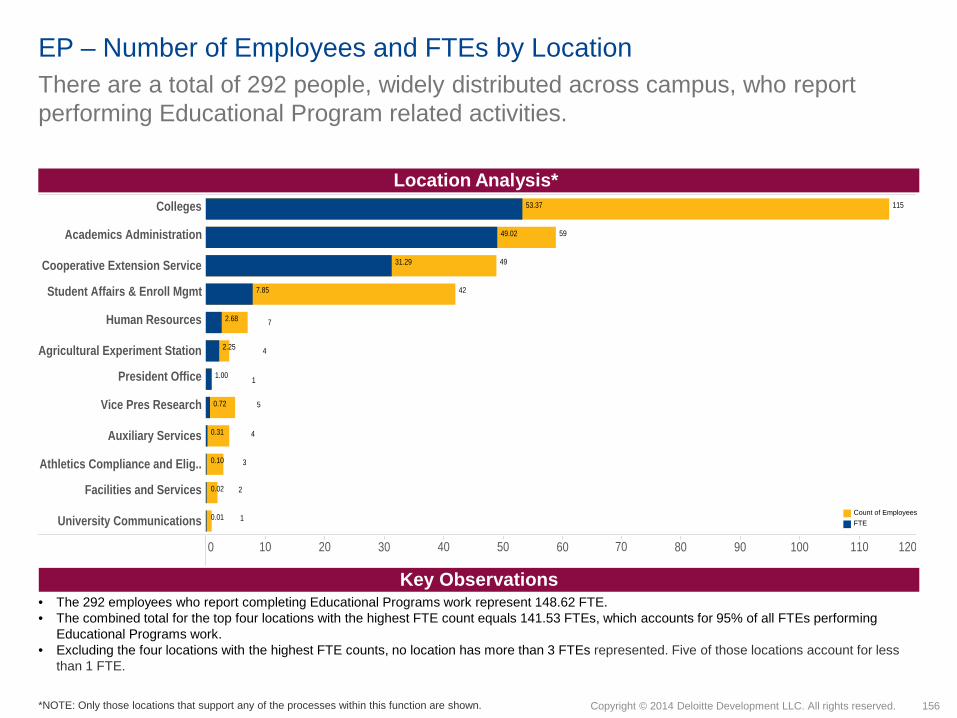
156Copyright © 2014 Deloitte Development LLC. All rights reserved.
EP – Number of Employees and FTEs by Location There are a total of 292 people, widely distributed across campus, who report performing Educational Program related activities.
Location Analysis*
0 10 20 30 40 50 60 70 80 90 100 110 120
Colleges
Academics Administration
Cooperative Extension Service
Student Affairs & Enroll Mgmt
Human Resources
Agricultural Experiment Station
President Office
Vice Pres Research
Auxiliary Services
Athletics Compliance and Elig..
Facilities and Services
University Communications 1
2
3
4
5
1
4
7
115
59
49
42
31.29
53.37
49.02
7.85
2.25
2.68
1.00
0.10
0.72
0.02
0.31
0.01
Key Observations
Measure NamesCount of EmployeesFTE
• The 292 employees who report completing Educational Programs work represent 148.62 FTE. • The combined total for the top four locations with the highest FTE count equals 141.53 FTEs, which accounts for 95% of all FTEs performing
Educational Programs work. • Excluding the four locations with the highest FTE counts, no location has more than 3 FTEs represented. Five of those locations account for less
than 1 FTE.
*NOTE: Only those locations that support any of the processes within this function are shown.
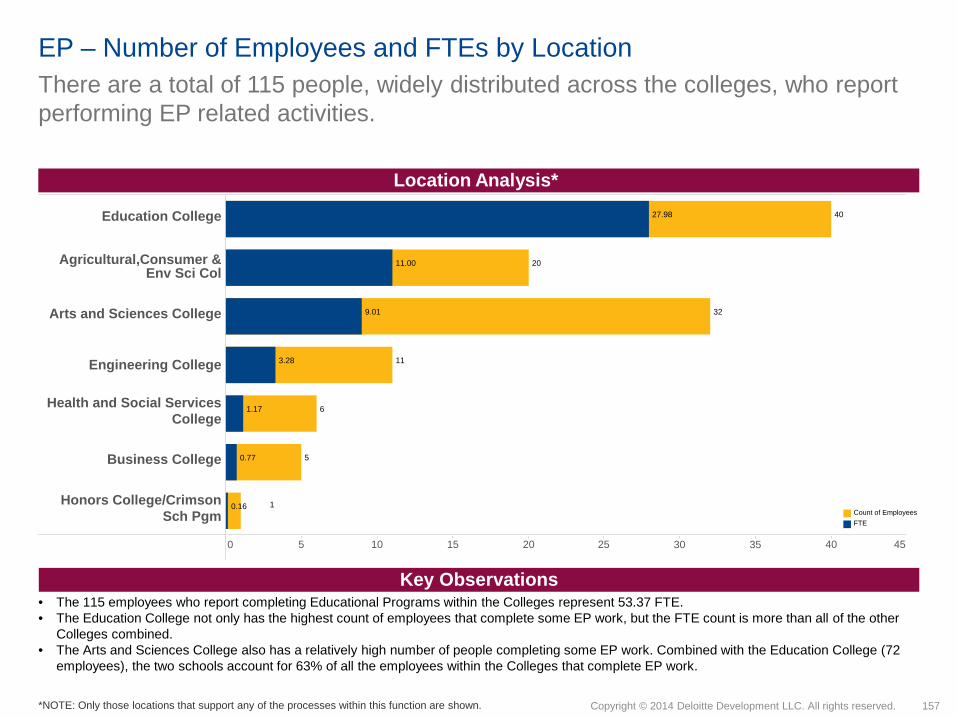
157Copyright © 2014 Deloitte Development LLC. All rights reserved.
EP – Number of Employees and FTEs by Location There are a total of 115 people, widely distributed across the colleges, who report performing EP related activities.
Location Analysis*
Key Observations• The 115 employees who report completing Educational Programs within the Colleges represent 53.37 FTE. • The Education College not only has the highest count of employees that complete some EP work, but the FTE count is more than all of the other
Colleges combined.• The Arts and Sciences College also has a relatively high number of people completing some EP work. Combined with the Education College (72
employees), the two schools account for 63% of all the employees within the Colleges that complete EP work.
0 5 10 15 20 25 30 35 40 45
Education College
Agricultural,Consumer &Env Sci Col
Arts and Sciences College
Engineering College
Health and Social ServicesCollege
Business College
Honors College/CrimsonSch Pgm
1
40
20
32
11
6
5
27.98
11.00
3.28
1.17
0.77
0.16
9.01
Measure NamesCount of EmployeesFTE
*NOTE: Only those locations that support any of the processes within this function are shown.
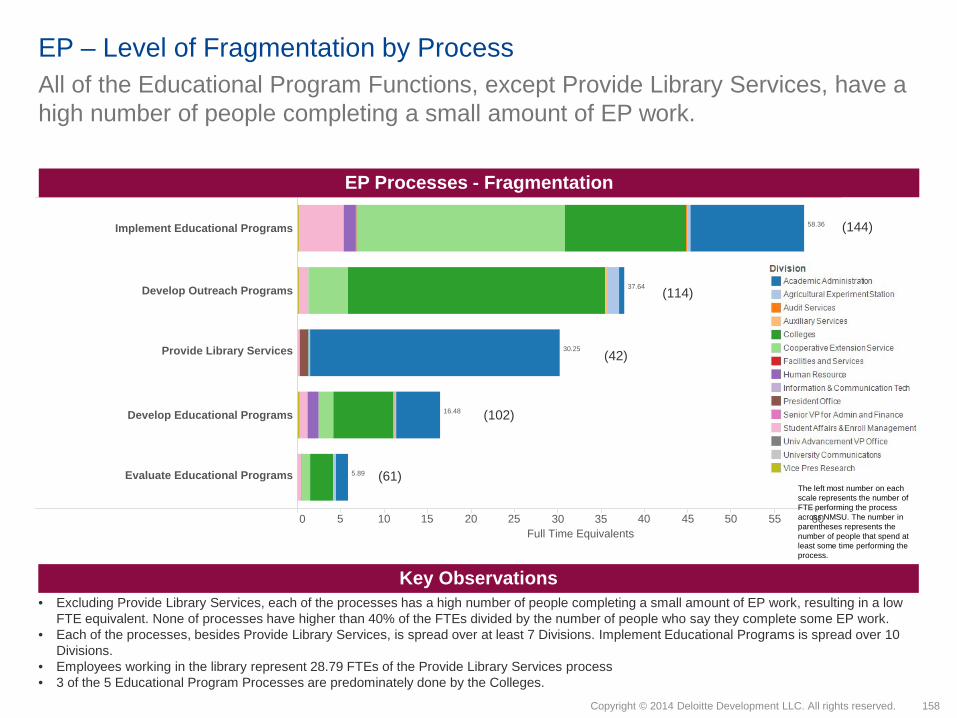
158Copyright © 2014 Deloitte Development LLC. All rights reserved.
0 5 10 15 20 25 30 35 40 45 50 55 60Full Time Equivalents
Implement Educational Programs
Develop Outreach Programs
Provide Library Services
Develop Educational Programs
Evaluate Educational Programs
58.36
37.64
30.25
16.48
5.89
All of the Educational Program Functions, except Provide Library Services, have a high number of people completing a small amount of EP work.
EP – Level of Fragmentation by Process
EP Processes - Fragmentation
Key Observations• Excluding Provide Library Services, each of the processes has a high number of people completing a small amount of EP work, resulting in a low
FTE equivalent. None of processes have higher than 40% of the FTEs divided by the number of people who say they complete some EP work.• Each of the processes, besides Provide Library Services, is spread over at least 7 Divisions. Implement Educational Programs is spread over 10
Divisions. • Employees working in the library represent 28.79 FTEs of the Provide Library Services process• 3 of the 5 Educational Program Processes are predominately done by the Colleges.
The left most number on each scale represents the number of FTE performing the process across NMSU. The number in parentheses represents the number of people that spend at least some time performing the process.
(144)
(114)
(42)
(102)
(61)

159Copyright © 2014 Deloitte Development LLC. All rights reserved.
The majority of time spent for the Educational Programs function in the Colleges is on Developing Outreach Programs.
EP – Level of Fragmentation by Process
EP Processes - Fragmentation
Key Observations• Although Implement Educational Programs accounts for the most FTEs (53.36) across the University, Develop Outreach Programs accounts for
the most FTEs (29.69) across the Colleges. • In the two processes with the most FTEs (Develop Outreach Programs and Implement Educational Programs), the Education College accounts for
the college with the most FTEs. In those two processes, the combined total for the Education College is 25.37 FTE, which accounts for 48% of all FTEs in the Colleges performing Educational Programs work.
0 5 10 15 20 25 30Full Time Equivalents
Develop Outreach Programs
Implement Educational Programs
Develop Educational Programs
Evaluate Educational Programs
Provide Library Services
29.69
13.96
6.98
2.68
0.06
Agricultural,Consumer & Env Sci ColArts and Sciences CollegeBusiness CollegeEducation College
Engineering CollegeHealth and Social Services College
Honors College/Crimson Sch Pgm

160Copyright © 2014 Deloitte Development LLC. All rights reserved.
NMSU spends ~$7.7M on labor costs for employees performing Educational Program work.
EP – Fragmentation by Process (Labor Cost)
EP Processes – Fragmentation (Labor Cost)
Key Observations• Of the ~$7.7M spent on Educational Program labor costs, 62% of the costs are for the Implement Educational Programs and Develop Outreach
Programs processes• While Implement Educational Programs has more than 20 FTEs compared to Develop Outreach Programs, the labor cost for Implement
Educational Programs is only $379K more than the labor costs for Develop Outreach Programs. This is primarily due to those employees in Develop Outreach Programs generally earning slightly higher wages.
• The labor costs for Evaluate Educational Programs is only 5% of the labor costs for the EP function. • $2.6M of the ~$7.7M labor cost for EP work is funded thru restricted resources.
0 500,000 1,000,000 1,500,000 2,000,000 2,500,000 3,000,000Cost of Labor
Implement Educational Programs
Develop Outreach Programs
Provide Library Services
Develop Educational Programs
Evaluate Educational Programs
$2,573.0K
$2,194.3K
$1,429.8K
$1,106.5K
$362.8K

161Copyright © 2014 Deloitte Development LLC. All rights reserved.
0 200,000 400,000 600,000 800,000 1,000,000 1,200,000 1,400,000 1,600,000 1,800,000 2,000,000Cost of Labor
Develop Outreach Programs
Implement Educational Programs
Develop Educational Programs
Evaluate Educational Programs
Provide Library Services
$1,865.2K
$706.4K
$534.8K
$197.4K
$2.8K
The Colleges spends ~$3.3M on labor costs for employees performing Educational Program work.
EP – Fragmentation by Process (Labor Cost)
EP Processes – Fragmentation (Labor Cost)
Key Observations• Of the ~$7.7M spent on Educational Program labor costs, $3.3M (43%) of the costs is spent within the Colleges. • The Education College accounts for the majority of the labor costs within the Colleges spent on EP. The Education College spends ~$1.7M on EP
work, which accounts for 52% of all the labor cost spent on EP work within the Colleges. • While Evaluate Educational Programs is the least costly EP process across the University, Provide Library Services is the least costly EP function
within the college. Provide Library Services accounts for less than 1% of the total spent on labor costs within the Colleges.
Agricultural,Consumer & Env Sci ColArts and Sciences CollegeBusiness CollegeEducation College
Engineering CollegeHealth and Social Services College
Honors College/Crimson Sch Pgm
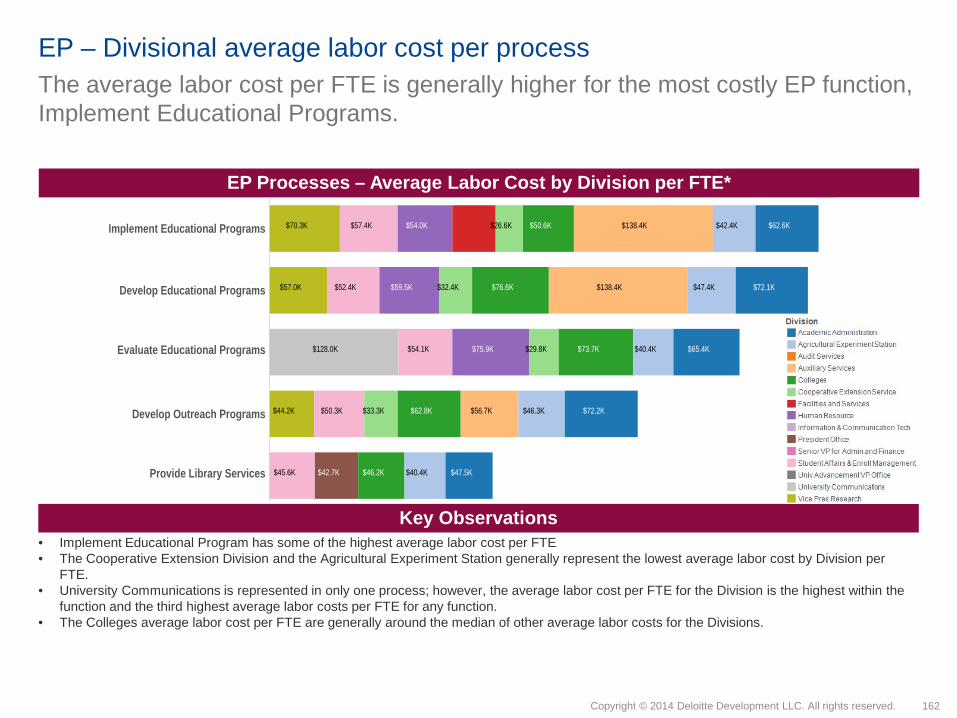
162Copyright © 2014 Deloitte Development LLC. All rights reserved.
Implement Educational Programs
Develop Educational Programs
Evaluate Educational Programs
Develop Outreach Programs
Provide Library Services
$138.4K
$138.4K
$128.0K
$72.1K
$65.4K
$72.2K
$47.5K
$42.4K
$47.4K
$40.4K
$46.3K
$40.4K
$56.7K
$50.6K
$76.6K
$73.7K
$62.8K
$46.2K
$26.6K
$32.4K
$29.8K
$33.3K
$54.0K
$59.5K
$75.9K
$42.7K
$57.4K
$52.4K
$54.1K
$50.3K
$45.6K
$62.6K$70.3K
$57.0K
$44.2K
The average labor cost per FTE is generally higher for the most costly EP function, Implement Educational Programs.
EP – Divisional average labor cost per process
EP Processes – Average Labor Cost by Division per FTE*
Key Observations• Implement Educational Program has some of the highest average labor cost per FTE• The Cooperative Extension Division and the Agricultural Experiment Station generally represent the lowest average labor cost by Division per
FTE. • University Communications is represented in only one process; however, the average labor cost per FTE for the Division is the highest within the
function and the third highest average labor costs per FTE for any function. • The Colleges average labor cost per FTE are generally around the median of other average labor costs for the Divisions.

163Copyright © 2014 Deloitte Development LLC. All rights reserved.
Evaluate Educational Programs
Develop Educational Programs
Implement Educational Programs
Develop Outreach Programs
Provide Library Services
$215.2K
$142.5K
$201.8K
$201.8K
$201.8K
$66.4K
$64.9K
$47.3K
$62.9K
$78.0K
$73.3K
$62.6K
$72.3K
$84.1K
$57.5K
$83.4K
$70.7K
$33.6K
$69.1K
$40.9K
$76.2K
$97.7K
$81.8K
$76.5K
$46.1K
$64.7K
$45.0K
$45.4K
The Colleges with the lowest FTE representation in the process generally have the highest average labor cost per FTE.
EP – Colleges average labor cost per process
EP Processes – Average Labor Cost by Division per FTE
Key Observations
Agricultural,Consumer & Env Sci ColArts and Sciences CollegeBusiness CollegeEducation College
Engineering CollegeHealth and Social Services College
Honors College/Crimson Sch Pgm
• The Honors College and Business College, when represented, account for the smallest number of FTEs; however, they represent the highest average labor costs per FTE. This indicates that the individuals completing this work for the two colleges have high salaries.
• For all but one function, when represented, the Health and Social Service College has the lowest average labor cost per FTE. • Although Evaluate Educational Programs accounts for the smallest number of total FTEs completing EP work, this process is one of the most
costly within the Colleges on average labor cost per FTE basis.
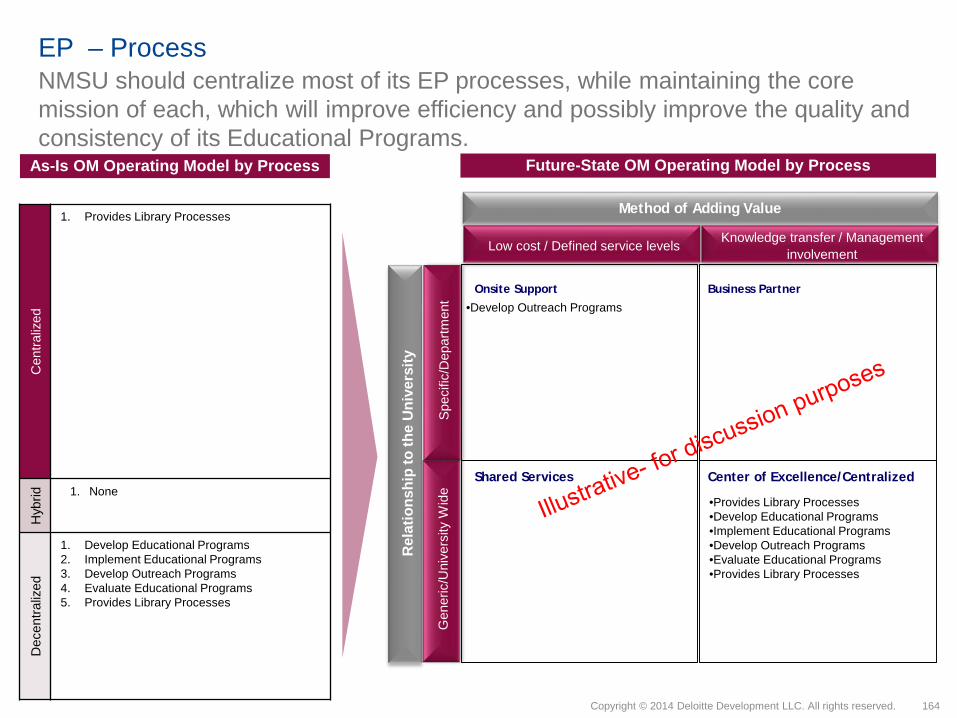
164Copyright © 2014 Deloitte Development LLC. All rights reserved.
NMSU should centralize most of its EP processes, while maintaining the core mission of each, which will improve efficiency and possibly improve the quality and consistency of its Educational Programs.
EP – Process C
entra
lized
1. Provides Library Processes
Hyb
rid 1. None
Dec
entra
lized
1. Develop Educational Programs2. Implement Educational Programs3. Develop Outreach Programs4. Evaluate Educational Programs5. Provides Library Processes
Rel
atio
nshi
p to
the
Uni
vers
ity
Method of Adding Value
Low cost / Defined service levels Knowledge transfer / Management involvement
Center of Excellence/CentralizedShared Services
Business PartnerOnsite Support
•Provides Library Processes•Develop Educational Programs•Implement Educational Programs•Develop Outreach Programs•Evaluate Educational Programs•Provides Library Processes
Gen
eric
/Uni
vers
ity W
ide
Spec
ific/
Dep
artm
ent
As-Is OM Operating Model by Process Future-State OM Operating Model by Process
•Develop Outreach Programs

165Copyright © 2014 Deloitte Development LLC. All rights reserved.
EP – Key OpportunitiesBased on key findings and observations with NMSU during the Staffing Study, we would recommend the following opportunities for consideration:
# Opportunity Name
Opportunity Category Impact Timeline(Short Term <= 6 mos,
Medium >6 mos <=12 mosLong > 12 mos
Potential Impact
EP01Centralize All Educational Program Process
Streamline most of the Educational Programs processes into one office. This office will be an incubator of support that will help develop and implement educational programs. The office will also develop metrics that will be used to evaluate Educational Programs.
Organization Long L

Auxiliaries (AUX)

167Copyright © 2014 Deloitte Development LLC. All rights reserved.
AUX – Overview
Auxiliary Services Processes*1. Oversee University Parking, Transportation
and Mail Services2. Oversee University Housing and related
Contract Management3. Oversee University Food Services and ID
Card Services and related Contract Management
4. Oversee University Residential Life and related Contract Management
5. Oversee University Conference Services6. Oversee University Student Union7. Oversee University Special Events8. Oversee Bookstore Management and
related Contract Management9. Oversee Golf Course Management
Overview
The Auxiliary function is primarily responsible for providing services that enhance and support the
operations of campus life.
Degree of Centralization vs. Peers
Degree of Shared Services vs. Peers
Primary ERP Tool vs. Peers
Technology Capabilities vs. Peers
50%
25%
50%
25%
25%
50%
75%
50%
75%
75%
Level of reporting capability within ID Card Servicessystem
Level of reporting capability within Parking ManagementSystem
Level of reporting capability within Housing ManagementSystem
Self-service Portal capability in function
Degree to which supporting processes are accomplishedvia automated workflow
75%50%
100%
25%50%
ID Card Services System
Parking Management System
Housing Management System
Standard ERP Customized ERP In-house system
NMSU, FY15
AUX’s high level of centralization is comparable to peers, but it does not leverage Shared Services concepts and has mid-range capability to support reporting, self service, and workflow.
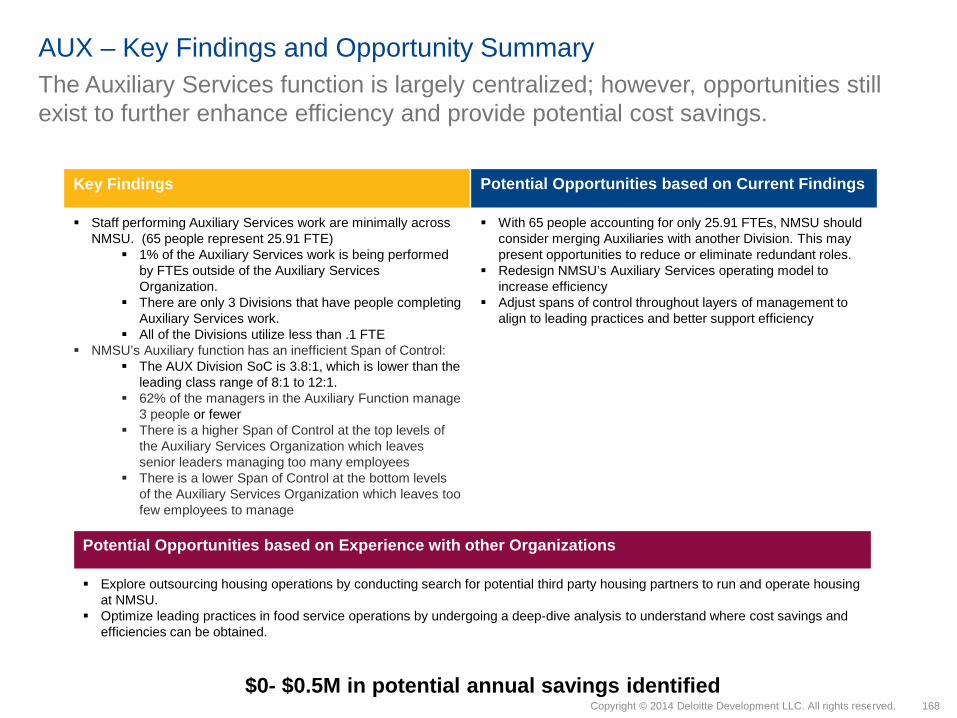
168Copyright © 2014 Deloitte Development LLC. All rights reserved.
Potential Opportunities based on Experience with other Organizations
Explore outsourcing housing operations by conducting search for potential third party housing partners to run and operate housing at NMSU.
Optimize leading practices in food service operations by undergoing a deep-dive analysis to understand where cost savings and efficiencies can be obtained.
AUX – Key Findings and Opportunity Summary
Key Findings
Staff performing Auxiliary Services work are minimally across NMSU. (65 people represent 25.91 FTE)
1% of the Auxiliary Services work is being performed by FTEs outside of the Auxiliary Services Organization.
There are only 3 Divisions that have people completing Auxiliary Services work.
All of the Divisions utilize less than .1 FTE NMSU’s Auxiliary function has an inefficient Span of Control:
The AUX Division SoC is 3.8:1, which is lower than the leading class range of 8:1 to 12:1.
62% of the managers in the Auxiliary Function manage 3 people or fewer
There is a higher Span of Control at the top levels of the Auxiliary Services Organization which leaves senior leaders managing too many employees
There is a lower Span of Control at the bottom levels of the Auxiliary Services Organization which leaves too few employees to manage
Potential Opportunities based on Current Findings
With 65 people accounting for only 25.91 FTEs, NMSU should consider merging Auxiliaries with another Division. This may present opportunities to reduce or eliminate redundant roles.
Redesign NMSU’s Auxiliary Services operating model to increase efficiency
Adjust spans of control throughout layers of management to align to leading practices and better support efficiency
$0- $0.5M in potential annual savings identified
The Auxiliary Services function is largely centralized; however, opportunities still exist to further enhance efficiency and provide potential cost savings.

169Copyright © 2014 Deloitte Development LLC. All rights reserved.
AUX – Number of Employees and FTEs by Location
0 5 10 15 20 25 30 35 40 45 50 55 60 65
AuxiliaryServices
Facilities andServices
UniversityCommunications
Colleges 1
2
2
6025.76
0.03
0.10
0.02
There are a total of 65 people, minimally distributed across campus over 4 Divisions, who report performing Auxiliary Services related activities.
Location Analysis*
Key Observations
Measure NamesCount of EmployeesFTE
• The 65 people who reported completing Auxiliary Services processes represent 25.91 FTE. • There are only 4 Divisions where Auxiliary Services work is being performed. ~99% of the FTEs completing Auxiliary Services Work are in the
Auxiliary Services Division. • In the 3 locations outside of the Auxiliary Services Division, cumulatively, there are 5 people who report completing Auxiliary Services work that
account for .15 FTEs.
*NOTE: Only those locations that support any of the processes within this function are shown.

170Copyright © 2014 Deloitte Development LLC. All rights reserved.
0 1 2 3 4 5 6 7 8 9 10 11 12Full Time Equivalents
Oversee Golf Course Management
Oversee University Food Services and ID CardServices and related Contract Management
Oversee University Special Events
Oversee University Conference Services
Oversee University Parking, Transportation andMail Services
Oversee University Housing and relatedContract Management
Oversee University Residential Life and relatedContract Management
Oversee Bookstore Management and relatedContract Management
Oversee University Student Union
10.80
4.25
4.11
2.59
1.72
1.22
1.10
0.10
0.02
There are only two Auxiliary Service Function processes that include employees performing AUX work outside of the central AUX Division.
AUX – Level of Fragmentation by Process
Auxiliary Services Processes - Fragmentation
Key Observations• Only two Auxiliary Service processes—(1)Oversee University Special Events and (2) Oversee University Housing and related Contract
Management—include any amount of FTEs outside of the Auxiliary Services Division. • Oversee University Special Events - .13 FTE outside of Auxiliary Services • Oversee University Housing and related Contract Management - .02 FTE outside of Auxiliary Services. (Amount is so small that it does not
appear on graphic above)• There are a high number of people (22) who report completing Overseeing University Special Events, but cumulatively they spend a small part of
their time completing Auxiliary work as indicated by the law number of FTE equivalents.
The left most number on each scale represents the number of FTE performing the process across NMSU. The number in parentheses represents the number of people that spend at least some time performing the process.
DivisionAcademic Administration
Ag Experiment StationAudit Services
Auxiliary ServicesColleges
Cooperative Extension ServiceFacilities and Services
Honors College/Crimson Sch PgmHuman ResourcesInformation TechnologyPresident OfficeProcurementSenior VP for Admin & FinanceStudent Affairs & Enroll MgmtUniv Advancement VP Office
University CommunicationsVice Pres Research
(14)
(22)
(7)
(6)
(6)
(12)
(2)
(7)
(1)
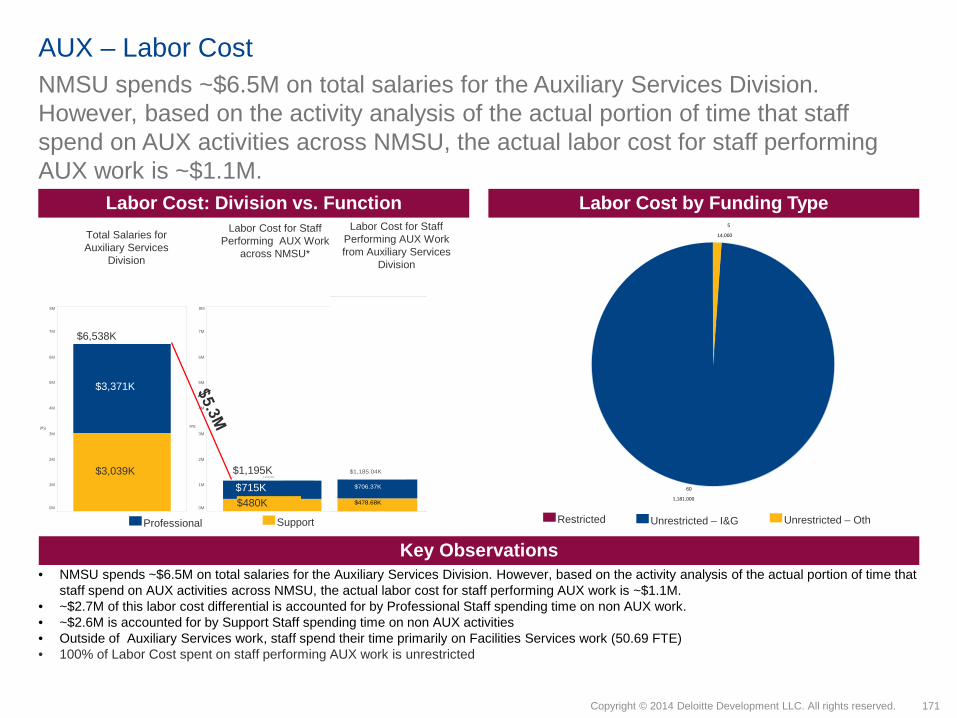
171Copyright © 2014 Deloitte Development LLC. All rights reserved.
0M
1M
2M
3M
4M
5M
6M
7M
8M
Sal
3,371,000
3,039,000
6,538,000
0M
1M
2M
3M
4M
5M
6M
7M
8M
Sal
715,000
480,000
1,195,000
60
1,181,000
5
14,000
AUX – Labor CostNMSU spends ~$6.5M on total salaries for the Auxiliary Services Division. However, based on the activity analysis of the actual portion of time that staff spend on AUX activities across NMSU, the actual labor cost for staff performing AUX work is ~$1.1M.
Labor Cost: Division vs. Function Labor Cost by Funding Type
Key Observations• NMSU spends ~$6.5M on total salaries for the Auxiliary Services Division. However, based on the activity analysis of the actual portion of time that
staff spend on AUX activities across NMSU, the actual labor cost for staff performing AUX work is ~$1.1M. • ~$2.7M of this labor cost differential is accounted for by Professional Staff spending time on non AUX work. • ~$2.6M is accounted for by Support Staff spending time on non AUX activities• Outside of Auxiliary Services work, staff spend their time primarily on Facilities Services work (50.69 FTE)• 100% of Labor Cost spent on staff performing AUX work is unrestricted
$3,371K
$3,039K
$480K$715K
$6,538K
$1,195K
Restricted Unrestricted – I&G Unrestricted – OthProfessional Support
$706.37K
$478.68K
$1,185.04K
Total Salaries for Auxiliary Services
Division
Labor Cost for Staff Performing AUX Work
across NMSU*
Labor Cost for Staff Performing AUX Work from Auxiliary Services
Division

172Copyright © 2014 Deloitte Development LLC. All rights reserved.
Reflecting the minimal fragmentation of Auxiliary Services processes across NMSU, there is minimal cost being spent on Auxiliary Services outside of the Division.
AUX – Fragmentation by Process (Labor Cost)
Auxiliary Services Processes – Fragmentation (Labor Cost)
Key Observations• Out of a total of $1,195,000 spent on staff completing AUX work, only $9.6K was spent on labor cost outside of the division.• 4 of the 9 AUX process cost less than $75K for labor costs.• Combined, the top two most costly AUX processes account for 55% of all labor cost spend on AUX work.
DivisionAcademic Administration
Ag Experiment StationAudit Services
Auxiliary ServicesColleges
Cooperative Extension ServiceFacilities and Services
Honors College/Crimson Sch PgmHuman ResourcesInformation TechnologyPresident OfficeProcurementSenior VP for Admin & FinanceStudent Affairs & Enroll MgmtUniv Advancement VP Office
University CommunicationsVice Pres Research
0 50,000 100,000 150,000 200,000 250,000 300,000 350,000 400,000 450,000 500,000Cost of Labor
Oversee Golf Course Management
Oversee University Special Events
Oversee University Food Services and ID CardServices and related Contract Management
Oversee University Conference Services
Oversee University Housing and related ContractManagement
Oversee University Parking, Transportation and MailServices
Oversee University Residential Life and relatedContract Management
Oversee Bookstore Management and relatedContract Management
Oversee University Student Union
$460.4K
$193.3K
$154.6K
$112.4K
$111.3K
$73.1K
$71.8K
$14.4K
$3.3K
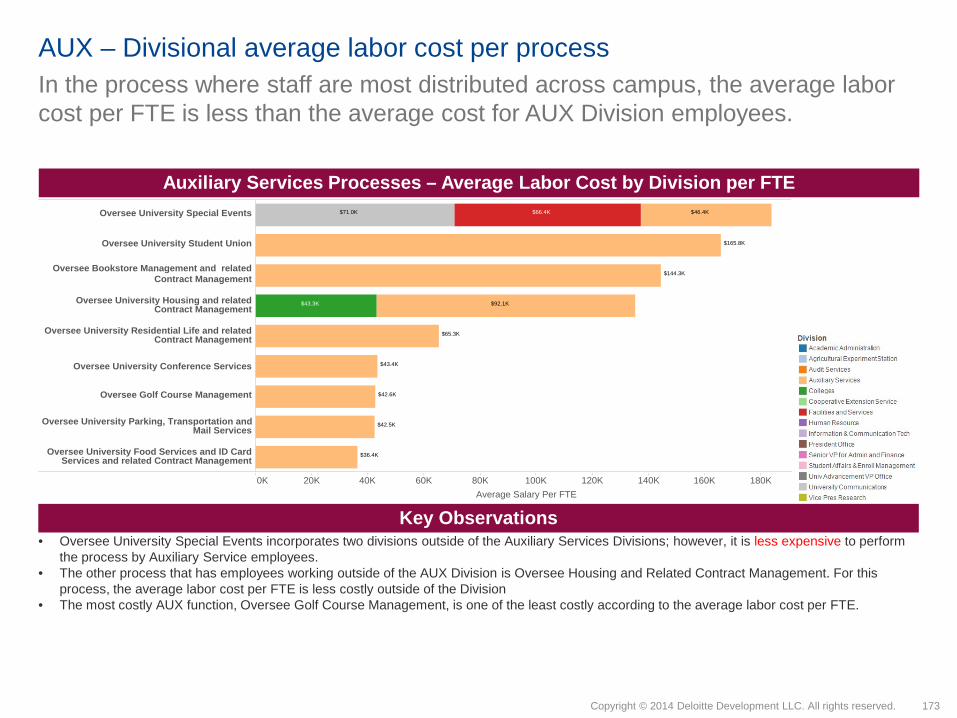
173Copyright © 2014 Deloitte Development LLC. All rights reserved.
In the process where staff are most distributed across campus, the average labor cost per FTE is less than the average cost for AUX Division employees.
AUX – Divisional average labor cost per process
Auxiliary Services Processes – Average Labor Cost by Division per FTE
Key Observations• Oversee University Special Events incorporates two divisions outside of the Auxiliary Services Divisions; however, it is less expensive to perform
the process by Auxiliary Service employees. • The other process that has employees working outside of the AUX Division is Oversee Housing and Related Contract Management. For this
process, the average labor cost per FTE is less costly outside of the Division• The most costly AUX function, Oversee Golf Course Management, is one of the least costly according to the average labor cost per FTE.
0K 20K 40K 60K 80K 100K 120K 140K 160K 180KAverage Salary Per FTE
Oversee University Special Events
Oversee University Student Union
Oversee Bookstore Management and relatedContract Management
Oversee University Housing and relatedContract Management
Oversee University Residential Life and relatedContract Management
Oversee University Conference Services
Oversee Golf Course Management
Oversee University Parking, Transportation andMail Services
Oversee University Food Services and ID CardServices and related Contract Management
$165.8K
$144.3K
$46.4K
$92.1K
$65.3K
$43.4K
$42.6K
$42.5K
$36.4K
$43.3K
$66.4K$71.0K
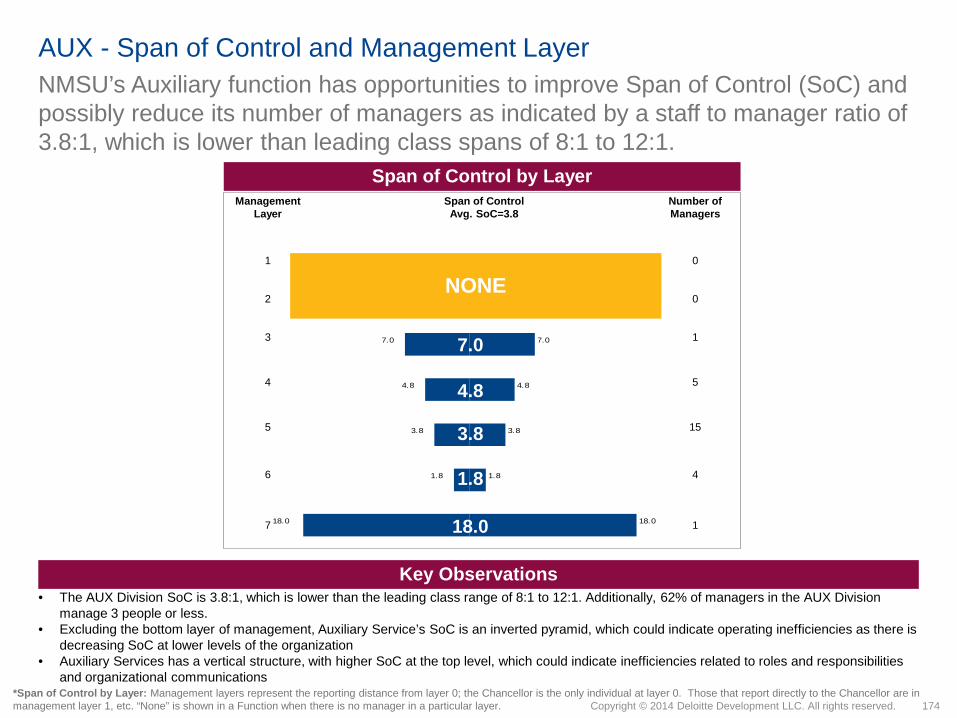
174Copyright © 2014 Deloitte Development LLC. All rights reserved.
18.0
7.0
4.8
3.8
1.8
18.0
7.0
4.8
3.8
1.8
NMSU’s Auxiliary function has opportunities to improve Span of Control (SoC) and possibly reduce its number of managers as indicated by a staff to manager ratio of 3.8:1, which is lower than leading class spans of 8:1 to 12:1.
AUX - Span of Control and Management Layer
Key Observations• The AUX Division SoC is 3.8:1, which is lower than the leading class range of 8:1 to 12:1. Additionally, 62% of managers in the AUX Division
manage 3 people or less. • Excluding the bottom layer of management, Auxiliary Service’s SoC is an inverted pyramid, which could indicate operating inefficiencies as there is
decreasing SoC at lower levels of the organization• Auxiliary Services has a vertical structure, with higher SoC at the top level, which could indicate inefficiencies related to roles and responsibilities
and organizational communications
Span of Control by LayerManagement
LayerSpan of ControlAvg. SoC=3.8
Number of Managers
1 0
2 0
3 1
4 5
5 15
6 4
7 1
NONE
*Span of Control by Layer: Management layers represent the reporting distance from layer 0; the Chancellor is the only individual at layer 0. Those that report directly to the Chancellor are in management layer 1, etc. “None” is shown in a Function when there is no manager in a particular layer.
7.0
4.8
3.8
1.8
18.0

175Copyright © 2014 Deloitte Development LLC. All rights reserved.
Keeping Auxiliary Services processes centralized, but merging them with another function could further promote consistency, and increase efficiency.
AUX – Process C
entra
lized
1. Oversee University Parking, Transportation and Mail Services
2. Oversee University Housing and related Contract Management
3. Oversee University Food Services and ID Card Services and related Contract Management
4. Oversee University Residential Life and related Contract Management
5. Oversee University Conference Services
6. Oversee University Student Union7. Oversee University Special Events8. Oversee Bookstore Management and
related Contract Management9. Oversee Golf Course Management
Hyb
rid
1. None
Dec
entra
lized
1. None
Rel
atio
nshi
p to
the
Uni
vers
ity
Method of Adding Value
Low cost / Defined service levels Knowledge transfer / Management involvement
Center of Excellence/CentralizedShared Services
Business PartnerOnsite Support
•Oversee University Parking, Transportation and Mail Services•Oversee University Housing and related Contract Management•Oversee University Food Services and ID Card Services and related Contract Management•Oversee University Residential Life and related Contract Management•Oversee University Conference Services•Oversee University Student Union•Oversee University Special Events•Oversee Bookstore Management and related Contract Management•Oversee Golf Course Management
Gen
eric
/Uni
vers
ity W
ide
Spec
ific/
Dep
artm
ent
As-Is AUX Operating Model by Process Future-State AUX Operating Model by Process
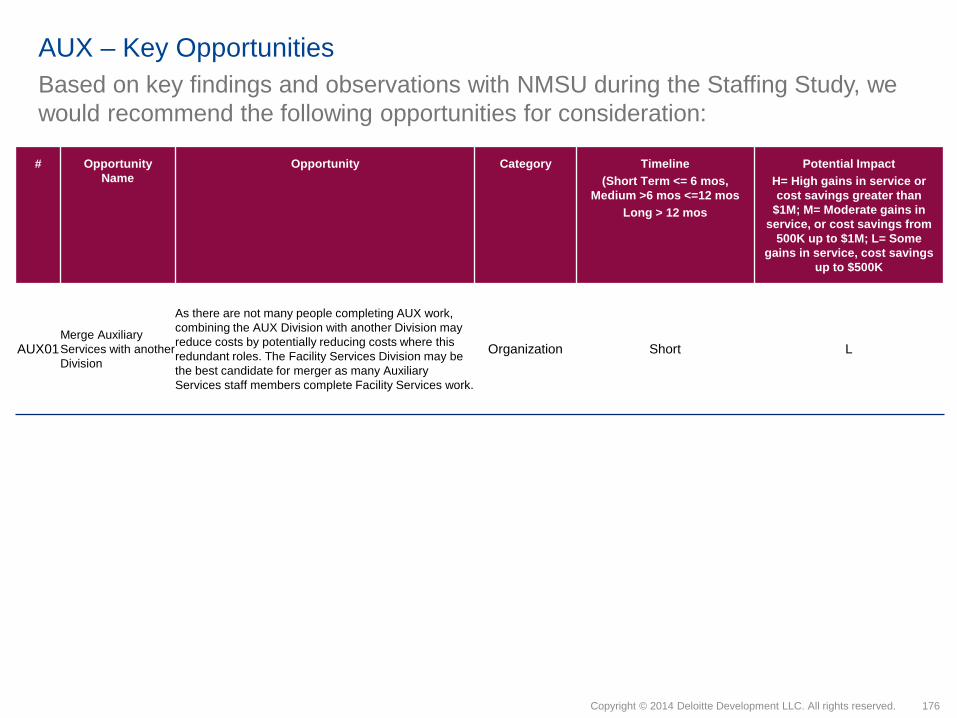
176Copyright © 2014 Deloitte Development LLC. All rights reserved.
AUX – Key OpportunitiesBased on key findings and observations with NMSU during the Staffing Study, we would recommend the following opportunities for consideration:
# Opportunity Name
Opportunity Category Timeline(Short Term <= 6 mos,
Medium >6 mos <=12 mosLong > 12 mos
Potential ImpactH= High gains in service or cost savings greater than
$1M; M= Moderate gains in service, or cost savings from
500K up to $1M; L= Some gains in service, cost savings
up to $500K
AUX01Merge AuxiliaryServices with another Division
As there are not many people completing AUX work, combining the AUX Division with another Division may reduce costs by potentially reducing costs where this redundant roles. The Facility Services Division may be the best candidate for merger as many Auxiliary Services staff members complete Facility Services work.
Organization Short L

Research, Scholarship, and Creative Activities (RSC)

178Copyright © 2014 Deloitte Development LLC. All rights reserved.
RSC – Overview
RSC Processes*1. Manage Research, Discovery, Creative and/or
Development Unit2. Manage Research and/or Development Program3. Coordinate Program Activities4. Conduct Research, Scholarship and Creative
Activities5. Provide Research Support6. Provide Technical Support7. Support Machining Operations8. Develop Software9. Support Artistic Activities10. Manage R&D Site Operations11. Provide Training12. Provide Agricultural Support
Overview
The primary responsibility of the RSC function is to support creative research through technical
support and operational assistance.
Degree of Centralization vs. Peers
Degree of Shared Services vs. Peers
Primary ERP Tool vs. Peers
Technology Capabilities vs. Peers
N/A
N/A
NMSU, FY15
RSC is highly decentralized in comparison to peers and it does not leverage Shared Services concepts.

179Copyright © 2014 Deloitte Development LLC. All rights reserved.
RSC – Key Findings and Opportunity Summary
Key Findings
Staff performing RSC work are distributed broadly across NMSU. (603 people represent 429.56 FTEs)
The total 429.56 FTE who perform RSC- related activities is the highest number of FTEs for any function at NMSU.
The RSC processes are spread over many Divisions, predominantly the Colleges
Across the University, there are a significant number of people utilized to support the process “Provide Research Support.”
The 138.47 FTEs allocated toward this process represents 32% of all FTEs performing any RSC work
Cumulatively, NMSU spends ~$25.3M on labor costs for the RSC function.
Potential Opportunities based on Current Findings
Redesign and streamline NMSU’s RSC operating model to increase efficiency and provide cost savings by better aligning strategic and transactional work.
Centralize several processes into central office that supports RSC initiatives across the University
Implement business partner for certain processes. Continue onsite support for processes where
assistance is needed within the unit.
Up to $500K in potential annual savings identified
The RSC function is highly decentralized with a few hybrid processes. Redesigning and streamlining the operating model may provide some opportunities for improved efficiencies and cost savings. However, opportunities might be limited given the high level of restricted funding (~50%) of labor costs for this function.
Span of Control nor Management Layers were not computed for this function.
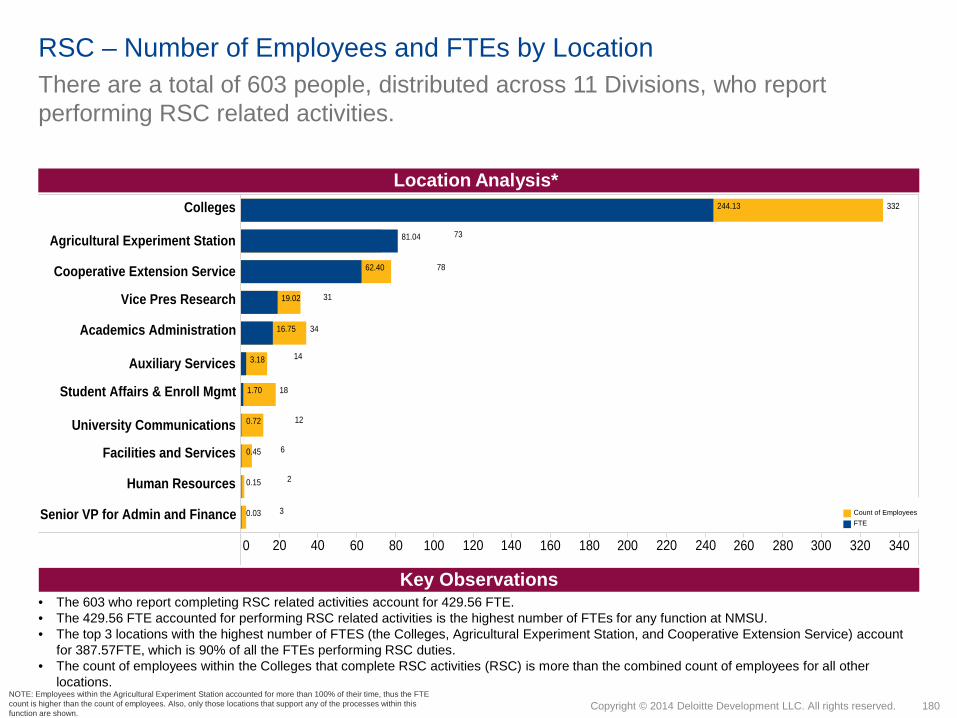
180Copyright © 2014 Deloitte Development LLC. All rights reserved.
0 20 40 60 80 100 120 140 160 180 200 220 240 260 280 300 320 340
Colleges
Agricultural Experiment Station
Cooperative Extension Service
Vice Pres Research
Academics Administration
Auxiliary Services
Student Affairs & Enroll Mgmt
University Communications
Facilities and Services
Human Resources
Senior VP for Admin and Finance 3
2
6
12
14
31
78
73
332
34
18
244.13
16.75
62.40
81.04
19.02
0.45
0.15
3.18
0.03
1.70
0.72
RSC – Number of Employees and FTEs by Location There are a total of 603 people, distributed across 11 Divisions, who report performing RSC related activities.
Location Analysis*
Key Observations
Measure NamesCount of EmployeesFTE
• The 603 who report completing RSC related activities account for 429.56 FTE. • The 429.56 FTE accounted for performing RSC related activities is the highest number of FTEs for any function at NMSU.• The top 3 locations with the highest number of FTES (the Colleges, Agricultural Experiment Station, and Cooperative Extension Service) account
for 387.57FTE, which is 90% of all the FTEs performing RSC duties.• The count of employees within the Colleges that complete RSC activities (RSC) is more than the combined count of employees for all other
locations.NOTE: Employees within the Agricultural Experiment Station accounted for more than 100% of their time, thus the FTE count is higher than the count of employees. Also, only those locations that support any of the processes within this function are shown.

181Copyright © 2014 Deloitte Development LLC. All rights reserved.
RSC – Number of Employees and FTEs by Location (Colleges) There are a total of 332 people within the Colleges who report performing RSC related activities.
Location Analysis*
Key Observations• The 332 employees who report completing RSC activities within Colleges account for 244.13 FTEs.• More than half (67%) of the FTEs performing RSC work within the colleges are located within the Arts and Sciences College and the Agricultural,
Consumer and Environmental Science College. • The Health and Social Services College has the highest percentage (83%) of FTEs to count of employees performing RSC work. This indicates that
for a majority of people in this college, RSC work is their primary responsibility.
0 10 20 30 40 50 60 70 80 90 100 110 120
Arts and Sciences College
Agricultural,Consumer & EnvSci Col
Engineering College
Health and Social ServicesCollege
Education College
Business College
Honors College/Crimson SchPgm
2
21
119
85
69
29
7
91.25
71.25
17.35
49.54
13.81
0.07
0.86
Measure NamesCount of EmployeesFTE
*NOTE: Only those locations that support any of the processes within this function are shown.

182Copyright © 2014 Deloitte Development LLC. All rights reserved.
There are a significant number of people across NMSU supporting the Provide Research Support process.
RSC – Level of Fragmentation by Process
RSC Processes - Fragmentation
Key Observations• There are a significant number of people supporting the “Provide Research Support” process. The 138.47 FTEs allocated toward this process
represents 32% of all FTEs performing any RSC work. • For the processes with 25 or more FTE, the processes generally spreads at least 7 Divisions. • Across the function, there are a high number of employees that report completing RSC processes. Excluding Provide Research Support, no
process has a 50% ratio of FTEs to the number of employees that report performing that process.• The Colleges have more than 50% of the FTEs in all but 4 processes. The four processes are Provide Training, Manage Research and and/or
Development Program, Provide Agricultural Support, and Support Machining Operations.
The left most number on each scale represents the number of FTE performing the process across NMSU. The number in parentheses represents the number of people that spend at least some time performing the process.
0 10 20 30 40 50 60 70 80 90 100 110 120 130 140 150Full Time Equivalents
Provide Research Support
Coordinate Program Activities
Conduct Research, Scholarship and CreativeActivities
Provide Technical Support
Provide Training
Manage Research and/or Development Program
Provide Agricultural Support
Manage Research, Discovery, Creative and/orDevelopment Unit
Support Artistic Activities
Develop Software
Support Machining Operations
Manage R&D Site Operations
138.47
63.35
61.21
50.81
30.67
28.44
21.71
16.08
7.48
4.46
3.70
3.19
(213)
(162)
(20)
(29)
(26)
(25)
(50)
(51)
(83)
(118)
(143)
(143)

183Copyright © 2014 Deloitte Development LLC. All rights reserved.
The RSC processes generally have FTEs distributed over a majority of the Colleges.
RSC – Level of Fragmentation by Process for the Colleges
RSC Processes - Fragmentation
Key Observations• The RSC processes have FTEs distributed over a majority of the Colleges. For each process with at least 5 FTEs, the process is spread over at
least 5 colleges. • Both the Agricultural, Consumer and Environmental Science College (ACE) and the Arts and Sciences College contribute FTEs to every RSC
Process except one. ACE does not contribute to the process Support Machining Operations and the Arts and Science College does not contribute to the process Provide Agricultural Support.
• The Arts and Sciences College contributes the most FTEs to 6 out of 11 processes. • The Health and Social Services College contributes the most FTEs to one process, Provide Training.
0 10 20 30 40 50 60 70 80Full Time Equivalents
Provide Research Support
Conduct Research, Scholarship andCreative Activities
Provide Technical Support
Coordinate Program Activities
Manage Research and/or DevelopmentProgram
Manage Research, Discovery, Creativeand/or Development Unit
Provide Training
Support Artistic Activities
Develop Software
Manage R&D Site Operations
Support Machining Operations
Provide Agricultural Support
76.33
44.69
44.08
33.48
13.92
9.95
8.61
4.88
3.77
2.29
1.09
1.05
Agricultural,Consumer & Env Sci ColArts and Sciences CollegeBusiness CollegeEducation College
Engineering CollegeHealth and Social Services College
Honors College/Crimson Sch Pgm

184Copyright © 2014 Deloitte Development LLC. All rights reserved.
Cumulatively, NMSU spends ~$25.3M on labor costs for the RSC function. RSC – Fragmentation by Process (Labor Cost)
RSC Processes – Fragmentation (Labor Cost)
Key Observations• NMSU spends ~$25.3M on labor costs for the RSC function. Of the total spent on RSC, $7.5M is spent on the Provide Research Support process,
which represents 30% of the total labor cost spend. • The top three most costly processes for the RSC function—Provide Research Support, Conduct Research, Scholarship and Creative Activities,
and Coordinate Program Activities—represent 58% of the total labor costs for the RSC function.
0 1,000,000 2,000,000 3,000,000 4,000,000 5,000,000 6,000,000 7,000,000 8,000,000Cost of Labor
Provide Research Support
Conduct Research, Scholarship and CreativeActivities
Coordinate Program Activities
Provide Technical Support
Manage Research and/or Development Program
Manage Research, Discovery, Creative and/orDevelopment Unit
Provide Training
Provide Agricultural Support
Support Artistic Activities
Develop Software
Manage R&D Site Operations
Support Machining Operations
$7,519.4K
$3,683.8K
$3,528.9K
$3,127.3K
$2,407.3K
$1,703.7K
$1,396.9K
$808.7K
$400.0K
$355.9K
$215.5K
$189.2K
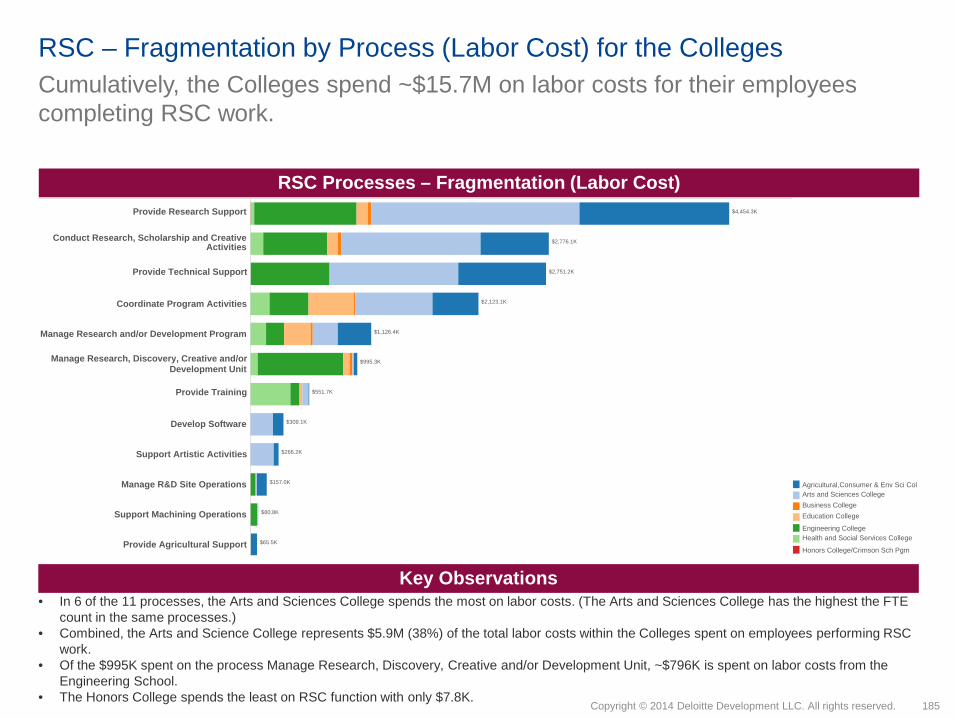
185Copyright © 2014 Deloitte Development LLC. All rights reserved.
Cumulatively, the Colleges spend ~$15.7M on labor costs for their employees completing RSC work.
RSC – Fragmentation by Process (Labor Cost) for the Colleges
RSC Processes – Fragmentation (Labor Cost)
Key Observations• In 6 of the 11 processes, the Arts and Sciences College spends the most on labor costs. (The Arts and Sciences College has the highest the FTE
count in the same processes.) • Combined, the Arts and Science College represents $5.9M (38%) of the total labor costs within the Colleges spent on employees performing RSC
work. • Of the $995K spent on the process Manage Research, Discovery, Creative and/or Development Unit, ~$796K is spent on labor costs from the
Engineering School. • The Honors College spends the least on RSC function with only $7.8K.
Agricultural,Consumer & Env Sci ColArts and Sciences CollegeBusiness CollegeEducation College
Engineering CollegeHealth and Social Services College
Honors College/Crimson Sch Pgm
Provide Research Support
Conduct Research, Scholarship and CreativeActivities
Provide Technical Support
Coordinate Program Activities
Manage Research and/or Development Program
Manage Research, Discovery, Creative and/orDevelopment Unit
Provide Training
Develop Software
Support Artistic Activities
Manage R&D Site Operations
Support Machining Operations
Provide Agricultural Support
$4,454.3K
$2,776.1K
$2,751.2K
$2,123.1K
$1,126.4K
$995.3K
$551.7K
$309.1K
$266.2K
$157.0K
$80.8K
$65.5K

186Copyright © 2014 Deloitte Development LLC. All rights reserved.
Within many of the processes the average labor cost per FTE varies greatly across the Divisions.
RSC – Divisional average labor cost per process
RSC Processes – Average Labor Cost by Division per FTE*
Key Observations• Within many of the processes the average labor cost per FTE varies greatly across the Divisions. In some cases the difference is nearly $90K
between the lowest average labor cost per FTE and the highest average labor cost per FTE. For example, within the Coordinate Program Activities, the average labor cost per FTE for University Communications is $128K vs. the Cooperative Extension Service, which is $39K
• There are generally higher average labor costs per FTE when the process is spread across more Divisions• Excluding Student Affairs and the Cooperative Extension Service, the highest average labor cost per FTE for each division is for the process
Manage Research, Discovery, Creative and/or Development Unit. This indicates that high salaried individuals are performing this process across the Divisions.
Manage Research and/or Development Program
Manage Research, Discovery, Creative and/orDevelopment Unit
Provide Research Support
Coordinate Program Activities
Provide Technical Support
Provide Training
Conduct Research, Scholarship and CreativeActivities
Develop Software
Provide Agricultural Support
Manage R&D Site Operations
Support Machining Operations
Support Artistic Activities
$104.2K
$117.1K$113.8K$100.0K$143.4K
$128.0K
$128.0K
$128.0K
$128.0K
$120.1K
$45.0K
$57.8K
$48.9K
$61.1K
$51.3K
$30.8K
$57.1K
$36.5K
$91.9K
$91.9K
$40.8K
$37.7K
$33.6K
$35.4K
$51.0K
$80.9K
$58.4K
$63.4K
$62.4K
$64.1K
$62.1K
$82.0K
$62.4K
$68.6K
$74.1K
$54.6K
$77.3K
$65.4K
$70.7K
$39.0K
$54.5K
$29.1K
$47.3K
$41.7K
$49.2K
$68.6K
$41.5K
$62.8K
$54.6K
$64.8K
$63.3K
$55.1K
$55.6K
$55.7K
$94.2K
$37.6K
$54.7K
$74.9K
$48.4K
$73.7K
$44.4K
$40.3K
$71.4K
$41.1K
$50.4K
$53.6K
$72.7K
$91.2K
$53.2K
$80.1K
$81.8K
$92.4K
$63.5K

187Copyright © 2014 Deloitte Development LLC. All rights reserved.
The average labor cost per FTE varies greatly across the Colleges.RSC – Colleges average labor cost per process
RSC Processes – Average Labor Cost by Division per FTE*
Key Observations
Provide Research Support
Manage Research, Discovery, Creative and/orDevelopment Unit
Manage Research and/or Development Program
Conduct Research, Scholarship and CreativeActivities
Provide Technical Support
Coordinate Program Activities
Provide Training
Manage R&D Site Operations
Develop Software
Support Artistic Activities
Support Machining Operations
Provide Agricultural Support
$130.0K
$187.7K
$150.9K
$190.2K
$101.8K
$100.9K
$107.5K
$132.4K
$191.1K
$201.8K
$56.1K
$51.9K
$60.1K
$56.6K
$44.5K
$63.8K
$59.2K
$64.5K
$83.7K
$62.3K
$69.1K
$71.9K
$68.7K
$75.7K
$57.4K
$45.6K
$82.7K
$52.5K
$76.7K
$94.0K
$72.5K
$82.8K
$61.8K
$56.7K
$45.0K
$64.1K
$34.2K
$71.0K
$84.4K
$65.4K
$70.4K
$68.9K
$87.5K
$86.0K
$87.8K
$93.1K
$79.7K
$27.1K $57.9K
$49.3K
$62.9K
$48.4K
$52.4K
$43.3K
Agricultural,Consumer & Env Sci ColArts and Sciences CollegeBusiness CollegeEducation College
Engineering CollegeHealth and Social Services College
Honors College/Crimson Sch Pgm
• Similar to the overall University, the average labor cost per FTE varies greatly across the Colleges. In some cases the difference is ~$160K between the lowest average labor cost and the highest average. For example, within the Conduct Research, Scholarship and Creative Activities the average labor cost per FTE for the Business College is $187.7K vs. the Health and Social Services , which is $27.1K
• When represented, the Business College most often has one of the highest average labor cost per FTE for RSC work being completed.• The process Support Artistic Activities represents the most inexpensive average labor cost per FTE across the Colleges.

188Copyright © 2014 Deloitte Development LLC. All rights reserved.
The processes for the RSC function are highly decentralized as no Division has overarching responsibility for the function. However, centralizing some of the processes may provide opportunities for improved efficiency and cost reduction.
RSC – Process C
entra
lized
1. None
Hyb
rid
1. Develop Software2. Support Artistic Activities3. Support Machining Operations4. Manage R&D Site Operations
Dec
entra
lized
1. Manage Research, Discovery, Creative and/or Development Unit
2. Manage Research and/or Development Program
3. Coordinate Program Activities4. Conduct Research, Scholarship and
Creative Activities5. Provide Research Support6. Provide Technical Support7. Provide Training8. Provide Agricultural Support
Rel
atio
nshi
p to
the
Uni
vers
ity
Method of Adding Value
Low cost / Defined service levels Knowledge transfer / Management involvement
Center of Excellence/CentralizedShared Services
Business PartnerOnsite Support
•Manage Research, Discovery, Creative and/or Development Unit•Manage Research and/or Development Program•Coordinate Program Activities•Provide Research Support•Provide Technical Support•Support Machining Operation•Support Artistic Activities
Gen
eric
/Uni
vers
ity W
ide
Spec
ific/
Dep
artm
ent
As-Is RSC Operating Model by Process Future-State RSC Operating Model by Process
•Develop Software•Provide Training
•.
•Provide Agricultural Support•Support Machining Operations•Manage R&D Site Operations•Conduct Research, Scholarship and Creative Activities
.

189Copyright © 2014 Deloitte Development LLC. All rights reserved.
RSC – Key OpportunitiesBased on key findings and observations with NMSU during the Staffing Study, we would recommend the following opportunities for consideration:
# Opportunity Name
Opportunity Category Impact Timeline(Short Term <= 6 mos,
Medium >6 mos <=12 mosLong > 12 mos
Potential ImpactH= High gains in service or cost savings greater than
$1M; M= Moderate gains in service, or cost savings from
500K up to $1M; L= Some gains in service, cost savings
up to $500K
RSC01 Streamline Support for RSC Efforts
While there are certain processes that require Onsite Support; several RSC initiatives can be centralized or shifted to a business partner model that will help improve efficiency and maximize NMSU’s resources.
Organization Medium L

Appendix
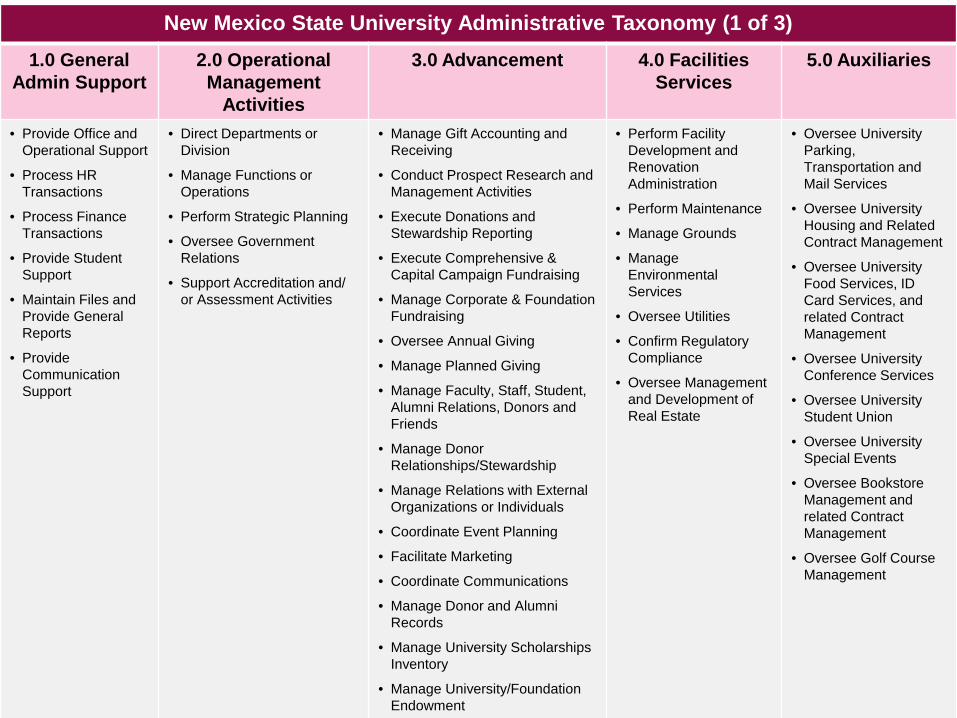
191Copyright © 2014 Deloitte Development LLC. All rights reserved.
New Mexico State University Administrative Taxonomy (1 of 3)1.0 General
Admin Support2.0 Operational Management
Activities
3.0 Advancement 4.0 Facilities Services
5.0 Auxiliaries
• Provide Office and Operational Support
• Process HR Transactions
• Process Finance Transactions
• Provide Student Support
• Maintain Files and Provide General Reports
• Provide Communication Support
• Direct Departments or Division
• Manage Functions or Operations
• Perform Strategic Planning
• Oversee Government Relations
• Support Accreditation and/ or Assessment Activities
• Manage Gift Accounting and Receiving
• Conduct Prospect Research and Management Activities
• Execute Donations and Stewardship Reporting
• Execute Comprehensive & Capital Campaign Fundraising
• Manage Corporate & Foundation Fundraising
• Oversee Annual Giving
• Manage Planned Giving
• Manage Faculty, Staff, Student,Alumni Relations, Donors and Friends
• Manage Donor Relationships/Stewardship
• Manage Relations with ExternalOrganizations or Individuals
• Coordinate Event Planning
• Facilitate Marketing
• Coordinate Communications
• Manage Donor and Alumni Records
• Manage University Scholarships Inventory
• Manage University/Foundation Endowment
• Perform Facility Development and Renovation Administration
• Perform Maintenance
• Manage Grounds
• Manage Environmental Services
• Oversee Utilities
• Confirm Regulatory Compliance
• Oversee Management and Development of Real Estate
• Oversee University Parking, Transportation and Mail Services
• Oversee University Housing and Related Contract Management
• Oversee University Food Services, ID Card Services, and related Contract Management
• Oversee University Conference Services
• Oversee University Student Union
• Oversee University Special Events
• Oversee Bookstore Management and related Contract Management
• Oversee Golf Course Management
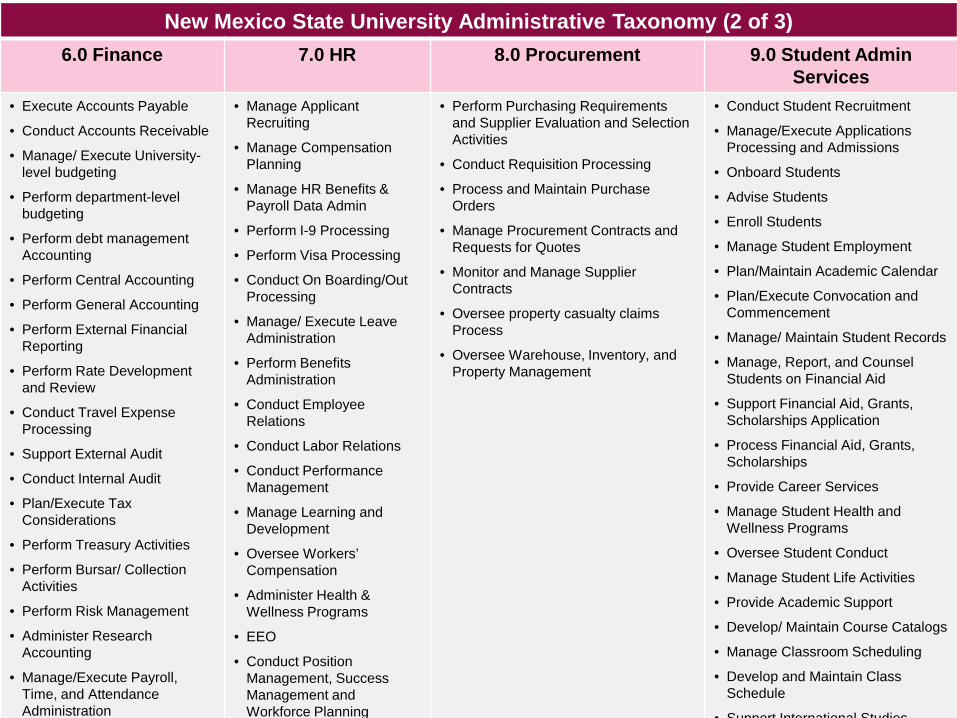
192Copyright © 2014 Deloitte Development LLC. All rights reserved.
New Mexico State University Administrative Taxonomy (2 of 3)6.0 Finance 7.0 HR 8.0 Procurement 9.0 Student Admin
Services• Execute Accounts Payable
• Conduct Accounts Receivable
• Manage/ Execute University-level budgeting
• Perform department-levelbudgeting
• Perform debt management Accounting
• Perform Central Accounting
• Perform General Accounting
• Perform External Financial Reporting
• Perform Rate Development and Review
• Conduct Travel Expense Processing
• Support External Audit
• Conduct Internal Audit
• Plan/Execute Tax Considerations
• Perform Treasury Activities
• Perform Bursar/ Collection Activities
• Perform Risk Management
• Administer Research Accounting
• Manage/Execute Payroll, Time, and Attendance Administration
• Manage Applicant Recruiting
• Manage Compensation Planning
• Manage HR Benefits & Payroll Data Admin
• Perform I-9 Processing
• Perform Visa Processing
• Conduct On Boarding/OutProcessing
• Manage/ Execute LeaveAdministration
• Perform Benefits Administration
• Conduct Employee Relations
• Conduct Labor Relations
• Conduct Performance Management
• Manage Learning andDevelopment
• Oversee Workers’ Compensation
• Administer Health & Wellness Programs
• EEO
• Conduct Position Management, Success Management and Workforce Planning
• Perform Purchasing Requirements and Supplier Evaluation and Selection Activities
• Conduct Requisition Processing
• Process and Maintain Purchase Orders
• Manage Procurement Contracts and Requests for Quotes
• Monitor and Manage Supplier Contracts
• Oversee property casualty claimsProcess
• Oversee Warehouse, Inventory, and Property Management
• Conduct Student Recruitment
• Manage/Execute Applications Processing and Admissions
• Onboard Students
• Advise Students
• Enroll Students
• Manage Student Employment
• Plan/Maintain Academic Calendar
• Plan/Execute Convocation and Commencement
• Manage/ Maintain Student Records
• Manage, Report, and Counsel Students on Financial Aid
• Support Financial Aid, Grants, Scholarships Application
• Process Financial Aid, Grants, Scholarships
• Provide Career Services
• Manage Student Health and Wellness Programs
• Oversee Student Conduct
• Manage Student Life Activities
• Provide Academic Support
• Develop/ Maintain Course Catalogs
• Manage Classroom Scheduling
• Develop and Maintain Class Schedule
• Support International Studies

193Copyright © 2014 Deloitte Development LLC. All rights reserved.
New Mexico State University Administrative Taxonomy (3 of 3)10.0 Award
Development, Compliance &
Admin
11.0 Information Technology 12.0Communication
s
13.0 Research, Public Service &
Scholarly/ CreativeActivities
14.0Educational Programs
• Identify Grant Funding and Manage Limited Submissions
• Provide Proposal Development Support
• Support Grant Proposal Preparation, Review and Submission
• Manage AwardNegotiation and Acceptance
• Support FinancialRegulatory Management
• Process Awards
• Perform Award Project Management
• Manage Licensing,Commercialization, and Technology Transfer
• Manage Conflicts of Interest (COI) related to Sponsored Activities
• Manage Research Compliance
• Conduct Subcontractor Procurement
• Administer & Manage University-wide IT
• Program, Project and/or Service Mgmt.
• Conduct Application Support & Main.• Manage App. Dev. & Implementation• Conduct Business Requirements
Analysis• Support Data Centers• Provide End-user Support• Manage Hardware & Software
Acquisition• Support Research Computing• Manage Telecommunications• Manage IT Vendors• Design, Implement, Maintain
Networks• Support IT Life Safety Systems• Maintain Information Security• Oversee Document Management• Perform Computer & Op System
Admin• Oversee Disaster Recovery/Business
Continuity• Oversee Identity & Authentication
Mgmt. • Perform Database Admin• Administer/Maintain Data Warehouse• Oversee Decision Support & Data
Model• Facilitate Business Process
Automation and Operational support• Execute Operational and Longitudinal
• Plan/Execute Communications
• Plan/Execute Marketing
• Plan/Execute Cooperative Extension Services and Agricultural Extension Services Publications
• Product Broadcast Television Programs
• Manage Public TV and Radio Stations
• Develop News Stories and Conduct Media Relations
• Handle Sports Information Duties
• Provide Strategic Direction for University Website
• Manage Research, Discovery, and/or Development Unit
• Manage Research and Development Program
• Coordinate Program Activities
• Conduct Research, Scholarship, and Creative Activities
• Provide Research Support
• Provide Technical Support
• Support Machining Operations
• Develop Software
• Support Artistic Activities
• Manage R&D Site Operations
• Provide Training
• Provide Agricultural Support
• Develop Educational Programs
• Implement Educational Programs
• Develop Outreach Programs
• Evaluate Educational Programs
• Provide Library Services

194Copyright © 2014 Deloitte Development LLC. All rights reserved.
Formulas UsedEstimated Savings for Each Functional Area (Slides: 31,43,55,70,77,89,101,113,125,137,147,163,176,188)• Combined potential impact for opportunities in each function. H= High gains in service or cost savings greater than $1M; M= Moderate gains in
service, or cost savings from 500K up to $1M; L= Some gains in service, cost savings up to $500K.
Location analysis: (Slides: 32, 44, 56,71, 78, 90,102,114,126,138,148,149,164,165,177,189,190)• Count of the number of employees, by division (position location) on campus, who were reported as having spent some time doing the given
function’s work• Sum of the fraction of time that each of these employees, by division (position location) on campus, spent doing the given function’s work
Process fragmentation (FTE): (Slides:33,45,57,72,80,91,103,115,127,129,150,151,166,167,178,191,192)• The count of the number of employees, fragmented by division (position location) on campus, who were reported as having spent some time doing
the function’s work, broken down by process• Sum of the fraction of time that each of these employees, fragmented by division (position location) on campus, spent doing the given function’s
work, broken down by process
Labor cost bar charts: (Slides:34,46,58,80,92,104,116,128,152,179)• Sum of the salaries + fringe of all employees in the mapping function’s division, fragmented by professional vs. support staff• Sum of the product of salary + fringe for each employee spending time performing the given function’s work across campus and the fraction of time
that each of these employees spent doing the given function’s work, fragmented by professional vs. support staff
Labor cost pie charts: (Slides:34,46,58,80,92,104,116,128,152,179)• Sum of the product of salary + fringe for each employee spending time performing the given function’s work across campus and the fraction of time
that each of these employees spent doing the given function’s work, fragmented by funding type
Process fragmentation (Labor Cost): (Slides:35,47,59,81,93,105,117,129,141,153,154,168,169,180,193,194)• Sum of the product of salary + fringe for each employee spending time performing the given function’s work across campus and the fraction of time
that each of these employees spent doing the given function’s work, fragmented by division (position location) on campus, broken down by process
Process fragmentation (Average Labor Costs): (Slides:36,48,61,82,94,106,118,130,142,155,156,170,171,195, 196)• Sum of the product of salary + fringe for each employee spending time performing the given function’s work across campus and the fraction of time
that each of these employees spent the given function’s work, fragmented by division (position location) on campus and divided by the sum of the fraction of time that each of these employees spent doing the given function’s work, broken down by process
• Avg per division per process = Sum[(Salary + Fringe)*FTE]HR, Applicant Recruiting, /Sum(FTE)Fn, Process, Division
SOC by Layer: (Slides:37,49,62,83,95,107,119,131,157,182)• Average number of direct reports (span of control) by management layer for the given function’s mapping division• Number of managers per management layer for the given function’s correlating division
Number of Direct Reports by Managers: (Slides:37,49,62,83,95,107,119,131,157,182)• Count of the number of managers managing a given number of direct reports for the given function’s mapping division