new locked charge protection system · pdf file2 new locked charge protection system prevents...
TRANSCRIPT
1
NEW LOCKED CHARGE PROTECTION SYSTEM PREVENTS DAMAGE TO 14MW GEARED
MILL.
H De Beer1 and M. Lombaard1, P. Warner2, *P. van Zyl3
1Goldfields
Tarkwa Mine
Ghana
2Anglo American
45 Main Street
Johannesburg, South Africa
3SDG Technologies
14 Partridge Avenue
Kempton Park, South Africa
(*Corresponding author: [email protected])

2
NEW LOCKED CHARGE PROTECTION SYSTEM PREVENTS DAMAGE TO 14MW GEARED
MILL.
ABSTRACT
The 14MW SAG mill at Tarkwa, Ghana, experienced a frozen drop charge incident on 10 February 2010. This caused downtime of 112 hours, a repair cost of $200k and production loss of 162,000 tons, corresponding to a loss of $8.9M. A new locked charge protection system was installed on the two Tarkwa mills on 30 July 2010, mitigating this risk. This system calculates the ore angle in real time while the mill is starting up and trips the mill if the ore angle exceeds a trip angle setting. The calculation of the ore angle is derived from the mill motor rotor currents only - no mechanical transducers are required. The head of Gold Fields West Africa, Peter Turner, says of the new system: "This is excellent work and the type of technology that has had and will continue to have, major opportunity cost impacts on our business."
KEYWORDS
SAG mill, Ball mill, Locked charge, drop charge, frozen charge, Liquid Resistance Starter, LRS
INTRODUCTION
A “locked charge incident” is referred to by Svalbonas (2002) as a “drop charge,” while
Vanderbeek (2004) refers to “locked charge protection” and Frank (1997) refers to “frozen charge protection,” “baked charge protection,” or “cemented charge protection.” All these simply refer to the mixture of the ore, steel balls and water in the mill becoming solidified, being lifted up when the mill starts rotating, and then falling when the mill has rotated more than 90º.
According to Vanderbeek, 2004, "The installation of a locked charge protection system is critical
for large diameter SAG and ball mills. This capability is inherent with the gearless drives.” Frank (1997) describes the implementation of such a system for gearless drives.
In many installations, locked charge protection systems have not been widely used on some common geared configurations, such as the two 14MW mills at Tarkwa. Previous locked charge protection systems applicable to this type of mill configuration were not simple and reliable enough to be widely accepted by industry. A big contributing factor was that the sensors used by these systems did not prove robust and reliable enough under the conditions of milling plant operation.
The new locked charge protection system installed at Tarkwa follows a different approach by only measuring the electrical currents between the motor rotor and the liquid resistance starter. The technology to measure large electrical currents is very well established and routinely used as input to critical electrical protection devices. It will be shown in this paper that all information necessary to calculate the ore angle during start-up is present in the motor rotor currents, and is utilized by the new locked charge protection system.
The monitoring and automated analysis of the motor rotor currents has also yielded exciting benefits by enabling the diagnosis of various electrical problems that can otherwise go unnoticed until they cause major damage. Three of these problems that have been solved at Tarkwa and Damang will be highlighted.
3
OPERATING PRINCIPLE: LOCKED CHARGE PROTECTION
Mathematical Overview
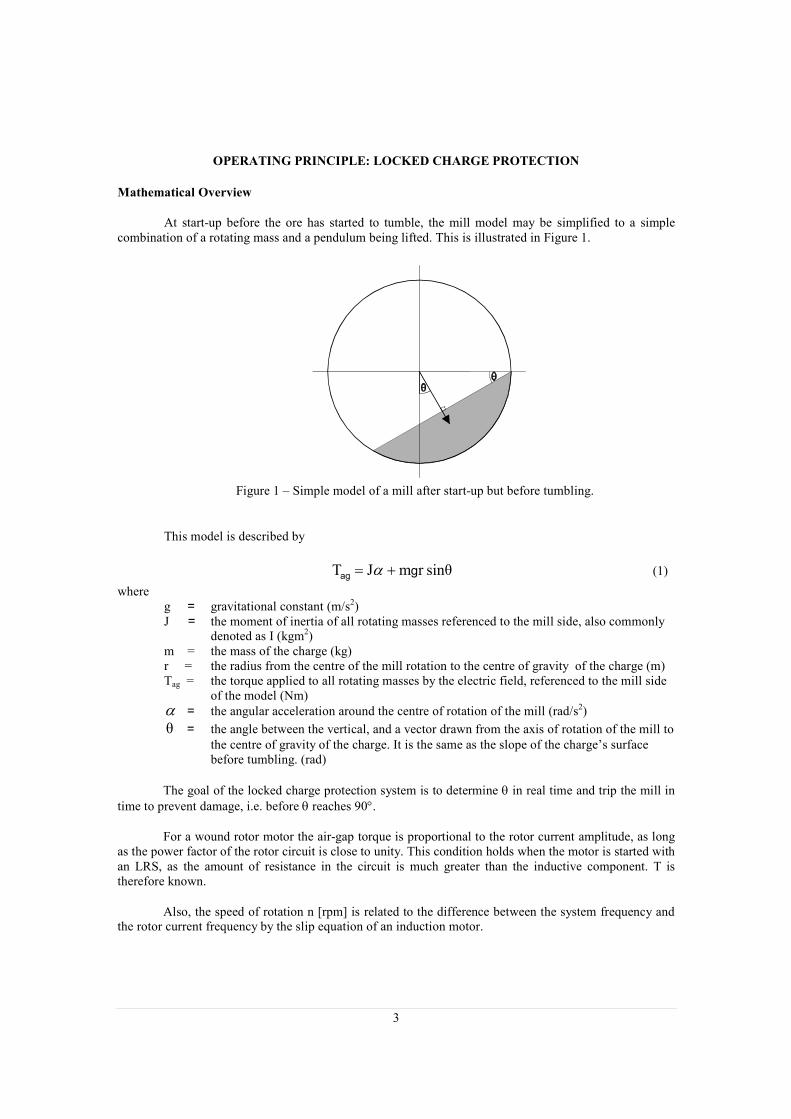
At start-up before the ore has started to tumble, the mill model may be simplified to a simple combination of a rotating mass and a pendulum being lifted. This is illustrated in Figure 1.
This model is described by
sinθr mJ gag +=Τ α (1)
where g = gravitational constant (m/s2) J = the moment of inertia of all rotating masses referenced to the mill side, also commonly
denoted as I (kgm2) m = the mass of the charge (kg) r = the radius from the centre of the mill rotation to the centre of gravity of the charge (m) Tag = the torque applied to all rotating masses by the electric field, referenced to the mill side
of the model (Nm)
α = the angular acceleration around the centre of rotation of the mill (rad/s2)
θ = the angle between the vertical, and a vector drawn from the axis of rotation of the mill to
the centre of gravity of the charge. It is the same as the slope of the charge’s surface before tumbling. (rad)
The goal of the locked charge protection system is to determine θ in real time and trip the mill in
time to prevent damage, i.e. before θ reaches 90°.
For a wound rotor motor the air-gap torque is proportional to the rotor current amplitude, as long as the power factor of the rotor circuit is close to unity. This condition holds when the motor is started with an LRS, as the amount of resistance in the circuit is much greater than the inductive component. T is therefore known.
Also, the speed of rotation n [rpm] is related to the difference between the system frequency and the rotor current frequency by the slip equation of an induction motor.
Figure 1 – Simple model of a mill after start-up but before tumbling.

4
60p
ffn
rotorsystem×
−= (2)
where fsystem = the system frequency (Hz) frotor = the rotor circuit frequency (Hz) n = the speed of rotation (rpm) p = the number of pole pairs, 3 in the case of the Tarkwa motors with 6 poles.
From n and the gearbox ratio, the mill’s angular speed, ω, is known and therefore also the angular
acceleration, α, and angular position, θ.
The only unknowns in the system equation [1] are therefore J and mgr. During the first few degrees of mill rotation, the charge has not tumbled and both the parameters may therefore be solved.
Thereafter, J and mgr remain constant until the point in time where tumbling occurs, and J and
mgr may therefore be substituted to solve θ. θ will remain equal to mill rotation up to the tumbling point, after which it breaks away and remains approximately constant thereafter.

5
Protection Operation Examples
Figure 2 - Tarkwa Ball 2011/05/05 15h09 #0123 (Ore Angle Graph)
Figure 2 is an actual example of a safe start-up. For the first part of the start-up, the graph is at 45°, while
the charge has not tumbled and the ore angle is therefore the same as the mill angle. At 63°, the ore tumbles and the ore angle settles at a lower value as the mill angle continues to increase. The graph therefore enters the green safe area to the right of the graph.

6
Figure 3 - Tarkwa Ball 2011/05/05 14h04 #0122 Figure 3 is an actual example of a locked charge trip. The charge does not tumble and the graph
therefore enters the red TRIP area at the top of the graph. A trip is issued by the Locked Charge Protection Relay (“LCPR”), and the motor is tripped after a short delay, caused by intermediate relay action and breaker tripping time. After the trip, the mill still coasts a few degrees under its own momentum. Hans de Beer was standing next to the mill during this trip, and confirmed that a small fraction of the charge could
be heard dropping, but not enough to cause damage to the mill. The trip setting was reduced to 75° following this experience.
Video Taken Inside a Mill
In order to confirm the calculation of ore angle by means of the above principles visually, a video was taken inside a mill and correlated frame-for-frame with the graph of mill and ore angles generated by the locked charge protection system.

7
SYSTEM OVERVIEW
Locked Charge Protection Relay (LCPR)
At the heart of the system is the Locked Charge Protection Relay, or LCPR. This is a powerful numerical protection device responsible for calculating the angle of repose in real time and tripping the mill if this reaches a dangerous angle. Figure 4 is a photo of the LCPR panel at the Tarkwa SAG mill during commissioning. The LCPR panel is mounted against the Liquid Resistance Starter control cabinet, to facilitate easy connection to the DC CTs depicted in Figure 5.
Figure 4 – LCPR panel
Figure 5 – DC CTs used for rotor current measurement

8
HMI
A dedicated HMI in the control room shows the status of the system, including the real-time mill and ore angles during start-up. This is important to bolster the control personnel’s confidence in the functioning of the locked charge protection system. Figure 6 shows a screenshot of the HMI after a typical start-up.
Figure 6 – HMI display after typical start-up
Typical Tumbling Angles
Figures 7 and 8 give the distribution of tumbling angles for the Ball and SAG mills. Power to Tarkwa is supplied by the Ghana power utility and due to power dips and outages, the number of mill start-ups is relatively high. Under these crash stop conditions, the mill stops without prior controlled grind out of the mill charge and circulating load. This is when locked charge damage is most likely, and where normal barring procedure has not been effective in eliminating locked charges.
It can be seen that the Ball mill tumbling angle is typically very high, with a total of 8 start-ups
reaching tumbling angles higher than 80 degrees and therefore tripping on locked charge. The total number of start-ups was 129 and thus 6% of the start-ups could have caused locked charge damage.
The SAG mill tumbling angles were mostly between 30 and 40 degrees, yet it is interesting to note
that some start-ups also had high tumbling angles. As expected, high tumbling angles are reached more often in the ball mill, as the particle size is smaller.

9
0
2
4
6
8
10
12
14
16
18
25 30 35 40 45 50 55 60 65 70 75 80 85 90
Tumbling Angle (degrees)
Number
of Startups
Figure 7 – Histogram of Ball Mill Tumbling Angles
0
10
20
30
40
50
60
70
80
25 30 35 40 45 50 55 60 65 70 75 80 85 90
Tumbling Angle (degrees)
Number
of Startups
Figure 8 – Histogram of SAG Mill Tumbling Angles
Trip
Trip
10
Internet Based Report Generation
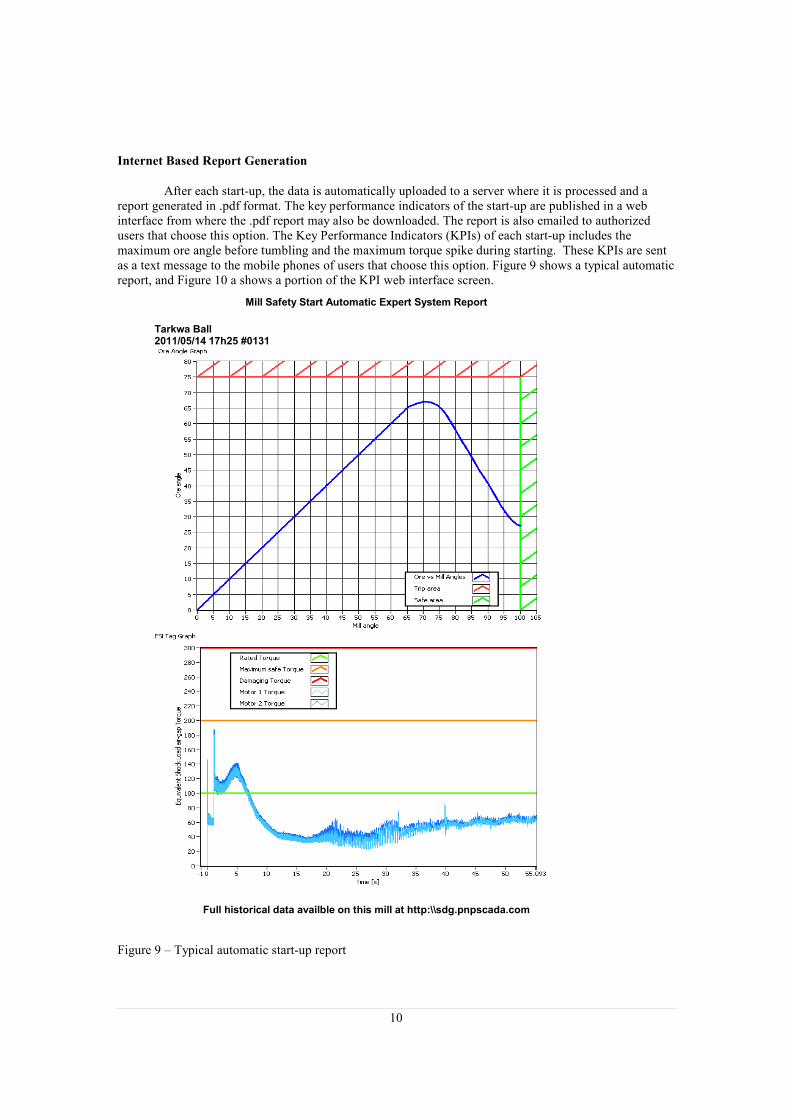
After each start-up, the data is automatically uploaded to a server where it is processed and a report generated in .pdf format. The key performance indicators of the start-up are published in a web interface from where the .pdf report may also be downloaded. The report is also emailed to authorized users that choose this option. The Key Performance Indicators (KPIs) of each start-up includes the maximum ore angle before tumbling and the maximum torque spike during starting. These KPIs are sent as a text message to the mobile phones of users that choose this option. Figure 9 shows a typical automatic report, and Figure 10 a shows a portion of the KPI web interface screen. Figure 9 – Typical automatic start-up report
Mill Safety Start Automatic Expert System Report
Tarkwa Ball 2011/05/14 17h25 #0131
Full historical data availble on this mill at http:\\sdg.pnpscada.com

11
Figure 10 – KPI web interface screen

12
CONDITION MONITORING FROM ROTOR CURRENTS
As stated, torque trace of each start-up is calculated from the rotor currents. This enables comprehensive liquid resistance starter performance analysis, ensuring the early detection of liquid resistance starter problems. Corrective action can therefore be taken expediently to prevent damage to electric motors, gearboxes, pinion gears and girth gears.
LRS Arcing in Electrolyte
At Tarkwa, large current spikes were found on the ball mill motor rotors during some start-ups, as shown in Figure 11. The mill motors had previously suffered severe damage of the slip-ring surface which led to excessive brush wear and subsequent slip-ring flashing. The current spikes measured were large enough to cause damage to the slip-rings, and may have been the cause of these problems.
Figure 11 – Large rotor current spikes during start-up
4100A
4180A
4520A
-5920A
-4880A
-7462A
MOTOR 2
MOTOR 1
-5370A
-3800A

13
The current spikes were attributed to arcing inside the electrolyte when the LRS electrodes came too close to each other too quickly, and slowing down the electrode movement easily eliminated this. The electrolyte strength was also recalculated based on these results.
LRS Underperforming
Damang, situated close to Tarkwa in Ghana, also ordered a LCPR system after the success at Tarkwa. Large torque spikes of up to 429% of rated torque were found at the end of the start-up sequence. The mills were previously experiencing periodic gearbox damage. Torque spikes like these are severe enough to cause mechanical damage, so it is likely that the damage was caused by these torque spikes. The torque spikes were attributed to insufficient turn-down ratio of the LRS. This means that the LRS resistance did not fall low enough at the end of the start-up sequence. The LRS was therefore unable to bring the motor close enough to the running speed, resulting in a sudden speed increase with associated high torque when the LRS was shorted out at the end of the start-up sequence.
Refurbishing the existing LRS’s with bigger electrodes eliminated the torque spikes. Figure 12
shows the torque traces before and after the problem was detected and rectified.
Fig 12. Torque trace calculated from rotor currents on Damang Ball mill before and after remedial
action was taken.
14
Trip on Unbalance Torque
The Tarkwa SAG mill incorporates shear pin couplings to protect the drive train against mechanical torque spikes. This presents the problem that when one pin has sheared, the mill will continue to start from only one motor. This stresses the remaining drive train before the motor eventually trips on overload. The mill motor protection relays were set to trip the mill on undercurrent, which then trips the mill when one of the motor load falls away, but this was found to be unsatisfactory under certain conditions.
The ideal solution would be to incorporate the shear pin coupling protection into the Mill Safe Start, as it monitors the rotor currents and therefore the torque on both motors. This makes it simple to detect a difference in torque of the two motors, and trip when one of the two shear pin couplings shears. This functionality is currently being incorporated into the LCPR.
CONCLUSION
A system was presented that addresses some of the major risk areas that have caused premature mechanical and electrical failure of large geared grinding mills, simply by mathematical processing of the motor rotor currents. These include protection against locked charge incidents and detection and measurement of torque transients during start-up, enabling corrective action to be taken expediently to pre-empt electrical and mechanical damage.
ACKNOWLEDGEMENTS
The authors would like to thank everyone who has made a contribution to this work, from its inception to the successful procurement and commissioning of the Tarkwa systems.
REFERENCES
Frank, W.D. (1997). Don’t drop that charge! Metals, Mining & More, 1/97, 1-2. Erlangen, Germany: Siemens. Svalbonas, V. (2002). The Design of Grinding Mills. Mineral Processing Plant Design, Practice, and Control Proceedings, (p.846). Society for Mining, Metallurgy, and Exploration, Inc. Vanderbeek, J.L. (2004). State of the SAG. In E.C.Dowling Jr. & J.I.Marsden(Eds.), Improving and Optimizing Operations: Things that actually work!, Plant Operators’ Forum 2004 (pp.141).Littleton, CO: Society for Mining, Metallurgy, and Exploration, Inc.