new large class pedagogy: developing students’ whole brain thinking skills
TRANSCRIPT

Available online at www.sciencedirect.com
1877–0428 © 2011 Published by Elsevier Ltd.doi:10.1016/j.sbspro.2011.03.116
Procedia Social and Behavioral Sciences 15 (2011) 426–435
WCES-2011
New large class pedagogy: developing students’ whole brain thinking skills
Ingrid le Rouxa *aDepartment of Business Management, University of Pretoria, Pretoria, South Africa
Abstract
In an attempt to involve all students in a large first year class an array of activities were administered. A whole-brain thinking model was used as a framework to analyse how students perceive their current thinking preferences. The rational of using different thinking preferences is explained, discussing the whole brain model as well as the activities associated with each preference. Typical learning activities for each preference are also explored. A mixed methodology was used. The results report patterns between approaches and thinking preferences through factor analysis and a Duncan Critical range test.© 2011 Published by Elsevier Ltd.
Keywords: Teaching and learning, Whole brain technology, thinking preferences.
1. Introduction
We are living in rapid changing times and the ability of students in general and first year students in particular to cope with the way higher education is conducted, often in very large classes, force us as educators to relook the way we teach our students. It is known that Albert Einstein was passionate about the need to celebrate the unique differences that exist in all of us including the different ways we all think and learn. He saw it as something to be welcomed and to be celebrated (Leaf, 2005). Lecturers’ need to change their own way of thinking about teaching in order to include the unique differences of our students in an attempt to prepare all students as they progress with their studies not only to pass but also to be able to cope with the pressures of the world of work. Alligning teaching and learning with the practical world of work during the duration of the students’ time spend in a Higher Education institution will ensure that skills received are aligned to the exit-level outcomes required for successfully responding to the fast changing needs of the business world.
This paper focuses on Accounting as well as Investment Management students in the faculty of Economic and Management Sciences. It is however evident that in many large classes, the outdated school pedagogy of passive learning, memorisation and regurgitating of content continues and is often the known method of doing and also an easy way out. It is known that the sheer number of students in large classes limits the lecturer’s ability to implement discussion and the physical distance from the lecturer impedes on personalised and engaging experiences (Messineo, Gaither & Ritchey, 2007).
The paper addresses the problem of outdated, ineffective teaching and learning interventions in very large first-year University classes. A variety of teaching interventions and activities were included in an attempt to engage all students by providing them with an array of activities to address a whole brain perspective to learning and teaching. In the current fast changing business world, students should be equiped with all the possible knowledge and experience to deal with people, the fast changing technological environment and be able to make decisions that suit

Ingrid le Roux / Procedia Social and Behavioral Sciences 15 (2011) 426–435 427
the situation. The task at hand requires an expanded mind and diversity of thinking and the result, a higher return on your human-capital investment (De Ridder & Wilcox, 1999). “Clearly, humans have the capacity to move beyond what currently exists in order to generate and implement new ideas (Ward, 2004)”.
2. Reasoning behind the research
Many of our students enter university with limited learning and critical thinking skills, characterised by memorisation. This may be the result of a schooling system where a strong focus is placed on passing the exit level examination. Many students also seem to have limited abilities to use web technologies when they start the academic year due to a large disparity between backgrounds. The expectations of students seems to focus on the outdated way of summarising and memorising the course content while studying on their own.
Due to the large class size of the first year Business Management course of the University of Pretoria, attendance of lectures, motivation for the course, interest in general and pass rates were lower than desired compared to previous years. Teaching large classes is more an art and a craft than a science, with its own tricks and shortcuts. It should be run as a small business with thousands of paying customers (Heppner, 2007). According to Messineo et al (2007), instructors of larger classes find these classes especially challenging, especially in an attempt to identify and address the varied needs and preferences of an increasingly diverse student population. The Business Management course used in this research is an introductory course and, although the majority of students are Accounting and Investment Management students, about 13% of students are from two other faculties on campus. This leads to a situation of students with diverse backgrounds, motivation levels, interests and career aspiration.
3. Research Problem
Many students do not attend classes after the first few weeks of a semester because the way lecturers present the content of the course does not necessarily address their preferred way of acquiring and assimilating knowledge. Ivanova and Ivanova (2009) also arqued that if we want to understand our future students better, we have to know their preferences and expectations. Addressing the diverse thinking needs in a class using whole brain technology helps us to include innovative ways to fascilitate, accommodate and develop students to better understand themselves and deal with the world of work.
Enhancing student involvement through a variety of teaching methods and learning activities may help to to address individual thinking preferences and also develop the areas of low preference. The moving away from a predictable traditional monologue in large classes may raise their curiosty (Boice, 1996) and hopefully improve class attendance.
4. Literature Review
4.1. Application of whole brain technology
Our thinking preferences characterise our approaches to problem solving. All people are different and use their own particular approaches based on successful experiences. Being aware of your own and other people’s way of thinking and assimilating of information on which they take decisions, are not only benefiting the venture, but also society at large (Lumsdaine & Lumsdaine, 1995; Lumsdaine & Binks, 2003). For this research whole brain technology was used, which according to Herman 1998, provides a basis for measuring different preferences by determining the degree of dominance that has developed among the four thinking structures of the brain (see Figure I).
In order to follow the thinking of the paper an explanation of the theory behind whole brain technology is necessary. In the early 1980’s Ned Herrman proposed a model to explain how the brain works: how it thinks, learns, solves problems, communicates, etc. Robert Sperry (Nobel price winner in 1981) showed that the left and right brain hemispheres of the brain do different tasks and Maclean’s showed that the cerebral system, limbic system and the brain stem do different thinking – reason, emotions, autonomic functions ( Herrmann, 1998). Herrmann combined the Sperry left – right and Maclean cerebral-limbic models into the whole-brain model with four “thinking” areas of the brain because they have neural cortices (areas shown to be involved in thinking). The A & D quadrants of the

428 Ingrid le Roux / Procedia Social and Behavioral Sciences 15 (2011) 426–435
model represents cerebral thinking and B & C represents emotional or visceral thinking. Descriptors used by Sperry and others to decribe left and right-brain thinking are respectively “A” – “B” and “C” – “D” (De Ridder & Wilcox, 1999 and Herrmann, 1998), (See Figure I). The discussion of the characterictic of the different quadrants that follows, may help clarify uncertainties.
Figure I Ned Herrman’s Whole brain Model (Herrmann, 1998)
The characteristics of the four quadrants model can be summarised as follow: Characteristics of quadrant A: Quadrant A thinking is analytical, technical, precise, logical, rational,
critical and deals with data analysis, risk assessments, financial budgets as well as with analytical problem solving and making of decisions based on logical reasoning. These thinkers often choose to be engineers, accountants, analysts, actuaries and surgeons. They often talk about the “bottom line”, “getting facts” and “critical analysis” (Lumsdaine & Lumsdaine, 1995 and Lumsdaine & Binks, 2004).
Characteristics of quadrant B: Quadrant B thinking is organised, sequential, controlled, planned, conservative, structured, detailed and scheduled as well as administration, procedures and maintaining the status quo. These thinkers often choose to be planners, administrators and bookkeepers. People dominant in quadrant B talk about “law and order”, “keeping the status quo” and “playing it safe” (Lumsdaine & Lumsdaine, 1995 and Lumsdaine & Binks, 2004).
Characteristics of quadrant C: Quadrant C thinking is sensory, emotional, people-oriented as well as spiritual values, teamwork, personal relationships, nuturing and communication. These thinkers often choose to be teachers, trainers, social workers and nurses. They talk about “the family”, “the team”, “persoanl growth” and “values” (Lumsdaine & Lumsdaine, 1995 and Lumsdaine & Binks, 2004).
Characteristics of quadrant D: Quadrant D thinking is visual, holistic, creative, integrative , conceptual and intuitive as well as explorative, entrepreneurial and future-oriented. These thinkers often choose design, art, architecture and geometry as career options. They talk about the “big picture”, “cutting edge” and “playing with ideas” (Lumsdaine & Lumsdaine, 1995 and Lumsdaine & Binks, 2004).
It is however important to remember that although an individual may favour cognitive activities associated with specific quadrants, both the left and right brain hemispheres of the brain contribute to everything, but they contribute in a different way. Each quadrant is different, but equal in importance (De Boer, Bothma & du Toit, Unpublished). Herrmann (1995) stated that fortunately we are not linked to a single perspective but hard wired to be “whole brained”.
The Herrmann Brain Dominance Instrument (HBDI) is an application of the Whole Brain Technology. The HBDI is capable of measuring the degree of preference between each of the four individual thinking structures (quadrants) and each of the four paired structures (modes), (Herrmann, 1998). If the proper 120-question survey instrument is used, the applicant would receive a four-quadrant profile, which displays the degree of preference for each of the four quadrants (see Figure II for an example of a HBDI profile).
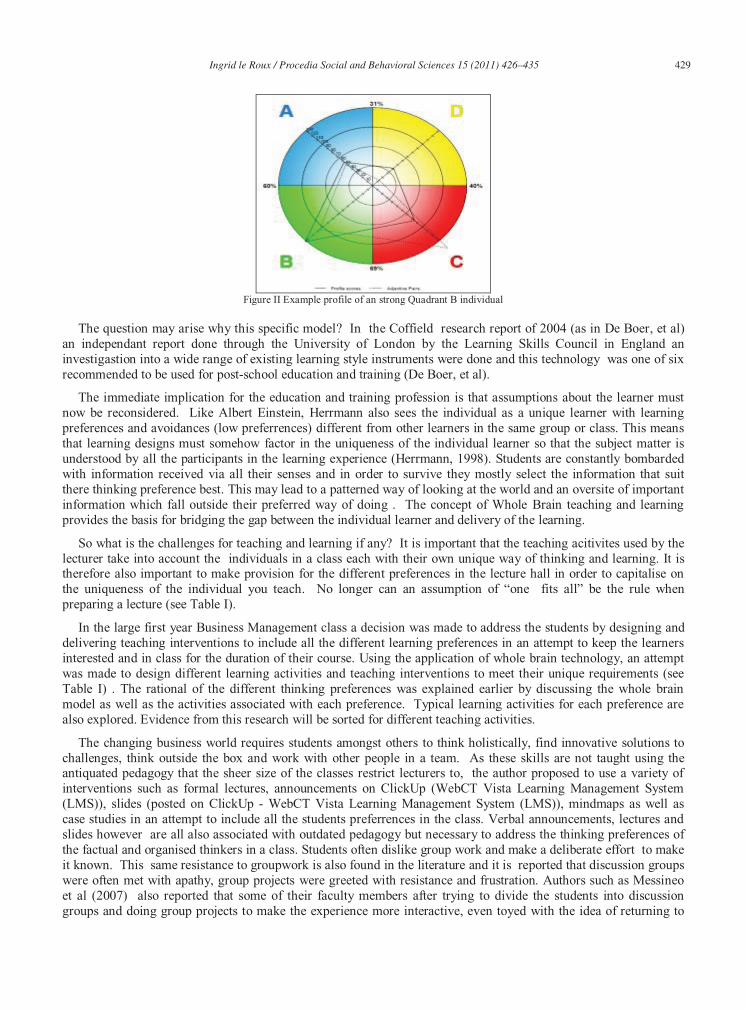
Ingrid le Roux / Procedia Social and Behavioral Sciences 15 (2011) 426–435 429
Figure II Example profile of an strong Quadrant B individual
The question may arise why this specific model? In the Coffield research report of 2004 (as in De Boer, et al) an independant report done through the University of London by the Learning Skills Council in England an investigastion into a wide range of existing learning style instruments were done and this technology was one of six recommended to be used for post-school education and training (De Boer, et al).
The immediate implication for the education and training profession is that assumptions about the learner must now be reconsidered. Like Albert Einstein, Herrmann also sees the individual as a unique learner with learning preferences and avoidances (low preferrences) different from other learners in the same group or class. This means that learning designs must somehow factor in the uniqueness of the individual learner so that the subject matter is understood by all the participants in the learning experience (Herrmann, 1998). Students are constantly bombarded with information received via all their senses and in order to survive they mostly select the information that suit there thinking preference best. This may lead to a patterned way of looking at the world and an oversite of important information which fall outside their preferred way of doing . The concept of Whole Brain teaching and learning provides the basis for bridging the gap between the individual learner and delivery of the learning.
So what is the challenges for teaching and learning if any? It is important that the teaching acitivites used by the lecturer take into account the individuals in a class each with their own unique way of thinking and learning. It is therefore also important to make provision for the different preferences in the lecture hall in order to capitalise on the uniqueness of the individual you teach. No longer can an assumption of “one fits all” be the rule when preparing a lecture (see Table I).
In the large first year Business Management class a decision was made to address the students by designing and delivering teaching interventions to include all the different learning preferences in an attempt to keep the learners interested and in class for the duration of their course. Using the application of whole brain technology, an attempt was made to design different learning activities and teaching interventions to meet their unique requirements (see Table I) . The rational of the different thinking preferences was explained earlier by discussing the whole brain model as well as the activities associated with each preference. Typical learning activities for each preference are also explored. Evidence from this research will be sorted for different teaching activities.
The changing business world requires students amongst others to think holistically, find innovative solutions to challenges, think outside the box and work with other people in a team. As these skills are not taught using the antiquated pedagogy that the sheer size of the classes restrict lecturers to, the author proposed to use a variety of interventions such as formal lectures, announcements on ClickUp (WebCT Vista Learning Management System (LMS)), slides (posted on ClickUp - WebCT Vista Learning Management System (LMS)), mindmaps as well as case studies in an attempt to include all the students preferrences in the class. Verbal announcements, lectures and slides however are all also associated with outdated pedagogy but necessary to address the thinking preferences of the factual and organised thinkers in a class. Students often dislike group work and make a deliberate effort to make it known. This same resistance to groupwork is also found in the literature and it is reported that discussion groups were often met with apathy, group projects were greeted with resistance and frustration. Authors such as Messineo et al (2007) also reported that some of their faculty members after trying to divide the students into discussion groups and doing group projects to make the experience more interactive, even toyed with the idea of returning to
430 Ingrid le Roux / Procedia Social and Behavioral Sciences 15 (2011) 426–435
the outdated pedagogy of the test and lecture format that students appeared to prefer. The reason why some students dislike working with others are often the result of a preferred way of thinking and assimilating information. Using the research om whole brain technology gives a valuable opportunity to explain why they dislike group activities but also to explain why it is a valuable exercise to engage in.
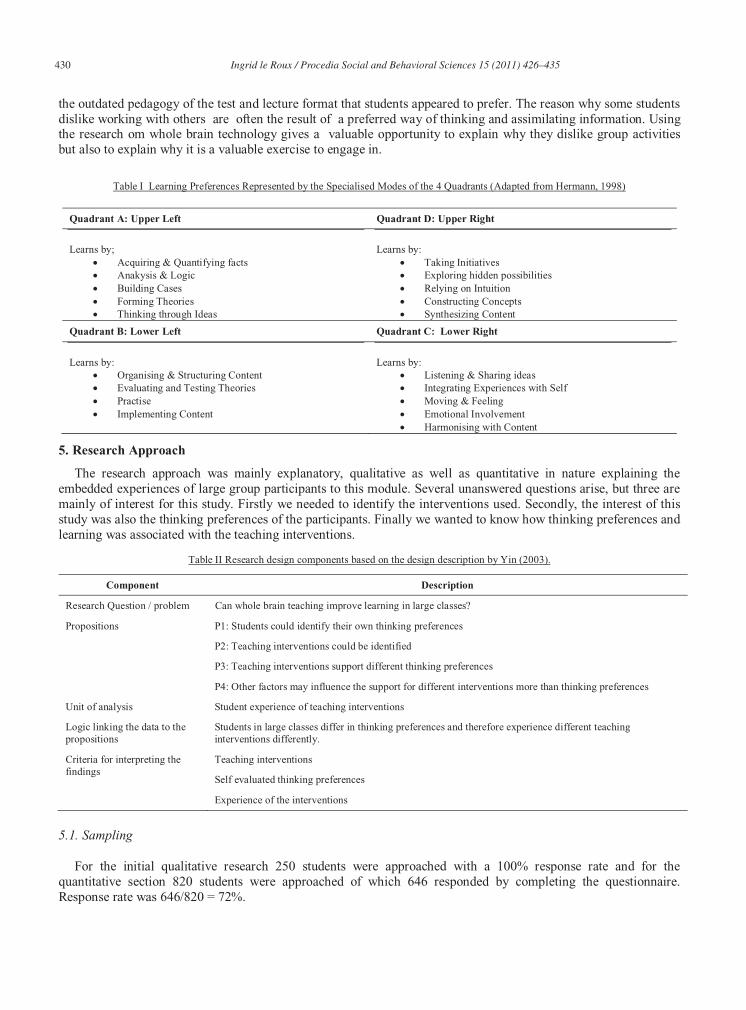
Table I Learning Preferences Represented by the Specialised Modes of the 4 Quadrants (Adapted from Hermann, 1998)
Quadrant A: Upper Left Quadrant D: Upper Right
Learns by;Acquiring & Quantifying facts Anakysis & Logic Building Cases Forming Theories Thinking through Ideas
Learns by:Taking Initiatives Exploring hidden possibilities Relying on Intuition Constructing Concepts Synthesizing Content
Quadrant B: Lower Left Quadrant C: Lower Right
Learns by:Organising & Structuring Content Evaluating and Testing Theories Practise Implementing Content
Learns by:Listening & Sharing ideas Integrating Experiences with Self Moving & Feeling Emotional Involvement Harmonising with Content
5. Research Approach
The research approach was mainly explanatory, qualitative as well as quantitative in nature explaining the embedded experiences of large group participants to this module. Several unanswered questions arise, but three are mainly of interest for this study. Firstly we needed to identify the interventions used. Secondly, the interest of this study was also the thinking preferences of the participants. Finally we wanted to know how thinking preferences and learning was associated with the teaching interventions.
Table II Research design components based on the design description by Yin (2003).
Component Description
Research Question / problem Can whole brain teaching improve learning in large classes?
Propositions P1: Students could identify their own thinking preferences
P2: Teaching interventions could be identified
P3: Teaching interventions support different thinking preferences
P4: Other factors may influence the support for different interventions more than thinking preferences
Unit of analysis Student experience of teaching interventions
Logic linking the data to the propositions
Students in large classes differ in thinking preferences and therefore experience different teaching interventions differently.
Criteria for interpreting the findings
Teaching interventions
Self evaluated thinking preferences
Experience of the interventions
5.1. Sampling
For the initial qualitative research 250 students were approached with a 100% response rate and for the quantitative section 820 students were approached of which 646 responded by completing the questionnaire. Response rate was 646/820 = 72%.
Ingrid le Roux / Procedia Social and Behavioral Sciences 15 (2011) 426–435 431
5.2. Data Collection
The phenomena investigated involved the students, their thinking, participation and experiences of the different interventions during the module. The main sources of evidence were then explored as follows:
Firstly a short questionnaire with open ended questions were distributed to invite the thinking of respondents on their preferred way of learning; Secondly a basic questionnaire to measure the self evaluation of the thinking preferences were done by administering selected items from the HBDI instrument; Thirdly lectures were augmented with online and group activites using the WebCT Vista Learning Management System (LMS) in a blended learning mode; Fourthly a full questionnaire evaluating the course approaches used and the respondent experiences thereof.
6. Key Findings
The respondents reported on their own learning styles as described in Table III.
Table III: Self declared preferred (liked and disliked) way of learning as reported by respondents.
Learning activity you find easy or like and is seen as your preferred way of learning
Self studyMaking summaries or mindmapsfor memorisation
On my own at home in silence for easy memorisation
Working through old papersoralone or in groups
Total
Number (%) 42 (16.8%) 72 (28.8%) 118 (47.2%) 18 (7.2%) 250
Learning activity /activities you find difficult or dislike
Working in groups doing projects in groups
Essay type questions, comprehension tests, assignments & presentations
Anything with numbers, maths & mindmaps
Research topics in books & websites
Number (%) 155 (62%) 42 (16.8%) 32 (12.8%) 21 (8.4%) 250
Table III shows that the pre-course questionnaire identified a wide range of learning styles. reported by respondents. Many students reported a dislike for working in groups (62%) and many preferred to working on their own making summaries for memorisation. For 72% of the respondents a memorisation style of learning that did not involve critical thinking was mentioned as the preferred way of doing.
Table IV shows that the majority of respondents identified themselves as A and B quadrant dominant (left-brain) thinking that totalled over 77%. Normal population distribution shows equal distribution between the four quadrants. The distribution found in this sample however appears accurate as the typical accountancy and financial major would have a preference for factual and procedural information and therefore shows an accurate application within this specific sample. Students majors were distributed as 86.9% for accounting and finance while social science and tourism students were 13.1% of the sample.
Table IV Distribution of self evaluated thinking preferences of respondents.
Thinking preference Quadrant
A B C D Total
Observations 337 156 68 84 646
Percentage 52.7 24.3 10.5 13.0 100
The interventions were identified through an exploratory factor analysis using oblique rotation. Table V shows the interventions identified through this process with cronbach alphas all above 0.7 suggesting high intercorrelations between variables within factors.
432 Ingrid le Roux / Procedia Social and Behavioral Sciences 15 (2011) 426–435
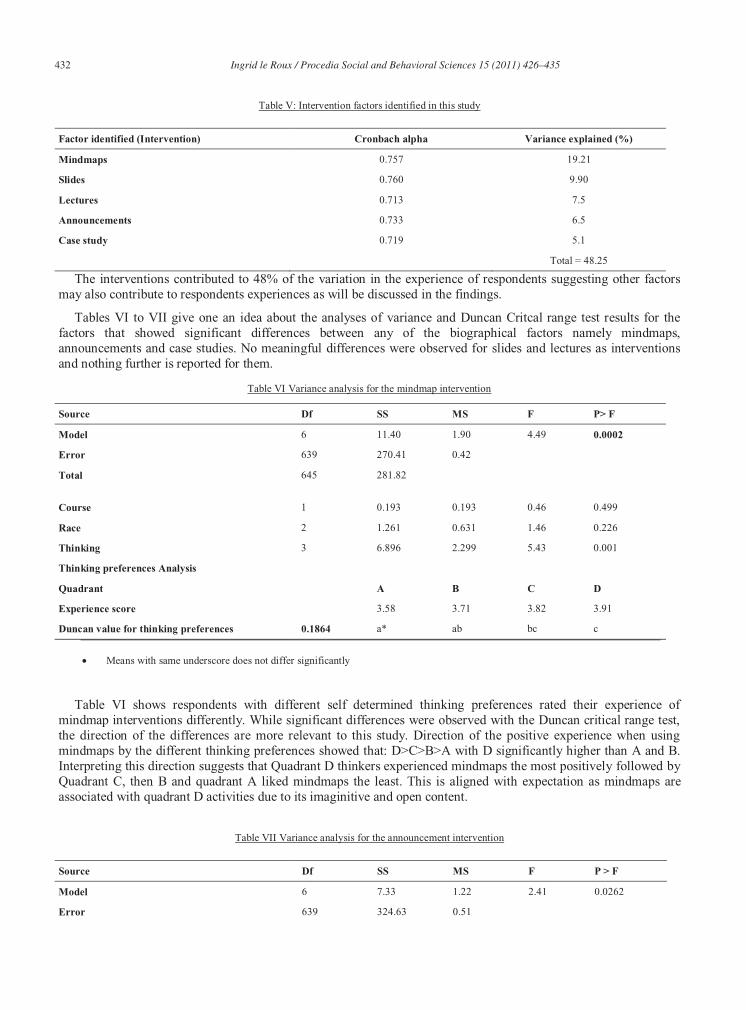
Table V: Intervention factors identified in this study
Factor identified (Intervention) Cronbach alpha Variance explained (%)
Mindmaps 0.757 19.21
Slides 0.760 9.90
Lectures 0.713 7.5
Announcements 0.733 6.5
Case study 0.719 5.1
Total = 48.25
The interventions contributed to 48% of the variation in the experience of respondents suggesting other factors may also contribute to respondents experiences as will be discussed in the findings.
Tables VI to VII give one an idea about the analyses of variance and Duncan Critcal range test results for the factors that showed significant differences between any of the biographical factors namely mindmaps, announcements and case studies. No meaningful differences were observed for slides and lectures as interventions and nothing further is reported for them.
Table VI Variance analysis for the mindmap intervention
Source Df SS MS F P> F
Model 6 11.40 1.90 4.49 0.0002
Error 639 270.41 0.42
Total 645 281.82
Course 1 0.193 0.193 0.46 0.499
Race 2 1.261 0.631 1.46 0.226
Thinking 3 6.896 2.299 5.43 0.001
Thinking preferences Analysis
Quadrant A B C D
Experience score 3.58 3.71 3.82 3.91
Duncan value for thinking preferences 0.1864 a* ab bc c
Means with same underscore does not differ significantly
Table VI shows respondents with different self determined thinking preferences rated their experience of mindmap interventions differently. While significant differences were observed with the Duncan critical range test, the direction of the differences are more relevant to this study. Direction of the positive experience when using mindmaps by the different thinking preferences showed that: D>C>B>A with D significantly higher than A and B. Interpreting this direction suggests that Quadrant D thinkers experienced mindmaps the most positively followed by Quadrant C, then B and quadrant A liked mindmaps the least. This is aligned with expectation as mindmaps are associated with quadrant D activities due to its imaginitive and open content.
Table VII Variance analysis for the announcement intervention
Source Df SS MS F P > F
Model 6 7.33 1.22 2.41 0.0262
Error 639 324.63 0.51
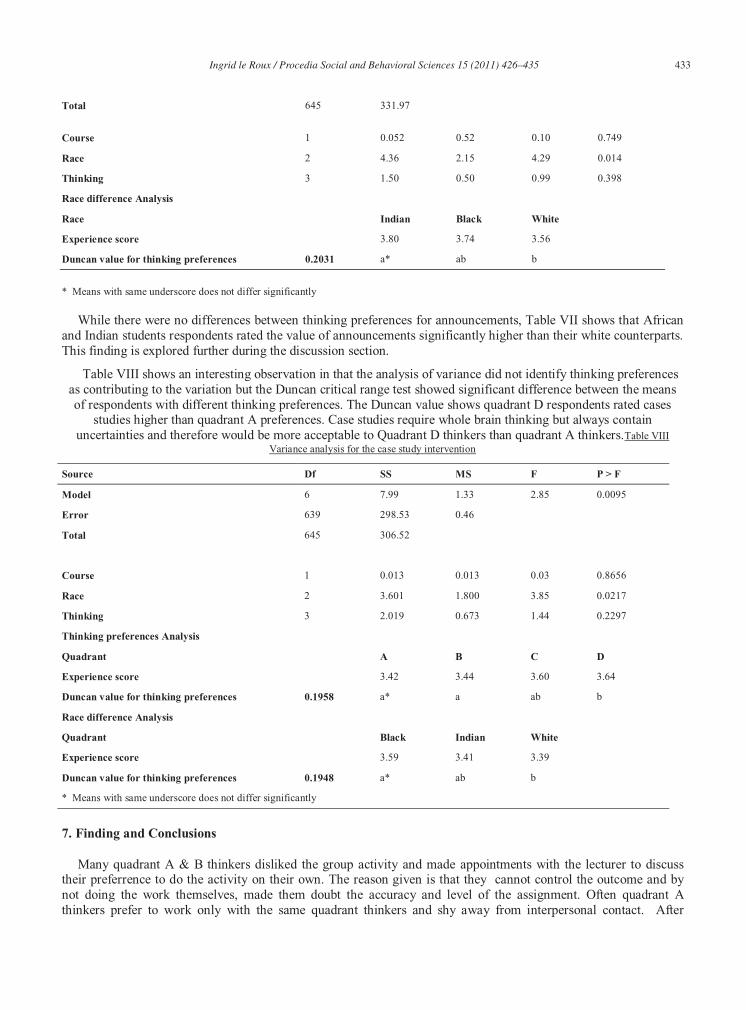
Ingrid le Roux / Procedia Social and Behavioral Sciences 15 (2011) 426–435 433
Total 645 331.97
Course 1 0.052 0.52 0.10 0.749
Race 2 4.36 2.15 4.29 0.014
Thinking 3 1.50 0.50 0.99 0.398
Race difference Analysis
Race Indian Black White
Experience score 3.80 3.74 3.56
Duncan value for thinking preferences 0.2031 a* ab b
* Means with same underscore does not differ significantly
While there were no differences between thinking preferences for announcements, Table VII shows that African and Indian students respondents rated the value of announcements significantly higher than their white counterparts. This finding is explored further during the discussion section.
Table VIII shows an interesting observation in that the analysis of variance did not identify thinking preferences as contributing to the variation but the Duncan critical range test showed significant difference between the means of respondents with different thinking preferences. The Duncan value shows quadrant D respondents rated cases
studies higher than quadrant A preferences. Case studies require whole brain thinking but always contain uncertainties and therefore would be more acceptable to Quadrant D thinkers than quadrant A thinkers.Table VIII
Variance analysis for the case study intervention
Source Df SS MS F P > F
Model 6 7.99 1.33 2.85 0.0095
Error 639 298.53 0.46
Total 645 306.52
Course 1 0.013 0.013 0.03 0.8656
Race 2 3.601 1.800 3.85 0.0217
Thinking 3 2.019 0.673 1.44 0.2297
Thinking preferences Analysis
Quadrant A B C D
Experience score 3.42 3.44 3.60 3.64
Duncan value for thinking preferences 0.1958 a* a ab b
Race difference Analysis
Quadrant Black Indian White
Experience score 3.59 3.41 3.39
Duncan value for thinking preferences 0.1948 a* ab b
* Means with same underscore does not differ significantly
7. Finding and Conclusions
Many quadrant A & B thinkers disliked the group activity and made appointments with the lecturer to discuss their preferrence to do the activity on their own. The reason given is that they cannot control the outcome and by not doing the work themselves, made them doubt the accuracy and level of the assignment. Often quadrant A thinkers prefer to work only with the same quadrant thinkers and shy away from interpersonal contact. After

434 Ingrid le Roux / Procedia Social and Behavioral Sciences 15 (2011) 426–435
explaining the value of groupwork using an integrated thinking approach, groupwork was preceived in a more positive light and done with more enthusiasm.
To discuss the findings, the propositions stated in Table I are revisited to evaluate whether the findings show support (or not) for each.
P1: Students could identify their own thinking preferences
Respondents appear to have identified their thinking preferences correctly despite not using the validated evaluation tool (HBDI instrument). Self evaluation is very difficult as less than 5% of individuals are single dominant. Double dominant individuals (38% of the population) and triple dominant individuals (54% of the population) have secondary and tertiary preferences that are often closely related to their dominant preference. The quadruple dominant (3%) individuals have an even harder time to this. While we found support for Proposition 1, it must be seen in the contexts of the above discussion.
Table II shows the distribution for the self evaluation of their thinking preferences. It is largely A & B quadrants that concures with whole brain technology suggesting a preference for factual, organised way of doing which is typically associated with the accounting and investment management professions. The observed bias for the A & B quadrants in the distribution appears to be validated by this.
P2: Teaching interventions could by identified
Sufficient support was found that the teaching interventions used could clearly be identified by the exploratory factor analysis as shown by the high Cronbach Alphas. Through factor analysis the interventions were identified as shown in Table III. Cronbach Alphas above 0.7 suggest high correlations between the elements of the factors. The five interventions also explained 48% of the variance and thus support proposition 2.
P3: Teaching interventions support different thinking preferences
The interventions identified could be motivated within the different quadrants by identifying a primary and secondary quadrant support for each as follows:
Lectures are focused to convey content through factual information and contextual information depending on the competence of the lecturer.Slides where bullet points are used to summarise the content supports factual information presented in a procedural way.Announcements use online technology to summarise all information discussed in class and support a procedural way of posting facts and process information. Mindmaps are a holistic way of integrating the factual content and is largely part of the imaginitive preference. Group work forces students to interact and work with other students who do not necessarily have the same preference for thinking as they have and was used to develop the mindmap activities. Groups were formed on ClickUp (LSM system) to avoid a stampede to the lecture’s door. Case studies were used where application of factual information is needed. This activity also requires contextual insight which forms part of holistically looking at a situation and is part of the need for imaginitive information.
Based on the model presented in Figure I and the points just mentioned, support was therefore found for proposition 3 because the dominance of the thinking preference for each of the interventions can clearly be seen.
P4: Other factors may influence the support for different interventions more than thinking preferencesOther factors than the thinking preferences can play a role such as race as well as the course that were indicated
as major by respondents. Indian and African students more than Whites have a preference for the use of announcements. Race in this study could be treated as a proxy for socio-cultural background suggesting mainly a difference in access to technology. However this needs to be investigated further.
When we look at Table VI it is also seen that African respondents enjoyed case studies more than Indians and Whites. This should also be investigated to determine what other factors may play a role. It is known that case
Ingrid le Roux / Procedia Social and Behavioral Sciences 15 (2011) 426–435 435
studies are widely used in post graduate courses and MBA’s because of it’s holistic view of a situation. If we look at the above mentioned, then it is concluded that support was found for proposition 4.
8. Researchers Observations
The researcher’s personal observations on the outcome are also reported, her expectations in general as well as the reality of large classes:
Class attendance and pass rates improved significantly from the previous year; Online communication increased from the previous year and can be associated with the new online approach to teaching due to the different course activities; We can confidently recommend which teaching activities are successful in stimulating whole-brain thinking in first year students in very large classes;However the demand on the course coordinators’ time due to the workload involved as well as the technical ability of assisting lecturers have a influence on the management style and ability of the course co ordinators.
9. Limitations of the study
The ideal situation would be to administer the HBDI assessment which is a scientic valiadated instrument. It is however expensive and not in the budget of the normal University student.
References
Boice Robert. 1996. First-Order Principles for College Teachers. Anker Publishing Company, Inc. ISBN 1-882982-12-6.
De Boer, A.L., Bothma T. && du Toit, P. Enhancing liertacy through the application of whole brain technology. Unpublished
De Ridder, C. G. & Wilcox, A. Mark. 1999. The Brain Connection. [email protected].
Heppner, Frank. 2007. Teaching the large College Class.A Guidebook for Instructors with Multitudes. John Jossy-Bass, A Wiley Imprint. ISNB-
13:987-0-470-18084-69 .
Herrmann, N. 1998. Measurement of Brain Dominance. An early version of this paper was delivered to the International Congress on Cerebral
Dominances. Munich. 62 – 70.
Hermann, N. 1998. The Theory Behind the HBDI and Whole Brain Technology. Unpublished.
Ivanova, A. & Ivanova, G. 2009. Net- Generation Learning Style – a Challenge for Higher Education. International Conference on Computer and
Technologies.
Leonar, D. & Straus, S. 1997. Putting Your Company’s Whole Brain to Work. Harvard Business Review. July – August 1997, Vol. 75, Issue 4.
Leafe, C. 2005. Switch on your Brain. Tafelberg Publishers. ISBN -13:978-0-624-04284-7
Lumsdaine, E. & Binks, 2003. M. Keep on moving! Entrepreneurial Creativity and Effective Problem Solving. The McGraw-Hill, Inc. ISBN 0-
07-284153-2.
Lumsdaine, E. &Lumsdaine, M. Creative problem Solving. Thinking skills for a Changing World. 1995. McGraw-Hill, Inc. ISBN 0-07-113478-
6.
Messineo, M., Gaither, J., Bott, J. & Ritchey, K. 2007. Inexperienced versus Experienced Students’ Expectations for Active learning in Large
Classes. Heldref Publications. Vol. 55/No. 3.
Zull, J. E. 2004. The Art of Changing the Brain. Educational leadership. September, 68 – 72.
Ward, T. E. 2004. Cognition, Creativity and Entrepreneurship. Journal of Business Venturing, 19, 173 -188.