new land-based method for surveying sandy shores and extracting dems: the inshore system
TRANSCRIPT
Environ Monit Assess (2011) 182:243–257DOI 10.1007/s10661-011-1873-5
New land-based method for surveying sandy shoresand extracting DEMs: the INSHORE system
Paulo Baptista · Telmo R. Cunha · Ana Matias · Cristina Gama ·Cristina Bernardes · Óscar Ferreira
Received: 18 April 2010 / Accepted: 18 January 2011 / Published online: 9 February 2011© Springer Science+Business Media B.V. 2011
Abstract The INSHORE system (INtegratedSystem for High Operational REsolution in shoremonitoring) is a land-base survey system designedand developed for the specific task of monitoringthe evolution in time of sandy shores. This systemwas developed with two main objectives: (1) toproduce highly accurate 3D coordinates of surfacepoints (in the order of 0.02 to 0.03 m); and (2)to be extremely efficient in surveying a beachstretch of several kilometres. Previous tests havedemonstrated that INSHORE systems fulfil such
P. Baptista (B) · C. BernardesDepartment of Geosciences, Centrefor Environmental and Marine Studies (CESAM),University of Aveiro, Campus Universitáriode Santiago, 3810-193, Aveiro, Portugale-mail: [email protected]
T. R. CunhaDepartment of Electronics, Telecommunications andInformatics, Institute of Telecommunications,University of Aveiro, Campus Universitário deSantiago, 3810-193, Aveiro, Portugal
A. Matias · Ó. FerreiraCIMA, Marine and Environmental Research Centre,University of Algarve, Edificio 7, Campus deGambelas, 8005-139, Faro, Portugal
C. GamaDepartment of Geosciences, Geophysics Centre ofEvora (CGE), University of Évora, R. RomãoRamalho 59, 7000-671, Evora, Portugal
objectives. Now, the usefulness of the INSHOREsystem as a survey tool for the production ofDigital Elevation Models (DEMs) of sandy shoresis demonstrated. For this purpose, the comparisonof DEMs obtained with the INSHORE systemand with other relevant survey techniques is pre-sented. This comparison focuses on the final DEMaccuracy and also on the survey efficiency andits impact on the costs associated with regularmonitoring programmes. The field survey methodof the INSHORE system, based on profile net-works, has a productivity of about 30 to 40 ha/h,depending on the beach surface characteristics.The final DEM precision, after interpolation ofthe global positioning system profile network, isapproximately 0.08 to 0.12 m (RMS), dependingon the profile network’s density. Thus, this is auseful method for 3D representation of sandyshore surfaces and can permit, after interpolation,reliable calculations of volume and other physicalparameters.
Keywords Topography · Total station ·Beach morphology · Beach volume
Introduction
To study processes that are related to storm im-pact, coastal erosion and morphodynamic charac-terisation, it is important to gather good-quality

244 Environ Monit Assess (2011) 182:243–257
sub-aerial topographic data of sandy shores. Of-ten, these studies are performed in scope of reg-ular monitoring programmes. Depending on theaim of each case study and on the spatial andtemporal scales involved, several techniques andsurvey methodologies are available, and these canbe divided into aerial- and terrestrial-based tech-niques. The ability of each technique to acquiredata in an efficient mode is important for generat-ing a morphological representation of the terrain.
Aerial survey techniques have developed sig-nificantly over the last decade and include air-borne laser scanning (ALS) with the capacity toproduce highly accurate Digital Elevation Models(DEMs) (e.g. Huising and Gomes Pereira 1998;Wehr and Lohr 1999; Krabill et al. 2000; Woolardand Colby 2002; Saye et al. 2005). The verticalaccuracy of the laser beam is better than 0.1 m(Petzold et al. 1999), which makes ALS well-suited for studying processes that occur over largespatial and/or temporal scales (e.g. coastline evo-lution or beach erosion/accretion responses).
It is also possible to generate DEMs of thecoastal surface based on airborne photogramme-try using sequential, overlapping, high-resolutionphotos (Anders and Byrnes 1991; Fletcher et al.2002). However, to achieve an accuracy of a fewcentimetres, coordinates are required for roughlysix ground points per photo. Using this method-ology for DEM generation is not practical be-cause the homogeneity of the sand surface causesdifficulty in selection of ground points.
On the other hand, sandy shore terrestrial-based research work is, since several decades,supported in many cases by discrete cross-shoreprofiles made at regular or irregular intervalsalong the beach using conventional, classical geo-detic surveying techniques (e.g. theodolites andtotal stations) (e.g. Emery 1961; Komar 1976;Forbes et al. 2004; Anfuso et al. 2007; Ciccacciet al. 2008; Reis and Gama 2010). Underfavourable conditions, punctual survey accuracyin the vertical component is typically a few cen-timetres (i.e. 0.02 to 0.05 m) (Livingstone et al.1999; Saye et al. 2005). Traditional profiling meth-ods (surveying of cross-shore transects) makesdifficult the extraction of a reliable DEM forstudying morphological features present in the
long-shore component, namely when macro-scales are considered. Examples of such featuresinclude sand bars and beach cusps.
More recently, the use of RTK-global position-ing system (GPS) or differential GPS (DGPS) wasintroduced for coastal studies (e.g. Morton et al.1993; Plant and Holman 1997; Jackson et al. 2005;Aagaard et al. 2005; Silva et al. 2007; Alcántara-Carrió and Fontán 2009). The most simple surveymethods involve collecting beach profiles by walk-ing with the GPS antenna mounted on a backpack(Dail et al. 2000). According to Ruggiero et al.(2005), the sum of the instrumental, calibrationand repeatability errors for this survey methodonly allows detection of beach elevation changesgreater than approximately 0.08 m, which is lessaccurate than standard terrestrial surveying usingclassical geodetic techniques.
Monitoring systems that use GPS receiversmounted onto vehicles permit surveying of widersandy shore areas with a dense profile networkand allow for subsequent construction of DEMs.The most simplified versions use one GPS an-tenna mounted to a four- or six-wheel-drive all-terrain vehicle (Morton et al. 1993; Plant andHolman 1997; Haxel and Holman 2004). Theefficiency of the mobile platform, however, isaffected by beach morphodynamic states and ishigher for dissipative (with more flatten surface),rather than reflective (with prominent slopes)beaches, according with the morphodynamiccharacterisation presented by Wright and Short(1984). Multi-antenna GPS systems mounted onall-terrain vehicles allow computation of the ve-hicle’s attitude (roll, pitch and heading angles),and these measurements can be used to deter-mine and compensate for vertical deviations ofthe GPS antennas caused by changes in beach’sslope (Groat 2000; List et al. 2006). However, inmulti-antennae GPS systems, the GPS antennaeare often directly mounted onto the vehicle struc-ture. This configuration is susceptible to sometuning errors due to calibration deficiencies in thesurvey system’s parameters and also to parame-ters variation during a single survey. For exam-ple, all-terrain vehicle systems use air-pressurisedtires and survey-to-survey differences in tire pres-sure can be of significant importance. Variations
Environ Monit Assess (2011) 182:243–257 245
in the soil’s resistance characteristics can alsoinfluence wheels penetration. These variationscan be significant along each cross-shore profilebecause of differences in sand moisture contentand compaction that are higher at the foreshorethan at the backshore. Even more significant isthe natural behaviour of the vehicle’s suspensionmechanism which, in response to terrain changes,imposes a significant variation on the distancefrom the chassis to the ground surface. As a conse-quence, Lancker et al. (2004) report that elevationdifferences smaller than 0.10 m should not beconsidered as significant when all-terrain vehiclesare utilised.
A new concept was developed for land-based,multi-antenna system that is adapted for mo-bile platforms, whose validation is presented byBaptista et al. (2010). This concept is basedin a previously developed multi-antenna system(Baptista et al. 2008) that account for the atti-tude of the structure holding the reference GPSantenna, by keeping the slope height of the an-tenna constant with respect to the ground. In thisstudy, the performance of the data acquisitionprocess of the prototype system was evaluatedwith the goal of generating a reliable DEM. First,the punctual accuracy of the prototype system wascompared to an independent technique, the totalstation-based survey. Such a test is mandatoryfor further analysis of DEMs generated by bothsurvey techniques. Next, the productivity and re-peatability of this methodology was evaluated forbeach profiling. Finally, the relationship betweenthe profile density and its spatial distribution wasexamined, accounting for changes in the beach’sslope. The precision of the generated DEM wascompared to a DEM generated using traditionaltotal station cross-shore profiles.
Material and methods
Prototype system
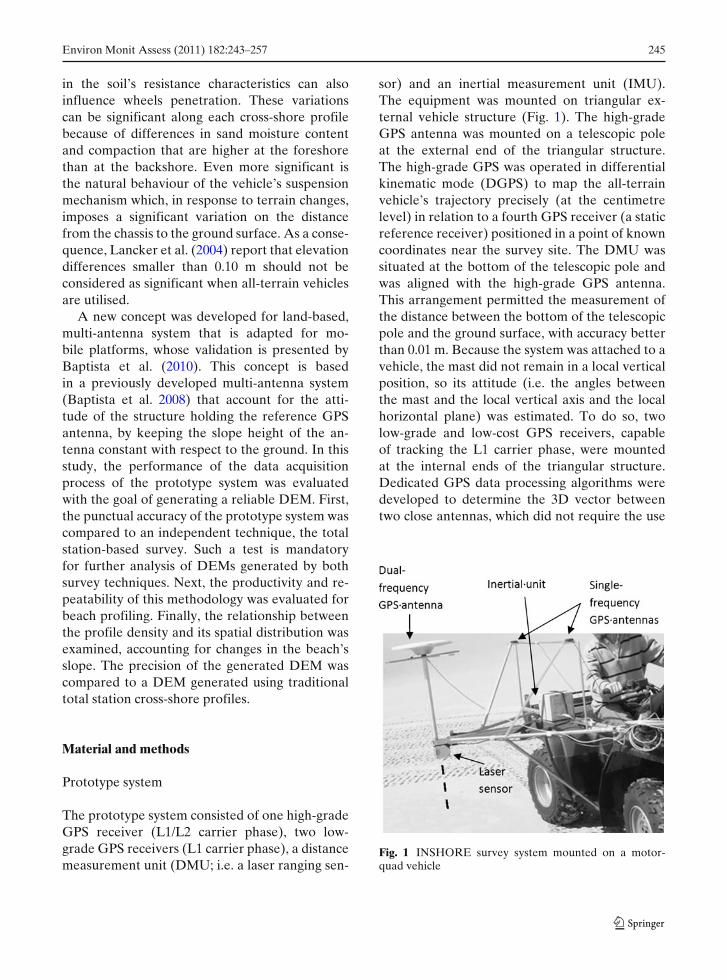
The prototype system consisted of one high-gradeGPS receiver (L1/L2 carrier phase), two low-grade GPS receivers (L1 carrier phase), a distancemeasurement unit (DMU; i.e. a laser ranging sen-
sor) and an inertial measurement unit (IMU).The equipment was mounted on triangular ex-ternal vehicle structure (Fig. 1). The high-gradeGPS antenna was mounted on a telescopic poleat the external end of the triangular structure.The high-grade GPS was operated in differentialkinematic mode (DGPS) to map the all-terrainvehicle’s trajectory precisely (at the centimetrelevel) in relation to a fourth GPS receiver (a staticreference receiver) positioned in a point of knowncoordinates near the survey site. The DMU wassituated at the bottom of the telescopic pole andwas aligned with the high-grade GPS antenna.This arrangement permitted the measurement ofthe distance between the bottom of the telescopicpole and the ground surface, with accuracy betterthan 0.01 m. Because the system was attached to avehicle, the mast did not remain in a local verticalposition, so its attitude (i.e. the angles betweenthe mast and the local vertical axis and the localhorizontal plane) was estimated. To do so, twolow-grade and low-cost GPS receivers, capableof tracking the L1 carrier phase, were mountedat the internal ends of the triangular structure.Dedicated GPS data processing algorithms weredeveloped to determine the 3D vector betweentwo close antennas, which did not require the use
Fig. 1 INSHORE survey system mounted on a motor-quad vehicle
246 Environ Monit Assess (2011) 182:243–257
of two high-grade dual-frequency receivers (whichare highly expensive). Using the known (fixed)geometry of all three GPS antennas (of the twolow-cost receivers plus that of the high-grade GPSreceiver in the outermost mast) it was possible todetermine the high-precision 3D vectors betweeneach antenna pair. The vectors were then mathe-matically transformed to determine an estimate ofthe telescopic pole orientation.
An inertial unit, with three accelerometers andthree gyroscopes displaced in three orthogonalaxes, was included for redundancy in the deter-mination of the structure attitude, contributingto a robustness increase. As the accelerometersand gyroscopes sense the instantaneous linear androtational accelerations of the platform through amechanism that is completely independent fromthat based on GPS measurements, the IMU datawas used to control the accuracy of the attituderesults obtained from the GPS data. This sig-nificantly improves the robustness of the overallsystem.
The data from all the sensors mounted on theplatform (except that of the high-grade receiverwhich has internal storage memory) are storedin a data-logger especially designed for this pur-pose. Furthermore, the storage equipment im-plemented a synchronisation mechanism whichmakes the stored data from all the sensors tobe referenced to the same time frame. This isfundamental to jointly processing the data of theinvolved sensors in order to determine with ac-curacy the coordinates of the ground points. Thetime frame used as reference was based on thesynchronisation signal (one pulse per second—1 PPS) send by one of the GPS receivers, whichwas then processed by the data-logger micro-controller.
The prototype system was named INSHORE(INtegrated System for High OperationalREsolution in shore monitoring) and wasmounted on the side of a four-wheel motor-quad.The system was attached to an extendible armwith a variable length ranging from 0.90 to 1.50 m.The survey system is adequate for surveyingbeach morphological features, such as berm crestsand the crestline of erosive scarps cut into thebeach berm, which are not directly accessible byother vehicle-based survey methods that do not
include a lateral extension arm (which places thereference point of measurement on the side of thevehicle, and not over it).
Prototype system accuracy and repeatability tests
The accuracy of the INSHORE system was eval-uated by comparison with an independent clas-sic geodetic survey technique based on totalstation observations. The system was tested ona reflective sandy shore (most demanding condi-tions). In addition to the overall accuracy of theINSHORE system, the system’s productivity wasalso evaluated by comparing the time required byeach technique to survey a sandy beach.
The test area was a sandy shore stretch thatwas 350 m long and about 80 m wide, situatedin Melides Beach into Tróia-Sines sandy embayedcoast (SW of Portugal). This is a reflective beachwith steep beach face slopes (7◦ < slope < 10◦).The textural parameters indicate the dominanceof medium very well-sorted sands (Gama 2005).The survey method used a traditional cross-shorebeach profiling, with profiles spaced at 40 m in-tervals. The total station was positioned on acoordinated benchmark, whose coordinates weredetermined using high-accuracy DGPS data ref-erenced to the Portuguese national geodetic net-work. The ellipsoidal heights in the WGS84datum were converted to elevations above meansea level. The measuring staff was always in-serted to a depth of 0.05 m. Nine cross-shoreprofiles, whose acquired points were used as con-trol points, were carried out to evaluate the ac-curacy in relation to the INSHORE system. Thetime required to execute this task was recorded.The nine profiles were repeated using theINSHORE prototype system, and the elapsedtime was also recorded. These profiles were gath-ered so that the point of incidence of the DMUbeam, which corresponds to the ground pointbeing coordinated, passed over the profiles us-ing the points previously determined by the to-tal station survey, as indicators of the trajectory.Two consecutive passages over the profiles wereperformed to guarantee INSHORE positions inthe vicinity of the previous total station controlpoints.

Environ Monit Assess (2011) 182:243–257 247
INSHORE system vertical accuracy was cal-culated by determining the altimetric differencesbetween the coordinate pairs generated by totalstation surveying (used as control points) andINSHORE surveying. All coordinate pairs withina pre-defined planimetric vicinity radius werecompared. The search radius was defined to0.30 m from each total station control point.Field observations suggested that search radiuslarger than 0.30 m were ineffective because theterrain’s topographic differences could mask theresults. Each method’s productivity was evaluatedby comparing the time required to complete eachbeach profiling (it should be mentioned that, dueto dedicated software applications, the time re-quired for processing the data gathered by theINSHORE system is negligible when compared tothe survey time).
A repeatability test was performed to deter-mine if there was an INSHORE system accuracydegradation caused by changes in the vehicle’svelocity. This test was performed by surveyingtwo parallel profiles using a separation of ap-proximately 3 m. Each profile was 500 m longand was surveyed twice. Surveys were performedat different velocities, and the altimetric differ-ences between each run over each profile weredetermined.
Base information density and generationof DEMs
According to profile density (number of profilesper area) and profile spatial distribution (loca-tion of profiles in a beach stretch) differences inmorphological surface representation and volumecomputed are expected in the generated DEM.Despite the differences in the methodological ap-proached, namely INSHORE system versus totalstation, the acquisition methods are certainly re-sponsible for differences in the generated DEMs.For the purposes of this work the total stationacquisition method was only based on cross-shoreprofiles, which agrees with the most of the sur-veys referenced in literature, while the DEMsgenerated from the INSHORE survey includeboth cross- and long-shore profiles. In both cases,the triangulated irregular network interpolationmethod (Lee and Schachter 1980; Guibas and
Stolfi 1985) was applied after defining a commonarea that included data from both survey methods.This analysis was performed in the same previ-ously mentioned sandy beach test zone.
For the total station cross-shore profiles twodensities were considered for DEM’s computa-tion. The lower density level includes five cross-shore profiles and the high-density level includesnine cross-shore profiles, 80 and 40 m spaced, re-spectively. For the INSHORE, three density lev-els were used for DEMs computation that besidesthe same nine cross-shore profiles previously men-tioned, also include the long-shore beach profiles.Different profile networks of lower, medium andhigh density were used on DEM’s generation forthe data collected by the INSHORE system. Itwas considered as lower-density profile, a networkthat includes nine cross-shore profiles and fourlong-shore profiles delineating the seaward limitof the emerged beach, the berm crest, the innerlimit of the berm and the foredune baseline. Themedium-density profile network includes six long-shore profiles that delineated the seaward beachlimit, the beach-cusps, the berm crest, the innerlimit of the berm, the inner berm and the foredunebaseline. It was considered a high-density networkthat includes a higher number of data both onthe cross- and long-shore directions, without beingonly attached to previously defined profiles.
The DEMs generated from the two densitylevels of cross-shore profiles (acquired by thetotal station) and from the three density levelsof cross- and long-shore profiles (acquired byINSHORE system) were analysed in what con-cerns the beach volume and morphological rep-resentation of beach features. With the goal toanalyse the DEM surface quality, generated byeach one of data sets acquired by total station andINSHORE system, it was used a set of 40 DGPScontrol points. The control points were located inareas far from the profiles and were not used inthe interpolation. These 40 points were acquiredin a fast-static procedure with L1/L2 ambiguityresolution, obtaining an accuracy in the order of1 cm for each point. For each measured controlpoint the differences in the vertical component(Z ) in relation to the respective DEM nodes weredetermined allowing estimate the DEM precision(root mean square (RMS)).
248 Environ Monit Assess (2011) 182:243–257
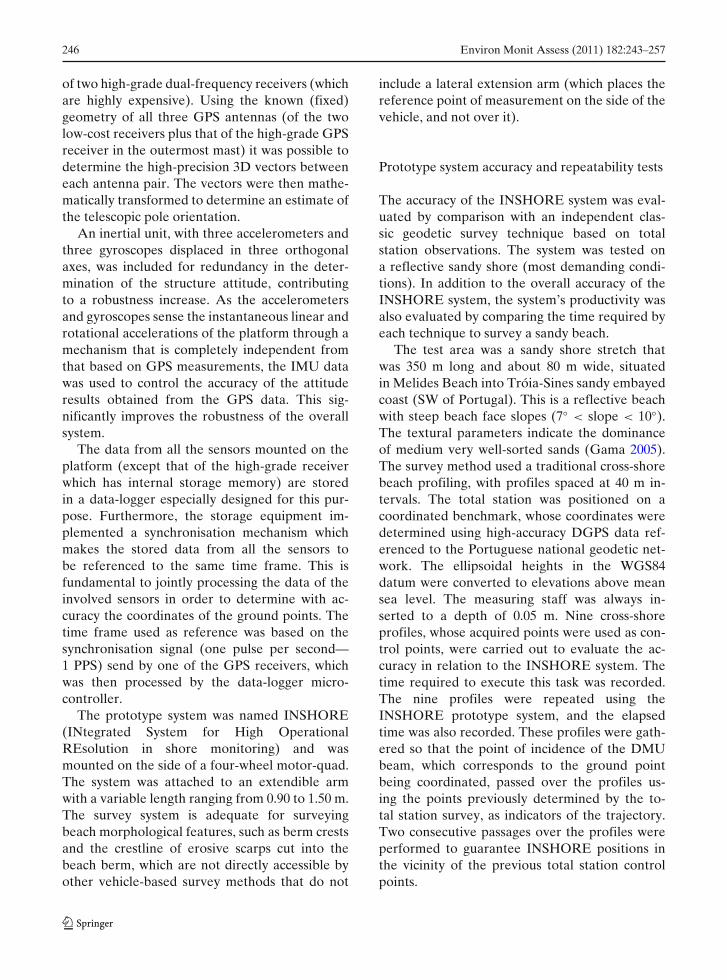
Fig. 2 Position ofsampling points surveyedwith the total station andthe INSHORE system
Results
Prototype system accuracy and repeatability tests
Since the INSHORE system was designed foruse on a mobile platform (here, a four-wheelmotor quad), it presented higher productivity indata acquisition. Cross-shore profiles (Fig. 2) weresurveyed for 60 min by the total station and for5 min by the INSHORE system. For the accuracytest, 160 points were positioned using the totalstation along the beach profiles, but only 120
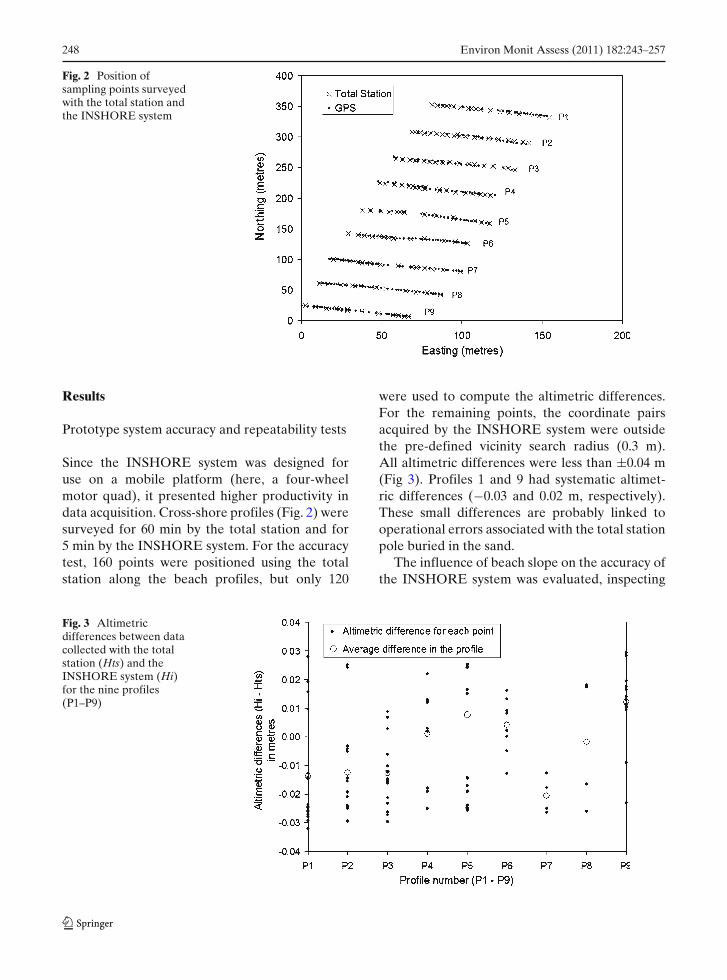
were used to compute the altimetric differences.For the remaining points, the coordinate pairsacquired by the INSHORE system were outsidethe pre-defined vicinity search radius (0.3 m).All altimetric differences were less than ±0.04 m(Fig 3). Profiles 1 and 9 had systematic altimet-ric differences (−0.03 and 0.02 m, respectively).These small differences are probably linked tooperational errors associated with the total stationpole buried in the sand.
The influence of beach slope on the accuracy ofthe INSHORE system was evaluated, inspecting
Fig. 3 Altimetricdifferences between datacollected with the totalstation (Hts) and theINSHORE system (Hi)for the nine profiles(P1–P9)
Environ Monit Assess (2011) 182:243–257 249
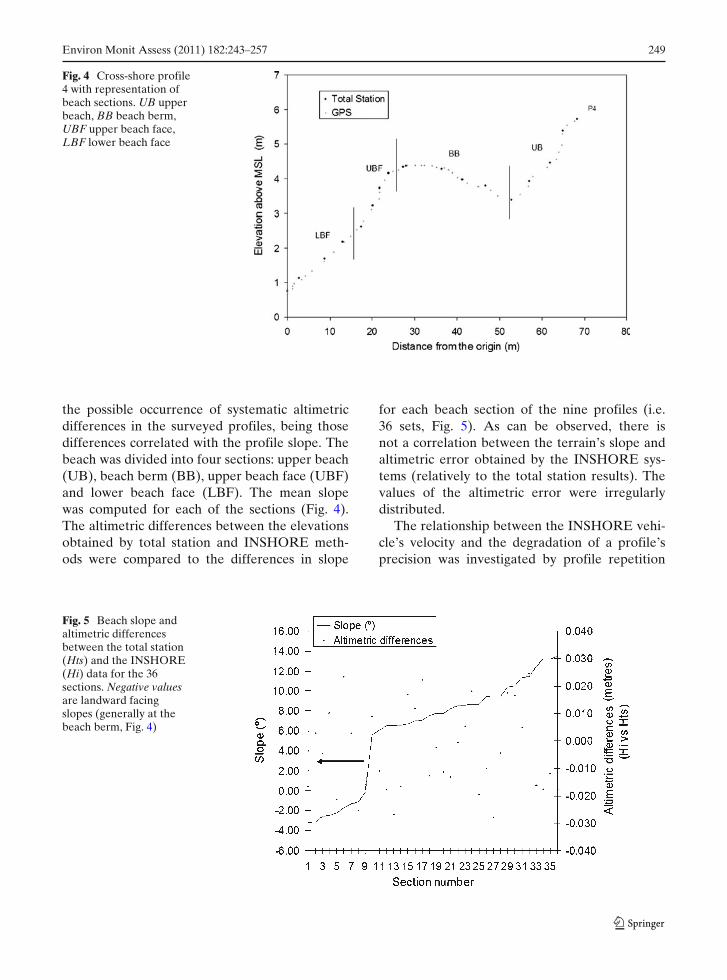
Fig. 4 Cross-shore profile4 with representation ofbeach sections. UB upperbeach, BB beach berm,UBF upper beach face,LBF lower beach face
the possible occurrence of systematic altimetricdifferences in the surveyed profiles, being thosedifferences correlated with the profile slope. Thebeach was divided into four sections: upper beach(UB), beach berm (BB), upper beach face (UBF)and lower beach face (LBF). The mean slopewas computed for each of the sections (Fig. 4).The altimetric differences between the elevationsobtained by total station and INSHORE meth-ods were compared to the differences in slope
for each beach section of the nine profiles (i.e.36 sets, Fig. 5). As can be observed, there isnot a correlation between the terrain’s slope andaltimetric error obtained by the INSHORE sys-tems (relatively to the total station results). Thevalues of the altimetric error were irregularlydistributed.
The relationship between the INSHORE vehi-cle’s velocity and the degradation of a profile’sprecision was investigated by profile repetition
Fig. 5 Beach slope andaltimetric differencesbetween the total station(Hts) and the INSHORE(Hi) data for the 36sections. Negative valuesare landward facingslopes (generally at thebeach berm, Fig. 4)
250 Environ Monit Assess (2011) 182:243–257
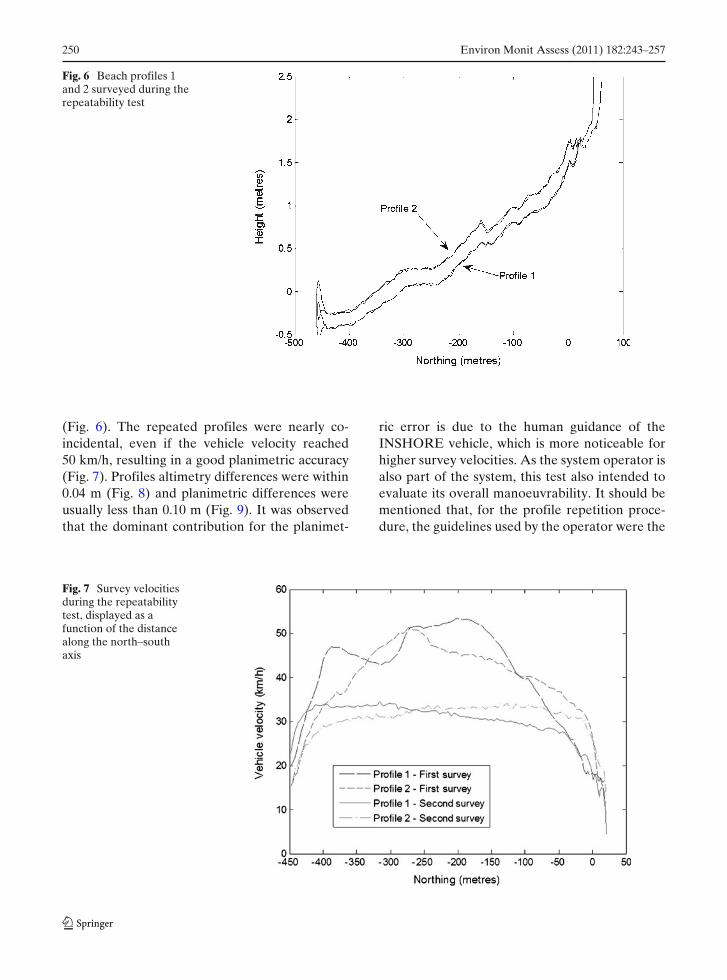
Fig. 6 Beach profiles 1and 2 surveyed during therepeatability test
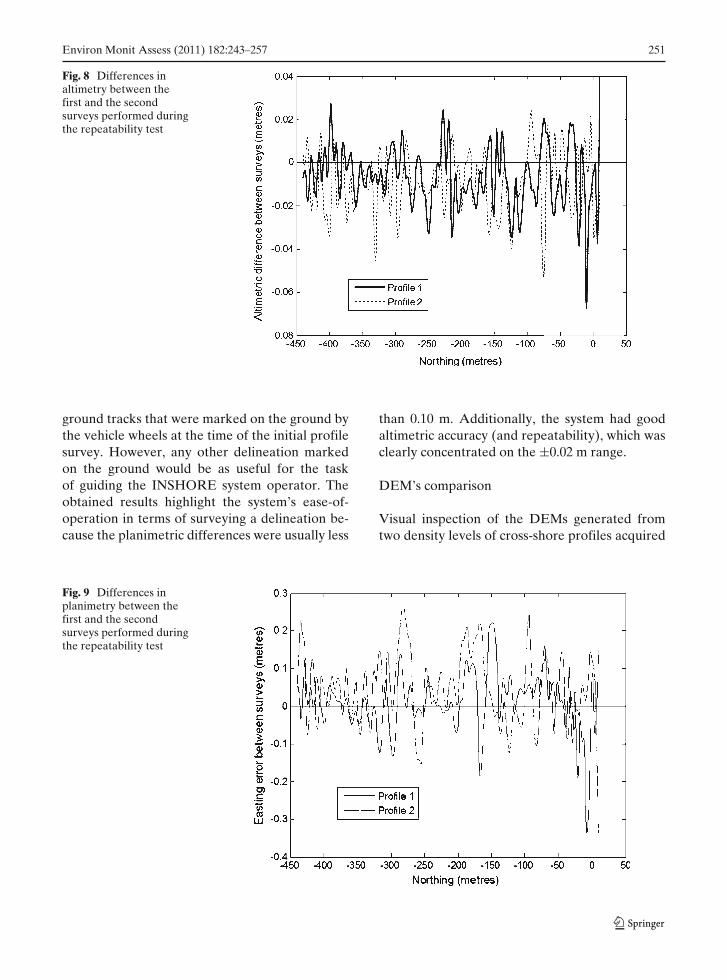
(Fig. 6). The repeated profiles were nearly co-incidental, even if the vehicle velocity reached50 km/h, resulting in a good planimetric accuracy(Fig. 7). Profiles altimetry differences were within0.04 m (Fig. 8) and planimetric differences wereusually less than 0.10 m (Fig. 9). It was observedthat the dominant contribution for the planimet-
ric error is due to the human guidance of theINSHORE vehicle, which is more noticeable forhigher survey velocities. As the system operator isalso part of the system, this test also intended toevaluate its overall manoeuvrability. It should bementioned that, for the profile repetition proce-dure, the guidelines used by the operator were the
Fig. 7 Survey velocitiesduring the repeatabilitytest, displayed as afunction of the distancealong the north–southaxis
Environ Monit Assess (2011) 182:243–257 251
Fig. 8 Differences inaltimetry between thefirst and the secondsurveys performed duringthe repeatability test
ground tracks that were marked on the ground bythe vehicle wheels at the time of the initial profilesurvey. However, any other delineation markedon the ground would be as useful for the taskof guiding the INSHORE system operator. Theobtained results highlight the system’s ease-of-operation in terms of surveying a delineation be-cause the planimetric differences were usually less
than 0.10 m. Additionally, the system had goodaltimetric accuracy (and repeatability), which wasclearly concentrated on the ±0.02 m range.
DEM’s comparison
Visual inspection of the DEMs generated fromtwo density levels of cross-shore profiles acquired
Fig. 9 Differences inplanimetry between thefirst and the secondsurveys performed duringthe repeatability test

252 Environ Monit Assess (2011) 182:243–257
Fig. 10 Cross-shorebeach profiles surveyedby total station and therespectivepost-interpolation DEMs.a DEM generated fromthe low-densitycross-shore profiles, withprofile pointssuperimposed (dottedlines); b DEM generatedfrom the high-densitycross-shore profiles, withprofile pointssuperimposed (dottedlines)
by total station does not detect significantdifferences resulting from distinct data density(Fig. 10). The interpolated surfaces highlight thesteep beach face, where linear contour lines haveheights changing from 0.5 to 3.5 m. In the back-shore, a new slope change is present and has con-
tour lines ranging from 4.5 to 6.5 m above meansea level. The volumetric difference betweenboth DEMs is about 800 m3 and corresponds toa mean altimetric difference of about 0.034 mbetween the two profiles sets used for DEMgeneration.
Fig. 11 Low-, mean- and high-density network profilessurveyed by the INSHORE system and their DEMs. aDEM generated from the low-density network, with net-work points superimposed (dotted lines); b DEM gen-
erated from the medium-density network, with networkpoints superimposed (dotted lines); c DEM generated frommedium-density network, with network points superim-posed (dotted lines)

Environ Monit Assess (2011) 182:243–257 253
Table 1 Computed results after interpolation of different network profiles
Technique Profile density (survey area with Interpolation results Mean elevation RMS altimetricapproximately 350 × 80 m) Volume (m3) difference between error to the
interpolated DEMs 40 controland reference DEM (m) points (m)
Total station Low-density level 93,600 −0.078 0.31(5 cross-shore profiles)
Total station High-density level 94,400 −0.047 0.22(9 cross-shore profiles)
INSHORE system Low-density network 96,700 0.043 0.17(9 cross-shore/4 long-shore profiles)
INSHORE system Medium-density network 95,200 −0.016 0.12(9 cross-shore/6 long-shore profiles)
INSHORE system High-density network 95,600 Reference DEM 0.08
RMS are related to ground control points located outside the surveyed profiles
DEMs generated from the three density levelsof cross- and long-shore profiles, acquired by theINSHORE system, make more evident the mor-phological representation of beach cusps (Fig. 11).After interpolation, the obtained DEMs from allnetworks verified that beach cusps were presenton the beach face. However, the DEM from thelower-density network only suggests the presenceof beach cusps, and a correct evaluation was notpossible either for the longitudinal variability ofthese rhythmic forms or for their physical parame-ters (e.g. wave length and amplitude). The DEMfrom the medium- and high-density network pro-vided a more detailed representation of the fore-shore and backshore morphologies. In these cases,the foreshore beach cusps were defined as rhyth-mic forms with a 35-m mean wave length and a3–5-m mean amplitude. The volumetric differencebetween calculated values for the lower- and high-density profile networks was about 1,100 m3,after grid interpolation and corresponds to analtimetric difference of about 0.04 m betweenthe interpolated surfaces. Table 1 presents a syn-thesis of the results obtained for DEMs gen-erated using several levels of network profiledensity.
In the present case study, the DEM qualitycontrol was performed by computing the altimet-ric differences between the height of 40 DGPSground control points and the DEM height atthese points. Because total station and INSHOREsystems have similar absolute positioning accu-
racy, the DEM precision after interpolation de-pends on profile density. The traditional cross-shore profiles, usually surveyed by theodolitesand total stations, are characterised by reducedDEM accuracy because of deficient spatial profilecoverage. Analysing the 40 control points, thecalculated DEM precision was 0.31 m (RMS)for the five cross-shore profile case and 0.22 m(RMS) for the nine cross-shore profile case. Forthe INSHORE system, the compared profiles hadan identical number of cross-shore profiles in thesame locations and had variable numbers of long-shore profiles. For these comparisons, the RMSvalues were between 0.08 and 0.17 m from high-to low-profile density case studies.
Discussion
The establishment of regular topographic moni-toring programmes using land-based survey sys-tems on sandy shores requires accurate, quick andefficient methodologies for DEM generation. Theperformance of a prototype system (INSHOREsystem) for surveying sandy shores was comparedto an independent classical technique, the totalstation. The comparison was performed by con-sidering the reliability of the final extracted DEM,taken into account the positioning accuracy andthe influence of profile network density on DEMprecision.

254 Environ Monit Assess (2011) 182:243–257
The INSHORE system has an average accu-racy better than 0.03 m in the vertical componentand such accuracy is independent of the terrainslope changes. Since the INSHORE survey systemworks in kinematic mode on a mobile platform,its productivity is 10 to 12 times better than thoseof the classical geodetic methodologies. Terraincoverage efficiency in beach profiling is anotherimportant aspect of survey method evaluation andis related to the number of positions recordedper unit of distance, along the profile. INSHOREsystem was designed to work at vehicle velocitiesup to 20 m/s with data acquisition rates up to10 Hz, without degradation of the survey accu-racy. Adjustment of the acquisition cadence canbe made to satisfy the survey’s requirements.
Because of the higher efficiency associated withthe platform’s mobility, the land-based platformpermitted better morphological coverage. Besidesthe traditional straight cross-shore profiles, thelong-shore profiles, if performed to assure a cor-rect delineation of the main slope changes alongthe beach, make the morphological representa-tion more reliable. The morphological study ofbeaches in the long-shore component with theinherent rhythmic forms is an important researchtopic, which has not been yet applied to spa-tial macro-scales mostly due to data acquisitiondifficulties at such scales. We propose a techniquethat makes this feasible at a very low cost due tothe simultaneous high efficiency and high accu-racy of the INSHORE system. However, as thissurvey system works as a land mobile platform,
such as a motor quad, some limitations in its usecan be mentioned, as is the case of its difficulties insurveying sandy beaches areas covered with rockyoutcrops or areas semi-covered with water duringlow tides, as can occur in some low-tide terraces.Limitations can also be in order in surveying ad-jacent sandy shore areas as dune fields for naturalenvironment preservation reasons.
Table 2 presents a synthesis of the productiv-ity and accuracy indicators determined for theINSHORE system, in relation to the indica-tors pertaining to other land-based or aerialtechnologies.
Two indices are considered for comparing theproductivity: the velocity of the land-based oraerial platform (in m/s) and the geographic areacovered by the survey (ha/h). An aerial mobileplatform such as ALS only requires one passageover the survey area to cover a littoral band thatis the width of the sub-aerial beach. When usinga land-based platform, like the INSHORE pro-totype system mounted on a four-wheel motor-quad, the data acquisition system implies a beachprofiling methodology. For this case, the produc-tivity is evaluated by examining the system’s ca-pacity to cover a specific area in a specific timeperiod using long-shore and cross-shore profilenetworks. On-foot methodologies, as is the to-tal station case with the traditional cross-shoreprofiling, has inherent limitations in beach survey.Consequently, the productivity indicators of thesethree techniques correspond to three distinct spa-tial scales for topographic surveys.
Table 2 Synthesis of the main accuracy and productivity indicators for several survey techniques aiming DEM generation
Technique Productivity Positioning accuracy DEM accuracy (after interpolation)Vertical Vertical (RMS)
Terrestrial based techniquesINSHORE system 10–20 m/s 0.02–0.03 m 0.08–0.12 ma
30–40 ha/hTotal station 3–4 ha/h 0.02–0.03 m 0.22–0.31 ma
Aerial-based techniquesAirborne laser scanningb 60–70 m/s 0.10 m 0.15–0.22 m
4,000–5,000 ha/haRange of values dependent on profile density, according to the beach morphological characteristics (as previous explainedin the text)bHuising and Gomes Pereira (1998), Wehr and Lohr (1999), Krabill et al. (2000), Woolard and Colby (2002) and Zhanget al. (2005)
Environ Monit Assess (2011) 182:243–257 255
The positioning accuracy, the final DEM ac-curacy and the costs are the three main as-pects that must be analysed in the comparison ofthe different techniques. In ALS, accuracy esti-mates are obtained by computing the RMS of thedifferences between reference and laser Z val-ues, taken as reference terrestrial measurementsacquired in the same period as the laser data(Huising and Gomes Pereira 1998). For aerialplatforms, the ALS includes a laser with accura-cies of approximately 0.010 m (Wehr and Lohr1999) for a flight altitude of 700 m. The finalDEM accuracy for this method is around 0.15–0.22 m (RMS) (Huising and Gomes Pereira 1998;Krabill et al. 2000; Woolard and Colby 2002). Inland-based survey methodologies, the INSHOREsystem provides DEMs accuracy around 0.08 and0.12 m according with the network density. Thebeach profiles, besides the cross-shore transects,must include long-shore profiles that delineatethe main slope changes. It must be highlightedthat the obtained values reports to a reflectivesandy shore and include a broad range of slopes(0◦ < slope < 14◦). It should be mentioned that,besides the increase in positioning accuracy, theINSHORE system presents two important opera-tional advantages over the airborne laser scanningtechnique. First of all, the operation costs aremuch lower for the INSHORE system, and sois the complexity level of logistics. Secondly, theINSHORE system can operate under cloudyskies, strong winds or even in light showers,whereas the ALS system requires extremely goodweather conditions. The INSHORE system allowsdaily use during and immediately after storms,which is not possible with ALS.
Conclusion
The performance evaluation of the INSHOREsystem for DEM determination of coastal areashas been assessed and compared with the perfor-mance of land- and aerial-based survey method-ologies. Initially, the positioning accuracy ofsurface points achieved by the INSHORE sys-tem was compared with that of classical geodeticmethods, based on total station measurements,and it was concluded that the INSHORE system
presents an accuracy, in the altimetric component,that is on the same order of that of the geodeticmethods. Due to the estimate of the INSHOREplatform attitude, and to the accuracy and rangeof its laser distance sensor, it was shown thatsuch positioning accuracy is maintained indepen-dently of the tilt angles of the INSHORE platform(caused by the different ground surface slopes). Itwas also demonstrated that such positioning accu-racy is not dependent on the speed of motion ofthe INSHORE vehicle (mostly due to the reducedsampling time of the INSHORE sensors). Thus,as the INSHORE system is able to calculate aground point position for each 0.1 s, while mov-ing at speeds of tens of kilometres per hour, thebenefits of using the INSHORE system for DEMdata gathering, instead of classical geodetic meth-ods, are tremendous. In the same survey time, theINSHORE system can survey a wider region witha higher coverage (a denser grid), thus leadingto a DEM that represents the morphology of theground surface with much more detail and moreaccuracy (because the interpolation software thatcreates the DEM has a denser net of points).
DEMs extracted from data acquired fromINSHORE survey system can also benefit fromthe facility of this system due to the design ofthe equipment structure laterally mounted on thevehicle, in delineate steep beach features, as beachcusps or berms crests in the long-shore beachcomponent. The ability to quickly survey largecoastal areas is an enormous advantage especiallyin meso- to macro-tidal areas, as it provides addi-tional time during low tide to improve samplingdensity with long-shore profiles, or to perform de-lineation of coastal features such as beach cusps,ridges, berm crests, outcrops, etc. These improve-ments lead to more reliable DEMs that betterrepresent the morphology of the ground surfaceand permit improved determination of sedimentvolume.
In terms of airborne survey techniques, theINSHORE system was compared to ALS meth-ods as this is recognized as highly efficient, pro-ducing DEMs with good accuracy and resolution.Although the INSHORE survey system cannotcompete with the ALS method in terms of pro-ductivity, it has two main advantages. The firstand most important aspect is the much lower

256 Environ Monit Assess (2011) 182:243–257
implementation and operation costs presentedby the INSHORE system, being less dependenton weather conditions. Monthly monitoring of acoastal area with ALS is far beyond the budgets ofmost research groups or environmental agencies.Secondly, it is a land-based technology adaptedto a mobile platform that can easily combineother types of data, as sedimentary data, sam-pling location, vegetation identification, amongstothers. For regular, multi-year monitoring pro-grammes that operate on spatial scales rangingfrom kilometres to tens of kilometres, surveys ofsandy shores will benefit from this new technol-ogy, which provides a favourable framework forresearch studies or for management applicationsthat require highly accurate data.
Acknowledgements This work was developed under theINSHORE project (reference PTDC/AMB/73169/2006)—Integrated System for High Operational Resolution inShore Monitoring—funded by the Portuguese ScienceFoundation (FCT—Fundação para a Ciência e a Tec-nologia). The authors are grateful to Bruna Rodrigues,Mara Nunes and Luís Albardeiro for helping in thefield survey. Paulo Baptista was supported by the Fun-dação para a Ciência e a Tecnologia, grant referenceSFRH/BPD/63141/2009. Ana Matias was supported by theFundação para a Ciência e a Tecnologia, grant referenceSFRH/BPD/18476/2004.
References
Aagaard, T., Kroon, A., Andersen, S., Sorensen, R. M.,Quartel, S., Vinther, N. (2005). Intertidal beachchange during storm conditions; Egmond, TheNetherlands. Marine Geology, 218, 65–80.
Alcántara-Carrió, J., Fontán, A. (2009). Factors controllingthe morphodynamics and geomorphologic evolutionof a cuspate foreland in a volcanic intraplate island(Maspalomas, Canary Islands). Journal of CoastalResearch, S.I., 56, 683–687.
Anders, F. J., & Byrnes, M. A. (1991). Accuracy of shore-line change rates as determined from maps and aerealphotographs. Shore and Beach, 59(1), 17–26.
Anfuso, G., Domínguez, L., Gracia, F. (2007). Short andmean-term evolution of a coastal sector in Cadiz, SWSpain. Catena, 70, 229–242.
Baptista, P., Bastos, L., Bernardes, C., Cunha, T., Dias,J. (2008). Monitoring sandy shore morphologies by
DGPS—A practical tool to generate digital elevationmodels. Journal of Coastal Research, 24(6), 1516–1528.
Baptista, P., Cunha, T. R., Bernardes, C. (2010). Thevalidation analysis of the INSHORE system —Aprecise and efficient coastal survey system. Envi-ronmental Monitoring and Assessment. doi:10.1007/s10661-010-1765-0.
Ciccacci, S., Galiano, M., Roma, M., Salvatore, M. (2008).Morphological analysis and erosion rate evaluationin badlands of Radicofani área (Southern Tuscany—Italy). Catena, 74, 87–97.
Dail, H. J., Merrifield, M. A., Bevis, M. (2000). Steep beachmorphology changes due to energetic wave forcing.Marine Geology, 162, 443–458.
Emery, K. O. (1961). A simple method of measuring beachprofiles. Limnology and Oceanography, 6, 90–93.
Fletcher, C., Rooney, J., Barbee, M., Siang-Chyn, L.,Richmond, B. (2002). Mapping shoreline change us-ing digital orthophotogrammetry on Maui, Hawaii.Journal of Coastal Research, NS38, 106–124.
Forbes, D. L., Parkes, G. S., Manson, G. K., Ketch, L. A.(2004). Storms and shoreline retreat in the SouthernGulf of St. Lawrence. Marine Geology, 210, 169–204.
Gama, C. (2005). Dinâmica de Sistemas Sedimentares doLitoral Ocidental Português a Sul do Cabo Espichel(359 pp.). Ph.D. thesis, Portugal: University of Évora.
Groat, C. G. (2000). U.S. Geological Survey: Facing thenew century. Sea Technology, 41(1), 45–47.
Guibas, L., & Stolfi, J. (1985). Primitives for the manip-ulation of general subdivisions and the computationof voronoi diagrams. ACM Transactions on Graphics,4(2), 74–123.
Haxel, J. H., & Holman, R. A. (2004). The sediment re-sponse of a dissipative beach to variations in waveclimate. Marine Geology, 206, 73–99.
Huising, E. J., & Gomes Pereira, L. M. (1998). Errors andaccuracy estimates of laser data acquired by variouslaser scanning systems for topographic applications.Journal of Photogrammetry & Remote Sensing, 53,245–261.
Jackson, D. W. T., Cooper, J. A. G., del Rio, L. (2005).Geological control of beach morphodynamic state.Marine Geology, 216, 297–314.
Komar, P. D. (1976). Beach processes and sedimentation.New Jersey: Prentice-Hall.
Krabill, W. B., Wright, C. W., Swift, R. N., Frederick, E. B.,Manizade, S. S., Yungel, J. K.,et al. (2000). Airbornelaser mapping of assateague national seachore beach.Photogrammetric Engineering and Remote Sensing, 66,65–71.
Lancker, V., Lanckneus, J., Hearn, S., Hoekstra, P., Levoy,F., Miles, J., et al. (2004). Coastal and nearshore mor-phology, bedforms and sediment transport pathwaysat Teignmouth (UK). Continental Shelf Research, 24,1171–1202.
Lee, D. T., & Schachter, B. J. (1980). Two algorithms forconstructing a delaunay triangulation. InternationalJournal of Computer and Information Sciences, 9(3),219–242.
List, J. H., Farris, A. S., Sullivan, C. (2006). Re-versing storm hotspots on sandy beaches: Spatial

Environ Monit Assess (2011) 182:243–257 257
and temporal characteristics. Marine Geology, 226,261–279.
Livingstone, D., Raper, J., McCarthy, T. (1999). Integrat-ing aereal videography and digital photography withterrain modelling: An application for coastal geomor-phology. Geomophology, 29, 77–92.
Morton, R. A., Leach, M. P., Paine, J. G., Cardoza, M. A.(1993). Monitoring beach changes using GPS sur-veying techniques. Journal of Coastal Research, 9(3),702–720.
Plant, N. G., & Holman, R. A. (1997). Intertidalbeach profile estimation using video images. MarineGeology, 140, 1–24.
Petzold, B., Reiss, P., Stossel, W. (1999). Laser scanning—Surveying and mapping agencies are using a new tech-nique for the derivation of digital elevation models.Journal of Photogrammetry & Remote Sensing, 54,95–104.
Reis, A., & Gama, C. (2010). Sand size versus beachfaceslope—An explanation based on the constructal law.Geomorphology, 114, 276–283.
Ruggiero, P., Kaminsky, G. M., Gelfenbaum, G., Voigt,B. (2005). Seasonal to interannual morphodynamicsalong a high-energy dissipative littoral cell. Journal ofCoastal Research, 21(3), 553–587.
Saye, S. E., van der Wal, D., Pye, K., Blott, S. J.(2005). Beach–dune morphological relationships anderosion/accretion: An investigation at five sites in Eng-land and Wales using LIDAR data. Geomorphology,72, 128–155.
Silva, A., Taborda, R., Rodrigues, A., Duarte, J., Cascalho,J. (2007). Longshore drift estimation using fluorescenttracers: New insights from an experiment at Com-porta Beach, Portugal. Marine Geology, 240, 137–150.
Wehr, A., & Lohr, U. (1999). Airborne laser scanning—Anintroduction and overview. Journal of Photogramme-try & Remote Sensing, 54, 68–82.
Woolard, J. W., & Colby, J. D. (2002). Spatial character-ization, resolution, and volumetric change of coastaldunes using airbone lidar: Cape Hatteras, North Car-olina. Geomorphology, 48, 269–287.
Wright, L. D., & Short, A. D. (1984). Morphodynamic vari-ability of surf zones and beaches: A synthesis. MarineGeology, 56, 93–118.
Zhang, K., Whitman, D., Leatherman, S., Robertson, W.(2005). Quantification of beach changes caused byHurricane Floyd along Florida’s Atlantic coast usingairborne laser surveys. Journal of Coastal Research,21, 123–134.