new jersey sch ool cllimate survey - rems.ed.gov climate survey... · vey materi under the s ct. y...
TRANSCRIPT
_FiF
_______Funds for thn full by a gFree Schoo
NEW
S
New Jb
_______he developmgrant from tols and Com
W JERSE
SURVEY
A
Division o
O
O
New J
Trenhttp
Jersey Scby the BlouRutgers, t
________ment of thethe United Smmunities A
EY SCH
Y ADMINI
Davcting Comm
SuAssistan
f Student Se
Na
Office of Stud
KSchool C
Office of Stud
ersey DepP.O
nton, Newp://www.st
hool Climustein Cethe State
SEPTE
_______e New JerseStates DepAct of the N
HOOL CL
ISTRATIO
vid C. Hespemissioner of E
usan Martz nt Commissiervices and
ancy Curry Director
dent Support
Kelly Allen Climate Specdent Support
partment O. Box 500
Jersey 0tate.nj.us/
ate Surveenter for S
University
EMBER 20
________ey School C
partment of No Child Lef
LIMATE
ON GUID
e Education
ioner Career Read
rt Services
cialist rt Services
of Educat0 8625-050/education
ey materiaSurvey Rey of New
014
_______Climate SurEducation ft Behind A
E SURVE
DE 2.0
diness
tion
00 n
als producesearch, Jersey
________rvey materiunder the S
Act.
EY
ced
________als were prSafe and D
_____ rovided
Drug-

NJSCSSurveyAdministrationGuide2.0 Page1
INTRODUCTION
The establishment and maintenance of positive school climates and cultures, as is the case
with other school improvement efforts, require reliable data from which to identify strengths
and concerns and draw actionable conclusions. The New Jersey School Climate Survey
(NJSCS) is a collaborative effort between the Bloustein Center for Survey Research (BCSR),
at Rutgers, the State University of New Jersey and the New Jersey Department of Education
(NJDOE). It is designed to collect and analyze objective information from diverse school
populations (i.e., students, staff and parents) for reinforcing positive conditions and addressing
vulnerabilities in local conditions for learning.
Schools are encouraged but not required to use the NJSCS tools to support local school
climate and culture improvement activities. The materials are provided as a service to help
schools understand and improve local safe and supportive conditions for learning. The NJSCS
also can be used to assist schools, particularly school safety teams, in meeting their
obligations under the Anti-Bullying Bill of Rights Act to “…develop, foster, and maintain a
positive school climate by focusing on the on-going, systemic process and practices in the
school and to address school climate issues such as harassment, intimidation, or bullying …”
and to “… review and strengthen school climate and the policies of the school to prevent and
address harassment, intimidation, or bullying of students.”
The NJSCS is a free resource designed exclusively for local use in supporting ongoing school
improvement efforts. The NJSCS is based on the domains for school climate identified in the
research literature. The questionnaires were originally drawn from multiple, field-tested survey
instruments and a subsequent validation analysis was performed by BCSR. This analysis
informed the revisions to the NJSCS tool that are reflected in the revised materials released in
the fall of 2014. Please note that the most robust and useful data is likely to come from the
administration of all four surveys or as many of the surveys as possible; however, schools
have the flexibility to administer the surveys in a way that will best meet their needs.
While the NJSCS materials are in the public domain, you may not under any circumstances
change the materials and attribute the revised materials to the NJDOE in any way. You are

NJSCSSurveyAdministrationGuide2.0 Page2
encouraged to use the NJSCS tools as an integral part of your continuous efforts to improve
student education. Conducting a school climate survey on a regular basis will yield valuable
information related to various aspects of your school, such as its:
Physical Environment;
Teaching and Learning Capability;
Morale in the School Community,
Quality of Relationships;
Level of Parental Support and Engagement;
Safety Situation;
Emotional Environment, and;
Perception of Administration Support.
NJSCS Materials
This guide is designed to assist schools that are planning to conduct the NJSCS using the
materials provided to school districts by the NJDOE. Please note that this is the second
version of this guide and it is designed to be used with the revised set of materials released in
the fall of 2014. Chapters 1 to 4 offer recommended guidelines for conducting surveys,
including planning and logistics; selecting participants and sampling; administering surveys;
and preparing the data for the reporting of results. The NJSCS questionnaires and
supplementary materials are available online for each chief school administrator and charter
school lead person at http://www.state.nj.us/education/students/safety/behavior/njscs/. In
addition to this guide, an NJSCS questionnaire and a set of data templates designed for use
with either a paper-based mode of administration (data entry) or a web-based mode of
administration (data paste) have been designed for use with each of the four populations of
the school community (i.e., school staff, middle school-high school students, elementary
school students, parents). The file names for each product, organized by target populations,
are identified in Table A-1 on the next page. Note that the files available for download from
the NJDOE website are marked with a date at the end of the listed file names found in Table
A-1. Please ensure that the file(s) you are using for your administrations are the most
current files. The NJDOE website will always have the most current files. Should any
updates be issued, they will be indicated with the date changes were made to any files.

NJSCSSurveyAdministrationGuide2.0 Page3
Table A-1: New Jersey School Climate Survey: Survey Administration Materials
Population Questionnaire Mode of Administration
Paper Survey (Data Entry Template)
Web Survey (Data Paste Template)
School Staff, Teachers, and Administrators NJSCS_Staff_Q.pdf NJSCS_Staff_Data_Entry.xlsx NJSCS_Staff_Data_Paste.xlsx
Middle School and High School Students
(grades 6-12) NJSCS_MSHS_Student_Q.pdf NJSCS_MSHS_Student_Data_Entry.xl
sx NJSCS_MSHS_Student_Data_Paste.xlsx
Elementary School Students
(grades 3-5) NJSCS_ES_Student_Q.pdf NJSCS_ES_Student_Data_Entry.xlsx NJSCS_ES_Student_Data_Paste.xlsx
Parents of Students NJSCS_Parent_Q.pdf NJSCS_Parent_Data_Entry.xlsx NJSCS_Parent_Data_Paste.xlsx
Other Resources
NJSCS: Survey Administration Guide NJSCS_Guide.pdf
Appendix A Sample Selection Form – NJSCS_Sample_Selection_Form.xlsx Class Roster Sheet – NJSCS_Class_Roster_Sheet.xlsx
Appendix B Data Entry and Data Paste and Display Tool Examples (in Survey Administration Guide)
Comments or suggestions regarding the NJSCS materials may be directed to [email protected].

NJSCSSurveyAdministrationGuide2.0 Page4
TABLE OF CONTENTS
1. Planning Your Survey
a. Choosing between a paper- or web-based administration
b. Designating a survey coordinator
c. Determining who will administer your survey
d. Establishing a timeline for your survey
2. Selecting Participants
a. Sampling overview
b. Sampling guidelines
c. Selecting a sample
d. Documenting your sample
3. Survey Administration
a. Establishing procedures
b. Selecting a time frame
c. Establishing a tracking system
d. Training your survey collectors
e. Assembling and distributing materials
f. Reconciling and correcting your results
4. Preparing Data and Reporting Results
a. Understanding the data entry/data paste and display tool
b. The survey domains
c. Interpreting your results
d. Printing and distributing your results
5. Closing

1. PLANNING YOUR SURVEY
The use of the surveys involves many steps, several of which can be time-consuming. It is
important to prepare a comprehensive plan that describes all activities in detail, identifies the
personnel who will perform each task, and allows sufficient time for the completion of each
major activity. Start survey preparations by identifying key roles and responsibilities and
establishing a timeline for the survey.
Previous surveying experience can provide excellent guidance during the NJSCS planning
process. If your school has conducted a survey in past years, the information gained from that
experience should be incorporated into your plan for this year’s survey. Review the notes
which were made during previous experiences to help identify useful techniques for ease of
data collection and reporting. Expand and refine your plan each time you conduct the survey.
For more information contact the NJDOE at [email protected].
This chapter describes the following steps for planning to implement the NJSCS:
• Determine whether your school will utilize a paper-based or web-based survey;
• Identify the staff member(s) who will coordinate the NJSCS project;
• Determine the staff member(s) who will administer surveys to respondents; and
• Establish a survey schedule and procedures.
a. Choosing between a Paper- or Web-based Administration
The first step to conducting a school climate survey is to determine whether your survey
administration will be paper-based, web-based, or some combination of these two methods. A
paper-based administration will entail the manual printing, distribution, collection, and data
entering of paper surveys. The surveys can be downloaded from the NJDOE website at
http://www.state.nj.us/education/students/safety/behavior/njscs/. A web-based administration
will utilize a web survey application that must be developed by school districts. Examples of
such web applications systems are Qualtrics or Survey Monkey. These applications can be
programmed, disseminated, and then used to maintain a database record of the surveys. Data
can then be exported into an Excel or SPSS-based program for analysis.
NJSCS Survey Administration Guide 2.0 Page 5

NJSCSSurveyAdministrationGuide2.0 Page6
Regardless of which method is used, the NJDOE provides a data entry tool to display your
data. These Excel files are available online for downloading at the same webpage identified in
on the previous page of this guide. Please note that, if a paper-based administration is chosen,
data analysis should proceed using the data entry and display tool; whereas if a web-based
administration is used, data analysis should utilize the data paste and display tool. Table 1-1
outlines the advantages and disadvantages to each method.
Table 1-1: Paper vs. Web-Based Survey Administration
Paper-Based Web-Based
Advantages
Control over access to the survey
Control over original materials
Clear record of what has been done
No need for access to technology
Anonymity is easier to achieve
Less expensive
Speed and ease of data collection
No data entry necessary
Cyber record of results
Disadvantages
More expensive (printing costs, etc.)
Time consuming for data entry
Data is vulnerable before it is entered
Internet access is necessary
Requires initial online survey set-up
Limited control over survey access
Anonymity cannot be guaranteed
As noted, advantages to a paper administration include control over survey access, the fact
that computers are not necessarily needed, and that participants can be assured of anonymity.
However, this type of effort is more expensive, will take more time, and can be vulnerable to
misplacement of, or damage to, surveys before they are entered. Overall, a paper survey may
be considered more appropriate for staff and students because school administrators are able
to ensure that each student/staff member receives and returns only one survey on a set date.
Advantages to a web survey include that it requires less cost, time, and energy, and that it
creates a real-time record of the results. However, this method requires the population to have
Internet access and entails some initial online survey setup. In addition, there is limited control
over who actually takes the survey and anonymity cannot necessarily be guaranteed.
Therefore a web survey may be more appropriate for parents, since the cost of mailings or

NJSCSSurveyAdministrationGuide2.0 Page7
distribution of paper surveys to parents could be prohibitive and scheduling a paper-based
one-time parent administration is not feasible. On a final note, if you decide to do a web
survey, it is crucial that a test of the survey is performed before anyone is invited to participate.
b. Designate a Survey Coordinator
It is important to identify a single person as the Survey Coordinator. The survey coordinator
is responsible for overall management of the survey. The district anti-bullying coordinator or
the school anti-bullying specialist would be an appropriate staff member to perform this role.
The survey coordinator manages logistical aspects of the surveys, produces and distributes
the questionnaires or programs the web survey tool, identifies and trains staff to act as survey
administrators, monitors data collection, tallies responses, and compiles the final results.
c. Determine the Staff Members Who Will Administer the Survey
Conducting a successful NJSCS relies on efforts from a variety of partners. Even after the
coordinator generates a comprehensive plan for the NJSCS, responsibility for a successful
implementation lies in the committed and coordinated efforts of the teachers and other staff
members who program, distribute, and collect the surveys, as well as with students and their
parents. Therefore, it is vital for the survey coordinator to closely coordinate with these
partners and take steps to ensure that they are emotionally invested in the survey outcomes at
the outset of the process.
d. Establish a Timeline
To establish a realistic timeline for conducting the NJSCS, first identify the specific activities
that must be accomplished and determine the amount of time that should be allotted for each
activity. It is recommended that you conduct the survey process between September and
December or between January and May. Thus, as you determine how long each task will
take, use a 3-4 month total time frame as a guide. Remember that the task time frames for
student, parent, and staff surveys will also vary. For example, student data collection will likely
only take a day or two, while collecting data from parents will require a longer time frame, such
as 2-3 weeks. Also, remember that the time taken to perform tasks varies due to factors such

NJSCSSurveyAdministrationGuide2.0 Page8
as whether you use a paper- or web administration, how many staff members assist with the
survey effort, their degree of expertise, and the school’s enrollment size.
Table 1-2 provides a list of necessary activities and explains where more information can be
found for each activity in this guide. Many tasks in the timeline overlap. In most instances,
multiple activities will be addressed during the same time frame. If you have conducted the
NJSCS before, use that experience to guide your scheduling decisions. Identify activities that
may take more (or less) time than has been previously allocated.
Once a list of activities/tasks and a timeline have been established, decide the way each
activity will be conducted and who will be responsible for it. Create a planning worksheet to
keep track of the status of activities. Table 1-3 is a sample planning worksheet that the survey
coordinator can use. Schedule a meeting with staff, and if possible, include people who have
helped conduct a survey in prior years. Their experience will be valuable during the planning
process. This meeting should be scheduled as early in the process as possible.

NJSCSSurveyAdministrationGuide2.0 Page9
Table 1-2: Activity and Task Timeline
Chapter Activity/Task Comments Time to Allow
When to Begin
1 Review previous survey procedures
Review notes from past years, talk to past coordinator/participants
1 Establish a survey mode, schedule, and procedures
Choose paper- or web, fill out the activity task timelines, enumerate specific procedures
2 Determine characteristics of the survey sample
Decide which selection methods and which ratios will be used
2 Select classes for surveying; Identify staff eligible for survey
Select classes of students/parents for participation using ratios; identify school staff members eligible for inclusion in the survey
3 Plan and design survey administrator training
Print out materials, meet with and train administrators
3 Establish survey administration dates
Coordinate with school leadership to plan dates for surveying each population
3 Print or program your survey questionnaires
Ensure that printing resources are available at school, print questionnaires, or program web survey tool
3 Select and train survey administrators
Decide who from the school will participate and train them
3 Administer the NJSCS Distribute and collect surveys or open online data collection
3 Close data collection Decide on a time when surveys will no longer be accepted
4 Review incoming surveys Place ID numbers on questionnaires; review questionnaires for errors/inconsistencies prior to data entry/paste; reconcile response rates
4 Input data and report results Hand enter or paste results from survey into data entry/data paste and display tool, observe auto-generated responses, distribute printed version

NJSCSSurveyAdministrationGuide2.0 Page10
Table 1-3: Task Timeline and Participants
Task Name Start Date
End DatePerson in Charge
Others InvolvedDate
Completed
Task #1: Planning the Survey
Review previous survey procedures Establish a survey schedule and procedures
Task #2: Selecting a Sample
Determine characteristics of sample Select classes
Task #3: Administering Surveys
Plan and design survey administrator training Establish survey administration dates Print or program your questionnaires Select and train survey administrators Administer NJSCS End data collection
Task #4: Reconciling Results and Reports
Review incoming surveys Hand enter or paste results and prepare data

NJSCSSurveyAdministrationGuide2.0 Page11
2. SELECTING SURVEY PARTICIPANTS
The quality and usefulness of NJSCS data largely depend on the procedures used to
select survey respondents for participation. Two selection procedures can be used in
the administration of any of the school climate surveys: census and probability
sampling.
Census - A census is when every staff member, student, or parent is selected for
participation. This method ensures that there are enough completed surveys to yield
reliable data. For example, staff surveys are likely to utilize the census procedure since
there will be a small and manageable number of staff members at any school and
surveying each member is not a particularly burdensome task. Smaller schools will also
likely find the census procedure for students and parents to be the most appropriate
selection procedure for the survey.
Probability Sample – When the school population is especially large, surveying
everyone can be costly, time-consuming, and is usually unnecessary. In these
instances, a probability sample of the population to be surveyed should be selected.
Larger schools may prefer the probability sampling procedures for students and parents
as described later in this chapter, since surveying a larger population may be
challenging and time prohibitive.
Standardized sample selection and documentation procedures in this document are
recommended to ensure NJSCS data are of the highest quality, credibility, and
usefulness. This chapter describes the characteristics of a good survey sample; the
importance of a good sample; and the procedures for selecting the NJSCS sample,
including ways to:
Utilize the sampling guidelines;
Select the sample; and
Document the sample.
NJSCSSurveyAdministrationGuide2.0 Page12
a. Sampling Overview
A good sample is scientifically selected, efficient, and well-documented. A scientific
sample gives each eligible respondent a known and equal probability of being selected
as part of the sample. This is called probability sampling.
A sample frame is a list of potential respondents, from which the sample is chosen.
The NJSCS recommends a classroom-level selection design that relies on entire
student classes as the sampling frame for the selection of both student and parent
populations. This is the case because it is far too administratively burdensome to select
at the individual student or parent level. The survey coordinator is responsible for
selecting the classes using the procedures described in this chapter and the NJSCS
materials that have been made available to each chief school administrator and charter
school lead person. A scientifically selected sample cannot include volunteer classes,
because using the method of self-selection, or even targeted selection, can bias the
results and impede your ability to draw actionable conclusions from the survey
responses that can be said to represent the entire population.
An efficient sample design produces results that are more precise than those from
other possible samples of the same cost and level of effort. The more precise the
survey results, the more confidence you can have that the results are accurate and truly
reflect the population’s opinions. A very large sample is not efficient or necessary, since
it will require more documentation and follow up and unnecessarily use resources in
exchange for only a slight increase in survey precision.
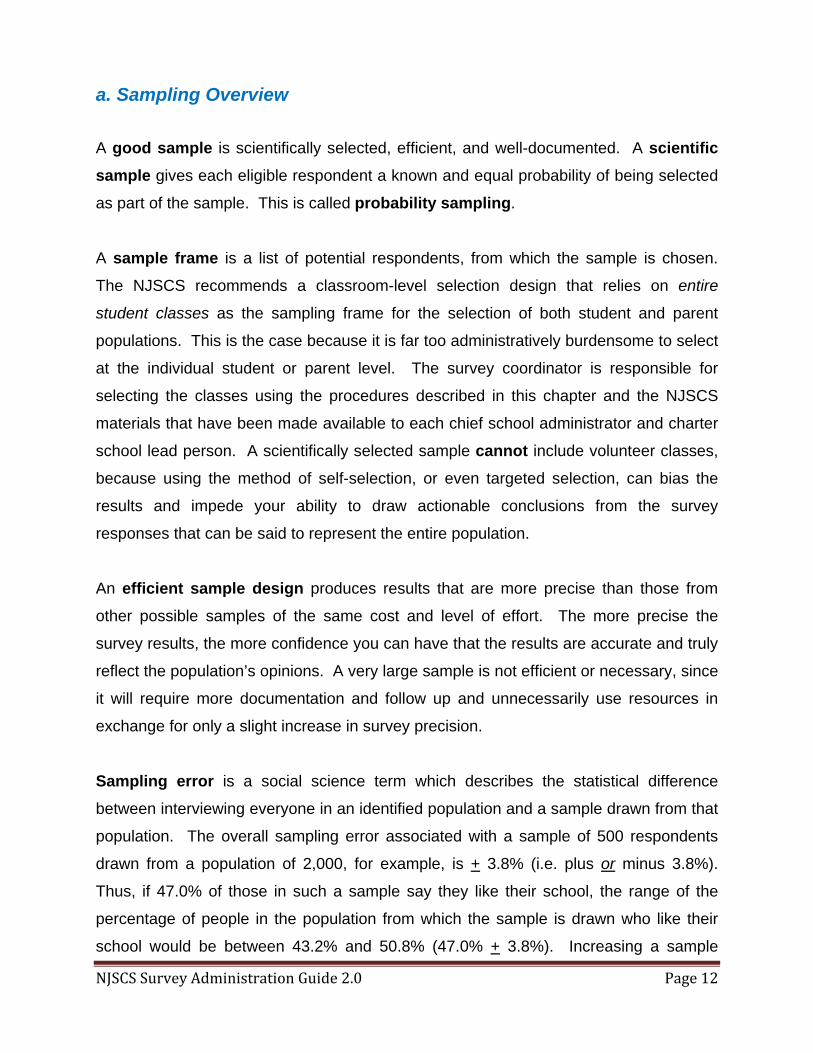
Sampling error is a social science term which describes the statistical difference
between interviewing everyone in an identified population and a sample drawn from that
population. The overall sampling error associated with a sample of 500 respondents
drawn from a population of 2,000, for example, is + 3.8% (i.e. plus or minus 3.8%).
Thus, if 47.0% of those in such a sample say they like their school, the range of the
percentage of people in the population from which the sample is drawn who like their
school would be between 43.2% and 50.8% (47.0% + 3.8%). Increasing a sample

NJSCSSurveyAdministrationGuide2.0 Page13
beyond 500 is highly inefficient, because it will not decrease the sampling error by
much, but will cost much more in time and resources.
A good sample is also well-documented. For example, when surveying students,
appropriate documentation is required during the class selection, data collection, and
data analysis phases. Detailed documentation during these phases will help ensure the
survey process is efficient and will provide a clear, written record of the NJSCS for the
next time your school conducts the survey. Response rate is also an important
sampling concept, and refers to the percentage of completed surveys received from the
school census or sampled population. For example, if you are using a total of 500
respondents as the survey sample size and 450 respondents return completed surveys,
the response rate is:
450 respondents completed surveys ÷ 500 respondents in sample = 90.0% response rate
It is expected that response rates for students and staff should be close to or near
100%, excluding students or staff who are absent for the period of survey administration
or the few who choose not to participate. Therefore, conclusions drawn from these high
response rate populations or samples should be very representative of the population
overall. On the other hand, response rates for the parent survey are likely to be lower,
and therefore, it is not recommended that you attempt to draw conclusions based on a
sample size of fewer than 60 parents, if your student population is more than 300. With
a participating sample of parents this small, the level of confidence that your estimates
truly represent the overall school parent population’s opinions is very small.
b. Sampling Guidelines
The sampling process will differ based on whether you are surveying staff, students, or
parents; therefore instructions for sampling are presented separately below. Sampling
will proceed in the same manner for both paper- and web-based administrations.

NJSCSSurveyAdministrationGuide2.0 Page14
Staff Surveys
All staff surveys will be administered using a census, or full population sampling
method. This sample will include all full-time school administrators, teachers and
student support services staff, as well as office, custodial, food service, transportation
and other staff. Schools may use discretion with regards to the inclusion of part-time
staff, remembering that the goal is to receive an accurate and complete picture of how
staff members view the school climate. While most items in the staff survey are largely
applicable to teachers and administration, other staff members may find some questions
difficult to answer based on their position at the school. It is recommended you instruct
all staff either to answer questions based on their perceptions or to leave items blank if
they do not feel they can answer them. Do not forget to make a record of which staff
members are included so that when it comes time to administer the survey no persons
are omitted from the effort.
Student Surveys (Elementary and Middle-High School)
Table 2-1 provides estimated sample sizes based on the NJSCS sampling design for
different eligible student population sizes. Find your school’s student population in
column 1 and use the corresponding sampling ratio in column 4 to select your sampling
ratio, or the ratio of the total number classes to sampled classes. If enrollment in the
school falls between two values in the student population column, use the sampling
ratio for the smaller value. For example, if you have 1,250 eligible students, the sample
ratio will be 3:1. Please note that “n-size” refers to the final number of completed
surveys that you expect to receive when finished.

NJSCSSurveyAdministrationGuide2.0 Page15
Table 2-1: Student Sampling Targets and Ratios
Student Population
Response Rate Assumption
Target n-size
Sampling Ratio
Sampling Error
Under 500 ~ 100% < 500 census n/a
500 to 999 ~ 100% 250 - 500 2:1 +/- 3.8*
1,000 to 1,499 ~ 100% 333 - 500 3:1 +/- 4.0
1,500 to 1,999 ~ 100% 375 - 500 4:1 +/- 4.1
2,000 + ~ 100% 400 + 5:1 +/- 4.4**
* Sampling error for population ranges were calculated for 95% confidence using the midpoint between the two values. ** Sampling error for this ratio was calculated for 95% confidence using the lowest value in the scenario (2,000).
Parent Surveys
Sampling of parents may be done by the selection of entire classes of students, who will
then either be sent an online version of the survey or students will be given the survey
to take home to their parents and, once completed, return them to their teachers. The
only difference in the sampling process is that, since an approximate 50% response rate
is expected from parents, this sample will be larger.
Schools are welcome to use main office lists of parents and sample from those in lieu of
the class selection method, but this is only a viable option if you plan to mail paper
surveys or administer they survey online to parents, and it may be costlier in both
money and time to use a paper-based survey. If you are using the recommended class
selection method, Table 2-2 provides estimated sample sizes based on the NJSCS
sampling design for different eligible population sizes. Again, find your school’s student
population in column 1 and use the corresponding sampling ratio in column 4.
Remember that if your school enrollment falls between two values in the student
population column, use the sampling ratio for the smaller value. For example, if you
have 1,250 eligible students, your sample ratio will be 2:1.

NJSCSSurveyAdministrationGuide2.0 Page16
Table 2-2: Parent Sampling Targets and Ratios
Student Population
Response Rate Assumption
Target n-size
Sampling Ratio
Sampling Error
Under 1,000 ~ 50% < 500 census
1,000 to 1,999 ~ 50% 250 - 500 2:1 +/- 4.6*
2,000 + ~ 50% 333 + 3:1 +/- 4.9**
* Sampling error for population ranges were calculated for 95% confidence using the midpoint between the two values. * Sampling error for this ratio was calculated for 95% confidence using the lowest value in the scenario (2,000).
c. Selecting a Survey Sample
The Sample Selection Form is a Microsoft Excel (MS-Excel) file that will assist the
survey coordinator in selecting a sample for both student and parent surveys. The
document is a blank sheet that includes rows in which to input each school class eligible
for survey inclusion. Appendix A contains a sample of this sheet. Inputting this
information will create a list to serve as the sampling frame. It also includes columns
that identify the characteristics of each listed class; including the teacher name, grade
level, and class enrollment. Classes should be grouped and inputted in order by grade
level from low to high, with the lowest grade level listed first and the highest grade level
listed last. Grouping the list by grade level is essential, because it will ensure that your
final sample is roughly proportionate to the overall school population in terms of the
composition of its grade levels.
Student Survey Sample
If you are selecting a student sample, it is strongly advised that class selection occur by
homeroom. If homerooms are not used at your school or are otherwise unavailable,
you may select classes by a certain period of the day, preferably one that does not
include many “special classes,” such as Spanish or Art, because they may be subject to
schedule fluctuations. This homeroom-based form of student sample selection is
optimal because it allows you to make a list of students to be surveyed directly from
original homeroom rosters and also permits you to track participation.

NJSCSSurveyAdministrationGuide2.0 Page17
Parent Survey Sample
If you are selecting a parent sample, it is also advised that you use homerooms, since
regardless of whether you use a paper- or web-based survey; it will be easier to keep
track of the parents who have returned the survey with the same kinds of student-based
class lists described above.
The process for selecting classes is explained below:
1) Ensure that all classes are listed: a quality check can be performed by comparing
the summed total from the “enrollment” column against school records.
2) Use the school’s allotted sampling ratio from column 3 in Tables 2-1 and 2-2 to
select the appropriate number of classes from the list. For example, if there are 36
classes and the sampling ratio is 2:1, you will be selecting 18 classes.
3) Beginning with the first class on the list, use the ratio as an interval to select every
(x)th class until you reach the end of the list. Continuing with the example above, if
the sampling ratio is 2:1, select every 2nd class.
4) If you have sampled correctly, the summed enrollment from the selected classes
should be approximately the amount that was desired in column 2 of Tables 2-1 and
2-2. You also should have selected a distribution of grade levels that is
proportionate to the school’s grade composition – meaning that if the school consists
of roughly 25% of 3rd grade classes, then the sample should also include roughly
25% of 3rd grade classes.
d. Documenting the Sample
Documenting the sample is very important. Complete documentation of the sampling
process is essential both to demonstrate that the sample was selected scientifically and
to facilitate tracking during both the sample selection and the survey collection process.
Documentation is especially important when tracking parent survey returns since their

NJSCSSurveyAdministrationGuide2.0 Page18
response rates will be lower. If information on the sampling process is not documented
properly, results cannot be generalized to the entire population (i.e., cannot be said to
represent the population). Additionally, a clear, written record of the sampling process
will help improve future surveying efforts. Therefore, it is important to save all records
pertaining to sample selection and refer to them if you have questions during or after the
data collection process.

NJSCSSurveyAdministrationGuide2.0 Page19
3. SURVEY ADMINISTRATION
This chapter focuses on the critical actions to be taken for a successful paper- or web-
based survey administration. Survey administration comprises a wide variety of
activities, and refers to the overall management of the NJSCS and to the data collection
procedures. Survey administration activities occur before, during, and after data
collection; thus, survey administrators should be trained early in the process. Survey
administration activities are divided into the following six categories:
Establishing survey administration procedures;
Selecting the dates for survey administration;
Establishing a survey tracking system;
Choosing and training survey administrators;
Assembling and distributing or programming survey materials; and
Reconciling and correcting results.
a. Establishing Survey Administration Procedures
Establishing standards and procedures that will be uniformly used are crucial to the
integrity of the survey administration and the survey results. The importance and
benefits of setting standards and following prescribed procedures cannot be overstated.
Survey administration standards help protect the confidentiality of participants, improve
the quality of data, and increase response rates.
A very important aspect of NJSCS data collection is confidentiality. Respondents
must feel confident that every reasonable effort has been made to protect their privacy.
Ensuring confidentiality allows respondents to feel comfortable answering questions
honestly, which ultimately leads to more accurate data - and is, in itself, an indicator of
school climate. In order to uphold confidentiality, only survey coordinators will have
extended access to the survey answers. Consider asking all survey coordinators and
administrators to sign a confidentiality agreement that can be shown to anyone who

NJSCSSurveyAdministrationGuide2.0 Page20
would like to view it. Informing respondents of this agreement indicates to the
respondents that the commitment to confidentiality is a serious one, and reinforces the
survey administrator’s obligation to protect respondent privacy.
b. Selecting the Dates for Survey Administration
If you are using a one-time paper administration, the dates selected for survey
administration can affect response rates. While staff surveys can be scheduled more
easily, remember the following guidelines as you select the parent and student survey
administration dates since both populations may not be as available at these times,
which will negatively affect response rates:
Administer the survey as early in the semester as possible to avoid busy school
schedules, standardized testing preparation, and decreased attendance, particularly
by 12th graders at the end of the school year;
Ideally, survey administration should take place over as short a time period as
possible, preferably a single day for students and a single week for staff and
parents. This is to ensure that no respondents are surveyed twice or omitted. Also
surveys are snapshots of sentiment during a specific time period; if a major event
occurs during data collection, the survey’s conceptual frame will differ across
respondents and altar the results unevenly;
Avoid holidays, special conference days, and standardized testing days; and avoid
distributing the survey on the following days to avoid surveying during periods of low
attendance:
o The days immediately before or after spring break;
o The Friday before a Monday holiday; and
o Any day during the last month of school.
c. Establishing a Survey Tracking System
Once your survey population has been selected, you can use the Class Roster Sheet
to help track your sample. See Appendix A for an example; also provided as a MS-

NJSCSSurveyAdministrationGuide2.0 Page21
Excel file. These forms can be used by teachers or other administrators to track survey
returns. As completed surveys are collected at the homeroom level, survey
administrators can check off each respondent’s name as having participated in the
survey. These forms should be returned to the survey coordinator, so the overall
sample can be tracked and documented.
d. Choosing and Training Survey Administrators
Survey administrators have an important role. Staff and parents will likely be
completing the survey at home or online, thus survey administrators will act only as
collectors for these populations. For students, classroom teachers may administer the
survey, but you must make sure that the students feel comfortable enough to provide
honest responses while their teacher is present. It is suggested that you allow proctors
to conduct the survey, or have teachers switch classrooms for the day.
Once the survey administrators are selected, create a mechanism to ensure that they
have uniform information about the NJSCS and follow the same survey administration
procedures. A training session is the best method for providing this information. Survey
administrators can be most efficiently trained simultaneously in a central location at the
school. To increase the chances for retention of information, hold the training session
as close as possible to the time when the survey will be administered. A short, but
comprehensive, one-hour session should be sufficient.
Prepare a training agenda and relevant materials for the training session. The agenda
could include the following topics, depending upon the activities that are required of the
survey administrators:
Purpose of the NJSCS;
Importance of following survey administration procedures and maintaining confidentiality;
Presenting and administering the survey;
Documenting school and class participation; and
Discussing the materials required for survey administration.

NJSCSSurveyAdministrationGuide2.0 Page22
If a training session for survey administrators cannot be arranged, a detailed set of
written instructions should be provided or, at a minimum, Chapter 3 of this survey
administration guide, which is entitled “Survey Administration,” should be issued.
e. Assembling and Distributing Survey Materials
The survey coordinator is responsible for either programming the survey online or
printing all supplies necessary for a paper-based survey administration and issuing
those materials to the survey administrators before the selected survey date(s). Since
collection will differ based upon population, the instructions below are divided into
separate sections for staff, students, and parents.
Staff Surveys
It is recommended that staff be allowed to self-administer the survey, meaning that they
be allowed to complete it at home or anywhere else where they feel comfortable
answering honestly. Once completed, they will be responsible for returning them to the
survey coordinator. Since it is vital that staff confidentiality be maintained, it is
recommended that you inform all participating staff of the survey and its procedures
beforehand. This may be accomplished using a letter which explains the purpose of the
survey, instructs them on how to participate, and tells them when the survey will be
distributed to them. Surveys can be given out in staff mailboxes or any other similar
manner. Staff should be encouraged to return the survey to a single location, preferably
in a bin or container placed somewhere that allows them some privacy upon return. If
staff is being given a web-based survey, ensure that you are extremely careful to not
divulge any individual responses

NJSCSSurveyAdministrationGuide2.0 Page23
Student Surveys (Elementary and Middle-High School)
If using a paper survey, once survey administrators have the necessary supplies, they
are to distribute them to students and collect them on the day of survey administration.
The survey is designed to take no more than a regular 40-minute class period. It is
recommended that classrooms be used as the venue for data collection. Survey
administrators also should be provided with a large envelope that can be sealed, in
which to store completed surveys. This ensures that no surveys are misplaced, that all
surveys are stored and separated by homeroom, and further assures students of
confidentiality of participation. If the administration is collected online, you may still use
a single classroom period, but you may have to rotate students in and out of computer
access areas.
Have survey administrators make a note of students who are absent on the day of the
survey administration. These students can either complete the survey at home or a
make-up session can be held in a central location where all students who were absent
on the original planned date can complete the survey. Have survey administrators be
prepared to help students who need assistance with reading, or who do not read
English well enough to participate without help. It is important to emphasize that under
no circumstances should survey administrators or others involved in survey
administration attempt to influence student responses.
Parent Surveys
If you are utilizing a classroom-level selection method for a paper- or web-based survey
with a parent population, it is recommended that either you allow students to deliver the
questionnaire in a manner similar to the way that other school-parent communications
are handled or send e-mail invites to parents. This e-mail or paper survey should be
accompanied by a letter similar to the one prepared for staff. It should state the
purpose of the survey and instruct parents on how to participate but, more importantly
for parents, it should stress the benefits of their participation and provide them with the

NJSCSSurveyAdministrationGuide2.0 Page24
name and contact information for someone at the school that they can reach out to with
questions about the survey.
Additional Instructions for Web Surveys
Administrators should be cautious when using a web-based survey to be sure that they
have taken steps to prevent students, staff, or parents from taking the survey multiple
times in order to steer results. This practice is also known as “ballot stuffing” and it is
advised that you do not make the survey openly available to parties outside of your
intended population OR permit the survey to be accessed by the same person (student,
staff, parents) on multiple occasions. These issues could occur if you posted a web-
based survey openly on your school’s website. To correct for this, most web survey
software includes the option to either email the survey to respondents with a unique link
that allows them to participate just one time or utilize other security features. While
these security measures could result in a loss of respondent anonymity, allowing
multiple responses or non-intended parties to complete a survey will obviously bias the
results and complicate analysis.
f. Reconciling and Correcting the Results
If you are using either a paper- or web-based administration, two forms are provided in
Appendix A that can help with the reconciliation process: the Sample Selection Form
and the Class Roster Sheet. The survey administrator should retain the sampling
sheet in a central location in order to track both overall student participation and
participation by class. Give a class roster sheet to each survey administrator that can
be filled out during the survey, to be returned to the survey coordinator as a cover sheet
along with completed surveys from each selected class. This way, participation can be
tracked by class and school-wide response rates also can be tracked. For paper
surveys the survey coordinator should number the surveys consecutively as they are
received, in order to make data entry correction easier. You may write the identification
number on the lower right hand corner of the first page of each survey as they are
returned. Make sure that you have as many completed surveys for entry as there are
NJSCSSurveyAdministrationGuide2.0 Page25
listed in the class roster forms that have been returned. For web-based administrations,
these sheets can simply be filled while the students are taking the survey.
A task for the survey coordinator is to correct some of the incoming completed paper
surveys that have been filled out incorrectly. This includes removing any identifying
characteristics which were left in error by the respondent, such as their name, but it also
includes making some important choices about the way respondent errors should be
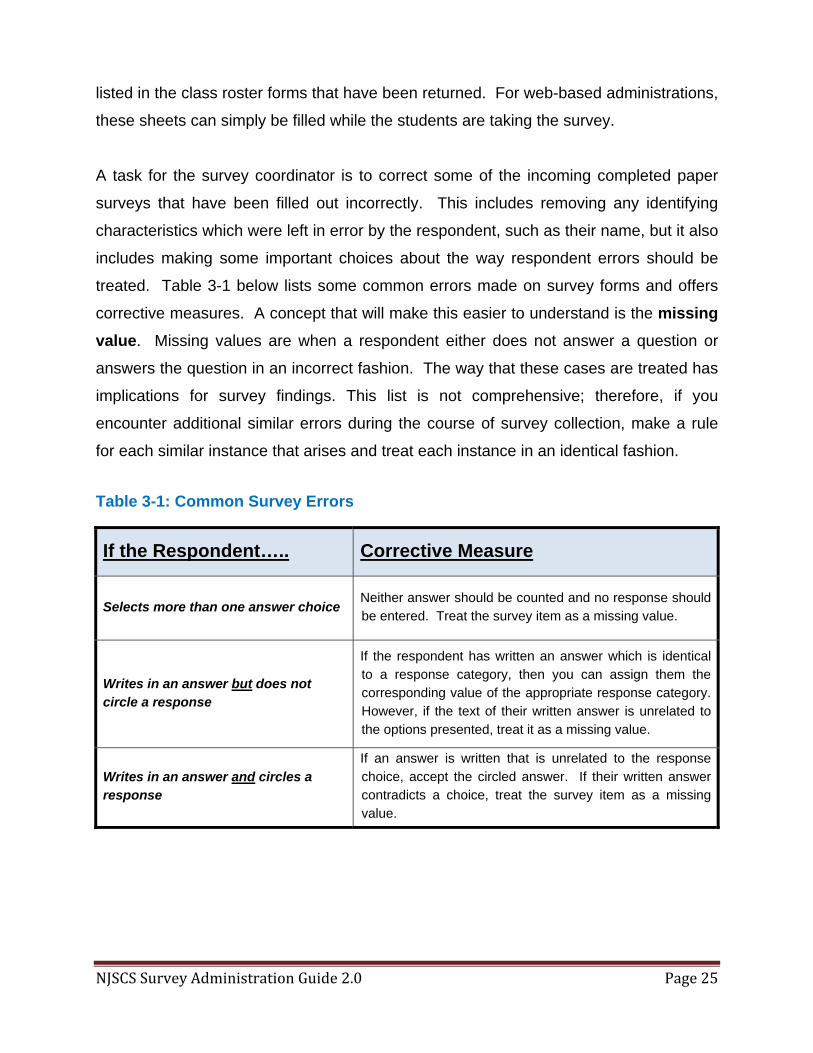
treated. Table 3-1 below lists some common errors made on survey forms and offers
corrective measures. A concept that will make this easier to understand is the missing
value. Missing values are when a respondent either does not answer a question or
answers the question in an incorrect fashion. The way that these cases are treated has
implications for survey findings. This list is not comprehensive; therefore, if you
encounter additional similar errors during the course of survey collection, make a rule
for each similar instance that arises and treat each instance in an identical fashion.
Table 3-1: Common Survey Errors
If the Respondent….. Corrective Measure
Selects more than one answer choice Neither answer should be counted and no response should be entered. Treat the survey item as a missing value.
Writes in an answer but does not circle a response
If the respondent has written an answer which is identical to a response category, then you can assign them the corresponding value of the appropriate response category. However, if the text of their written answer is unrelated to the options presented, treat it as a missing value.
Writes in an answer and circles a response
If an answer is written that is unrelated to the response choice, accept the circled answer. If their written answer contradicts a choice, treat the survey item as a missing value.

NJSCSSurveyAdministrationGuide2.0 Page26
4. PREPARING DATA AND REPORTING RESULTS
This chapter describes both the Data Entry Display Tool and the Data Paste Display
Tool that have been prepared in MS-Excel format and provided online at
http://www.state.nj.us/education/students/behavior/njscs/. These MS-Excel files, which
are formatted for either hand entry of data or pasting of data from a web survey program
or another format, will facilitate a number of the survey coordinator’s tasks, from acting
as a data entry or data paste program to tabulating and summarizing data as well as
reporting results automatically in a user-friendly and easy-to-understand fashion. The
chapter is broken into four main sections, which focus on the following topics:
Understanding the organization of the data entry or data paste and display tool;
Describing the survey domains;
Interpreting the data entry or data paste and display tool’s auto-generated tabs; and
Printing and distributing results
a. Understanding the Data Entry/Data Paste Display Tools
The data entry display tool and the data paste and display tools are very similar and are
designed to facilitate data compilation and produce graphical representations of results.
These tools only differ with regards to how the data is inputted. Once you have
completed the paper- or web-based data collection and reconciled incoming survey
materials, results must either be entered by hand into the data entry and display tool or
pasted as an entire dataset into the data paste and display tool. Both of these tools will
generate identical reports from the inputted data that will help you interpret the findings
and understand the strengths of your school’s climate and which areas could be
improved. If you have used MS-Excel before, these tools will be easy to navigate. If
you have not used MS-Excel, you might want to recruit someone at the school who is
more familiar with the program; however, a quick tutorial on MS-Excel can most likely
enable even the novice to easily use the data entry/data paste display tools.

NJSCSSurveyAdministrationGuide2.0 Page27
The data entry/data paste display tools are organized into a number of separate tabs,
which must be clicked on to access the individual MS-Excel sheets. A tab labeled
Instructions explains in detail how to use all the sheets in these tools. The tab labeled
either Data Entry or Data Paste is the place where you interface with the program,
entering individual surveys or pasting an entire dataset of answers into the system.
Once you have entered the matrix of responses into the data entry or data paste tab,
the remaining sheets will automatically populate with results in statistical and graphical
form. These sheets are accessed by clicking on the tabs on the bottom of the page that
have labels corresponding to each of the individual Domain, and the Domain Score
Sheet. The first set of these tabs represent the survey domains, which are explained
below, and the final tab is an overall summary sheet of all of the domains. These
sheets are easily printed and can be distributed in order to facilitate a discussion of
survey results among school stakeholders. There is also a tab labeled Data Display
Instructions, which provides detailed explanations for understanding and interpreting
the results in the individual domain tabs and summary Domain Scores tab.
b. The Survey Domains
The NJSCS is based on school climate domains that are identified in the research
literature, and the questions are drawn heavily from field-tested survey instruments that
were found mainly on the United States Department of Education’s Safe and Supportive
Schools Technical Assistance Center website1. As quoted from the Center’s website,
their goals are identified as follows:
[Provide] training and support to states, including 11 grantees funded under the Safe and Supportive Schools Program and other state administrators; administrators of districts and schools; teachers; support staff at schools; communities and families; and students
[Seek] to improve schools' conditions for learning through measurement and program implementation, so that all students have the opportunity to realize academic success in safe and supportive environments.
The survey questions are organized into these conceptual domains, or categories,
which together make up the school’s overall climate. Each question belongs within one
1 The contents of the Safe and Supportive Schools Technical Assistance Center website were assembled under a contract from the U.S. Department of Education, Office of Safe and Healthy Students to the American Institutes for Research (AIR), Contract Number ED-OSD-10-O-0093. The website was last accessed on October 25, 2012 at the link below: http://safesupportiveschools.ed.gov/index.php?id=01

NJSCSSurveyAdministrationGuide2.0 Page28
of these categories, and responses are tabulated in order to score these domains, with
a higher score representing a healthier and more positive school climate. The domains
are arranged by survey population, color-coded, and described below in plain language.
Staff
Physical Environment - This domain addresses scheduling, the use of the building,
and attitudes toward the building.
Teaching and Learning - This domain focuses on the academic climate of the school
and probes support for student development, levels of instructional challenge
and relevance, and attitudes about “ownership” (i.e., a sense of personal
responsibility for teaching and learning and personal pride in successfully
achieving academic objectives) by students of learning and teachers of
teaching. It also includes general attitudinal measures of satisfaction with the
school’s overall instructional quality.
Morale in the School Community - This domain addresses “pride of place” as
ownership and identification with the school’s central character, as well as a
call to all stakeholders for “belonging” to the school.
Relationships - This domain assesses the degree to which lines of interpersonal
communication are open and honest and produce healthy, positive outcomes.
This includes an assessment of the depth, sincerity, and authenticity of
communications efforts.
Parental Support Engagement - This domain is concerned with the degree to which
parents and community members are incorporated into both the social and
academic life of the school. This includes assessing the efficacy of school-
home communications and an assessment of the degree of home support for
learning.

NJSCSSurveyAdministrationGuide2.0 Page29
Safety - This domain addresses attitudes toward the individual’s sense of physical
safety in and around the school.
Emotional Environment - This domain addresses attitudes toward the social
environment. This includes perceptions of how the average student ought to,
and does, behave, as well as the general fairness of the school.
Administration Support - By considering the school as a “common cause,” this
domain assesses the school leadership’s perceived ability to support and rally
the school community to healthy and positive outcomes in terms of quality of
communications, level of integrity, and ease of teamwork, as well as the
promotion of professional and academic success.
Students (Elementary and Middle-High School)
Physical Environment - This domain addresses scheduling, the use of the building,
and attitudes toward the building.
Teaching and Learning - This domain focuses on the academic climate of the school
and probes support for student development, levels of instructional challenge
and relevance, and learning and personal pride in successfully achieving
academic objectives by students of learning and teachers of teaching. It also
includes general attitudinal measures of satisfaction with the school’s overall
instructional quality.
Morale in the School Community - This domain addresses “pride of place” as
ownership and identification with the school’s central character, as well as a
call to all stakeholders for “belonging” to the school. By considering the school
as a “common cause,” this domain assesses the school leadership’s ability to
support and rally the school community to healthy and positive outcomes.
Student Relationships - This domain assesses the degree to which relationships
between students are open, honest, and respectful and lead to positive
NJSCSSurveyAdministrationGuide2.0 Page30
outcomes rather than negative, preventable outcomes such as bullying,
harassment, and intimidation.
Parental Support - This domain is concerned with the degree to which parents and
community members are incorporated into both the social and academic fabric
of the school. This includes assessing the efficacy of school-home
communications and an assessment of the degree of home support for
learning.
Safety - This domain addresses attitudes toward the individual’s sense of physical
safety in and around the school.
Emotional Environment - This domain addresses attitudes toward the social
environment. This includes perceptions of how the average student ought to,
and does, behave as well as the general fairness of the school.
Parents
Physical Environment - This domain addresses scheduling, the use of the building,
and attitudes toward the building.
Teaching and Learning - This domain focuses on the academic climate of the school
and probes support for student development, levels of instructional challenge
and relevance, and learning and personal pride in successfully achieving
academic objectives by students of learning and teachers of teaching. It also
includes general attitudinal measures of satisfaction with the school’s overall
instructional quality.
Morale in the School Community - This domain addresses “pride of place” as
ownership and identification with the school’s central character, as well as a
call to all stakeholders for “belonging” to the school. By considering the school
as a “common cause,” this domain assesses the school leadership’s ability to
support and rally the school community to healthy and positive outcomes.

NJSCSSurveyAdministrationGuide2.0 Page31
Relationships - This domain assesses the degree to which lines of interpersonal
communication are open and honest and produce healthy, positive outcomes.
This includes an assessment of the depth, sincerity, and authenticity of
communications efforts, as well as the fairness of the administration of the
school’s academic and social environments.
Parental Support and Engagement - This domain is concerned with the degree to
which parents and community members are incorporated into both the social
and academic life of the school. This includes assessing the efficacy of school-
home communications, an assessment of the degree of home support for
learning, and general parental satisfaction with the school.
Perceptions of Safety and Emotional Environment - This domain addresses
attitudes toward physical safety, the social environment, and individual
emotional safety. This includes perceptions of how the average student ought
to, and does, behave.
Table 4-1, on the next page shows how the domains fit across all four populations.

NJSCSSurveyAdministrationGuide2.0 Page32
Table 4-1: Conceptual Domains by Population Type
Middle and High School Students
Elementary School Students Staff Parents
Physical Environment Physical Environment Physical Environment Physical Environment
Teaching and Learning Teaching and Learning Teaching and Learning Teaching and Learning
Morale in the School Community Morale in the School Community Morale in the School Community Morale in the School Community
Student Relationships Student Relationships Relationships Relationships
Parental Support Parental Support Parental Support and Engagement Parental Support and Engagement
Safety Safety Safety Safety/Emotional Environment
Emotional Environment Emotional Environment Emotional Environment
Administration Support

NJSCSSurveyAdministrationGuide2.0 Page33
c. Interpreting Results
Once the data from each completed survey have been entered into either the data entry
or the data paste sheet, the cell fields in the domain sheets and in the domain score
sheet will automatically populate with results. Detailed instructions for understanding
and interpreting the survey results can be found in the Data Display Instructions tab,
which is in the data entry or data paste and display tool’s MS-Excel sheet. It is
important to interpret the data in the appropriate fashion, and care should be taken
when drawing conclusions from results, especially if the survey data collection process
yields a low response rate. Additionally, it should be noted that all results are
designed to be publicly reported at the domain score level. Individual items should
not be highlighted or scrutinized for any purpose other than for use with internal
evaluation and planning. Individual scores presented out of context can sometimes do
more harm than good. For example, a school may score very well on the Physical
Environment domain overall, but score poorly on one of the individual items that
comprise it, thus presenting this one poor score will unfairly malign the school’s domain
performance.
An item that has been added to the 2014 NJSCS is a question with regards to whether
the child attends an after school program, and if so, at what type of venue. By itself, this
is an interesting piece of information to learn, but it can also be used as a way to
examine outcomes by differing groups of students. This is what is known as an
independent variable, or a factor which is thought to cause variation on some kind of
behavior or outcome. In this case, whether a child attends an after school program and
in what venue, may affect how they perceive the school climate. Please note that this
variable is not depicted in the data entry/data paste tool but you may analyze it on its
own, or use it as a way to split your results by type of student.
Visual examples of completed results derived using the data display tool is provided in
Appendix B. It should be noted that the template used in Appendix B is the display for

NJSCSSurveyAdministrationGuide2.0 Page34
the staff survey. The templates provided for the other populations will largely follow the
same layout, but have minor differences in appearance.
d. Printing and Distributing Results
The data entry and data paste and display tools have been formatted for ease of
printing. The instructions sheet can be printed by selecting the “print” command from
the main menu of the MS-Excel program. If you choose to print “entire workbook,” the
file produced is set to print all pages, with the last set of pages displaying the results of
the survey. Each individual domain sheet and the summary domain score sheet can be
printed by first clicking on the individual tab to be printed and then selecting print “active
sheets” from the MS-Excel main menu. The page margins and page breaks have all
been pre-assigned so they do not need to be adjusted. Each sheet also may be
converted into separate Adobe PDF files before printing. The benefits of converting the
workbook to a PDF include standardization of the document across software formats
and operating systems as well as the ease of sending and receiving results via e-mail.
The data entry/data paste display tool is formatted for a color printer, so if one is
available, please use it. However, even without color, the printed results should provide
materials that will be useful in starting a school-wide conversation with stakeholders
about the results from the survey.

NJSCSSurveyAdministrationGuide2.0 Page35
5. CLOSING
The NJSCS materials provide school staff with powerful tools for regularly examining
and improving school climates and cultures. Used in accordance with the information in
this guide and the intent of the NJSCS materials, the surveys provide valuable,
objective information to support improvements in schools and their educational
programs.
As meaningful and as useful as the survey results can be, the survey data can have
even more power when used in conjunction with existing local data that provides
information on student and staff attendance; student conduct referrals and dispositions;
school violence, vandalism, harassment intimidation, and bullying, and substance abuse
incidents, as reported on the NJDOE’s Electronic Violence and Vandalism Reporting
System; student grades; standardized test scores; and student graduation and dropout
rates. Considering the NJSCS survey data in concert with other data can provide a
clearer and more complete understanding of school strengths and issues to be
addressed, which can significantly help in identifying specific and measurable objectives
for school change.
Additionally, the survey data might not tell the whole story about the school climate
domains or might provide pointers for further study. It can be extremely beneficial to
have discussions or hold “focus groups” with various school constituencies (e.g.,
students, school staff, parents and other community members) to provide insight into
the data or to identify more specific information (e.g., examples, practical solutions), all
of which aide in comprehending and giving meaning to the data and assist in focusing
energies on targeted, proactive solutions.
The research literature overwhelmingly emphasizes the importance of using objective
information in planning, implementing, and evaluating school improvement efforts. It is
our hope that the NJSCS materials will be used as a primary mechanism for the
objective assessment of local school climates and cultures for the overall improvement
of schools.

Appendix A: Sample Materials
Sample Selection Form
In this example, the sampling ratio is 3:1, thus every third class is selected. The survey
coordinator will be the one filling the red ink
School Name: Survey Coordinator Date/Period:
Listing of Classes for Selected Period: Selection Order Class Teacher's Name Total # Enrolled Grade Level
1 Class 1 first name last name 23 7
2 Class 2 first name last name 23 7
3 Class 3 first name last name 23 7
1 Class 4 first name last name 23 7
2 Class 5 first name last name 23 7
3 Class 6 first name last name 23 7
1 Class 7 first name last name 23 7
2 Class 8 first name last name 23 7
3 Class 9 first name last name 23 7
1 Class 10 first name last name 23 7
2 Class 11 first name last name 23 7
3 Class 12 first name last name 23 7
1 Class 13 first name last name 23 7
NJSCS Survey Administration Guide 2.0 Appendix A Page - 1
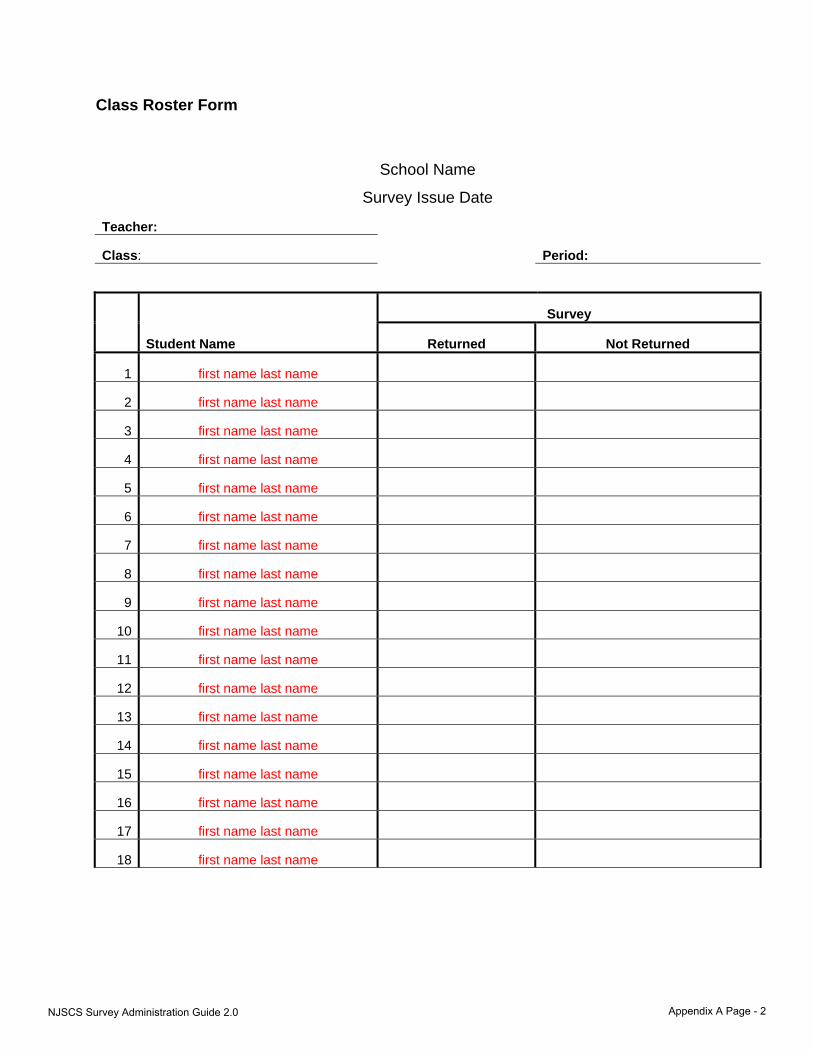
Class Roster Form
School Name
Survey Issue Date
Teacher:
Class: Period:
Survey
Student Name Returned Not Returned
1 first name last name
2 first name last name
3 first name last name
4 first name last name
5 first name last name
6 first name last name
7 first name last name
8 first name last name
9 first name last name
10 first name last name
11 first name last name
12 first name last name
13 first name last name
14 first name last name
15 first name last name
16 first name last name
17 first name last name
18 first name last name
NJSCS Survey Administration Guide 2.0 Appendix A Page - 2

Worksheet
Data Entry Instructions:
Data Entry
Data Display Instructions:
Physical Environment
Teaching and Learning
Morale in the School Community
Student Relationships
Parental Support
Safety
Emotional Environment
Domain Scores
Middle School and High School StudentsNew Jersey School Climate Survey
This will contain the survey results for all questions in the parental support domain.
This will contain the survey results for all questions in the morale in the school community domain.
This contains descriptions of all seven domains, and will contain the calculated domain scores, and the domain score distributions.
This will contain the survey results for all questions in the physical environment domain.
This will contain the survey results for all questions in the safety domain.
The graphical presentations in the final eight worksheets (tabs) related to the seven domains are produced from data entered on the Data Entry worksheet. The Data Entry tab requires data to be entered for the tables and graphs in subsequent tabs to be visible; therefore, you will not see graphs or tables in the tabs until data are entered. Each data display worksheet for the seven survey domains listed above and the final domain score worksheet are all locked and can not be changed. These worksheets include many formulas essential for creating the tables. All tables are based on data entered from the data entry tab. Any mistakes in data entry will create errors in these data display tables. Therefore, the use of quality control in entering data is essential.
This will contain the survey results for all questions in the emotional environment domain.
Description of MS-Excel TemplateThis MS-Excel file is provided for the purposes of Data Entry and Data Display for the New Jersey School Climate Survey. Please note that there are separate Data Entry and Data Display templates for each of the four populations that receive the School Climate Survey - Middle School and High School Students, Elementary School Students, Parents, and School Staff. The title of each template corresponds to the population being surveyed. This MS-Excel template contains 11 worksheets that are described below:
This will contain the survey results for all questions in the teaching and learning domain.
This will contain the survey results for all questions in the student relationships domain.
Description
This contains instructions for using the Data Entry worksheet.
This is the worksheet where you will enter the data for each of the completed paper questionnaires.
This contains instructions for using the Data Display worksheets.
Appendix B: Sample Data Entry and Display Tool
Note: Throughout Appendix B, the survey for middle school and high school students is used as an example. However, the instructions and guidance apply to the surveys for all four populations.
NJSCS Survey Administration Guide 2.0 Appendix B Page - 1
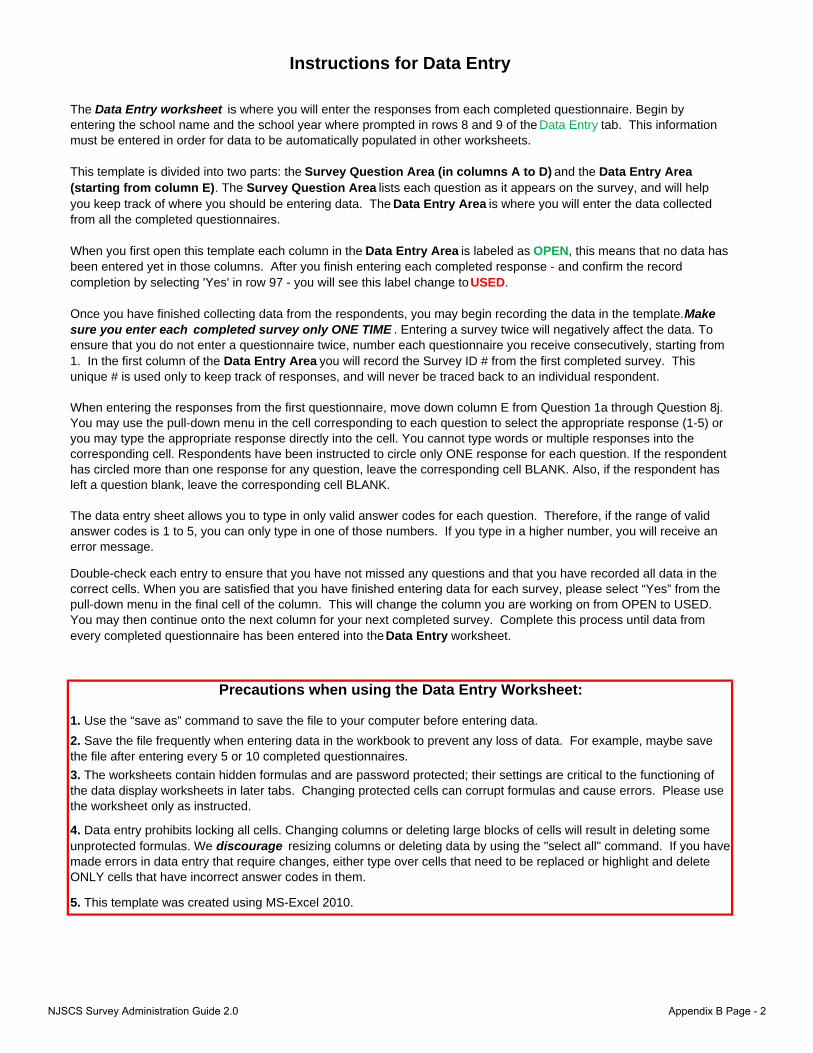
Precautions when using the Data Entry Worksheet:
1. Use the “save as” command to save the file to your computer before entering data.
The Data Entry worksheet is where you will enter the responses from each completed questionnaire. Begin by entering the school name and the school year where prompted in rows 8 and 9 of the Data Entry tab. This information must be entered in order for data to be automatically populated in other worksheets.
This template is divided into two parts: the Survey Question Area (in columns A to D) and the Data Entry Area (starting from column E). The Survey Question Area lists each question as it appears on the survey, and will help you keep track of where you should be entering data. The Data Entry Area is where you will enter the data collected from all the completed questionnaires.
When you first open this template each column in the Data Entry Area is labeled as OPEN, this means that no data has been entered yet in those columns. After you finish entering each completed response - and confirm the record completion by selecting 'Yes' in row 97 - you will see this label change to USED.
Once you have finished collecting data from the respondents, you may begin recording the data in the template. Make sure you enter each completed survey only ONE TIME . Entering a survey twice will negatively affect the data. To ensure that you do not enter a questionnaire twice, number each questionnaire you receive consecutively, starting from 1. In the first column of the Data Entry Area you will record the Survey ID # from the first completed survey. Thisunique # is used only to keep track of responses, and will never be traced back to an individual respondent.
When entering the responses from the first questionnaire, move down column E from Question 1a through Question 8j. You may use the pull-down menu in the cell corresponding to each question to select the appropriate response (1-5) or you may type the appropriate response directly into the cell. You cannot type words or multiple responses into the corresponding cell. Respondents have been instructed to circle only ONE response for each question. If the respondent has circled more than one response for any question, leave the corresponding cell BLANK. Also, if the respondent has left a question blank, leave the corresponding cell BLANK.
The data entry sheet allows you to type in only valid answer codes for each question. Therefore, if the range of valid answer codes is 1 to 5, you can only type in one of those numbers. If you type in a higher number, you will receive an error message.
Double-check each entry to ensure that you have not missed any questions and that you have recorded all data in the correct cells. When you are satisfied that you have finished entering data for each survey, please select “Yes” from the pull-down menu in the final cell of the column. This will change the column you are working on from OPEN to USED. You may then continue onto the next column for your next completed survey. Complete this process until data from every completed questionnaire has been entered into the Data Entry worksheet.
Instructions for Data Entry
4. Data entry prohibits locking all cells. Changing columns or deleting large blocks of cells will result in deleting someunprotected formulas. We discourage resizing columns or deleting data by using the "select all" command. If you have made errors in data entry that require changes, either type over cells that need to be replaced or highlight and delete ONLY cells that have incorrect answer codes in them.
2. Save the file frequently when entering data in the workbook to prevent any loss of data. For example, maybe savethe file after entering every 5 or 10 completed questionnaires.
3. The worksheets contain hidden formulas and are password protected; their settings are critical to the functioning ofthe data display worksheets in later tabs. Changing protected cells can corrupt formulas and cause errors. Please use the worksheet only as instructed.
5. This template was created using MS-Excel 2010.
NJSCS Survey Administration Guide 2.0 Appendix B Page - 2

Please Enter the School Name: Example High School
Please Enter the School Year: 2014-15
d. I like my school building.
Most students in my school…
For additional instructions, please see the instructions worksheet tab for details on how to use thisdata entry form.
_____________________________________
1. Please indicate how much you agree or disagree with the following statementsabout your school:
a. The length of the school day is about right.b. I often do not have enough time to get from one class to the next.c. My school is kept clean.
2. Please indicate how much you agree or disagree with the following statementsabout students at your school:
e. My school has clear rules and consequences for behavior.
School Climate SurveyMiddle School and High School Students
Data Entry Form_____________________________________
Instructions
a. do their best, even when their work is difficult.b. do all their homework.c. think it is OK to cheat if other students are cheating.d. try to do a good job on schoolwork even when it is not interesting.
NJSCS Survey Administration Guide 2.0 Appendix B Page - 3

c. encourage students to share their ideas about things we are studying in class.
3. Please indicate how much you agree or disagree with the following statementsabout your teachers:
My teachers…a. give me a lot of encouragement.b. make learning interesting.
a. are well-behaved.
d. notice when I am doing a good job and let me know about it.e. will help me improve my work if I do poorly on an assignment.f. provide me with lots of chances to be part of class discussions or activities.g. often assign homework that helps me learn.h. will give me extra help at school outside of our regular class.
4. Please indicate how much you agree or disagree with the following statementsabout your school:
Most students in my school…
e. There are lots of chances for students in my school to talk with a teacher one-on-one.
b. do not really care about each other.c. help each other when asked.
b. Students in my school treat each other with respect.c. Students are treated fairly by the adults in the school.d. Most students in my school are easily able to work out disagreements with other students.
d. treat each other well.
5. Please indicate how much you agree or disagree with the following statementsabout your school:
a. Teachers at my school treat students with respect.
l. My teachers really care about me.
f. Students at this school are often bullied.g. Students at this school are often teased or picked on.h. Harassment, intimidation, and bullying by other students are a problem at my school.i. Adults in this school apply the same rules to all students equally.j. I sometimes stay home because I do not feel safe at school.k. Adults in this school are usually willing to make the time to give students extra help.
NJSCS Survey Administration Guide 2.0 Appendix B Page - 4

a. outside around the school?
6. How safe do you feel…
b. in the hallways and bathrooms of the school?c. in your classes?
7. Please indicate how much you agree or disagree with the following:
Thinking back over the past year in school, how often did you… a. enjoy being in school?b. hate being in school?c. feel that the school work you were assigned was meaningful and important?
j. My parents would punish me if they found out I skipped school.i. My parents ask if I’ve gotten my homework done.
8. Please indicate how much you agree or disagree with the following:
a. Students have lots of chances in my school to get involved in sports, clubs, and other school activities outside of class.b. I have opportunities to express myself at school.c. Students help decide what goes on in my school.d. I wish I went to a different school.e. In my school, students have lots of chances to help decide things, like activities and rules.f. I feel like I belong at this school.g. Teachers and other adults here listen to students' ideas about the school.h. My family wants me to do well in school.
NJSCS Survey Administration Guide 2.0 Appendix B Page - 5

Question
Number Question Item
Total
Respondents
1
Strongly
Disagree
2
Disagree
3
Neutral
4
Agree
5
Strongly
Agree
Mean
Rating
4590 926 917 916 894 937
20.2% 20.0% 20.0% 19.5% 20.4% 3.00
DOMAIN DOMAIN DESCRIPTION DOMAIN SCORE
Ph
ysical
Enviro
nm
ent
This domain addresses scheduling, the use of the
building, and attitudes toward the building.
49.9
Precautions when using the Data Display Templates:
1. Use the "print preview" command to see the pages that will print before printing . This file should produce 14 pages of output. The last eight pages, from 7 to 14, are considered your report tables. Each table should be formatted properly for printing. You may want to first print the file as a PDF before printing from this Excel file. The PDF file can then be edited by deleting or adding pages for your report.2. The template contains hidden formulas and is password protected.
Response Category
Reading the Overall Domain Score Sheet
The domain scores sheet has been designed to produce a one-page summary of all domain scores, which is easily printed. Each
domain is depicted and described in plain language in the domain description column. The domain score represents a value
ranging from 0 to 100, which has been tabulated from the survey responses. A higher score represents a healthier, more positive
school climate in that domain. In the example below, Physical Environment has been tabulated into a score of 49.9. The domain
score distribution is a bar graph that depicts the distribution of individual student answers, grouped into deciles. Thus, if an
individual student’s survey scores a certain domain as 23, that student will be placed in the decile group between 20 and 30. The
bar will be higher if more students place within that specified range, or lower if fewer students place within that range. In the
example below, about 25% of students scored Physical Environment in the range between 30 and 40.
DOMAIN SCORE DISTRIBUTION (in deciles)
School Climate Survey
Middle School and High School Students
Instructions on Data Display
These instructions provide an overview of the NJ School Climate Survey Data Display worksheet and serve as a guide for understanding as well as interpreting the survey results. This section provides instructions on how to interpret a set of sample tables which look just like the ones that appear on the actual results tabs.
Reading the Individual Domain Scores
When you click on a domain tab, such as Physical Environment, the rows will show each of the individual question items from which the domain is constructed, while the columns contain information on the distribution of student responses as well as the overall mean rating. The number in the total respondents' column represents the number of students who answered the item, in the example below it is 4590. Also, all potential response categories are tabulated in terms of both the raw number of students who selected a particular response option and the percentage of the total respondents who answered that way. In the example below, 926 students (or 20.2%) strongly disagreed that the length of the school day was about right. You may note that the total sum of the raw scores from all available response categories should add up to the number of total respondents indicated in the table. The summed percentages from each response category should add up to approximately 100.0%. (Minor differences may occur due to rounding.) Additionally, since the response categories have numerical values associated with them a mean for the item can be calculated by summing all the individual responses and dividing by the total number of respondents. In this way, a higher or lower score can relate to either a more positive or negative school climate depending on the wording of the question. In this example, the mean ranges from 1 to 5, and is calculated as 3.00, or very close to neutral.
1aThe length of the school
day is about right
NJSCS Survey Administration Guide 2.0 Appendix B Page - 6

School Climate Survey ‐ Middle School and High School StudentsExample High School
Question Number Question Item
Total Respondents
1
Strongly
Disagree
2
Disagree
3
Neutral
4
Agree
5
Strongly
Agree
Mean Rating
4590 926 917 916 894 93720.2% 20.0% 20.0% 19.5% 20.4% 3.00
4593 913 895 970 934 88119.9% 19.5% 21.1% 20.3% 19.2% 2.99
4588 934 911 959 912 87220.4% 19.9% 20.9% 19.9% 19.0% 2.97
4584 896 906 920 991 87119.5% 19.8% 20.1% 21.6% 19.0% 3.01
1d
Response Category
The length of the school day is about right
I often do not have enough time to get from one class to the next
My school is kept clean
I like my school building
2014‐15DOMAIN: PHYSICAL ENVIRONMENT
1a
1b
1c
NJSCS Survey Administration Guide 2.0 Appendix B Page - 7

School Climate Survey ‐ Middle School and High School StudentsExample High School
Question Number Question Item
Total Respondents
1
Strongly
Disagree
2
Disagree
3
Neutral
4
Agree
5
Strongly
Agree
Mean Rating
4574 921 894 912 912 93520.1% 19.5% 19.9% 19.9% 20.4% 3.01
4613 922 915 906 931 93920.0% 19.8% 19.6% 20.2% 20.4% 3.01
4607 910 918 927 926 92619.8% 19.9% 20.1% 20.1% 20.1% 3.01
4623 942 890 902 926 96320.4% 19.3% 19.5% 20.0% 20.8% 3.02
4611 933 924 947 901 90620.2% 20.0% 20.5% 19.5% 19.6% 2.98
4594 918 905 904 946 92120.0% 19.7% 19.7% 20.6% 20.0% 3.01
4617 835 969 955 944 91418.1% 21.0% 20.7% 20.4% 19.8% 3.03
4603 941 940 895 925 90220.4% 20.4% 19.4% 20.1% 19.6% 2.98
4612 919 943 898 905 94719.9% 20.4% 19.5% 19.6% 20.5% 3.00
4620 913 900 931 947 92919.8% 19.5% 20.2% 20.5% 20.1% 3.02
School Climate Survey ‐ Middle School and High School StudentsExample High School
Question Number Question Item
Total Respondents
1
Never
2
Seldom
3
Some‐
times
4
Often
5
Almost
Always
Mean Rating
4601 889 923 925 941 923
19.3% 20.1% 20.1% 20.5% 20.1% 3.02
DOMAIN: TEACHING AND LEARNING
Response Category
My teachers give me a lot of encouragement
My teachers encourage students to share their ideas about things we are studying in class
My teachers make learning interesting
Thinking back over the past year in school, how often did you feel that the school work you were assigned was meaningful and important?
5k
7c
My teachers will help me improve my work if I do poorly on an assignmentMy teachers provide me with lots of chances to be part of class discussions or activities
My teachers often assign homework that helps me learn
My teachers will give me extra help at school outside of our regular class
2014‐15DOMAIN: TEACHING AND LEARNING
Response Category
2014‐15
3a
3b
3c
3dMy teachers notice when I am doing a good job and let me know about it
3e
3f
3g
3h
5a Teachers at my school treat students with respect
Adults in this school are usually willing to make the time to give students extra help
NJSCS Survey Administration Guide 2.0 Appendix B Page - 8
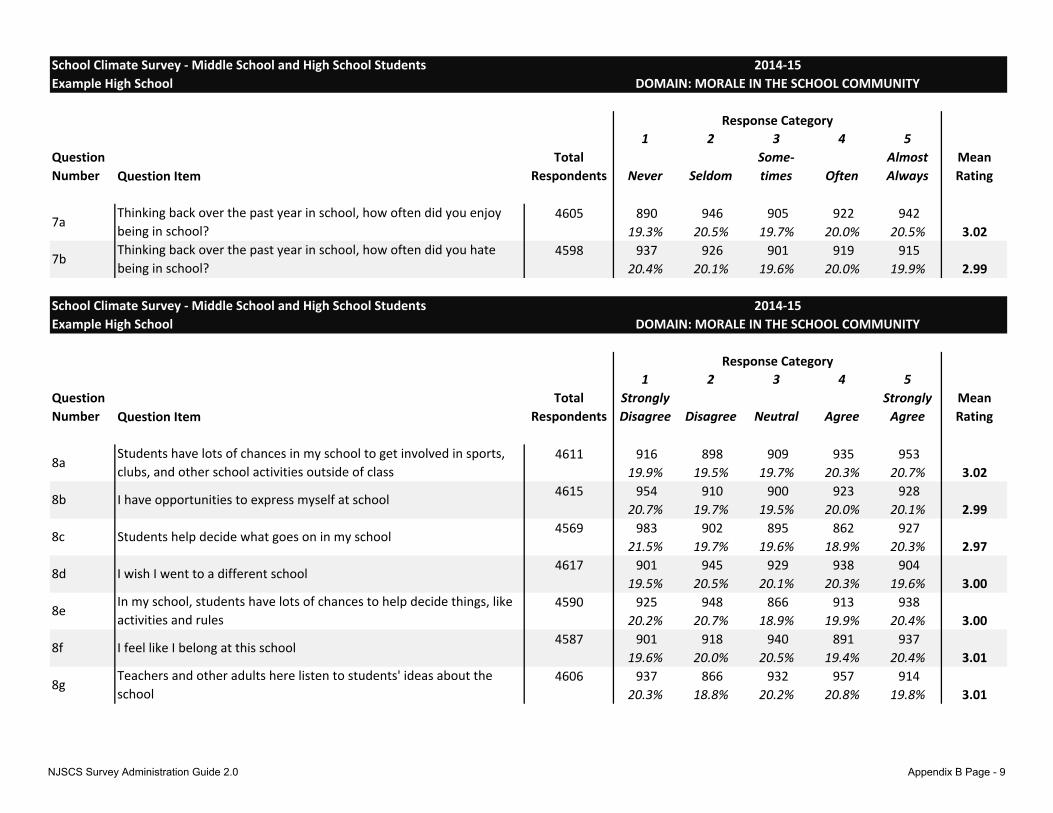
School Climate Survey ‐ Middle School and High School StudentsExample High School
Question Number Question Item
Total Respondents
1
Never
2
Seldom
3
Some‐
times
4
Often
5
Almost
Always
Mean Rating
4605 890 946 905 922 94219.3% 20.5% 19.7% 20.0% 20.5% 3.02
4598 937 926 901 919 91520.4% 20.1% 19.6% 20.0% 19.9% 2.99
School Climate Survey ‐ Middle School and High School StudentsExample High School
Question Number Question Item
Total Respondents
1
Strongly
Disagree
2
Disagree
3
Neutral
4
Agree
5
Strongly
Agree
Mean Rating
4611 916 898 909 935 95319.9% 19.5% 19.7% 20.3% 20.7% 3.02
4615 954 910 900 923 92820.7% 19.7% 19.5% 20.0% 20.1% 2.99
4569 983 902 895 862 92721.5% 19.7% 19.6% 18.9% 20.3% 2.97
4617 901 945 929 938 90419.5% 20.5% 20.1% 20.3% 19.6% 3.00
4590 925 948 866 913 93820.2% 20.7% 18.9% 19.9% 20.4% 3.00
4587 901 918 940 891 93719.6% 20.0% 20.5% 19.4% 20.4% 3.01
4606 937 866 932 957 91420.3% 18.8% 20.2% 20.8% 19.8% 3.01
8f I feel like I belong at this school
8d
8g
8e
Teachers and other adults here listen to students' ideas about the school
In my school, students have lots of chances to help decide things, like activities and rules
8b
DOMAIN: MORALE IN THE SCHOOL COMMUNITY
Response Category
Thinking back over the past year in school, how often did you enjoy being in school?
I wish I went to a different school
8c Students help decide what goes on in my school
2014‐15DOMAIN: MORALE IN THE SCHOOL COMMUNITY
Response Category
I have opportunities to express myself at school
2014‐15
7a
7bThinking back over the past year in school, how often did you hate being in school?
8aStudents have lots of chances in my school to get involved in sports, clubs, and other school activities outside of class
NJSCS Survey Administration Guide 2.0 Appendix B Page - 9

School Climate Survey ‐ Middle School and High School StudentsExample High School
Question Number Question Item
Total Respondents
1
Strongly
Disagree
2
Disagree
3
Neutral
4
Agree
5
Strongly
Agree
Mean Rating
4583 907 919 905 943 90919.8% 20.1% 19.7% 20.6% 19.8% 3.01
4600 866 945 928 937 92418.8% 20.5% 20.2% 20.4% 20.1% 3.02
4591 930 889 862 948 96220.3% 19.4% 18.8% 20.6% 21.0% 3.03
4596 897 976 888 908 92719.5% 21.2% 19.3% 19.8% 20.2% 3.00
Harassment, intimidation, and bullying by other students are a problem at my school
2014‐15
5b
5f
5g
5h
DOMAIN: STUDENT RELATIONSHIPS
Response Category
Students in my school treat each other with respect
Students at this school are often teased or picked on
Students at this school are often bullied
NJSCS Survey Administration Guide 2.0 Appendix B Page - 10

School Climate Survey ‐ Middle School and High School StudentsExample High School
Question Number Question Item
Total Respondents
1
Strongly
Disagree
2
Disagree
3
Neutral
4
Agree
5
Strongly
Agree
Mean Rating
4563 912 883 938 892 93820.0% 19.4% 20.6% 19.5% 20.6% 3.01
4627 912 908 939 960 90819.7% 19.6% 20.3% 20.7% 19.6% 3.01
4621 918 945 875 925 95819.9% 20.5% 18.9% 20.0% 20.7% 3.01
2014‐15
8h
8i
8j
DOMAIN: PARENTAL SUPPORT
Response Category
My family wants me to do well in school
My parents ask if I’ve gotten my homework done
My parents would punish me if they found out I skipped school
NJSCS Survey Administration Guide 2.0 Appendix B Page - 11

School Climate Survey ‐ Middle School and High School StudentsExample High School
Question Number Question Item
Total Respondents
1
Strongly
Disagree
2
Disagree
3
Neutral
4
Agree
5
Strongly
Agree
Mean Rating
4621 914 903 884 918 100219.8% 19.5% 19.1% 19.9% 21.7% 3.04
School Climate Survey ‐ Middle School and High School StudentsExample High School
Question Number Question Item
Total Respondents
1
Not
Safe
2
Some‐
what Safe
3
Mostly
Safe
4
Very
Safe
Mean Rating
4595 1136 1142 1162 115524.7% 24.9% 25.3% 25.1% 2.51
4596 1141 1188 1118 114924.8% 25.8% 24.3% 25.0% 2.49
4588 1153 1202 1091 114225.1% 26.2% 23.8% 24.9% 2.48
6c How safe do you feel in your classes?
6a How safe do you feel outside around the school?
2014‐15DOMAIN: SAFETY
Response Category
5j I sometimes stay home because I do not feel safe at school
2014‐15DOMAIN: SAFETY
Response Category
6b How safe do you feel in the hallways and bathrooms of the school?
NJSCS Survey Administration Guide 2.0 Appendix B Page - 12

School Climate Survey ‐ Middle School and High School StudentsExample High School
Question Number Question Item
Total Respondents
1
Strongly
Disagree
2
Disagree
3
Neutral
4
Agree
5
Strongly
Agree
Mean Rating
4599 900 898 933 950 91819.6% 19.5% 20.3% 20.7% 20.0% 3.02
4581 882 951 916 931 90119.3% 20.8% 20.0% 20.3% 19.7% 3.00
4595 897 951 904 925 91819.5% 20.7% 19.7% 20.1% 20.0% 3.00
4625 903 955 943 909 91519.5% 20.6% 20.4% 19.7% 19.8% 3.00
4611 939 914 920 906 93220.4% 19.8% 20.0% 19.6% 20.2% 3.00
4606 958 967 935 862 88420.8% 21.0% 20.3% 18.7% 19.2% 2.95
4569 897 971 865 893 94319.6% 21.3% 18.9% 19.5% 20.6% 3.00
4598 949 907 881 949 91220.6% 19.7% 19.2% 20.6% 19.8% 2.99
4607 926 908 938 899 93620.1% 19.7% 20.4% 19.5% 20.3% 3.00
4605 892 902 904 970 93719.4% 19.6% 19.6% 21.1% 20.3% 3.03
4588 928 907 893 916 94420.2% 19.8% 19.5% 20.0% 20.6% 3.01
4571 869 890 980 919 91319.0% 19.5% 21.4% 20.1% 20.0% 3.03
4617 928 902 956 931 90020.1% 19.5% 20.7% 20.2% 19.5% 2.99
4574 875 911 911 942 93519.1% 19.9% 19.9% 20.6% 20.4% 3.03
Adults in this school apply the same rules to all students equally
DOMAIN: EMOTIONAL ENVIRONMENT
Students are treated fairly by the adults in the school
Most students in my school are easily able to work out disagreements with other studentsThere are lots of chances for students in my school to talk with a teacher one‐on‐one
Response Category
My school has clear rules and consequences for behavior.
Most students in my school do all their homework
Most students in my school think it is OK to cheat if other students are cheatingMost students in my school try to do a good job on schoolwork even when it is not interesting
Most students in my school do their best, even when their work is difficult
Most students in my school are well‐behaved
Most students in my school do not really care about each other
Most students in my school help each other when asked
Most students in my school treat each other well
2014‐15
My teachers really care about me
1e
2a
2b
2c
2d
4a
4b
4c
4d
5c
5d
5e
5i
5l
NJSCS Survey Administration Guide 2.0 Appendix B Page - 13

School Climate Survey ‐ Middle School and High School StudentsExample High School
DOMAIN DOMAIN DESCRIPTION DOMAIN SCORE DOMAIN SCORE DISTRIBUTION (in deciles)
PhysicalEnvironm
ent
This domain addresses scheduling, the use of the building, and attitudestoward the building. 49.9
Teaching and
Learning
This domain focuses on the academic climate of the school and probessupport for student development, levels of instructional challenge andrelevance, and learning and personal pride in successfully achievingacademic objectives by students of learning and teachers of teaching. Italso includes general attitudinal measures of satisfaction with the school’soverall instructional quality.
50.3
Morale
in the School
Community
This domain addresses “pride of place” as ownership and identificationwith the school’s central character, as well as a call to all stakeholders for“belonging” to the school. By considering the school as a “commoncause,” this domain assesses the school leadership’s ability to supportand rally the school community to healthy and positive outcomes.
50.1
StudentRelationships
This domain assesses the degree to which relationships between studentsare open, honest, and respectful and lead to positive outcomes ratherthan negative, preventable outcomes such as bullying, harassment, andintimidation.
49.9
ParentalSupport
This domain is concerned with the degree to which parents andcommunity members are incorporated into both the social and academicfabric of the school. This includes assessing the efficacy of school‐homecommunications and an assessment of the degree of home support forlearning.
50.6
Safety
This domain addresses attitudes toward the individual’s sense of physicalsafety in and around the school. 49.8
Emotional
Environment
This domain addresses attitudes toward the social environment. Thisincludes perceptions of how the average student ought to, and does,behave as well as the general fairness of the school.
50.1
DOMAIN SCORE RESULTS2014‐15
0%
10%
20%
30%
40%
50%
0 to 10 >10 to 20 >20 to 30 >30 to 40 >40 to 50 >50 to 60 >60 to 70 >70 to 80 >80 to 90 >90 to 100
0%
10%
20%
30%
40%
50%
0 to 10 >10 to 20 >20 to 30 >30 to 40 >40 to 50 >50 to 60 >60 to 70 >70 to 80 >80 to 90 >90 to 100
0%
10%
20%
30%
40%
50%
0 to 10 >10 to 20 >20 to 30 >30 to 40 >40 to 50 >50 to 60 >60 to 70 >70 to 80 >80 to 90 >90 to 100
0%
10%
20%
30%
40%
50%
0 to 10 >10 to 20 >20 to 30 >30 to 40 >40 to 50 >50 to 60 >60 to 70 >70 to 80 >80 to 90 >90 to 100
0%
10%
20%
30%
40%
50%
0 to 10 >10 to 20 >20 to 30 >30 to 40 >40 to 50 >50 to 60 >60 to 70 >70 to 80 >80 to 90 >90 to 100
0%
10%
20%
30%
40%
50%
0 to 10 >10 to 20 >20 to 30 >30 to 40 >40 to 50 >50 to 60 >60 to 70 >70 to 80 >80 to 90 >90 to 100
0%
10%
20%
30%
40%
50%
0 to 10 >10 to 20 >20 to 30 >30 to 40 >40 to 50 >50 to 60 >60 to 70 >70 to 80 >80 to 90 >90 to 100
NJSCS Survey Administration Guide 2.0 Appendix B Page - 14