new jersey: hydrogen and fuel cell development...
TRANSCRIPT
Hydrogen and Fuel Cell Development Plan2018
New JerseyHydrogen EconomyEconomic DevelopmentEnvironmental Performance
Energy Reliability

w w w . n e e s c . o r g 1 | P a g e
Hydrogen and Fuel Cell Development Plan – A “Roadmap” for New Jersey
Collaborative Participants
New Jersey Fuel Cell Coalition JoAnn Milliken
Breakthrough Technologies Institute Robert Rose
Project Management and Plan Development
Northeast Electrochemical Energy Storage Cluster Joel M. Rinebold – Program Director
Paul Aresta – Project Manager Alexander C. Barton – Energy Specialist
Jennifer Dierkens – GIS Specialist
Supporting Agencies United States Small Business Administration1
Cover Photo References Connecticut Center for Advanced Technology; “New Jersey skyline;” January 2014.
Connecticut Center for Advanced Technology; “Toyota Mirai”; April 2015. Doc Searls; “2014_02_06_lhr-ewr_417;” https://creativecommons.org/licenses/by/2.0/; February 2014.
Doosan Fuel Cell America; Data Centers & Telecom; “Providing reliable and efficient energy solutions for mission-critical applications”; http://www.doosanfuelcell.com/en/markets/data-centers-telcom/; February 2018.
1 NEESC is a network of industry, academic, government and non-governmental leaders working together to help businesses that provide energy storage solutions, particularly hydrogen fuel cell systems. Supported by the U.S. Small Business Administration’s Innovative Economies Initiative, NEESC activities will lead to increased U.S. based market share, economic activity, productivity, technology deployment, and job creation.
w w w . n e e s c . o r g 2 | P a g e
TABLE OF CONTENTS
EXECUTIVE SUMMARY ............................................................................................................................. 3
INTRODUCTION .......................................................................................................................................... 4
Technology Description ............................................................................................................................................ 4
Industry/Market Status .............................................................................................................................................. 4
DRIVERS ...................................................................................................................................................... 5
Economic Impact ...................................................................................................................................................... 6
Environmental Benefits ............................................................................................................................................. 7
Energy Resiliency ..................................................................................................................................................... 7
Policy ........................................................................................................................................................................ 8
CONSISTENCY WITH NEW JERSEY’S ENERGY PLANS ......................................................................................... 8
FUEL CELLS FOR STATIONARY POWER............................................................................................................. 9
Tri-generation .......................................................................................................................................................... 10
Emergency Preparedness ......................................................................................................................................... 10
Stationary Fuel Cell Market/Policy Opportunities .................................................................................................. 10
FUEL CELLS FOR TRANSPORTATION............................................................................................................... 12
Light/Medium Duty Vehicle Fleets ......................................................................................................................... 13
Bus Transit .............................................................................................................................................................. 13
Specialty Vehicles ................................................................................................................................................... 13
Hydrogen Infrastructure .......................................................................................................................................... 14
Hydrogen/Fuel Cell Transportation Market/Policy Opportunities .......................................................................... 14
CONCLUSION ................................................................................................................................................ 16
INDEX OF FIGURES
Figure 1 – Hydrogen Production and Use ..................................................................................................................... 4
INDEX OF TABLES
TABLE 1 – NEW JERSEY ECONOMIC DATA – HYDROGEN FUEL CELL INDUSTRY ............................................... 6
TABLE 2 – NEW JERSEY HYDROGEN FUEL CELL POLICY INCENTIVES ........................................................................... 8
TABLE 3 – FUEL CELL SYSTEM ADVANTAGES ............................................................................................................... 9
TABLE 4 – STATIONARY FUEL CELL TARGET APPLICATIONS ...................................................................................... 10
TABLE 5 – POLICY/INCENTIVES FOR STATIONARY FUEL CELL DEVELOPMENT ........................................................... 11
TABLE 6 – FCEV ADVANTAGES .................................................................................................................................. 12
TABLE 7 – TRANSPORTATION FUEL CELL TARGETS .................................................................................................... 12
TABLE 8 – FC MATERIAL HANDLER ADVANTAGES ..................................................................................................... 13
TABLE 9 – CRITERIA FOR FCEV DEPLOYMENT ........................................................................................................... 14
TABLE 10 – POLICY/INCENTIVES FOR FCEV DEPLOYMENT ........................................................................................ 15
w w w . n e e s c . o r g 3 | P a g e
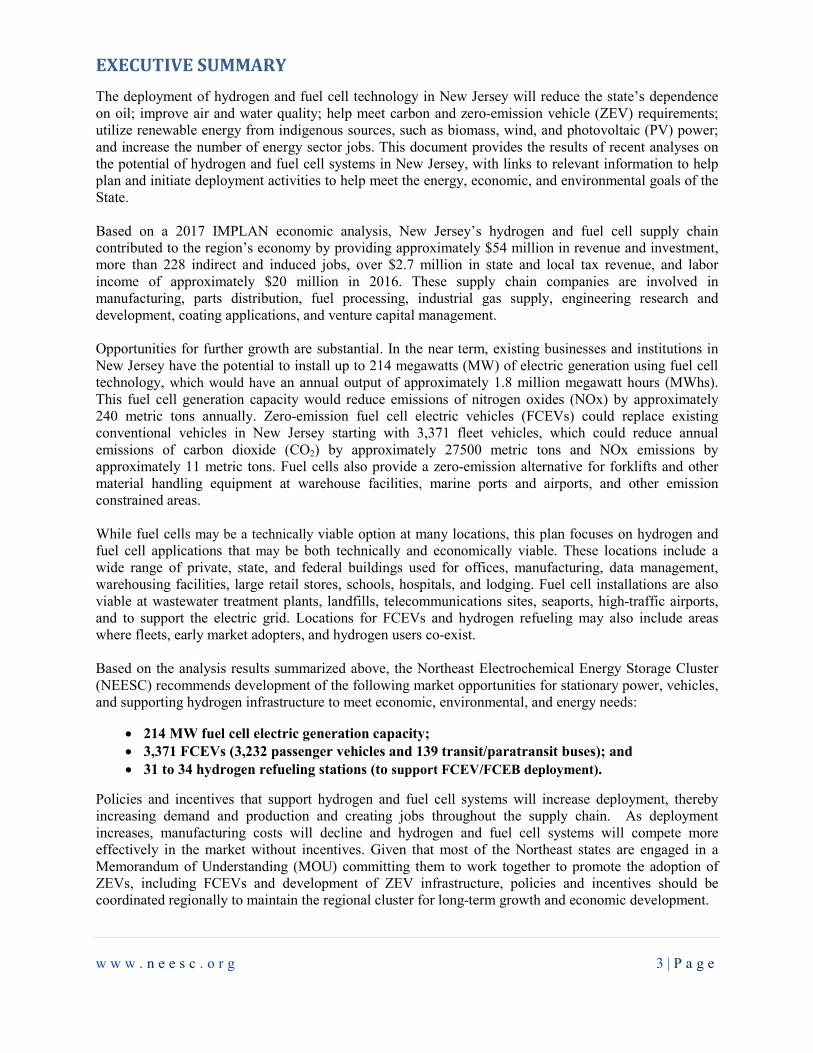
EXECUTIVE SUMMARY
The deployment of hydrogen and fuel cell technology in New Jersey will reduce the state’s dependence on oil; improve air and water quality; help meet carbon and zero-emission vehicle (ZEV) requirements; utilize renewable energy from indigenous sources, such as biomass, wind, and photovoltaic (PV) power; and increase the number of energy sector jobs. This document provides the results of recent analyses on the potential of hydrogen and fuel cell systems in New Jersey, with links to relevant information to help plan and initiate deployment activities to help meet the energy, economic, and environmental goals of the State. Based on a 2017 IMPLAN economic analysis, New Jersey’s hydrogen and fuel cell supply chain contributed to the region’s economy by providing approximately $54 million in revenue and investment, more than 228 indirect and induced jobs, over $2.7 million in state and local tax revenue, and labor income of approximately $20 million in 2016. These supply chain companies are involved in manufacturing, parts distribution, fuel processing, industrial gas supply, engineering research and development, coating applications, and venture capital management. Opportunities for further growth are substantial. In the near term, existing businesses and institutions in New Jersey have the potential to install up to 214 megawatts (MW) of electric generation using fuel cell technology, which would have an annual output of approximately 1.8 million megawatt hours (MWhs). This fuel cell generation capacity would reduce emissions of nitrogen oxides (NOx) by approximately 240 metric tons annually. Zero-emission fuel cell electric vehicles (FCEVs) could replace existing conventional vehicles in New Jersey starting with 3,371 fleet vehicles, which could reduce annual emissions of carbon dioxide (CO2) by approximately 27500 metric tons and NOx emissions by approximately 11 metric tons. Fuel cells also provide a zero-emission alternative for forklifts and other material handling equipment at warehouse facilities, marine ports and airports, and other emission constrained areas. While fuel cells may be a technically viable option at many locations, this plan focuses on hydrogen and fuel cell applications that may be both technically and economically viable. These locations include a wide range of private, state, and federal buildings used for offices, manufacturing, data management, warehousing facilities, large retail stores, schools, hospitals, and lodging. Fuel cell installations are also viable at wastewater treatment plants, landfills, telecommunications sites, seaports, high-traffic airports, and to support the electric grid. Locations for FCEVs and hydrogen refueling may also include areas where fleets, early market adopters, and hydrogen users co-exist. Based on the analysis results summarized above, the Northeast Electrochemical Energy Storage Cluster (NEESC) recommends development of the following market opportunities for stationary power, vehicles, and supporting hydrogen infrastructure to meet economic, environmental, and energy needs:
• 214 MW fuel cell electric generation capacity; • 3,371 FCEVs (3,232 passenger vehicles and 139 transit/paratransit buses); and • 31 to 34 hydrogen refueling stations (to support FCEV/FCEB deployment).
Policies and incentives that support hydrogen and fuel cell systems will increase deployment, thereby increasing demand and production and creating jobs throughout the supply chain. As deployment increases, manufacturing costs will decline and hydrogen and fuel cell systems will compete more effectively in the market without incentives. Given that most of the Northeast states are engaged in a Memorandum of Understanding (MOU) committing them to work together to promote the adoption of ZEVs, including FCEVs and development of ZEV infrastructure, policies and incentives should be coordinated regionally to maintain the regional cluster for long-term growth and economic development.
w w w . n e e s c . o r g 4 | P a g e
INTRODUCTION
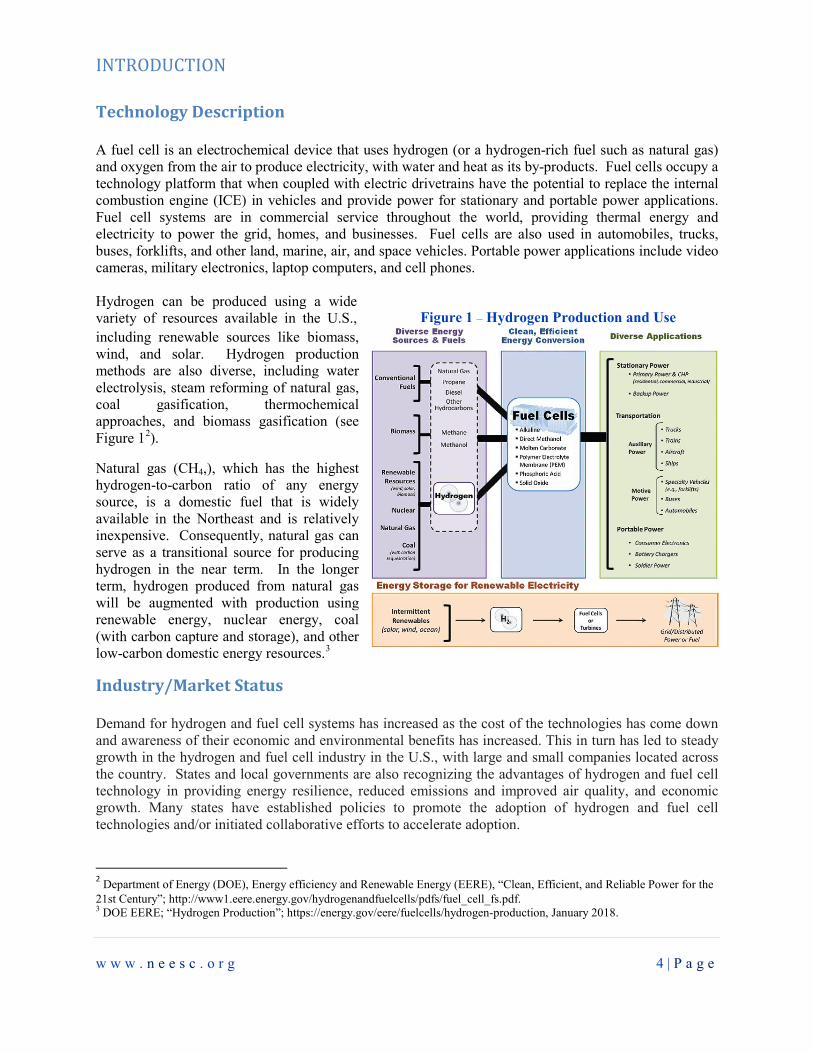
Technology Description A fuel cell is an electrochemical device that uses hydrogen (or a hydrogen-rich fuel such as natural gas) and oxygen from the air to produce electricity, with water and heat as its by-products. Fuel cells occupy a technology platform that when coupled with electric drivetrains have the potential to replace the internal combustion engine (ICE) in vehicles and provide power for stationary and portable power applications. Fuel cell systems are in commercial service throughout the world, providing thermal energy and electricity to power the grid, homes, and businesses. Fuel cells are also used in automobiles, trucks, buses, forklifts, and other land, marine, air, and space vehicles. Portable power applications include video cameras, military electronics, laptop computers, and cell phones. Hydrogen can be produced using a wide variety of resources available in the U.S., including renewable sources like biomass, wind, and solar. Hydrogen production methods are also diverse, including water electrolysis, steam reforming of natural gas, coal gasification, thermochemical approaches, and biomass gasification (see Figure 12).
Natural gas (CH4,), which has the highest hydrogen-to-carbon ratio of any energy source, is a domestic fuel that is widely available in the Northeast and is relatively inexpensive. Consequently, natural gas can serve as a transitional source for producing hydrogen in the near term. In the longer term, hydrogen produced from natural gas will be augmented with production using renewable energy, nuclear energy, coal (with carbon capture and storage), and other low-carbon domestic energy resources.3
Industry/Market Status Demand for hydrogen and fuel cell systems has increased as the cost of the technologies has come down and awareness of their economic and environmental benefits has increased. This in turn has led to steady growth in the hydrogen and fuel cell industry in the U.S., with large and small companies located across the country. States and local governments are also recognizing the advantages of hydrogen and fuel cell technology in providing energy resilience, reduced emissions and improved air quality, and economic growth. Many states have established policies to promote the adoption of hydrogen and fuel cell technologies and/or initiated collaborative efforts to accelerate adoption.
2 Department of Energy (DOE), Energy efficiency and Renewable Energy (EERE), “Clean, Efficient, and Reliable Power for the 21st Century”; http://www1.eere.energy.gov/hydrogenandfuelcells/pdfs/fuel_cell_fs.pdf. 3 DOE EERE; “Hydrogen Production”; https://energy.gov/eere/fuelcells/hydrogen-production, January 2018.
Figure 1 – Hydrogen Production and Use

w w w . n e e s c . o r g 5 | P a g e
The U.S. Department of Energy’s (DOE) “State of the States: Fuel Cells in America 2016” Report provides an up-to-date resource for hydrogen and fuel cell policies and deployment activities in each State. This DOE Report notes that fuel cell power plants are located in at least 43 states, providing power to commercial and municipal operations. Cities are adopting fuel cells to power essential services when the grid goes down; telecom companies are using fuel cells to power communication towers; and businesses are using fuel cell systems to power retail sites and data centers. 4
Stationary fuel cells are providing stable power and heat around the world in microgrids and at wastewater treatment plants, food and beverage plants, office buildings, telecommunication hubs, data centers, retail stores, universities, hospitals, hotels, government facilities, and other applications. In New Jersey, highly efficient CHP and all-electric fuel cell systems have been successfully operating as part of the State’s Clean Energy Program (CEP).
On the utility side of the meter, large-scale fuel cell systems are being deployed to support the electric grid where transmission is constrained or increased reliability is sought, including an approximately 15 megawatt (MW) system in Connecticut, a 30 MW system in Delaware, and a 59 MW system in Seoul, Korea. These fuel cell systems are providing clean, 24/7, power generation to complement the increasing deployment of intermittent solar and wind resources and support grid reliability in locations where it is most needed.
In 2013, the governors of California, Connecticut, Maryland, Massachusetts, New York, Oregon, Rhode Island and Vermont signed a MOU, committing to support the deployment of 3.3 million ZEVs by 2025, including FCEVs. New Jersey and Maine, while not signatories to the MOU, have also adopted California’s ZEV standards.
DRIVERS Economic benefits, environmental quality, and energy reliability are driving the development of hydrogen and fuel cell technologies for regional, national and global markets. Federal research and development and demonstration programs, supported by federal tax incentives for FCEVs, hydrogen infrastructure, and fuel cell stationary power generation, have been important drivers. However, the support and investment of state and local governments has been instrumental in spurring the use of fuel cell and hydrogen systems in many parts of the U.S. At least 30 states currently include fuel cells or hydrogen as eligible resources in their Renewable Portfolio Standards (RPS) and permit net metering of fuel cells; 25 states support fuel cells by offering rebates, grants, loans, bonds, special financing, or public benefits funding; and 16 states provide personal, corporate, property and/or sales tax incentives for fuel cells.5 In 2017, NEESC, which is administered by the Connecticut Center for Advanced Technology (CCAT) and supported by the U.S. Small Business Administration (SBA), updated an economic analysis of the Northeast region’s fuel cell and hydrogen industry. The analysis found that the industry experienced growth over the last five years in employment, revenue and investment, labor income, and state and local tax revenue. The age distribution of hydrogen and fuel cell companies in the Northeast states suggests a substantial expansion in the sector, with several small businesses exhibiting recent growth. Growth of hydrogen and fuel cell patents in the Northeast far exceeds the growth of all types of clean energy patents in the region. Analysis also indicates a high geographic concentration of hydrogen and fuel cell original equipment 4State of the States: Fuel Cells in America 2016, DOE Fuel Cell Technologies Office, November 2016; https://energy.gov/sites/prod/files/2016/11/f34/fcto_state_of_states_2016.pdf. 5 State of the States: Fuel Cells in America 2016, DOE Fuel Cell Technologies Office, November 2016.
w w w . n e e s c . o r g 6 | P a g e
State/Local Tax ($M) 2.7 Indirect Revenue and Investment ($M) 37.3 Indirect Jobs 138 Indirect Labor Income ($M) 14.3 Induced Revenue and Investment ($M) 17 Induced Jobs 90 Induced Labor Income ($M) 5.6 Total Revenue and Investment ($M) 54.4 Total Jobs 228 Total Labor Income ($M) 20
manufacturers (OEMs) and supply chain companies in the Northeast and identifies the region as a global leader in the hydrogen and fuel cell sector with all of the hallmarks of a vibrant and strong cluster. The proximity of the OEM and supply chain companies in this cluster has provided a competitive advantage for research, design, development, manufacturing, and export of commercial products to national and international markets. Analysis of New Jersey’s emerging hydrogen and fuel cell industry indicates that the state has a definitive and attractive economic development opportunity as this collective industry strives to meet global demand for clean, low carbon heat and power. New Jersey’s biomass, wind, and photovoltaic (PV) power production initiatives could be further enhanced with energy storage provided by hydrogen. These drivers will become more important as users turn to sustainable energy sources in place of fossil fuels. The following sections provide information specific to the State of New Jersey.
Economic Impact6
The NEESC economic analysis also found that the hydrogen and fuel cell supply chain in the Northeast states contributed:
• Nearly $1.4 billion in revenue and investment; • More than 6,620 direct, indirect and induced jobs; and • Labor income of approximately $615 million.
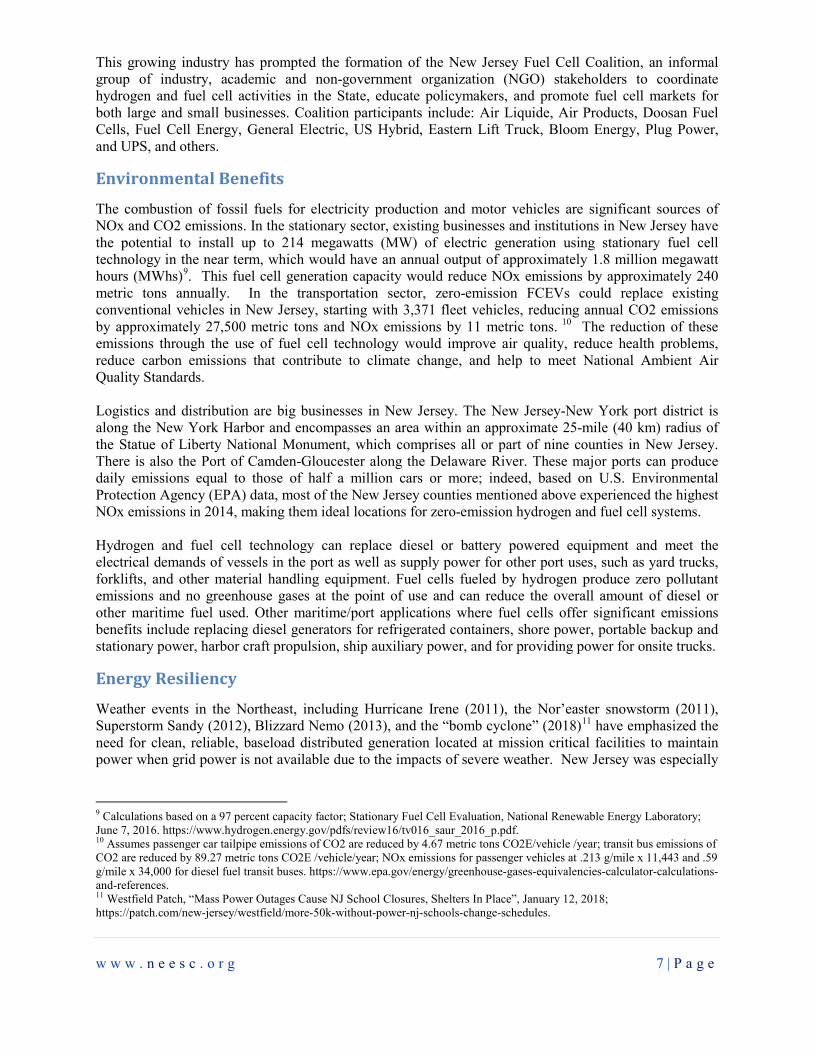
In 2016, New Jersey’s hydrogen and fuel cell supply chain realized approximately $54 million in revenue and investment, and contributed over $2.7 million in state and local tax revenue. These companies are involved in manufacturing, parts distribution, fuel processing, industrial gas supply, engineering research and development (R&D), coating applications, and venture capital management.7 More than 200 indirect and induced jobs were provided resulting in labor income of approximately $20 million. This economic data (see Table 1) comes from an IMPLAN Economic Financial Model8 analysis conducted by NEESC.
6 2017 Economic Impact of the Northeastern Hydrogen Energy and Fuel Cell Industry, NEESC, Todd Gabe, September 2017. 7 Northeast Electrochemical Energy Storage Cluster Supply Chain Database, http://neesc.org/resources/?type=1, December 8, 2016. 8 IMPLAN is an economic impact assessment software system that develops local-level input-output models to estimate the economic impact of new firms moving into a region. This analysis assesses the direct, indirect, and induced values of the Northeast region’s hydrogen and fuel cell industry. Indirect impacts are the estimated output (i.e., revenue), employment and labor income in other business (i.e., non OEMs) that are associated with the purchases made by hydrogen and fuel cell OEMs, as well as other companies in the sector’s supply chain. Induced impacts are the estimated output, employment and labor income in other businesses (i.e., non OEMs) that are associated with the purchases by workers related to the hydrogen and fuel cell industry.
Table 1 – New Jersey Economic Data – Hydrogen Fuel Cell Industry (2016)
w w w . n e e s c . o r g 7 | P a g e
This growing industry has prompted the formation of the New Jersey Fuel Cell Coalition, an informal group of industry, academic and non-government organization (NGO) stakeholders to coordinate hydrogen and fuel cell activities in the State, educate policymakers, and promote fuel cell markets for both large and small businesses. Coalition participants include: Air Liquide, Air Products, Doosan Fuel Cells, Fuel Cell Energy, General Electric, US Hybrid, Eastern Lift Truck, Bloom Energy, Plug Power, and UPS, and others.
Environmental Benefits
The combustion of fossil fuels for electricity production and motor vehicles are significant sources of NOx and CO2 emissions. In the stationary sector, existing businesses and institutions in New Jersey have the potential to install up to 214 megawatts (MW) of electric generation using stationary fuel cell technology in the near term, which would have an annual output of approximately 1.8 million megawatt hours (MWhs)9. This fuel cell generation capacity would reduce NOx emissions by approximately 240 metric tons annually. In the transportation sector, zero-emission FCEVs could replace existing conventional vehicles in New Jersey, starting with 3,371 fleet vehicles, reducing annual CO2 emissions by approximately 27,500 metric tons and NOx emissions by 11 metric tons. 10 The reduction of these emissions through the use of fuel cell technology would improve air quality, reduce health problems, reduce carbon emissions that contribute to climate change, and help to meet National Ambient Air Quality Standards. Logistics and distribution are big businesses in New Jersey. The New Jersey-New York port district is along the New York Harbor and encompasses an area within an approximate 25-mile (40 km) radius of the Statue of Liberty National Monument, which comprises all or part of nine counties in New Jersey. There is also the Port of Camden-Gloucester along the Delaware River. These major ports can produce daily emissions equal to those of half a million cars or more; indeed, based on U.S. Environmental Protection Agency (EPA) data, most of the New Jersey counties mentioned above experienced the highest NOx emissions in 2014, making them ideal locations for zero-emission hydrogen and fuel cell systems. Hydrogen and fuel cell technology can replace diesel or battery powered equipment and meet the electrical demands of vessels in the port as well as supply power for other port uses, such as yard trucks, forklifts, and other material handling equipment. Fuel cells fueled by hydrogen produce zero pollutant emissions and no greenhouse gases at the point of use and can reduce the overall amount of diesel or other maritime fuel used. Other maritime/port applications where fuel cells offer significant emissions benefits include replacing diesel generators for refrigerated containers, shore power, portable backup and stationary power, harbor craft propulsion, ship auxiliary power, and for providing power for onsite trucks.
Energy Resiliency
Weather events in the Northeast, including Hurricane Irene (2011), the Nor’easter snowstorm (2011), Superstorm Sandy (2012), Blizzard Nemo (2013), and the “bomb cyclone” (2018)11 have emphasized the need for clean, reliable, baseload distributed generation located at mission critical facilities to maintain power when grid power is not available due to the impacts of severe weather. New Jersey was especially
9 Calculations based on a 97 percent capacity factor; Stationary Fuel Cell Evaluation, National Renewable Energy Laboratory; June 7, 2016. https://www.hydrogen.energy.gov/pdfs/review16/tv016_saur_2016_p.pdf. 10 Assumes passenger car tailpipe emissions of CO2 are reduced by 4.67 metric tons CO2E/vehicle /year; transit bus emissions of CO2 are reduced by 89.27 metric tons CO2E /vehicle/year; NOx emissions for passenger vehicles at .213 g/mile x 11,443 and .59 g/mile x 34,000 for diesel fuel transit buses. https://www.epa.gov/energy/greenhouse-gases-equivalencies-calculator-calculations-and-references. 11 Westfield Patch, “Mass Power Outages Cause NJ School Closures, Shelters In Place”, January 12, 2018; https://patch.com/new-jersey/westfield/more-50k-without-power-nj-schools-change-schedules.

w w w . n e e s c . o r g 8 | P a g e
impacted by Hurricane Sandy with more than 2.4 million power customers, nearly two thirds of the state, having no electricity.12 In several Northeastern states, where powerful storms and inclement weather have impacted the electrical grid, utilities and municipalities are integrating fuel cells into microgrids to ensure continuous power for essential services, like first responders, gas stations, senior centers, schools, and emergency shelters. Fuel cells also offer unique advantages in providing tri-generation capability to provide heat and power for stationary applications and fuel for mobile applications. Policy
New Jersey’s proximity to major load centers, its relatively high cost of electricity, and concerns over air quality and energy reliability have resulted in renewed interest in the development of efficient and cost effective renewable energy and energy storage technologies. Specific energy policies in New Jersey that support hydrogen and fuel cell adoption are displayed in Table 2 and Appendix IV – State Energy Policy/Incentives for Stationary Fuel Cell and Hydrogen Transportation. Legislation and policy to support distributed generation and renewable technologies can be cost effective and appropriate for public investment. Since the inception of the New Jersey Renewable Energy Portfolio Standard (RPS), New Jersey ratepayers have invested more than $242.4 million for Class I and Class II renewables from renewable energy certificates (REC) and alternate compliance payments (ACP) through 2015.13 Fuel cells operating on renewable fuels are classified as a Class I renewable resource in New Jersey. The State of New Jersey's Clean Energy Program (NJCEP) is developing a strategic plan that will serve as a roadmap to help shape program design and budget allocations. Consequently, the hydrogen and fuel cell industry has advocated incentives and financing mechanisms that put hydrogen and fuel cell systems on a level playing field with other clean energy systems. New Jersey legislators have also proposed additional incentives for ZEVs and ZEV infrastructure that will promote the adoption of hydrogen and fuel cell systems for transportation applications. The fuel cell industry has also proposed “pay-for-performance” incentives for stationary power systems that enable the true value of fuel cells to be captured.
Consistency with New Jersey’s Energy Plans
Hydrogen and fuel cell technologies can help New Jersey achieve the over-arching goals as defined in the State’s s Energy Master Plan, last updated in 2015. The Master Plan describes New Jersey’s strategic vision for the use, management, and development of energy in the State,14 and includes the following goals from the original 2011 plan:
• Driving down the cost of energy for all customers; • Promoting a diverse portfolio of new, clean, in-state generation;
12 “Electricity not likely to come back soon for N.J.”, Eliot Caroom/The Star-Ledger, October 30, 2012; http://www.nj.com/news/index.ssf/2012/10/electricity_not_likely_to_come.html#incart_m-rpt-2. 13 New Jersey Energy Master Plan Update (December 2015), p. 33; http://nj.gov/emp/docs/pdf/New_Jersey_Energy_Master_Plan_Update.pdf. 14 New Jersey Energy Master Plan Update (December 2015).
Table 2 – NJ Policy Incentives Applicable to Hydrogen & Fuel Cells
• Mandatory Renewable Portfolio Standards (RPS) • Interconnection Standards • Net Metering • Public Benefits Funds • ZEV Purchase Incentives • Renewable Fuel Incentive Rebates • Refueling Infrastructure Incentives

w w w . n e e s c . o r g 9 | P a g e
• Rewarding energy efficiency and energy conservation/reduce peak demand; • Capitalizing on emerging technologies for transportation and power production; and • Maintaining support for the renewable energy portfolio standards.
In the 2015 Mater Plan Update, the State added a goal to “Improve Energy Infrastructure Resiliency & Emergency Preparedness and Response”, by:
• Protecting the State’s critical energy infrastructure; • Increasing the use of microgrid technologies and distributed energy resources (DER); and • Creating long-term financing for local energy resiliency measures.
New Jersey’s Energy Master Plan also reiterates the State’s intention to explore programs that expand the use of alternatively fueled vehicles (AFVs) by fleet owners as well as individuals, and to facilitate the development of infrastructure for AFVs. For example, the State supported a NJ TRANSIT microgrid study as part of a DOE/ New Jersey’s Board of Public Utilities (NJBPU) partnership, which led to the U.S. Department of Transportation awarding more than $400 million in federal funding to the transit agency to create a first-of-its-kind microgrid providing highly reliable power for critical transit services. The project includes distributed generation, combined heat and power (CHP), and fuel cells.
Fuel Cells for Stationary Power
In 2016, combined retail sales of electricity in New Jersey amounted to over 75 million megawatt-hours (MWh) for the residential, industrial, transportation and commercial sectors.15 To meet this demand, New Jersey’s residents rely on both in-state resources and imports of power. Even though New Jersey’s load growth is projected to be nearly flat over the next 10 years, requests to retire generation facilities, which totaled over 8,000 MW of capacity in the PJM region, may put additional pressure on the electric grid. 16 Fuel cell technology offers several advantages (see Table 3) in helping to meet the demand and the need for new capacity with clean and high efficiency generation located directly at the customer’s site. Distributed generation (DG) and energy storage will increase efficiency, improve end user reliability, and reduce emissions. There are also opportunities to maximize the efficiency and cost effectiveness of fuel cells with CHP applications. This is consistent with the New Jersey Energy Master Plan, which states that “of all the DG systems promoted and advanced by New Jersey, including solar, CHP is the most energy efficient and cost effective in terms of emission reductions.”17 Based on a subset of targets identified within this plan (see Appendix V), there is the potential to develop 214 MW of stationary fuel cell generation capacity in New Jersey in the near term, providing the following benefits, annually:
• Production of approximately 1.82 million MWh of electricity.18 • Production of approximately 3.47 million MMBTUs of thermal energy.19 • Reduction of NOx emissions by up to approximately 240 metric tons (electric generation only).20
15 U.S. EIA; “Table 1. 2016 Summary statistics (New Jersey): Total retail sales (megawatthours);” https://www.eia.gov/electricity/state/newjersey/; January 2018. 16 PJM, Future Deactivations (as of February 5, 2018); http://www.pjm.com/-/media/planning/gen-retire/pending-deactivation-requests.ashx?la=en. 17 New Jersey Energy Master Plan Update (December 2015), p. 19. 18 Calculations based on a 97 percent capacity factor; Stationary Fuel Cell Evaluation, National Renewable Energy Laboratory June 7, 2016. https://www.hydrogen.energy.gov/pdfs/review16/tv016_saur_2016_p.pdf. 19 MMBTU calculations are based on 400 kW PAFC and 1.4 MW MCFC units because SOFC units are non-CHP.
• High electric efficiency (> 40 percent) • Overall efficiency 85 to 93 percent • Reduction of noise • Reduction of air pollution • Siting is not controversial • Waste heat can be captured and used
Table 3 –Fuel Cell System Advantages

w w w . n e e s c . o r g 10 | P a g e
• Schools • Hospitals • Large Retail Stores • Hotels • Municipal Buildings
Table 4 – Target Applications for Stationary Fuel Cells
This Plan focuses primarily on applications for small fuel cells (typically 100 to 200 kW); midsize fuel cells (typically 400 kW to 1,000 kW); and large fuel cells (typically over 1MW). Midsize and large fuel cells (>400 kW) are potentially viable for large energy users and grid applications, while small fuel cells (< 200kW) are potentially viable for site-specific applications, such as back-up power for telecommunications sites and grid resilience. Potential stationary targets are illustrated in APPENDIX I – Figure 1, “New Jersey: Market Potential for Hydrogen and Fuel Cell Stationary Applications.”
Tri-generation
A tri-generation power station incorporates CHP technology that produces hydrogen in addition to heat and electricity. Hydrogen produced by a fuel cell system can be used for industrial purposes or can be used to support a fueling station for FCEVs and fuel cell forklifts. FuelCell Energy is currently involved in the manufacture of tri-generation technology and operation of a tri-generation facility that runs on natural gas and biogas. This facility produces heat and power and hydrogen for vehicles.21 This use of fuel cells can help to address the challenge that early infrastructure deployment presents to the hydrogen and fuel cell industry because hydrogen station investment often needs to come before the vehicle demand. Tri-generation facilities can provide transportation fuel to fleets and/or the public and electric power to an industrial facility. With a tri-generation system, hydrogen is only generated when it is needed for refueling, otherwise the hydrogen is used internally and the system continuously produces electricity and heat. This configuration leverages all of the capital that is invested in the plant, which helps to mitigate potential stranded capital issues.
Emergency Preparedness
Extreme weather events in the Northeast have emphasized the need for clean and reliable distributed energy alternatives located at mission critical facilities to maintain power when there is a power outage. New Jersey was especially hard hit by Hurricane Sandy, which caused more than 2.4 million power customers, nearly two thirds of the state, to lose electricity.22 Fuel cells can provide reliable, efficient power and thermal energy during a power outage to maintain critical operations. More than 25 fuel cells, located in the Northeast region affected by Hurricane Sandy, performed as expected and provided electricity, heat, and hot water during and after the storm passed. Several states are considering initiatives that include increased use of performance and engineering standards, improved planning, hardening of the infrastructure, increased communications and collaboration, additional response training, and the use of microgrids and other emerging technologies to mitigate impact(s) on energy grid infrastructure. Fuel cells are now being considered as ultra-clean generators for microgrids to reliably provide heat and electricity at base load and to operate in island mode to serve essential needs during extended power outages.
Stationary Fuel Cell Market/Policy Opportunities
NEESC has identified a near term market opportunity to develop an additional 214 MW of fuel cell capacity in New Jersey. Fuel cells are already in use for buildings, data centers, telecommunications applications, power for remote locations, distributed generation, grid resilience, and cogeneration (in which excess heat released during electricity generation is used for other
20 U.S. EIA; “Table 1. 2015 Summary statistics (New Jersey): Emissions (lbs/MWh);” https://www.eia.gov/electricity/state/newjersey/; February 27, 2017. 21 DOE, EERE; “Tri-Generation Success Story World’s First Tri-Gen Energy Station–Fountain Valley;” December 2016. https://energy.gov/sites/prod/files/2016/12/f34/fcto_fountain_valley_success_story.pdf; January 2017. 22 “Electricity not likely to come back soon for N.J.”, Eliot Caroom/The Star-Ledger, October 30, 2012; http://www.nj.com/news/index.ssf/2012/10/electricity_not_likely_to_come.html#incart_m-rpt-2.
w w w . n e e s c . o r g 11 | P a g e
• Renewable Portfolio Standards • Net Metering • Public Benefits Funds • Performance Power Purchase • State Grant Programs • Property Tax Incentives
Table 5 – Policies for Stationary Fuel Cells
applications). Significant market opportunities exist for stationary fuel cells in New Jersey, especially CHP, in schools, hospitals, large commercial and municipal buildings, and other critical facilities. To enhance energy efficiency through on-site power generation with recovery and productive use of waste heat, the NJBPU provides financial incentives for CHP installations. New Jersey now has almost 3,000 MW of CHP, which is one of the highest concentrations of CHP in the country. Fuel cells initially qualified for incentives under NJCEP’s CHP Program; however, in 2016, the NJCEP suspended fuel cells without heat recovery, (i.e., all-electric fuel cells) from participation in the program. Effective on July 1, 2017, fuel cell applications with heat recovery are eligible for financial incentives for projects greater than three (3) MW in capacity.23 The BPU’s current process for selecting eligible CHP projects involves a third-party analysis that evaluates the costs and benefits of a project from the perspective of the customer and uses pre-determined assumptions that directly and materially affect the outcome of the cost-benefit analysis. The National Fuel Cell Research Center (NFCRC), which works with stationary fuel cell companies, notes that this process does not evaluate the electric system as a whole, and in many cases, the assumptions do not reflect the actual specifics of the projects, such as the form of financing, the impact of federal tax incentives, the value of resiliency to a customer, and the amount of out-of-state funding levered into New Jersey.24 These variables, which could be considered in evaluating the cost-benefit of specific projects, are intrinsic to a reverse auction selection process, which the industry has proposed to the NJBPU. Other states with clean energy programs use the reverse auction mechanism for project selection because it is based on “pay-for-performance”, with payments based on multiyear operational performance that is carefully measured. The incentive amount for each project is determined via a competitive auction, ensuring that projects do not receive more funding than absolutely necessary to achieve program objectives. Connecticut’s Low Emission Credit (“LREC”) program, New York’s Renewable Portfolio Standard, and California’s Self-Generation Incentive Program are all “pay-for-performance” programs, using meters to measure the actual system operation and providing payments contingent upon a specified minimum level of operational capacity. The use of a competitive reverse auction process in New Jersey may more accurately determine the minimum incentive necessary by compensating only for systems that are operating efficiently. In fact, New Jersey has utilized a reverse auction format for over a decade to procure Basic Generation Service (“BGS”) for the State’s utility default electric customers, as this approach results in the best default service pricing. A similar reverse auction process may result in selecting the most cost-effective clean energy projects and capturing the most potential energy savings – while minimizing lost opportunities, consistent with the NJCEP strategic objectives. The NFCRC also noted that the key objectives of the NJCEP are to save energy, money, and the environment. To this end, the industry has encouraged the NJBPU to base eligibility and incentive levels on a technology’s ability to reduce emissions, while maintaining cost effectiveness and reliability, not only the ability to recover heat. The reduction of criteria air pollutants emissions, such as ozone, SOx, NOx and particulate matter should be highly valued in deciding incentive levels, along with the reduction
23 New Jersey Clean Energy Program; Combined Heat and Power, January 2018; http://www.njcleanenergy.com/commercial-industrial/programs/combined-heat-power/combined-heat-power. 24 National Fuel Cell Research Center, Comments on New Jersey Clean Energy Program Strategic Plan, March 3, 2017.
w w w . n e e s c . o r g 12 | P a g e
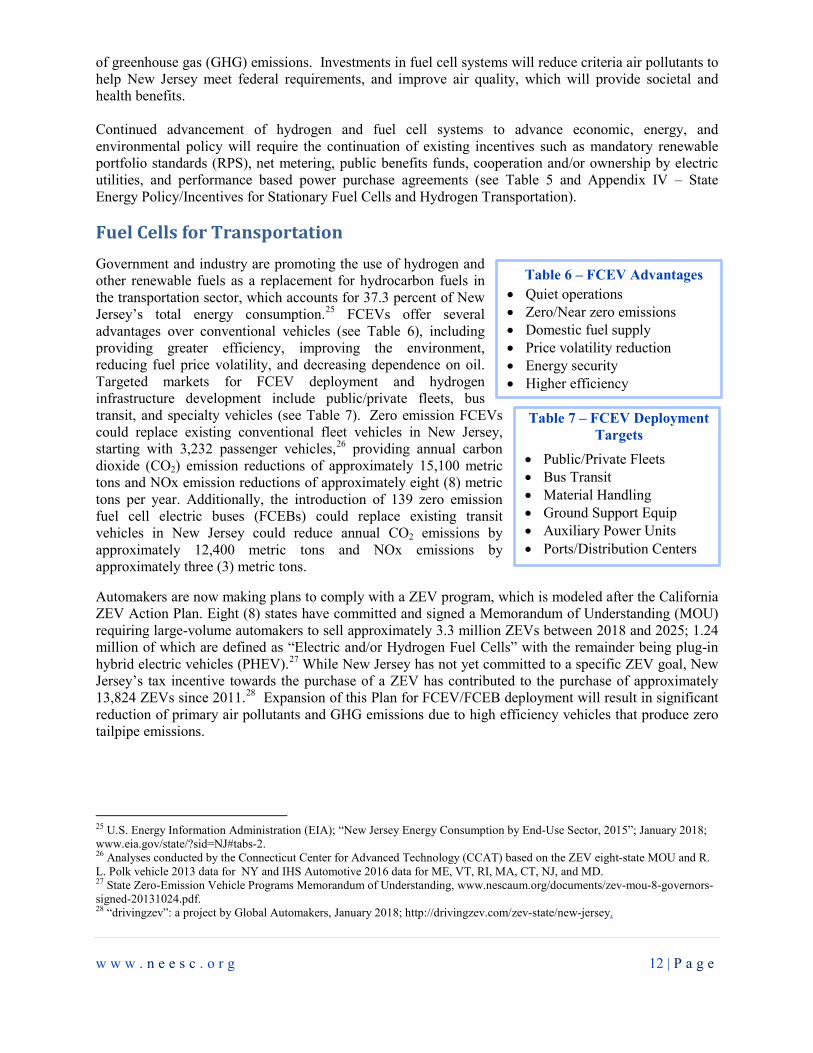
• Public/Private Fleets • Bus Transit • Material Handling • Ground Support Equip • Auxiliary Power Units • Ports/Distribution Centers
Table 7 – FCEV Deployment Targets
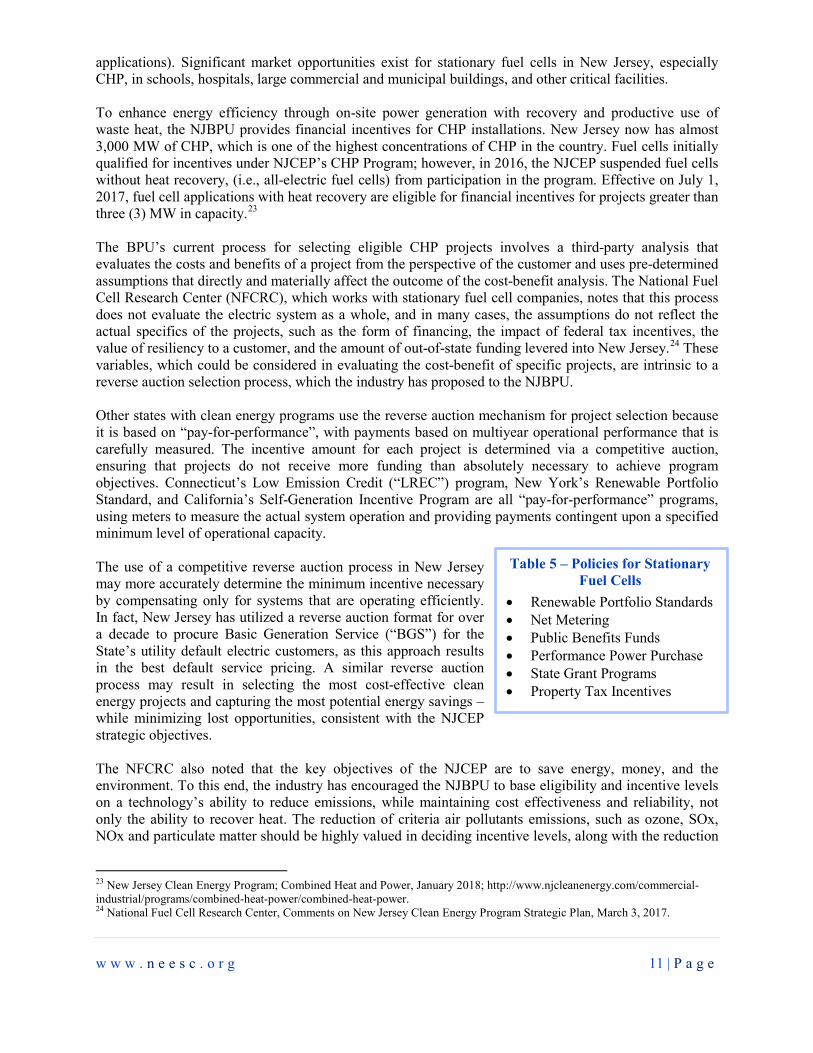
of greenhouse gas (GHG) emissions. Investments in fuel cell systems will reduce criteria air pollutants to help New Jersey meet federal requirements, and improve air quality, which will provide societal and health benefits. Continued advancement of hydrogen and fuel cell systems to advance economic, energy, and environmental policy will require the continuation of existing incentives such as mandatory renewable portfolio standards (RPS), net metering, public benefits funds, cooperation and/or ownership by electric utilities, and performance based power purchase agreements (see Table 5 and Appendix IV – State Energy Policy/Incentives for Stationary Fuel Cells and Hydrogen Transportation).
Fuel Cells for Transportation
Government and industry are promoting the use of hydrogen and other renewable fuels as a replacement for hydrocarbon fuels in the transportation sector, which accounts for 37.3 percent of New Jersey’s total energy consumption.25 FCEVs offer several advantages over conventional vehicles (see Table 6), including providing greater efficiency, improving the environment, reducing fuel price volatility, and decreasing dependence on oil. Targeted markets for FCEV deployment and hydrogen infrastructure development include public/private fleets, bus transit, and specialty vehicles (see Table 7). Zero emission FCEVs could replace existing conventional fleet vehicles in New Jersey, starting with 3,232 passenger vehicles,26 providing annual carbon dioxide (CO2) emission reductions of approximately 15,100 metric tons and NOx emission reductions of approximately eight (8) metric tons per year. Additionally, the introduction of 139 zero emission fuel cell electric buses (FCEBs) could replace existing transit vehicles in New Jersey could reduce annual CO2 emissions by approximately 12,400 metric tons and NOx emissions by approximately three (3) metric tons.
Automakers are now making plans to comply with a ZEV program, which is modeled after the California ZEV Action Plan. Eight (8) states have committed and signed a Memorandum of Understanding (MOU) requiring large-volume automakers to sell approximately 3.3 million ZEVs between 2018 and 2025; 1.24 million of which are defined as “Electric and/or Hydrogen Fuel Cells” with the remainder being plug-in hybrid electric vehicles (PHEV).27 While New Jersey has not yet committed to a specific ZEV goal, New Jersey’s tax incentive towards the purchase of a ZEV has contributed to the purchase of approximately 13,824 ZEVs since 2011.28 Expansion of this Plan for FCEV/FCEB deployment will result in significant reduction of primary air pollutants and GHG emissions due to high efficiency vehicles that produce zero tailpipe emissions.
25 U.S. Energy Information Administration (EIA); “New Jersey Energy Consumption by End-Use Sector, 2015”; January 2018; www.eia.gov/state/?sid=NJ#tabs-2. 26 Analyses conducted by the Connecticut Center for Advanced Technology (CCAT) based on the ZEV eight-state MOU and R. L. Polk vehicle 2013 data for NY and IHS Automotive 2016 data for ME, VT, RI, MA, CT, NJ, and MD. 27 State Zero-Emission Vehicle Programs Memorandum of Understanding, www.nescaum.org/documents/zev-mou-8-governors-signed-20131024.pdf. 28 “drivingzev”: a project by Global Automakers, January 2018; http://drivingzev.com/zev-state/new-jersey.
• Quiet operations • Zero/Near zero emissions • Domestic fuel supply • Price volatility reduction • Energy security • Higher efficiency
Table 6 – FCEV Advantages
w w w . n e e s c . o r g 13 | P a g e
Light/Medium Duty Vehicle Fleets
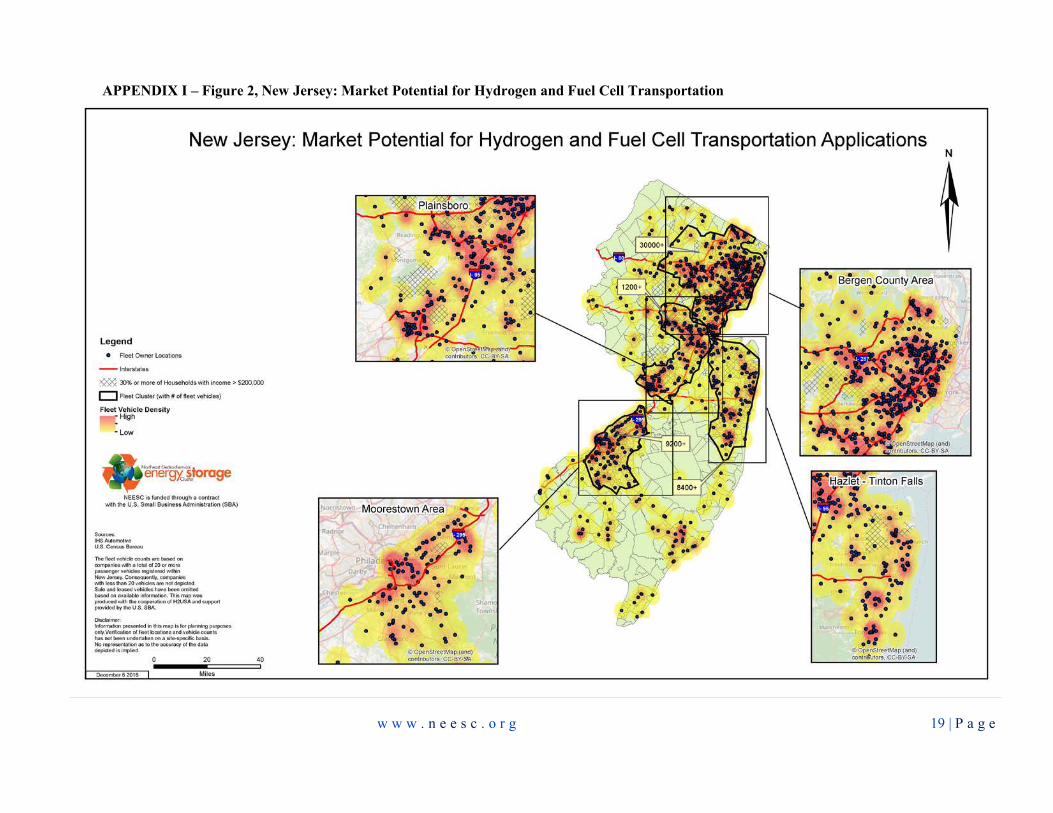
There are over 69,000 passenger fleet vehicles classified as non-leasing or company owned vehicles in New Jersey.29 Passenger vehicles at transportation hubs for fleets are good candidates for hydrogen fueling and the use of FCEVs because they mostly operate on fixed routes or within fixed districts and can be fueled from a centralized station. As illustrated in Appendix I – Figure 2, “New Jersey: Market Potential for Hydrogen and Fuel Cell Transportation Applications,” clusters of fleet vehicles in New Jersey are located primarily in the Bergen County, Hazlet, Moorestown, Plainsboro, and Tinton Falls areas.
Bus Transit There are approximately 2,970 transit buses that provide public transportation services in New Jersey.30 Although the efficiency of conventional diesel buses has increased, these buses have the greatest potential for energy savings by using high efficiency fuel cells. FCEBs have an average fuel economy of approximately 7.9 miles per kilogram of hydrogen, which equates to approximately 7 miles per diesel gallon equivalent (DGE).31 The average fuel efficiency of conventional diesel transit buses is approximately 3.87 miles per gallon.32 The use of hydrogen has the potential to reduce diesel fuel use by approximately 8,800 gallons of diesel fuel per vehicle, per year. 33The use of FCEBs may require: 1) fueling infrastructure to be co-located with the FCEB storage facilities, 2) redundancy of fuel supply, 3) generally accepted fuel measurements & certifications, and 4) an established track record for up-time performance.
Specialty Vehicles
Specialty vehicles, such as material handling equipment, airport tugs, street sweepers, and wheel loaders are used by a variety of industries, including manufacturing, construction, mining, agriculture, food sales, retailers, and wholesalers. Batteries that currently power some equipment for indoor use are heavy and take up significant storage space while only providing up to six hours of run time. Replacing and recharging batteries typically results in 20 minutes of lost productivity every four to eight hours. Fuel cell powered lift trucks can be operated indoors, can operate up to eight hours before refueling, can be refueled quickly (2-3 minutes), and eliminate the need for battery storage and charging rooms (see Table 8). In multi-shift operations with two or more battery replacements per day, the quick refueling of hydrogen fuel cells saves time and increases operator efficiency. Fuel cell powered equipment has zero emissions, a lower annual cost of ownership, and almost twice the estimated product life than battery powered equipment. Furthermore, since lift truck operators can refuel hydrogen themselves, operations can keep business moving and make more efficient use of labor resources. Fuel cell powered material handling equipment is already in use at dozens of warehouses, distribution centers, and manufacturing plants in North America. For example, FreezPak Logistics has selected Plug Power's full-service GenKey solution for its new cold storage distribution center freezer warehouse under construction in Carteret, New Jersey. This GenKey deployment includes 25 fuel cell powered lift trucks,
29 Vehicle Fleet data provided by IHS Automotive for CT, ME, MA, RI, NJ, MD (2016). 30 New Jersey Transit; https://www.njtransit.com/pdf/FactsAtaGlance.pdf. 31 NREL; “Fuel Cell Buses in U.S. Transit Fleets: Current Status 2017;” https://www.nrel.gov/docs/fy18osti/70075.pdf. 32 CARB Cost Assumptions and Data Sources (updated on 6/26/2017); https://arb.ca.gov/msprog/ict/meeting/mt170626/170626costdatasources.xlsx. 33 Assumes an average transit bus travels approximately 34,000 miles annually and 3.87 miles/gallon. http://www.afdc.energy.gov/data/10309. Calculated based on 10,160 grams CO2 per gallon for diesel fuel.
• Lower total cost of ownership • 80% lower refueling/recharging labor cost • 75% less space required for refueling • Improved Net Present Value (NPV) • Zero Emissions
Table 8 – FC Material Handler Advantages
w w w . n e e s c . o r g 14 | P a g e
• High Population Density • Support and Policies for Clean Technology • NEESC and H2USA Activities • Strong Hydrogen and Fuel Cell Industry • Areas with Early Market Adopters • Areas with Hydrogen Production and Use • Areas with Alternative Refueling Stations
Table 9 – Criteria for FCEV Deployment
an outdoor hydrogen storage facility with two indoor dispensers, and total service for both the fuel cell powered lift trucks and hydrogen storage system.34 Large corporations that are currently using or planning to use fuel cell powered material handling equipment across the country include: Central Grocers, FedEx Freight, Sysco Foods, and Walmart.35
Hydrogen Infrastructure Hydrogen refueling infrastructure, consisting of production or delivery, storage, and dispensing equipment, is required to support FCEVs, including light duty passenger vehicles, buses and material handling equipment. While costs typically range from $1,000,000 - $3,260,000 per hydrogen station,36 construction of these stations could be backed by private sector financing or developed publicly in conjunction with deployment of high efficiency ZEV fleets. Models for hydrogen infrastructure financing have been developed, which support plans for deployment of FCEVs, by OEMs, state stakeholders, H2USA, and Northeast States for Coordinated Air Use Management (NESCAUM). This plan complements those efforts to help coordinate the initial development of hydrogen refueling infrastructure to improve the value of FCEVs to customers that will enable growth and distribution of ZEV technology into the market place. Potential sites for development include existing conventional refueling stations and new sites where hydrogen may be offered with other alternative fuels (see Table 9). Potential locations for hydrogen refueling infrastructure with fleet clusters, early market adopters, and other factors are identified in APPENDIX I – Figure 2, “New Jersey: Market Potential for Hydrogen and Fuel Cell Transportation Applications”. In April 2016, industrial gas company Air Liquide announced plans for the development of twelve hydrogen fueling stations in the Northeast, through the company’s collaboration with Toyota Motor Sales USA, Inc. The initial network of hydrogen stations will span approximately 300 miles across five states (Connecticut, Massachusetts, New Jersey, New York, and Rhode Island) and support the introduction of FCEVs on the East Coast. Most of these stations are scheduled to open to the public in 2018. Air Liquide is currently constructing hydrogen fueling stations in the Northeast, including the Bronx, Brooklyn, and Hempstead, NY, and Lodi and Whippany, NJ to support the initial deployment of FCEVs in high population density areas.37
Hydrogen/Fuel Cell Transportation Market/Policy Opportunities
NEESC recommends a near-term acquisition of at least 3,371 FCEVs/FCEBs in the state of New Jersey - 3,232 passenger fleet vehicles, including 130 FCEV passenger vehicles for use by the state of New Jersey fleet, and 139 transit/paratransit buses.38 These deployments would require the development of 31 to 34 hydrogen refueling stations. A state investment of $33.2 million to $71.6 million for infrastructure 34 Plug Power Press Release, March 19, 2015. 35 U.S. DOE, “Early Markets: Fuel Cells for Material Handling Equipment;” http://www.energy.gov/sites/prod/files/2014/03/f9/early_markets_mhe_fact_sheet.pdf ; October 2016. 36 California Air Resources Board; Joint Agency Staff Report on Assembly Bill 8: Assessment of Time and Cost Needed to Attain 100 Hydrogen Refueling Stations in California; December 2015; CEC-600-2015-016. 37 Presentation by Air Liquide, “Northeast H2 Fueling Station Network”, H2 Station Update, Air Liquide Advanced Technologies U.S. December 2017. 38 Automotive-fleet.com; “2009-My Registration_2009 State-Operated Vehicle;” http://www.automotive-fleet.com/statistics/statsviewer.aspx?file=http%3a%2f%2fwww.automotive-fleet.com%2ffc_resources%2fstats%2fAFFB10-16-top10-state.pdf&channel; October 2014.

w w w . n e e s c . o r g 15 | P a g e
development and FCEV deployment would provide a solid framework to support these initial markets. An additional $27.8 million (20 percent of $139 million) would be needed for the acquisition of 139 transit/paratransit buses. In summary, the Hydrogen/Fuel Cell Transportation Market Opportunities for New Jersey include:
• 3,232 Fuel Cell Electric Passenger Vehicles (130 FCEVs for NJ State fleet) - $16.16 million.39 • H2 Infrastructure (34 stations) - $17 million to $55.42 million (50 percent of capital cost). • 139 Fuel Cell Transit/Paratransit Buses - $27.8 million (20 percent state cost-share/80 percent
federal cost share) 40, As noted earlier, fuel cells can meet the power needs of New Jersey’s logistics and distribution centers, including at the State’s many ports, while significantly reducing emissions. Applications include yard trucks, forklifts and other material handling specialty equipment; generators for refrigerated containers and shore power; portable and backup power; harbor craft propulsion; ship auxiliary power; and onsite trucks. Also, because some of the State’s logistics and distribution businesses are located along the New Jersey Turnpike, the opportunity exists for stations to be located at sites that can provide fuel for both cars and fuel cell powered material handling equipment. Funding for deployment of transportation fuel cells and hydrogen fueling infrastructure will come from the private sector, federal and state resources41, and from other sources, potentially including the Volkswagen Partial Consent Decrees (Settlements), which has allocated more than $65 million to New Jersey for transportation projects that include engine re-powering and alternative fueling, including hydrogen.42 Consumer incentives to mitigate costs and enhance the FCEV ownership experience may include purchasing of state passenger vehicles, “point-of-purchase” rebates, hydrogen fuel rebates, incentives for refueling infrastructure, FCEV buy back incentives, tax incentives, infrastructure partnerships, and high occupancy vehicle (HOV) lanes/parking (see Table 10). Alternative vehicle infrastructure to support ZEVs could benefit from similar incentives such as time of day rates for hydrogen production and fuel subsidies.
Coordination of hydrogen and fuel cell related plans underway in the Northeast states will lead to market and economic development opportunities. Partnerships between state stakeholders, the U.S. DOE, H2USA, industry OEMs, and the hydrogen industry will increase opportunities for phased infrastructure development with deployment of FCEVs. Supporting DOE and national efforts to develop uniform codes and standards will further strengthen deployment opportunities.
39 A proposed state incentive of $5,000 per FCEV deployed. 40 It is projected that an order for 40 fuel cell buses would reduce the cost to $1 million or less. NREL, Fuel Cell Buses in U.S. Transit Fleets: Current Status 2017; https://www.nrel.gov/docs/fy18osti/70075.pdf. 41 The Federal Transit Administration’s Bus & Bus Facilities Infrastructure Investment Program could provide states and direct recipients 80 percent of the net capital project costs to replace, rehabilitate and purchase buses and related equipment and to construct bus-related facilities including technological changes or innovations to modify low or no emission vehicles or facilities. 42 In 2016, Volkswagen AG agreed to Partial Consent Decrees (“Settlements”). See US EPA, Volkswagen Clean Air Act Civil Settlement, https://www.epa.gov/enforcement/volkswagen-clean-air-act-civil-settlement. Center for Climate and Energy Solutions, “Volkswagen Settlement Funding: What Cities Should Know”, December 2016; https://www.c2es.org/docUploads/vw-settlement-final.pdf.
• ZEV Program • Purchase of State Passenger Vehicles • “Point-of-Purchase” Rebates • Fuel/Infrastructure/FCEV Buy Back • Tax Incentives • Infrastructure Partnerships • HOV Lanes/Parking Incentives
Table 10 – Policy/Incentives for FCEV Deployment
w w w . n e e s c . o r g 16 | P a g e
Conclusion Hydrogen and fuel cell technology provides significant opportunities for more efficient use of cleaner energy, job creation and economic development. Realizing approximately $54 million in revenue and investment in 2016, the U.S. based hydrogen and fuel cell industry in New Jersey is estimated to have contributed over $2.7 million in state and local tax revenue. If newer/emerging hydrogen and fuel cell technology were to gain momentum, the number of companies and employment for the industry could grow substantially. Hydrogen and fuel cell technology provides an opportunity for New Jersey to more fully utilize its renewable energy industry in transportation, energy storage, and electric generation applications at consumer sites. Such use could make New Jersey a showcase for regionally manufactured energy storage and renewable energy technologies while reducing NOx and GHG emissions and increasing energy reliability. To facilitate the execution of this Plan, New Jersey should develop an “Action Plan,” including provisions for funding and financing and a schedule for achieving the market opportunities identified herein:
• 214 MW fuel cell electric generation capacity; • 3,371 FCEVs (3,232 passenger and 139 transit/paratransit buses) as ZEVs; and • 31 to 34 hydrogen refueling stations (to support FCEV deployment).
These market opportunities represent a short-term investment for long-term US productivity. As such, any provisions for funding/financing and schedule for implementation should recognize the short-term cost to facilitate long-term market opportunities. Development of infrastructure will require planning and investments by public and private entities with an expectation of a payback on those investments.

w w w . n e e s c . o r g 17 | P a g e
APPENDICES

w w w . n e e s c . o r g 18 | P a g e
APPENDIX I – Figure 1, New Jersey: Market Potential for Hydrogen and Fuel Cell Stationary Applications
w w w . n e e s c . o r g 19 | P a g e
APPENDIX I – Figure 2, New Jersey: Market Potential for Hydrogen and Fuel Cell Transportation
w w w . n e e s c . o r g 20 | P a g e
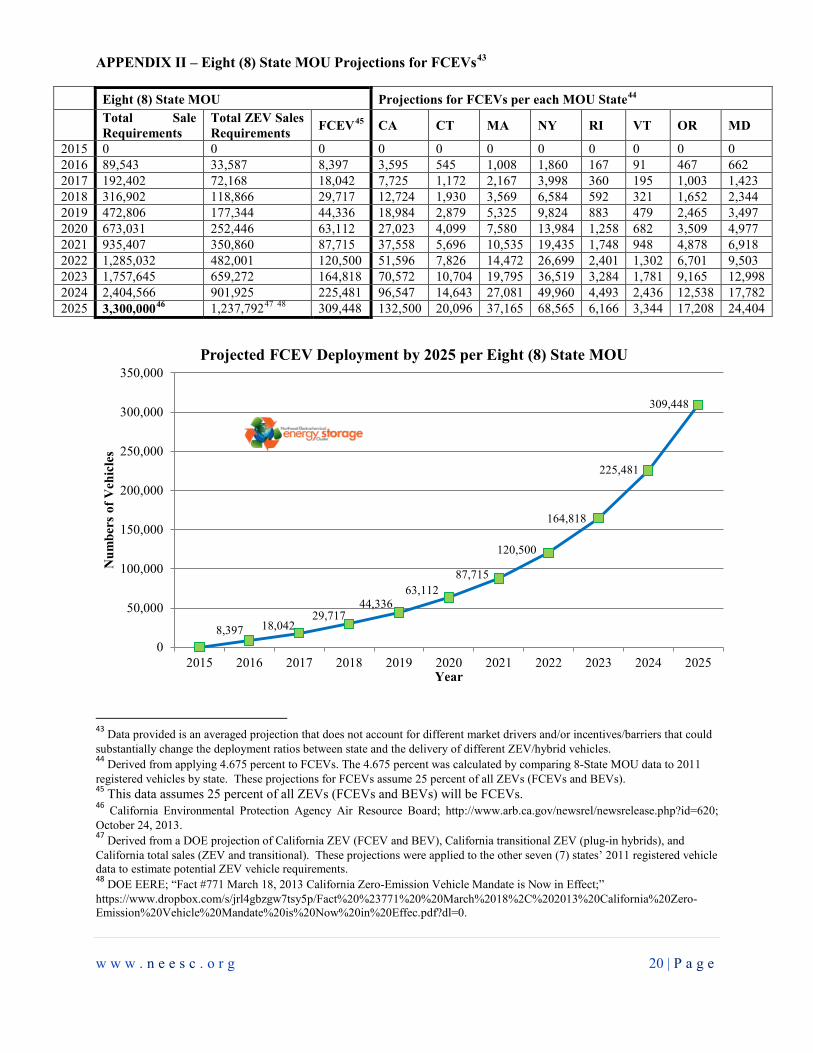
APPENDIX II – Eight (8) State MOU Projections for FCEVs43
Eight (8) State MOU Projections for FCEVs per each MOU State44
Total Sale Requirements
Total ZEV Sales Requirements FCEV45 CA CT MA NY RI VT OR MD
2015 0 0 0 0 0 0 0 0 0 0 0 2016 89,543 33,587 8,397 3,595 545 1,008 1,860 167 91 467 662 2017 192,402 72,168 18,042 7,725 1,172 2,167 3,998 360 195 1,003 1,423 2018 316,902 118,866 29,717 12,724 1,930 3,569 6,584 592 321 1,652 2,344 2019 472,806 177,344 44,336 18,984 2,879 5,325 9,824 883 479 2,465 3,497 2020 673,031 252,446 63,112 27,023 4,099 7,580 13,984 1,258 682 3,509 4,977 2021 935,407 350,860 87,715 37,558 5,696 10,535 19,435 1,748 948 4,878 6,918 2022 1,285,032 482,001 120,500 51,596 7,826 14,472 26,699 2,401 1,302 6,701 9,503 2023 1,757,645 659,272 164,818 70,572 10,704 19,795 36,519 3,284 1,781 9,165 12,998 2024 2,404,566 901,925 225,481 96,547 14,643 27,081 49,960 4,493 2,436 12,538 17,782 2025 3,300,00046 1,237,79247 48 309,448 132,500 20,096 37,165 68,565 6,166 3,344 17,208 24,404
43 Data provided is an averaged projection that does not account for different market drivers and/or incentives/barriers that could substantially change the deployment ratios between state and the delivery of different ZEV/hybrid vehicles. 44 Derived from applying 4.675 percent to FCEVs. The 4.675 percent was calculated by comparing 8-State MOU data to 2011 registered vehicles by state. These projections for FCEVs assume 25 percent of all ZEVs (FCEVs and BEVs). 45 This data assumes 25 percent of all ZEVs (FCEVs and BEVs) will be FCEVs. 46 California Environmental Protection Agency Air Resource Board; http://www.arb.ca.gov/newsrel/newsrelease.php?id=620; October 24, 2013. 47 Derived from a DOE projection of California ZEV (FCEV and BEV), California transitional ZEV (plug-in hybrids), and California total sales (ZEV and transitional). These projections were applied to the other seven (7) states’ 2011 registered vehicle data to estimate potential ZEV vehicle requirements. 48 DOE EERE; “Fact #771 March 18, 2013 California Zero-Emission Vehicle Mandate is Now in Effect;” https://www.dropbox.com/s/jrl4gbzgw7tsy5p/Fact%20%23771%20%20March%2018%2C%202013%20California%20Zero-Emission%20Vehicle%20Mandate%20is%20Now%20in%20Effec.pdf?dl=0.
8,397 18,042 29,717
44,336 63,112
87,715
120,500
164,818
225,481
309,448
0
50,000
100,000
150,000
200,000
250,000
300,000
350,000
2015 2016 2017 2018 2019 2020 2021 2022 2023 2024 2025
Num
bers
of V
ehic
les
Year
Projected FCEV Deployment by 2025 per Eight (8) State MOU
w w w . n e e s c . o r g 21 | P a g e
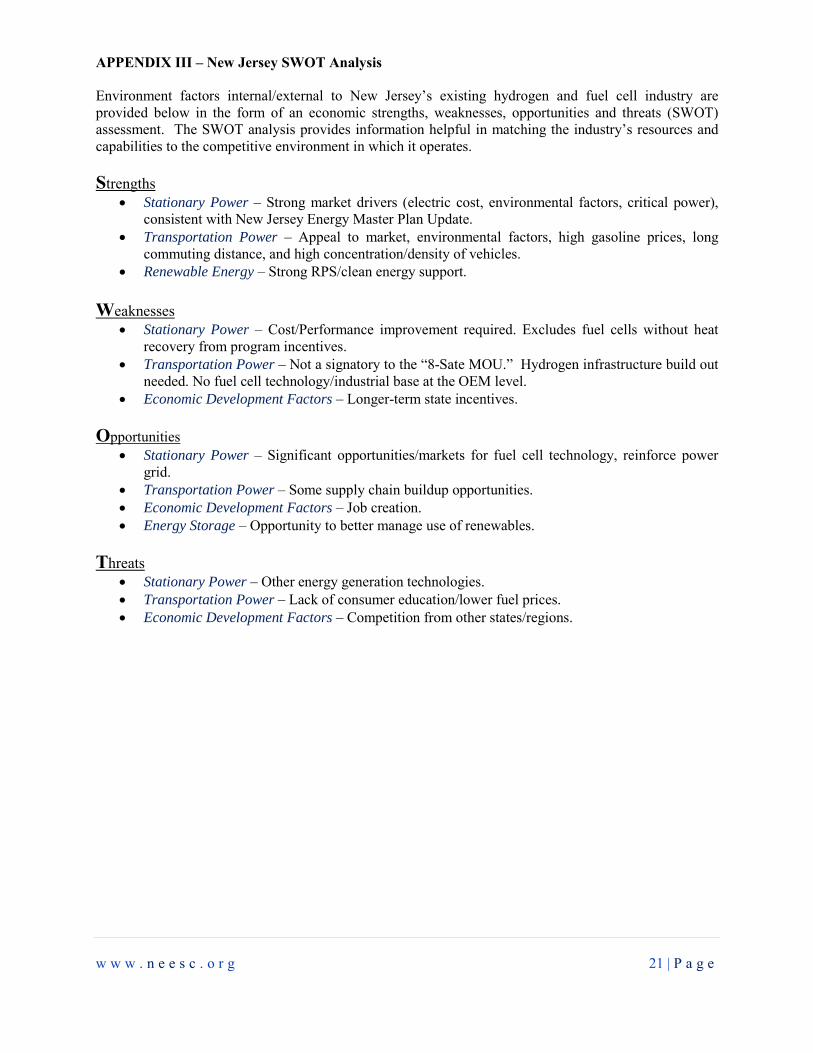
APPENDIX III – New Jersey SWOT Analysis Environment factors internal/external to New Jersey’s existing hydrogen and fuel cell industry are provided below in the form of an economic strengths, weaknesses, opportunities and threats (SWOT) assessment. The SWOT analysis provides information helpful in matching the industry’s resources and capabilities to the competitive environment in which it operates. Strengths
• Stationary Power – Strong market drivers (electric cost, environmental factors, critical power), consistent with New Jersey Energy Master Plan Update.
• Transportation Power – Appeal to market, environmental factors, high gasoline prices, long commuting distance, and high concentration/density of vehicles.
• Renewable Energy – Strong RPS/clean energy support.
Weaknesses • Stationary Power – Cost/Performance improvement required. Excludes fuel cells without heat
recovery from program incentives. • Transportation Power – Not a signatory to the “8-Sate MOU.” Hydrogen infrastructure build out
needed. No fuel cell technology/industrial base at the OEM level. • Economic Development Factors – Longer-term state incentives.
Opportunities
• Stationary Power – Significant opportunities/markets for fuel cell technology, reinforce power grid.
• Transportation Power – Some supply chain buildup opportunities. • Economic Development Factors – Job creation. • Energy Storage – Opportunity to better manage use of renewables.
Threats
• Stationary Power – Other energy generation technologies. • Transportation Power – Lack of consumer education/lower fuel prices. • Economic Development Factors – Competition from other states/regions.
w w w . n e e s c . o r g 22 | P a g e
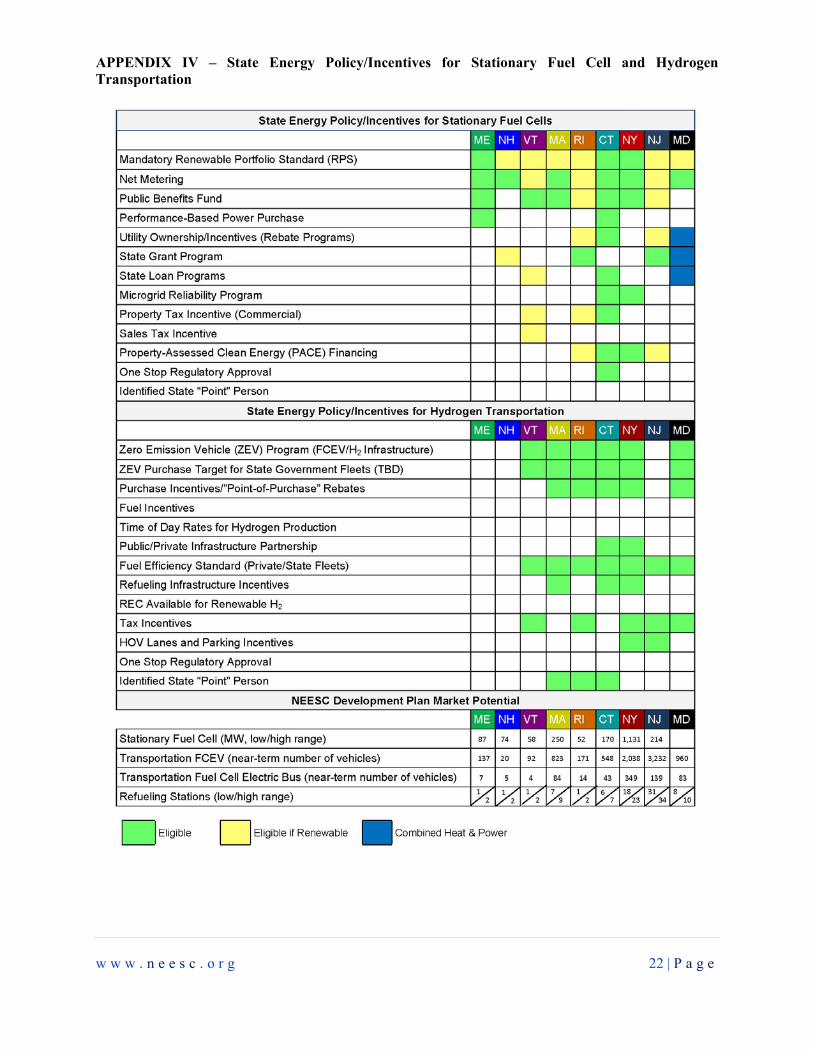
APPENDIX IV – State Energy Policy/Incentives for Stationary Fuel Cell and Hydrogen Transportation
w w w . n e e s c . o r g 23 | P a g e
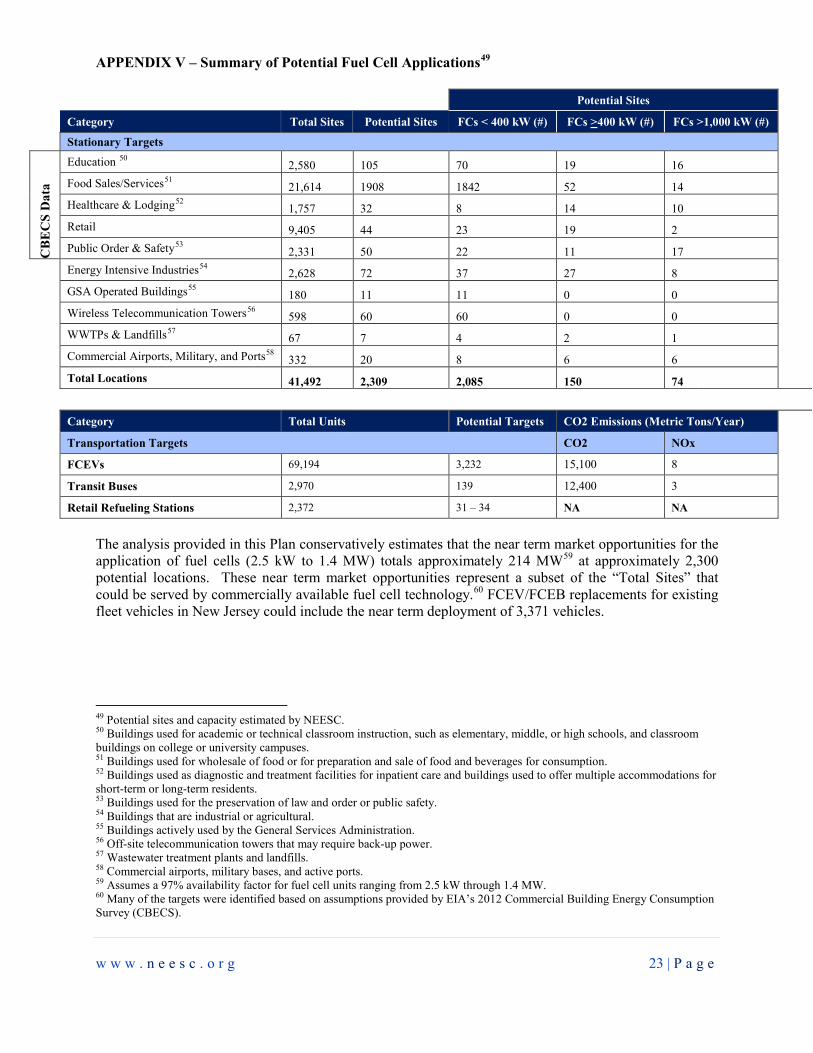
APPENDIX V – Summary of Potential Fuel Cell Applications49
Potential Sites
Category Total Sites Potential Sites FCs < 400 kW (#) FCs >400 kW (#) FCs >1,000 kW (#)
Stationary Targets
CB
EC
S D
ata
Education 50 2,580 105 70 19 16 Food Sales/Services51 21,614 1908 1842 52 14 Healthcare & Lodging52 1,757 32 8 14 10 Retail 9,405 44 23 19 2 Public Order & Safety53 2,331 50 22 11 17
Energy Intensive Industries54 2,628 72 37 27 8 GSA Operated Buildings55 180 11 11 0 0 Wireless Telecommunication Towers56 598 60 60 0 0 WWTPs & Landfills57 67 7 4 2 1 Commercial Airports, Military, and Ports58 332 20 8 6 6 Total Locations 41,492 2,309 2,085 150 74
Category Total Units Potential Targets CO2 Emissions (Metric Tons/Year)
Transportation Targets CO2 NOx
FCEVs 69,194 3,232 15,100 8 Transit Buses 2,970 139 12,400 3 Retail Refueling Stations 2,372 31 – 34 NA NA
The analysis provided in this Plan conservatively estimates that the near term market opportunities for the application of fuel cells (2.5 kW to 1.4 MW) totals approximately 214 MW59 at approximately 2,300 potential locations. These near term market opportunities represent a subset of the “Total Sites” that could be served by commercially available fuel cell technology.60 FCEV/FCEB replacements for existing fleet vehicles in New Jersey could include the near term deployment of 3,371 vehicles.
49 Potential sites and capacity estimated by NEESC. 50 Buildings used for academic or technical classroom instruction, such as elementary, middle, or high schools, and classroom buildings on college or university campuses. 51 Buildings used for wholesale of food or for preparation and sale of food and beverages for consumption. 52 Buildings used as diagnostic and treatment facilities for inpatient care and buildings used to offer multiple accommodations for short-term or long-term residents. 53 Buildings used for the preservation of law and order or public safety. 54 Buildings that are industrial or agricultural. 55 Buildings actively used by the General Services Administration. 56 Off-site telecommunication towers that may require back-up power. 57 Wastewater treatment plants and landfills. 58 Commercial airports, military bases, and active ports. 59 Assumes a 97% availability factor for fuel cell units ranging from 2.5 kW through 1.4 MW. 60 Many of the targets were identified based on assumptions provided by EIA’s 2012 Commercial Building Energy Consumption Survey (CBECS).