new jersey department of transportation, in-house lecture series, trenton, september 24, 2008...
TRANSCRIPT
New Jersey Department of Transportation, In-House New Jersey Department of Transportation, In-House Lecture Series, Trenton, September 24, 2008Lecture Series, Trenton, September 24, 2008
Transportation and Oil Prices: Transportation and Oil Prices: From Modal Shift to Supply Chain From Modal Shift to Supply Chain PropagationPropagation
Jean-Paul RodrigueAssociate ProfessorDept. of Global Studies & GeographyHofstra UniversityNew York, USA
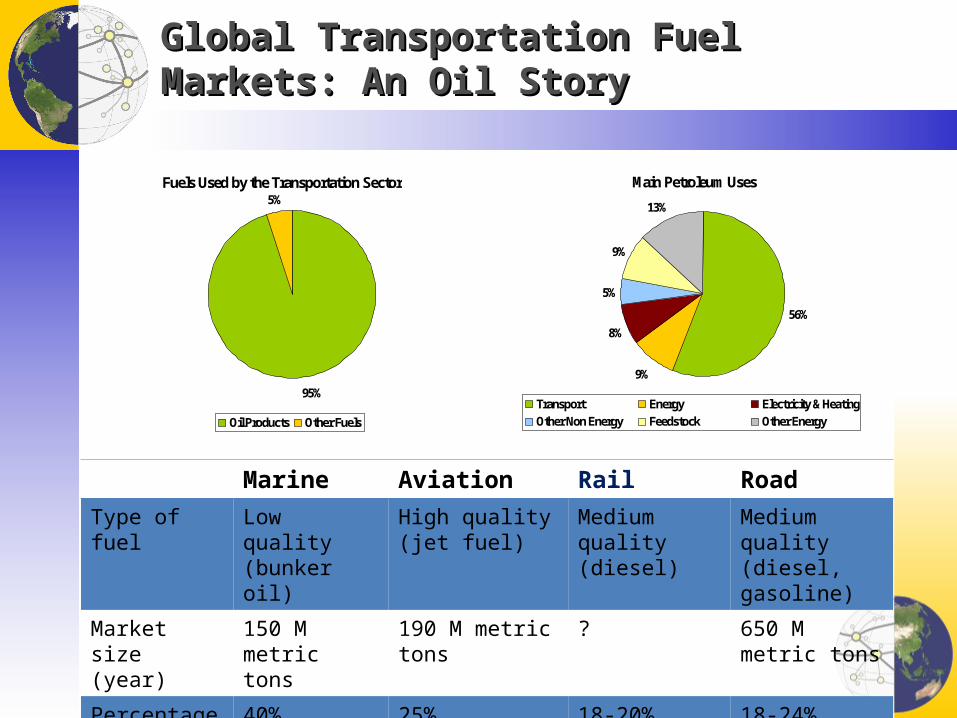
Global Transportation Fuel Markets: An Oil StoryGlobal Transportation Fuel Markets: An Oil Story
Fuels Used by the Transportation Sector
95%
5%
Oil Products Other Fuels
Main Petroleum Uses
56%
9%
8%
5%
9%
13%
Transport Energy Electricity & Heating
Other Non Energy Feedstock Other Energy
Marine Aviation Rail Road
Type of fuel Low quality (bunker oil)
High quality (jet fuel) Medium quality (diesel)
Medium quality (diesel, gasoline)
Market size (year)
150 M metric tons
190 M metric tons ? 650 M metric tons
Percentage of operating costs
40% 25% 18-20% 18-24%
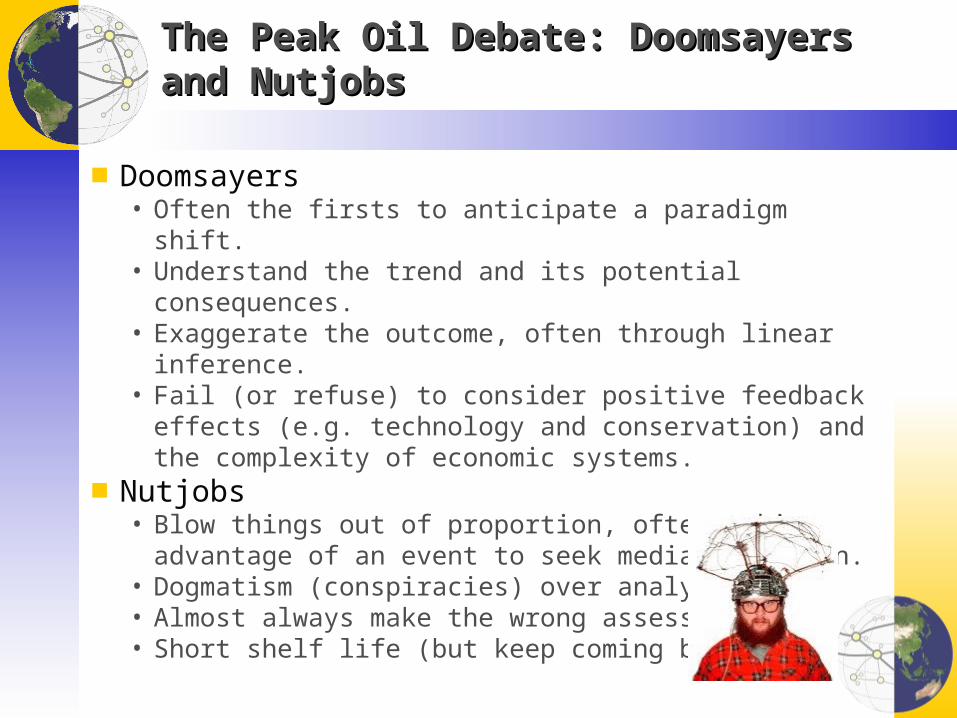
The Peak Oil Debate: Doomsayers and NutjobsThe Peak Oil Debate: Doomsayers and Nutjobs
■ Doomsayers• Often the firsts to anticipate a paradigm shift.• Understand the trend and its potential consequences.• Exaggerate the outcome, often through linear inference.• Fail (or refuse) to consider positive feedback effects (e.g.
technology and conservation) and the complexity of economic systems.
■ Nutjobs• Blow things out of proportion, often taking advantage of an
event to seek media attention.• Dogmatism (conspiracies) over analysis.• Almost always make the wrong assessment.• Short shelf life (but keep coming back…).

Demystifying Conspiracy TheoriesDemystifying Conspiracy Theories
■ We are running out of oil• We are running out of cheap oil options.
■ OPEC fixes oil prices• A dysfunctional cartel that can do little.• Each member does mostly want it wants.• Statements should be viewed as comic relief (e.g. Chavez).
■ Speculation drives oil prices• Somewhat (short term), but many can also lose their shirts.
■ High oil prices paralyze transportation• Not really.• Low oil prices promotes wasteful practices.• High oil prices force a reconsideration and a default in
unsustainable practices.
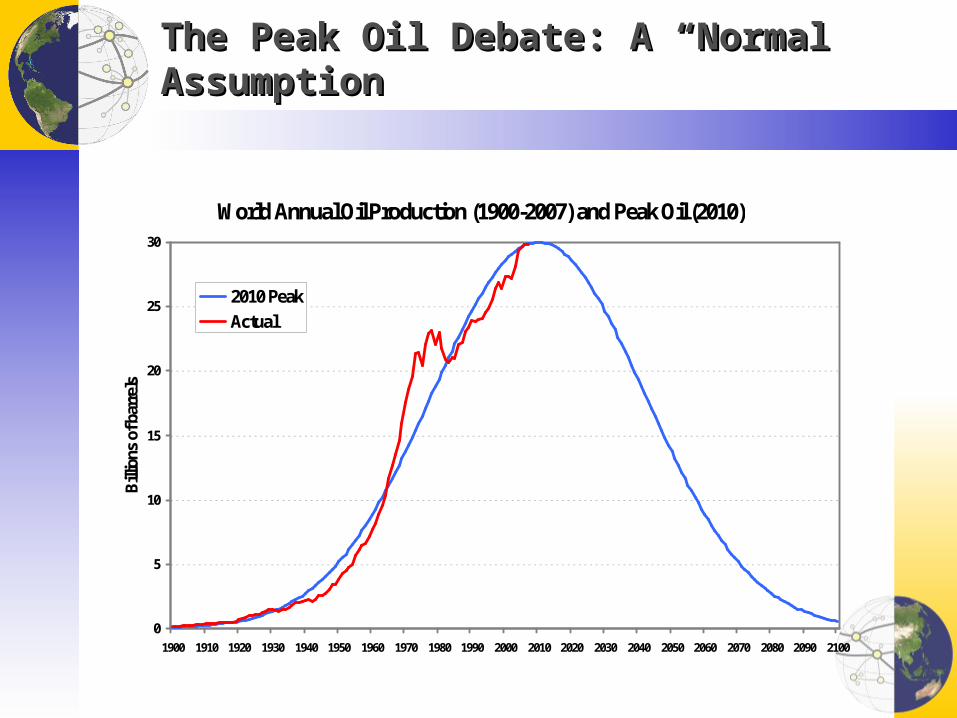
The Peak Oil Debate: A “Normal” AssumptionThe Peak Oil Debate: A “Normal” Assumption
World Annual Oil Production (1900-2007) and Peak Oil (2010)
0
5
10
15
20
25
30
1900 1910 1920 1930 1940 1950 1960 1970 1980 1990 2000 2010 2020 2030 2040 2050 2060 2070 2080 2090 2100
Bill
ions
of b
arre
ls
2010 Peak
Actual
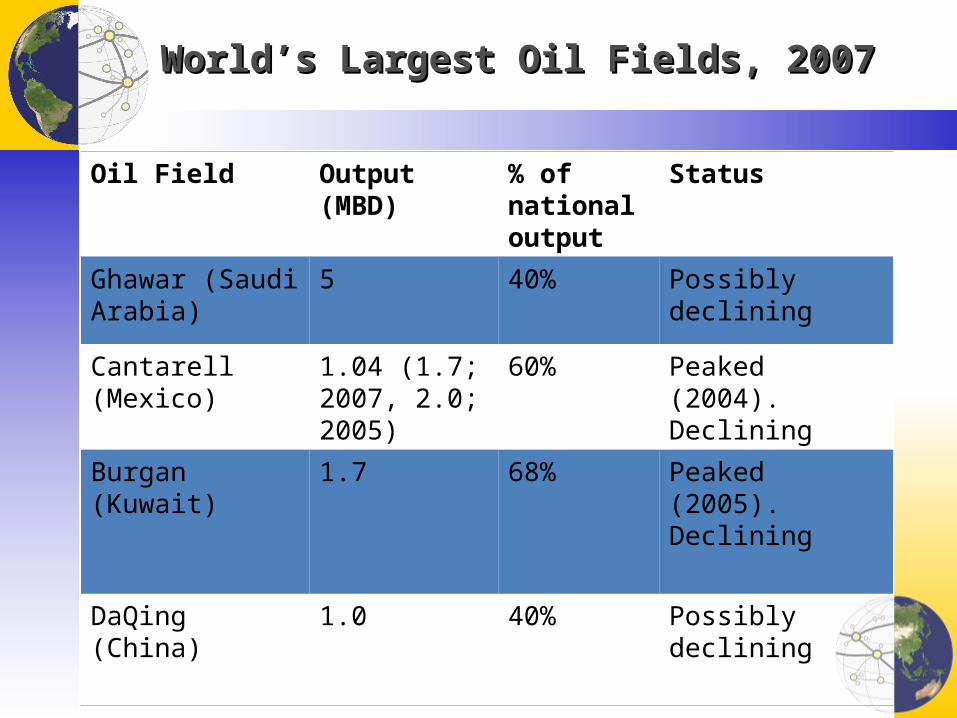
World’s Largest Oil Fields, 2007World’s Largest Oil Fields, 2007
Oil Field Output (MBD) % of national output
Status
Ghawar (Saudi Arabia)
5 40% Possibly declining
Cantarell (Mexico) 1.04 (1.7; 2007, 2.0; 2005)
60% Peaked (2004). Declining
Burgan (Kuwait) 1.7 68% Peaked (2005). Declining
DaQing (China) 1.0 40% Possibly declining
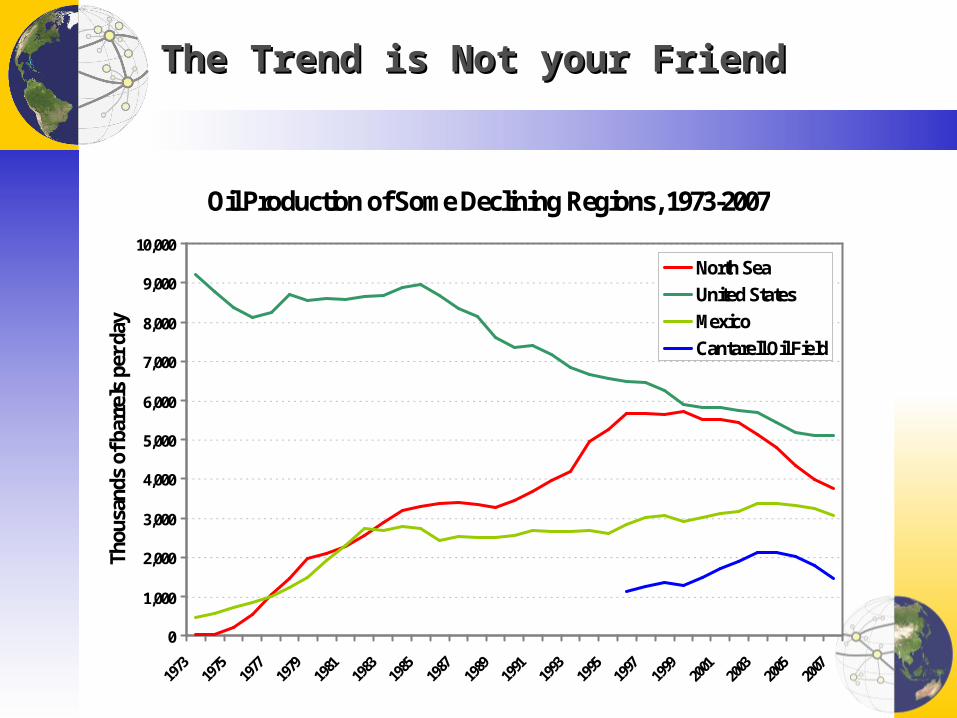
The Trend is Not your FriendThe Trend is Not your Friend
Oil Production of Some Declining Regions, 1973-2007
0
1,000
2,000
3,000
4,000
5,000
6,000
7,000
8,000
9,000
10,000
1973
1975
1977
1979
1981
1983
1985
1987
1989
1991
1993
1995
1997
1999
2001
2003
2005
2007
Thou
sand
s of
bar
rels
per
day
North Sea
United States
Mexico
Cantarell Oil Field
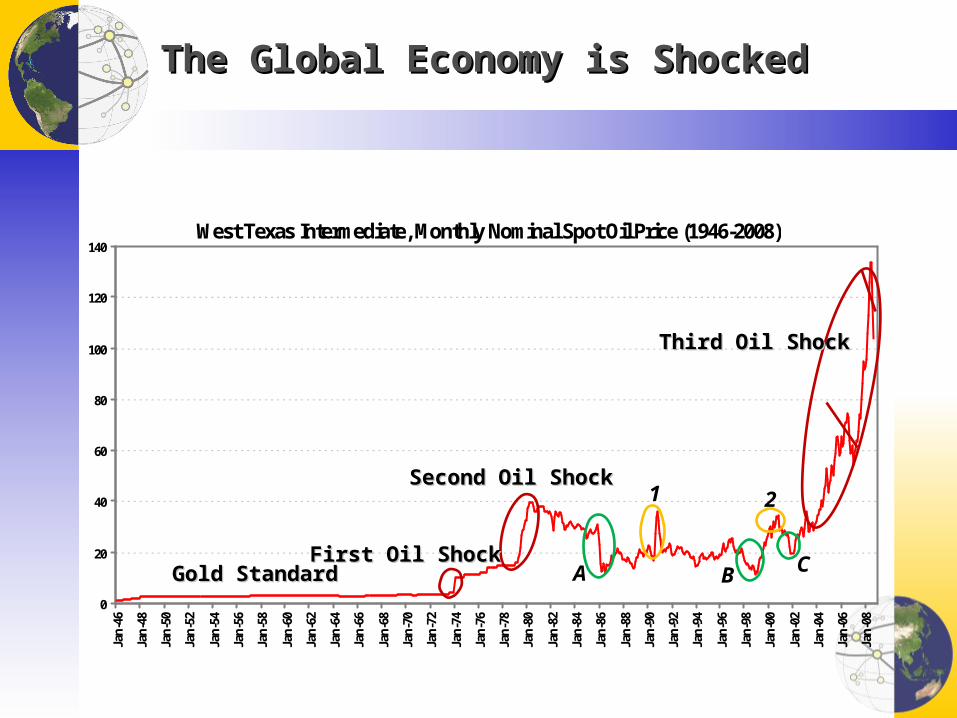
The Global Economy is ShockedThe Global Economy is Shocked
West Texas Intermediate, Monthly Nominal Spot Oil Price (1946-2008)
0
20
40
60
80
100
120
140
Jan-
46
Jan-
48
Jan-
50
Jan-
52
Jan-
54
Jan-
56
Jan-
58
Jan-
60
Jan-
62
Jan-
64
Jan-
66
Jan-
68
Jan-
70
Jan-
72
Jan-
74
Jan-
76
Jan-
78
Jan-
80
Jan-
82
Jan-
84
Jan-
86
Jan-
88
Jan-
90
Jan-
92
Jan-
94
Jan-
96
Jan-
98
Jan-
00
Jan-
02
Jan-
04
Jan-
06
Jan-
08
Gold StandardGold StandardFirst Oil ShockFirst Oil Shock
Second Oil ShockSecond Oil Shock
Third Oil ShockThird Oil Shock
A B C
21
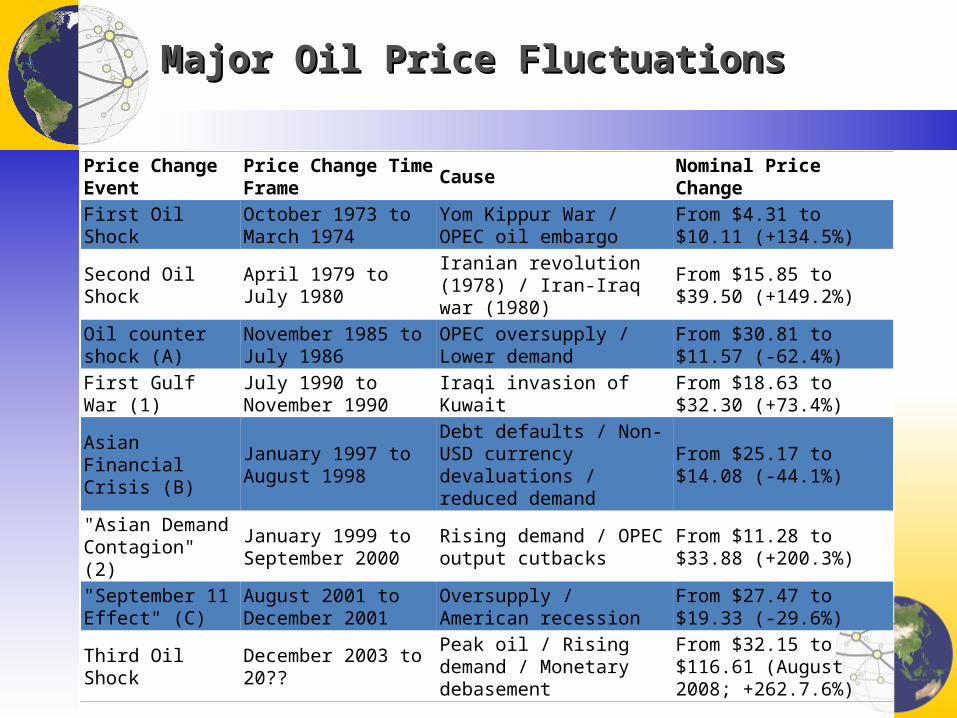
Major Oil Price FluctuationsMajor Oil Price Fluctuations
Price Change Event Price Change Time Frame Cause Nominal Price Change
First Oil Shock October 1973 to March 1974
Yom Kippur War / OPEC oil embargo
From $4.31 to $10.11 (+134.5%)
Second Oil Shock April 1979 to July 1980 Iranian revolution (1978) / Iran-Iraq war (1980)
From $15.85 to $39.50 (+149.2%)
Oil counter shock (A) November 1985 to July 1986
OPEC oversupply / Lower demand
From $30.81 to $11.57 (-62.4%)
First Gulf War (1) July 1990 to November 1990 Iraqi invasion of Kuwait From $18.63 to $32.30
(+73.4%)
Asian Financial Crisis (B)
January 1997 to August 1998
Debt defaults / Non-USD currency devaluations / reduced demand
From $25.17 to $14.08 (-44.1%)
"Asian Demand Contagion" (2)
January 1999 to September 2000
Rising demand / OPEC output cutbacks
From $11.28 to $33.88 (+200.3%)
"September 11 Effect" (C)
August 2001 to December 2001 Oversupply / American recession From $27.47 to $19.33 (-
29.6%)
Third Oil Shock December 2003 to 20?? Peak oil / Rising demand / Monetary debasement
From $32.15 to $116.61 (August 2008; +262.7.6%)
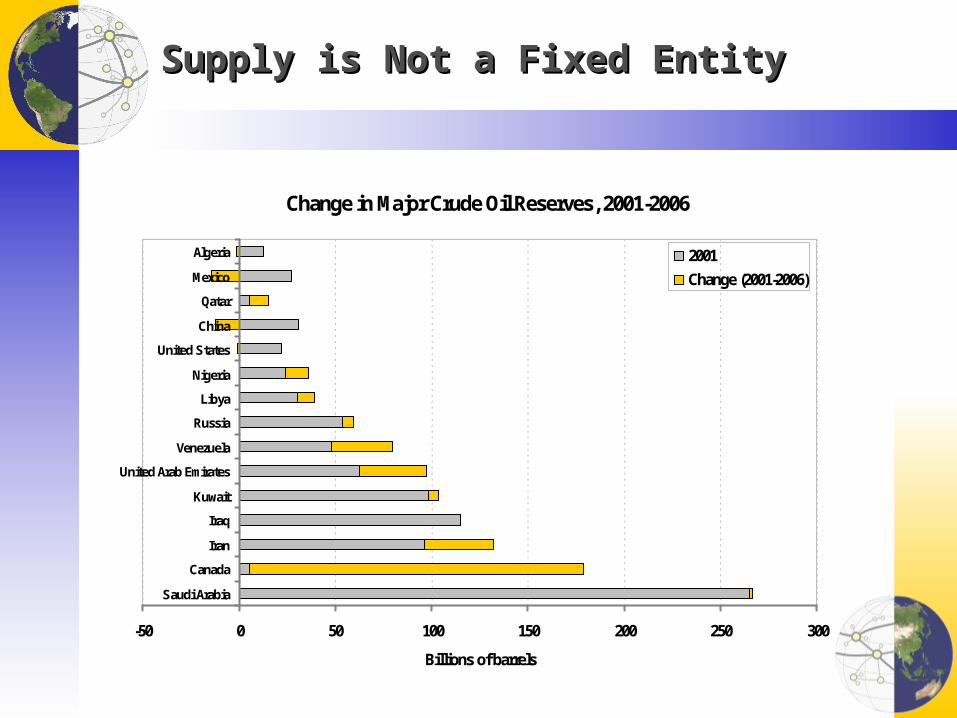
Supply is Not a Fixed EntitySupply is Not a Fixed Entity
Change in Major Crude Oil Reserves, 2001-2006
-50 0 50 100 150 200 250 300
Saudi Arabia
Canada
Iran
Iraq
Kuwait
United Arab Emirates
Venezuela
Russia
Libya
Nigeria
United States
China
Qatar
Mexico
Algeria
Billions of barrels
2001
Change (2001-2006)
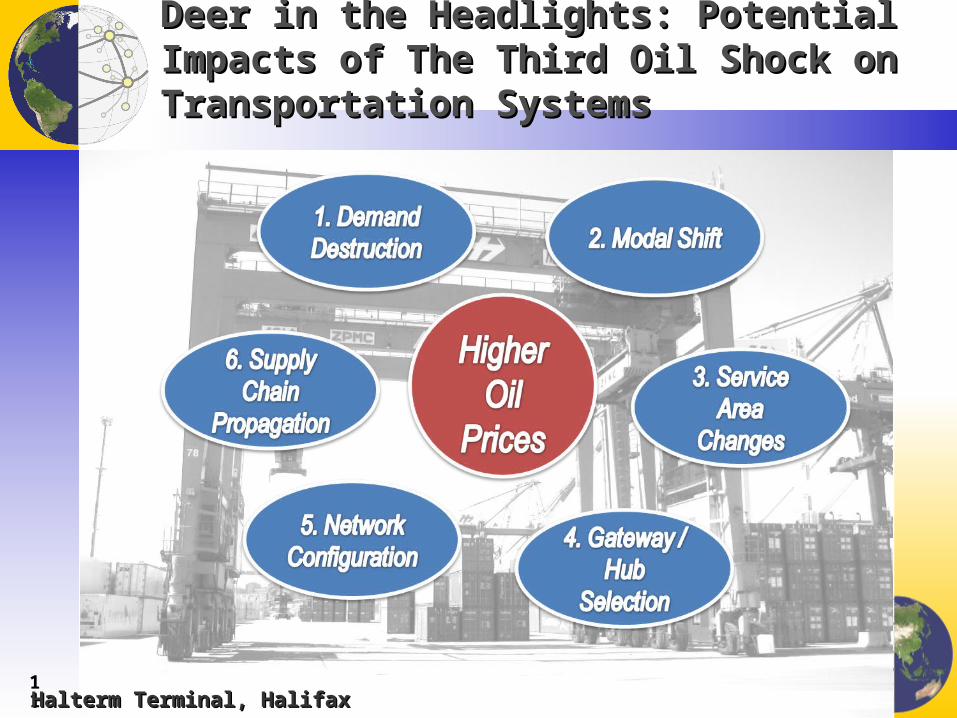
Deer in the Headlights: Potential Impacts of The Deer in the Headlights: Potential Impacts of The Third Oil Shock on Transportation SystemsThird Oil Shock on Transportation Systems
11Halterm Terminal, HalifaxHalterm Terminal, Halifax
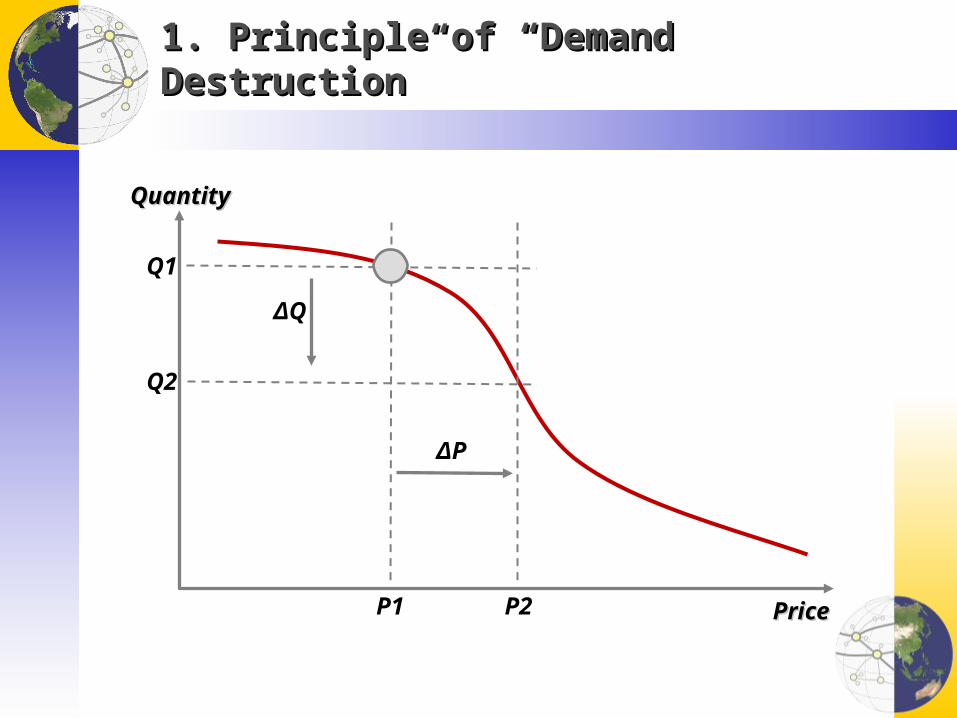
1. Principle of “Demand Destruction”1. Principle of “Demand Destruction”
PricePrice
QuantityQuantity
P1
ΔP
P2
Q1
ΔQ
Q2

Annual Vehicle-Miles Traveled and Year-over-Year Annual Vehicle-Miles Traveled and Year-over-Year Changes (Peak Mobility?)Changes (Peak Mobility?)
Recession
End of the motorization cycleSlow down of suburbanizationAging of the population
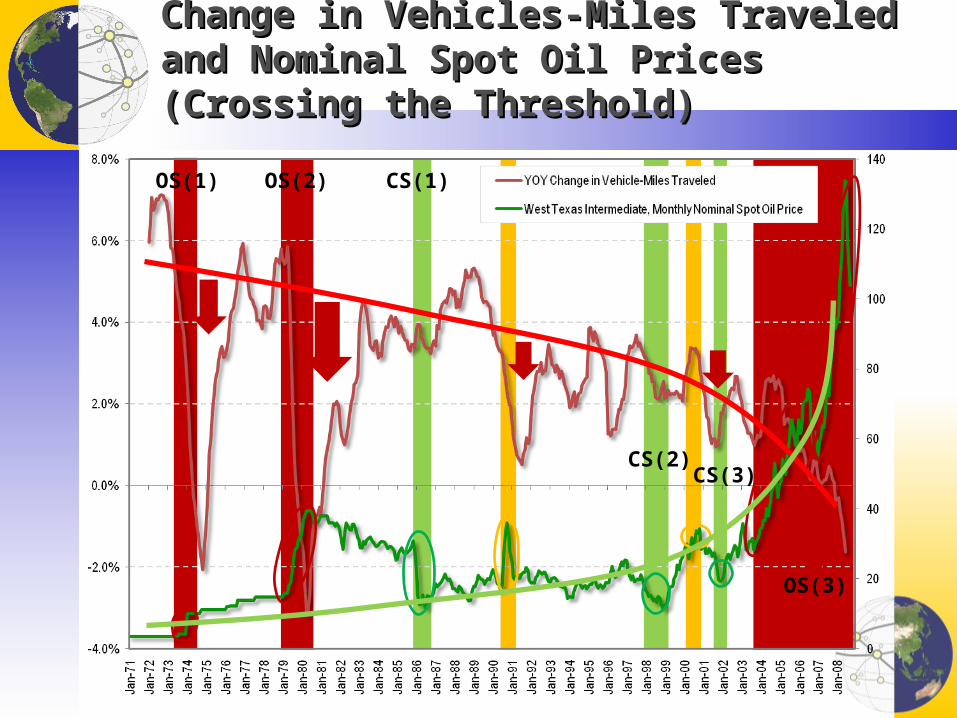
Change in Vehicles-Miles Traveled and Nominal Spot Change in Vehicles-Miles Traveled and Nominal Spot Oil Prices (Crossing the Threshold)Oil Prices (Crossing the Threshold)
OS(1) OS(2)
OS(3)
CS(1)
CS(2)CS(3)
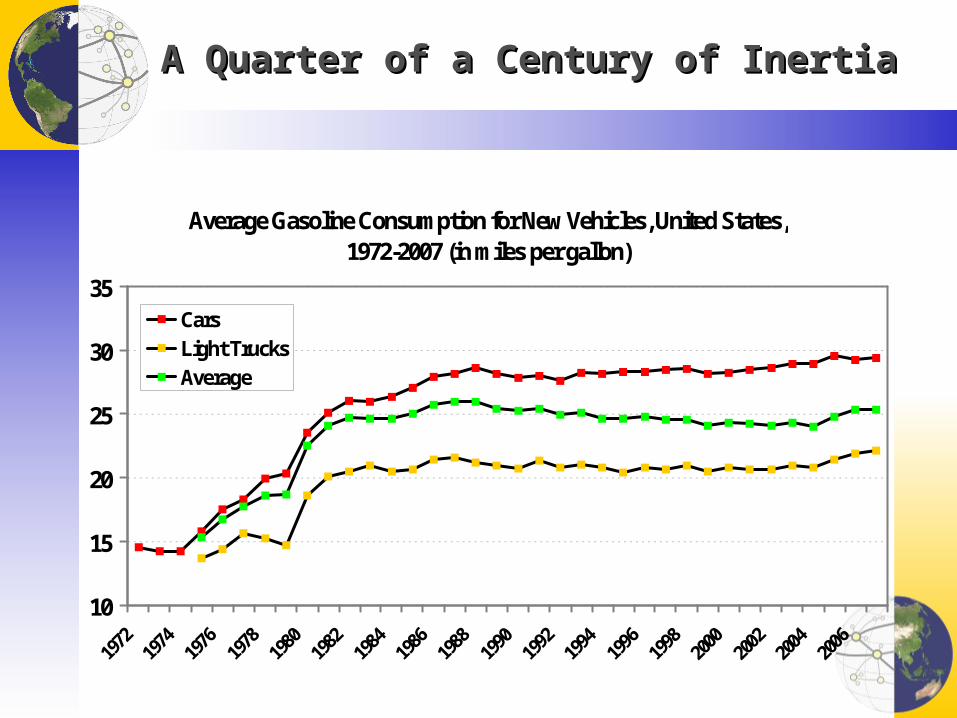
A Quarter of a Century of InertiaA Quarter of a Century of Inertia
Average Gasoline Consumption for New Vehicles, United States, 1972-2007 (in miles per gallon)
10
15
20
25
30
35
1972
1974
1976
1978
1980
1982
1984
1986
1988
1990
1992
1994
1996
1998
2000
2002
2004
2006
CarsLight TrucksAverage
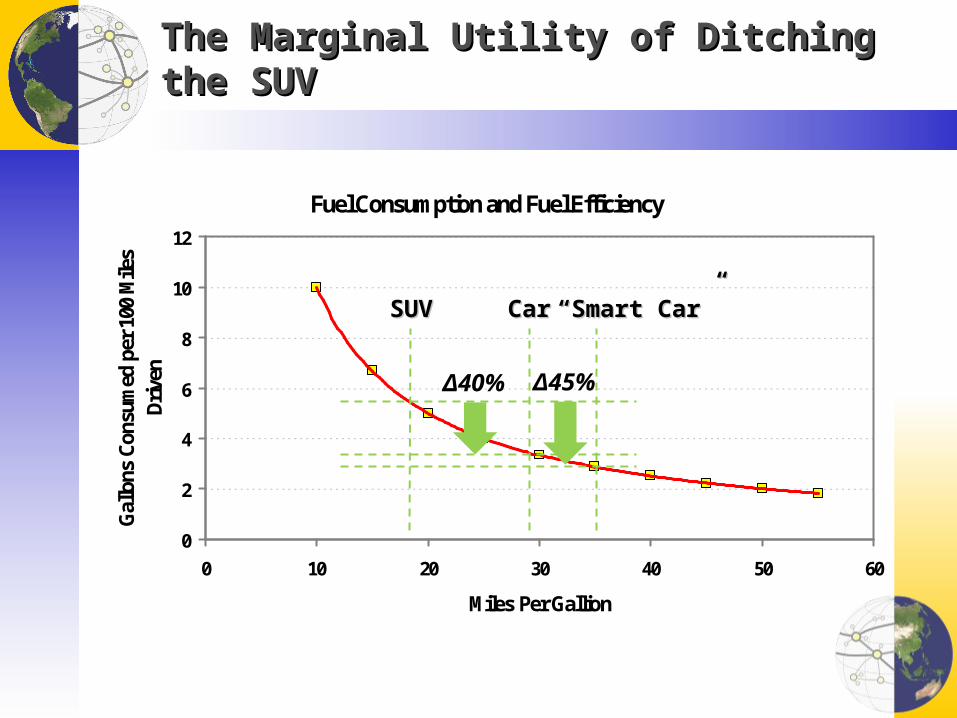
The Marginal Utility of Ditching the SUVThe Marginal Utility of Ditching the SUV
Fuel Consumption and Fuel Efficiency
0
2
4
6
8
10
12
0 10 20 30 40 50 60
Miles Per Gallion
Gal
lons
Con
sum
ed p
er 1
00 M
iles
Dri
ven
SUVSUV CarCar ““Smart Car”Smart Car”
Δ40% Δ45%

Air Transportation Has Some Room for SubstitutionAir Transportation Has Some Room for Substitution
Trend in Aircraft Fuel Efficiency (Fuel burned per Seat)
20
30
40
50
60
70
80
90
100
1955 1965 1975 1985 1995 2005
Year of Introduction
% o
f Bas
e (C
omet
4)
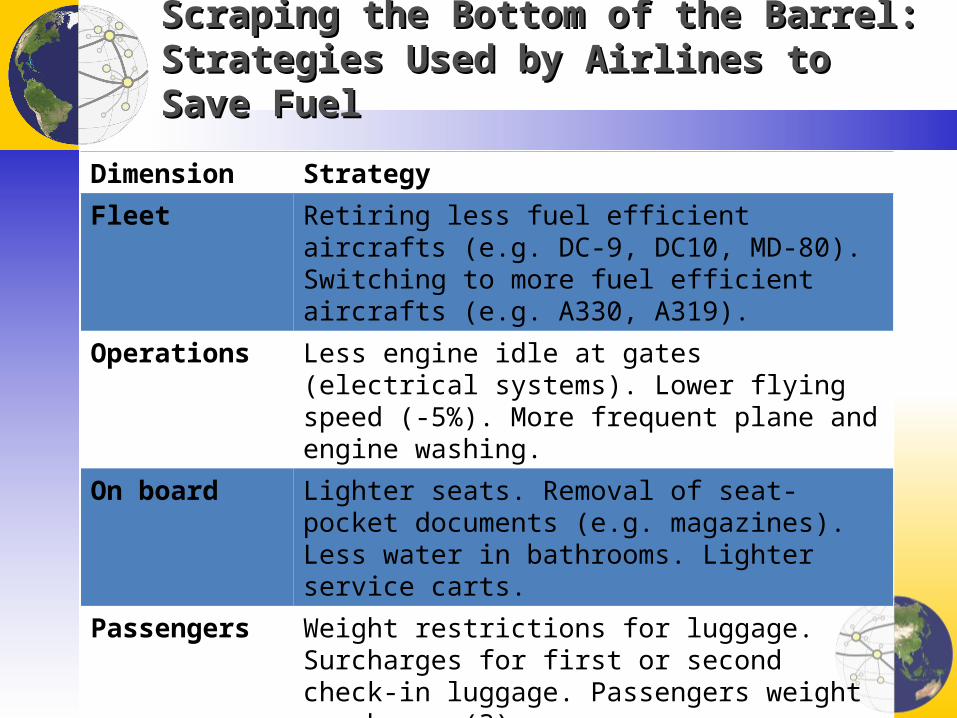
Scraping the Bottom of the Barrel: Strategies Used Scraping the Bottom of the Barrel: Strategies Used by Airlines to Save Fuelby Airlines to Save Fuel
Dimension Strategy
Fleet Retiring less fuel efficient aircrafts (e.g. DC-9, DC10, MD-80). Switching to more fuel efficient aircrafts (e.g. A330, A319).
Operations Less engine idle at gates (electrical systems). Lower flying speed (-5%). More frequent plane and engine washing.
On board Lighter seats. Removal of seat-pocket documents (e.g. magazines). Less water in bathrooms. Lighter service carts.
Passengers Weight restrictions for luggage. Surcharges for first or second check-in luggage. Passengers weight surcharges(?)
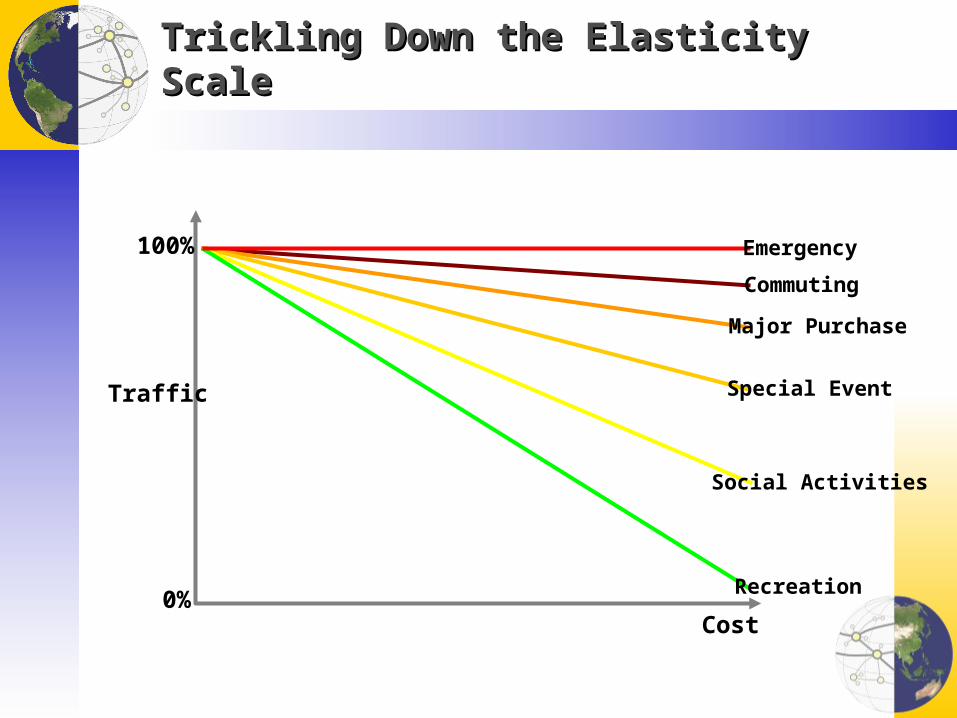
Trickling Down the Elasticity ScaleTrickling Down the Elasticity Scale
Traffic
Cost
100%
0%
Emergency
Commuting
Major Purchase
Special Event
Social Activities
Recreation

Differentials in Demand DestructionDifferentials in Demand Destruction
0
10
20
30
40
50
60
70
80
90
100
0 1 2 3 4 5 6 7 8 9 10
Cost Level
Traf
fic
Shopping
Social / RecreationWork
Total trips
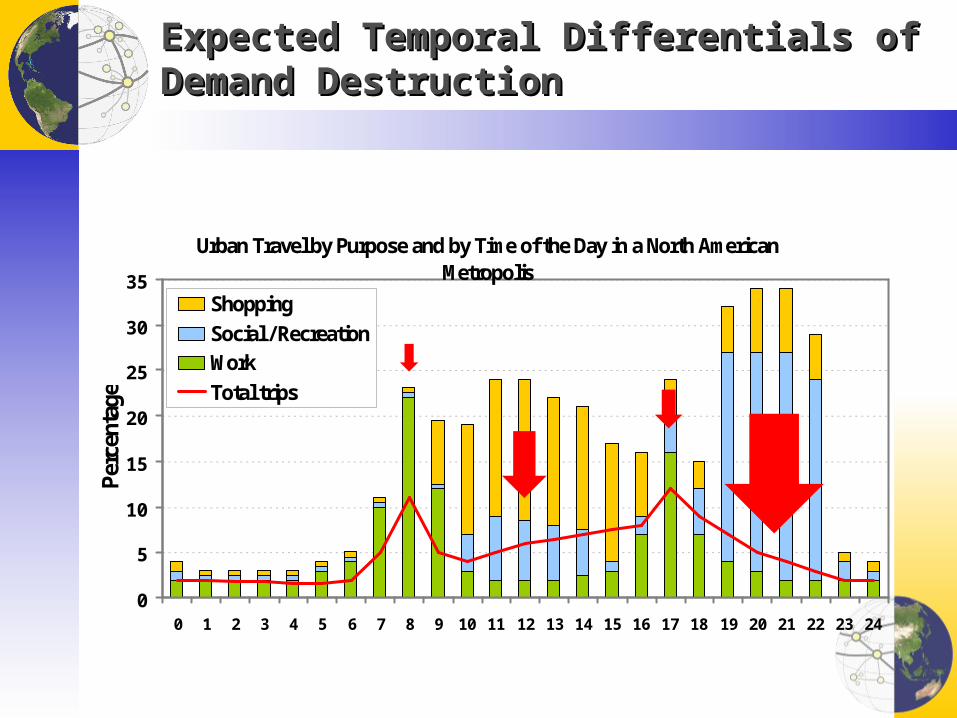
Expected Temporal Differentials of Demand Expected Temporal Differentials of Demand DestructionDestruction
Urban Travel by Purpose and by Time of the Day in a North American Metropolis
0
5
10
15
20
25
30
35
0 1 2 3 4 5 6 7 8 9 10 11 12 13 14 15 16 17 18 19 20 21 22 23 24
Perc
enta
ge
Shopping
Social / RecreationWork
Total trips
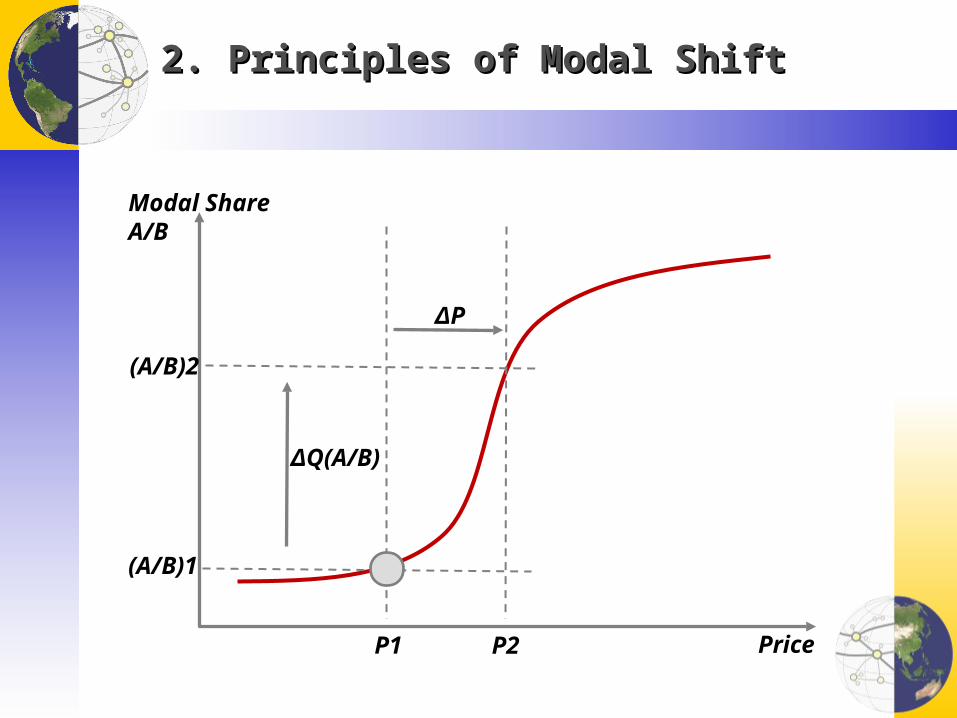
2. Principles of Modal Shift2. Principles of Modal Shift
Price
Modal ShareA/B
P1
ΔP
P2
(A/B)1
ΔQ(A/B)
(A/B)2
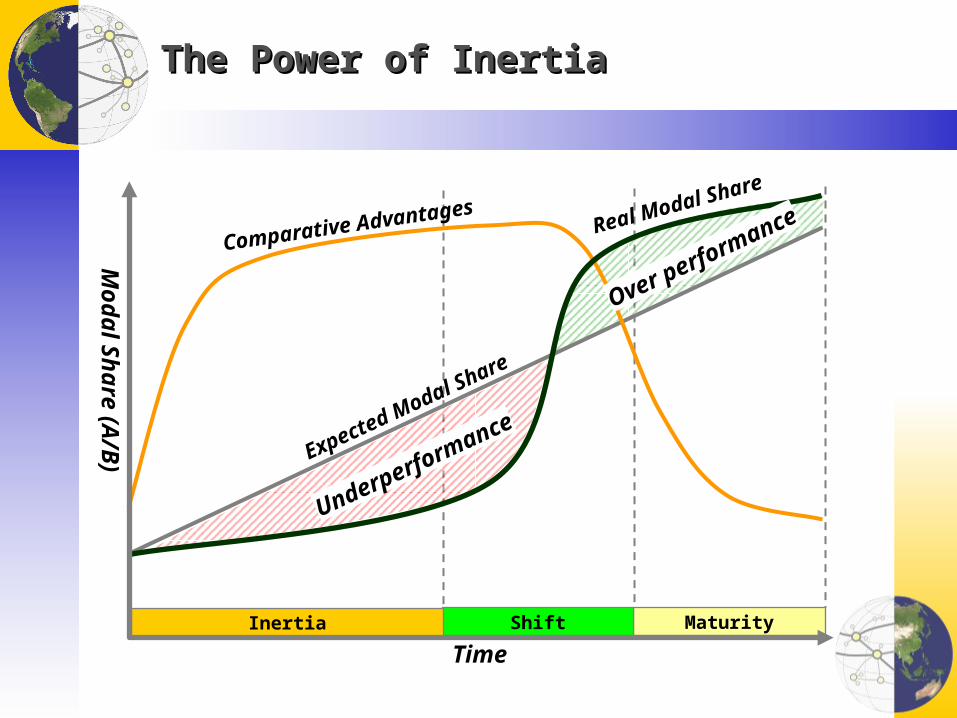
MaturityShiftInertia
The Power of InertiaThe Power of Inertia
Modal Share (A
/B)
Time
Comparative Advantages Real Modal Share
Expected Modal Share
Underperformance
Over performance
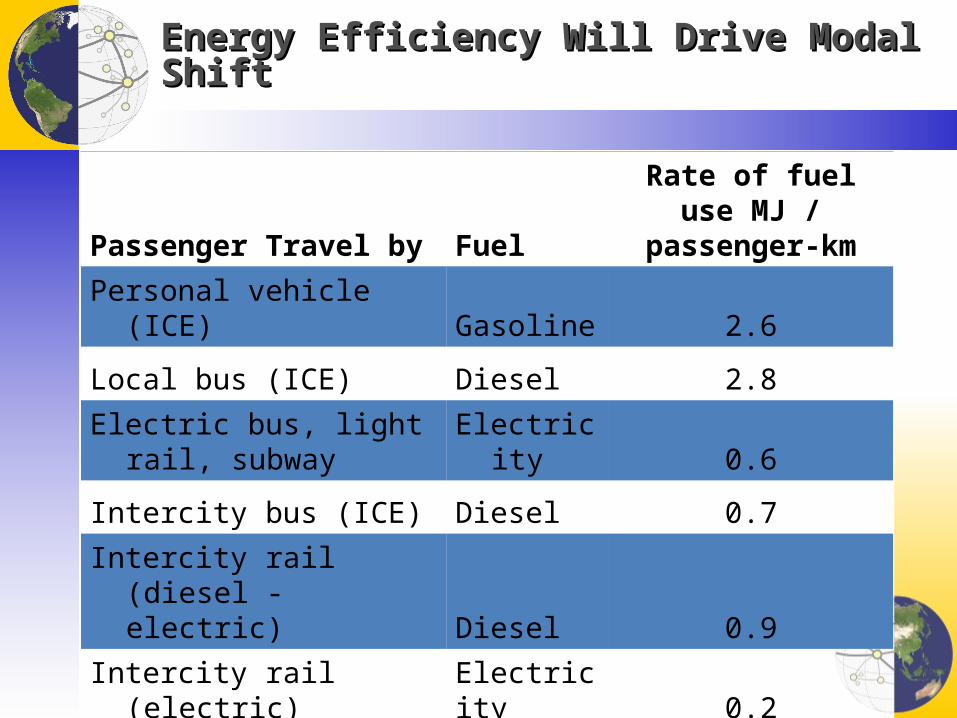
Energy Efficiency Will Drive Modal ShiftEnergy Efficiency Will Drive Modal Shift
Passenger Travel by FuelRate of fuel use MJ /
passenger-km
Personal vehicle (ICE) Gasoline 2.6
Local bus (ICE) Diesel 2.8
Electric bus, light rail, subway Electricity 0.6
Intercity bus (ICE) Diesel 0.7
Intercity rail (diesel - electric) Diesel 0.9
Intercity rail (electric) Electricity 0.2
High-speed rail (electric) Electricity 0.3
Aircraft (domestic) Kerosene 2.0
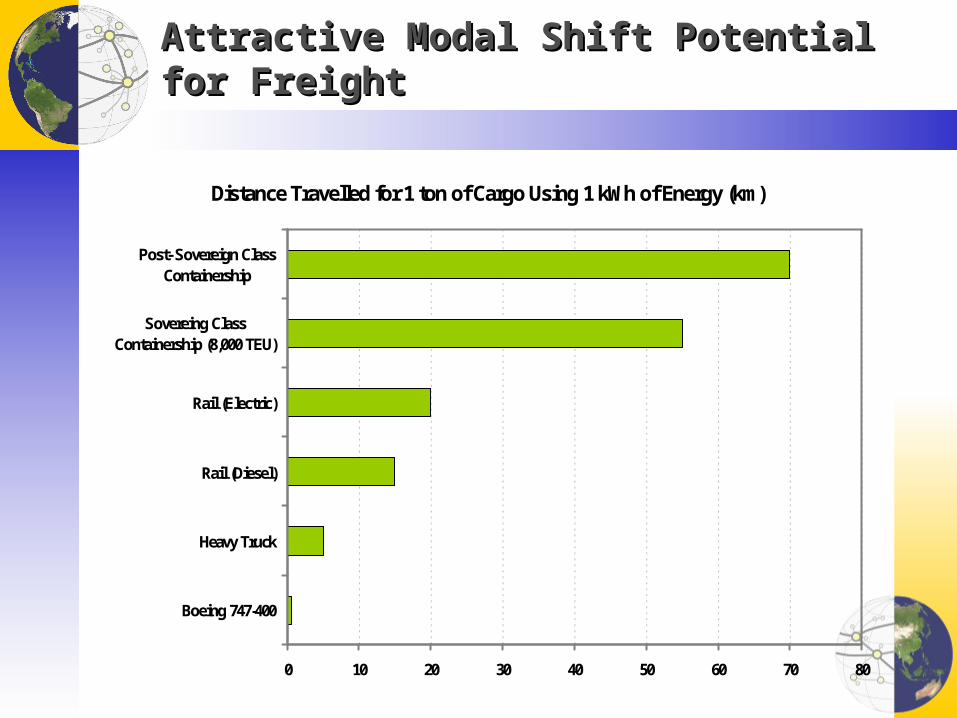
Attractive Modal Shift Potential for FreightAttractive Modal Shift Potential for Freight
Distance Travelled for 1 ton of Cargo Using 1 kWh of Energy (km)
0 10 20 30 40 50 60 70 80
Boeing 747-400
Heavy Truck
Rail (Diesel)
Rail (Electric)
Sovereing ClassContainership (8,000 TEU)
Post- Sovereign ClassContainership
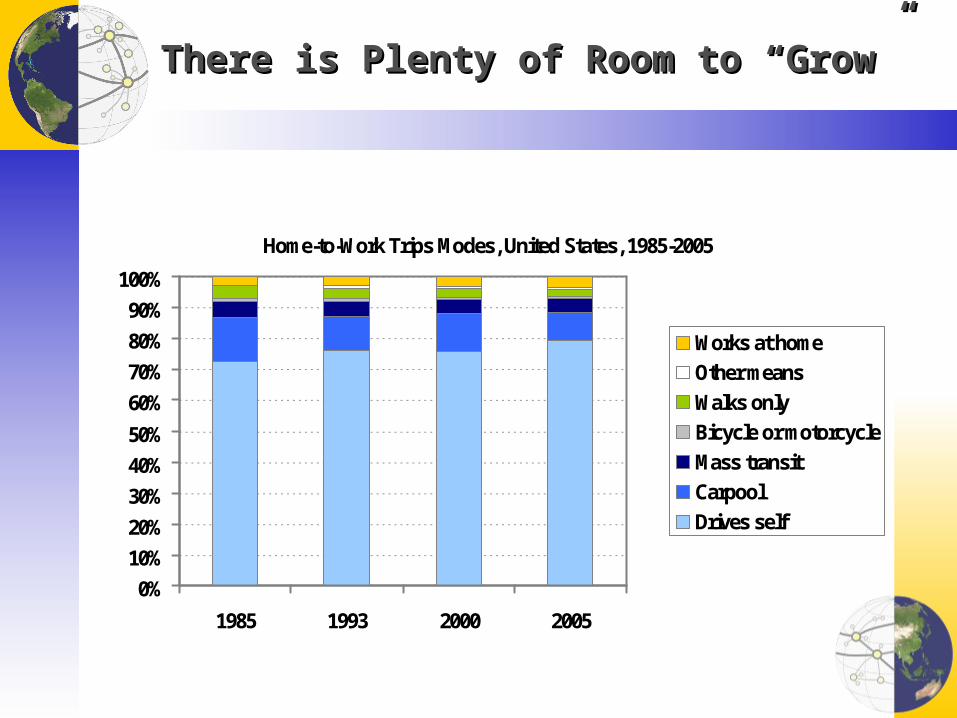
There is Plenty of Room to “Grow”There is Plenty of Room to “Grow”
Home-to-Work Trips Modes, United States, 1985-2005
0%
10%
20%
30%
40%
50%
60%
70%
80%
90%
100%
1985 1993 2000 2005
Works at home
Other means
Walks only
Bicycle or motorcycle
Mass transit
Carpool
Drives self
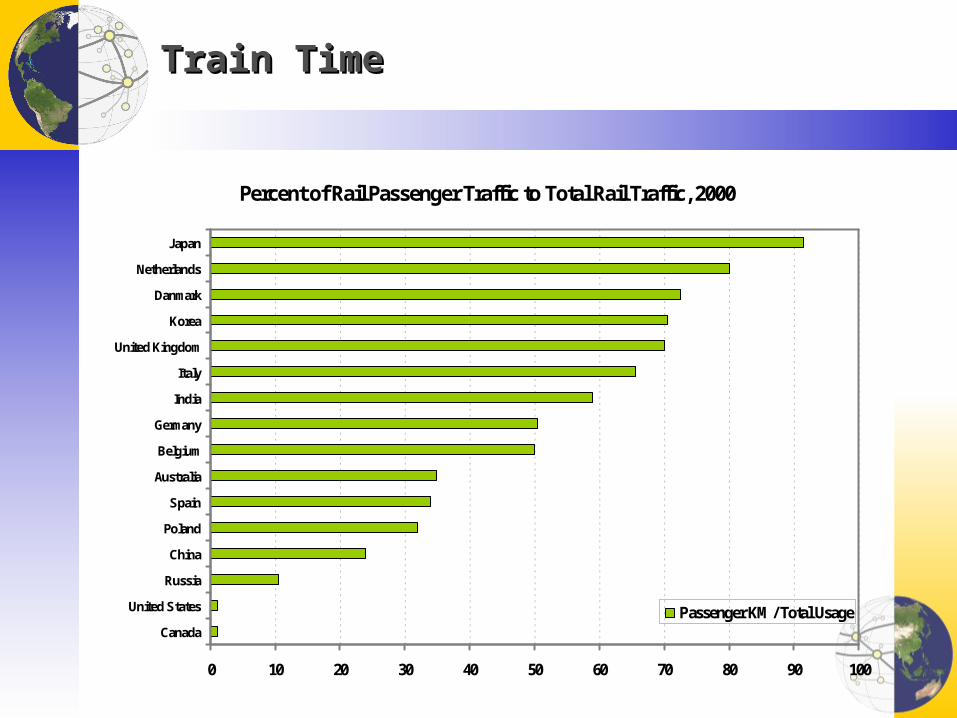
Train TimeTrain Time
Percent of Rail Passenger Traffic to Total Rail Traffic, 2000
0 10 20 30 40 50 60 70 80 90 100
Canada
United States
Russia
China
Poland
Spain
Australia
Belgium
Germany
India
Italy
United Kingdom
Korea
Danmark
Netherlands
Japan
Passenger KM / Total Usage
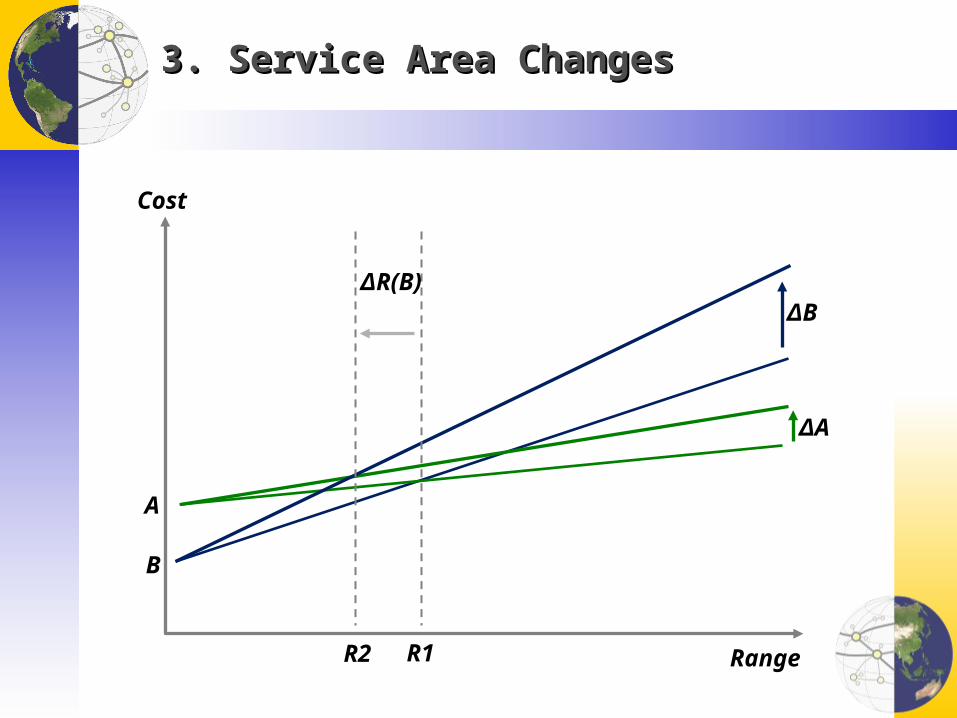
3. Service Area Changes3. Service Area Changes
Range
ΔA
ΔB
R1
Cost
ΔR(B)
R2
A
B
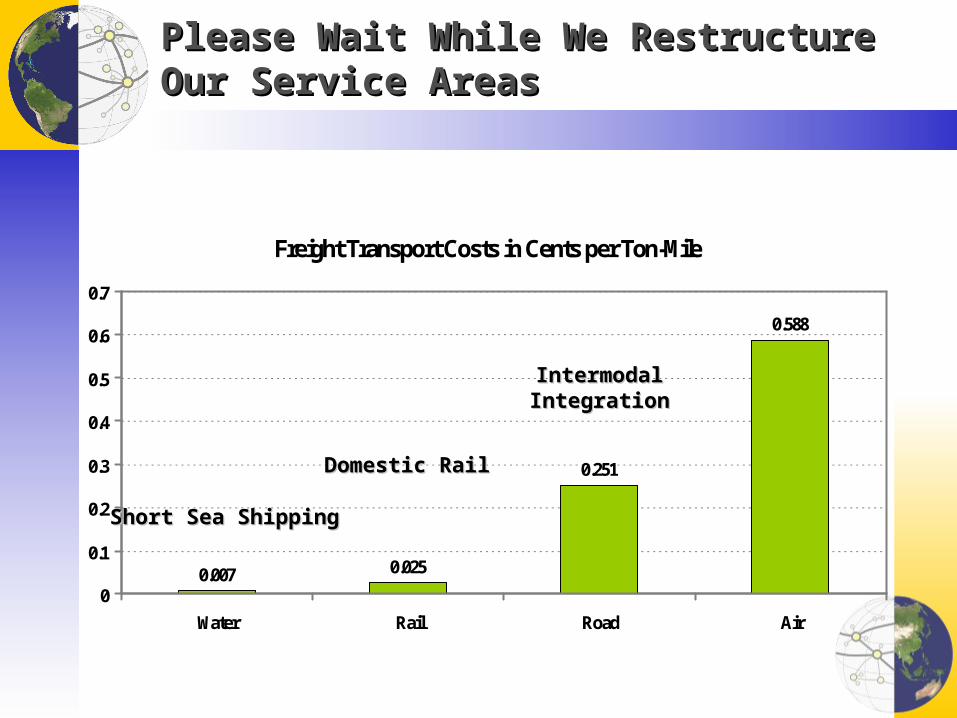
Please Wait While We Restructure Our Service AreasPlease Wait While We Restructure Our Service Areas
Freight Transport Costs in Cents per Ton-Mile
0.007 0.025
0.251
0.588
0
0.1
0.2
0.3
0.4
0.5
0.6
0.7
Water Rail Road Air
Short Sea ShippingShort Sea Shipping
Domestic RailDomestic Rail
IntermodalIntermodalIntegrationIntegration
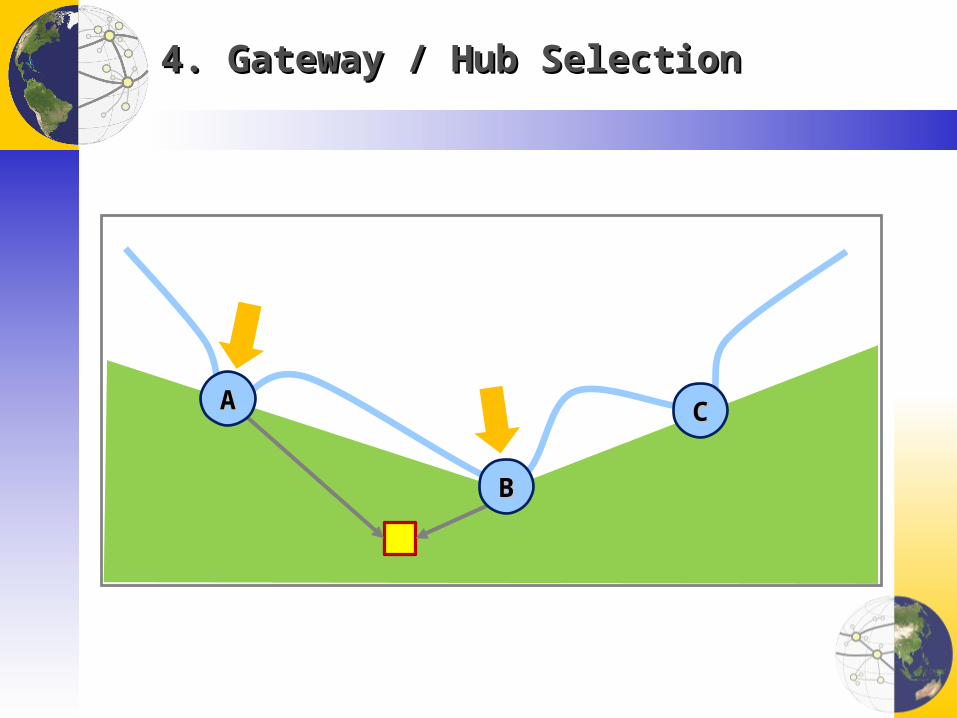
4. Gateway / Hub Selection4. Gateway / Hub Selection
BB
AA CC

Going Down the FunnelGoing Down the Funnel
Container Traffic Handled by Montreal and Halifax, 1981-2007 (TEU)
0
200,000
400,000
600,000
800,000
1,000,000
1,200,000
1,400,000
2007
2005
2003
2001
1999
1997
1995
1993
1991
1989
1987
1985
1983
1981
Halifax
Montreal
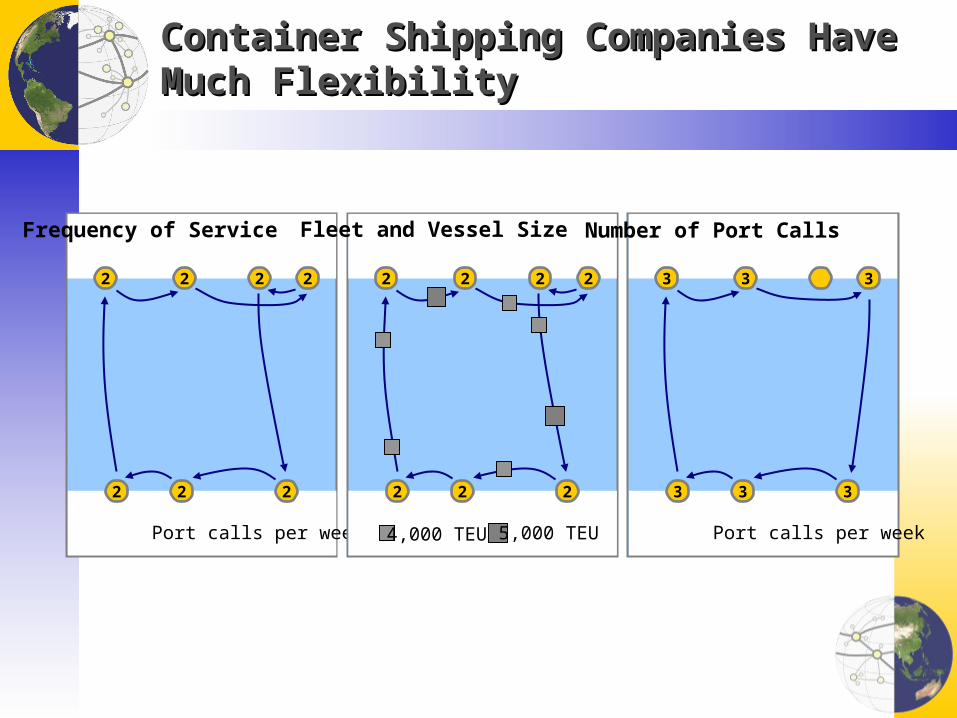
Container Shipping Companies Have Much Container Shipping Companies Have Much FlexibilityFlexibility
2 2 2 2
2 2 2
Port calls per week
2 2 2 2
2 2 2
4,000 TEU 5,000 TEU
3 3 3
3 3 3
Port calls per week
Frequency of Service Fleet and Vessel Size Number of Port Calls
Equa
tor
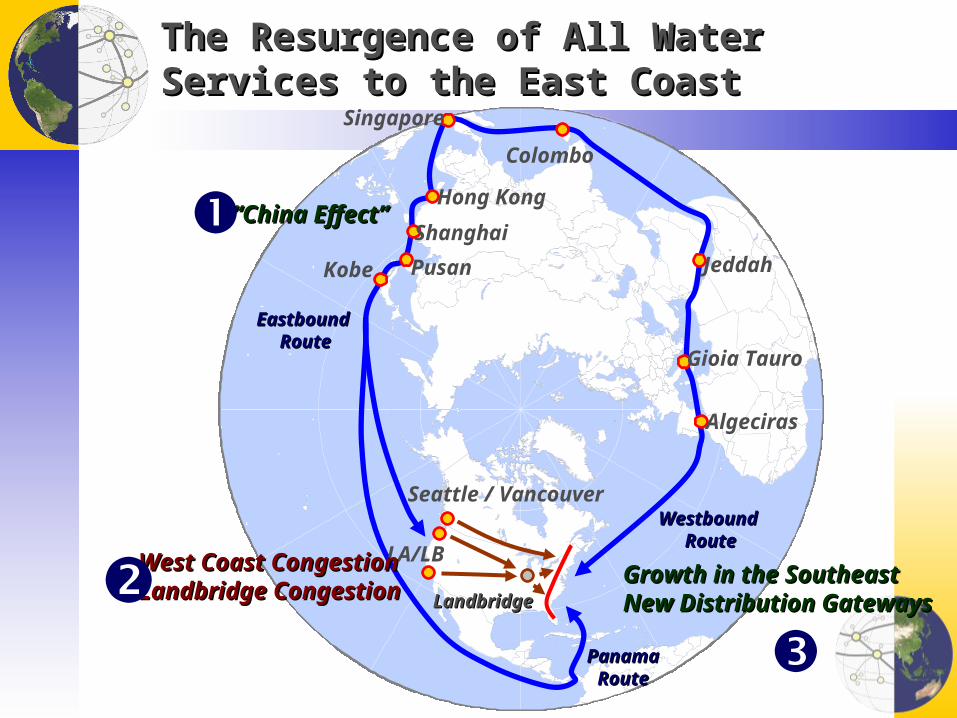
The Resurgence of All Water Services to the East The Resurgence of All Water Services to the East CoastCoast
LandbridgeLandbridge
Westbound Westbound RouteRoute
Eastbound Eastbound RouteRoute
Algeciras
Gioia Tauro
Jeddah
Colombo
Singapore
Hong Kong
Shanghai
PusanKobe
LA/LB
Seattle / Vancouver
PanamaPanamaRouteRoute
““China Effect”China Effect”
West Coast CongestionWest Coast CongestionLandbridge CongestionLandbridge Congestion
Growth in the SoutheastGrowth in the SoutheastNew Distribution GatewaysNew Distribution Gateways
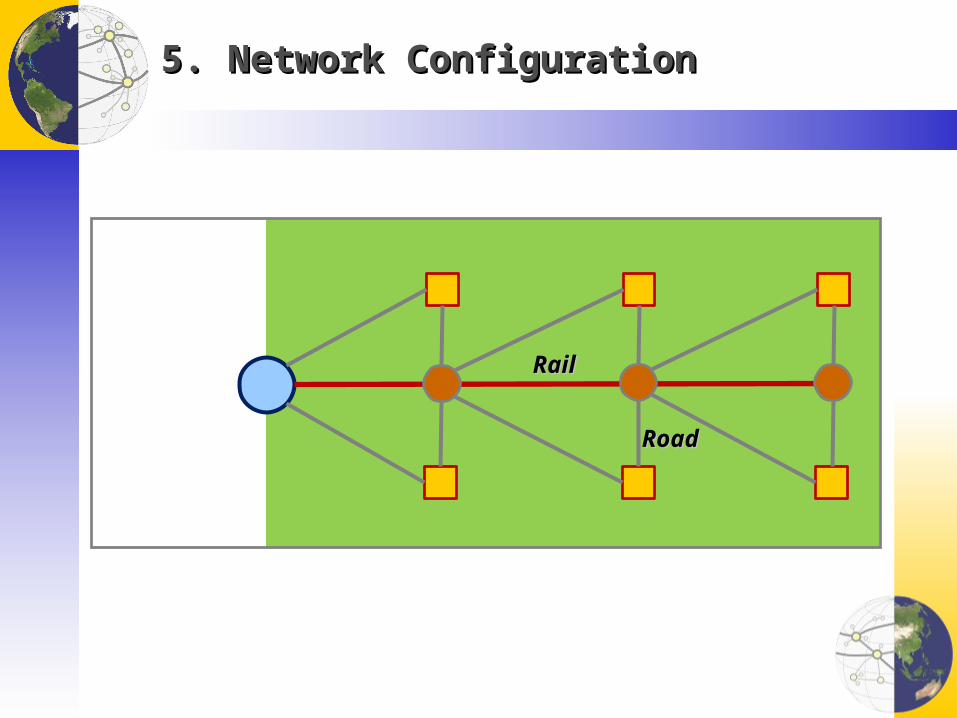
5. Network Configuration5. Network Configuration
RailRail
RoadRoad
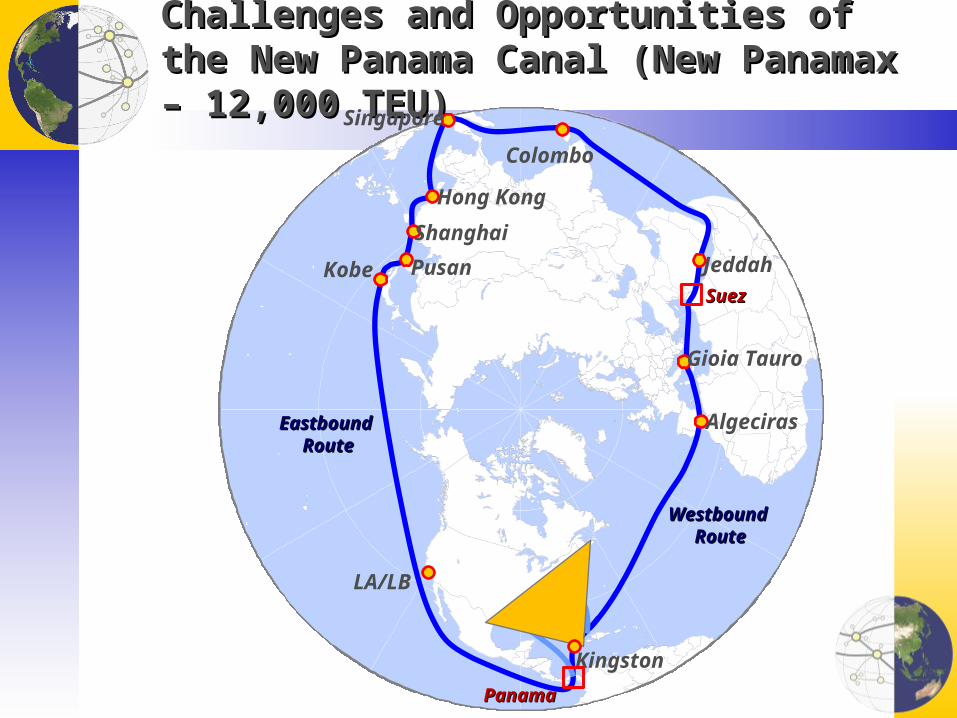
Challenges and Opportunities of the New Panama Challenges and Opportunities of the New Panama Canal (New Panamax – 12,000 TEU) Canal (New Panamax – 12,000 TEU)
Equa
tor
Westbound Westbound RouteRoute
Eastbound Eastbound RouteRoute
Algeciras
Gioia Tauro
Jeddah
Colombo
Singapore
Hong Kong
Shanghai
PusanKobe
LA/LB
Kingston
PanamaPanama
SuezSuez
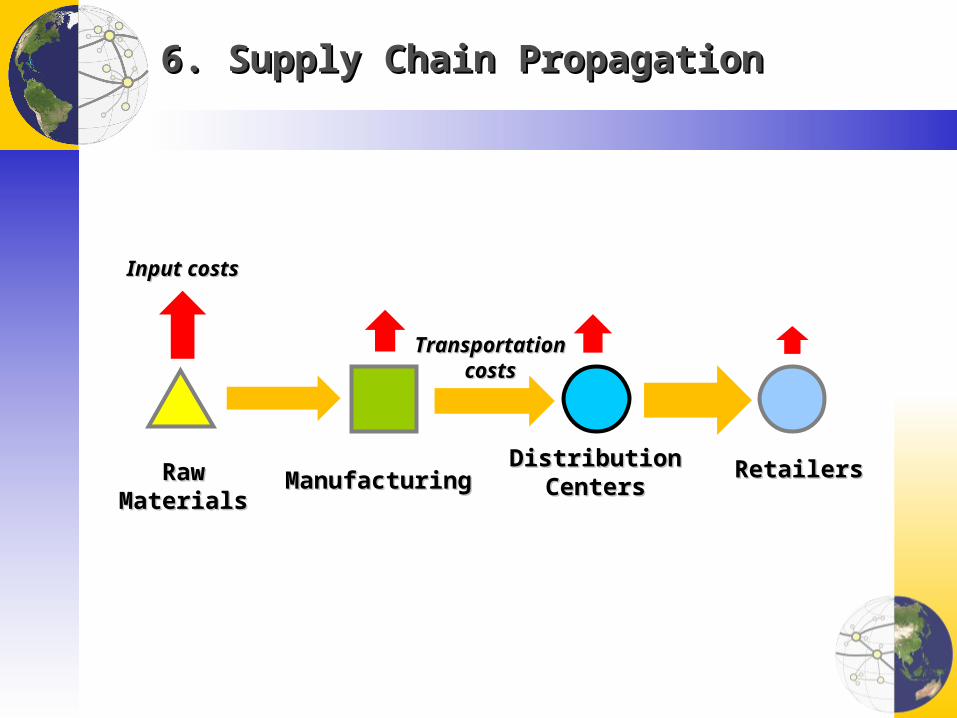
6. Supply Chain Propagation6. Supply Chain Propagation
RawRawMaterialsMaterials
DistributionDistributionCentersCenters
RetailersRetailersManufacturingManufacturing
Input costsInput costs
TransportationTransportationcostscosts

Swallowing the PillSwallowing the Pill
0
1
2
3
4
5
6
7
8
World Oil Expenditures as % of GPD, 1972-2008
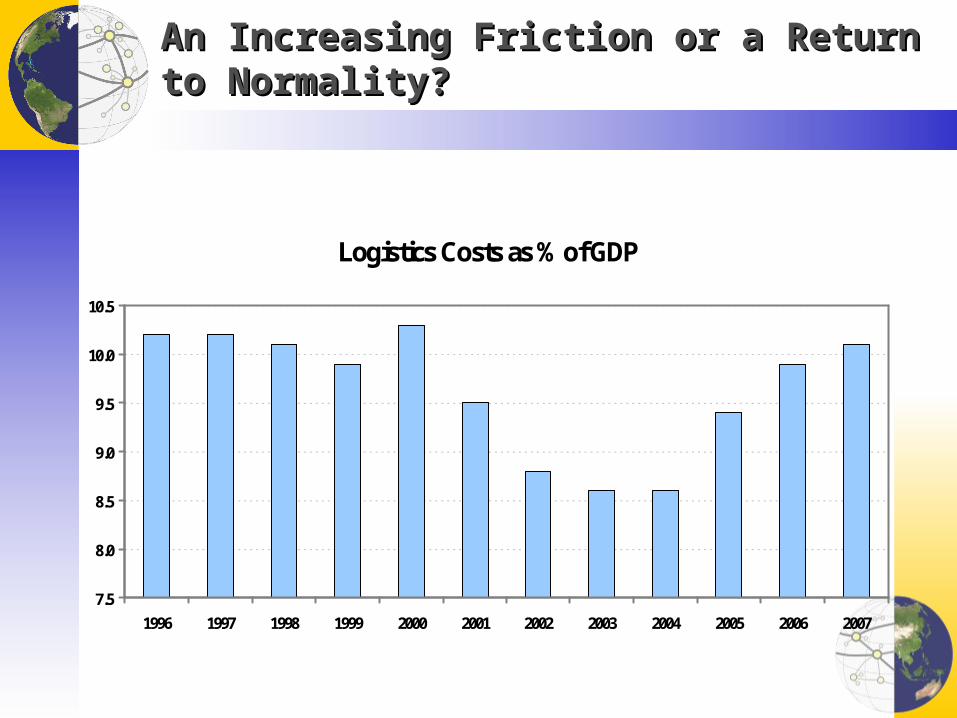
An Increasing Friction or a Return to Normality?An Increasing Friction or a Return to Normality?
Logistics Costs as % of GDP
7.5
8.0
8.5
9.0
9.5
10.0
10.5
1996 1997 1998 1999 2000 2001 2002 2003 2004 2005 2006 2007

Breaking the Comparative Advantages ThresholdBreaking the Comparative Advantages Threshold
Costs of Shipping a 40 foot Container From China to the American East Coast
$0
$2,000
$4,000
$6,000
$8,000
$10,000
$12,000
$14,000
$16,000
2000 ($30barrel)
2005 ($56barrel)
2008 ($135barrel)
($150 barrel) ($200 barrel)
From China
From Mexico
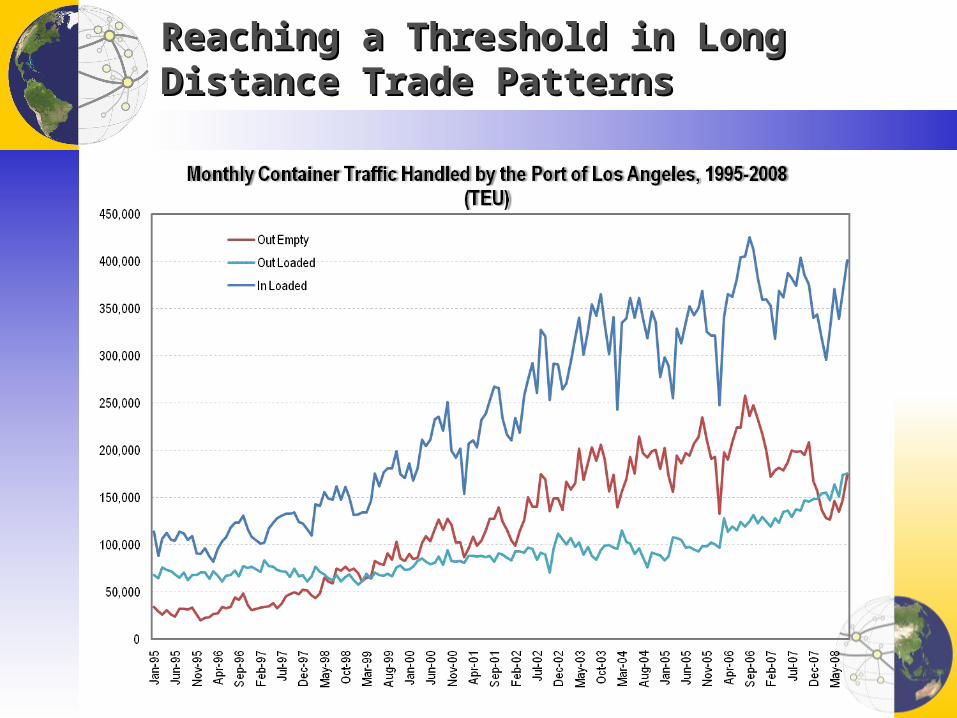
Reaching a Threshold in Long Distance Trade Reaching a Threshold in Long Distance Trade PatternsPatterns
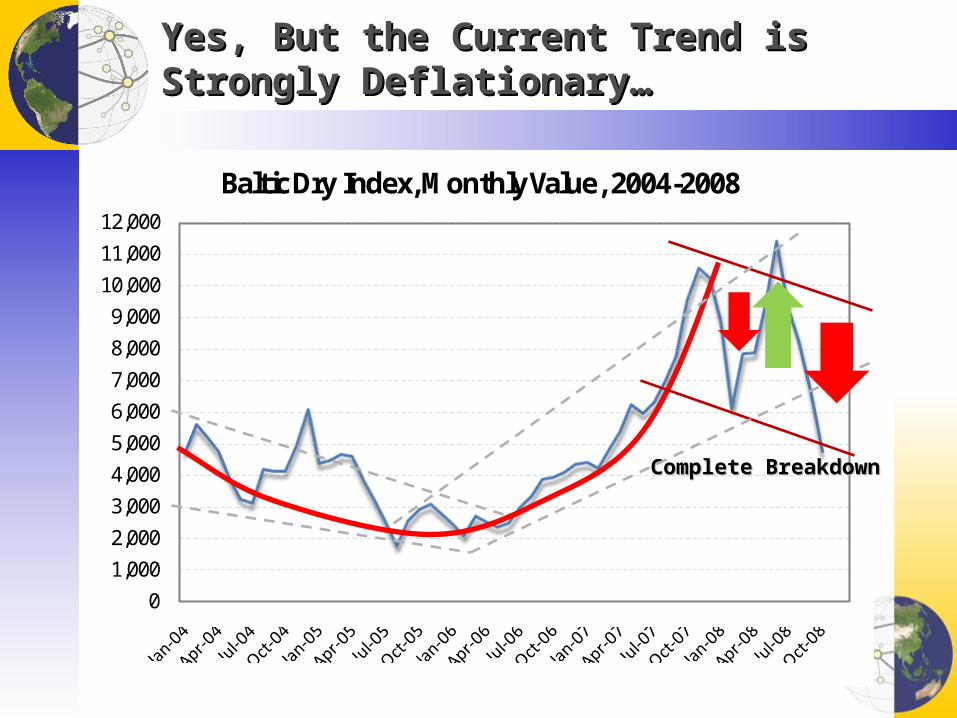
Yes, But the Current Trend is Strongly Deflationary…Yes, But the Current Trend is Strongly Deflationary…
01,0002,0003,0004,0005,0006,0007,0008,0009,00010,00011,00012,000
Baltic Dry Index, Monthly Value, 2004-2008
Complete BreakdownComplete Breakdown
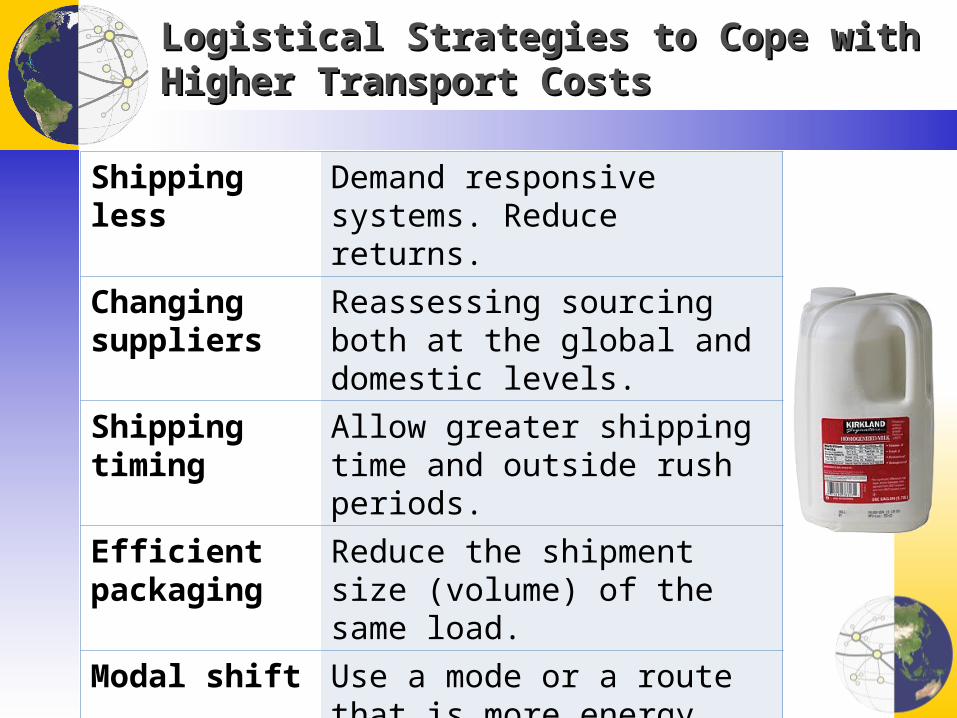
Logistical Strategies to Cope with Higher Transport Logistical Strategies to Cope with Higher Transport CostsCosts
Shipping less Demand responsive systems. Reduce returns.
Changing suppliers
Reassessing sourcing both at the global and domestic levels.
Shipping timing Allow greater shipping time and outside rush periods.
Efficient packaging
Reduce the shipment size (volume) of the same load.
Modal shift Use a mode or a route that is more energy efficient.
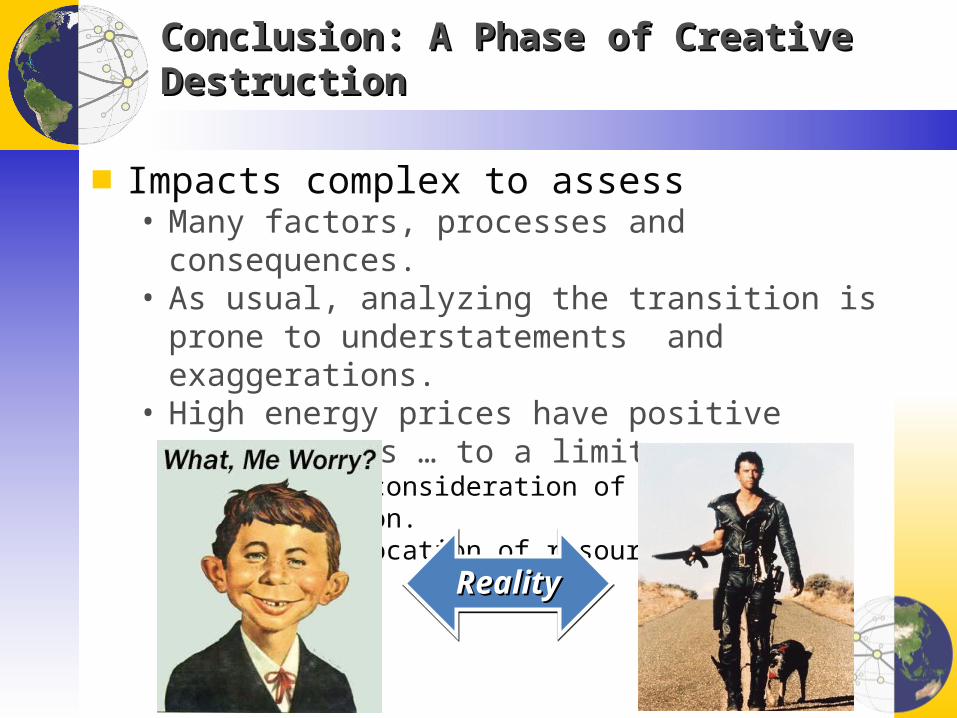
Conclusion: A Phase of Creative DestructionConclusion: A Phase of Creative Destruction
■ Impacts complex to assess• Many factors, processes and consequences.• As usual, analyzing the transition is prone to understatements
and exaggerations.• High energy prices have positive consequences … to a limit:
• Force a reconsideration of practices and conservation.• Better allocation of resources.
RealityRealityRealityReality