new gre score scale brochure by ets
TRANSCRIPT
Inside:• An in-depth look at the new
130 – 170 score scales
• Guidance on making the transition to the new score scales
• Helpful considerations when using GRE® scores
A helpful overview of what you need to know
The new Verbal Reasoning and Quantitative Reasoning score scales:
Betterby Design™
Using the new score scales:
Here’s a quick review of the new score scales:
• Verbal Reasoning scores are reported on a 130 – 170 score scale, in one-point increments (the prior 200 – 800 score scale was reported in 10-point increments).
• Quantitative Reasoning scores are reported on a 130 – 170 score scale, in one-point increments (the prior 200 – 800 score scale was reported in 10-point increments).
• Analytical Writing scores are reported on the 0 – 6 score scale, in half-point increments.
How the new score scales provide clearer differentiation
The 41-point score scales were selected to reflect the changes in content, test length and the new psychometric model of the GRE revised General Test.
In setting the new score scales, one goal was to have scores spread out across the entire range of possible scores.
For example, in the case of the Quantitative Reasoning scale, this will reduce the portion of test takers’ scores that are “bunched” at the upper end of the scale — as has been the case in the past — providing better differentiation between top-scoring applicants.
Why one-point increments lead to better decisions
Scores in the Verbal Reasoning and Quantitative Reasoning measures are reported in one-point increments, making it easier for you to distinguish performance differences between your applicants.
For example, a 500 and a 520 on the prior Verbal Reasoning score scale created the impression that there was a bigger difference in ability than there actually was. But by reporting in one-point increments, a 150 and 152, for example, demonstrate small differences.
Now small score differences are less likely to be interpreted as meaningful when comparing applicants — and larger score differences will stand out more clearly.
How they provide more simplicity in comparing applicants.
The GRE® revised General Test was introduced in August 2011, making the most trusted assessment of graduate-level skills even better — for you, and for your potential students.
With new question types and the new test-taker friendly design, the GRE revised General Test also features new score scales for the Verbal Reasoning and Quantitative Reasoning measures. These new score scales will help you make more meaningful comparisons between applicants — and even better admissions decisions for your program.
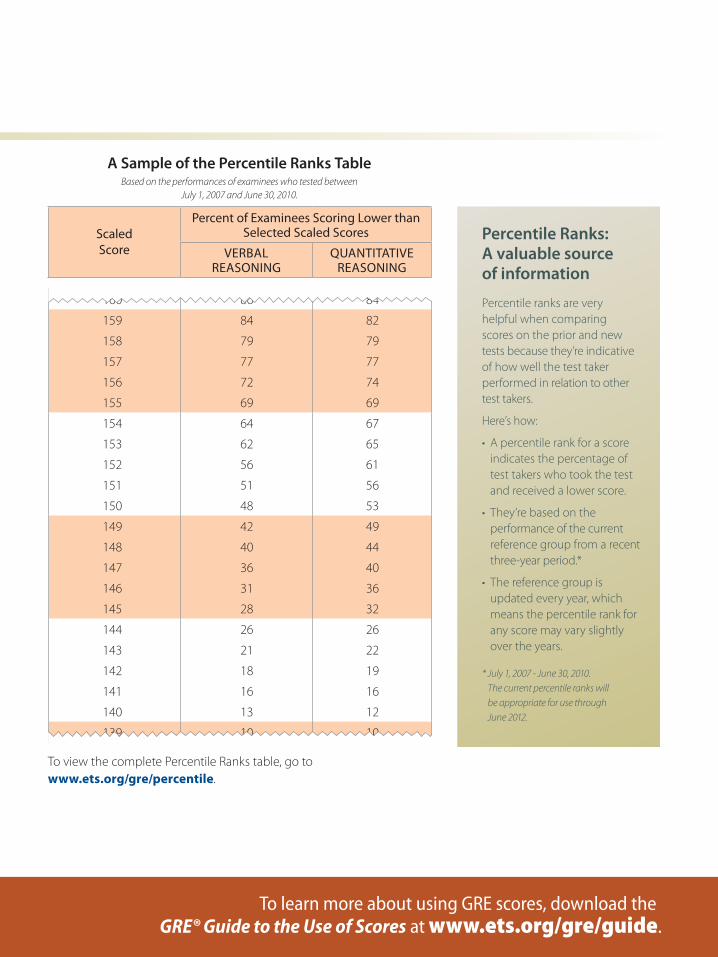
Scaled Score
Percent of Examinees Scoring Lower than Selected Scaled Scores
VErbAL rEASoninG
QuAntitAtiVE rEASoninG
160 86 84
159 84 82
158 79 79
157 77 77
156 72 74
155 69 69
154 64 67
153 62 65
152 56 61
151 51 56
150 48 53
149 42 49
148 40 44
147 36 40
146 31 36
145 28 32
144 26 26
143 21 22
142 18 19
141 16 16
140 13 12
139 10 10
Percentile Ranks: A valuable source of information
Percentile ranks are very helpful when comparing scores on the prior and new tests because they’re indicative of how well the test taker performed in relation to other test takers.
Here’s how:
• A percentile rank for a score indicates the percentage of test takers who took the test and received a lower score.
• They’re based on the performance of the current reference group from a recent three-year period.*
• The reference group is updated every year, which means the percentile rank for any score may vary slightly over the years.
* July 1, 2007 - June 30, 2010. The current percentile ranks will be appropriate for use through June 2012.
A Sample of the Percentile Ranks TableBased on the performances of examinees who tested between
July 1, 2007 and June 30, 2010.
To view the complete Percentile Ranks table, go to www.ets.org/gre/percentile.
To learn more about using GRE scores, download the GRE® Guide to the Use of Scores at www.ets.org/gre/guide.
Since GRE® scores are valid for five years, these concordance tables will help you understand the relationship between scores on the new 130 – 170 score scales and scores on the prior 200 – 800 score scales — making it easier for you to compare candidates.
Percentile ranks are also included on the concordance tables for your convenience. A sample portion of each concordance table is shown to the right.
For business schools: The easy-to-use GRE® Comparison Tool
The GRE Comparison Tool places GRE scores in the context of GMAT® Total scores, so business schools that are more familiar with GMAT scores can understand and appropriately interpret GRE scores.
• This online tool calculates a predicted GMAT Total score based on an applicant’s GRE Verbal Reasoning and Quantitative Reasoning scores.
• You can calculate an estimated GMAT Total score by entering GRE scores on either the 130 – 170 score scales or the 200 – 800 score scales.
Try it now at www.ets.org/gre/comparison.
To help you more easily transition to using scores on the new score scales, we’ve created two concordance tables — one for the Verbal Reasoning measure and one for the Quantitative Reasoning measure.
Comparing applicants:Using concordance tables to get familiar with the new score scales.
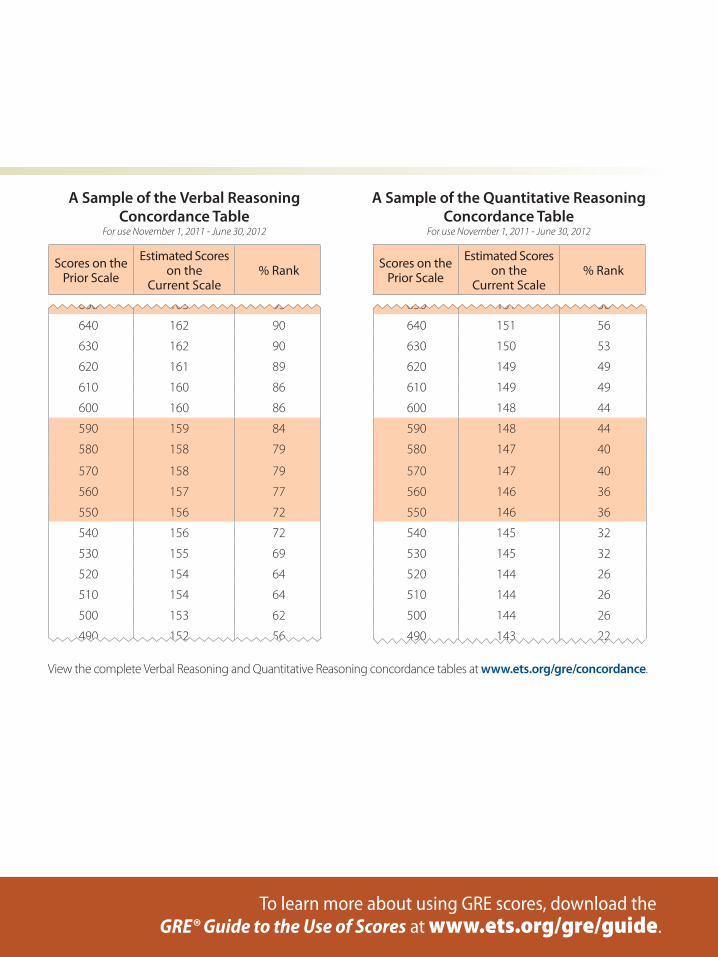
A Sample of the Verbal Reasoning Concordance Table
For use November 1, 2011 - June 30, 2012
A Sample of the Quantitative Reasoning Concordance Table
For use November 1, 2011 - June 30, 2012
650 163 93
640 162 90
630 162 90
620 161 89
610 160 86
600 160 86
590 159 84
580 158 79
570 158 79
560 157 77
550 156 72
540 156 72
530 155 69
520 154 64
510 154 64
500 153 62
490 152 56
650 151 56
640 151 56
630 150 53
620 149 49
610 149 49
600 148 44
590 148 44
580 147 40
570 147 40
560 146 36
550 146 36
540 145 32
530 145 32
520 144 26
510 144 26
500 144 26
490 143 22
Scores on the Prior Scale
Estimated Scores on the
Current Scale% rank Scores on the
Prior Scale
Estimated Scores on the
Current Scale% rank
View the complete Verbal Reasoning and Quantitative Reasoning concordance tables at www.ets.org/gre/concordance.
To learn more about using GRE scores, download the GRE® Guide to the Use of Scores at www.ets.org/gre/guide.
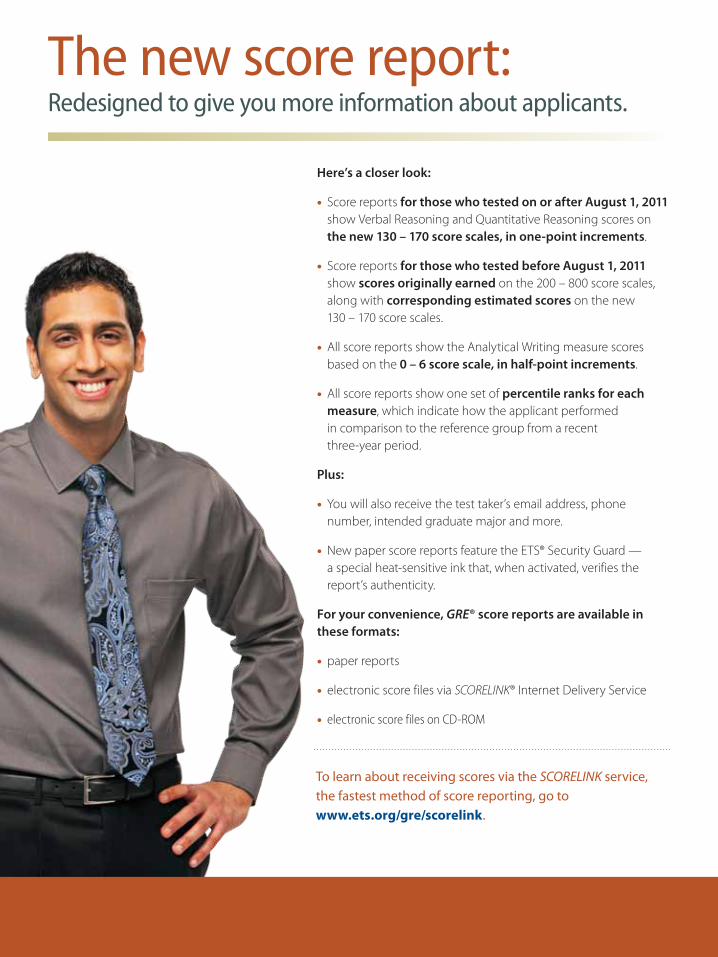
Here’s a closer look:
• Score reports for those who tested on or after August 1, 2011 show Verbal Reasoning and Quantitative Reasoning scores on the new 130 – 170 score scales, in one-point increments.
• Score reports for those who tested before August 1, 2011 show scores originally earned on the 200 – 800 score scales, along with corresponding estimated scores on the new 130 – 170 score scales.
• All score reports show the Analytical Writing measure scores based on the 0 – 6 score scale, in half-point increments.
• All score reports show one set of percentile ranks for each measure, which indicate how the applicant performed in comparison to the reference group from a recent three-year period.
Plus:
• You will also receive the test taker’s email address, phone number, intended graduate major and more.
• New paper score reports feature the ETS® Security Guard — a special heat-sensitive ink that, when activated, verifies the report’s authenticity.
For your convenience, GRE® score reports are available in these formats:
• paper reports
• electronic score files via SCORELINK® Internet Delivery Service
• electronic score files on CD-ROM
The new score report:Redesigned to give you more information about applicants.
to learn about receiving scores via the SCORELINK service, the fastest method of score reporting, go to www.ets.org/gre/scorelink.
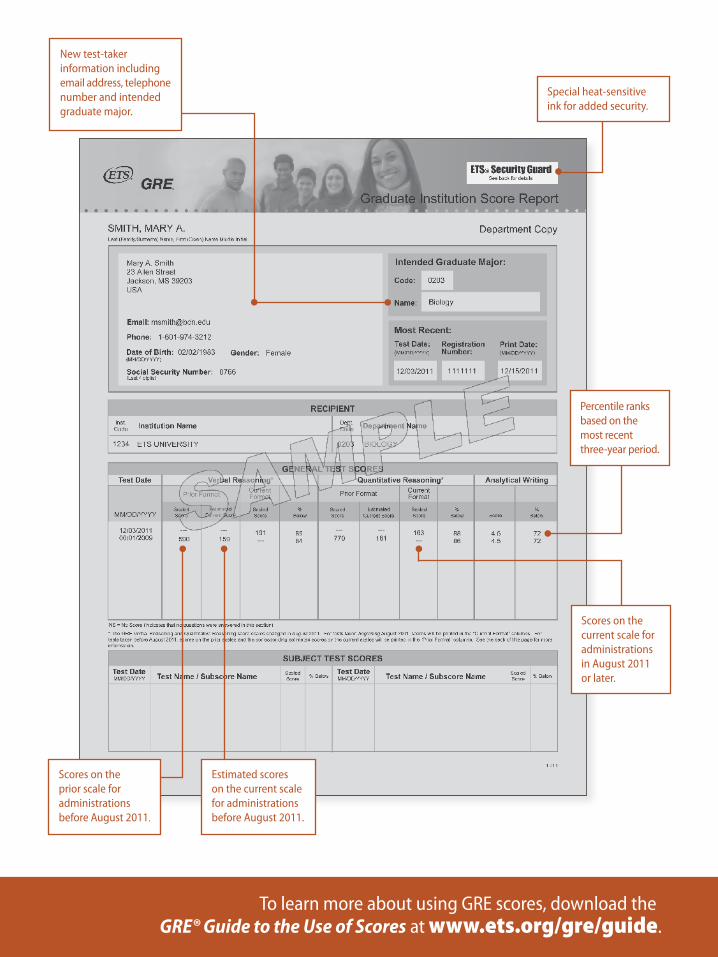
Estimated scores on the current scale for administrations before August 2011.
New test-taker information including email address, telephone number and intended graduate major.
Special heat-sensitive ink for added security.
Scores on the prior scale for administrations before August 2011.
Percentile ranks based on the most recent three-year period.
Scores on the current scale for administrations in August 2011 or later.
To learn more about using GRE scores, download the GRE® Guide to the Use of Scores at www.ets.org/gre/guide.
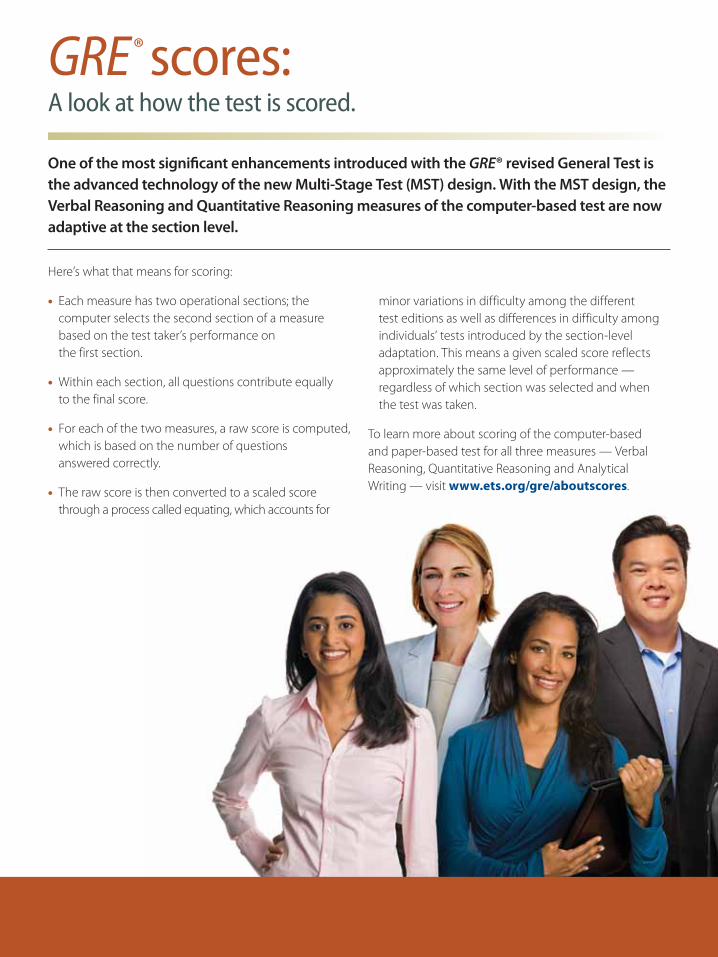
One of the most significant enhancements introduced with the GRE® revised General Test is the advanced technology of the new Multi-Stage Test (MST) design. With the MST design, the Verbal Reasoning and Quantitative Reasoning measures of the computer-based test are now adaptive at the section level.
Here’s what that means for scoring:
• Each measure has two operational sections; the computer selects the second section of a measure based on the test taker’s performance on the first section.
• Within each section, all questions contribute equally to the final score.
• For each of the two measures, a raw score is computed, which is based on the number of questions answered correctly.
• The raw score is then converted to a scaled score through a process called equating, which accounts for
GRE® scores:A look at how the test is scored.
minor variations in difficulty among the different test editions as well as differences in difficulty among individuals’ tests introduced by the section-level adaptation. This means a given scaled score reflects approximately the same level of performance — regardless of which section was selected and when the test was taken.
To learn more about scoring of the computer-based and paper-based test for all three measures — Verbal Reasoning, Quantitative Reasoning and Analytical Writing — visit www.ets.org/gre/aboutscores.

As graduate and business school programs around the world become familiar with the new score scales, it’s a good time to reflect on the benefits of using GRE scores.
For more than 60 years, the GRE General Test has been a valid predictor of success at the graduate level. With its introduction in August 2011, the GRE revised General Test continues to:
• assess the skills that graduate and business school programs value — verbal reasoning, quantitative reasoning, critical thinking and analytical writing.
• provide a common measure for comparing applicants with differing educational and cultural backgrounds.
• furnish independent information to supplement the evaluation of grades and recommendations.
• provide access to a broad, diverse pool of highly qualified applicants interested in pursuing an advanced degree.
A look at how scores are helpful in the admissions process.
To learn more about using GRE scores, download the GRE® Guide to the Use of Scores at www.ets.org/gre/guide.
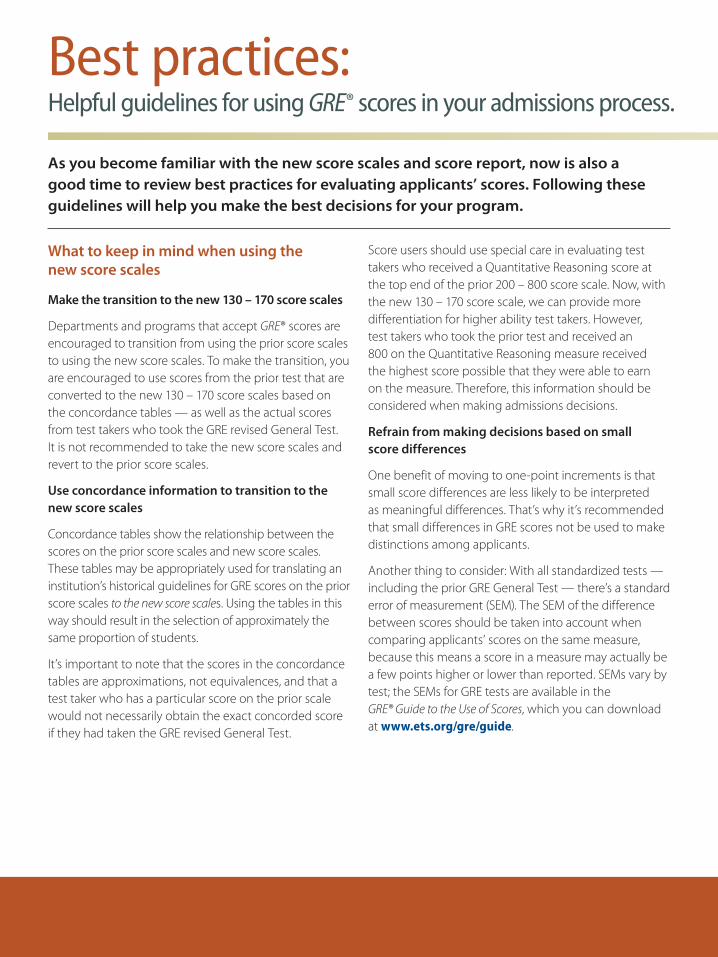
As you become familiar with the new score scales and score report, now is also a good time to review best practices for evaluating applicants’ scores. Following these guidelines will help you make the best decisions for your program.
What to keep in mind when using the new score scales
Make the transition to the new 130 – 170 score scales
Departments and programs that accept GRE® scores are encouraged to transition from using the prior score scales to using the new score scales. To make the transition, you are encouraged to use scores from the prior test that are converted to the new 130 – 170 score scales based on the concordance tables — as well as the actual scores from test takers who took the GRE revised General Test. It is not recommended to take the new score scales and revert to the prior score scales.
Use concordance information to transition to the new score scales
Concordance tables show the relationship between the scores on the prior score scales and new score scales. These tables may be appropriately used for translating an institution’s historical guidelines for GRE scores on the prior score scales to the new score scales. Using the tables in this way should result in the selection of approximately the same proportion of students.
It’s important to note that the scores in the concordance tables are approximations, not equivalences, and that a test taker who has a particular score on the prior scale would not necessarily obtain the exact concorded score if they had taken the GRE revised General Test.
Score users should use special care in evaluating test takers who received a Quantitative Reasoning score at the top end of the prior 200 – 800 score scale. Now, with the new 130 – 170 score scale, we can provide more differentiation for higher ability test takers. However, test takers who took the prior test and received an 800 on the Quantitative Reasoning measure received the highest score possible that they were able to earn on the measure. Therefore, this information should be considered when making admissions decisions.
Refrain from making decisions based on small score differences
One benefit of moving to one-point increments is that small score differences are less likely to be interpreted as meaningful differences. That’s why it’s recommended that small differences in GRE scores not be used to make distinctions among applicants.
Another thing to consider: With all standardized tests — including the prior GRE General Test — there’s a standard error of measurement (SEM). The SEM of the difference between scores should be taken into account when comparing applicants’ scores on the same measure, because this means a score in a measure may actually be a few points higher or lower than reported. SEMs vary by test; the SEMs for GRE tests are available in the GRE® Guide to the Use of Scores, which you can download at www.ets.org/gre/guide.
Best practices:Helpful guidelines for using GRE® scores in your admissions process.
Other resources to help you make the transition to the new score scalesVisit www.ets.org/gre/infocenter to:• Register for an upcoming webinar, featuring live Q&A session with GRE measurement experts.
• Sign up for our eUpdate newsletter to receive updates and stay informed about the GRE revised General Test.
Plus, go to www.ets.org/gre/scoring to:• Review concordance tables for the Verbal Reasoning and Quantitative Reasoning measures.
• See percentile ranks for scores in the Verbal Reasoning, Quantitative Reasoning and Analytical Writing measures.
To learn more about using GRE scores, download the GRE® Guide to the Use of Scores at www.ets.org/gre/guide.
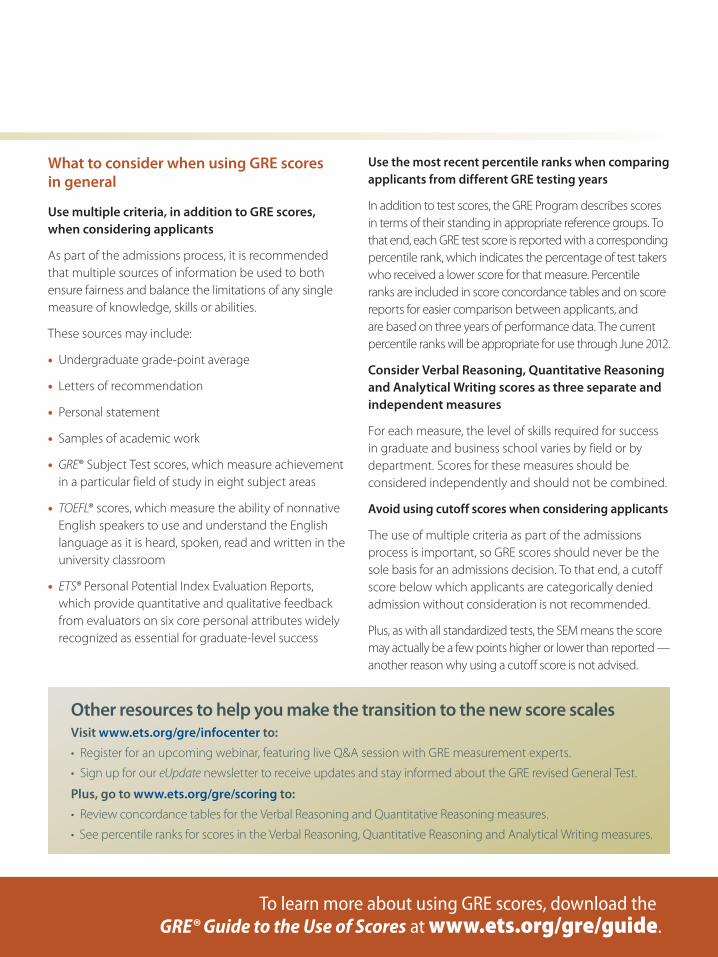
What to consider when using GRE scores in general
Use multiple criteria, in addition to GRE scores, when considering applicants
As part of the admissions process, it is recommended that multiple sources of information be used to both ensure fairness and balance the limitations of any single measure of knowledge, skills or abilities.
These sources may include:
• Undergraduate grade-point average
• Letters of recommendation
• Personal statement
• Samples of academic work
• GRE® Subject Test scores, which measure achievement in a particular field of study in eight subject areas
• TOEFL® scores, which measure the ability of nonnative English speakers to use and understand the English language as it is heard, spoken, read and written in the university classroom
• ETS® Personal Potential Index Evaluation Reports, which provide quantitative and qualitative feedback from evaluators on six core personal attributes widely recognized as essential for graduate-level success
Use the most recent percentile ranks when comparing applicants from different GRE testing years
In addition to test scores, the GRE Program describes scores in terms of their standing in appropriate reference groups. To that end, each GRE test score is reported with a corresponding percentile rank, which indicates the percentage of test takers who received a lower score for that measure. Percentile ranks are included in score concordance tables and on score reports for easier comparison between applicants, and are based on three years of performance data. The current percentile ranks will be appropriate for use through June 2012.
Consider Verbal Reasoning, Quantitative Reasoning and Analytical Writing scores as three separate and independent measures
For each measure, the level of skills required for success in graduate and business school varies by field or by department. Scores for these measures should be considered independently and should not be combined.
Avoid using cutoff scores when considering applicants
The use of multiple criteria as part of the admissions process is important, so GRE scores should never be the sole basis for an admissions decision. To that end, a cutoff score below which applicants are categorically denied admission without consideration is not recommended.
Plus, as with all standardized tests, the SEM means the score may actually be a few points higher or lower than reported — another reason why using a cutoff score is not advised.
Visit us online at www.ets.org/gre/institutionsEmail us at [email protected]
Call the GrE Helpline at +1-609-683-2002
At EtS, we advance quality and equity in education for people worldwide by creating assessments based on rigorous research. EtS serves individuals, educational institutions and government agencies by providing customized solutions for teacher certification, English language learning, and elementary, secondary and post-secondary education, as well as conducting education research, analysis and policy studies. Founded as a nonprofit in 1947, EtS develops, administers and scores more than 50 million tests annually — including the TOEFL® and TOEIC® tests, the GRE® tests and The Praxis Series™ assessments — in more than 180 countries, at over 9,000 locations worldwide. www.ets.org
Copyright © 2011 by Educational testing Service. All rights reserved. EtS, the EtS logo, LiStEninG. LEArninG. LEADinG., GrE, toEFL, toEiC and SCorELinK are registered trademarks of Educational testing Service (EtS). bEttEr bY DESiGn and
tHE PrAXiS SEriES are trademarks of EtS. GMAt is a registered trademark of the Graduate Management Admission Council. EtS10317b
Learn more about the GRE® revised General Test.
765815