new geomagnetic field models released · wavelength geomagnetic field originating from sources...
TRANSCRIPT

GEOSCIENCE AUSTRALIA
ISSUE 77 March 2005
17
New editions of the Australian Geomagnetic Reference Field (AGRF) model and the International Geomagnetic Reference Field (IGRF-10) are now available from Geoscience Australia.
Both models have a wide range of applications in the scientific, industrial and engineering sectors and the general community. Areas of specialist application include mineral exploration, surveying, mapping, research into the global magnetic field and its secular change, and studies of the Earth’s deep interior, crust, ionosphere and magnetosphere. The AGRF model is also a particularly useful tool for anyone using a compass or GPS technology for navigation in and around Australia - including bushwalkers, orienteers, mariners and pilots - and for applications such as aligning satellite dishes or telescopes.
The Australian Geomagnetic Reference Field ModelThe AGRF is a mathematical model of the geomagnetic field of Australia, nearby offshore areas, Papua New Guinea and parts of eastern Indonesia. The first model was derived for 1 January 1985 (epoch 1985.0). It has been improved and updated every five years to ensure that slow but unpredictable changes in the geomagnetic field, which originate from within the Earth, are tracked as accurately as possible.
The 2005 revision - the fifth in the series - is a mathematical representation of the undisturbed geomagnetic main field at epoch 2005.0 and its predicted annual change over 2005-2010. The model describes the field originating from internal sources using spherical cap harmonics. The main field is modelled to a nominal minimum wavelength of 1500 km and the annual change to 2000 km.
Extensive vector geomagnetic survey data sets were used to derive the main field model, including magnetic data from the Danish Oersted satellite and the US Magsat satellite, high elevation airborne data, and Australia-wide ground based vector survey data. The main field data sets were updated to epoch 2005.0 using a secular variation model of the Australian region derived from geomagnetic observatory and repeat station data collected from Australia and neighbouring countries over the last 45 years.
Figure 1. Contours of the magnetic declination in degrees (red) and annual change of declination (blue) in minutes-of-arc per year from the AGRF 2005 model for epoch 2005.0. The circular boundary shows the limit of the AGRF model, contours outside the boundary are from the International Geomagnetic Reference Field Model (IGRF-10 at 2005.0)
▼
NEW Geomagnetic Field Models RELEASED
GEOSCIENCE AUSTRALIA
ISSUE 77 March 2005
18
The secular variation model in AGRF 2005 is based on a linear extrapolation of the most recently available geomagnetic observatory and repeat station data from Australia and neighbouring countries. Based on knowledge of the past behaviour of the magnetic field the secular variation model should be suitable out to epoch 2010.
The 2005 revision of the AGRF model is built upon the recently released 10th generation of the International Geomagnetic Reference Field, which is a global spherical harmonic model of the geomagnetic field. An on-line calculator for the AGRF is available on the GA web site. Software is also available from GA to evaluate the AGRF at a single point or a grid of points.
The extensive regional data set used in developing the AGRF model makes it the best available model for the Australian regional magnetic field for the interval 2005-2010.
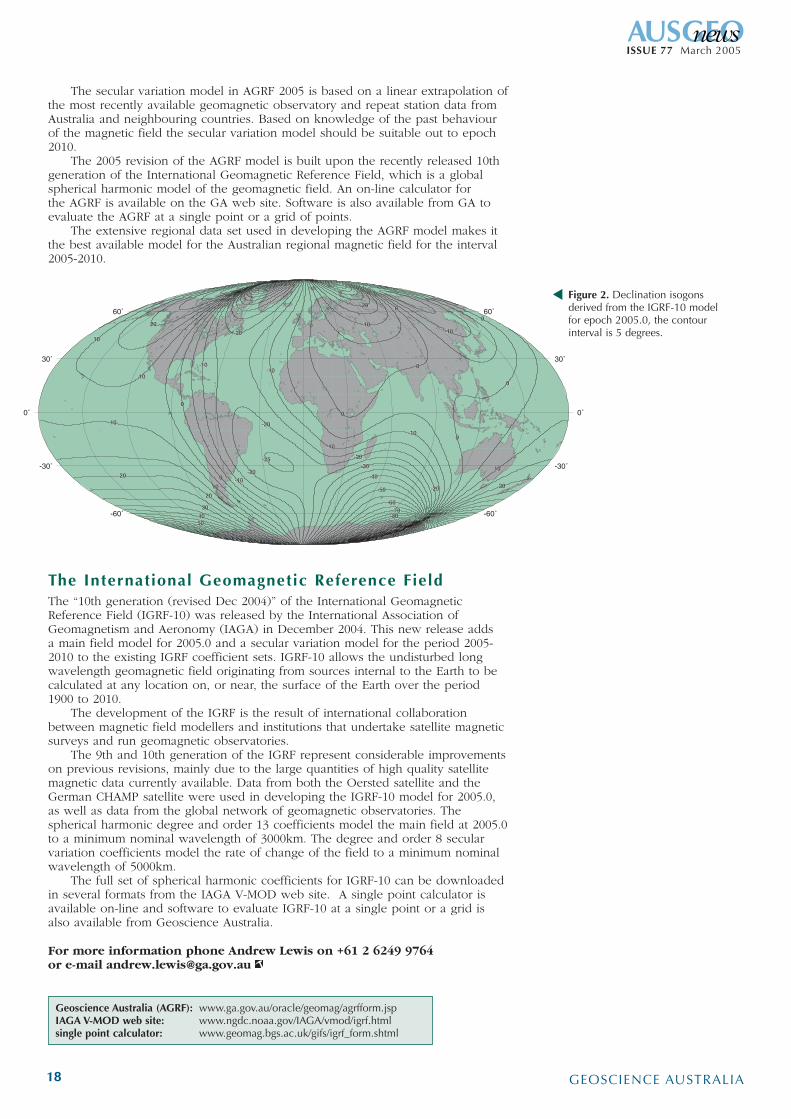
The International Geomagnetic Reference FieldThe “10th generation (revised Dec 2004)” of the International Geomagnetic Reference Field (IGRF-10) was released by the International Association of Geomagnetism and Aeronomy (IAGA) in December 2004. This new release adds a main field model for 2005.0 and a secular variation model for the period 2005-2010 to the existing IGRF coefficient sets. IGRF-10 allows the undisturbed long wavelength geomagnetic field originating from sources internal to the Earth to be calculated at any location on, or near, the surface of the Earth over the period 1900 to 2010.
The development of the IGRF is the result of international collaboration between magnetic field modellers and institutions that undertake satellite magnetic surveys and run geomagnetic observatories.
The 9th and 10th generation of the IGRF represent considerable improvements on previous revisions, mainly due to the large quantities of high quality satellite magnetic data currently available. Data from both the Oersted satellite and the German CHAMP satellite were used in developing the IGRF-10 model for 2005.0, as well as data from the global network of geomagnetic observatories. The spherical harmonic degree and order 13 coefficients model the main field at 2005.0 to a minimum nominal wavelength of 3000km. The degree and order 8 secular variation coefficients model the rate of change of the field to a minimum nominal wavelength of 5000km.
The full set of spherical harmonic coefficients for IGRF-10 can be downloaded in several formats from the IAGA V-MOD web site. A single point calculator is available on-line and software to evaluate IGRF-10 at a single point or a grid is also available from Geoscience Australia.
For more information phone Andrew Lewis on +61 2 6249 9764 or e-mail [email protected]
Geoscience Australia (AGRF): www.ga.gov.au/oracle/geomag/agrfform.jspIAGA V-MOD web site: www.ngdc.noaa.gov/IAGA/vmod/igrf.htmlsingle point calculator: www.geomag.bgs.ac.uk/gifs/igrf_form.shtml
Figure 2. Declination isogons derived from the IGRF-10 model for epoch 2005.0, the contour interval is 5 degrees.
▼
GEOSCIENCE AUSTRALIA
ISSUE 77 March 2005
19
Geoscience Australia’s remote sensing unit, ACRES, has established a National Remote Sensing Technical Reference Group to advise on strategic positioning and on technical decisions about the provision of ‘public good’ satellite imagery.
The group held its first meeting in December 2004. Discussion focused on satellite data usage and access, agreement on the group’s terms of reference and updating ACRES activities. The group also examined technical contingencies and strategies. Major discussion points included the following:• ACRES requires input for its development of a LANDSAT contingency
plan. LANDSAT is still the preferred data source in Australia for a wide range of environmental, agricultural, land-cover and vegetation monitoring and mining applications, at regional and national scales. The contingency plan is in response to concerns about LANDSAT data continuity, an aging LANDSAT 5 satellite, and the scan-line corrector anomaly on LANDSAT 7.
• National and international remote sensing activities by bodies such as the Australian Government Space Forum, the Committee on Earth Observation Satellites, the Group on Earth Observations and the Global Monitoring of Environmental Security group, and the series of Earth Observation Summits.
• Satellite data providers continue to experience increased demands from users, with satellite data being used in a new and broader range of applications. The shift from ‘technology push’ to ‘user pull’ of satellite data heightens the need for improved support and reliable data delivery, particularly for time-critical applications.
• The need for integrated products that provide solutions and decision-support systems, rather than just data, will continue to be a challenge for satellite data providers.
• Continual supply of data into forecast models and the increase in near-real time applications were identified as growth areas for satellite data usage.
• The critical importance of data archives such as the Advanced Very High Resolution Radiometer (AVHRR) and the LANDSAT archives is now being realised in applications such as national drought monitoring, land-cover change assessments and many other applications.
• An extension of X-band network stations to support the growth in near-real time applications and data access, especially in meteorology, means that X-band stations will be needed in Darwin, Casey (Antarctica) and Crib Point (Victoria).
Current members of the National Remote Sensing Technical Reference Group include Mr Max Bye, Mr Tim Danaher, Dr David Griersmith, Dr Alex Held, Dr Adam Lewis, Ms Elizabeth McDonald, Ms Alla Metlenko, Dr Shanti Reddy, Professor John Richards, Dr Kim Ritman and Dr Richard Smith. The group will reconvene in April 2005.
For further information about the group’s activities, contact Adam Lewis on +61 2 6249 9353 or e-mail [email protected]
technical reference groupRemote sensing unit sets up
technical reference group
ISSUE 77 March 2005
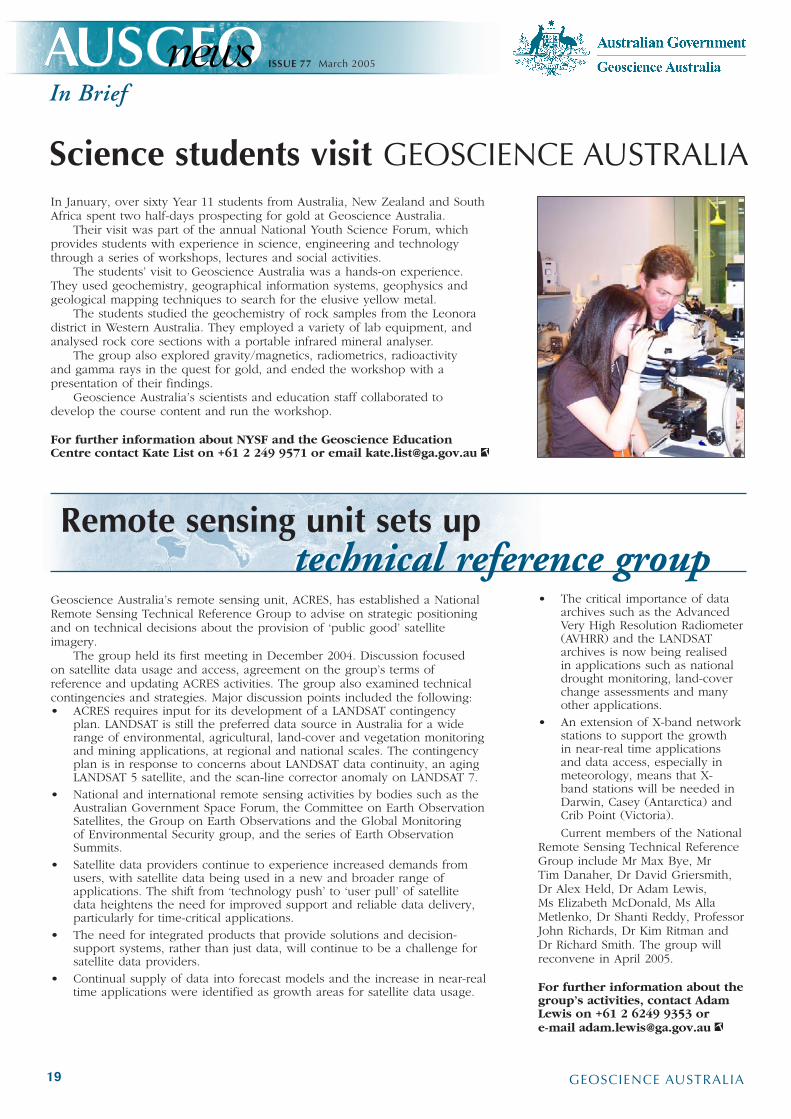
In January, over sixty Year 11 students from Australia, New Zealand and South Africa spent two half-days prospecting for gold at Geoscience Australia.
Their visit was part of the annual National Youth Science Forum, which provides students with experience in science, engineering and technology through a series of workshops, lectures and social activities.
The students’ visit to Geoscience Australia was a hands-on experience. They used geochemistry, geographical information systems, geophysics and geological mapping techniques to search for the elusive yellow metal.
The students studied the geochemistry of rock samples from the Leonora district in Western Australia. They employed a variety of lab equipment, and analysed rock core sections with a portable infrared mineral analyser.
The group also explored gravity/magnetics, radiometrics, radioactivity and gamma rays in the quest for gold, and ended the workshop with a presentation of their findings.
Geoscience Australia’s scientists and education staff collaborated to develop the course content and run the workshop.
For further information about NYSF and the Geoscience Education Centre contact Kate List on +61 2 249 9571 or email [email protected]
Science students visit GEOSCIENCE AUSTRALIA

GEOSCIENCE AUSTRALIA
ISSUE 77 March 2005
20
The new 1:100 000 scale topographic map of the ACT region covers a larger area than previous editions. The new map includes a Landsat image showing the state of vegetation after the January 2003 bushfires that claimed four lives and destroyed more than 500 houses in Canberra.
Geoscience Australia worked closely with the ACT Emergency Services Authority to produce the map and a Geographical Information System data product that will be a valuable resource for the region’s emergency management workers and community.
The map is part of a cooperative pilot program being undertaken by Geoscience Australia in partnership with state and territory emergency management and mapping agencies. The program addresses issues raised by the House of Representatives Select Committee Inquiry into the Operational Response to the January 2003 Bushfires in the ACT and the Council of Australian Governments’ (COAG) National Inquiry on Bushfire Management, Prevention and Mitigation in Australia.
During a recent visit to Geoscience Australia’s headquarters, Warren Entsch, Parliamentary Secretary to the Minister for Industry, Tourism and Resources, thanked the staff involved in production of the map and database. He pointed out the importance of accurate maps showing critical infrastructure such as roads, bridges, buildings and dams, for emergency management.
Mr Entsch said the project—a significant undertaking by Geoscience Australia on behalf of the Australian Government— had produced a map that gave emergency service workers this critical information and also provided a good overview of the ‘bush capital’.
Gary Nairn, Parliamentary Secretary to the Prime Minister and chairman of the House of Representatives Select Committee, commended Geoscience Australia for its prompt response to the committee’s recommendations.
Geoscience Australia initiated the $1 million pilot program in early 2004, in collaboration with state mapping agencies and the Emergency Management Spatial Information Network Australia. The pilot program was set up to improve national cooperation and achieve best practice in mapping and maintaining fundamental information needed for emergency management and other purposes. The findings of the pilot are being integrated into the 2005–06 program.
The COAG inquiry also identified the need for topographic data for operational use at 1:25 000 and 1:50 000 scales. The cooperative program with the states is already allowing Geoscience Australia to develop single ‘point of truth’ GIS databases that can be used to derive maps at a range of scales.
Left to right: Senator Gary Humphries, Senator for the ACT; the Hon. Warren Entsch MP, Parliamentary Secretary to the Minister for Industry, Tourism and Resources; Dr Trevor Powell, Chief, Spatial Information Sciences; The Hon. Gary Nairn MP, Parliamentary Secretary to the Prime Minister; and Mr Peter Holland, General Manager, National Mapping Division, following the launch of the new ACT Region map at Geoscience Australia on 15 February 2005.
ACT Region map updated after firestorm
▼
GEOSCIENCE AUSTRALIA
ISSUE 77 March 2005
21
LATEST ASSESSMENT IDENTIFIES NEED FOR new mineral resources
Australia’s mineral and solid fuel resources remain reasonably healthy in the short to medium term, according to Australia’s Identified Mineral Resources 2004, released online by Geoscience Australia in late 2004. However, resource trends for some major commodities have plateaued, and our share of global exploration spending continues to fall. In the longer term, the future of the Australian minerals industry depends on more exploration and new discoveries.
Australia’s Identified Mineral Resources, published annually by Geoscience Australia, gives governments long-term estimates of ore reserves. The publication also compares our figures with industry estimates, which are generally based on shorter term planning and commercial considerations.
Australia’s Identified Mineral Resources 2004 is available on-line. The commodity sections are also accessible via Australian Mines Atlas.
For more information, phone Bill McKay on +61 2 6249 9003 or e-mail [email protected]
Geoscience Australia on-line: www.ga.gov.au/image_cache/GA5476.pdf.Australian Mines Atlas: www.australianminesatlas.gov.au
Geoscience Australia’s Australian Centre for Remote Sensing (ACRES) has extended the range of satellite image product options available to clients, following an agreement to distribute ASTER satellite data.
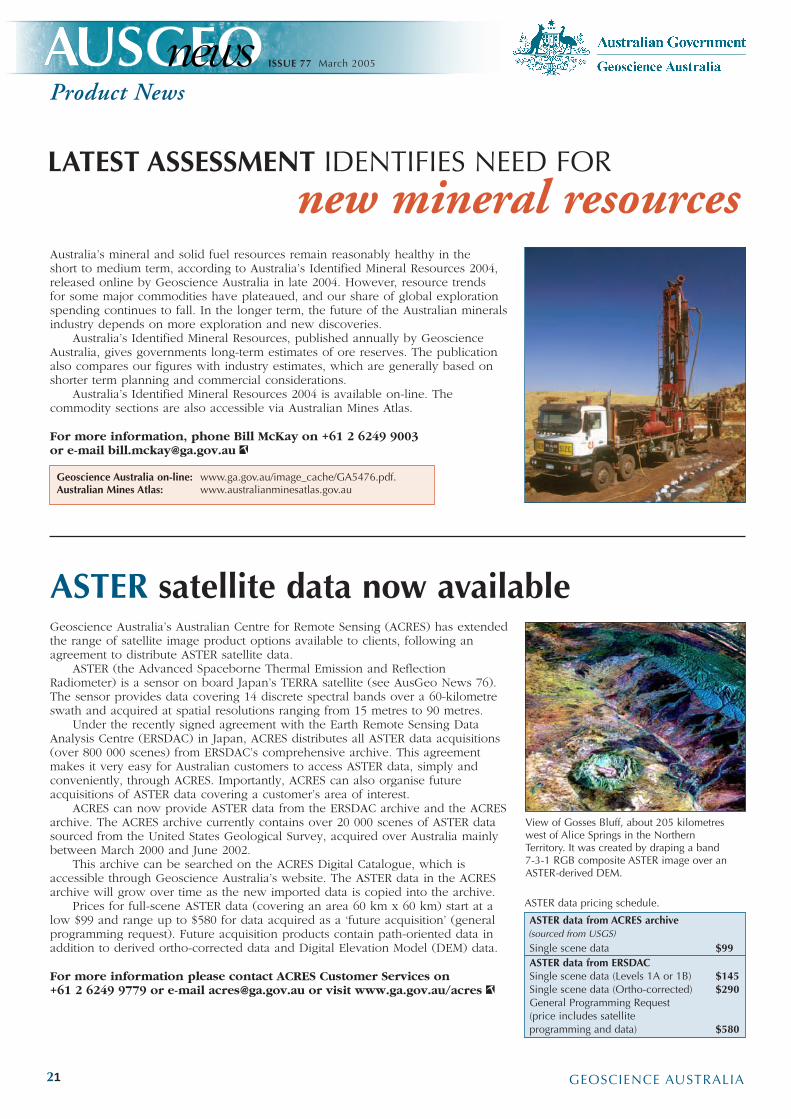
ASTER (the Advanced Spaceborne Thermal Emission and Reflection Radiometer) is a sensor on board Japan’s TERRA satellite (see AusGeo News 76). The sensor provides data covering 14 discrete spectral bands over a 60-kilometre swath and acquired at spatial resolutions ranging from 15 metres to 90 metres.
Under the recently signed agreement with the Earth Remote Sensing Data Analysis Centre (ERSDAC) in Japan, ACRES distributes all ASTER data acquisitions (over 800 000 scenes) from ERSDAC’s comprehensive archive. This agreement makes it very easy for Australian customers to access ASTER data, simply and conveniently, through ACRES. Importantly, ACRES can also organise future acquisitions of ASTER data covering a customer’s area of interest.
ACRES can now provide ASTER data from the ERSDAC archive and the ACRES archive. The ACRES archive currently contains over 20 000 scenes of ASTER data sourced from the United States Geological Survey, acquired over Australia mainly between March 2000 and June 2002.
This archive can be searched on the ACRES Digital Catalogue, which is accessible through Geoscience Australia’s website. The ASTER data in the ACRES archive will grow over time as the new imported data is copied into the archive.
Prices for full-scene ASTER data (covering an area 60 km x 60 km) start at a low $99 and range up to $580 for data acquired as a ‘future acquisition’ (general programming request). Future acquisition products contain path-oriented data in addition to derived ortho-corrected data and Digital Elevation Model (DEM) data.
For more information please contact ACRES Customer Services on +61 2 6249 9779 or e-mail [email protected] or visit www.ga.gov.au/acres
View of Gosses Bluff, about 205 kilometres west of Alice Springs in the Northern Territory. It was created by draping a band 7-3-1 RGB composite ASTER image over an ASTER-derived DEM.
ASTER satellite data now available
ASTER data from ACRES archive
Single scene data $99ASTER data from ERSDAC Single scene data (Levels 1A or 1B) $145 Single scene data (Ortho-corrected) $290General Programming Request (price includes satellite programming and data) $580
ASTER data pricing schedule.
ISSUE 77 March 2005
GEOSCIENCE AUSTRALIA
ISSUE 77 March 2005
22
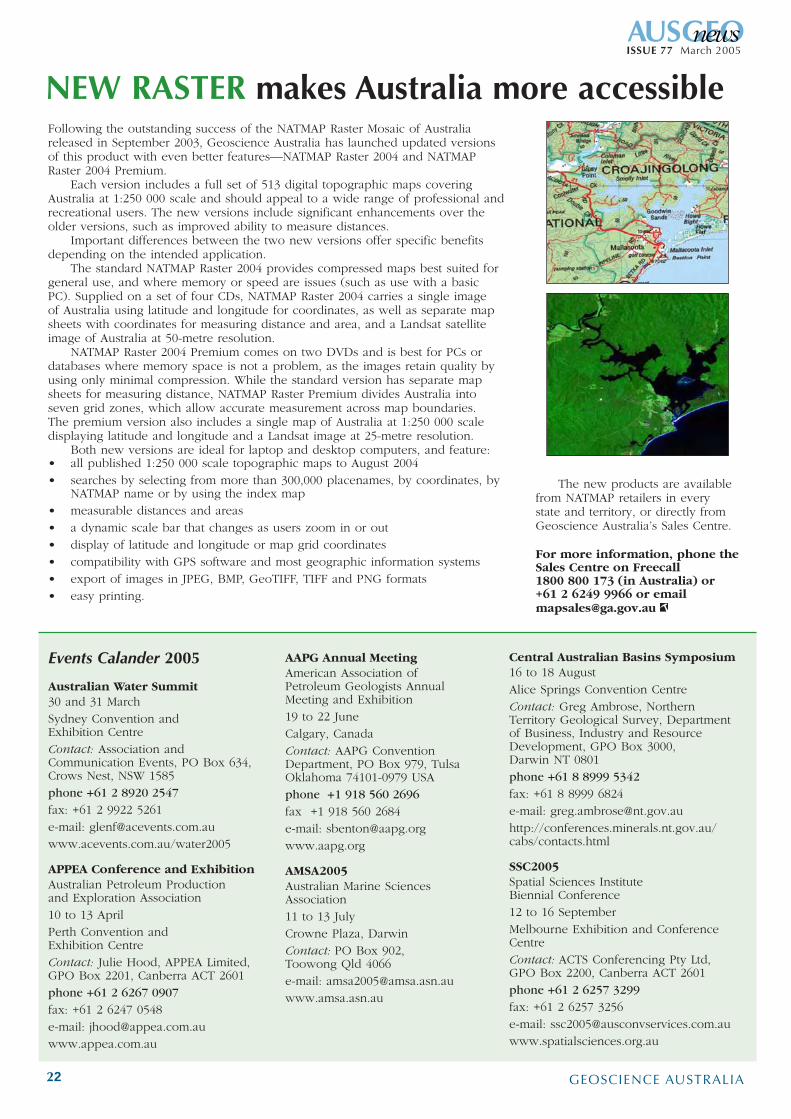
Following the outstanding success of the NATMAP Raster Mosaic of Australia released in September 2003, Geoscience Australia has launched updated versions of this product with even better features—NATMAP Raster 2004 and NATMAP Raster 2004 Premium.
Each version includes a full set of 513 digital topographic maps covering Australia at 1:250 000 scale and should appeal to a wide range of professional and recreational users. The new versions include significant enhancements over the older versions, such as improved ability to measure distances.
Important differences between the two new versions offer specific benefits depending on the intended application.
The standard NATMAP Raster 2004 provides compressed maps best suited for general use, and where memory or speed are issues (such as use with a basic PC). Supplied on a set of four CDs, NATMAP Raster 2004 carries a single image of Australia using latitude and longitude for coordinates, as well as separate map sheets with coordinates for measuring distance and area, and a Landsat satellite image of Australia at 50-metre resolution.
NATMAP Raster 2004 Premium comes on two DVDs and is best for PCs or databases where memory space is not a problem, as the images retain quality by using only minimal compression. While the standard version has separate map sheets for measuring distance, NATMAP Raster Premium divides Australia into seven grid zones, which allow accurate measurement across map boundaries. The premium version also includes a single map of Australia at 1:250 000 scale displaying latitude and longitude and a Landsat image at 25-metre resolution.
Both new versions are ideal for laptop and desktop computers, and feature:• all published 1:250 000 scale topographic maps to August 2004• searches by selecting from more than 300,000 placenames, by coordinates, by
NATMAP name or by using the index map• measurable distances and areas• a dynamic scale bar that changes as users zoom in or out• display of latitude and longitude or map grid coordinates• compatibility with GPS software and most geographic information systems• export of images in JPEG, BMP, GeoTIFF, TIFF and PNG formats• easy printing.
NEW RASTER makes Australia more accessible
The new products are available from NATMAP retailers in every state and territory, or directly from Geoscience Australia’s Sales Centre.
For more information, phone the Sales Centre on Freecall 1800 800 173 (in Australia) or +61 2 6249 9966 or email [email protected]
Events Calander 2005
Australian Water Summit 30 and 31 March Sydney Convention and Exhibition Centre Contact: Association and Communication Events, PO Box 634, Crows Nest, NSW 1585phone +61 2 8920 2547
fax: +61 2 9922 5261e-mail: [email protected]/water2005
APPEA Conference and Exhibition Australian Petroleum Production and Exploration Association 10 to 13 April Perth Convention and Exhibition Centre Contact: Julie Hood, APPEA Limited, GPO Box 2201, Canberra ACT 2601phone +61 2 6267 0907
fax: +61 2 6247 0548e-mail: [email protected]
AAPG Annual Meeting American Association of Petroleum Geologists Annual Meeting and Exhibition19 to 22 JuneCalgary, CanadaContact: AAPG Convention Department, PO Box 979, Tulsa Oklahoma 74101-0979 USAphone +1 918 560 2696
fax +1 918 560 2684e-mail: [email protected]
AMSA2005 Australian Marine Sciences Association11 to 13 JulyCrowne Plaza, DarwinContact: PO Box 902, Toowong Qld 4066e-mail: [email protected]
Central Australian Basins Symposium 16 to 18 August Alice Springs Convention Centre Contact: Greg Ambrose, Northern Territory Geological Survey, Department of Business, Industry and Resource Development, GPO Box 3000, Darwin NT 0801phone +61 8 8999 5342
fax: +61 8 8999 6824e-mail: [email protected]://conferences.minerals.nt.gov.au/cabs/contacts.html
SSC2005 Spatial Sciences Institute Biennial Conference12 to 16 September Melbourne Exhibition and Conference Centre Contact: ACTS Conferencing Pty Ltd, GPO Box 2200, Canberra ACT 2601phone +61 2 6257 3299
fax: +61 2 6257 3256e-mail: [email protected]