new firm size jolts data provide insight to the u.s. … · new firm size jolts data provide...
TRANSCRIPT

New Firm Size JOLTS Data Provide Insight to the U.S. Labor Market
Charlotte Oslund, BLS/JOLTS
Federal Committee on Statistical Methodology
Research Conference Washington, DC
November 4, 2013

BLS Labor Market Data
2
CES Employment:
matched labor supply/demand
JOLTS Job Openings:
excess demand for labor
CPS Unemployment:
excess supply of labor

JOLTS Survey Scope
~16,400 establishments sampled from:
Nonagricultural industries
All 50 states and the District of Columbia
Private sector and government
All size classes

JOLTS Data Elements
Employment (pay period of the 12th)
Job openings (last day of the month)
Hires (full month)
Total Separations (full month)
Quits
Layoffs and Discharges
Other Separations

JOLTS and the Labor Market
Strong economy
Open jobs available
Quits are high
Layoffs are low
People are retiring
Struggling economy opposite of the above.
May be leading indicators of turns in the business cycle.

126,000
128,000
130,000
132,000
134,000
136,000
138,000
140,000
2,000
2,500
3,000
3,500
4,000
4,500
5,000
5,500
Em
plo
ym
en
t Jo
b O
pe
nin
gs
Employment
Job Openings
Job openings and employment Seasonally adjusted, in thousands

Why size class estimates?
Size class data provides a better understanding of what happens throughout the business cycle.
Do firms of different sizes react differently across the business cycle?
Are firms of different sizes affected the same way and same amount by economic turns?
Do workers act differently based on the size of their employing firm?
Useful information for economists and policymakers.

JOLTS Size Class Estimates
Size class estimates based on size of establishment began in 2010.
Experimental and available upon request from [email protected].
Size class estimates based on size of firm are being researched.

Establishment vs. Firm
An establishment is a single location and may be part of a larger company.
The firm includes all or multiple locations of the business.
Economic analysis at the firm level makes sense since business decisions are made at the firm level.
Size class data are for private sector only since the concept of “firm” is not intuitive for government.
9

JOLTS Monthly Estimator
Frame stratified by ownership/region/industry sector/establishment size class
Sample unit = establishment
Est = JOLTS*WGT*NRAF*BMF
WGT=sampled weight
NRAF=nonresponse adjustment factor
BMF= ratio CES Emp/JOLTS Emp
No new methodology needed for establishment-based size class estimates.
10

Firm Size Challenges
JOLTS does not sample the firm, so have to post-stratify sample units into size classes based on parent firm size.
No CES employment by firm size.
The frame, Quarterly Census of Employment and Wages (QCEW), has employment by size of firm but lags JOLTS by 9 months. Ex: When JOLTS estimates August 2013, the latest QCEW is 4th quarter 2012.
QCEW is quarterly while JOLTS is monthly.
11

Firm Size Decisions
Employment distribution by firm size changes slowly; reasonable to model missing months from most-current QCEW.
Chose 12-month moving average.
Recompute 12MMA quarterly as new QCEW quarter is available.
Multiply employment distribution by firm size times current month CES employment to provide JOLTS BMF.
Est = JOLTS*WGT*NRAF*PSF*BMF
12


Job Openings by Firm Size
Small firms cut a lot of job openings during the recession and have increased only slightly post-recession.
Medium and large firms cut job openings more sharply during the recession but began increasing openings post-recession.
Job openings seem to be flattening now for all three firm sizes.
14


Hires by Firm Size
Small firms cut hires gradually before and during the recession and have not increased hiring yet post-recession.
Medium and large firms cut hires more sharply during the recession, increased hiring slightly post-recession.
Hires are flat now in all three firm sizes.
16
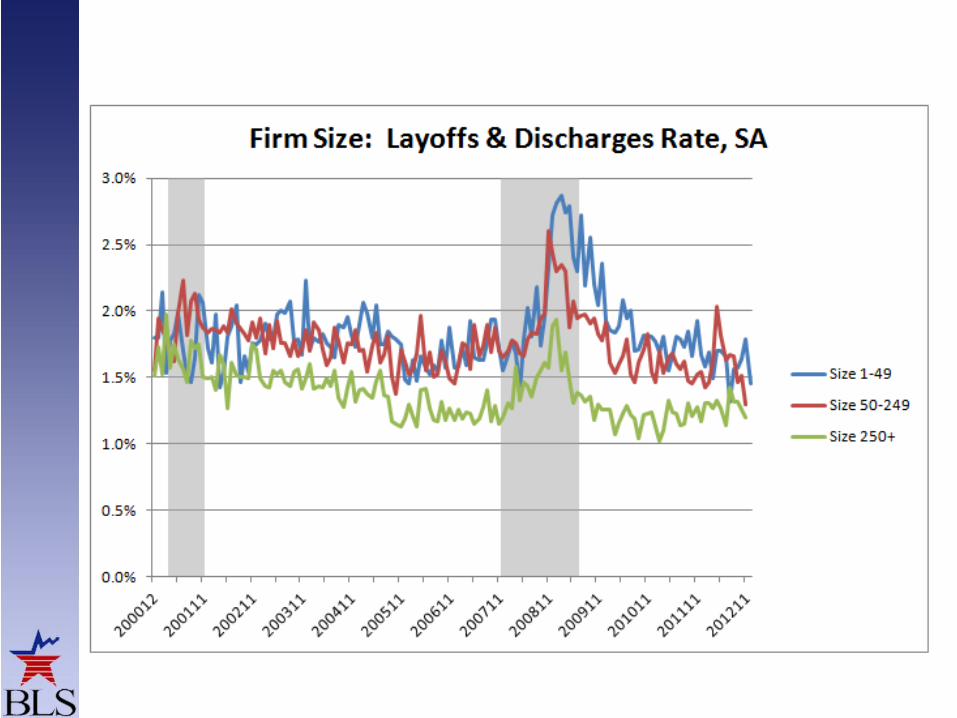

Layoffs by Firm Size
Firms of all sizes increased layoffs gradually through the first part of the recession with a large peak about 2/3 the way through the recession.
Firms of all sizes reduced layoffs to pre-recession levels or better during 2010.
Small and medium firms have held layoffs steady since 2010 but large firm layoffs may be creeping upwards again.
18

Two Sides of the Story
Data that tell us about the employer:
Job openings
Hires
Layoffs and discharges
Data that tell us about the worker:
Quits
Other Separations (retirements)
19

Quits rates were lowest at large firms before the recession, but now the quits rate is very low and the same at firms of all sizes. Workers are not quitting their jobs.

Retirements and transfers are more common in large firms that offer retirement packages and that have multiple locations to transfer between.

In small firms, layoffs outnumbered quits for nearly 2 years.
Workers at small firms are hanging on to their jobs (flat quits, L&D). 22

In medium firms, layoffs outnumbered quits for about 1 ½ years.
Quits are trending up ever so slightly; L&D had a second peak in spring 2012. 23

Large firms had barely more layoffs than quits
very briefly at the height of the recession.
Workers at large firms are slowly beginning to quit more often but layoffs seem to creeping upwards too. 24

Conclusion
The JOLTS size class data provide additional information about the labor market and state of the economy.
Establishment-based estimates are available now.
Firm-based estimates are under research and will be available as soon as possible.
25

Contact Information
Charlotte Oslund Statistician
Job Openings and Labor Turnover Survey Bureau of Labor Statistics
www.bls.gov/jlt [email protected] (202) 691-5870