new england energy alliance
TRANSCRIPT

www.newenglandenergyalliance.org 77 Franklin Street • Suite 507 • Boston, MA 02110 • Phone 617-216-5765
New England Energy Alliance October 2006 New England was one of the first regions of the country to restructure the industry that generates, transmits and delivers electricity. The key catalyst was the persistently high cost of electricity which put the region at a competitive disadvantage. By the late 1990s, all of the New England states except Vermont passed legislation to move toward competitive retail markets, and in 1999, the region’s competitive wholesale electricity market was launched. Many of the results have been positive, although issues concerning market effectiveness remain and continue to be debated. In this report, prepared by Polestar Communications & Strategic Analysis for several members of the New England Energy Alliance1, you will see that the operating performance of power plants has improved significantly, emission rates from the generation of electricity have declined dramatically even as electricity generation has increased 25 percent, and consumers have cumulatively saved between $6.5 to $7.6 billion between 1998 and 2005 based on projections of where prices would have trended in the absence of restructuring. Those savings largely result from wholesale market performance and state mandated rate reductions, and do not reflect recent natural gas price volatility. Unfortunately, electricity supplies are not keeping pace with demand growth, despite an initial burst of power plant construction in the early years of restructuring. In addition, the region has become heavily dependent on natural gas to fuel electricity generating plants. Yet, facilities needed to diversify and increase supplies of natural gas and electricity often face strong political and community opposition. This lack of infrastructure development jeopardizes the benefits from the competitive markets. To address these infrastructure and diversity concerns – both of which are underlying factors in the region’s high cost of energy – political leadership is needed to encourage investment and to make siting and permitting of energy facilities more predictable and timely. The New England states also need to work more closely to harmonize state policies and regulations. This paper provides insights on the region’s electricity industry restructuring efforts and offers principles for your consideration that are designed to help guide future policy development. We hope you find it useful. Sincerely, Carl Gustin President
1 Constellation NewEnergy, Dominion Resources, Duke Energy Gas Transmission, Edison Electric Institute, Entergy Corporation, KeySpan Energy, National Grid, Nuclear Energy Institute, SUEZ Energy North America, TransCanada Corporation
A Review of Electricity Industry Restructuring
in New England
Prepared for Members of: The New England Energy Alliance
By: Polestar Communications & Strategic Analysis
Boston, Massachusetts
September 2006

Member Sponsors
This paper was sponsored by the following members of the New England Energy Alliance:
Constellation NewEnergy Dominion Resources
Duke Energy Gas Transmission Edison Electric Institute
Entergy Corporation KeySpan Energy
National Grid Nuclear Energy Institute
SUEZ Energy North America TransCanada Corporation
Contents
I. Introduction and Summary 1 General
Wholesale Market Performance State Retail Markets Infrastructure in Restructured Markets
II. Wholesale Markets 7 General
Wholesale Market Performance Environmental Emission Reductions
III. State Retail Markets 19 General
Common Regional Retail Restructuring Features Retail Marketplace Consumer Prices Retail Market Competition and Consumer Choice
IV. Infrastructure in Restructured Markets 35 Generation Capacity Development
Fuel/Resource Diversity V. Principles for Future Action 43 Appendix: State Mandated Restructuring Programs 45
Electricity Efficiency Programs Renewable Generation Programs

1
I. Introduction and Summary General The New England states were among the first in the nation to restructure wholesale and retail electricity markets beginning in the late 1990s. In large part, the action was prompted by the burden of having the highest electricity costs in the country, which created hardships for residential consumers and handicapped many businesses from competing on a “level playing field” with companies located outside the region.2 Restructuring required most electric utilities to: sell their generating plants, allow consumers to choose among electricity suppliers and procure electricity for those consumers not choosing an electricity supplier – while remaining regulated and responsible for local distribution service. Wholesale restructuring involved creating a fair and reliable market for competition in generating electricity while ensuring equal access to transmission grids. Once established, the wholesale market caused electricity to become a commodity with prices set not by regulators, but by market rules and the balance between supply and demand.3 In has been seven years since the region’s wholesale marketplace was launched and within this timeframe all the New England states – with the exception of Vermont – have introduced competition into retail markets. Sponsored by the New England Energy Alliance, this white paper presents what may well be the first integrated review of the progress of restructuring in New England. Formed in August 2005, the Alliance advocates for policies to ensure the availability, reliability, and affordability of energy supplies which are vital to the region’s economic growth and prosperity. The aim of this paper is three-fold: first, to identify and quantify the performance of the regional wholesale market; second, to review and qualitatively compare individual state retail markets; and third, to assess the impact of restructuring on generation and fuel source infrastructure. In short, this paper represents a static snapshot assessment of restructuring from its initiation through 2005 based on three public expectations that were widely discussed in the late 1990s: 4
• creation of consumer economic savings – Are retail electricity price trends lower or higher today than they would have been in the absence of restructuring, both nominally and after adjusting for inflation? 5
2A number of factors contributed to the high cost of electricity in the region including: the lack of indigenous fossil fuel resources making the region totally dependent on fossil fuel imports; the region’s high cost of living which translates into higher prices for labor, housing, electricity, etc.; and expensive utility capital investments. 3 The wholesale market is administered by ISO New England, which is overseen by the Federal Energy Regulatory Commission (FERC). 4 This paper makes no judgment as to whether or not the formerly regulated electric utilities could have achieved the same performance level if restructuring had not taken place. 5 It was beyond the scope of this paper to project the future sustainability of any economic savings from restructuring.

2
• consumer choice of suppliers – Do customers now have more options in terms of choice of electricity suppliers, products and services?
• enhancement of environmental benefits – Have emissions of sulfur dioxide, nitrogen
oxides, and carbon dioxide from the generation of electricity decreased? The most recent data and information available from state public utilities commissions and energy offices, the U.S. Energy Information Administration, as well as ISO New England are applied throughout the paper.6 Wherever appropriate, simplified calculations are provided to show key trends and/or to summarize results. The paper is divided into four additional sections plus an appendix. Section II addresses the regional wholesale market, which is overseen by ISO New England. In Section III, state retail markets are considered both individually and collectively with associated mandated programs reviewed in the Appendix. Section IV considers infrastructure issues, specifically relating to generating capacity and fuel supply diversity. Finally, Section V presents the principles adopted by the Alliance to guide the development of future regional energy policies. Wholesale Market Performance In evaluating changes since the competitive wholesale marketplace was launched, five indicators were considered: market participation; infrastructure investment; generating plant performance; wholesale price trends; and financial risk transfer. The environmental impacts of restructuring were also assessed.
Market Participation: More than 280 companies either participate or are eligible to participate in the market comprised of $11.2 billion in annual electricity transactions.
Infrastructure Investment: An unprecedented 10,000 MW of new generation was added
during the first six years of restructuring – increasing supply by ~30%. Since then, further investment has stalled because of both real and perceived financial risks associated with the recovery of capital and the “boom or bust cycle” of infrastructure that requires long lead times to permit and build. As a result, current generation resources may not be sufficient to maintain electricity grid reliability as early as 2008.
Transmission capacity is also insufficient and is causing bottlenecks that are costing consumers hundreds of millions of dollars in congestion costs. Since 2001, however, 75 projects have been placed in service with five major additional projects underway totaling more than $1.5 billion that will alleviate bottlenecks, some of which have been in existence
6 Generally, this data and information is complete through 2005, but there are exceptions and they are noted within the text. These exceptions include natural gas consumption data which is reported by EIA through 2004 and customer migration data which reflects the most recent data available from each state’s Public Utility Commission (which vary between year-end 2005 and mid-2006) . It should also be noted that there are significant reporting inconsistencies among the states which limits the analysis. Consumer migration, energy efficiency, and renewable program results, for example, are tracked differently in each state.

3
for up to 20 years. Despite this effort, $1 billion in additional upgrades to the transmission system are still required.
Generation Performance: The combination of competition, new plant ownership, and reduced operation of inefficient plants has improved generating plant performance. Since wholesale restructuring, plant availability has increased by 8%, avoiding the construction of up to five, 400 Megawatt generating facilities.
Wholesale Prices: According to ISO New England, competitive forces have led to a
reduction in wholesale electricity costs of approximately $700 million annually. However, this savings is tempered with a 47% increase in wholesale costs during 2005 due to the unprecedented high price of natural gas. After adjusting for fuel costs (which are beyond the control of regional markets), wholesale electricity spot-market prices were between 2 to almost 6% lower between 2003 through 2005 than in 2000.
Financial Risk Minimization: Generating companies, not utility ratepayers, now assume
significant financial risk with respect to infrastructure investment. A clear sign of this risk transfer is that some companies that overpaid for generating plants in the region (when utilities were required to divest their assets) have transferred those assets to lenders or even declared bankruptcy.
Because plants are no longer allowed a regulated rate of return, some are experiencing financial difficulties because of an inability to fully recover fixed costs under the wholesale market operating structure. Many of these plants continue to operate to maintain reliability standards under FERC-approved arrangements called “Reliability Must Run” (RMR) agreements which cost consumers about $700 million annually. An upcoming change to the wholesale market is intended to correct this dislocation with the development of a “Forward Capacity Market” (FCM) to compensate generators for fixed costs and encourage investment in new power plants – estimated to cost consumers about $5 billion through 2010.7 While it remains to be seen how many new power plants will actually be built, initial reaction to the FCM from generating companies has been positive.8 But new plants will still have to overcome regulatory, permitting and financing hurdles.
Environmental Protection: Three traits of restructuring including construction of new
generating capacity, better generating plant performance and increased generating plant efficiencies – combined with some of the most stringent environmental regulations in the country – have resulted in significant reductions in emissions. While electricity generation within the region increased 25% between 1998 and 2004, associated sulfur dioxide (SO2) emission rates decreased by 56%, nitrogen oxide (NOx) by 57% and carbon dioxide (CO2) by 22%.
7 ISO New England estimates that Forward Capacity Markets will provide about $5 billion in transitional revenues to generators until the market is fully implemented in 2010 (with payments beginning in December of 2006). The first forward capacity auction is scheduled to take place during the first quarter of 2008, to cover capacity needs for June 2010 through May 2011. 8 “Flurry of Power Plant Proposals Offers Hope”, The Boston Globe, September 25, 2006.

4
State Retail Markets Five of the six New England states restructured their electricity industries – all with varying approaches and timeframes. The status of restructuring in each state, along with an estimation of consumer economic benefits and the progress of retail competition is provided below. Included in the Appendix is a review of state mandated energy efficiency and renewable programs. It should be noted that neither of the two primary goals of state restructuring – consumer savings and choice – were explicitly defined by any of the state legislatures. To this day, they still mean different things to different people and are, therefore, not surprisingly, the nexus of ongoing debate about the success of restructuring.
Retail price assessment: Through state administered rate reductions, utility supply procurement requirements, and competitive wholesale market forces, all electricity consumers have benefited economically from restructuring. Based on a comparison of actual retail electricity prices against a projection of where they would likely have trended in the absence of restructuring from 1998 to 2005, New England consumers have cumulatively saved between $6.5 and $7.6 billion.9 On a state-by-state basis, savings range from $3.4 billion in Massachusetts, to essentially “break-even” in Maine.
After adjusting for inflation, all the New England states (including Vermont which has benefited from wholesale market efficiencies) have lower retail electricity prices – 7 to 18% through 2005 when compared to those years just prior to restructuring. However, more recently, record-high natural gas prices, environmental compliance costs, and transmission congestion costs are reducing these economic benefits.
Customer Choice: While consumer switching from utilities to competitive suppliers has
progressed fairly well among medium and large manufacturers and businesses in some states, the level of competition remains very limited in the smaller commercial and residential sectors throughout the region. Massachusetts and Maine have had the most success building a market for competitive service providers. In those states, competitive suppliers now serve more than a third of total retail load and about 80% of the large industrial load. Approximately 10% of Rhode Island’s electricity load is currently served by competitive suppliers. The number of consumers served by competitive suppliers in both Connecticut and New Hampshire remains low, although there are indications that migration to competitive suppliers is beginning to occur as standard offer transition periods have either recently expired or soon will, and large manufacturers and businesses are or will soon be experiencing changing utility pricing.
Key reasons for the lack of greater retail competition in some customer segments include: the lack of or minimal price difference between utility offered and competitive supplier service; the high cost to suppliers to acquire smaller customers; and limited consumer
9 First order calculations were performed to quantify this range of savings. The high end value reflects a comparison of the actual weighted average regional retail rates against a projection of where rates were trending had a regulated industry structured continued (from 1998 to 2005). The lower value was quantified based on the same methodology applied to each individual state. See page 23 for a more detailed description of these calculations.

5
knowledge about restructuring particularly in the residential and small commercial customer sectors.
Energy Efficiency: New England ratepayers contribute about $240 million each year to fund energy efficiency programs implemented in each state. These programs save the region enough electricity annually to meet the needs of about 125,000 homes and reduce peak demand by about 140 Megawatts per year.10 Between 2000 and 2004, efficiency programs avoided the generation of more than: 30,000 tons of SO2; 9,000 tons of NOx; and 8 million tons of CO2.
Renewable Programs: Massachusetts, Connecticut and Rhode Island mandated ratepayer
funding for renewable project development. In addition, all of the region’s states except New Hampshire have adopted renewable portfolio standards (RPS) – requiring that a percentage of electricity supply be provided by renewable generation sources. It has been estimated that an additional 1,000 Megawatts of new renewable generation in the region may be needed by 2010 to meet RPS requirements.11 To date, however, fewer than 100 Megawatts of generation have been added – so achieving the legislated goal is in doubt. Moreover, if the goal is not met, hundreds of millions of dollars in compliance payments will be passed on to consumers with no electricity in return.
Infrastructure in Restructured Markets The future performance of the region’s restructured electricity market is dependent on the availability of adequate infrastructure. However, construction of new generating facilities is not keeping pace with increasing electricity demand which could impact the region’s economic growth. In addition, the region has become heavily dependent on natural gas to fuel electricity generating plants:
Generation Capacity Development: The region needs new generating capacity. It appears that the pending imbalance between supply and demand in the region has been caused by insufficient economic incentives for investment in new capacity. The recently FERC-accepted “forward capacity market” is intended to remedy this problem and provide incentives for meeting the region’s future capacity needs.12 While initial response from generators has been positive, the details have yet to be worked out and the impacts on the region’s electricity market and economy remain uncertain. Contributing to this challenge are state environmental policies, namely the Regional Greenhouse Gas Initiative “RGGI”, that have created uncertainty in terms of impacts on electricity prices and investment decisions. 13
10 Estimate does not include reductions from demand reduction programs administered by ISO New England. 11 “Electric Energy Efficiency and Renewable Energy in New England: As Assessment of Existing Policies and Prospects for the Future”, The Regulatory Assistance Project, May 2005. 12 The alternative to LICAP or Locational Installed Capacity Market. 13 Seven northeastern states signed a memorandum of understanding in December 2005 to establish the first carbon dioxide cap and trade program in the U.S. RGGI includes all the New England states except Massachusetts and Rhode Island. Massachusetts has adopted a separate greenhouse gas reduction program.

6
Fuel/Resource Diversity: The region’s natural gas consumption has grown by 70% over the last decade – primarily for electricity generation. The balance between the supply and demand of natural gas in the region is tenuous and the consequences costly. Additional supplies of natural gas are needed, combined with more diverse sources of fuels for electricity generation including coal, nuclear, renewables as well as efficiency measures to ensure a reliable supply of electricity at an affordable price.
Political leadership is needed to overcome these challenges to guide: 1) the design, implementation and monitoring of proposed wholesale market changes to ensure that imperfections are corrected so that infrastructure is built when and where it is needed most; and 2) action to harmonize state policies, programs and regulations throughout the region to encourage infrastructure investment, facilitation of infrastructure siting and resource diversity. While the report makes no explicit recommendations, the Alliance advocates the adoption of its principles (contained in Section V) to help guide policies and actions to ensure that the region has reliable and affordable supplies of electricity and natural gas. These principals provide a roadmap to the region’s political leaders in reaching a consensus and implementing programs and initiatives to overcome the clear challenges outlined above.
7
II. Wholesale Markets In less than a decade, the electric industry has been transformed from one dominated by vertically integrated monopolies that generated, transmitted and delivered electricity to one driven by competition with new participants, rules, procedures, systems and entities. This section provides an overview of the changes that have transpired and the performance of the wholesale marketplace. General Congress initiated the groundwork for deregulating wholesale electricity markets through provisions contained in the Public Utility Regulatory Policies Act of 1978 (PURPA). The Act mandated that regulated electric utilities provide a market for the output of non-utility generating (or power) plants that meet certain size, technology and environmental criteria. Many state regulators required utilities to sign long-term purchase power contracts with small independent PURPA generators at the utilities’ then avoided costs.14 Plants built pursuant to PURPA represented the beginning of a new class of generators called independent power producers (“IPP’s”). Further, pursuant to state-mandated integrated resource planning processes, regulators required utilities to compare the cost of utility-built generation with that of power from IPP’s and to take the least cost alternative. This regulatory paradigm resulted in the maturation of the IPP industry across the country. Thereafter, the move to competition in wholesale markets was advanced with the passage of the Energy Policy Act of 1992. The Act began the process of allowing open access to the existing transmission system to non-utility generators. Associated regulations issued by FERC (Orders 888 and 889) authorized open and equal access to all utilities’ transmission lines for all electricity producers, thus facilitating wholesale and retail restructuring. A cornerstone of the state-level restructuring that followed in most New England states was utility divestiture of generation assets. In the early stages of restructuring, most of the region’s electric utilities sold their plants to merchant generating companies and power marketers.15 ISO New England, an independent system operator (ISO) approved by the Federal Energy Regulatory Commission (FERC), was formed to develop and administer a competitive wholesale market to ensure fair and open access to the region’s transmission systems and unbiased
14PURPA was a legislative response to the oil embargoes of the 1970s and was an effort to wean the United States off of its reliance on imported oil. Long-term PURPA contracts along with expensive capital investments contributed to New England’s high electric rates (among other factors) prior to restructuring. Today, consumers continue to pay the price in utility transition costs – a customer charge that covers utility contractual obligations that were approved by regulators prior to restructuring that would have been recovered at fixed rates over time under the old regulatory system. Transition costs are steadily declining as utility obligations are paid off. 15 Utilities in Massachusetts, Connecticut, Maine and Rhode Island sold generation to competitive suppliers because they were either mandated to, or voluntarily agreed to divest generation sources in order to recoup stranded costs. Public Service Company of New Hampshire was required to sell its share of the Seabrook Nuclear Power Station, but was not required to divest its fossil/hydro generation assets.

8
administration of the markets. In May 1999, New England’s wholesale electricity markets were formally launched and included new market arrangements, procedures, rules, systems and products to support the implementation of competition.16 When the wholesale market in New England was launched, ongoing refinements to the governing rules and systems should have been expected because the introduction of competition in the electricity generation industry did not closely parallel the experience of other deregulated industries. Since wholesale market initiation, ISO New England, with FERC approval, has made two significant design changes to marketplace rules and procedures. Standard Market Design (SMD). On March 1, 2003, ISO New England implemented SMD – a major design overhaul of the wholesale electricity market.17 The objective was to establish a common framework with neighboring regions to promote greater economic efficiency and inter-regional trade in order to further FERC’s goal of standardizing wholesale markets nationwide. It was also adopted to increase the region’s electricity reliability by providing clear economic signals indicating where supply and load are imbalanced and generation or transmission is needed most. New England’s SMD was based on features of a wholesale electricity market design model adopted by the PJM Interconnection.18 A key component of SMD was the establishment of “locational marginal pricing” – an approach that divided the New England region into eight zones.19 Locational marginal pricing recognizes that the region’s transmission system can become congested during times of peak demand making it more expensive to deliver electricity to some specific geographic areas. Previously, such expenses were distributed among all consumers in the region. Now, these prices reflect the true cost of delivering and supplying electricity at every location on the grid, which is designed to provide incentive for the construction of new transmission infrastructure and generating facilities into those areas where they are most needed. Congestion costs translate into higher electricity prices in import-constrained zones. ISO New England has estimated New England’s transmission congestion costs to range from $50 million to $300 million per year. In 2005, wholesale electricity prices in Connecticut were approximately 17% higher on average than those in Maine – the regional zone with the lowest average energy prices.20 Consumers in the Boston area and Southwest Connecticut (the two 16 In the 1990s, as states and regions established wholesale competition for electricity, groups of utilities and their federal and state regulators began forming independent, transmission operators to ensure equal access to the power grid for new, non-utility competitors. Today, there are seven Independent System Operators and Regional Transmission Organizations (ISO/RTO) in the U.S. 17 SMD was the third order in a series of FERC initiatives to increase the efficiency of competitive wholesale electricity markets. The intent of SMD was to increase open access to interstate transmission systems to allow market participants to compete on a level playing field with consistent rules for all players in all regions. FERC’s proposed SMD rule issued in 2002, created considerable opposition in certain parts of the country and was withdrawn in July 2005. However, New England moved forward with competitive market development. 18 The ISO region that formerly comprised Pennsylvania, New Jersey and Maryland. 19 Connecticut, Maine, New Hampshire, Rhode Island, Vermont, Western and Central Massachusetts, Northeastern Massachusetts and Boston, Southeastern Massachusetts and Cape Cod. 20 In 2005, the average day-ahead Locational Marginal Price difference between Maine and Connecticut was $12.33/Mwh or about 17% (or $70.82 versus $83.15 per MWh) from “2005 Annual Markets Report”, ISO New England, June 1, 2006.

9
most congested areas in the region) are paying 10 to 20% more per year for electricity until additional transmission infrastructure is constructed or new generating plants are built closer to where electricity is most consumed. An independent assessment of the region’s wholesale market found that SMD in its first full year of operation operated as designed. SMD markets improved the efficiency of congestion management in terms of dispatching generation to satisfy energy demand and operating reserve requirements while maintaining power flows on the network.21 Regional Transmission Organization (RTO). In early 2005, FERC designated ISO New England as the regional transmission organization for the six-state region.22 As an RTO, ISO New England’s role has been expanded to include greater operational control of the region’s transmission facilities, in addition to the administration and oversight of the region’s competitive wholesale markets. FERC encouraged the formation of a northeastern RTO, covering New England, New York, and the Mid-Atlantic States, in order to achieve greater market efficiencies, but this concept did not come to fruition.23 ISO as an RTO exercises operational control over the region’s transmission facilities pursuant to contractual arrangement with New England’s transmission owners. Under this arrangement, ISO has clear authority to conduct regional planning and to identify the need for transmission upgrades. Transmission owners have agreed to build or arrange to have built the upgrades that ISO finds are needed. In return, the transmission owners receive FERC-approved incentives to participate in the RTO. The designation of ISO New England as an RTO has the potential for significant qualitative benefits for consumers – such as increased reliability from better transmission planning and upgrading – but are difficult to quantify as they are intangible and some may not be realized in the short-term. The goal of an RTO is to ultimately lower costs to ratepayers through reduced transmission congestion (decreasing transmission costs and increasing access to lower cost generation) and by increasing electricity reliability. Wholesale Market Performance The New England power supply system is operated as a single control area with over 350 power plants, 8,000 miles of high-voltage transmission lines and 12 interconnections to neighboring systems serving 6.5 million businesses and households.24
21 “2004 Assessment of the Electricity Markets in New England”, Potomac Economics, Ltd., June 2005. 22 FERC is promoting the voluntary formation of RTOs to promote efficiency in wholesale electricity markets and the lowest price possible for reliable service. FERC Order No. 2000 amended its regulations under the Federal Power Act to advance the formation of RTOs requiring each public utility that owns, operates or controls facilities for the transmission of electric energy in interstate commerce to make certain filings to form an RTO. 23 As of mid-2005, over 50% of the generating capacity in the U.S. is operating within an ISO/RTO context. RTOs include the Midwest Independent Transmission System Operator; PJM Interconnection; ISO New England, and the California ISO. Additionally the New York ISO provides RTO elements, but is an ISO rather than an RTO, and the Electric Reliability Council of Texas provides many RTO functions, but is not FERC jurisdictional. 24 “2005 Annual Markets Report”, ISO New England, June 1, 2006.

10
As a commodity, electricity is sold through fixed contracts between wholesale buyers and sellers and through short-term (day-ahead) or spot (real-time) trading. About 75% of electricity trading activity is done through bilateral transactions – contracts to purchase or sell electricity over specified time periods under set prices. Bilateral transactions provide price certainty because these arranged contracts are fixed and not subject to external market forces Spot- (real-time) and short-term (day-ahead) trading is typically relied upon as a “balancer” between supply and demand. Five parameters were selected to serve as marketplace performance indicators: market participation; infrastructure (generation, transmission) investment; generating plant performance; wholesale price trends; and financial risk transfer. Market Participation. More than 280 companies and entities either participate or are eligible to do so in New England’s wholesale marketplace and complete $11.2 billion of electricity transactions annually.25 Participants include power generators, transmission owners, electricity suppliers (marketers and brokers), publicly owned municipal utilities and large end-users. Since the markets opened in 1999, there has been a 71% increase in the number of eligible wholesale market participants, with actual participation varying by state.26 Before retail restructuring was initiated, for example, there were approximately 15 electric utilities in New England (excluding municipal utilities) that operated all the region’s generating plants. There are now more than 35 companies operating generating plants with the largest owning no more than about 15% of the region’s supply.27 An independent assessment commissioned by ISO New England on the performance of the region’s wholesale electricity market for the calendar year 2004 found it to be “fair and competitive”.28 Generation Capacity Investment. Electricity consumption has increased by 15% in the region since the competitive wholesale marketplace was established.29 Investors responded by investing more than $9 billion to build some 25 new generating plants in just a 6-year timeframe, increasing the region’s electricity supply by 30%. In an absolute sense, there is no precedent prior to restructuring for the quantity of generating plants built and brought to commercial operation over such a short period of time. However, in recent years, investment in new generating facilities has slowed considerably. ISO New England estimates that only about 1,000 MW of new capacity will be added in the next several years – which is less than half of expected demand growth. To complicate matters, a portion of the region’s older electric and gas infrastructure may need to be replaced or undergo substantial refurbishment to remain in operation. As a result, according to ISO New England, current generation resources may be insufficient to maintain the reliability of the electric grid in some parts of New England during peak demand periods as soon as 2008. There are several aspects to this infrastructure issue – which are discussed in Section IV.
25 “2005 Annual Markets Report”, ISO New England, June 1, 2006. 26 “ISO New England: Delivering Value to the Region”, 2005. 27 According to data contained in ISO New England CELT Report. 28 “2004 Annual Markets Report”, ISO New England, July 2005. 29 Statistics from Energy Information Administration, U.S. Department of Energy.

11
Transmission Infrastructure Investment. In the competitive marketplace, the dispatch of electricity over the region’s 8,000 miles of transmission lines generated by more than 350 power plants is challenging because New England’s electricity system was built by individual utility companies, each serving local load and each coordinating their generation and transmission construction and operations. Moreover, a significant portion of the transmission system is more than 30 years old and has become too small to handle the volume of electricity now demanded. In the decade prior to the formation of an RTO, transmission infrastructure capital investment was lagging, which consequently puts the region in a catch-up mode today. A recent industry study confirmed that transmission investment has not kept up with either demand growth or generation investment and has not been sufficient to accommodate the advent of regional power markets.30 It is important to note that the region would likely have had a transmission infrastructure capacity shortfall even if the former regulated utility structure remained in place. The broad flow of electricity in a competitive marketplace has simply exacerbated this situation along with transmission siting difficulties historically prevalent throughout the region. Improvements, however, are being made. Since 2001, seventy-five projects have been placed in service totaling $217 million in construction costs and many others are well on their way to completion.31 For example, five major bulk transmission system projects totaling more than $1.5 billion in four states have been initiated which should ultimately reduce congestion costs and improve the flow of electricity within the region. NSTAR is nearing completion of a $60 million transmission line in greater Boston, bringing 25% more electricity into the City which should moderate prices in this zone.32 The Northeast Utilities/United Illuminating Company 345 kV project will improve the transfer of power and system performance in Southwest Connecticut. Phase I of the project is under construction with a projected in-service date of December 2006 which will increase the area’s import capability by 275 Megawatts. Phase 2, currently in the final design stage, will increase the import capability by 825Megawatts. It is scheduled for completion in December 2009.33 Other large-scale transmission projects underway include a Northeast Reliability Interconnect Project that will improve transfer capability between New England and New Brunswick, and the Northwest Vermont Reliability Project that will improve the transmission system in that area. However, more system upgrades are needed. In addition to the large-scale projects listed above, ISO New England’s 2005 Regional System Plan identifies over 200 additional transmission infrastructure projects estimated to cost approximately $1 billion that will be needed to ensure a reliable supply of electricity over the next ten years.34 30 “Transmission: The Critical Link,” National Grid, 2005. 31 “2005 Regional System Plan”, ISO New England, October 20, 2005. 32 The NSTAR 345 kV Reliability Project consists of three cable circuits. The projected in-service date for the first two cable circuits is December 2006 which will increase import capability by 900MW. The third cable is scheduled for service before the summer of 2008 and will increase import capability by another 200MW. 33 “2005 Regional System Plan”, ISO New England, October 20, 2005. 34 “ISO New England’s Annual Assessment Targets Continued Power System Enhancements”, ISO New England, October 20, 2005.
12
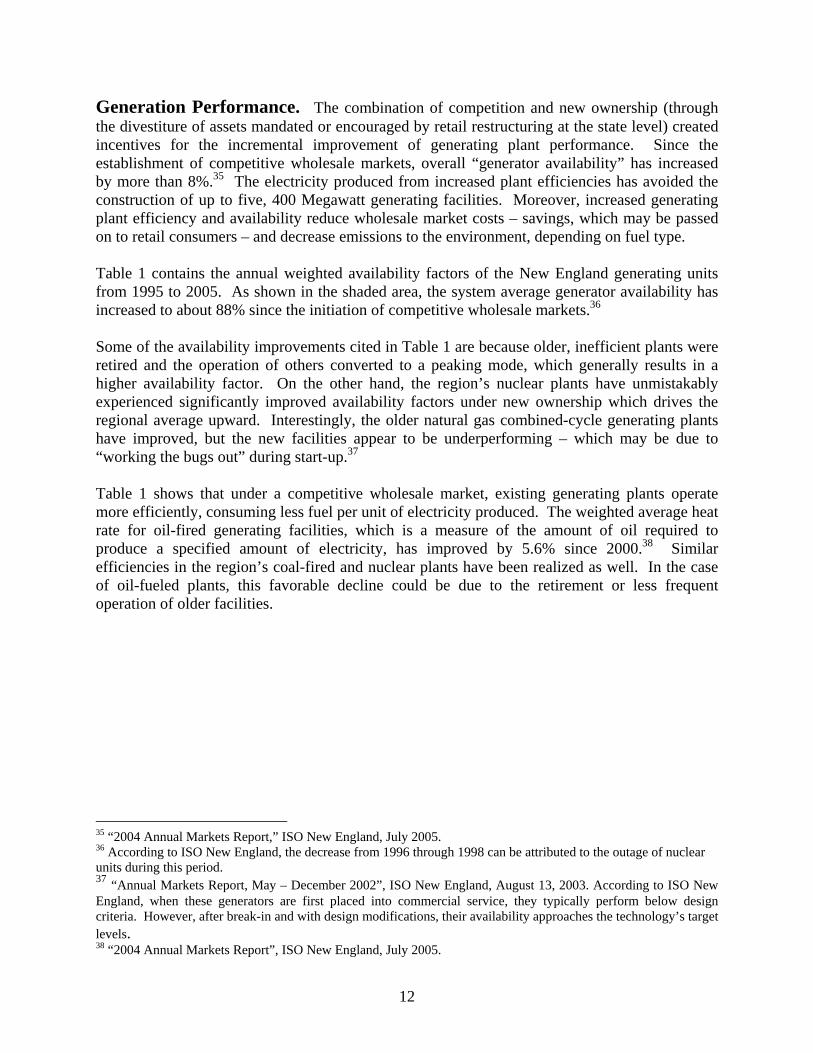
Generation Performance. The combination of competition and new ownership (through the divestiture of assets mandated or encouraged by retail restructuring at the state level) created incentives for the incremental improvement of generating plant performance. Since the establishment of competitive wholesale markets, overall “generator availability” has increased by more than 8%.35 The electricity produced from increased plant efficiencies has avoided the construction of up to five, 400 Megawatt generating facilities. Moreover, increased generating plant efficiency and availability reduce wholesale market costs – savings, which may be passed on to retail consumers – and decrease emissions to the environment, depending on fuel type. Table 1 contains the annual weighted availability factors of the New England generating units from 1995 to 2005. As shown in the shaded area, the system average generator availability has increased to about 88% since the initiation of competitive wholesale markets.36 Some of the availability improvements cited in Table 1 are because older, inefficient plants were retired and the operation of others converted to a peaking mode, which generally results in a higher availability factor. On the other hand, the region’s nuclear plants have unmistakably experienced significantly improved availability factors under new ownership which drives the regional average upward. Interestingly, the older natural gas combined-cycle generating plants have improved, but the new facilities appear to be underperforming – which may be due to “working the bugs out” during start-up.37 Table 1 shows that under a competitive wholesale market, existing generating plants operate more efficiently, consuming less fuel per unit of electricity produced. The weighted average heat rate for oil-fired generating facilities, which is a measure of the amount of oil required to produce a specified amount of electricity, has improved by 5.6% since 2000.38 Similar efficiencies in the region’s coal-fired and nuclear plants have been realized as well. In the case of oil-fueled plants, this favorable decline could be due to the retirement or less frequent operation of older facilities.
35 “2004 Annual Markets Report,” ISO New England, July 2005. 36 According to ISO New England, the decrease from 1996 through 1998 can be attributed to the outage of nuclear units during this period. 37 “Annual Markets Report, May – December 2002”, ISO New England, August 13, 2003. According to ISO New England, when these generators are first placed into commercial service, they typically perform below design criteria. However, after break-in and with design modifications, their availability approaches the technology’s target levels. 38 “2004 Annual Markets Report”, ISO New England, July 2005.

13
Table 1 New England Generating Plant Average Availability Factors (%)
1995 1996 1997 1998 1999 2000 2001 2002 2003 2004 2005 System Average
79 78 75 78 81 81 87 89 88 88 88
Fossil Steam 81 81 84 81
79 78 83 85 87 86 86
Nuclear 63 53 32 53 82 89 92 91 91 94 89 Jet Engine 88 92 94 93 70 88 95 94 94 97 95 Combustion Turbine
94 92 96 92 90 83 89 92 93 97 95
Combined Cycle:
90 92 92 89 83 80 85 90 85 86 86
- Pre-1999 90 92 92 89 91 89 96 92 91 92 92 - 1999-2004 n/a n/a n/a n/a 47 67 76 89 84 84 86 Hydro 83 88 86 86 81 81 96 96 95 94 94 Pumped Storage
97 94 97 91 86 86 95 87 92 90 92
Diesel 90 94 90 89 88 88 98 98 98 95 98 Source: “2005 Annual Markets Report”, ISO New England, Inc.
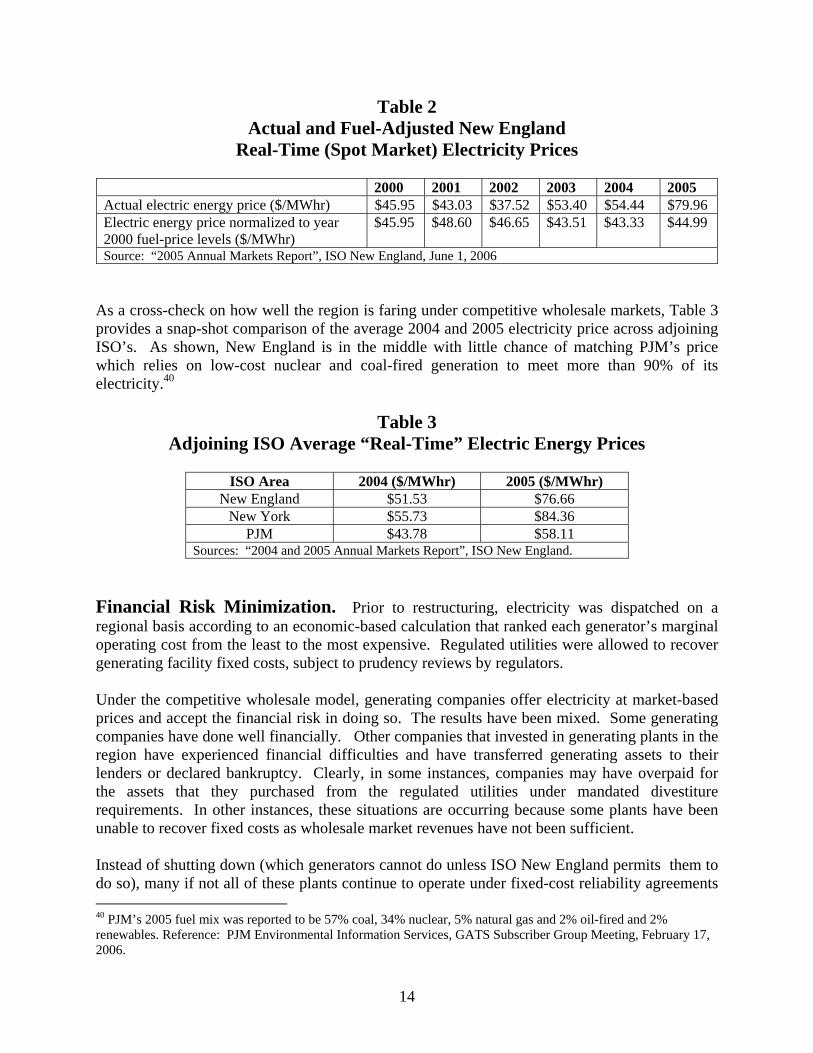
Wholesale Prices. New England wholesale electricity prices have decreased since 2000 after adjusting for fuel costs (which significantly fluctuate under international, weather and production influences that are beyond the control of regional markets). According to ISO New England, competitive market incentives to improve generator availability, enhance operation and make infrastructure more efficient, along with new generating facilities, reduced wholesale electricity prices by 5.7% through 2004, leading to an annual cost reduction of $700 million. The amount of the reduction realized by retail consumers may differ. Table 2 provides a summary of actual real-time (or spot market) electricity prices for the period 2000 through 2005 as well as those normalized to year 2000 fuel price levels. With the fuel cost adjustment, the 2005 average wholesale electricity price was still lower than it was in 2000, which reflects the increase in generating plant availability and other competitive factors. In terms of actual wholesale prices, the substantially higher electricity price during 2005 was driven by the unprecedented high cost of natural gas. During that year, units burning gas or oil set wholesale electricity spot prices 87% of the time and the price of natural gas increased by 47% -- which, in turn increased the wholesale price of electricity by that same amount.39 During high price periods, natural gas packs a double economic punch to New England because when the price of this fuel increases, so does electricity.
39 “2005 Annual Markets Report”, ISO New England, June 1, 2006.
14
Table 2 Actual and Fuel-Adjusted New England
Real-Time (Spot Market) Electricity Prices
2000 2001 2002 2003 2004 2005 Actual electric energy price ($/MWhr) $45.95 $43.03 $37.52 $53.40 $54.44 $79.96 Electric energy price normalized to year 2000 fuel-price levels ($/MWhr)
$45.95 $48.60 $46.65 $43.51 $43.33 $44.99
Source: “2005 Annual Markets Report”, ISO New England, June 1, 2006 As a cross-check on how well the region is faring under competitive wholesale markets, Table 3 provides a snap-shot comparison of the average 2004 and 2005 electricity price across adjoining ISO’s. As shown, New England is in the middle with little chance of matching PJM’s price which relies on low-cost nuclear and coal-fired generation to meet more than 90% of its electricity.40
Table 3
Adjoining ISO Average “Real-Time” Electric Energy Prices
ISO Area 2004 ($/MWhr) 2005 ($/MWhr) New England $51.53 $76.66
New York $55.73 $84.36 PJM $43.78 $58.11
Sources: “2004 and 2005 Annual Markets Report”, ISO New England. Financial Risk Minimization. Prior to restructuring, electricity was dispatched on a regional basis according to an economic-based calculation that ranked each generator’s marginal operating cost from the least to the most expensive. Regulated utilities were allowed to recover generating facility fixed costs, subject to prudency reviews by regulators. Under the competitive wholesale model, generating companies offer electricity at market-based prices and accept the financial risk in doing so. The results have been mixed. Some generating companies have done well financially. Other companies that invested in generating plants in the region have experienced financial difficulties and have transferred generating assets to their lenders or declared bankruptcy. Clearly, in some instances, companies may have overpaid for the assets that they purchased from the regulated utilities under mandated divestiture requirements. In other instances, these situations are occurring because some plants have been unable to recover fixed costs as wholesale market revenues have not been sufficient. Instead of shutting down (which generators cannot do unless ISO New England permits them to do so), many if not all of these plants continue to operate under fixed-cost reliability agreements 40 PJM’s 2005 fuel mix was reported to be 57% coal, 34% nuclear, 5% natural gas and 2% oil-fired and 2% renewables. Reference: PJM Environmental Information Services, GATS Subscriber Group Meeting, February 17, 2006.
15
called Reliability Must Run Agreements (RMRs). Subject to FERC approval, these agreements provide financial support to ensure that units needed for reliability continue to be available. The need for these agreements suggests that the current market structure does not adequately compensate generators providing reliability service (that is, only operating periodically when electricity demand is peaking).41 As of December 31, 2005, RMRs were in effect for 14 generating stations, comprising 4,719 Megawatts of capacity, or 15% of the total system-wide capacity. In Connecticut, approximately half of the generating capacity is operating under some form of reliability agreement costing consumers approximately $330 million annually. Massachusetts has seven generating plants totaling about 1500 Megawatts operating under reliability agreements, costing consumers $375 million annually. The high number of RMRs demonstrates the need for wholesale market changes (i.e., pending Forward Capacity Market implementation) to allow generators to recover fixed costs and encourage new infrastructure investment. Environmental Emission Reductions A key driver in restructuring efforts was environmental protection – namely the reduction in atmospheric emissions from the generation of electricity. The environmental benefits from restructuring have been leveraged by federal (The Clean Air Act and its Amendments) and state air quality regulations that were promulgated coincident to the individual state efforts. For example, Massachusetts was the first state in the nation to limit carbon dioxide (CO2) and mercury emissions from electricity generating plants.42 These environmental regulations led to significant investment in emission control equipment – in some cases hundreds of millions of dollars per plant – by the new owners of generating facilities after their divestiture by the formerly regulated utilities. More importantly, the more rigorous air emission regulations coupled with siting requirements made the construction of new natural gas-fired generating plants the investment of choice by developers (which as subsequently discussed in Section IV has led to heavy dependence on this fossil fuel). Over the past six years, there have been very significant air quality improvements even though electricity generation within the region increased almost 25% during the same timeframe. Put simply, electricity production has risen and emissions have declined. Emission Trends. Two traits of wholesale market restructuring, construction of new generating capacity and increased generating plant performance, were considered in assessing
41 An upcoming change to the wholesale market involves the development of a “Forward Capacity Market” which will increase compensation to all generators. 42 In 2001, Massachusetts enacted strict regulations applicable to the state’s oldest power plants requiring significant reductions in SO2, NOx, and even CO2 (currently federally unregulated) which required major upgrades of pollution control technology or re-powering of facilities. Compliance deadlines were phased-in over a seven-year period. In 2004, Massachusetts also adopted regulations to cut mercury emissions from coal-fired facilities – and previously promulgated regulations for the mitigation of mercury emissions from trash-to-energy facilities.

16
emission trends (the environmental benefits of ongoing electricity efficiency programs are a function of state mandated programs and are summarized in the Appendix). It was beyond the scope of this paper to assess the effects of the new federal and state environmental regulations on the emission reduction trends which undoubtedly also played a key role.
Natural gas-fired generation: Since restructuring, generation capacity in New England increased by 11,000 Megawatts, almost all of which was natural gas-fired. Natural gas-fired combined-cycle plants offer extremely high efficiency – up to double that of other fossil-fueled generating facilities emitting almost 5 times less nitrogen oxide, up to 55% less carbon dioxide and no sulfur dioxide, compared to either oil or coal.
Investment in this new generation has resulted in either the retirement or the reduced operation of some older plants with higher emission rates and has enabled new electricity demand to be met with fewer emissions. More specifically, restructuring has led to several fossil-fired generating plants to be: retired (and replaced with new natural gas fired facilities); refurbished or retrofitted with emission controls that go beyond federal and/or state requirements.
Increased operating efficiency: As discussed previously, generating plant efficiencies
have increased in the competitive marketplace (due to better performance or the predominant operation by the most efficient facilities) which means that less fuel is consumed per unit of electricity produced which in turn means fewer emissions. In addition, the availability factor of emissions-free nuclear generating plants has improved substantially which presumably defers the operation of fossil-fired units thereby reducing emissions.
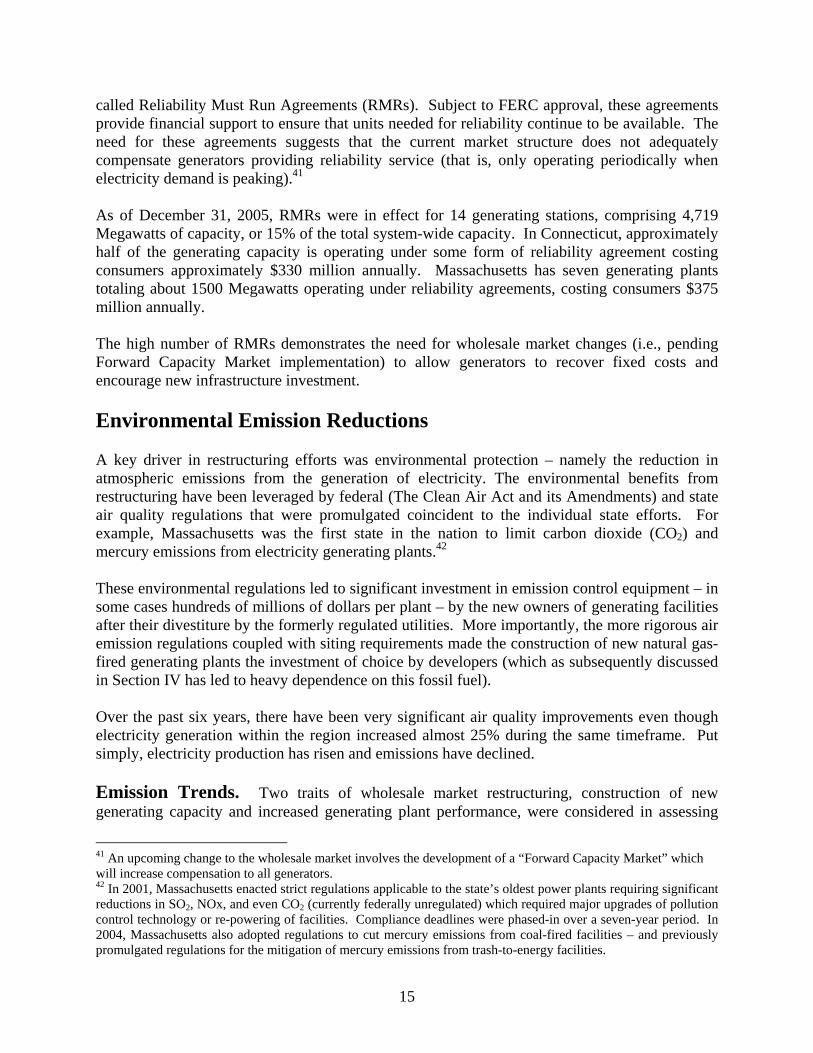
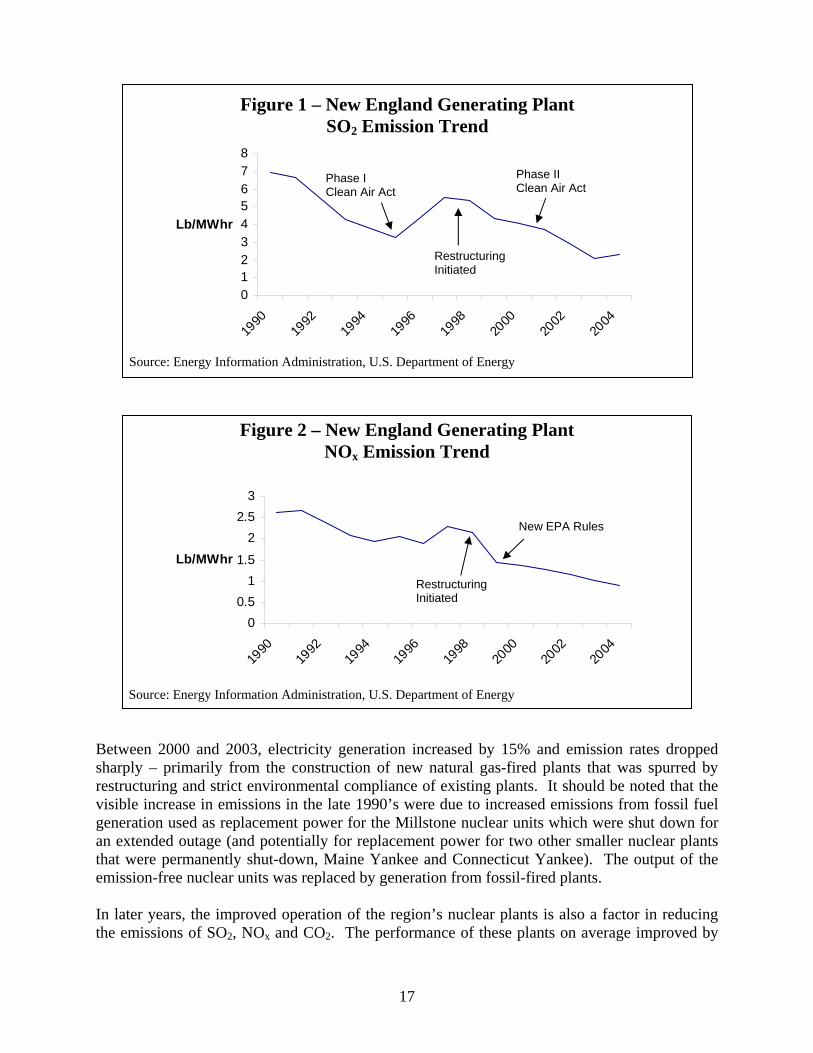
Figures 1 through 3 show emission trends from electricity generation in New England for: sulfur dioxide (SO2,), which is responsible for acid rain; nitrogen oxide (NOx), which produces smog; and carbon dioxide (CO2), a key driver in global warming. Between 1998 (as restructuring was initiated in three of the six New England states) and 2004, the emission rates from generating electricity have declined by: 56% for SO2, 57% for NOx and 22% for CO2.43 As noted above, this decline was not entirely due to restructuring. In Figures 1 and 2, the impacts of the Clean Air Act and its amendments can be seen between 1990 and 1999 (just as restructuring was initiated) as SO2 and NOx emissions rates declined due to generating plant technology and equipment retrofits. 43 Based on weighted average of state electricity generation and emissions data, Energy Information Administration, U.S. Department of Energy.
17
012345678
1990
1992
1994
1996
1998
2000
2002
2004
Lb/MWhr
00.5
11.5
22.5
3
1990
1992
1994
1996
1998
2000
2002
2004
Lb/MWhr
Between 2000 and 2003, electricity generation increased by 15% and emission rates dropped sharply – primarily from the construction of new natural gas-fired plants that was spurred by restructuring and strict environmental compliance of existing plants. It should be noted that the visible increase in emissions in the late 1990’s were due to increased emissions from fossil fuel generation used as replacement power for the Millstone nuclear units which were shut down for an extended outage (and potentially for replacement power for two other smaller nuclear plants that were permanently shut-down, Maine Yankee and Connecticut Yankee). The output of the emission-free nuclear units was replaced by generation from fossil-fired plants. In later years, the improved operation of the region’s nuclear plants is also a factor in reducing the emissions of SO2, NOx and CO2. The performance of these plants on average improved by
Figure 1 – New England Generating Plant SO2 Emission Trend
Source: Energy Information Administration, U.S. Department of Energy
Restructuring Initiated
Phase II Clean Air Act
Phase I Clean Air Act
Source: Energy Information Administration, U.S. Department of Energy
Figure 2 – New England Generating Plant NOx Emission Trend
New EPA Rules
Restructuring Initiated

18
20% from 1990 through 2005 – a trend that continued under restructuring when nuclear units were purchased by companies specializing in nuclear plant operations. As shown in Figure 3, the emissions of CO2 have declined slightly but notably – marking the first time there has been a roll back in greenhouse gas emissions in the region – an important accomplishment given that four of the six New England states signed a memorandum of understanding establishing the first carbon dioxide cap and trade program in the U.S. The Regional Greenhouse Gas Initiative (RGGI) includes all of the region’s states except Massachusetts and Rhode Island and is intended to maintain current CO2 emissions levels from electricity generation through 2015, and then reduce them 10% by 2019.44
0
200
400
600
800
1000
1200
1990
1992
1994
1996
1998
2000
2002
2004
Lb/MWhr
44 Massachusetts and Rhode Island did not sign the RGGI agreement. Massachusetts has a greenhouse gas emission reduction program already in place; and while New Hampshire signed the agreement, the legislature failed to implement it.
Figure 3 – New England Generating Plant CO2 Emission Trend
Source: Energy Information Administration, U.S. Department of Energy
Millstone nuclear units offline
Restructuring Initiated

19
III. State Retail Markets Five of the six New England states initiated electric industry restructuring at the retail level in the late 1990s – a process that continues to this day. This section provides an overview of the restructuring process in each state followed by a simplified estimation of the consumer economic impacts that have accrued through 2005. Brief summaries of state mandated consumer funded electricity efficiency and renewable generation programs are included the Appendix. General As shown in Figure 4, the key catalyst for restructuring in New England was the persistently high cost of electricity which was both putting the region’s industry at a competitive disadvantage and burdening family budgets. Prior to restructuring, electricity prices in the region were up to 69% above the national average primarily due to the lack of indigenous fuel sources, over dependence on fossil fuel imports, higher than average prices for labor and transportation, and expensive capital investments and IPP/PURPA contracts. Since then (through 2005), the difference between the national average price of electricity and New England’s has narrowed in each state (between 4-21%) with the exception of Massachusetts (which increased 3%). The reality of being located at the “end of the energy pipeline” is also evident in Figure 4, as all of the most expensive states except California are located in the northeast.
69%62%
53% 53% 53%48%
42%38%
16%
38%
NH NY CT NJ RI MA VT CA ME PA
Source: Energy Information Administration, U.S. Department of Energy
Figure 4 – Top Ten States with the Highest Electricity Rates (1996)
(Percent above national average)
20
All of the New England states except Vermont initiated restructuring to lower the price of electricity by introducing competition into the electricity generation portion of the industry and by providing customers the opportunity to choose their retail electricity supplier. 45 It is important to note that there was no federal legislation or national policy framework for retail electricity restructuring – only a series of rulemaking actions by FERC to create competitive wholesale markets and to provide open access to the transmission system. Conversely, a clear national policy was in place for the restructuring and deregulation efforts of other industries including the trucking, railroad, telecommunications, airline and banking industries that occurred over the past 20 years. As a result, the restructuring of the electric utility industry at the retail level has been accomplished on an ad hoc state-by-state basis with inconsistent policies and standards. 46 While the New England states adopted differing restructuring approaches and timetables, all the state restructuring policies essentially “unbundled” electricity service into three components — generation, transmission and distribution. Generation companies now compete in a deregulated wholesale electricity market, while distribution companies (essentially the remnants of the formerly vertically integrated utilities) continue to operate as state-regulated monopolies. Transmission is regulated by FERC. Distribution utilities are required to procure power from the wholesale market for customers not choosing a competitive supplier. In short, state commissions now regulate only the rates of the distribution companies – approximately 20 - 40% of a customer’s bill. Nevertheless, states indirectly impact wholesale market generation infrastructure development significantly through siting requirements and environmental policies. Common Regional Retail Restructuring Features Rhode Island and Massachusetts were the first two states in the region to implement restructuring in 1998, followed by Maine and Connecticut in 2000. New Hampshire’s electric utilities restructured at different times beginning in 1998 with the largest utility implementing restructuring in 2001.47 There are several common features, which serve as a platform for assessing and comparing the progress of restructuring within the New England region, which are summarized in Table 4 and discussed below.
Divestiture of Generation Assets/Creation of Merchant Plants: To avoid a concentration of market power and to minimize transition costs, most electric utilities were “encouraged”, if not mandated, to divest their generation assets in an auction
45 Vermont is the only state in the Northeast that has not restructured. The Vermont Public Service Board recommended restructuring in 1996. However, a major obstacle was found to be the very high level of stranded costs from must-take power contracts. 46 Besides the New England states, a dozen others and the District of Columbia have also restructured including New Jersey, Delaware, Illinois, Oregon, Texas, Arizona, Maryland, New York, Pennsylvania, Michigan, Virginia, Ohio. 47 The New Hampshire Legislature enacted a statute which directed the Public Utilities Commission to develop a statewide restructuring plan to implement electric retail choice for all customers by January 1998. The Commission issued its plan in 1997 although its implementation was slowed by subsequent litigation that constrained the Commission to consider only voluntary filings of settlement agreements or compliance plans. As a result, electric utilities in New Hampshire restructured at different times and in somewhat different ways.

21
process in exchange for the right to recover “stranded costs” such as capital and contractual costs incurred under the old regulatory system. As a result, most generating facilities now operate on a “merchant basis” and the financial risk has largely, if not completely, shifted from the consumer to the owners of the plants. The Public Service Company of New Hampshire is the only utility within the restructured states that has not divested all of its generating facilities (while it sold its share of the Seabrook Nuclear Power Station, it has not divested fossil and hydropower facilities).
Allowance of Transition Costs into Rates: Transition costs (also referred to as “stranded
costs”) are the generation investments and contractual cost of utilities that were approved by regulators prior to restructuring, which would have been recovered at fixed rates over time under the old regulatory system. Post restructuring, transition costs minus the sale price of utilities’ generating plants were allowed to be recovered over time through a consumer bill charge. In many cases, generating plants were sold at above book value prices which reduced transition costs paid by consumers (but may have put the new owners in financial jeopardy as discussed elsewhere in this paper).
Retail Choice of Power Supplier or Standard Offer Service: All consumers were given
the option to choose their electricity supplier. Those not choosing a retail supplier were provided standard offer service, which is the electricity purchased by local distribution companies on behalf of its customers. The standard offer period was established to allow for the orderly transition from a fully regulated to a more competitive electric industry structure.
Mandated Rate Reductions: Three states mandated that rate discounts be incorporated
into standard offer service for a set period of time. In Massachusetts, this amounted to a 15% total bill reduction based on 1997 rates adjusted for inflation. In Connecticut, the statute required that standard offer service be 10% below the rates that were in effect on December 31, 1996. In New Hampshire rate reductions were utility-specific averaging about 15% compared to rates prior to restructuring. Rhode Island did not mandate a rate reduction, but required rates to be frozen at 1996 rates. Maine did not require a specific rate reduction.
Consumer-funded Programs for Efficiency and Renewables: All the states mandated
consumer-funding to ensure electricity efficiency programs continued in the post-restructured markets. Massachusetts, Connecticut and Rhode Island also mandated the development of consumer-funded renewable energy generation development funds. In addition, all the states except New Hampshire required the establishment of renewable portfolio standards to “theoretically ensure” a certain percentage of renewable energy generation would be included in the state’s fuel mix. As summarized in the Appendix, these programs are state regulated and are not considered elements of restructured markets (although they can and do influence the overall performance of the markets).

22
Table 4 Overview of New England State Restructuring Legislation
Consumer-Funded Programs
(3) Legislation (Date of Implementation)
Plant Divestiture (1)
Initial Mandated Rate Caps/ Reductions (2)
Electricity Efficiency
Renewable Development
Renewable Portfolio Standard (4)
Connecticut Electric Restructuring Act of 1998 and 2003 (July 2000)
X 10% below 1996 rates, subject to adjustment
X X X
Massachusetts Electric Restructuring Act of 1997 (March 1998)
X 15% below 1997 rates, subject to adjustment
X X X
Maine Electric Industry Restructuring Act of 1997 (March 2000)
X None X -- X
New Hampshire Electric Industry Act of 1996 (Utility-by-Utility basis from 1998 to 2003)
Partial (nuclear, but not fossil or hydro)
Averaging 15% below pre-restructuring rates
X -- --
Rhode Island Utility Restructuring Act of 1996 (January 1998)
X Frozen at 1996 rates, subject to adjustment
X X X
(1) To avoid a concentration of market power and to minimize transition costs, electric utilities were encouraged or mandated to divest or sell their generation assets (power plants) according to differing timeframes established by the states.
(2) Some states mandated rate reductions or price caps to ensure consumer savings during the transition to full retail competition and to insulate consumers from volatile wholesale market price fluctuations during the initial stages of competitive market development. The expectation was that a majority of customers would eventually switch to competitive suppliers by the end of the rate reduction period. When this did not occur in some states, these periods were extended.
(3) These programs differ by state and are funded through special charges on all consumer electricity bills. (4) Requires a certain percentage of electricity supply to be provided by renewable generation sources – which
differ by state.

23
Retail Marketplace Consumer Prices Retail Pricing Drivers and Assessment. Through state administered rate reductions and utility supply procurement requirements and competitive wholesale market forces, all classes of electricity consumers have benefited economically from restructuring. Throughout the standard offer service periods, electricity rates in several states decreased or were kept fairly stable despite unprecedented increases in the cost of oil and natural gas through long-term, fixed-priced contracts that utilities negotiated (fuel price adjustments were passed on to customers in some states with the approval of state regulatory commissions). Quantifying the economic impacts of electricity restructuring is not a simple exercise – given the diverse factors that should be considered (such as environmental regulations, fossil fuel prices, wholesale market rules and procedures, increased electricity demand, etc.) as well as a prognostication of what retail prices would have been under a continued regulated industry. To date, such an analysis has not been undertaken for New England and those performed by individual states in the early years of restructuring are now outdated. First order calculations were performed from two different perspectives – both of which include an indeterminate amount of savings from the wholesale markets (see previous discussion in Section II) that were passed on to the retail market:
Region-wide estimation. On a nominal basis, New England-wide savings were estimated by comparing the actual weighted average regional retail rates as reported by the U.S. Energy Information Administration against a projection of what they would have been under a continued regulated industry structure from 1998 through 2005 (based on where average retail electricity prices were trending pre-restructuring).48
State-by-state estimation. A similar calculation applying the same methodology as above
was performed on a state-by-state basis, for the years since restructuring was initiated in each state.
Regional Economic Impact Quantification. Figure 5 shows a comparison of the actual retail prices of electricity in comparison to a projection of what they may have been without restructuring in the region.49 The projection is both simple and conservative in that it is a continuation of the pricing trends that prevailed during the early and mid-1990s. This estimate quantifies about $7.6 billion in cumulative, region wide, consumer savings since restructuring efforts began. Note in Figure 5, that a substantial portion of the savings were accrued in the early years of restructuring as the compounding influence of numerous wholesale market drivers has, at least for the present, changed the course of retail pricing.
48 Massachusetts, Rhode Island, and a portion of New Hampshire’s retail markets were restructured in 1998. For purposes of this analysis, that year marks the beginning of when economic impacts from restructuring started. 49 The projection of the retail price under continued regulated utility operation is based on the weighted average price trend from 1990 through 1997, after which restructuring was initiated at different times in each state and in the wholesale market in 1999. From the trend, a compounded annual rate of increase in the retail price was calculated at 1.6% and linearly projected forward. Given all of the external factors that have influenced the market since 2000, this projection was considered conservative.

24
6789
1011121314
1990 1992 1994 1996 1998 2000 2002 2004
¢/kWhr
State-by-State Economic Impact Quantification. Summarized below are the estimated economic impacts from restructuring using the same methodology discussed above for the period of retail restructuring in each state. Notwithstanding the difference in electricity demand between the New England states, the spread of savings across the region is significant and reflects the ad hoc basis in which restructuring was implemented. The savings range from about $3.4 billion in Massachusetts to slightly better than “break even” in Maine. Savings for Vermont were also calculated as that state has benefited from wholesale market savings as well as other asset divestitures as discussed below. Combined, state cumulative savings total about $6.5 billion, which is not surprisingly different (about 15%) than the regional estimate presented above given the differences in timeframes and estimated trend calculations (before restructuring). The regional and total state savings values are close enough, however, to provide some measure of confidence that consumers have accrued a significant amount of savings from electricity industry restructuring.
Massachusetts: Consumers on standard offer service were guaranteed a 15% savings from 1997 electricity prices (off the entire bill adjusted for inflation). From 1998 through 2000, for example, average electricity rates in the state decreased each year.50 Thereafter, state regulators allowed standard offer prices to be adjusted to include wholesale market price increases. Over the 7-year transition period from 1998 to 2005, there were significant savings for consumers who stayed on standard offer service for either part or all of the period. Massachusetts consumers in total have saved about $3.4 billion.51
50Average electricity rates in Massachusetts decreased from 10.48 cents per kWh in 1997 to 8.99 cents per kWh in 1999. 51 The projection of the average retail price under continued regulated utility operation is based on the price trend from 1990 through 1997 reported by the U.S. Energy Information Administration (EIA). An annual rate of increase in the retail price was calculated at 1.6% beginning in 1998 and linearly projected forward. Savings were based on total retail sales during that period reported by EIA.
Figure 5 – Average New England Retail Electricity Rates
Source: Energy Information Administration, U.S. Department of Energy
Estimated trend w/o restructuring
Actual trend

25
Connecticut: The restructuring statute required that utility standard offer service be set at 10% below the 1996 rates and remain at that level from 2000 until year-end 2003. A “retail adder”, that is, an estimate of the cost that retail suppliers would incur to provide electric service to each class of consumer was added to this price (about one cent per kWh). The Revised Electric Restructuring bill signed into law in 2003 created the Transitional Standard Offer (TSO) beginning in 2004 through December 2006, which required utilities to rebid their supply contracts. The TSO does not include the “retail adder”, but does include federally mandated congestion charges (from the implementation of SMD in the wholesale markets discussed in Section II).52 Between 2000 and 2005, it is estimated that consumers have saved between $700 million and $1.5 billion from restructuring.53 This wide range reflects additional consumer savings from electricity rate decreases that occurred a few years prior to retail competition initiation – reductions that are likely attributable to the initiation of the competitive wholesale market in 1999 and utility cost cutting measures implemented in anticipation of restructuring.54
Rhode Island: While there was no mandated reduction, the standard offer was initially
set to equal the price of electricity paid by customers in September 1996, decreasing average retail rates through 2000.55 Thereafter, Rhode Island regulators approved standard offer rate increases for inflation and wholesale market adjustments. Between 1998 and 2005, it was estimated that consumers saved approximately $610 million.56
Maine: The state’s restructuring legislation did not mandate price caps or rate
reductions. The Maine Public Utilities Commission (PUC) initiated a bidding process to choose firms for securing utility standard offer service. At times, the PUC refused to accept bids that would have resulted in higher rates. Therefore, consumer savings have been accrued as a result of state regulatory intervention – and from wholesale market efficiencies reflected in the market-based contracts. Average retail electricity rates went down during the first year of restructuring then increased in 2001 and 2002 – most likely from natural gas price increases – and then dramatically decreased through 2005. Maine in general has lower wholesale costs than other zones in New England (see Section II on
52 “Docket No. 05-11-05, DPUC Monitoring the State of Competition in the Electric Industry,” February 22, 2006. 53 The projection of the average retail price under continued regulated utility operation is based on the price trend from 1990 through 1999 reported by the U.S. Energy Information Administration (EIA). An annual rate of increase in the retail price was calculated at 1.8% beginning in 2000 and linearly projected forward. Savings were based on total retail sales during that period reported by EIA. 54 Average retail electricity prices in Connecticut decreased from 10.52 cents per kWh in 1997 to 9.52 cents per kWh in 2000 – and remained at approximately that price level until 2003 when adjustments for wholesale market changes were made (when utilities rebid supply contracts) and congestion costs where added due to implementation of SMD in the wholesale market. 55 Average retail electricity prices decreased in 1998 from 10.7 cents per kWh to 9.59, and again to 9.02 cents per kWh in 1999. 56 The projection of the average retail price under continued regulated utility operation is based on the price trend from 1990 through 1997 reported by the Energy Information Administration (EIA). An annual rate of increase in the retail price was calculated at 1.2% beginning in 1998 and linearly projected forward. Savings were based on total retail sales during that period reported by EIA.
26
locational marginal pricing). Over the entire period since restructuring, consumers savings are estimated to be about “break even”.57
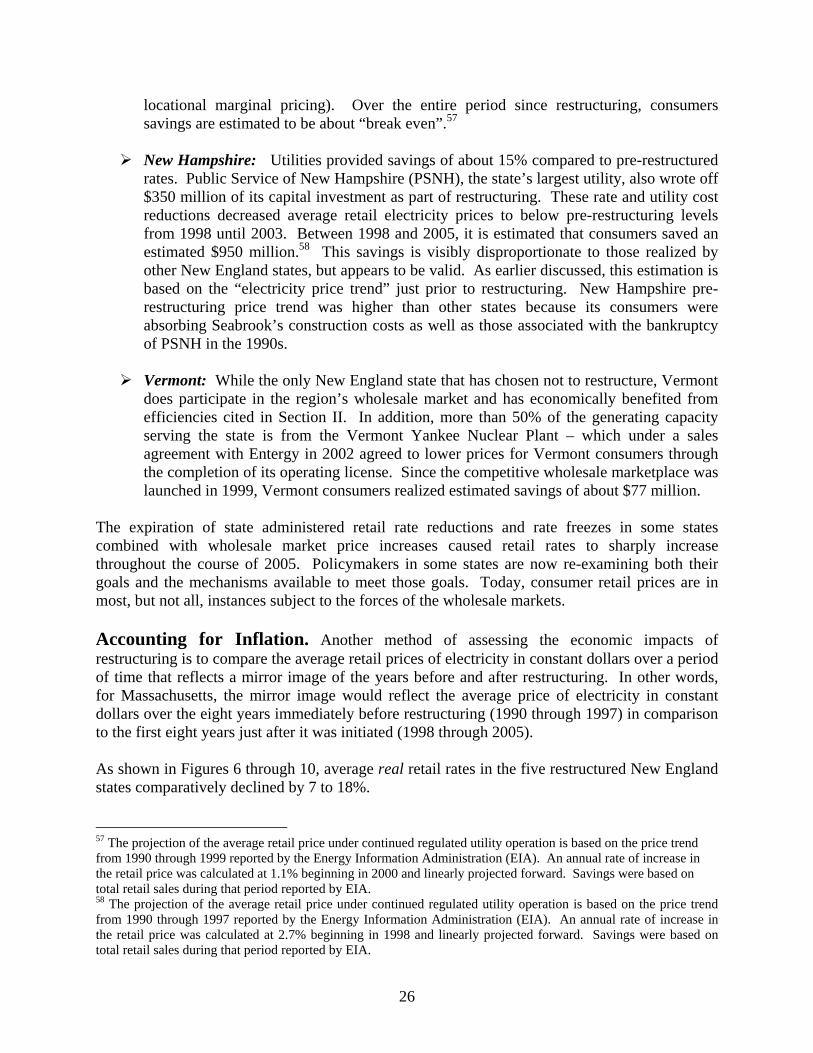
New Hampshire: Utilities provided savings of about 15% compared to pre-restructured
rates. Public Service of New Hampshire (PSNH), the state’s largest utility, also wrote off $350 million of its capital investment as part of restructuring. These rate and utility cost reductions decreased average retail electricity prices to below pre-restructuring levels from 1998 until 2003. Between 1998 and 2005, it is estimated that consumers saved an estimated $950 million.58 This savings is visibly disproportionate to those realized by other New England states, but appears to be valid. As earlier discussed, this estimation is based on the “electricity price trend” just prior to restructuring. New Hampshire pre-restructuring price trend was higher than other states because its consumers were absorbing Seabrook’s construction costs as well as those associated with the bankruptcy of PSNH in the 1990s.
Vermont: While the only New England state that has chosen not to restructure, Vermont
does participate in the region’s wholesale market and has economically benefited from efficiencies cited in Section II. In addition, more than 50% of the generating capacity serving the state is from the Vermont Yankee Nuclear Plant – which under a sales agreement with Entergy in 2002 agreed to lower prices for Vermont consumers through the completion of its operating license. Since the competitive wholesale marketplace was launched in 1999, Vermont consumers realized estimated savings of about $77 million.
The expiration of state administered retail rate reductions and rate freezes in some states combined with wholesale market price increases caused retail rates to sharply increase throughout the course of 2005. Policymakers in some states are now re-examining both their goals and the mechanisms available to meet those goals. Today, consumer retail prices are in most, but not all, instances subject to the forces of the wholesale markets. Accounting for Inflation. Another method of assessing the economic impacts of restructuring is to compare the average retail prices of electricity in constant dollars over a period of time that reflects a mirror image of the years before and after restructuring. In other words, for Massachusetts, the mirror image would reflect the average price of electricity in constant dollars over the eight years immediately before restructuring (1990 through 1997) in comparison to the first eight years just after it was initiated (1998 through 2005). As shown in Figures 6 through 10, average real retail rates in the five restructured New England states comparatively declined by 7 to 18%. 57 The projection of the average retail price under continued regulated utility operation is based on the price trend from 1990 through 1999 reported by the Energy Information Administration (EIA). An annual rate of increase in the retail price was calculated at 1.1% beginning in 2000 and linearly projected forward. Savings were based on total retail sales during that period reported by EIA. 58 The projection of the average retail price under continued regulated utility operation is based on the price trend from 1990 through 1997 reported by the Energy Information Administration (EIA). An annual rate of increase in the retail price was calculated at 2.7% beginning in 1998 and linearly projected forward. Savings were based on total retail sales during that period reported by EIA.

27
Figure 7 – Massachusetts Inflation Adjusted Average Retail Electricity Prices
(14% reduction)
Source: Energy Information Administration, U.S. Department of Energy
Source: Energy Information Administration, U.S. Department of Energy
Figure 8 – Maine Inflation Adjusted Average Retail Electricity Prices
(7% reduction)
Figure 6 – Connecticut Inflation Adjusted Average Retail Electricity Prices
(15% reduction)
Source: Energy Information Administration, U.S. Department of Energy
12.8 ¢/kWhr 10.9 ¢/kWhr
Pre-restructuring (1994 – 1999)
Post-restructuring (2000 – 2005)
13.2 ¢/kWhr 11.4 ¢/kWhr
Pre-restructuring (1990 – 1997)
Post-restructuring (1998 – 2005)
11.9 ¢/kWhr 11.1 ¢/kWhr
Pre-restructuring (1994 – 1999)
Post-restructuring (2000 – 2005)
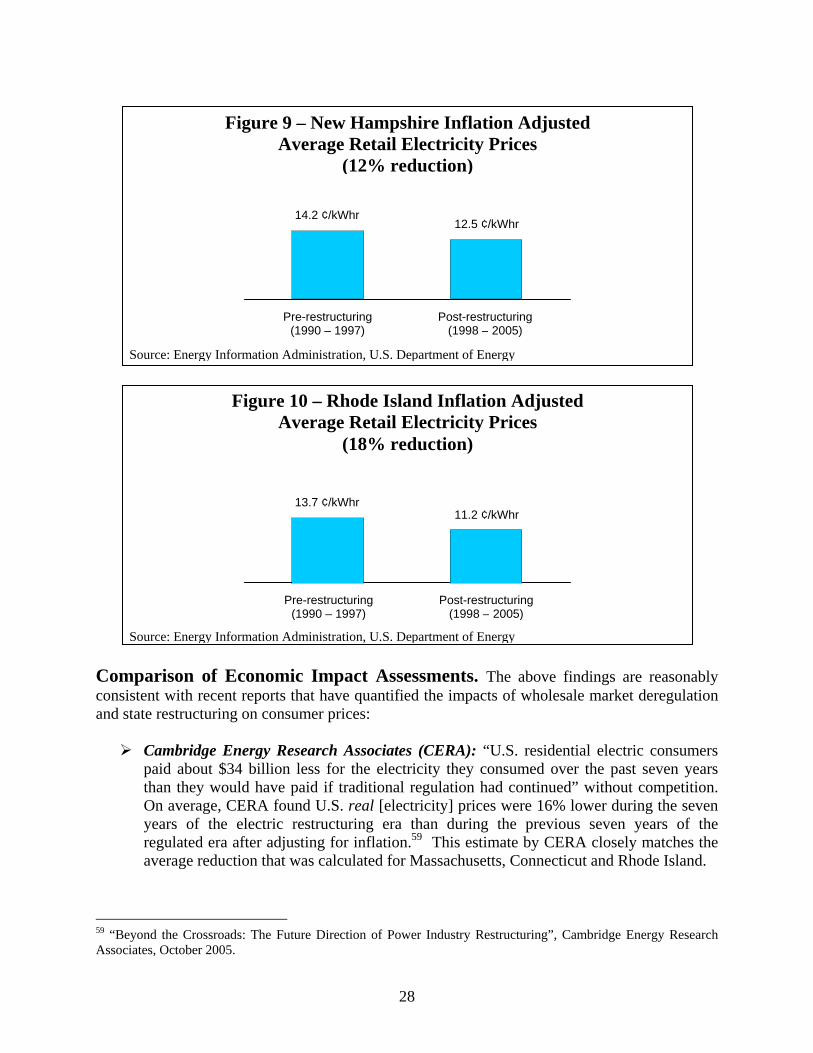
28
Comparison of Economic Impact Assessments. The above findings are reasonably consistent with recent reports that have quantified the impacts of wholesale market deregulation and state restructuring on consumer prices:
Cambridge Energy Research Associates (CERA): “U.S. residential electric consumers paid about $34 billion less for the electricity they consumed over the past seven years than they would have paid if traditional regulation had continued” without competition. On average, CERA found U.S. real [electricity] prices were 16% lower during the seven years of the electric restructuring era than during the previous seven years of the regulated era after adjusting for inflation.59 This estimate by CERA closely matches the average reduction that was calculated for Massachusetts, Connecticut and Rhode Island.
59 “Beyond the Crossroads: The Future Direction of Power Industry Restructuring”, Cambridge Energy Research Associates, October 2005.
Figure 9 – New Hampshire Inflation Adjusted Average Retail Electricity Prices
(12% reduction)
Source: Energy Information Administration, U.S. Department of Energy
Source: Energy Information Administration, U.S. Department of Energy
Figure 10 – Rhode Island Inflation Adjusted Average Retail Electricity Prices
(18% reduction)
13.7 ¢/kWhr 11.2 ¢/kWhr
Pre-restructuring (1990 – 1997)
Post-restructuring (1998 – 2005)
14.2 ¢/kWhr 12.5 ¢/kWhr
Pre-restructuring (1990 – 1997)
Post-restructuring (1998 – 2005)

29
New York Public Service Commission: A self produced report found that the total inflation adjusted electric price for a typical residential retail customer in New York including supply and delivery charges has dropped by an average of 16% between 1996 and 2004.60 This reduction also closely matches the average reductions estimated for Massachusetts, Connecticut and Rhode Island – another reasonable comparison given the close proximity of the states.
Global Energy Decisions: “Competitive wholesale power markets in the Eastern
Interconnection (comprising a significant area containing eight of the nation’s ten North American Electricity Reliability Councils) produced over $15 billion in consumer savings during 1999 – 2003, compared to what would have realized under the traditional regulated utility environment without competition”. This study found the operating efficiency of power plants to increase dramatically – from reduced refueling outages, improved capacity factors and reliability – providing substantial economic benefits – similar to those discussed in Section II regarding New England’s increased wholesale market efficiencies.61
Associated Industries of Massachusetts: Focused on a single state, this report (covering
the period through 2004) found that passage of the Massachusetts Electricity Restructuring Act in 1997 was steadily leading to significant economic benefits for all classes of consumers – particularly for those who stayed on standard offer service for either part of or all of the seven year transition period – with estimated savings of at least $2.3 billion. Factoring in 2005 savings as well as those attributed to all consumers from increased efficiencies of the wholesale markets since the competitive markets were introduced in 1999, total savings closely match the $3.4 billion savings estimated for all Massachusetts consumers above.62
Retail Market Competition and Consumer Choice Vibrancy of Competition & Choice. A key goal of restructuring was to provide consumers with “choice,” which is the option to purchase electricity from a competitive supplier. The states that initiated restructuring opened up electricity markets to competitive suppliers under the premise that competition would benefit all classes of consumers through better prices (as discussed above), services and technologies. Since restructuring, the level of competition remains decidedly limited in the residential sector as shown in Tables 5 and 6 with more robust competition in the commercial and industrial sectors.
60 “Staff Report on the State of Competitive Energy Markets: Progress to Date and Future Opportunities”, March 2006. 61 “Putting Competitive Power Markets to the Test, The Benefits of Competition in America’s Grid: Cost Savings and Operating Efficiencies”, Global Energy Decisions, LLC, July 2005. 62 “Electric Industry Restructuring in Massachusetts”, prepared by Polestar Communications & Strategic Analysis for The AIM Foundation, December 2005.
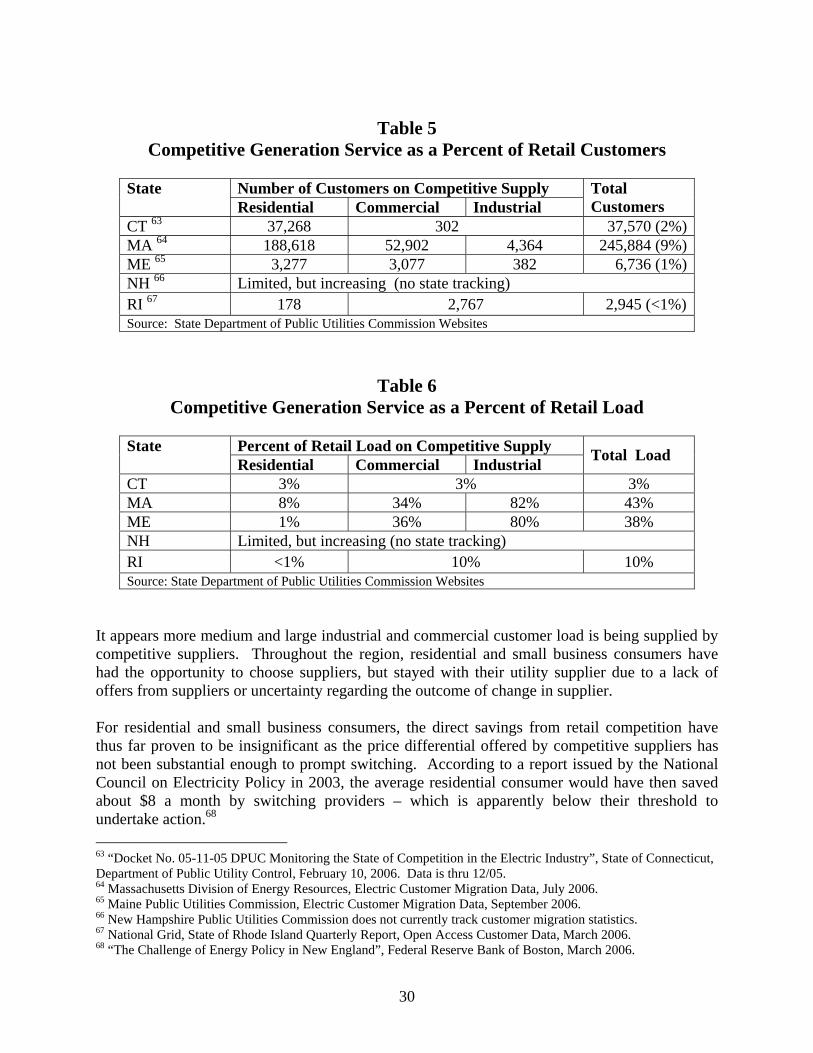
30
Table 5
Competitive Generation Service as a Percent of Retail Customers
Number of Customers on Competitive Supply State Residential Commercial Industrial
Total Customers
CT 63 37,268 302 37,570 (2%)MA 64 188,618 52,902 4,364 245,884 (9%)ME 65 3,277 3,077 382 6,736 (1%)NH 66 Limited, but increasing (no state tracking) RI 67 178 2,767 2,945 (<1%)Source: State Department of Public Utilities Commission Websites
Table 6 Competitive Generation Service as a Percent of Retail Load
Percent of Retail Load on Competitive Supply State
Residential Commercial Industrial Total Load
CT 3% 3% 3% MA 8% 34% 82% 43% ME 1% 36% 80% 38% NH Limited, but increasing (no state tracking) RI <1% 10% 10% Source: State Department of Public Utilities Commission Websites
It appears more medium and large industrial and commercial customer load is being supplied by competitive suppliers. Throughout the region, residential and small business consumers have had the opportunity to choose suppliers, but stayed with their utility supplier due to a lack of offers from suppliers or uncertainty regarding the outcome of change in supplier. For residential and small business consumers, the direct savings from retail competition have thus far proven to be insignificant as the price differential offered by competitive suppliers has not been substantial enough to prompt switching. According to a report issued by the National Council on Electricity Policy in 2003, the average residential consumer would have then saved about $8 a month by switching providers – which is apparently below their threshold to undertake action.68 63 “Docket No. 05-11-05 DPUC Monitoring the State of Competition in the Electric Industry”, State of Connecticut, Department of Public Utility Control, February 10, 2006. Data is thru 12/05. 64 Massachusetts Division of Energy Resources, Electric Customer Migration Data, July 2006. 65 Maine Public Utilities Commission, Electric Customer Migration Data, September 2006. 66 New Hampshire Public Utilities Commission does not currently track customer migration statistics. 67 National Grid, State of Rhode Island Quarterly Report, Open Access Customer Data, March 2006. 68 “The Challenge of Energy Policy in New England”, Federal Reserve Bank of Boston, March 2006.
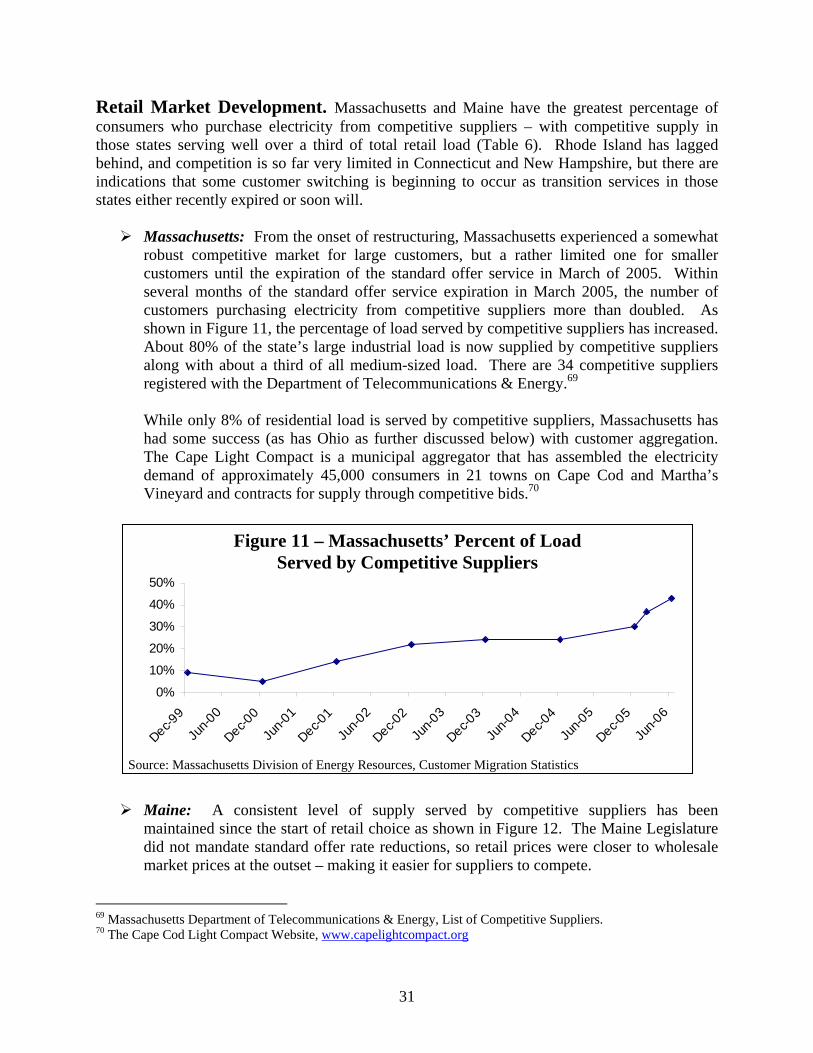
31
Retail Market Development. Massachusetts and Maine have the greatest percentage of consumers who purchase electricity from competitive suppliers – with competitive supply in those states serving well over a third of total retail load (Table 6). Rhode Island has lagged behind, and competition is so far very limited in Connecticut and New Hampshire, but there are indications that some customer switching is beginning to occur as transition services in those states either recently expired or soon will.
Massachusetts: From the onset of restructuring, Massachusetts experienced a somewhat robust competitive market for large customers, but a rather limited one for smaller customers until the expiration of the standard offer service in March of 2005. Within several months of the standard offer service expiration in March 2005, the number of customers purchasing electricity from competitive suppliers more than doubled. As shown in Figure 11, the percentage of load served by competitive suppliers has increased. About 80% of the state’s large industrial load is now supplied by competitive suppliers along with about a third of all medium-sized load. There are 34 competitive suppliers registered with the Department of Telecommunications & Energy.69 While only 8% of residential load is served by competitive suppliers, Massachusetts has had some success (as has Ohio as further discussed below) with customer aggregation. The Cape Light Compact is a municipal aggregator that has assembled the electricity demand of approximately 45,000 consumers in 21 towns on Cape Cod and Martha’s Vineyard and contracts for supply through competitive bids.70
0%
10%
20%
30%
40%
50%
Dec-99
Jun-0
0
Dec-00
Jun-0
1
Dec-01
Jun-0
2
Dec-02
Jun-0
3
Dec-03
Jun-0
4
Dec-04
Jun-0
5
Dec-05
Jun-0
6
Maine: A consistent level of supply served by competitive suppliers has been maintained since the start of retail choice as shown in Figure 12. The Maine Legislature did not mandate standard offer rate reductions, so retail prices were closer to wholesale market prices at the outset – making it easier for suppliers to compete.
69 Massachusetts Department of Telecommunications & Energy, List of Competitive Suppliers. 70 The Cape Cod Light Compact Website, www.capelightcompact.org
Source: Massachusetts Division of Energy Resources, Customer Migration Statistics
Figure 11 – Massachusetts’ Percent of Load Served by Competitive Suppliers
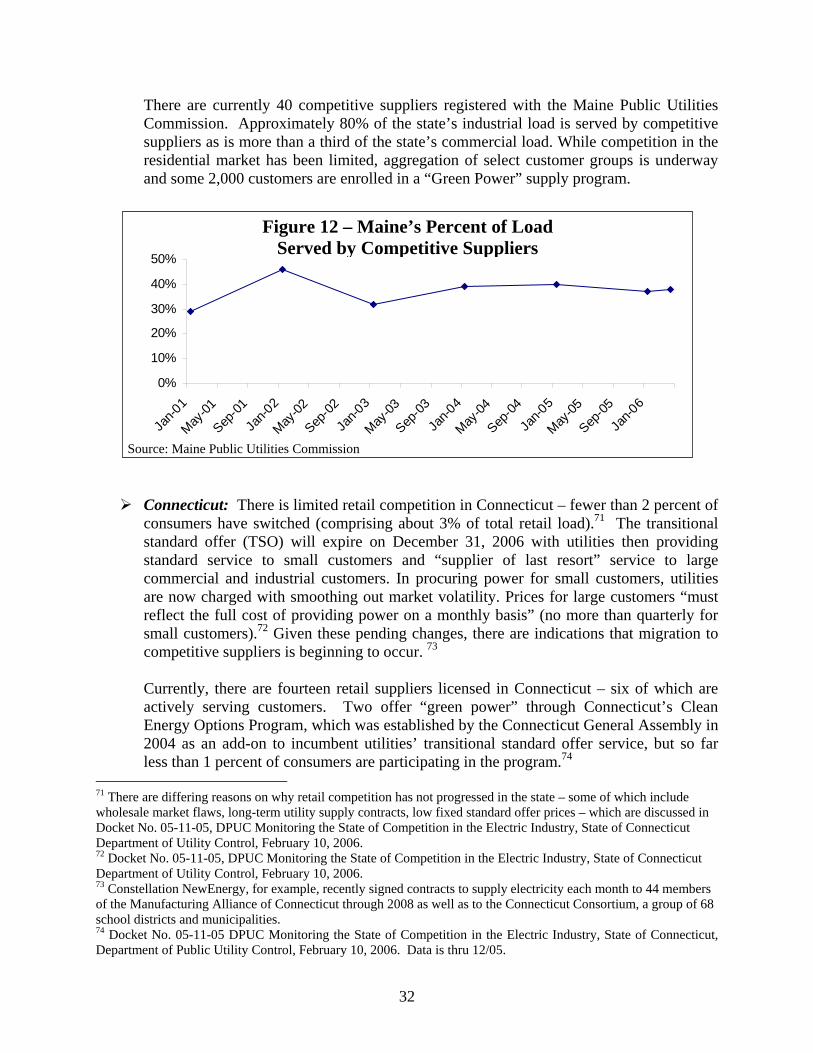
32
There are currently 40 competitive suppliers registered with the Maine Public Utilities Commission. Approximately 80% of the state’s industrial load is served by competitive suppliers as is more than a third of the state’s commercial load. While competition in the residential market has been limited, aggregation of select customer groups is underway and some 2,000 customers are enrolled in a “Green Power” supply program.
0%
10%
20%
30%
40%
50%
Jan-0
1
May-01
Sep-01
Jan-0
2
May-02
Sep-02
Jan-0
3
May-03
Sep-03
Jan-0
4
May-04
Sep-04
Jan-0
5
May-05
Sep-05
Jan-0
6
Connecticut: There is limited retail competition in Connecticut – fewer than 2 percent of consumers have switched (comprising about 3% of total retail load).71 The transitional standard offer (TSO) will expire on December 31, 2006 with utilities then providing standard service to small customers and “supplier of last resort” service to large commercial and industrial customers. In procuring power for small customers, utilities are now charged with smoothing out market volatility. Prices for large customers “must reflect the full cost of providing power on a monthly basis” (no more than quarterly for small customers).72 Given these pending changes, there are indications that migration to competitive suppliers is beginning to occur. 73 Currently, there are fourteen retail suppliers licensed in Connecticut – six of which are actively serving customers. Two offer “green power” through Connecticut’s Clean Energy Options Program, which was established by the Connecticut General Assembly in 2004 as an add-on to incumbent utilities’ transitional standard offer service, but so far less than 1 percent of consumers are participating in the program.74
71 There are differing reasons on why retail competition has not progressed in the state – some of which include wholesale market flaws, long-term utility supply contracts, low fixed standard offer prices – which are discussed in Docket No. 05-11-05, DPUC Monitoring the State of Competition in the Electric Industry, State of Connecticut Department of Utility Control, February 10, 2006. 72 Docket No. 05-11-05, DPUC Monitoring the State of Competition in the Electric Industry, State of Connecticut Department of Utility Control, February 10, 2006. 73 Constellation NewEnergy, for example, recently signed contracts to supply electricity each month to 44 members of the Manufacturing Alliance of Connecticut through 2008 as well as to the Connecticut Consortium, a group of 68 school districts and municipalities. 74 Docket No. 05-11-05 DPUC Monitoring the State of Competition in the Electric Industry, State of Connecticut, Department of Public Utility Control, February 10, 2006. Data is thru 12/05.
Source: Maine Public Utilities Commission
Figure 12 – Maine’s Percent of Load Served by Competitive Suppliers

33
Rhode Island: There has been limited customer switching to competitive suppliers,
almost all of which has been done in the commercial and industrial sectors, comprising approximately 10% of the load of those sectors combined. Ninety-nine percent of customers continue to purchase electricity from local distribution companies. With regulated standard offer service not scheduled to expire until 2020, it is unlikely that this situation will substantially change in the near-term.
New Hampshire: No customer migration statistics are currently compiled by the state as
minimal customer switching to competitive suppliers has occurred. However, according to the Public Utility Commission, there are indications that customer switching to competitive suppliers is gaining momentum among large customers as transition standard offer service offered by Unitil and Granite State recently expired.75 Some large commercial and industrial consumers have noted that they prefer the tailored contracts offered by competitive suppliers compared to utility “one-size-fits-all” approach to service.76 There are five competitive suppliers registered with the New Hampshire Public Utilities Commission.
Retail Competition in Other States. New England’s experience with retail competition is similar, and in some cases, better than other restructured states. For example, the customer switching statistics for New York are similar to those of Massachusetts’ – 7% of residential customers have switched to competitive suppliers and 43% of commercial and industrial customers. And with 58% of large non-residential load on competitive service, New York is viewed as having succeeded in building a market for competitive service.77 In New Jersey and Michigan, total consumer load served by competitive suppliers is 15 and 12%, both lower than Maine and Massachusetts. The more successful states have taken different approaches to develop their retail markets. Ohio’s legislation emphasized the establishment of municipal aggregation, which allows a municipality, county or other local branch of government to assemble the electricity demand of all or a part of the consumers and contract for supply through a competitive bid process. Citizens of the aggregating entity become part of the buying group unless they “opt-out”.78 This has resulted in more than 20% of Ohio’s residential consumers purchasing electricity from competitive suppliers through aggregators. Texas is generally viewed as among the most successful state in terms of developing a competitive retail marketplace.79 Since retail markets opened in 2002, at least 15% of residential, 20% of commercial and 38% of large consumers have switched to competitive suppliers. Texas adopted a retail competition program modeled after the one in United Kingdom 75 Telephone discussion with New Hampshire Public Utilities Commission staff, May 4, 2006. 76 “New Hampshire’s Competitive Market is Taking Off”, Restructuring Today, April 20, 2006. 77 “Retail Electric Competition in New York”, the Analysis Group for Constellation New Energy, August 2005. 78 “A Test of the Results of Electricity Deregulation”, Wall Street Journal, March 1, 2005. 79 A study by the Perryman Group titled “Electric Competition: Four Years of Cost Savings and Economic Benefits for Texas and Texans”, April 2006, concluded that since the introduction of retail competition in Texas’ electric market, Texans have realized substantial savings compared to what they would have paid in a regulated environment – approximately $3.6 billion in 2005 alone.

34
wherein utility transitional service is set at prices at or above wholesale market levels – creating sufficient economic margins to allow suppliers to be competitive. The Texas model also provides utilities with incentives to shift retail customers to competitive suppliers.

35
IV. Infrastructure in Restructured Markets The future performance of the region’s competitive markets is dependent on the availability of adequate infrastructure. Yet, for at least the remainder of this decade, New England faces an infrastructure shortfall in maintaining a reliable and affordable supply of electricity, which is vital for economic growth and prosperity.80 Specifically, the region as a whole needs additional supply to keep pace with increasing electricity demand. Moreover, the region has become heavily dependent on natural gas to fuel electricity generating plants and seems poised to become even more so even though supplies of this commodity are not keeping pace with demand. Several unique characteristics of electricity as an industry and commodity have contributed to this situation. Infrastructure investment ideally should be prompted and guided by wholesale markets but is often driven by individual state regulations and influenced by retail market programs (mandated by state legislatures). In addition, even in a properly functioning electricity market, the time required for traditional market forces to adjust a supply and demand imbalance may not be quick enough to maintain consumer and political leader confidence in reliable supply of electricity. As a commodity, electricity must be generated simultaneously with demand – which fluctuates constantly. As a result, additional, or reserve, capacity must be available to compensate for planned and unpredictable generating plant outages, as well as spikes in demand. In short, the unique characteristics of electricity provide challenges unlike any of the other industries that have been deregulated and it is not surprising that some intervention to assure adequate infrastructure is needed. This paper makes no explicit recommendations regarding the type or magnitude of intervention needed. Rather it highlights the challenges that will undoubtedly drive intervention. Generally, it appears that political leadership will be required along two fronts: 1) reforms to correct imperfections in the competitive wholesale market operations and; 2) coordination to harmonize policies, programs and regulations among states throughout the region. Generation Capacity Development Wholesale Market Imperfections. The region’s current favorable supply and hence reliability situation will soon become tenuous because there is a very limited amount of generating plant construction underway and peak demand is increasing by about 500 MW per year.81 There appears to be several reasons for this pending imbalance between supply and demand which include the lack of market signals and incentives to prompt the construction of additional generating capacity before it is actually needed, and the inability of some generating plants to recover their fixed costs (and thus, the prevalence of RMR agreements in Connecticut and Massachusetts).
80 Transmission is also a serious infrastructure issue but was addressed in Section II. Moreover, there has been clear progress in addressing this infrastructure issue in comparison to those involving generating capacity and fuel diversity. 81 The approximate equivalent of one new power plant a year.
36
The intent of the recently FERC-approved “Forward Capacity Market” (formerly LICAP) settlement is to promote investment in new and existing generating resources – and help mitigate the issues listed above. Under this mandated market structure, ISO New England will project the needs of the grid three years in advance and subsequently hold an annual auction to purchase capacity resources to satisfy them – to include new and existing generating plants, alternative generating sources as well as demand-response assets. ISO New England estimates the first forward capacity auction will be held as early as February 2008 with the resources being paid in 2010. In the interim, the agreement contains a multi-year transition mechanism that will compensate new and existing resources on a monthly fixed basis beginning in December 2006, estimated to increase consumer costs by 5 to 8 percent.82 Four New England states (Vermont, Connecticut, Rhode Island and New Hampshire) signed the agreement (Massachusetts and Maine opposed it) which was approved by FERC on June 15, 2006.83 The total cost is estimated to be substantial and is thus controversial. ISO New England estimated that the original LICAP proposal would cost New England consumers about $8-10 billion between 2006 and 2010. The cost of the FCM is substantially less – estimated at about $5 billion – but still a very significant increase in the price of electricity to consumers.84 Many of the details of the FCM still need to be worked out – and will be crucial to ensuring that the goals of the capacity market are attained. Initial market reaction has been positive as proposals for 21 new power plants have come before ISO New England since February 2006.85 And while it is uncertain how many of these plants will actually be built, they do indicate an increasing amount of certainty in the marketplace in terms of obtaining an adequate return on investment in electric generating resources. State Environmental Policies. Four of the six New England states signed a memorandum of understanding with three Mid-Atlantic states to develop a regional strategy for controlling greenhouse gas emissions from electricity generation called the Regional Greenhouse Gas Initiative or RGGI.86 Central to this initiative is the development of a regional cap-and-trade program for carbon dioxide (CO2) emissions from electricity generating plants in the participating states. Massachusetts has adopted similar greenhouse gas reduction targets, but along with Rhode Island decided not to participate in RGGI. While RGGI’s strategy for controlling CO2 emissions from generating plants is still under development, model regulations to be implemented in each state have been proposed. Beginning in 2009, emissions of CO2 from power plants in the region would be capped at approximately current levels until 2015. The states would then begin reducing emissions incrementally over a four-year period to achieve a 10% reduction by 2019.87 82 “Flurry of Power Plant Proposals Offers Hope”, The Boston, Globe, September 26, 2006. 83 “ISO New England Announces Broad Stakeholder Agreement on New Capacity Market Design”, March 6, 2006. 84 “What Does the Recent LICAP Settlement Mean for New England”, Electricity Restructuring Roundtable, National Grid, April 26, 2006. 85 “Flurry of Power Plant Proposals Offers Hope”, The Boston, Globe, September 26, 2006. 86 These states include: Connecticut, Delaware, Maine, New Hampshire, New Jersey, New York, and Vermont. In addition, Maryland, the District of Columbia, Pennsylvania, the Eastern Canadian Provinces and New Brunswick are observers in the process. 87 RGGI Press Release, August 15, 2006.
37
Many energy-companies are calling for greater certainty in climate policy, so that they can better plan for climate-related impacts on electricity prices and investment decisions as these actions are likely to effect existing and future infrastructure development.88 To comply with RGGI goals, it has been estimated that major change to the existing electricity supply infrastructure will be required, including the construction of significant amounts of new renewable and natural gas-fired generation – which could potentially place unsustainable demands on natural gas supply and its associated pipeline infrastructure. For example, to meet even the most modest goal considered under RGGI, a recent study sponsored by the Nuclear Energy Institute estimated that 12,800 Megawatts of renewable generation (about 26 projects the size of “Cape-Wind”) and 5,000 Megawatts of new natural gas fired generation (approximately 20 new plants) would be required over the next 15-year period. In addition to adding these renewables and new gas-fired resources, the operating licenses for all the region’s nuclear plants would need to be renewed. At the same time, many reliable, efficient and economic coal- and oil-fired plants would be forced to close prematurely.89 Beyond those daunting challenges, actions to meet RGGI goals may be incompatible with the Forward Capacity Market. Fuel/Resource Diversity Increasing Dependence on Natural Gas. New England’s growing reliance on natural gas to fuel all new generating plants has repeatedly raised concerns about the declining fuel diversity of the region’s electricity fuel mix. Almost all of the generating plants built in New England since restructuring have been natural gas-fired because of: their low capital costs, availability of fuel supply and ability to comply with strict federal and state environmental regulations. As shown in Figure 13, in 2004 (the most recent annual data that is publicly available), 41% of the region’s electricity is generated from natural gas. Notwithstanding RGGI requirements or other factors, natural gas is expected to fuel more than 50% of the region’s generating capacity within just several years. While even a 50% slice of the fuel diversity pie is nowhere near the 70% that oil accounted for in 1970 (which economically burdened the region during the oil price shocks of the 1970s), it does increase New England’s vulnerability to supply disruptions and higher prices than other region’s that are considered economic competitors. According to ISO New England, the region’s dependence on natural gas may be even higher in certain areas due to transmission constraints and the unavailability of diverse fuel generating resources. For example, reliance on natural gas for electricity production in the Boston area is forecast to reach approximately 80% by 2010. 90
88 As noted in “New England Energy Infrastructure – Adequacy Assessment and Policy Review”, prepared for the New England Energy Alliance by the Analysis Group, November 2005. 89 New generation estimated to be required to meet the most modest goal analyzed – maintaining CO2 emissions at the 2005 level under a 10 percent conservation target (of future growth in electricity demand). From “The Role of Nuclear Energy in Reducing CO2 Emissions in the Northeastern United States”, prepared by Polestar Applied Technology, Inc. for the Nuclear Energy Institute, May 2005. 90 ISO New England Attachment to “New England Natural Gas Infrastructure”, Federal Energy Regulatory
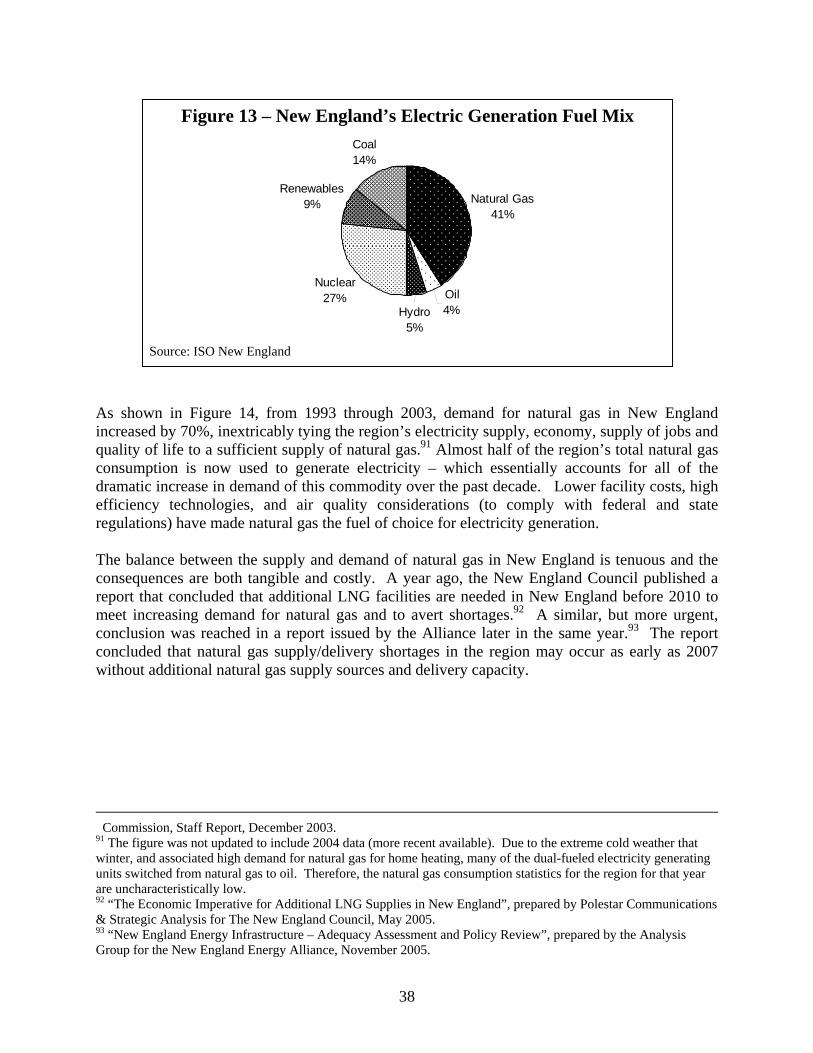
38
Natural Gas41%
Nuclear27%
Renewables9%
Coal14%
Oil4%Hydro
5%
As shown in Figure 14, from 1993 through 2003, demand for natural gas in New England increased by 70%, inextricably tying the region’s electricity supply, economy, supply of jobs and quality of life to a sufficient supply of natural gas.91 Almost half of the region’s total natural gas consumption is now used to generate electricity – which essentially accounts for all of the dramatic increase in demand of this commodity over the past decade. Lower facility costs, high efficiency technologies, and air quality considerations (to comply with federal and state regulations) have made natural gas the fuel of choice for electricity generation. The balance between the supply and demand of natural gas in New England is tenuous and the consequences are both tangible and costly. A year ago, the New England Council published a report that concluded that additional LNG facilities are needed in New England before 2010 to meet increasing demand for natural gas and to avert shortages.92 A similar, but more urgent, conclusion was reached in a report issued by the Alliance later in the same year.93 The report concluded that natural gas supply/delivery shortages in the region may occur as early as 2007 without additional natural gas supply sources and delivery capacity.
Commission, Staff Report, December 2003. 91 The figure was not updated to include 2004 data (more recent available). Due to the extreme cold weather that winter, and associated high demand for natural gas for home heating, many of the dual-fueled electricity generating units switched from natural gas to oil. Therefore, the natural gas consumption statistics for the region for that year are uncharacteristically low. 92 “The Economic Imperative for Additional LNG Supplies in New England”, prepared by Polestar Communications & Strategic Analysis for The New England Council, May 2005. 93 “New England Energy Infrastructure – Adequacy Assessment and Policy Review”, prepared by the Analysis Group for the New England Energy Alliance, November 2005.
Source: ISO New England
Figure 13 – New England’s Electric Generation Fuel Mix

39
Electric42%
Transportation5%
Industrial14%
Commercial16%
Residential23%
Electric6%
Transportation0%
Commercial22% Industrial
35%
Residential37%
Fuel Diversity Options in Restructured Markets. Prudence dictates that New England – individual states and the competitive markets – should work toward a diverse supply of natural gas and electricity generation resources. Fuel supply and generation diversity are desirable as a logical hedge against supply disruptions which protects the reliability of electricity delivery that the region’s economy and quality of life depend upon. Prior to restructuring, a diverse mix of resources also provided economic benefits by reducing the risk of price increases – as generation rates were based on the average cost of all generation. Today, fuel diversity has little effect on electricity prices because natural gas units are “on the margin” and under the wholesale market’s reverse auction process set the cost of electricity almost 90% of the time. Natural gas prices have increased by 400% since 1999 and are the key reason for the recent spike in electricity rates noted above. More recently, relief in natural gas prices has resulted in a reduction in wholesale spot market prices. 94 However, the balance between supply and demand of this fossil fuel commodity is tenuous and could periodically and unpredictably put upward pressure on the price of electricity for years to come.95 The competitive nature of the wholesale markets under restructuring drives investing to the lowest priced generating fuel – and to projects that are most likely to be approved. Challenging siting processes and a regional bias against certain fuel sources precludes from consideration some technologies that might otherwise be economically viable.
94 “New England Wholesale Electricity Prices Mirror Relief in Natural Gas Market; Mild Winter, Increased Natural Gas Supply Cited for Lower Power Prices”, ISO New England, April 3, 2006. 95 “The Economic Imperative for Additional LNG Supplies in New England”, prepared by Polestar Communications & Strategic Analysis for The New England Council, May 2005.
891 Billion Cubic Feet
70% Growth
526 Billion Cubic Feet
Source: Energy Information Administration, U.S. Department of Energy
Figure 14 – New England Natural Gas Consumption Trends
1993 2003

40
The November 2005 New England Energy Alliance report cited above stated: “Strict reliance on markets without placing a value on diversity or environmental impacts of different supply types may lead to investment in a narrow set of options”. Thus, reliance on markets may not solve the diversity issue, since markets do not pre-determine resource mix outcomes. Energy planners, policymakers and developers in the region thus need to carefully evaluate the tradeoffs represented by all demand and supply options available”.96
Nationally, these concerns have been raised in a recent National Commission on Energy Policy report that addresses the challenges of energy facility siting and permitting and identifies the need for a “wholly different and vastly more appealing siting paradigm”. The Commission noted that:
“While much needed energy production and distribution capacity has been added in many regions of the country over the last decade, other projects face critical siting and permitting constraints. Many of these constraints result from processes in which local concerns trump broader regional or national objectives. Environmental concerns, federal-state regulatory conflicts, aesthetic preferences, highly localized planning processes, investment risks and preferences and regional policy differences have all played varying roles in driving current patterns of infrastructure development and in making it difficult to permit and build major energy facilities in many parts of the United States.” 97
The Commission also noted that in parts of the country where regional planning processes are employed, there is a better chance that energy infrastructure siting decisions will be made.98 There are a limited number of options available over the next decade for diversifying the region’s fuel mix and supply resources as described below. As noted at the outset, the viability of these options lies along the seam of the forces in competitive markets and state policies and regulations.
Liquefied Natural Gas to Strengthen Supplies of Natural Gas. Used in New England for decades, LNG currently provides approximately 20% of the region’s annual consumption of natural gas increasing to 30% during winter peak demand periods. The Distrigas terminal in Everett – one of four on-shore LNG import facilities in the U.S. – is connected to the interstate pipeline network as well as the local natural gas distribution system. It also directly fuels Mystic Station, one of the largest natural gas-fired generating plants in New England.
This situation highlights the direction of a competitive market and its benefits to consumers if an adequate supply infrastructure is available. Essentially in the aftermath of restructuring, older and less efficient generating plants at the Mystic site were replaced by a larger and highly efficient facility within the greater Boston area (which by its very
96 “New England Energy Infrastructure – Adequacy Assessment and Policy Review”, prepared by the Analysis Group, for the New England Energy Alliance, November 2005 97 “Siting Critical Energy Infrastructure”, A White Paper Prepared by the Staff of the National Commission on Energy Policy, June 2006. 98 The Commission will sponsor a series of workshops across the country later this year and into next to address these issues.

41
location helps alleviate the region’s transmission congestion that was discussed earlier in Section II) with considerably fewer emissions. Moreover, by having the generating plant located close to a source of fuel, the “pipeline” was shortened.
The lack of new LNG infrastructure development is not due to a lack of proposals as numerous proposals to develop LNG terminals in New England are currently being processed by federal regulators. The need is both clear and present and the approval process should not be allowed to be short circuited or arbitrarily changed to accommodate special interests – as the consequences of a shortfall will impact the uses of natural gas for space heating and manufacturing as well as for electricity generation.
Clean Coal and Nuclear Technology as Viable Generation Sources. The continued efficient operation of the region’s coal and nuclear generating facilities is also essential to fuel diversification. These plants are classified as base-load generation – operating 24 hours a day, seven days a week, not changing production to match fluctuating electricity demand which changes from hour-to-hour.
New England’s nuclear plants currently generate more than a quarter of the region’s electricity at capacity factors that exceed other technologies and have the lowest production costs of any major source of electricity. They also do not produce emissions that cause smog or acid rain nor generate greenhouse gas emissions. Continued operation of the region’s nuclear plants – as well as renewal of their operating licenses – will be essential in achieving RGGI CO2 reduction targets. In fact, computer models produced for RGGI assume the nuclear plants in the region continue to operate.
In addition, the region’s coal plants have operated reliably – generating about 14% of the New England’s electricity. A hallmark of coal is its stability in generating electricity at low prices. In addition, coal can be easily stockpiled at power plant sites, so supply disruptions are not a significant issue. The region’s coal plant operators have invested hundreds of millions of dollars in emission control equipment, significantly reducing the region’s emissions. The recently passed federal Energy Act of 2005 includes financial incentives for new nuclear power plants and clean coal technology that could also assist the region in its fuel diversification efforts. However, given the political environment and historic opposition to these resources, investment in these technologies in New England is not likely in the near future – but should be a consideration in the longer term.
Energy Efficiency as a Resource. New England has consistently been a leader in energy
efficiency and has achieved greater progress than the nation as a whole, and compared to states with similar economies. As discussed in the Appendix, as part of restructuring, each New England state legislatively mandated funding for electricity efficiency programs through a rate-payer charge, totaling approximately $240 million per year, achieving about 750 million kWh in savings annually. Recent increases in fossil fuel prices, growing concerns about lack of capacity investment (as discussed above), and the
42
need to attain environmental goals should serve as drivers to increase efficiency’s role as a “supply” resource.
Renewable Program Project Development Optimization. As discussed in the Appendix,
to help increase fuel diversity, some of the states have mandated rate-payer funded Renewable Trust Funds to promote the development of renewable energy technologies. In addition, five states have adopted Renewable Portfolio Standards (albeit different ones which make the efforts individually and collectively less efficient with the regional wholesale marketplace) to require electricity suppliers to offer increasing amounts of generation from renewable sources.
These programs provide needed incentives to investors to make renewable projects economically competitive (although consumers are still paying for the total cost) and help meet environmental goals. As summarized in the Appendix, it is not clear whether these programs are working. Moreover, as ambitious as their goals are, they fall far short of what may well be required under RGGI commitments (as calculated in the NEI study previously referenced).

43
V. Principles for Future Action Restructuring remains a work in progress. Two of the three fundamental restructuring goals, to varying degrees at least to date, are being achieved: economic savings for consumers; and increased environmental benefits. The third goal, retail choice of suppliers, is achieving success, but is largely limited to medium and large commercial and industrial customers. It has not been achieved for smaller customers in a meaningful way in any of the states.
Economic Savings: Adjusted for inflation, average retail prices are lower – between 7 and 18 percent – than they were prior to restructuring. On a region-wide basis, consumers have saved between $6.5 and $7.6 billion since restructuring began. However, more recently, record-high natural gas prices, environmental compliance costs, and transmission congestion costs are reducing these economic benefits.
Environmental Improvement: Environmental improvements have resulted from
improved operating performance at power plants now owned by competitive power generators, and the significant number of natural gas-fired power plants built during the early years of restructuring – combined with stringent emissions regulations. Emissions of SO2, NOx and CO2 have all declined substantially despite a 25% increase in generation output since restructuring was initiated.
Retail Choice: Consumer switching from utilities to competitive suppliers has
progressed among medium and large commercial and industrial customers with buying power and knowledge. During the initial years of restructuring, residential and small commercial customers had little incentive to switch as long as utility prices were kept artificially low – or at least stable. Competitive suppliers could not match the price offered by utilities (and they incurred high marketing costs to reach these smaller customer sectors). Even as transition periods end in some states, smaller customers may not perceive the savings offered by competitive suppliers as significant enough to motivate change. These consumers have had choice, but most have chosen to stay with their utility supplier.
With respect to impacts on infrastructure under restructured markets, new generating facilities are not being built to keep pace with increasing electricity demand or in locations requiring additional supply. The reasons are the imperfections in wholesale markets that the pending “forward capacity market” is intended to remedy combined with uncertainties regarding state environmental policies and local resistance to infrastructure development. In addition, the region has become heavily dependent on natural gas to fuel electricity generating plants – substantially decreasing the region’s fuel diversity – yet infrastructure to increase or diversify natural and other supplies has been met with political and community opposition. Political leadership is needed to encourage infrastructure investment and siting by guiding wholesale market corrections and harmonizing state policies, programs and regulations. While this report makes no explicit recommendations, the New England Energy Alliance advocates the adoption of the following principles to guide development of energy policies.

44
Proactive Policy and Decision Making. A reliable and affordable supply of natural gas and electricity is directly linked to the region’s economic strength and quality of life. Necessary energy infrastructure, including electric transmission, electric generation, gas transmission, and LNG terminals must be in place when needed. Long lead times for capital intensive projects mean that the region must be proactive to: (1) adhere to, and improve, siting processes; and (2) establish policies that encourage public support and timely private sector investment.
Policy Balancing and Coordination. Each state should strive to balance energy,
environmental, and economic policies and ensure that long-term benefits exceed short-term costs. Better coordination and efficient execution of energy, economic, and environmental policy among the region’s states would reduce consumer costs, increase energy supply reliability, and help assure a level playing field for new infrastructure investment.
Supply Resource Diversity. The most reliable and affordable supply of energy is one that
is built on ample supplies, flexibility, and diversity. The exclusion of supply technologies through discriminatory policies and actions and failure to allow viable infrastructure projects to be vetted through established federal, state and local review processes makes the region vulnerable to price instability and delivery interruptions, and such exclusionary practices should be eliminated.
Recognition of costs. The energy industry is among the nation’s most capital-intensive.
To sustain an affordable and reliable supply of energy to meet consumer needs will require significant investments in all segments of the industry. Regardless of market and regulatory structures, public policy and regulatory actions should ensure that those investments are encouraged and that capital, fuel and operating costs are properly allocated and recovered, as appropriate.
Market Improvement. Electric utility restructuring and development of competitive
wholesale and retail markets in New England can increase efficiency through competition, provide consumers with choice and financial benefits, improve air quality and allocate risks of generation investments to developers. Imperfections in the restructured wholesale and retail markets as they mature are not unexpected and must be addressed by appropriate agencies and organizations.
Demand Side Management Expansion. Cost-effective energy efficiency and demand
response programs are essential to the success of a comprehensive energy strategy. State policy makers and regulators must continue to support investment for development of economical energy resources including end-use efficiency and demand response mechanisms.
Inter-regional Electric and Gas Interconnection Enhancement. In addition to
developing and maintaining vital energy infrastructure within New England, the electricity and gas transmission infrastructure with neighboring regions and eastern Canada should be strengthened, adding diversity, flexibility and resiliency to natural or man-made supply disruptions.
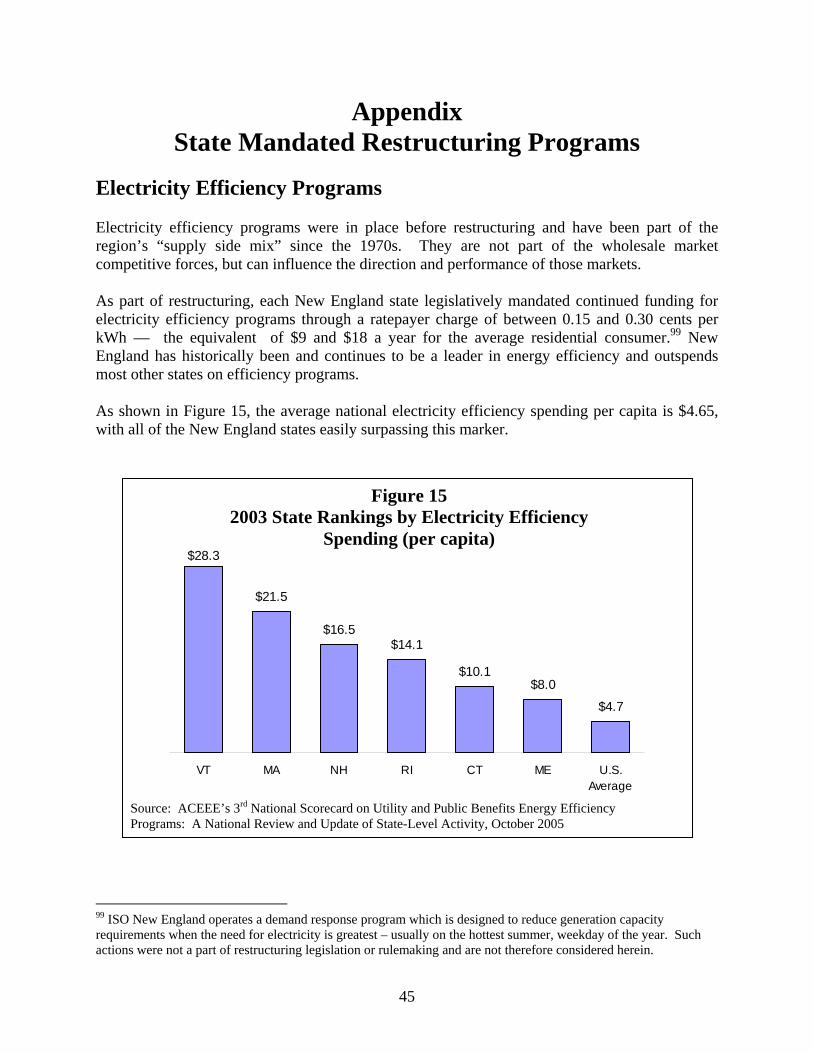
45
Appendix State Mandated Restructuring Programs
Electricity Efficiency Programs Electricity efficiency programs were in place before restructuring and have been part of the region’s “supply side mix” since the 1970s. They are not part of the wholesale market competitive forces, but can influence the direction and performance of those markets. As part of restructuring, each New England state legislatively mandated continued funding for electricity efficiency programs through a ratepayer charge of between 0.15 and 0.30 cents per kWh — the equivalent of $9 and $18 a year for the average residential consumer.99 New England has historically been and continues to be a leader in energy efficiency and outspends most other states on efficiency programs. As shown in Figure 15, the average national electricity efficiency spending per capita is $4.65, with all of the New England states easily surpassing this marker.
$28.3
$21.5
$16.5$14.1
$10.1$8.0
$4.7
VT MA NH RI CT ME U.S.Average
99 ISO New England operates a demand response program which is designed to reduce generation capacity requirements when the need for electricity is greatest – usually on the hottest summer, weekday of the year. Such actions were not a part of restructuring legislation or rulemaking and are not therefore considered herein.
Source: ACEEE’s 3rd National Scorecard on Utility and Public Benefits Energy Efficiency Programs: A National Review and Update of State-Level Activity, October 2005
Figure 15 2003 State Rankings by Electricity Efficiency
Spending (per capita)
46
Results to Date. Approximately $240 million is collected from New England consumers each year for programs that produce electricity savings of about 750 million kWh annually (or enough to power about 125,000 homes).100 This represents a 1.3% reduction in the region’s total consumption of electricity over the course of a year. This effectively has reduced New England’s annual electricity growth by about half over the past decade. Since restructuring was initiated in each state through 2005, approximately $1.7 billion has been cumulatively invested in electricity efficiency programs by New England ratepayers. This has produced cumulative annual savings of over 4 billion kWh, which is enough electricity to power over 650,000 homes. Cumulatively over the 12-year average lifetime of the installed measures, this is enough to displace electricity to power over 8 million homes. Since each state was restructured (through 2004), electric energy efficiency efforts have also avoided the generation of more than 30,000 tons of SO2, 9,000 tons of NOx, and 8 million tons of CO2.
101 The region’s electric energy efficiency programs also reduce total peak demand by about 140 MW per year, which while only less than 1% of the region’s total peak demand (which typically occurs on the hottest weekday of the summer), is still to be regarded as important.102 Peak demand is a key growth parameter – increasing some years by as much as 5%, which significantly drives infrastructure investment.103
Renewable Generation Programs Renewable generation sources have been recognized as desirable and necessary to help diversify the region’s supply of electricity. With the exception of hydropower, the relatively high cost of renewable electricity has hindered the development of major generating facilities within the region. To promote renewable generation investment in restructured markets, state legislatures established two types of programs. The first is a customer-funded program to invest in renewable technology development. The second requires electricity suppliers to ensure that a certain percentage of electricity sold is generated from renewable sources – and if not, they must pay a penalty. Theoretically, these programs provide needed incentives to investors to make renewable projects economically competitive and help meet environmental goals. Functionally, they lie outside of the wholesale marketplace and operate within retail markets. It is important to note, that some forms of renewable generation have very low capacity factors, so ISO New England must assure adequate backup capacity within the wholesale market to compensate for the unavailability and unpredictability of such sources of supply.
100 Assuming residences consume 6,000 kWh per year or 500 kWh a month on average. 101 Data prepared by Northeast Energy Efficiency Partnership, from state annual reports (www.neep.org). 102 This represents an average reduction since restructuring was initiated in each state and does not include demand reduction from interruptible load contracts with ISO. 103 Northeast Power Coordinating Council.
47
Renewable Electricity (Energy) Funds. Three states – Massachusetts, Connecticut and Rhode Island – have legislatively mandated the use of ratepayer funds for renewable technology development through a surcharge on electricity bills up to $8/year for a typical residential consumer administered by quasi-public agencies in Connecticut and Massachusetts and directly by government agencies in Rhode Island. Since restructuring was initiated in these states, a combined total of over $360 million has been collected from ratepayers.
Massachusetts: The Massachusetts Technology Collaborative (MTC), a quasi-public research and development entity, administers the Massachusetts Renewable Trust (RET) Fund which to date has collected over $275 million in consumer funds. Through 2005, the RET awarded more than $240 million to fund over 300 projects including the development of “green schools and buildings”, installation of renewable systems in buildings, funding to support renewable companies and the launching of the “Massachusetts Green Energy Fund”, a capital fund to support venture investments.104
Connecticut: The Connecticut Clean Energy Fund (CCEF) is administered by
Connecticut Innovations, Inc., a quasi-public agency of the state. The CCEF has collected over $60 million to fund projects including: a green power marketing program; a joint venture to develop portable solar power systems; and supplier efforts to increase consumer demand for renewable electricity. 105
Rhode Island: The first state in the nation to establish a public benefits fund for
renewable energy development, the fund is administered by the Rhode Island State Energy Office. Since 1997, approximately $27 million has been collected from consumers to fund a variety of projects. With the passage of the Renewable Portfolio Standards legislation in 2004 (as subsequently discussed), the renewable energy fund budget was reprioritized to shift resources to efforts that will better help electricity suppliers comply with renewable portfolio standards.106
While these programs have funded renewable energy installations, provided financial support to renewable companies and small-scale projects, initiated consumer education programs, and assisted in the development of green electricity purchase programs, they have had little direct impact on increasing the number of grid-scale electricity generating renewables projects. Renewable Portfolio Standards. Massachusetts, Connecticut and Maine included renewable portfolio standard (RPS) provisions in their restructuring laws to require that a specified percentage of electricity supply be provided by qualified renewable generation sources or that electricity distribution companies make an alternative payment that is collected from ratepayers into a designated fund.107 Rhode Island’s Renewable Energy Standard (RES) was
104 “Annual Statutory Report 2004”, Renewable Energy Trust, Massachusetts Technology Collaborative, August 2004 and Massachusetts Technology Collaborative Annual Report 2005. 105 “Fueling Connecticut’s Prosperity”, Connecticut Innovations 2005 Annual Report. 106 “Rhode Island Renewable Energy Fund Strategic Plan, April 1, 2005. 107 This program is in addition to federal tax credits which, although substantial, have so far proven insufficient to overcome the competitive price shortfall of renewable generation facilities. Twenty states and Washington D.C. have implemented minimum renewable energy standards.

48
enacted in June 2004 separate from its restructuring legislation and will be implemented in 2007. New Hampshire did not mandate an RPS. While Vermont has not restructured, a renewable portfolio “goal” was enacted calling for the state’s utilities to meet electricity growth between 2005 and 2012 with energy efficiency and renewable resources (capped at 10% of retail sales). If this goal is not achieved by 2012, the policy will become mandatory. State RPS Comparison. Key differences include the amount of renewables required, how they are defined, and cost recovery mechanisms. These differences make the individual policies less optimal and eliminate a regional synergy among the programs.
Required Renewable Threshold: By 2010: Massachusetts requires electricity providers to supply 5% of their portfolio from renewables, with Connecticut requiring 10%, and Rhode Island 4.5%. Maine’s portfolio requirement is the highest in the country – requiring electricity providers to supply 30% of electricity from renewable generation. However, this percentage is in fact lower than the available percentage of renewable generation due to the state’s broad definition of renewables (as discussed further below).
Defined Renewables: Definitions of qualifying renewable technologies vary widely.108
While landfill gas, solar thermal electric, solar photovoltaic, and wind energy are generally acceptable in all states, the rules vary for other technologies – particularly for biomass, hydropower and fuel cells. Connecticut, for example, accepts only “sustainable” biomass and Massachusetts accepts only low-emission advanced biomass conversion technologies such as biomass gasification. In addition, Connecticut accepts only “small hydropower” up to 5 Megawatts, but Maine allows hydroelectric plants up to 100 Megawatts which includes most of the hydro facilities in the state, and Massachusetts excludes hydropower altogether. For fuel cells, Connecticut and Maine accept those powered by natural gas, while Massachusetts and Rhode Island allow only those powered by renewable sources.
Existing Versus new Renewables: All the states except Massachusetts allow existing
renewable sources to count toward meeting the legislated goal. Massachusetts allows only renewables installed after December 31, 1997 – and only those located in the ISO New England control area. Beginning in 2010, Connecticut will allow renewable resources to be located in New York or PJM as well as New England.
Cost Recovery: Several approaches are used for funding RPS programs, including
passing the higher costs directly to all ratepayers, applying a charge on selected categories of sales, or encouraging consumers voluntarily to pay a premium for renewable power (through “green power”). Maine allows RPS costs to be recovered through green power programs, while Connecticut and Massachusetts exclude capacity purchased in green power programs from contributing to RPS requirements. In short, RPS costs can be as much as double the prevailing market price of electricity (since
108 “State Renewable Energy Requirements and Goals: Status Through 2003”, Energy Information Administration, U.S. Department of Energy.

49
suppliers must pay for both the renewable electricity and RPS compliance costs discussed below).
Compliance. Electricity suppliers in Massachusetts and Connecticut are required to demonstrate RPS compliance by verifying the purchase of renewable energy certificates (RECs) through the New England Power Pool Generation Information System.109,110 For each Megawatt-hour of renewable electricity generated, the system creates an electronic certificate which may be sold or traded. As a result, suppliers pay for both the renewable electricity and the RECs. Suppliers that fail to comply with the RPS must make an Alternative Compliance Payment (ACP), which is collected from ratepayers, to the state’s renewable energy investment fund, currently amounting to about $50/MWh to $55/MWh. New England currently has approximately 4,250 Megawatts of renewable capacity – most of which is either hydro or biomass.111 Studies have estimated that an additional 1,000 Megawatts of new renewable capacity will be needed in the region between 2000 and 2010 in order for all the states to comply with their RPS policies. However, between 2000 and 2004, just 73 Megawatts of renewable capacity has been added.112
109 This web-based system administered by an independent transaction processing service provider for the New England Power Pool compiles the production details not only of power generated from renewable resources, but also of all types of electricity generation in the NEPOOL control area. 110 RPS compliance in Maine is not an issue as there is an overabundance of generation that is qualified as renewable under the state’s definition. 111 2006 CELT Report, ISO New England, April 2006. 112Source: Electric Energy Efficiency and Renewable Energy in New England: An Assessment of Existing Policies and Prospects for the Future May 2005.