new china investing in a ‘new normal’ growth...
TRANSCRIPT

November 6, 2015
China Strategy
New China investing in a
‘new normal’ growth era
Portfolio Strategy Research
Top-down case; ‘New China’ ideas; implications
A ‘new normal’ growth era: Less could be more
After growing at around 10% p.a. for 30 years, China’s trend growth could
fall to around 5-6% in the next decade with continuing high cyclicality, but
the growth drivers will be different, and growth quality should improve.
New framework for investing in ‘New China’
Macro rebalancing, policy bias, reforms, and demographic shifts are
ushering in new waves of demand and reshaping the China story. Rising
consumption and services is a secular theme but high sectoral growth
variances imply a more nuanced equity story and implementation strategy.
Investors need to adjust their conventional framework to these macro
shifts. We identify 30 sub-industries (from 143) with high/stable revenue
growth and low sensitivity to GDP growth to form our ‘New China’
universe (671 companies, 21% of total A/H/ADR market cap). We add cross-
country profitability and valuation parameters to pick 19 stocks (9 A shares
and 10 offshore stocks), averaging 28% revenue and 31% EPS CAGR in
2015-17E, 23x 2016E P/E, and 1.1x PEG.
Implications for different types of investor
Index users: We prefer MXCN over HSCEI/HSI, CSI300 over SHCOMP.
Global corporates/funds: The classic EM story has largely played out
and local competition has risen: Adaptability is the key to success.
EM investors: China’s index weight in EM is set to rise over time; New
China stocks offer a sensible vehicle to close the underweight gaps.
China funds: Build core holdings around New China, trade Old China.
Commodities: Our commodity strategists expect prices to be lower for
longer but see demand shifting to ‘opex’ from ‘capex’ commodities.
‘New normal’ unleashes new demand, offering l-t alpha opportunities
Source: Bloomberg, Wind, Goldman Sachs Global Investment Research.
Kinger Lau, CFA +852-2978-1224 [email protected] Goldman Sachs (Asia) L.L.C.
Timothy Moe, CFA +852-2978-1328 [email protected] Goldman Sachs (Asia) L.L.C.
Jack Wang +852-2978-1220 [email protected] Goldman Sachs (Asia) L.L.C.
Alvin So +852-2978-1585 [email protected] Goldman Sachs (Asia) L.L.C.
Chenjie Liu, Ph.D +86(10)6627-3324 [email protected] Beijing Gao Hua Securities Company Limited
Goldman Sachs does and seeks to do business with companies covered in its research reports. As a result, investorsshould be aware that the firm may have a conflict of interest that could affect the objectivity of this report. Investorsshould consider this report as only a single factor in making their investment decision. For Reg AC certification and otherimportant disclosures, see the Disclosure Appendix, or go to www.gs.com/research/hedge.html. Analysts employed bynon-US affiliates are not registered/qualified as research analysts with FINRA in the U.S.
The Goldman Sachs Group, Inc. Global Investment Research
-10
-5
0
5
10
15
20
Ja
n-1
4
Ap
r-14
Ju
l-14
Oct-
14
Ja
n-1
5
Ap
r-15
Ju
l-15
Total consumption
Metal consumption
(%, YoY)
35%
0%
-10%
0%
10%
20%
30%
40%
2006
2007
2008
2009
2010
2011
2012
2013
2014
1H
15
New China Old China
Revenue growth (yoy)
197
118
50
100
150
200
250
Jan
-10
Jan
-11
Jan
-12
Jan
-13
Jan
-14
Jan
-15
New China
Old China
Market cap-weighted price returns
November 6, 2015 China
Goldman Sachs Global Investment Research 2
Table of contents
Investing in a ‘new normal’ era 2
A ‘new normal’ growth era: Less could be more 5
‘New normal’ creates ‘New China’, plotting a new story 12
New framework for investing in Chinese equities 17
Index users: Choose your ‘New’ indexes 22
Global funds/corporates: Adaptability is the key to success 23
EM investors: Buy ‘New China’ to reduce tracking errors 24
China-focused funds: Trade ‘Old China’; own ‘New China’ 25
Commodities: The divide between ‘opex’ and ‘capex’ commodities 26
Appendix 27
Disclosure Appendix 30
Investing in a ‘new normal’ era
The concept of a ‘new normal’ has been gathering investors’ attention. The expression
has been used repeatedly by senior policymakers in China to frame their views on the
economy and policy trends. But it also comes against a backdrop where headline GDP
growth is moderating, the policy/reform calendar is still active, asset markets volatility is
high, and global investors have widespread and entrenched concerns about China’s macro
situation. Hence there is considerable demand from investors to understand what a ‘new
normal’ era may entail and how that might impact their portfolio.
In this report, we aim to provide a refined analytical framework to help investors better
comprehend the ongoing macro and micro changes in China, and the resulting
structural investment implications, leveraging the detailed work from our macro
colleagues and single-stock analysts. Our logic and arguments are structured as follows:
A ‘new normal’ growth era: Less could be more
We believe the ‘new normal’ will be characterized by:
Lower potential growth rates (our economists project approximately 5-6% trend GDP
growth in the next decade) than the 10% pace achieved in the past 30 years;
Different growth drivers, notably more consumption/services, less investment and
exports, although the composition of the latter two is also changing;
Higher growth quality than before, given a more balanced and sustainable growth
profile, and less social deadweight losses (e.g. pollution, corruption);
Macro cyclicality will likely stay high as China needs reform and proactive cyclical
management to contain macro risks, facilitate the rebalancing, and to unleash/realize
its growth potential at the time when global demand is lackluster, and local macro
imbalances (high leverage, overcapacity, capital misallocation) are significant.

November 6, 2015 China
Goldman Sachs Global Investment Research 3
‘New normal’ creates ‘New China’, plotting a new story
Deep-rooted perceptions of China as ‘the world’s factory’ and the largest
infrastructure/property builder globally need to evolve into a new narrative under
the ‘new normal’.
China will likely invest more in ‘soft infrastructure’ than just building highways and
bridges; China is inevitably losing global market share in low-value-added goods (like
textiles and toys) but is now a dominant global and local player in high-end
electronics and industrial equipment, with rising momentum in infrastructure
exports. Demand for commodities is inevitably weak, but opex commodities should
continue to outperform capex commodities as China becomes richer.
As compelling as it might appear from a top-down perspective, consumption/services
is a broad concept and there is wide variation in growth between different items of
consumption due to changing consumer preferences and demographics, suggesting
the equity story could be more nuanced than headline growth potential may indicate.
New framework to find the bright spots
Investors need to adjust their investment framework as the economy morphs into a
new growth era: Popular equity indexes are not a good proxy for the economy, and
focusing on conventional macro indicators like IP and manufacturing PMI to formulate
market views could miss the big picture, and forgo potentially rewarding investment
opportunities.
The definition of ‘New China’ varies among investors. We systemically select 30 sub-
industries (GICS level 4) from our 3,636-company database (143 sub-industries) which
have delivered high and stable top-line growth (>10% revenue growth in each of the
past three years) and low revenue sensitivity to GDP growth to form our ‘New China’
universe. 671 companies (483 A shares, 200 offshore, 12 dual-listed) fall under this
group, representing 21% of total Chinese equity market cap (A+H+ADR).
High valuations and profitability normalization are two common risks and concerns
when investing in emerging and fast-growing themes. We focus on PEG ratios and
cross-country ROE comparison to drive our implementation ideas and to improve
risk/reward. We highlight 19 New China names under our coverage universe (9 A
shares and 10 offshore names), averaging 28% revenue and 31% EPS CAGR in 2015-
17E, 23x 2016E P/E, and 1.1x PEG.
Implications for different types of investor
1. Index users: China indexes have generated a wide range of returns over the past three
years—HSCEI has dropped 3% but ChiNext has rallied 268%—primarily reflecting their
‘New China’ content. MSCI China (offshore) and CSI300 (onshore), while not perfect,
are better proxies for the underlying (and changing) economic fundamentals, and
implementation tools on a risk/reward basis.
2. Global funds/corporates: The classic EM playbook—low per capita income, low
product penetration, high pent-up demand—has largely played out in China, in our
view. Local competition is intensifying and the strategy relying on untapped demand
and perception arbitrage is probably outdated. Global firms which adapt to the
evolving demographics, income levels, and consumer tastes should see higher chance
to succeed.
November 6, 2015 China
Goldman Sachs Global Investment Research 4
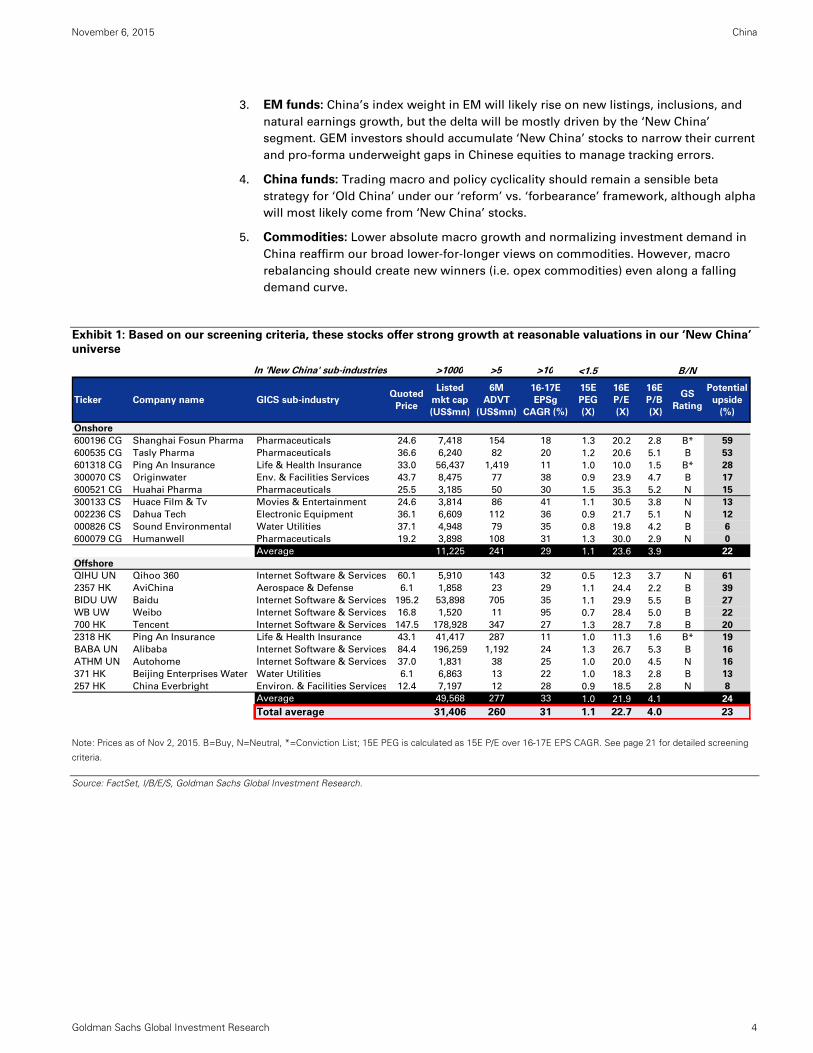
3. EM funds: China’s index weight in EM will likely rise on new listings, inclusions, and
natural earnings growth, but the delta will be mostly driven by the ‘New China’
segment. GEM investors should accumulate ‘New China’ stocks to narrow their current
and pro-forma underweight gaps in Chinese equities to manage tracking errors.
4. China funds: Trading macro and policy cyclicality should remain a sensible beta
strategy for ‘Old China’ under our ‘reform’ vs. ‘forbearance’ framework, although alpha
will most likely come from ‘New China’ stocks.
5. Commodities: Lower absolute macro growth and normalizing investment demand in
China reaffirm our broad lower-for-longer views on commodities. However, macro
rebalancing should create new winners (i.e. opex commodities) even along a falling
demand curve.
Exhibit 1: Based on our screening criteria, these stocks offer strong growth at reasonable valuations in our ‘New China’
universe
Note: Prices as of Nov 2, 2015. B=Buy, N=Neutral, *=Conviction List; 15E PEG is calculated as 15E P/E over 16-17E EPS CAGR. See page 21 for detailed screening
criteria.
Source: FactSet, I/B/E/S, Goldman Sachs Global Investment Research.
In 'New China' sub-industries >1000 >5 >10 <1.5 B/N
Ticker Company name GICS sub-industryQuoted
Price
Listed
mkt cap
(US$mn)
6M
ADVT
(US$mn)
16-17E
EPSg
CAGR (%)
15E
PEG
(X)
16E
P/E
(X)
16E
P/B
(X)
GS
Rating
Potential
upside
(%)
Onshore
600196 CG Shanghai Fosun Pharma Pharmaceuticals 24.6 7,418 154 18 1.3 20.2 2.8 B* 59
600535 CG Tasly Pharma Pharmaceuticals 36.6 6,240 82 20 1.2 20.6 5.1 B 53
601318 CG Ping An Insurance Life & Health Insurance 33.0 56,437 1,419 11 1.0 10.0 1.5 B* 28
300070 CS Originwater Env. & Facilities Services 43.7 8,475 77 38 0.9 23.9 4.7 B 17
600521 CG Huahai Pharma Pharmaceuticals 25.5 3,185 50 30 1.5 35.3 5.2 N 15
300133 CS Huace Film & Tv Movies & Entertainment 24.6 3,814 86 41 1.1 30.5 3.8 N 13
002236 CS Dahua Tech Electronic Equipment 36.1 6,609 112 36 0.9 21.7 5.1 N 12
000826 CS Sound Environmental Water Utilities 37.1 4,948 79 35 0.8 19.8 4.2 B 6
600079 CG Humanwell Pharmaceuticals 19.2 3,898 108 31 1.3 30.0 2.9 N 0
Average 11,225 241 29 1.1 23.6 3.9 22
Offshore
QIHU UN Qihoo 360 Internet Software & Services 60.1 5,910 143 32 0.5 12.3 3.7 N 61
2357 HK AviChina Aerospace & Defense 6.1 1,858 23 29 1.1 24.4 2.2 B 39
BIDU UW Baidu Internet Software & Services 195.2 53,898 705 35 1.1 29.9 5.5 B 27
WB UW Weibo Internet Software & Services 16.8 1,520 11 95 0.7 28.4 5.0 B 22
700 HK Tencent Internet Software & Services 147.5 178,928 347 27 1.3 28.7 7.8 B 20
2318 HK Ping An Insurance Life & Health Insurance 43.1 41,417 287 11 1.0 11.3 1.6 B* 19
BABA UN Alibaba Internet Software & Services 84.4 196,259 1,192 24 1.3 26.7 5.3 B 16
ATHM UN Autohome Internet Software & Services 37.0 1,831 38 25 1.0 20.0 4.5 N 16
371 HK Beijing Enterprises Water Water Utilities 6.1 6,863 13 22 1.0 18.3 2.8 B 13
257 HK China Everbright Environ. & Facilities Services 12.4 7,197 12 28 0.9 18.5 2.8 N 8
Average 49,568 277 33 1.0 21.9 4.1 24
Total average 31,406 260 31 1.1 22.7 4.0 23

November 6, 2015 China
Goldman Sachs Global Investment Research 5
A ‘new normal’ growth era: Less could be more
What is the ‘new normal’?
The term ‘new normal’ became common when used by PIMCO co-founder Bill Gross
and CEO Mohamed El-Erian in 2009 to describe the sluggish growth and deflationary
pressure globally post the Global Financial Crisis (GFC)1.
In May 2014, when President Xi Jinping visited Henan Province, he used this term to
describe China’s changing macro dynamics2.
During the APEC summit in Beijing in November 2014, President Xi characterized a
‘new normal’ growth era as: 1) growth shifting from high speed to medium-to-high
speed; 2) an improved and more efficient economic growth structure; and 3) growth
increasingly driven by innovation instead of inputs and investment3.
To better frame our discussion around this broad concept and subsequently translate this
into equity market views, we use ‘new normal’ to mean: a) decelerating potential (trend)
growth; b) changing macro growth propellants; c) possibly better quality of growth;
and, d) persistently high macro and policy cyclicality.
1. The pace of growth will further moderate
China has been able to grow 10% CAGR in the past 30 years essentially by
leveraging its cost competitiveness (labor, land, environment, FX), reform dividends
(opening up since 1979, Deng Xiaoping’s Southern tour in 1992, the SOE reform led by
Zhu Rongji from 1998 to 2002, the property market reform in the late 1990s, and WTO
accession in 2001), and its unique socioeconomic setup (state’s strong influence in
the economy).
However, that winning formula seems to have reached its limit given China’s cost
competitiveness has eroded, SOEs’ operating efficiency has deteriorated, cumulative
leverage and the pace at which leverage has been built is high on a global basis, and
China’s policy efficacy is now in question after the recent volatility in the asset markets.
Indeed, our economists expect China to go through a ‘bumpy deceleration’ process
over the medium to long term. Specifically, they forecast China’s (potential) GDP
growth to further slow to around 5.8% for the next 5 years, and then to 4.8% in the
decade thereafter, after factoring in the potential productivity gains as a result of
structural reforms but also the growth drag from the significant debt buildup since the
GFC. See Asia Econ Analyst: China’s bumpy deceleration continues, pulling region
along for the ride (Aug 31).
The slowing growth path is consistent with cross-country experiences. China’s per
capita GDP now stands at US$7,600 (current FX), similar to the US, Japan, Germany,
and UK in their mid-to-late 1970s. These economies on average registered less than 3%
growth (2.9% and 2.8% to be exact) in the subsequent 5 and 10 years after they
reached a per capita GDP level of US$8,000, which suggests the following:
1. The growth moderation in China shouldn’t be a major surprise, especially
considering China’s size and the high growth rate that it has delivered historically.
1 http://global.pimco.com/EN/Insights/Pages/Gross%20Sept%20On%20the%20Course%20to%20a%20New%20Normal.aspx
2 http://www.bloomberg.com/news/articles/2014-05-11/xi-says-china-must-adapt-to-new-normal-of-slower-growth
3 http://news.xinhuanet.com/english/china/2014-11/09/c_133776839.htm

November 6, 2015 China
Goldman Sachs Global Investment Research 6
2. If China manages to grow at 6.5% p.a. in the next five years as stated in the 13th
Five Year Blueprint, China would still be one of the fastest growing economies
in the G20.
3. The biggest question, in our view, would be how China will manage the
deceleration without triggering systemic events against a challenging local and
external backdrop. This requires a balancing act between pursuing reforms and
supporting growth, which we will address in the later sections.
Exhibit 2: After growing at 10% in the past 3 decades, China will likely see growth
moderating to around 5-6% in the next 5 to 10 years
Note: Average numbers indicates 10y real GDP CAGR.
Source: CEIC, Goldman Sachs Global Investment Research.
Exhibit 3: The slowdown should not be surprising given the size and maturity of the
Chinese economy
Note: Our per capita GDP comparison is based on current FX and on a nominal basis. On that basis: t=0 in 2014 for China, in
1974 for US, in 1975 for Germany, in 1977 for Japan, and in 1978 for UK.
Source: CEIC, Goldman Sachs Global Investment Research.
0
2
4
6
8
10
12
14
1965
1970
1975
1980
1985
1990
1995
2000
2005
2010
2015
2020
2025
2030
China real GDP growth (%, rolling 5y CAGR)
Avg: 7.2
Avg: 8.1
Avg: 10.4
Avg: 9.1
Avg: 10.0
Avg10-14: 8.6
15-19E: 5.8
20-24E: 5.1
25-30E: 4.5
-2
0
2
4
6
8
10
12
-15 -10 -5 0 5 10 15 20 25 30 35 40
China Japan US
Germany UK
Real GDP growth (%, rolling 5y CAGR)
t years
GDP per capita = 7.6k US$ (China current)
DM Avg: 2.9%DM Avg: 1.7%
November 6, 2015 China
Goldman Sachs Global Investment Research 7
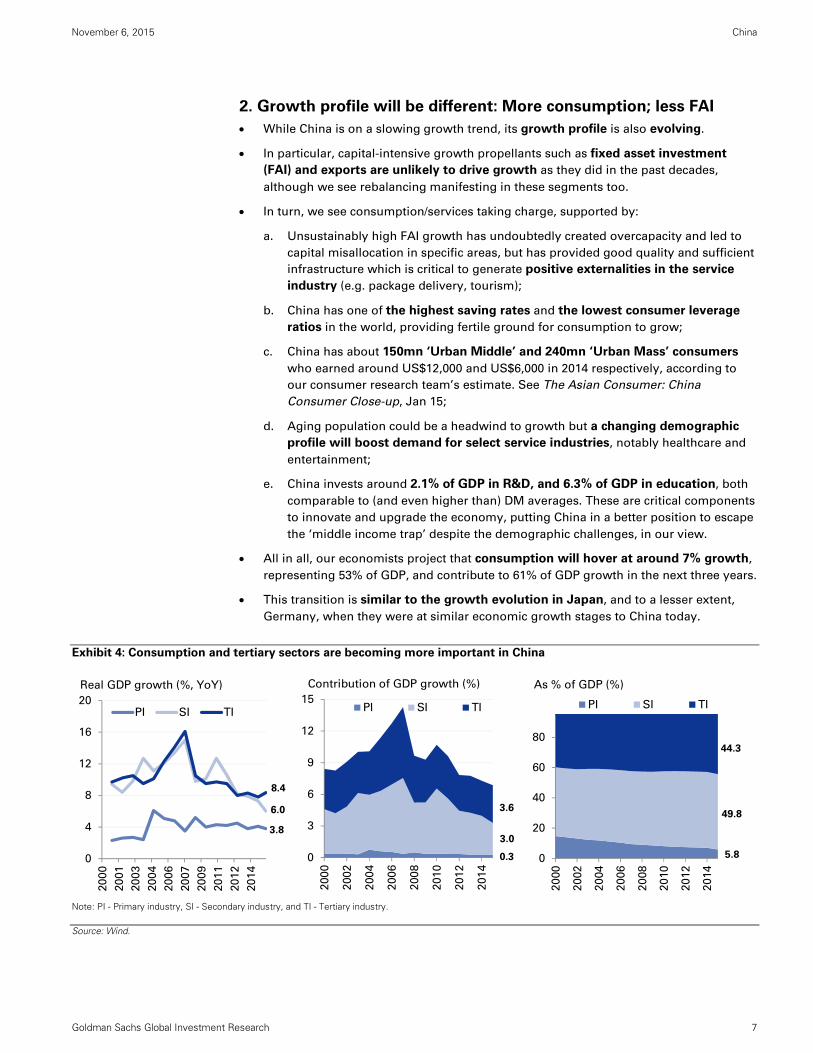
2. Growth profile will be different: More consumption; less FAI
While China is on a slowing growth trend, its growth profile is also evolving.
In particular, capital-intensive growth propellants such as fixed asset investment
(FAI) and exports are unlikely to drive growth as they did in the past decades,
although we see rebalancing manifesting in these segments too.
In turn, we see consumption/services taking charge, supported by:
a. Unsustainably high FAI growth has undoubtedly created overcapacity and led to
capital misallocation in specific areas, but has provided good quality and sufficient
infrastructure which is critical to generate positive externalities in the service
industry (e.g. package delivery, tourism);
b. China has one of the highest saving rates and the lowest consumer leverage
ratios in the world, providing fertile ground for consumption to grow;
c. China has about 150mn ‘Urban Middle’ and 240mn ‘Urban Mass’ consumers
who earned around US$12,000 and US$6,000 in 2014 respectively, according to
our consumer research team’s estimate. See The Asian Consumer: China
Consumer Close-up, Jan 15;
d. Aging population could be a headwind to growth but a changing demographic
profile will boost demand for select service industries, notably healthcare and
entertainment;
e. China invests around 2.1% of GDP in R&D, and 6.3% of GDP in education, both
comparable to (and even higher than) DM averages. These are critical components
to innovate and upgrade the economy, putting China in a better position to escape
the ‘middle income trap’ despite the demographic challenges, in our view.
All in all, our economists project that consumption will hover at around 7% growth,
representing 53% of GDP, and contribute to 61% of GDP growth in the next three years.
This transition is similar to the growth evolution in Japan, and to a lesser extent,
Germany, when they were at similar economic growth stages to China today.
Exhibit 4: Consumption and tertiary sectors are becoming more important in China
Note: PI - Primary industry, SI - Secondary industry, and TI - Tertiary industry.
Source: Wind.
0
4
8
12
16
20
20
00
20
01
20
03
20
04
20
06
20
07
20
09
20
11
20
12
20
14
PI SI TI
Real GDP growth (%, YoY)
8.4
6.0
3.8
0
20
40
60
80
20
00
20
02
20
04
20
06
20
08
20
10
20
12
20
14
PI SI TI
As % of GDP (%)
44.3
49.8
5.80
3
6
9
12
15
200
0
200
2
200
4
200
6
200
8
201
0
201
2
201
4
PI SI TI
Contribution of GDP growth (%)
3.6
3.0
0.3

November 6, 2015 China
Goldman Sachs Global Investment Research 8
Exhibit 5: China has one of the highest saving rates among major economies globally, while its consumer leverage is low
Note: Data is as of 2013.
Source: Haver.
Source: Haver, Goldman Sachs Global Investment Research.
Exhibit 6: China invested 2.1% of GDP in R&D in 2014,
comparable to OECD averages
Exhibit 7: China’s spending on education is high relative
to its income level on a global basis
Source: OECD.
Source: OECD, Haver.
Exhibit 8: Consumption (as a % of growth) rose in Japan
after it reached the 8K per capita income threshold
Exhibit 9: Investment as a % of GDP also moderated in
Japan and Germany as the economy matured
Note: Our per capita GDP comparison is based on current FX and on a nominal basis. On that basis: t=0 in 2014 for China, in 1974 for US, in 1975 for Germany, in 1977 for Japan, and in 1978 for UK.
Source: CEIC.
Source: CEIC.
0
10
20
30
40
50
60
19
70
19
75
19
80
19
85
19
90
19
95
20
00
20
05
20
10
China US UK
Japan Germany
Saving rate (%)
50%
13%
18%21%
25%
0
20
40
60
80
100
120
140
Sw
iss
Au
str
alia
Can
ad
a
No
rwa
y
UK
Ko
rea
Sw
ed
en
US
Ma
laysia
Th
aila
nd
Jap
an
Eu
ro A
rea
Pe
ru
Taiw
an
Co
lum
bia
Isra
el
S. A
fric
a
Ch
ina
Po
lan
d
Ch
ile
Cze
ch
Hu
ng
ary
Bra
zil
Tu
rkey
Ru
ssia
Ind
on
esia
Mexic
o
Ind
ia
Ph
ilip
pin
es
Household debt as % of GDP (%)
1.0
1.5
2.0
2.5
3.0
20
00
20
02
20
04
20
06
20
08
20
10
20
12
20
14
R&D spending as % of GDP
China: 2.1%
North Asia
+ SG: 3.0%
USA: 2.8%
Europe: 1.9%
OECD: 2.0%
Note: Averages for regional numbers4
5
6
7
8
0 10 20 30 40 50 60
Education expenditure as % of GDP (%, as of 2011)
Per capita income (k US$)
Canada
China France
Italy
Japan
UK
US
Argentina Australia
Korea
Mexico
Russia
45%
55%
65%
75%
85%
95%
-25 -20 -15 -10 -5 0 5 10 15 20 25 30 35 40
China Japan US
Germany UK
Final consumption as % of GDP
t years
GDP per capita = 7.6k US$
(China current)
30%
40%
50%
60%
70%
80%
-25 -20 -15 -10 -5 0 5 10 15 20 25 30 35 40
China Japan US
Germany UK
Household consumption as % of GDP
t years
GDP per capita = 7.6k US$
(China current)

November 6, 2015 China
Goldman Sachs Global Investment Research 9
3. Quality of growth should be better
Growth quality is admittedly hard to quantify. But, in the context of China macro and
markets, we define quality of growth as a more balanced and sustainable growth profile
which results in higher growth efficiency and less social deadweight losses. We see the
macro rebalancing enhancing growth quality in the following manners:
Reducing investment, especially in overcapacity and polluted sectors, and promoting
consumption should help divert capital to areas where supply hasn’t caught up with
demand (e.g. healthcare). In theory, this, with the appropriate policy support and
incentive, should help improve the Incremental Capital Output Ratio (ICOR) and the
Pareto efficiency for the economy, in our view.
The rising awareness of environmental issues and increasing investment in the related
areas should ease the pollution pressures, which have become a serious concern in
China. Not only are they creating economic losses which are not being accounted for
in the headline GDP, but they are threatening social stability if the situation continues
to worsen.
China’s Gini coefficient is high in a global context. The wealth disparity (or income
distribution inequality) between household and corporate sector should narrow as
FAI-driven growth tends to disproportionately benefit owners of capital than labor, and
vice versa for consumption-led growth, everything else being equal.
Rising consumption demand could also stimulate job creation in the tertiary sector,
which typically offers higher wages and is more labor-intensive than the secondary
industry, thereby buttressing income growth and helping to absorb the potential slack
from the challenging industrial sector.
In the end, private consumption has proven to be the key and sustainable growth
lever for major developed markets globally—we think this is the path that China should
follow.
Exhibit 10: ICOR at the macro level and ROIC in the
equity market have both moderated
Exhibit 11: The gaps between rich and poor in China are
quite significant
Note: Data is as of 2008 for Japan; 2009 for India; 2010 for China(WB), Indonesia, Australia and Canada; 2011 for S. Africa and Germany; 2012 for Mexico, Russia, Turkey, Italy, France and UK; 2013 for Colombia, Brazil, Argentina and US; and 2014 for China (Wind).
Source: Bloomberg, Wind, CEIC, Goldman Sachs Global Investment Research.
Source: CEIC.
2.5
3.0
3.5
4.0
4.5
5.0
5.5
1%
2%
3%
4%
5%
6%
7%
8%
9%
10%
20
06
20
07
20
08
20
09
20
10
20
11
20
12
20
13
20
14
1H
15
Trailing 5Y ICOR - RHS
All China ROIC
All China ex fin. ROIC
ROIC (%) ICOR (X)
0
10
20
30
40
50
60
70
S. A
fric
a
Co
lom
bia
Bra
zil
Mexic
o
Ch
ina (
Win
d)
Arg
en
tin
a
Ch
ina (
WB
)
Ru
ssia
US
Tu
rkey
Ind
on
esia
Italy
Au
str
ali
a
Ind
ia
Can
ad
a
Fra
nce
UK
Ja
pa
n
Germ
an
y
GINI Index (World Bank est.)

November 6, 2015 China
Goldman Sachs Global Investment Research 10
Exhibit 12: High growth has partly come at the expense
of the environment
Exhibit 13: The service industry is becoming a major
source of job creation
Source: Knoema, World Bank, Bloomberg.
Source: Wind.
4. Growth and policy cyclicality should stay high; ‘Growth’ vs.
‘Forbearance’ remains in place
Transforming a deep-rooted growth model which has been effective for the past three
decades in the second-largest economy in the world with more than 1.3bn people is
not an easy task.
Also, the fiscal stimulus program in 2008 has created and aggravated a number of
macro imbalances, notably overcapacity, high leverage, low SOE efficiency, and
potentially high NPLs. These macro issues have further complicated the transition.
As such, we believe macro (and market) volatility will likely stay high as China is still in
the process of optimizing conflicting objectives (reform, rebalancing, reasonable
growth) against a backdrop where global demand is lackluster, and domestic macro
imbalances remain significant.
The analytical framework that we have been using to comprehend the strong intra-year
macro and policy cyclicality is what we called as ‘reform’ vs. ‘forbearance’.
Specifically, striking a delicate balance between supporting short-term growth and
reducing systemic risk appears the key policy objective in the reform era, with the
policy pendulum (actions) swinging between a ‘proactive approach’ (i.e. pursuing
reform to address existing problems and pre-empt further risks) and ‘forbearance’ (i.e.
delay addressing the problems). This policy dynamics have also resulted in strong
intra-year volatility in the equity markets, in our view. See, inter alia, China Portfolio
Strategy: The China credit conundrum: Risks, paths and implications, Jul 26, 2013.
Overall, China needs structural reforms to correct these imbalances, facilitate the
rebalancing, and to unleash/realize its growth potential. We believe easy monetary
policy is required to buffer the downside risk and the ‘pain’ of reform. So far, we think
some progress has been made, but more is needed, especially in the SOE sector. See
China A-share Strategy: Retreat, repair, and reform, Oct 8, for detail.
2,081
2,017
1,993
1,940
1,960
1,980
2,000
2,020
2,040
2,060
2,080
2,100
20
07
20
12
20
14
Total renewable water
resources (m^3/inhab/yr)
11.6
11.5
11.3
11.3
11.1
11.2
11.3
11.4
11.5
11.6
20
07
20
09
20
11
20
13
Arable land
(as % of land area)
6.9
7.7
8.5
9.4
9.8
5.0
5.5
6.0
6.5
7.0
7.5
8.0
8.5
9.0
9.5
10.0
20
06
20
08
20
10
20
12
20
14
CO2 emission (mn tonnes)
0
200
400
600
800
1,000
0
20
40
60
80
100
196
5
196
8
197
1
197
4
197
7
198
0
198
3
198
6
198
9
199
2
199
5
199
8
200
1
200
4
200
7
201
0
201
3
PI SI TI Total employment - RHS
As % of total employment (%) Total employment (mn)

November 6, 2015 China
Goldman Sachs Global Investment Research 11
Exhibit 14: China has announced and implemented a number of key reforms since the 3rd party Plenum in Nov 2013
Source: PBoC, Xinhua News, Sina, Caixin, Reuters, Bloomberg, compiled by Goldman Sachs Global Investment Research.
Exhibit 15: China needs accommodative policy to soften
the ‘pain’ of reforms...
Exhibit 16: ...especially those relating to the significant
buildup of leverage
Source: WDI, Penn World Table, IMFWEO, BIS, Bloomberg, Goldman Sachs Global Investment Research.
Source: CEIC, PBOC, NBS, FactSet, Goldman Sachs Global Investment Research.
Obje
ctives
Policie
s/d
evelo
pm
en
ts
Key areas of reform since the third plenum meeting in Nov 2013
Fiscal reformsFinancial market
reformsSOE reformsSocial reforms
Division of responsibility and
spending rights between the
central and local
governments, more
transparency on spending,
and a more sustainable fiscal
revenue model.
Value added tax (VAT) and
resource tax reforms
Removed and lowered
consumption taxes in
selected products
LGFVs to include public
welfare debt in the fiscal
budget
Exempted VAT and Business
Tax for small firms with
quarterly revenues less than
Rmb 90K
Further infrastructure
investment to modernize
urban underground pipe
systems
Launched a bond-for-debt
swap program to help local
governments to convert thier
high-interest-bearing debts
into low-cost bonds with the
current quota of Rmb 3.2tn
Public-Private-Partnership
(PPP) to be further enhanced
to entice more private capital
participation.
Increasing the role of market
forces, improving
transparency and efficiency
of financial markets,
reinforcing capital account
opening and RMB
internationalization.
Expanded CNY/USD trading
band from 1% to 2%
Preferred share issuance pilot
program for banks
SH-HK Stock Connect
scheme started in Nov 2014
Launched deposit insurance
scheme
Asset-backed securities (ABS)
issuance will no longer need
PBoC‘s pre-approval
The Mainland-HK Mutual
Recognition of Funds (MRF)
started on July 1, 2015.
Introduced large-
denomination negotiable
certificates of deposit with
market-based interest rates
Removed the regulatory 75%
loan/deposit (L/D) cap for
banks, making the L/D ratio
used for reference only
Removed the interest rate
cap of bank deposits longer
than 1 year
The PBoC adjusted the CNY
fixing mechanism to allow
the CNY to weaken reflecting
market supply/demand
condition.
Reduced restrictions on
foreign investment by
making a 'negative list' of
industries other than which
foreigners can invest freely.
Promoting competition
between SOEs and private
companies, opening up more
SOE ownership to private
capital, and encouraging
M&A to reduce over-
capacity.
Opened up 80 state popjects
for private investment
Reduction and tighter
regulation on SOE
executives' compensation
and perks
Selected 6 SOEs as SOE
ownership reform pilots
Mixed ownership reform in
oil and gas sectors
The State Council released
plans to open up China’s
credit card clearing services
industry to foreign firms.
Six central SOEs started pilot
programs on mixed-
ownership reform
Compensation reforms in
central SOEs
BoCom, CMB and BOC
announced mixed-ownership
reform plans to introduce
more private shareholders.
AVIC asset restructuring
Shipping sector
consolidation
Released the "top-level
design" of SOE reforms, as
well as a more specific
guideline on SOE mixed-
ownership reforms
China Reform Holdings to
buy 6% stake in China Tower
to build electric-car charging
stations.
China Mobile, China Telecom
and China Unicom to sell
their tower assets to a new
entiy - China Tower
Encouraging further
urbanization, reforming
Hukou (household
registration system),
loosening up one-child
policy and expanding the
social welfare system.
Rural land reform to grant
farmers mortgage and
transfer rights of their land
Families will be allowed two
children if one parent is an
only child
Cut prices of more than 400
drugs to reduce health care
costs
Deregulated prices in 9
products and services
including tobacco, rail and
air freight, port services and
property brokerage
The PBoC provided Rmb
260bn of PSL to CDB for
shanty town development.
Plans to integrate health
care system for urban
residents with rural hukous
Plan for tax-deductible
private health insurance
allowing up to Rmb2,400
taxdeductible spending per
person per year on eligible
private health insurance
products.
Accelerated investment in
environmental protection
and stepped up regulation
on air, water and soil
polution
Fully abolished "one-child"
policy and replaced with
"two-child" policy
Legal reforms / anti-
corruption
Promoting the rule of law
and enhancing corruption
punishment, improving
oversight and prevention
structures.
Plans to separate the
jurisdiction of courts from
administrative divisions
Tightening regulations
concerning business
involvements and overseas
immigration of public
officials’ relatives
Launched a large -scale anti-
corruption campaign aiming
to catch both "tigers" and
"flies"
The Central Commission for
Discipline Inspection (CCDI)
to inspect all central SOEs
for corruption cases in 2015
Initiated a global anti-
corruption campain to bring
back corrupt officials
overseas
Further reduction of 'san
gong' spending
-3
-2
-1
0
1
Between 5-
10 years
before
5-years
before
0-1 years 2-3 years 4-5 years
30pp 40pp 50pp 60pp
Size of debt buildup (change in debt-to-GDP ratio)
Prior 10-yr average
Median policy rates relative to prior 10y avg (%)
0
2
4
6
2004
2005
2006
2007
2008
2009
2010
2011
2012
2013
2014
2015
2016
2017
2018
7D repo (%)
1.5%
4 6 9 12 12 12 11 12 12 16 19 19 20 22 24 2622 22 24 25 26 32 28 30 28 29 27 25 24 23 23 24
79 11 12
13 15 15 1624 27 24 26 31 34 36
109103
107114 106 98 98 93 94
110119 123
134143
145157
135 138149
161 156 155 152 150 150
178192 190
204219
226
242
0
30
60
90
120
150
180
210
240
270
20
00
20
01
20
02
20
03
20
04
20
05
20
06
20
07
20
08
20
09
20
10
20
11
20
12
20
13
20
14
20
15
E
Corporate leverage
LGFV leverage(loan, bond)
Govt. Leverage
Consumer loans
Percent of GDP (%)

November 6, 2015 China
Goldman Sachs Global Investment Research 12
‘New normal’ creates ‘New China’, plotting a new story
The ongoing macro rebalancing in a ‘new normal’ growth era is apparent in the gaps
between manufacturing and service PMIs, the divergence between CPI and PPI, and
based on our proprietary indicators, the disparity between GS China Consumption
Tracker and GS Metal Consumption Index (MCI), among many others. Macro aside,
rebalancing is also happening within key growth drivers and asset markets.
Exhibit 17: Macro rebalancing appears in play
Source: Wind, Goldman Sachs Global Investment Research.
1. China is still building, but less ‘hard infra’ and property, more
public goods
FAI growth has clearly slowed in the manufacturing and property sectors while
infrastructure spending growth has remained resilient, mainly reflecting the proactive and
expansionary fiscal policy but anemic investment demand from the private sector.
That said, underneath the broad infra investment category, ‘soft’ infrastructure (hospitals,
schools, sewage system, and other environmental-related and ‘public goods’ projects) is
showing moderately higher momentum vs. the traditional ‘hard’ infrastructure, which
typically focuses on transportation infra investment including highways, bridges, and high-
speed railways. We think this trend is likely to extend as ‘public goods’ related investment
is regarded by policymakers as one of the key levers to sustain and enhance growth going
forward, as stated in the 13th Five Year Blueprint.
Exhibit 18: Infra spending has held up well despite the weakening trends in property and
manufacturing FAI
Source: CEIC.
48
50
52
54
56
58
Jan
-12
Ju
l-12
Jan
-13
Ju
l-13
Jan
-14
Ju
l-14
Jan
-15
Ju
l-15
Service PMI
Manufacturing PMI
Index
-8
-6
-4
-2
0
2
4
6
Jan
-12
Ju
l-12
Jan
-13
Ju
l-13
Jan
-14
Ju
l-14
Jan
-15
Ju
l-15
CPI PPI
(%, YoY)
-10
-5
0
5
10
15
20
Ju
l-12
Oct-
12
Jan
-13
Ap
r-13
Ju
l-13
Oct-
13
Jan
-14
Ap
r-14
Ju
l-14
Oct-
14
Jan
-15
Ap
r-15
Ju
l-15
GS total consumption tracker
GS metal consumption index (MCI)
(%, YoY)
-10
0
10
20
30
40
50
Ap
r-1
0
Au
g-1
0
De
c-1
0
Ap
r-1
1
Au
g-1
1
De
c-1
1
Ap
r-1
2
Au
g-1
2
De
c-1
2
Ap
r-1
3
Au
g-1
3
De
c-1
3
Ap
r-1
4
Au
g-1
4
De
c-1
4
Ap
r-1
5
Au
g-1
5
Manufacturing+Property
Infra (Transportation)
Infra (Water/Edu/Health/Sports)
China FAI yoy growth (%, 3m rolling avg)

November 6, 2015 China
Goldman Sachs Global Investment Research 13
2. China isn’t just selling toys and textiles, it is exporting high-
speed rail and nuclear technology
China is losing market share (in the US and EU) in low-value-added products (textiles, toys)
to other developing nations on compressing cost advantage but it is still grabbing global
(and domestic) market shares in higher value-added goods, notably consumer electronics
and industrial equipment.
Looking ahead, we see China moving further up the value-added curve, with
transportation (high-speed rail), telecommunication, power-related (nuclear and coal-fire)
infrastructure equipment/technology potentially being the emerging exports growth drivers
given China’s rising R&D intensity and structural policy tailwinds (the ‘one-belt, one-road’
strategy).
Exhibit 19: China’s aggregate market shares in the US
and EU have remained stable
Exhibit 20: China has actually gained market shares in
the high-end tech products
Source: CEIC.
Source: CEIC, OECD, Goldman Sachs Global Investment Research.
Exhibit 21: China isn’t just selling toys and textiles, it is exporting power equipment and
high-end machinery
Source: CEIC.
0.6
0.7
0.8
0.9
1
1.1
1.2
1.3
1.4
1.5
Ju
n-0
6
Ju
n-0
7
Ju
n-0
8
Ju
n-0
9
Ju
n-1
0
Ju
n-1
1
Ju
n-1
2
Ju
n-1
3
Ju
n-1
4
Ju
n-1
5China Japan MalaysiaMexico Korea Taiwan
Indonesa
Market share in exports to the US and EU (non-energy, non-
materials) (indexed to May 2006)
0%
10%
20%
30%
40%
Dec-0
1
Dec-0
2
Dec-0
3
Dec-0
4
Dec-0
5
Dec-0
6
Dec-0
7
Dec-0
8
Dec-0
9
Dec-1
0
Dec-1
1
Dec-1
2
Dec-1
3
Dec-1
4
lowest tech
medium-low tech
medium-high tech
high tech
China's market share in the US and EU by tech intensity
(12m moving avg)
42.8
39.97.5
9.7
2
3
4
5
6
7
8
9
10
20
25
30
35
40
45
50
2002
2003
2004
2005
2006
2007
2008
2009
2010
2011
2012
2013
2014
Miscellaneous Articles (incl. toys,
footwear, textiles)
Power Machinery & Equip - RHS
China as % of total US + EU imports(%) (%)

November 6, 2015 China
Goldman Sachs Global Investment Research 14
3. China is still consuming commodities, but more ‘opex’ less ‘capex’
In their recent pieces, our commodity strategists decompose commodities into ‘capex’ and
‘opex’ categories. Capex commodities are used in heavy industry to create infrastructure
and the foundations of an economy; they include iron ore, coking coal, steel, cement and,
to a lesser extent, copper. In contrast, opex commodities are consumed to keep the
economy operating and include oil, natural gas, nickel (stainless steel) and aluminum
(packaging). In other words, buildings are constructed with capex commodities, but are
maintained—heated and cooled—with opex commodities.
Based on this classification, our commodity strategists find that the more investment- or
capex-intensive the commodity, the weaker the demand growth, and the more consumer-
or opex-intensive the commodity, the stronger the demand growth. For example, demand
is declining by 5.0% yoy for cement, a highly investment-intensive commodity, while
demand for gasoline, an extremely consumer-intensive commodity, is growing at 17.4%
yoy. This demand pattern suggests that the much-talked rebalancing is also underway in
the ‘old economy’ space.
See Commodities Research: What China’s rebalancing means for commodities, Oct 12.
Exhibit 22: The demand between opex and capex commodities is also a strong statement
of the rebalancing
Source: IEA, WoodMackenzie, CRU, USDA, Goldman Sachs Global Investment Research.
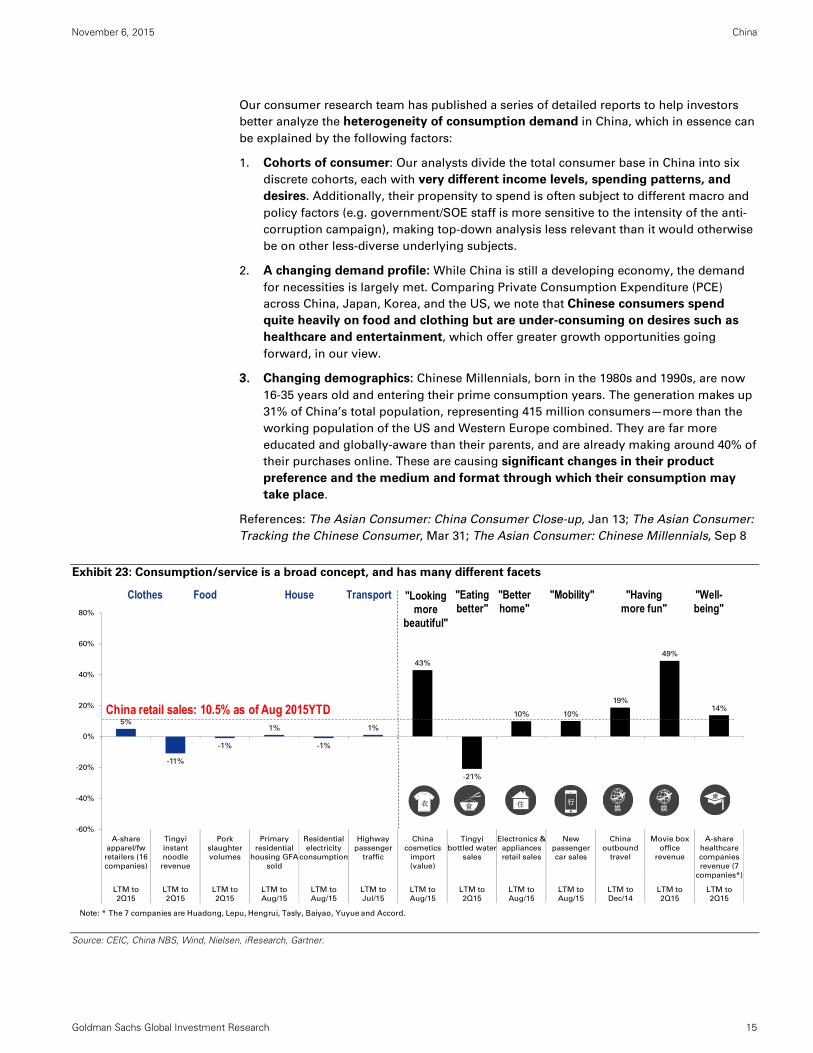
4. Consumption is a secular theme, but with many facets
So far, our top-down economic expectations and arguments suggest that consumption/
services could be a secular and compelling macro theme in China for years to come;
however, we acknowledge that consumption is a broad concept and not all consumption
items may fare well in the ‘new normal’.
For example, in Exhibit 23, we note significant growth variances among consumption
items ranging from necessities like food and clothes to discretionary spending on
entertainment and travel.
-10 -5 0 5 10 15 20
Cement
Thermal Coal
Steel
Iron Ore
Met Coal
Wheat*
Cotton*
Copper
Corn*
Sugar*
Diesel
Naptha
Oil (total)
Nickel**
Coffee*
Soybean*
Aluminium
Zinc***
Kerosene
Gasoline
Op
Ex
co
mm
od
itie
Ca
pE
x
co
mm
od
itie
s
*Est. 2015 annual consumption growth (no monthly data) ; **calculated from apparent Stainless
Steel demand; ***calculated from zinc galv. production
China consumption growth
2015 ytd (% yoy)
November 6, 2015 China
Goldman Sachs Global Investment Research 15
Our consumer research team has published a series of detailed reports to help investors
better analyze the heterogeneity of consumption demand in China, which in essence can
be explained by the following factors:
1. Cohorts of consumer: Our analysts divide the total consumer base in China into six
discrete cohorts, each with very different income levels, spending patterns, and
desires. Additionally, their propensity to spend is often subject to different macro and
policy factors (e.g. government/SOE staff is more sensitive to the intensity of the anti-
corruption campaign), making top-down analysis less relevant than it would otherwise
be on other less-diverse underlying subjects.
2. A changing demand profile: While China is still a developing economy, the demand
for necessities is largely met. Comparing Private Consumption Expenditure (PCE)
across China, Japan, Korea, and the US, we note that Chinese consumers spend
quite heavily on food and clothing but are under-consuming on desires such as
healthcare and entertainment, which offer greater growth opportunities going
forward, in our view.
3. Changing demographics: Chinese Millennials, born in the 1980s and 1990s, are now
16-35 years old and entering their prime consumption years. The generation makes up
31% of China’s total population, representing 415 million consumers—more than the
working population of the US and Western Europe combined. They are far more
educated and globally-aware than their parents, and are already making around 40% of
their purchases online. These are causing significant changes in their product
preference and the medium and format through which their consumption may
take place.
References: The Asian Consumer: China Consumer Close-up, Jan 13; The Asian Consumer:
Tracking the Chinese Consumer, Mar 31; The Asian Consumer: Chinese Millennials, Sep 8
Exhibit 23: Consumption/service is a broad concept, and has many different facets
Source: CEIC, China NBS, Wind, Nielsen, iResearch, Gartner.
5%
-11%
-1%
1%
-1%
1%
43%
-21%
10% 10%
19%
49%
14%
-60%
-40%
-20%
0%
20%
40%
60%
80%
A-share
apparel/fw
retailers (16
companies)
Tingyi
instant
noodle
revenue
Pork
slaughter
volumes
Primary
residential
housing GFA
sold
Residential
electricity
consumption
Highway
passenger
traffic
China
cosmetics
import
(value)
Tingyi
bottled water
sales
Electronics &
appliances
retail sales
New
passenger
car sales
China
outbound
travel
Movie box
office
revenue
A-share
healthcare
companies
revenue (7
companies*)
LTM to
2Q15
LTM to
2Q15
LTM to
2Q15
LTM to
Aug/15
LTM to
Aug/15
LTM to
Jul/15
LTM to
Aug/15
LTM to
2Q15
LTM to
Aug/15
LTM to
Aug/15
LTM to
Dec/14
LTM to
2Q15
LTM to
2Q15
康行
娱住食衣
娱
China retail sales: 10.5% as of Aug 2015YTD
Clothes Food House "Eating better"
Transport "Mobility" "Havingmore fun"
"Well-being"
"Better home"
"Looking more
beautiful"
Note: * The 7 companies are Huadong, Lepu, Hengrui, Tasly, Baiyao, Yuyue and Accord.

November 6, 2015 China
Goldman Sachs Global Investment Research 16
Exhibit 24: Chinese consumers are already spending a lot on food and clothing, but under-spend on healthcare and
entertainment, which offer the greater growth opportunities going forward, in our view
Source: Euromonitor, CEIC, Goldman Sachs Global Investment Research.
0
1
2
3
4
5
6
7
8
9
10
Looking more
beautiful
Eating better Better home Mobility/connectivity Having more fun Well-being
China
Korea
Japan
US
PCE per capita (k US$, 2013)
0%
5%
10%
15%
20%
25%
30%
35%
Looking more
beautiful
Eating better Better home Mobility/connectivity Having more fun Well-being
China
Korea
Japan
US
As % of aggregate PCE per capita (%, 2013)

November 6, 2015 China
Goldman Sachs Global Investment Research 17
New framework for investing in Chinese equities
Drawbacks of the conventional top-down framework
1. In our view, widely-followed Chinese equity indexes are not a good proxy for the
Chinese economy. For instance, Financials account for 72%/33%/42% of
HSCEI/SCHOMP/MXCN index cap, vs. around 13% in value-added terms by GDP
accounting. Similarly, while the service sector (ex Financials) currently represents 35%
of the economy, the associated equity sectors (healthcare, consumer
discretionary/staples, and transportation) have a smaller weighting in the indexes. Due
to this fundamental mismatch, we would caution against the common practice of
extracting macro views from aggregate index performance.
2. Returns variation within each index has also risen, possibly reflecting the fundamental
divergences between ‘New’ and ‘Old’ China (more on this below). Indeed, indexes
with higher ‘New China’ weightings have performed well in the past three years,
reinforcing the argument that deriving macro views from equity indexes could lead to
markedly different conclusions.
3. Investors often trade and formulate their views on Chinese equities based on ‘Old
China’ oriented indicators, such as IP and manufacturing PMI. We concur that these
indicators still provide useful signals in the industrial/manufacturing part of the
economy, but they may not offer a comprehensive macro view as they did in the past
given the rising GDP shares of consumption and other emerging industries.
Exhibit 25: We don’t think the commonly-followed Chinese equity indexes are good
representation of the underlying economy
Source: CEIC, Goldman Sachs Global Investment Research.
9%
7%
36%
10%
13%
5%
20%
0%
20%
40%
60%
80%
100%
2014 GDP
composition
TI - Others
TI - Transport
TI - Financials
TI - Wholesale
& Retail
SI - Industrials
SI -
Construction
PI
China GDP Composition
5% 3% 5%
11% 8%
14%
4%
9%
20%
42%
72%
33%
8% 12%
11%
5% 3% 9%
0%
20%
40%
60%
80%
100%
MXCN HSCEI SHCOMP
Cons Disc
Cons Stap
Energy
Financials
Health Care
Industrials
IT
Materials
Telecom
Utilities
Index sector weight

November 6, 2015 China
Goldman Sachs Global Investment Research 18
Exhibit 26: US equity index seems to be a reasonable proxy for the US economy
Note: Consumers include Wholesale and retail trade, professional services, recreation and other services; Industrials include manufacturing and transportation
Source: CEIC, Goldman Sachs Global Investment Research.
Exhibit 27: Investors have been trading HSCEI based on
IP momentum until recently
Exhibit 28: Indexes with high ‘New China’ content have
generally performed well, although with high volatility
Source: Bloomberg, NBS, Goldman Sachs Global Investment Research.
Source: Bloomberg, FactSet, Goldman Sachs Global Investment Research.
Exhibit 29: Return variances have been high in both offshore and onshore markets, partly reflecting the divergent
fundamental trends among various economic groups
Source: FactSet, Goldman Sachs Global Investment Research.
Source: FactSet, Goldman Sachs Global Investment Research.
3%
21%
10%
15%
16%
7%
10%
14%
0%
20%
40%
60%
80%
100%
GICS sector
Cons Disc
Cons Stap
Energy
Financials
Health Care
Industrials
IT
Materials
Telecom
Utilities
MXUS sector weight
13%
5%
15%
8%
20%
3%
30%
0%
20%
40%
60%
80%
100%
2014 GDP
composition
Consumers
Mining
Financials
Education &
Health CareIndustrials
Information
Construction
Utilities
Agriculture
US GDP composition
0
4
8
12
16
20
6000
8000
10000
12000
14000
16000
Dec-0
6
Dec-0
7
Dec-0
8
Dec-0
9
Dec-1
0
Dec-1
1
Dec-1
2
Dec-1
3
Dec-1
4
Dec-1
5
HSCEI index
IP growth (qoq ann)
HSCEI index IP growth (qoq ann, %)
-10%
0%
10%
20%
30%
40%
50%
60%
12% 16% 20% 24% 28% 32%
3-y
ear
retu
rn C
AG
R (
Lo
c)
Annualized volatility (3-year daily return)
Bubble size represents New
China as % of Index Cap
MXCN
MXCN
(+ADRs)
HSCEI
SZCOMP
SHCOMP
Chi-
next
CSI300
China
ADRs
HSI
A50
Note: We use MXOCN for China ADRs
-80%
-60%
-40%
-20%
0%
20%
40%
60%
80%
100%
120%
Ma
y-1
1
Au
g-1
1
No
v-1
1
Fe
b-1
2
Ma
y-1
2
Au
g-1
2
No
v-1
2
Fe
b-1
3
Ma
y-1
3
Au
g-1
3
No
v-1
3
Fe
b-1
4
Ma
y-1
4
Au
g-1
4
No
v-1
4
Fe
b-1
5
Ma
y-1
5
Au
g-1
5
Rolling12M ReturnsIndex Constituent Return (+/- 1SD)
MXCN Index
-3%
+1SD: 24%
-1SD: -31%
-100%
-50%
0%
50%
100%
150%
200%
250%
300%
Ma
y-1
1
Au
g-1
1
No
v-1
1
Fe
b-1
2
Ma
y-1
2
Au
g-1
2
No
v-1
2
Fe
b-1
3
Ma
y-1
3
Au
g-1
3
No
v-1
3
Fe
b-1
4
Ma
y-1
4
Au
g-1
4
No
v-1
4
Fe
b-1
5
Ma
y-1
5
Au
g-1
5
Rolling12M ReturnsIndex Constituent Return (+/- 1SD)
CSI 300 Index
41%
+1SD: 83%
-1SD: -1%

November 6, 2015 China
Goldman Sachs Global Investment Research 19
Our top-down framework for identifying ‘New China’
Given the constraints described above, and the need for a more systematic recognition of
the economic transformation, we enhance our ‘New China’ analytical framework based on
the following approach/logic (also see China Strategy: China FAQs, Sep 7):
1. Leveraging the financial database we compiled in our report: China Strategy: Key
micro trends in a macro-driven market, Sep 25, we aggregate 3,636 listed Chinese
companies (A, H, and ADRs) and organize them according to their GICS-4 sub-
industries (143 in total), the most granular industry level based on MSCI sector
classification.
2. We then group the sub-industries which have generated at least 10% revenue growth
since 2012 (i.e. FY2012, 2013, 2014). We prefer revenue growth over earnings growth
as the former appears a better proxy for underlying demand and is less subject to
industry competition and capital structure differences which impact earnings. This
procedure results in 52 sub-industries.
3. Then, we run correlation analysis to further screen for sub-industries which have
exhibited low revenue growth correlation with GDP growth, with an implicit view
that these sub-industries have been able to deliver consistently high top-line growth on
untapped and new demand despite the economic slowdown and policy cyclicality—the
essence of ‘New China’. This gives us 30 sub-industries which form our ‘New China’
universe, after eliminating those with insignificant number of companies and market
cap, and special revenue recognition accounting (e.g. property developers). For the
sub-industries which don’t fall into the ‘New China’ group, we put them in the ‘Old
China’ bucket.
Exhibit 31 shows the sectoral composition of our ‘New China’ universe, which comprises
671 companies (18% of total) with an aggregate market cap of US$1.8tn (21% of total),
across the A, H, and ADR markets.
In fundamental terms, ‘New China’ managed to grow top-line and bottom-line by 35%
and 47% respectively in 1H15 despite investors’ prevalent concerns about China macro.
At the other side of the spectrum, revenue growth for ‘Old China’ was essentially flat in
1H15, although slight margin expansion (mostly from Financials due to the buoyant stock
markets in 1H) helped lift earnings growth to 7%.
Valuation-wise, ‘New China’ trades at much higher absolute valuations than ‘Old China’ but
the valuation premiums look less discomforting when the former’s earnings growth
potential is put into perspective: ‘New China’ is trading at 1.1X PEG, vs. 1X of ‘Old
China’.
These attributes have led to strong outperformance of ‘New’ vs. ‘Old’: Over the past 3/5
years, ‘New China’ has rallied 126%/97%, while ‘Old China’ has gained 55%/18% vs.
benchmark (MSCI All China) of 35%/30%. See comparison on other fundamental metrics
in the Appendix.
Exhibit 30: Our top-down logic and process to identify ‘New China’ sectors and stocks
Source: Goldman Sachs Global Investment Research.
• 3636 companies
• US$8.7tn mkt
cap
• 143 GICS sub-
industries
2012,13,14 revenue growth ≥ 10%
≥ 2 companies in a sub-industry
Correlation between 2011-1H15 revenue growth and real GDP growth ≤ 54% (median of 143 sub-industries)
• 1113
companies
• US$3.7tn
mkt cap
• 52 GICS
sub-
industries
• 885
companies
• US$2.3tn mkt
cap
• 35 GICS sub-
industries
• 671 companies
• US$1.8tn mkt
cap
• 30 GICS sub-
industries

November 6, 2015 China
Goldman Sachs Global Investment Research 20
Exhibit 31: We form our ‘New China’ universe based on the following sub-industries
Source: FactSet, Goldman Sachs Global Investment Research.
Exhibit 32: ‘New China’ has significantly outperformed ‘Old China’ at both top- and bottom-line levels
Source: Bloomberg, Wind, MSCI, Goldman Sachs Global Investment Research.
Exhibit 33: ‘China New’ trades at much higher absolute
valuations than ‘Old China’....
Exhibit 34: ...but the valuation premiums look more
moderate when forward growth is taken into account
Note: f-PEG = forward 12-month PE / second 12-month EPS growth
Source: FactSet, I/B/E/S, Goldman Sachs Global Investment Research.
Source: FactSet, I/B/E/S, Goldman Sachs Global Investment Research.
GICS sector
Cable & Satellite Internet Retail
Education Services Movies & Entertainment
Consumer Staples Drug Retail Household Products
EnergyOil & Gas Equipment &
Services
Asset Management & Custody
BanksProperty & Casualty Insurance
Consumer Finance Real Estate Services
Life & Health Insurance
Biotechnology Health Care Technology
Health Care Distributors Life Sciences Tools & Services
Health Care Equipment Pharmaceuticals
Health Care Services
Aerospace & DefenseHuman Resource &
Employment Services
Diversified Support Services Trucking
Environmental & Facilities
Services
Electronic Equipment &
InstrumentsIT Consulting & Other Services
Internet Software & Services Systems Software
Telecom Alternative Carriers
Utilities Water Utilities
Consumer Discretionary
Health Care
Industrials
Information Technology
GICS sub-industry
Financials
3% 4%5%
10%
37% 7%
7%
20%
25%
15%
29%
2%
8%
6%
8% 12%
0%
20%
40%
60%
80%
100%
New China Old China
Cons Disc
Cons Stap
Energy
Financials
Health Care
Industrials
Tech
Materials
Telecom
Utilities
Sector weight
47%
7%
-40%
-20%
0%
20%
40%
60%
80%
100%
120%
2006
2007
2008
2009
2010
2011
2012
2013
2014
1H
15
New China
Old China
Earnings growth (yoy)
35%
0%
-5%
0%
5%
10%
15%
20%
25%
30%
35%
40%
2006
2007
2008
2009
2010
2011
2012
2013
2014
1H
15
New China Old China
Revenue growth (yoy)
25
12
5
10
15
20
25
30
35
Ja
n-1
0
Ju
n-1
0
No
v-1
0
Ap
r-1
1
Sep
-11
Fe
b-1
2
Ju
l-1
2
De
c-1
2
Ma
y-1
3
Oct-
13
Ma
r-14
Au
g-1
4
Ja
n-1
5
Ju
n-1
5
New China
Old China
Market cap-weighted f-P/E (x)
1.1
1.0
0.5
0.7
0.9
1.1
1.3
Jan
-10
Ju
n-1
0
No
v-1
0
Ap
r-1
1
Sep
-11
Feb
-12
Ju
l-12
Dec-1
2
May-1
3
Oct-
13
Mar-
14
Au
g-1
4
Jan
-15
Ju
n-1
5
New China
Old China
Market cap-weighted f-PEG (x)

November 6, 2015 China
Goldman Sachs Global Investment Research 21
Improving risk/reward: Our select 19 New China ideas
While we believe our ‘New China’ universe provides a sensible hunting ground for long-
term investment opportunities, we also acknowledge that high valuations and risks about
profitability normalization, which is common for emerging industries due to lower entry
barrier and intensifying competition, have historically deterred investors from this
attractive macro story.
As such, we add two qualifiers—valuation and profitability—to our ‘New China’ universe
to improve our implementation strategy. Specifically, we further narrow the universe by
selecting stocks which fulfill the following criteria:
a. At least 10% revenue and earnings CAGR from 2015 to 2017;
b. At least 10% average ROE from 2015 to 2017;
c. Price-to-earnings-growth (PEG) ratio below 1.5;
d. Average 2015-2017 ROE not higher than 10pp above global comps (based on MSCI
All Country World index constituents);
e. Non Sell-rated by GS/GH analysts (i.e. rated Buy or Neutral).
We believe these considerations should help reduce the risk of buying ‘New China’
stocks at unsustainably high valuations at peak profitability, which would have
‘double-whammy’ impact on returns when growth starts to normalize.
These parameters yield 19 names, 10 in offshore and 9 in onshore markets, and based on a
back-test have resulted in greater outperformance vs. the broad ‘New China’ universe and
‘Old China’ (see Exhibit 35).
Conviction Buy names include: Shanghai Fosun Pharma (A), and PingAn (A). Names that
are not under GS/GH coverage are shown in the Appendix.
Exhibit 35: ‘New China’ has meaningfully outperformed ‘Old China’
Source: FactSet, MSCI, Goldman Sachs Global Investment Research.
236
197
130
118
50
100
150
200
250
300
Ja
n-1
0
May-1
0
Se
p-1
0
Ja
n-1
1
May-1
1
Se
p-1
1
Ja
n-1
2
May-1
2
Se
p-1
2
Ja
n-1
3
May-1
3
Se
p-1
3
Ja
n-1
4
May-1
4
Se
p-1
4
Ja
n-1
5
May-1
5
Se
p-1
5
Select New China names (19 stocks)
New China
MSCI All China Index
Old China
Market cap-weighted price returns

November 6, 2015 China
Goldman Sachs Global Investment Research 22
Index users: Choose your ‘New’ indexes
The return profile (risk and return) is substantially different among key Chinese
equity indexes. For example, HSCEI has lost 3% in the past three years, while at the
other extreme ChiNext has rallied 268% during the same period.
The strong returns variations (and the extent of multiple expansion) seem positively
correlated with the index weighting of ‘New China’, which ultimately reflects the
earnings growth differentials among these indexes. These observations reinforce our
view that:
1. Strategically, MSCI China should continue to outperform HSCEI in the offshore
market given the former’s higher exposure in ‘New China’, especially after the
ADRs inclusion to the MSCI universe which will begin in mid-November. See
China Musings: Q&As on ADRs inclusion in MSCI, Oct 23;
2. In similar vein, we believe the fundamental outlook for SZCOMP and ChiNext is
more promising than SHCOMP or A50, although the high valuation premiums of
the former two over the ‘Old China’ indexes have complicated the expected return
function. As such, CSI300 looks like a more balanced index considering its
relatively high ‘New China’ weighting than SHCOMP and A50, but more moderate
valuation profile compared with SZCOMP and ChiNext.
Exhibit 36: Chinese equity indexes have delivered
markedly different returns...
Exhibit 37: ...with the ones with higher ‘New China’
weighting seeing higher PE expansion and returns
Source: Bloomberg, Goldman Sachs Global Investment Research.
Source: Bloomberg, Goldman Sachs Global Investment Research.
Exhibit 38: We think MSCI China and CSI300 offer a more balance growth and valuation trade-off to investors
Source: Bloomberg, FactSet, Goldman Sachs Global Investment Research.
268%
142%
94%63% 57%
41%
5% 4%
-3%-50%
0%
50%
100%
150%
200%
250%
300%
-50%
0%
50%
100%
150%
200%
250%
300%
Ch
ine
xt
SZ
CO
MP
CN
AD
Rs
SH
CO
MP
CS
I 3
00
A5
0
MX
CN
HS
I
HS
CE
I
Price Performance
Forward EPS change
Forward P/E change
% change % changeReturn decomposition, past 3 years
-10%
-5%
0%
5%
10%
15%
20%
25%
0% 5% 10% 15% 20% 25% 30% 35%
f-P
/E C
han
ge
(3
-yr
CA
GR
)
Forward EPS growth (3-year CAGR)
Bubble size represents New
China as % of Index Cap
MXCN
HSCEI
SZCOMP
SHCOMP
Chi-
next
CSI300
China
ADRs
HSIA50
Note: We use MXOCN for China ADRs
0
20
40
60
80
100
5
10
15
20
25
30
35
40
45
Ch
inex
t
CN
AD
Rs
SZ
CO
MP
SH
CO
MP
CS
I 3
00
HS
I
MX
CN
A5
0
HS
CE
I
2016E P/E (X) (LHS)
New China proportion (%) (RHS)
16E P/E (X) (%)
Note: we use MXOCN for China ADRs
0
20
40
60
80
100
0.5
0.7
0.9
1.1
1.3
1.5
Ch
inex
t
SZ
CO
MP
CS
I 3
00
SH
CO
MP
HS
I
A50
CN
AD
Rs
MX
CN
HS
CE
I
2016E PEG ratio (X) (LHS)
New China proportion (%) (RHS)
16E PEG ratio (X) (16E PE/ 17E EPSg) (%)
Note: we use MXOCN for China ADRs

November 6, 2015 China
Goldman Sachs Global Investment Research 23
Global funds/corporates: Adaptability is the key to success
The changing Chinese growth dynamics are impacting the way that global
corporates are doing business in China, and global funds which invest in these
companies. Indeed, from a macro perspective, China has become an important final-
demand destination for many economies globally.
But, selling into China isn’t as easy as in the past: Local firms are gaining market
share in a number of consumer/industrial products at the expense of foreign brands.
We attribute this to: a) rising local technological capability on strong R&D inputs; b)
greater focus by local firms on building brands to defend margins; c) better
understanding of customer needs; and d) more flexible selling/distribution channels
thanks to the proliferation of e-commerce (e.g. Xiaomi sells its smartphones online).
The situation isn’t gloomy for all foreign brands, notably in personal consumption
areas where Japanese/Western beer brands are outperforming domestic ones, H&M,
Uniqlo, Nike, Starbucks, and Korean cosmetic brands are still logging robust revenue
growth, although luxury retailers, global fast food chains, high-end hotels, and dairy
companies have been struggling. These micro data-points suggest that:
1. The classic EM story—low per capita income, low product penetration, high
pent-up demand—has largely played out in China. This means business
strategy relying on untapped demand and perception arbitrage (foreign brand
image) is probably outdated.
2. Global companies with strong brand equity, unique product offering and value
proposition, and those which target the right consumer cohorts with the right
products should have a higher likelihood of success.
Exhibit 39: China is an important end-customer for many
Asian and EM countries
Exhibit 40: Local players have gained market share in a
number of consumer and industrial products
Source: CEIC, Haver, Goldman Sachs Global Investment Research. Source: Gartner, Shangshi Consulting, GS Global Investment Research.
Exhibit 41: Lower shares of industrial sales by foreign co. Exhibit 42: Not all foreign firms are doing badly in China
Source: NBS, CEIC, Wind. Source: Company, Wind, ChinaAutoMarket, GS Global Investment Research.
0%
4%
8%
12%
16%
20%
24%
HK TW MY SG KR TH CL PH ZA ID RU IL BR IN
To China To G3
Final demand destination's share of
trade in value added
% GDP
18%
29%
39% 39%
66%
37%
46%
69%
10%
20%
30%
40%
50%
60%
70%
80%
Smartphone Autos Excavator Consumer
electronics
2011* Latest data**
Market share of domestic players in China
*Autos market share is as of 2012
**All data is as of June 2015 except Consumer electronics which is as of Dec 14
32%
23%
20%
22%
24%
26%
28%
30%
32%
34%
20
00
20
01
20
02
20
03
20
04
20
05
20
06
20
07
20
08
20
09
20
10
20
11
20
12
20
13
20
14
Foreign as % of total industrial sales in China
Foreign
enterprises
(Incl. HK/TW)
11%
10%
0%
-10%
-6%
50%
29%
14%
-10%
18%
13%
34%
10%
-20% -10% 0% 10% 20% 30% 40% 50% 60%
Asahi China (LC)
Heineken APAC Volume
CRE Beer
Yanjing Brewery
Tsingtao Brewery
Uniqlo China (LC)
H&M China
Semir Garment
Metersbonwe
BMW volume (local made)
Audi volume (local made)
Mercedes-Benz volume (local made)
Overall new passenger
Beer
Apparel
Auto
LTM to 2Q15
FY14 (Aug)
LTM to 2Q15
LTM to 2Q15
LTM to 2Q15
LTM to 2Q15
LTM to 2Q15
LTM to 2Q15
LTM to 2Q15
LTM to Jul/15
LTM to Jul/15
LTM to Jul/15
LTM to Aug/15car sales volume
Global
Global
Global
Local
Local
Local
Revenue
growth trend(Global vs. Local
brands)

November 6, 2015 China
Goldman Sachs Global Investment Research 24
EM investors: Buy ‘New China’ to reduce tracking errors
As flagged in our recent pieces, we believe China’s index weight will continue to
rise in both EM (MXEF) and regional (AP, APJ and ASJ) contexts due mainly to
inclusions of currently off-benchmark universes and stocks (e.g. ADRs and potentially
A shares).
‘New China’ will be the key contributor to the rising index weight, not only because
it is currently off benchmark but also since it is expected by consensus to deliver
higher earnings growth than current index constituents.
Our positioning analysis based on different sample universes reveals that:
1. GEM investors are currently underweight China offshore stocks (including
MSCI HK names which have high China revenue exposures) by around 210bps
(300bps ex HK) relative to the benchmark weight; and
2. GEM funds are effectively underweight the China IT sector (in an EM context) by
close to 300bps on a pro-forma basis (end May 2016), the second most
underweight sector behind China Financials.
These imply that: a) GEM funds will have a big positioning gap to fill in terms of their high
tracking errors on China on a pro-forma basis; and b) China Tech and other ‘New China’
stocks appear a sensible vehicle for investors to close this gap, considering light
positioning and strong fundamentals.
Exhibit 43: Higher index weights from China, mostly
contributed by ‘New China’
Exhibit 44: GEM investors are currently underweight
China by 300bps and over 700bps on a pro-forma basis
Source: FactSet, MSCI, Goldman Sachs Global Investment Research.
Source: EPFR, MSCI, Goldman Sachs Global Investment Research.
Exhibit 45: GEM funds are underweight China tech by close to 300bps on a forward basis
Source: FactSet, LionShares, MSCI, Goldman Sachs Global Investment Research.
23%
5.6%
14%
0%
10%
20%
30%
40%
50%
China All
(IF*=100%)
China A
(IF*=100%)
China ADR
MSCI China
Pro-forma weight in MSCI EM Index
42%
New China
Contribution 5.7%
13%
* assume 100% Inclusion Factor for MXCN-A to be included in MSCI Country Index
-306
194
-726
-800
-600
-400
-200
0
200
400
Sep
-05
Sep
-06
Sep
-07
Sep
-08
Sep
-09
Sep
-10
Sep
-11
Sep
-12
Sep
-13
Sep
-14
Sep
-15
bpChina/HK allocation in GEM mutual funds (OW/UW)
Note (1): Overall GEM mutual funds AUM ~ US$190bn
Note (2): Based on EPFR survey data vs. MSCI EM benchmark
Hong Kong(Off-benchmark allocation)
China Offhsore
(excl. HK)Pro-forma China UW
after ADR inclusions
China Holdings of EM Active managers
73 4917 9 3
-56 -74-102 -108
-565
-10
-381
22 12 5
-45-68 -88 -98
-511-600
-500
-400
-300
-200
-100
0
100
Co
ns.
Dis
c.
IT
Co
ns.
Sta
p.
Mate
rials
He
alt
h C
are
Ind
ustr
ials
Uti
liti
es
En
erg
y
Te
leco
m
Fin
an
cia
ls
China Pro-forma China
Overweight Underweight Marketweight
EM funds China allocation
(OW/UW, bp)
Based on sample of Top
200 EM funds (AUM:
US$ 320 bn); as of Aug
2015
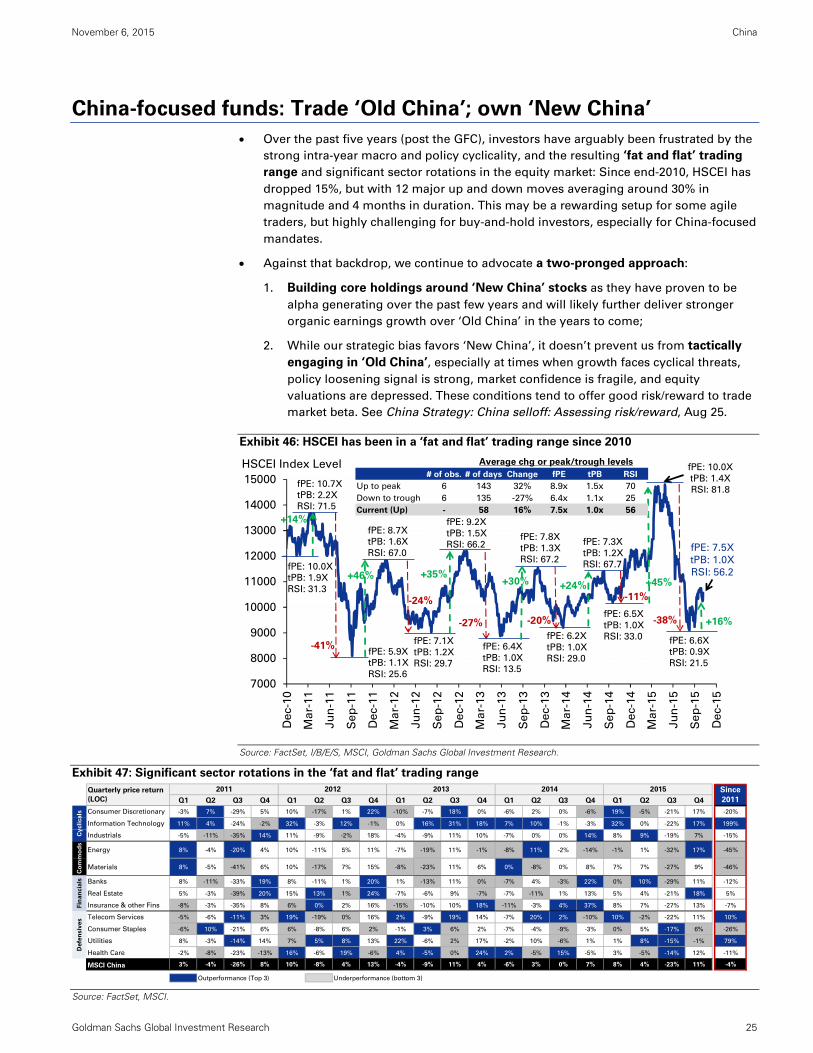
November 6, 2015 China
Goldman Sachs Global Investment Research 25
China-focused funds: Trade ‘Old China’; own ‘New China’
Over the past five years (post the GFC), investors have arguably been frustrated by the
strong intra-year macro and policy cyclicality, and the resulting ‘fat and flat’ trading
range and significant sector rotations in the equity market: Since end-2010, HSCEI has
dropped 15%, but with 12 major up and down moves averaging around 30% in
magnitude and 4 months in duration. This may be a rewarding setup for some agile
traders, but highly challenging for buy-and-hold investors, especially for China-focused
mandates.
Against that backdrop, we continue to advocate a two-pronged approach:
1. Building core holdings around ‘New China’ stocks as they have proven to be
alpha generating over the past few years and will likely further deliver stronger
organic earnings growth over ‘Old China’ in the years to come;
2. While our strategic bias favors ‘New China’, it doesn’t prevent us from tactically
engaging in ‘Old China’, especially at times when growth faces cyclical threats,
policy loosening signal is strong, market confidence is fragile, and equity
valuations are depressed. These conditions tend to offer good risk/reward to trade
market beta. See China Strategy: China selloff: Assessing risk/reward, Aug 25.
Exhibit 46: HSCEI has been in a ‘fat and flat’ trading range since 2010
Source: FactSet, I/B/E/S, MSCI, Goldman Sachs Global Investment Research.
Exhibit 47: Significant sector rotations in the ‘fat and flat’ trading range
Source: FactSet, MSCI.
7000
8000
9000
10000
11000
12000
13000
14000
15000
De
c-1
0
Ma
r-11
Ju
n-1
1
Se
p-1
1
De
c-1
1
Ma
r-12
Ju
n-1
2
Se
p-1
2
De
c-1
2
Ma
r-13
Ju
n-1
3
Se
p-1
3
De
c-1
3
Ma
r-14
Ju
n-1
4
Se
p-1
4
De
c-1
4
Ma
r-15
Ju
n-1
5
Se
p-1
5
De
c-1
5
HSCEI Index Level
+30%+46%
-41%
+35%
-24%
-27% -20%
+14%
fPE: 10.0X
tPB: 1.9X
RSI: 31.3
fPE: 5.9X
tPB: 1.1X
RSI: 25.6
fPE: 7.1X
tPB: 1.2X
RSI: 29.7
fPE: 6.4X
tPB: 1.0X
RSI: 13.5
fPE: 6.2X
tPB: 1.0X
RSI: 29.0
fPE: 10.7X
tPB: 2.2X
RSI: 71.5
fPE: 8.7X
tPB: 1.6X
RSI: 67.0
fPE: 9.2X
tPB: 1.5X
RSI: 66.2fPE: 7.8X
tPB: 1.3X
RSI: 67.2
fPE: 10.0X
tPB: 1.4X
RSI: 81.8
+45%+24%-11%
-38% +16%
fPE: 7.3X
tPB: 1.2X
RSI: 67.7
fPE: 6.5X
tPB: 1.0X
RSI: 33.0
fPE: 7.5X
tPB: 1.0X
RSI: 56.2
fPE: 6.6X
tPB: 0.9X
RSI: 21.5
# of obs. # of days Change fPE tPB RSI
Up to peak 6 143 32% 8.9x 1.5x 70
Down to trough 6 135 -27% 6.4x 1.1x 25
Current (Up) - 58 16% 7.5x 1.0x 56
Average chg or peak/trough levels
Q1 Q2 Q3 Q4 Q1 Q2 Q3 Q4 Q1 Q2 Q3 Q4 Q1 Q2 Q3 Q4 Q1 Q2 Q3 Q4
Consumer Discretionary -3% 7% -29% 5% 10% -17% 1% 22% -10% -7% 18% 0% -6% 2% 0% -6% 19% -5% -21% 17% -20%
Information Technology 11% 4% -24% -2% 32% -3% 12% -1% 0% 16% 31% 18% 7% 10% -1% -3% 32% 0% -22% 17% 199%
Industrials -5% -11% -35% 14% 11% -9% -2% 18% -4% -9% 11% 10% -7% 0% 0% 14% 8% 9% -19% 7% -15%
Energy 8% -4% -20% 4% 10% -11% 5% 11% -7% -19% 11% -1% -8% 11% -2% -14% -1% 1% -32% 17% -45%
Materials 8% -5% -41% 6% 10% -17% 7% 15% -8% -23% 11% 6% 0% -8% 0% 8% 7% 7% -27% 9% -46%
Banks 8% -11% -33% 19% 8% -11% 1% 20% 1% -13% 11% 0% -7% 4% -3% 22% 0% 10% -29% 11% -12%
Real Estate 5% -3% -39% 20% 15% 13% 1% 24% -7% -6% 9% -7% -7% -11% 1% 13% 5% 4% -21% 18% 5%
Insurance & other Fins -8% -3% -35% 8% 6% 0% 2% 16% -15% -10% 10% 18% -11% -3% 4% 37% 8% 7% -27% 13% -7%
Telecom Services -5% -6% -11% 3% 19% -19% 0% 16% 2% -9% 19% 14% -7% 20% 2% -10% 10% -2% -22% 11% 10%
Consumer Staples -6% 10% -21% 6% 6% -8% 6% 2% -1% 3% 6% 2% -7% -4% -9% -3% 0% 5% -17% 6% -26%
Utilities 8% -3% -14% 14% 7% 5% 8% 13% 22% -6% 2% 17% -2% 10% -6% 1% 1% 8% -15% -1% 79%
Health Care -2% -8% -23% -13% 16% -6% 19% -6% 4% -5% 0% 24% 2% -5% 15% -5% 3% -5% -14% 12% -11%
MSCI China 3% -4% -26% 8% 10% -8% 4% 13% -4% -9% 11% 4% -6% 3% 0% 7% 8% 4% -23% 11% -4%
Outperformance (Top 3) Underperformance (bottom 3)
Since
2011
Co
mm
od
sF
ina
ncia
lsD
efe
nsiv
es
2011 2012 2013 2014 2015Quarterly price return
(LOC)
Cy
cli
ca
ls

November 6, 2015 China
Goldman Sachs Global Investment Research 26
Commodities: The divide between ‘opex’ and ‘capex’ commodities
Our strategists have long-argued that the downtrend in commodity prices since
mid-2014 has been primarily driven by oversupply globally, rather than just
demand weakness (from China). Indeed, China has played a large role in that
oversupply dynamics, and China has nearly reached metals independence.
The oversupply situation, coupled with intertwined macro trends of deflation in input
costs, divergence between US/EM growth and the strong US$, and EM deleveraging
has reinforced our commodity strategists’ view that broad commodity prices will be
lower for longer as the market searches for a new equilibrium.
China’s demand is gradually shifting to ‘opex’ commodities (energy and
consumption-based metals such as aluminum) away from ‘capex’ commodities (steel,
cement, iron ore) as the macro rebalancing unfolds. We believe this capex to opex shift
has only just started and could reshape the longer-term supply/demand and
competitive positioning in the commodity complex because:
1. China is already the largest consumer of a number of capex commodities and
is unlikely to consume much more given the changing growth drivers from FAI to
services;
2. Quite intuitively, capex commodity demand growth tends to peak at lower income
levels, while opex demand growth only begins to peak at higher income levels.
Global experiences suggest that the transition has tended to happen at around
US$5k to US$12k per capita GDP level.
Exhibit 48: China is already the largest consumer of a number of ‘capex’ commodities
Source: Wood Mackenzie, WSA, EIA, IEA, USDA, ICCO, Goldman Sachs Global Investment Research.
Exhibit 49: Demand profile for commodities changes as
the economy develops
Exhibit 50: Opex demand growth only begins to peak at
higher income levels
Source: Goldman Sachs Global Investment Research. Source: Goldman Sachs Global Investment Research.
0%
10%
20%
30%
40%
50%
60%
Iro
n O
re
Alu
min
ium
Refi
ned
Nic
kel
Co
kin
g C
oal
Cru
de S
teel
Zin
c O
re
Refi
ned
Zin
c
Th
erm
al C
oal
Refi
ned
Co
pp
er
Co
tto
n
So
yb
ean
s
Co
rn
Wh
eat
Cru
de O
il
Dis
tilla
te
Su
ga
r
Mo
tor
Gaso
lin
e
Dry
Natu
ral
Gas
Co
ffee
Co
co
a
China demand as % of global demand
Capex commodities
Opex commodities
0
100
200
0 10,000 20,000 30,000 40,000 50,000 60,000
Aluminum (kg per capita)
Meat Protein (kg per capita)
Natural Gas (Thous.cf per capita)
Total Petroleum (bbl per capita)
Wheat (kg per capita)
Per capita
consumption
vs. GDP per
capita (2005
US$)
0
2
4
6
8
10
12
0 5,000 10,000 15,000 20,000 25,000
Wheat ‐ Opex
Meat ‐ Opex
Zinc ‐ Capex
Distilate ‐ Capex
Motor Gasoline ‐ OpexSteel ‐ Capex
Nat Gas ‐ Opex
Aluminum ‐ OpexJet fuel ‐ Opex
Nickel ‐ Opex
Op
ex
com
mod
itie
s C
apex
+ O
pex
co
mm
od
itie
s
Copper ‐ Opex
China 2014 China 2050(GS Projection)
Point of fastest
demand growth vs
GDP per capita
(2005 US$)

November 6, 2015 China
Goldman Sachs Global Investment Research 27
Appendix
Exhibit 51: Non GS/GH-covered companies that fit our ‘New China’ selection framework
Note: Prices as of Nov 2, 2015; 15E PEG is calculated as 15E P/E over 16-17E EPSg CAGR. See page 21 for detailed screening criteria.
Source: FactSet, I/B/E/S, Goldman Sachs Global Investment Research.
In 'New China' sub-industries >1000 >5 >10 <1.5
Ticker Company name GICS sector GICS sub-industryQuoted
Price
Listed
mkt cap
(US$mn)
6M
ADVT
(US$mn)
16-17E
EPSg
CAGR (%)
15E
PEG
(X)
15E
ROE
(%)
16E
P/E
(X)
16E
P/B
(X)
Onshore
600518 CG Kangmei Pharma Health Care Pharmaceuticals 16.2 11,219 349 26 0.9 17.9 19.3 3.2
000538 CS Yunnan Baiyao Health Care Pharmaceuticals 67.0 11,004 119 18 1.3 23.2 19.9 4.2
601607 CG Shanghai Pharma Health Care Health Care Distributors 18.8 5,713 130 15 1.1 10.1 15.1 1.6
600804 CG Dr.Peng Telecom Telecom Alternative Carriers 25.3 5,586 200 31 1.4 15.3 33.5 5.6
000963 CS Huadong Medicine Health Care Health Care Distributors 75.1 5,145 39 25 1.2 42.5 22.9 7.6
002294 CS Salubris Pharma Health Care Pharmaceuticals 28.3 4,667 62 18 1.3 31.1 19.3 4.8
300267 CS Er-Kang Pharma Health Care Pharmaceuticals 29.8 4,282 42 48 1.0 29.1 34.2 9.8
002456 CS O-Film Tech IT Electronic Equipment 21.1 3,433 139 25 1.0 14.1 18.9 2.9
002437 CS Harbin Gloria Pharma Health Care Pharmaceuticals 29.4 3,397 45 23 1.4 18.9 25.3 4.1
000028 CS National Accord Medicines Health Care Health Care Distributors 66.2 3,212 35 21 1.5 15.2 25.7 3.8
300287 CS Philisense Tech IT IT Consulting 16.7 2,998 33 63 1.2 18.4 53.6 11.3
300026 CS Chase Sun Pharma Health Care Pharmaceuticals 18.9 2,712 39 22 1.4 20.7 24.0 4.8
300273 CS Hokai Medical Health Care Health Care Equipment 21.2 2,634 113 36 1.5 21.1 37.2 8.0
600594 CG Yibai Pharma Health Care Pharmaceuticals 19.4 2,425 77 19 1.3 16.5 21.4 3.4
300113 CS Shunwang Tech IT Internet Software & Services 48.4 2,227 32 67 0.9 21.4 40.3 9.5
000513 CS Livzon Pharma Health Care Pharmaceuticals 53.4 2,108 28 24 1.4 15.4 27.7 4.3
600587 CG Shinva Medical Health Care Health Care Equipment 32.7 2,098 41 22 1.4 14.1 24.0 3.5
600422 CG KPC Pharma Health Care Pharmaceuticals 33.0 2,050 57 27 1.1 17.7 24.1 4.3
600557 CG Kanion Pharma Health Care Pharmaceuticals 23.9 1,935 69 23 1.3 14.8 23.1 3.7
002542 CS Zhonghua Geotechnical Industrials Env. & Facilities Services 11.2 1,839 34 53 0.9 19.1 33.0 10.5
300039 CS Kaibao Pharma Health Care Pharmaceuticals 12.8 1,678 82 18 1.4 20.0 21.7 4.2
300300 CS Hakim Info Tech IT IT Consulting 25.7 1,552 52 60 1.2 16.8 38.9 9.0
002462 CS Cachet Pharma Health Care Health Care Distributors 40.8 1,546 42 36 1.5 13.5 38.5 5.8
300298 CS Sinocare Health Care Health Care Equipment 36.4 1,499 20 31 1.5 17.3 34.0 6.0
002317 CS Zhongsheng Pharma Health Care Pharmaceuticals 12.6 1,468 44 27 1.1 15.6 22.6 3.7
300020 CS Enjoyor IT IT Consulting 14.0 1,443 69 31 1.1 12.5 25.4 3.6
002020 CS Jingxin Pharma Health Care Pharmaceuticals 28.9 1,304 16 42 1.1 11.7 33.5 4.6
Average 3,377 74 32 1.2 18.7 28.0 5.5
Offshore
NTES UW NetEase IT Internet Software & Services 144.4 18,999 117 19 1.1 21.9 17.4 3.6
1093 HK CSPC Pharma Health Care Pharmaceuticals 7.2 5,489 13 24 1.1 19.6 20.5 4.2
1099 HK Sinopharm Health Care Health Care Distributors 32.0 4,917 21 16 1.2 12.7 17.0 2.2
699 HK CAR Inc. Industrials Trucking 13.3 4,074 21 57 0.4 17.1 13.4 3.1
867 HK China Medical System Health Care Pharmaceuticals 10.7 3,428 9 22 1.0 22.5 17.3 3.6
2186 HK Luye Pharma Health Care Pharmaceuticals 7.5 3,218 10 23 1.1 15.2 20.7 3.1
WX UN Wuxi Pharma Health Care Life Sciences Tools & Svcs 44.8 3,178 26 19 1.5 14.1 23.8 3.1
570 HK China Trad. Medicine Health Care Pharmaceuticals 5.7 3,141 8 41 0.6 9.8 15.3 1.7
1530 HK 3SBio Inc Health Care Biotechnology 8.9 2,882 8 26 1.1 18.7 23.3 3.3
YY UW YY, Inc. IT Internet Software & Services 57.2 1,966 64 35 0.5 33.1 12.5 3.9
2607 HK Shanghai Pharma Health Care Health Care Distributors 18.2 1,797 10 15 0.9 10.1 12.7 1.3
2196 HK Shanghai Fosun Pharma Health Care Pharmaceuticals 24.9 1,296 8 18 1.1 13.6 16.9 2.3
400 HK Cogobuy Cons Disc Internet Retail 7.3 1,283 5 36 0.6 20.3 16.5 3.4
KANG UW iKang Healthcare Health Care Health Care Services 15.7 1,056 10 20 1.1 14.2 17.5 2.4
Average 4,052 24 26 1.0 17.3 17.5 3.0

November 6, 2015 China
Goldman Sachs Global Investment Research 28
Exhibit 52: Comparisons between ‘New’ and ‘Old’ China
Source: FactSet, MSCI, Goldman Sachs Global Investment Research.
Source: FactSet, I/B/E/S, MSCI, Goldman Sachs Global Investment Research.
Exhibit 53: Comparisons between ‘New’ and ‘Old’ China
Source: FactSet, I/B/E/S, MSCI, Goldman Sachs Global Investment Research.
Source: FactSet, I/B/E/S, MSCI, Goldman Sachs Global Investment Research.
Exhibit 54: Comparisons between ‘New’ and ‘Old’ China
Source: FactSet, I/B/E/S, MSCI, Goldman Sachs Global Investment Research.
Source: FactSet, I/B/E/S, MSCI, Goldman Sachs Global Investment Research.
3% 4% 4%5%
10% 6%
37% 7% 14%
7%
20% 16%
25%
5%
15%
29%33%
2%
8%4%6%4%
8% 12% 9%
0%
20%
40%
60%
80%
100%
New China Old China MSCI All China
Cons Disc
Cons Stap
Energy
Financials
Health Care
Industrials
IT
Materials
Telecom
Utilities
Sector weight19.7%
9.4%10.3%
18.2%
9.5%10.6%
5%
10%
15%
20%
New China Old China MSCI All China
2016E 2017E
SPS growth (yoy)
11.6% 10.9%9.2%
24.2%
13.6% 14.4%
5%
10%
15%
20%
25%
30%
New China Old China MSCI All China
2016E 2017E
EPS growth (yoy)
10.1%10.0%
10.5%10.6%
10.5%
11.0%
9.5%
10.0%
10.5%
11.0%
11.5%
New China Old China MSCI All China
2016E 2017E
Net margin
19%
37% 38%
3%
31%
27%
0%
5%
10%
15%
20%
25%
30%
35%
40%
New China Old China MSCI All China
2016E
2017E
Net debt / equity
14.4%
11.4%
12.2%
15.1%
11.9%
12.7%
10%
11%
12%
13%
14%
15%
16%
New China Old China MSCI All China
2016E 2017E
ROE

November 6, 2015 China
Goldman Sachs Global Investment Research 29
MSCI disclosure
All MSCI data used in this report is the exclusive property of MSCI, Inc. (MSCI). Without
prior written permission of MSCI, this information and any other MSCI intellectual property
may not be reproduced or redisseminated in any form and may not be used to create any
financial instruments or products or any indices. This information is provided on an “as is”
basis, and the user of this information assumes the entire risk of any use made of this
information. Neither MSCI, any of its affiliates nor any third party involved in, or related to,
computing or compiling the data makes any express or implied warranties or
representations with respect to this information (or the results to be obtained by the use
thereof), and MSCI, its affiliates and any such third party hereby expressly disclaim all
warranties of originality, accuracy, completeness, merchantability or fitness for a particular
purpose with respect to any of this information. Without limiting any of the foregoing, in
no event shall MSCI, any of its affiliates or any third party involved in, or related to,
computing or compiling the data have any liability for any direct, indirect, special, punitive,
consequential or any other damages (including lost profits) even if notified of the
possibility of such damages. MSCI and the MSCI indexes are service marks of MSCI and its
affiliates. The Global Industry Classification Standard (GICS) were developed by and is the
exclusive property of MSCI and Standard & Poor’s. GICS is a service mark of MSCI and
S&P and has been licensed for use by The Goldman Sachs Group, Inc.

November 6, 2015 China
Goldman Sachs Global Investment Research 30
Disclosure Appendix
Reg AC
We, Kinger Lau, CFA, Timothy Moe, CFA, Jack Wang, Alvin So and Chenjie Liu, Ph.D, hereby certify that all of the views expressed in this report
accurately reflect our personal views about the subject company or companies and its or their securities. We also certify that no part of our
compensation was, is or will be, directly or indirectly, related to the specific recommendations or views expressed in this report.
Unless otherwise stated, the individuals listed on the cover page of this report are analysts in Goldman Sachs' Global Investment Research division.
Disclosures
Distribution of ratings/investment banking relationships
Goldman Sachs Investment Research global coverage universe
Rating Distribution Investment Banking Relationships
Buy Hold Sell Buy Hold Sell
Global 32% 53% 15% 63% 57% 52%
As of October 1, 2015, Goldman Sachs Global Investment Research had investment ratings on 3,221 equity securities. Goldman Sachs assigns stocks
as Buys and Sells on various regional Investment Lists; stocks not so assigned are deemed Neutral. Such assignments equate to Buy, Hold and Sell
for the purposes of the above disclosure required by NASD/NYSE rules. See 'Ratings, Coverage groups and views and related definitions' below.
Disclosures required by United States laws and regulations
See company-specific regulatory disclosures above for any of the following disclosures required as to companies referred to in this report: manager
or co-manager in a pending transaction; 1% or other ownership; compensation for certain services; types of client relationships; managed/co-
managed public offerings in prior periods; directorships; for equity securities, market making and/or specialist role. Goldman Sachs usually makes a
market in fixed income securities of issuers discussed in this report and usually deals as a principal in these securities.
The following are additional required disclosures: Ownership and material conflicts of interest: Goldman Sachs policy prohibits its analysts,
professionals reporting to analysts and members of their households from owning securities of any company in the analyst's area of
coverage. Analyst compensation: Analysts are paid in part based on the profitability of Goldman Sachs, which includes investment banking
revenues. Analyst as officer or director: Goldman Sachs policy prohibits its analysts, persons reporting to analysts or members of their
households from serving as an officer, director, advisory board member or employee of any company in the analyst's area of coverage. Non-U.S. Analysts: Non-U.S. analysts may not be associated persons of Goldman, Sachs & Co. and therefore may not be subject to NASD Rule 2711/NYSE
Rules 472 restrictions on communications with subject company, public appearances and trading securities held by the analysts.
Additional disclosures required under the laws and regulations of jurisdictions other than the United States
The following disclosures are those required by the jurisdiction indicated, except to the extent already made above pursuant to United States laws
and regulations. Australia: Goldman Sachs Australia Pty Ltd and its affiliates are not authorised deposit-taking institutions (as that term is defined in
the Banking Act 1959 (Cth)) in Australia and do not provide banking services, nor carry on a banking business, in Australia. This research, and any
access to it, is intended only for "wholesale clients" within the meaning of the Australian Corporations Act, unless otherwise agreed by Goldman
Sachs. In producing research reports, members of the Global Investment Research Division of Goldman Sachs Australia may attend site visits and
other meetings hosted by the issuers the subject of its research reports. In some instances the costs of such site visits or meetings may be met in part
or in whole by the issuers concerned if Goldman Sachs Australia considers it is appropriate and reasonable in the specific circumstances relating to
the site visit or meeting. Brazil: Disclosure information in relation to CVM Instruction 483 is available at
http://www.gs.com/worldwide/brazil/area/gir/index.html. Where applicable, the Brazil-registered analyst primarily responsible for the content of this
research report, as defined in Article 16 of CVM Instruction 483, is the first author named at the beginning of this report, unless indicated otherwise at
the end of the text. Canada: Goldman Sachs Canada Inc. is an affiliate of The Goldman Sachs Group Inc. and therefore is included in the company
specific disclosures relating to Goldman Sachs (as defined above). Goldman Sachs Canada Inc. has approved of, and agreed to take responsibility for,
this research report in Canada if and to the extent that Goldman Sachs Canada Inc. disseminates this research report to its clients. Hong Kong: Further information on the securities of covered companies referred to in this research may be obtained on request from Goldman Sachs
(Asia) L.L.C. India: Further information on the subject company or companies referred to in this research may be obtained from Goldman Sachs
(India) Securities Private Limited. Goldman Sachs may beneficially own 1% or more of the securities (as such term is defined in clause 2 (h) the Indian
Securities Contracts (Regulation) Act, 1956) of the subject company or companies referred to in this research report. Japan: See
below. Korea: Further information on the subject company or companies referred to in this research may be obtained from Goldman Sachs (Asia)
L.L.C., Seoul Branch. New Zealand: Goldman Sachs New Zealand Limited and its affiliates are neither "registered banks" nor "deposit takers" (as
defined in the Reserve Bank of New Zealand Act 1989) in New Zealand. This research, and any access to it, is intended for "wholesale clients" (as
defined in the Financial Advisers Act 2008) unless otherwise agreed by Goldman Sachs. Russia: Research reports distributed in the Russian
Federation are not advertising as defined in the Russian legislation, but are information and analysis not having product promotion as their main
purpose and do not provide appraisal within the meaning of the Russian legislation on appraisal activity. Singapore: Further information on the
covered companies referred to in this research may be obtained from Goldman Sachs (Singapore) Pte. (Company Number:
198602165W). Taiwan: This material is for reference only and must not be reprinted without permission. Investors should carefully consider their
own investment risk. Investment results are the responsibility of the individual investor. United Kingdom: Persons who would be categorized as
retail clients in the United Kingdom, as such term is defined in the rules of the Financial Conduct Authority, should read this research in conjunction
with prior Goldman Sachs research on the covered companies referred to herein and should refer to the risk warnings that have been sent to them by
Goldman Sachs International. A copy of these risks warnings, and a glossary of certain financial terms used in this report, are available from
Goldman Sachs International on request.
European Union: Disclosure information in relation to Article 4 (1) (d) and Article 6 (2) of the European Commission Directive 2003/126/EC is available
at http://www.gs.com/disclosures/europeanpolicy.html which states the European Policy for Managing Conflicts of Interest in Connection with
Investment Research.
Japan: Goldman Sachs Japan Co., Ltd. is a Financial Instrument Dealer registered with the Kanto Financial Bureau under registration number Kinsho
69, and a member of Japan Securities Dealers Association, Financial Futures Association of Japan and Type II Financial Instruments Firms
Association. Sales and purchase of equities are subject to commission pre-determined with clients plus consumption tax. See company-specific

November 6, 2015 China
Goldman Sachs Global Investment Research 31
disclosures as to any applicable disclosures required by Japanese stock exchanges, the Japanese Securities Dealers Association or the Japanese
Securities Finance Company.
Ratings, coverage groups and views and related definitions
Buy (B), Neutral (N), Sell (S) -Analysts recommend stocks as Buys or Sells for inclusion on various regional Investment Lists. Being assigned a Buy
or Sell on an Investment List is determined by a stock's return potential relative to its coverage group as described below. Any stock not assigned as
a Buy or a Sell on an Investment List is deemed Neutral. Each regional Investment Review Committee manages various regional Investment Lists to a
global guideline of 25%-35% of stocks as Buy and 10%-15% of stocks as Sell; however, the distribution of Buys and Sells in any particular coverage
group may vary as determined by the regional Investment Review Committee. Regional Conviction Buy and Sell lists represent investment
recommendations focused on either the size of the potential return or the likelihood of the realization of the return.
Return potential represents the price differential between the current share price and the price target expected during the time horizon associated
with the price target. Price targets are required for all covered stocks. The return potential, price target and associated time horizon are stated in each
report adding or reiterating an Investment List membership.
Coverage groups and views: A list of all stocks in each coverage group is available by primary analyst, stock and coverage group at
http://www.gs.com/research/hedge.html. The analyst assigns one of the following coverage views which represents the analyst's investment outlook
on the coverage group relative to the group's historical fundamentals and/or valuation. Attractive (A). The investment outlook over the following 12
months is favorable relative to the coverage group's historical fundamentals and/or valuation. Neutral (N). The investment outlook over the
following 12 months is neutral relative to the coverage group's historical fundamentals and/or valuation. Cautious (C). The investment outlook over
the following 12 months is unfavorable relative to the coverage group's historical fundamentals and/or valuation.
Not Rated (NR). The investment rating and target price have been removed pursuant to Goldman Sachs policy when Goldman Sachs is acting in an
advisory capacity in a merger or strategic transaction involving this company and in certain other circumstances. Rating Suspended (RS). Goldman
Sachs Research has suspended the investment rating and price target for this stock, because there is not a sufficient fundamental basis for
determining, or there are legal, regulatory or policy constraints around publishing, an investment rating or target. The previous investment rating and
price target, if any, are no longer in effect for this stock and should not be relied upon. Coverage Suspended (CS). Goldman Sachs has suspended
coverage of this company. Not Covered (NC). Goldman Sachs does not cover this company. Not Available or Not Applicable (NA). The
information is not available for display or is not applicable. Not Meaningful (NM). The information is not meaningful and is therefore excluded.
Global product; distributing entities
The Global Investment Research Division of Goldman Sachs produces and distributes research products for clients of Goldman Sachs on a global
basis. Analysts based in Goldman Sachs offices around the world produce equity research on industries and companies, and research on
macroeconomics, currencies, commodities and portfolio strategy. This research is disseminated in Australia by Goldman Sachs Australia Pty Ltd
(ABN 21 006 797 897); in Brazil by Goldman Sachs do Brasil Corretora de Títulos e Valores Mobiliários S.A.; in Canada by either Goldman Sachs
Canada Inc. or Goldman, Sachs & Co.; in Hong Kong by Goldman Sachs (Asia) L.L.C.; in India by Goldman Sachs (India) Securities Private Ltd.; in
Japan by Goldman Sachs Japan Co., Ltd.; in the Republic of Korea by Goldman Sachs (Asia) L.L.C., Seoul Branch; in New Zealand by Goldman Sachs
New Zealand Limited; in Russia by OOO Goldman Sachs; in Singapore by Goldman Sachs (Singapore) Pte. (Company Number: 198602165W); and in
the United States of America by Goldman, Sachs & Co. Goldman Sachs International has approved this research in connection with its distribution in
the United Kingdom and European Union.
European Union: Goldman Sachs International authorised by the Prudential Regulation Authority and regulated by the Financial Conduct Authority
and the Prudential Regulation Authority, has approved this research in connection with its distribution in the European Union and United Kingdom;
Goldman Sachs AG and Goldman Sachs International Zweigniederlassung Frankfurt, regulated by the Bundesanstalt für
Finanzdienstleistungsaufsicht, may also distribute research in Germany.
General disclosures
This research is for our clients only. Other than disclosures relating to Goldman Sachs, this research is based on current public information that we
consider reliable, but we do not represent it is accurate or complete, and it should not be relied on as such. We seek to update our research as
appropriate, but various regulations may prevent us from doing so. Other than certain industry reports published on a periodic basis, the large
majority of reports are published at irregular intervals as appropriate in the analyst's judgment.
Goldman Sachs conducts a global full-service, integrated investment banking, investment management, and brokerage business. We have
investment banking and other business relationships with a substantial percentage of the companies covered by our Global Investment Research
Division. Goldman, Sachs & Co., the United States broker dealer, is a member of SIPC (http://www.sipc.org).
Our salespeople, traders, and other professionals may provide oral or written market commentary or trading strategies to our clients and principal
trading desks that reflect opinions that are contrary to the opinions expressed in this research. Our asset management area, principal trading desks
and investing businesses may make investment decisions that are inconsistent with the recommendations or views expressed in this research.
The analysts named in this report may have from time to time discussed with our clients, including Goldman Sachs salespersons and traders, or may
discuss in this report, trading strategies that reference catalysts or events that may have a near-term impact on the market price of the equity
securities discussed in this report, which impact may be directionally counter to the analyst's published price target expectations for such stocks. Any
such trading strategies are distinct from and do not affect the analyst's fundamental equity rating for such stocks, which rating reflects a stock's
return potential relative to its coverage group as described herein.
We and our affiliates, officers, directors, and employees, excluding equity and credit analysts, will from time to time have long or short positions in,
act as principal in, and buy or sell, the securities or derivatives, if any, referred to in this research.
The views attributed to third party presenters at Goldman Sachs arranged conferences, including individuals from other parts of Goldman Sachs, do
not necessarily reflect those of Global Investment Research and are not an official view of Goldman Sachs.
Any third party referenced herein, including any salespeople, traders and other professionals or members of their household, may have positions in
the products mentioned that are inconsistent with the views expressed by analysts named in this report.
This research is not an offer to sell or the solicitation of an offer to buy any security in any jurisdiction where such an offer or solicitation would be
illegal. It does not constitute a personal recommendation or take into account the particular investment objectives, financial situations, or needs of
individual clients. Clients should consider whether any advice or recommendation in this research is suitable for their particular circumstances and, if
appropriate, seek professional advice, including tax advice. The price and value of investments referred to in this research and the income from them
may fluctuate. Past performance is not a guide to future performance, future returns are not guaranteed, and a loss of original capital may occur.
Fluctuations in exchange rates could have adverse effects on the value or price of, or income derived from, certain investments.

November 6, 2015 China
Goldman Sachs Global Investment Research 32
Certain transactions, including those involving futures, options, and other derivatives, give rise to substantial risk and are not suitable for all investors.
Investors should review current options disclosure documents which are available from Goldman Sachs sales representatives or at
http://www.theocc.com/about/publications/character-risks.jsp. Transaction costs may be significant in option strategies calling for multiple purchase
and sales of options such as spreads. Supporting documentation will be supplied upon request.
All research reports are disseminated and available to all clients simultaneously through electronic publication to our internal client websites. Not all
research content is redistributed to our clients or available to third-party aggregators, nor is Goldman Sachs responsible for the redistribution of our
research by third party aggregators. For research, models or other data available on a particular security, please contact your sales representative or
go to http://360.gs.com.
Disclosure information is also available at http://www.gs.com/research/hedge.html or from Research Compliance, 200 West Street, New York, NY
10282.
© 2015 Goldman Sachs.
No part of this material may be (i) copied, photocopied or duplicated in any form by any means or (ii) redistributed without the prior written consent of The Goldman Sachs Group, Inc.