new broadband lidar for greenhouse carbon dioxide gas ... · new broadband lidar for greenhouse...
TRANSCRIPT
New Broadband LIDAR for Greenhouse Carbon Dioxide Gas
Sensing in the Earth's Atmosphere
Elena Georgieva 1,2*, William S. Heaps 2, Wen Huang 2.3
IJoint Center for Earth Systems Technology/UMBC
2 NASA Goddard Space Flight Center
3 Science Systems and Applications
ABSTRACT
We present airborne measurements of a novel eye-safe spectrally broadband LIDAR capable of
dealing with the atmospherically-induccd variations in CO2 absorption using a Fabry-Perot based detector.
The Fabry-Perot solid etalon in the receiver part is tuned to match the wavelength of several CO2 absorption
lines simultaneously. The broadband technique tremendously reduces the requirement for source wavelength
stability, instead putting this responsibility on the Fabry- Perot based receiver. The instrument technology we
are developing has a clear pathway to space and realistic potential to become a robust, low risk space
measurement system.
Keywords: Instrumentation, measurement and metrology (120.0120), remote sensing (280.0280),
atmospheric composition (010,1280), optical instruments (120.4640), absorption (300.1030), interferometry
(120.3180), Fabry-Perot (120.2230)
1. INTRODUCTION
There is a pressing need for measurements of atmospheric carbon dioxide concentration with high
spatial and temporal resolution for global and regional studies of the carbon cycle. Such measurements will
better resolve the linkage between global wamling and anthropogenic CO2 emissions. In the Deeadal
https://ntrs.nasa.gov/search.jsp?R=20110013349 2019-05-16T17:56:30+00:00Z

of Earth Science the National Research Council recommended that NASA develop, build, and t1y a laser
based system for precision measurement of total carbon dioxide (the ASCENDS mission). The mission
demands measurements of CO2 to a precision of I ppm out of the total ~400 ppm column in order to locate
sources and sinks. Achieving that is difficult due to a strong dependence on changes in atmospheric pressure
and temperature of atmospheric carbon dioxide absorption line position, shape, and strength. Our team at
Goddard Space Flight Center (GSFC) is developing a LIDAR system for column CO2 measurement based on
an innovative new technique employing a spectrally broad laser source centered at 1573.3 nm. The
backscattered light of the broadband illumination beam is detected and spectrally resolved using Fabry-Perot
based receiver.
2. MEASUREMENT APPROACH
Various approaches have been used to detect trace gases in the atmosphere. Most of them are
currently under development as candidates for the ASCENDS mission and require multiple lasers operating
at different, very narrow bandwidth wavelengths. Our broadband lidar (BBL) is capable of mitigating
inaccuracy associated with atmospherically-induced variations in CO2 absorption line shape and strength
using only one laser. We demonstrated our new approach using the CO2 measurements from the NASA DC-8
aircraft in July and August, 2011 over different locations.
The BBL transmitter consists of Nd:YAG laser (Surelite: IPG Photonics model number EAR-IOK-1571-LP
SF) and an OPO system with a maximum spectral bandwidth covering the I 572.2nm to 1574.2nm range. The
laser operates in pulsed mode, emitting 6 ns pulses over a 2 nm spectral range. The reason to choose the OPO
technique is because it is a mature technology, highly efficient, gives a possibility to control the signal
wavelength, the KTP crystals are commercially available and the transmitter part is compact and easy for
alignment. The KTP crystals (United Crystals Company) were X-cut, 4 X 4 X 20 mm, for non-critical phase
matching at room temperature for pump 1064 nm, signal 1573 nm and idler 3288.16-nm wavelengths.
The 1064 nm beam is expanded and combined with a 1573 nm beam; the two then exit together through a
nadir-viewing window of the aircraft. The ret1ection from the ground is collectcd by a telescope Vixen
model VC200L. The beam diameter out of the transmit '~",J~'JjJv is ~75 mm, with a rinIPrOPt1{,p' of ~ mrad
2

as detennined from actual laboratory measurements. Because the CO2 absorption strength is not constant but
varies with temperature and pressure, all the ASCENDS candidate lidars employ more than two wavelengths
in an effort to untangle those effects. Our bandpass filter is 4 nm wide. Fig. 1 illustrates the operation of the
lidar receiver. The thin blue line shows the transmission ofthe FP. The thin red lines are the CO2 absorption
lines. We are aligned with three CO2 absorption lines (1573.332 nm, 1573.992 nm and 1573.679nm).
Because our source emits wavelengths that are strongly absorbed by CO2 as well as wavelengths that are only
weakly absorbed all in a single laser pulse, we use the recciver portion of our lidar to separate the
wavelengths and provide our "differential" absorption.
1572.992 1573.679 1573.332 Light passing through the
000004
0000035 1 I I I FP bounces back and forth
i I :
0G003 between the two surfaces
o GOO()25 crating interference with the i i
3: ..:
'" :;: 000002 o result that it only transmits Il.
0000015 light for which integral
f} Goo01 number of half wavelengths
U U V ulu V V u U V V \j o OCOOD5
exactly fits between the two
1571 15715 1572 1-572.5 1573 1573 5 1574 1574.5
Wavelength, nm surfaces. By changing the
Fig. 1 This depicts the operation of our lidar receiver. thickness of the glass plate,
different colors can be
allowed to pass. By changing the ret1ectivity, the width of the passband can be controlled. We select a
ret1ectivity such that the width of a passband is nearly the same as the width of CO2 absorption and we place
the FP inside an oven (Thorlabs Inc.) so that the temperature can be controlled. Changing the temperature
changes the optical thickness of our FP and thereby alters the wavelengths that are transmitted. OUf lidar
receiver has two channels. The FP channel has both thc bandpass filter and the FP in front of the detector.
Thus it responds mostly to light that can be absorbed by the CO2• The reference (REF) channel only has thc

bandpass filter in front of the detector. Most of the light that reaches this detector is unaffccted by CO2. Fig.
2 is the lidar system with one side of its box removed to show the telescope and receiver scction.
Fig. 2 This picture show the Broad Band Iidar just prior to installation in
Fig. 3 arc the two channels as seen
on the screen of Tektronics
oscilloscope. The first peak is the
initial fire of the laser. This signal
serves to monitor the perfonnance
of the system and enables
corrections for drifts in the detector
or the FP temperature etc. The
second large peak is the reflected
light signal from the ground.
Comparing the changes in the the DC-S. The side covers are removed.
ratios of the FP and REF channel for this signal enables calculation of the CO2 column between the aircraft
and the ground. Fig. 4 shows the lidar installed in the cargo bay of the DC-S. In operation the laser fires at a
rate of 20 Hz. We record the signals from the FP and REF channels as a function of time and average shots
together.
Fig. 3 This shows a typical lidar return
signal. Fig. 4 This is the instrument installed in the cargo bay of the
DC-8.
4

3. DATA ANALYSIS
The analysis for data obtained on our test flights proceeds from Beer's Law of Absorption which may be
stated as follows:
(1)
where I is the intensity of the absorbed light, 10 is the intensity before absorption, n is the number density of
absorbers, s is the absorption cross section, and z is the range through the absorbing medium. We may also
write
I log- = -nsz
10 (2)
which shows that the log of the ratio of the absorbed intensity to the initial intensity is a linear function of the
range and the absorber number density. With a DIAL system we essentially measure L 10, and z. We
presume to have measured the absorption cross section in the laboratory so we can solve for n which is the
number of CO2 per square cm along the absorption path.
The lidar system measurement of II! involves a number of instrumental factors (eg. percentage of transmitted
light sampled, filter and FP transmission, detector response etc.). The measurement of I also involves same
factors plus the transmission of the atmosphere, the reflectivity of the ground etc. In principle the
instrumental factors could all be measured or calculated but this is difficult to do. Instead we make a second
measurement (let's call them l~ and I *) at a second wavelength using the same equipment. Beers law should
hold for this second measurement except that s * will have a different value. Subtracting the two equations
yields
I 1* log - - log - = -n(s - s*)z 10 10 (3)
For this measurement all the instrumental factors in the measurement divide out and if we choose the two
wavelengths so that ground reflectivity and atmospheric transmission are the same (except for absorption by
CO2) then our raw measurement of the difference of the two ratios is the same as the actual difference of the
two ratios. If we know the difference between the two absorption coefficients we can solve for carbon
dioxide abundance. The difference between the absorption coefficients can be measured in the lab, however

in the real atmosphere they are not eonstants but depend on pressure and temperature. From our knowledge
of the behavior of spectroseopic line shapes with temperature and pressure we ean deducc the correct values
of these absorption coefficients if we make a few additional mcasurements at other wavelengths. Because the
measurements for the broad band lidar are made over a range of wavelengths the absorption cross sections in
our analysis are weighted averages over a span of wavelengths. Essentially our s is an integral of the CO2
absorption over all three lines mUltiplied by the transmission of the FP and the bandpass filter and s * is an
integral of the CO2 absorption multiplied by the transmission of the BP filter alone. By judicious choice of
the BP tilter and FP transmission characteristics it is possible to reduce very significantly the effects of
pressure and temperature on these average cross sections. One of the strengths of the BBL as we implement it
is that the same detector, filter, and FP are used to measure 10 as we use to measure I. In this way we are
immune to 'drifts' in the components of the system.
These average cross sections could in principle be calculated by measurements of the BP filter and FP
transmission and using cross sections for CO2 obtained in the lab. They could also be determined by
calibrating the whole instrument in the lab introducing known amounts of CO2 into the absorption path of the
instrument and noting the ratio response. We will use both methods for precise final calculations. For this
paper we have adopted a different approach. The purpose of our recent test flights was to demonstrate the
measurement capability of the broadband lidar and to investigate its characteristics. We already know that the
approximate column abundance of CO2 is about 390 ppm. Using the pressure and aircraft altitude
measurements from the DC-8 along with the range information from the lidar we can calculate what fraction
of the total airmass the lidar has sounded. Multiplying the fraction by 390 give the approximate amount of
CO2 that the instrument has sensed. Comparing this number to the signal response of the lidar permits the
calculation of the difference in absorption eoefficients for the FP and REF channels. If wc plot the log of the
FP/REF ratio vcrsus the amount of CO2 sensed (esscntially the product ofn and z) then thc result should be a
line with a slope equal to this difference of avcrage absorption coefficients (s-s*). The ncxt section shows the
progression of the data analysis to achieve this plot.
6

4. DC-8 MAJOR ASCENDS FLIGHT TEST CAMPAIGN JULY/AUGUST,
2011, PALMDALE, CA; PRELIMINARY DATA
Prior to the flights we perfonned tests on tuning the FP in the receiver. On July 22 we did night
measurements while shooting at a 3.1 km range and changing the oven temperature with the FP. The Fig.5
to
0.8
<::::- oe q,
~ [ M .~
~ 02
0.0 a 5IJO 1000 1500 2000 2500
Figure 5. We put the FP etalon through several temperature changes. Lowest ratio shows the best temperature (system sensitive to CO2)
shows how the ratio changes with temperature of the
etalon and the optimal temperature for the system. The
circle is the region where the ratio has a minimum
(corresponding to maximum sensitivity, FP transmission
bands are aligned with the three strong CO2 absorption
lines) at the temperature 50.6 deg C. Noise in the data is
due to the strong wind moving the mirror reflecting the
laser beam.
During an instrument-validation flight over central
California, the DC-8 flew over the Rail Road Valley on August 3. When the plane is landing, ratio is going
up which means less and less absorption of
carbon dioxide (smaller atmospheric
column). The FP signal is increasing and as a
result the ratio of FPI Ref is increasing as
well. (Fig 6). The ratio changed by 0.6 for
4.3 km. At the shortest ranges shown the
lidar signal is very large resulting in
saturation of the detectors.
Because the location of the broadband lidar
was in the cargo pit of the DC-8 airplane
August 3, 2011 ffight
Range
Figure 6 shows the change in ratio with altitude of the plane. The range is in microseconds; I microsecond is 150 m. 40 microseconds= 6000 m=6 km, 20 microseconds 3000 m=3 km. At 6 km the ratio is -0.5 and at 1.7 km it change up to 1.1,
during flights we experienced a huge temperature changes which influenced the precision of the
measurements.
7

We observed temperature changes of over 10 deg
C during the flights (Fig. 7). Various parts of the
telescope cool at different rates as some are better
conductors and have different rates of expansion.
The back focus of the telescope can move
approximately 0.25 mm for every 1°C change in
temperature. This change in focus due to
temperature is a serious problem. On one of the Figure7. The plot shows temperature changes in the
flights we monitored a lot of moisture in the cargo pit on two different flights - on August 3 (pink) and
pit causing condensation on the optics. Signals August 7 (yellow).
dropped down because of the water on the nadir
viewing window and the near field ratio changed. We excluded these data points from the analysis. Huge
temperature changes may also affect the KTP crystals performance because the laser peak moves with
temperature (Fig 8). For that experiment we used an OSA (Optical spectrum analyzer) to monitor the lidar
peak while changing KTP temperature.
~ C ::2 .Q
0.000012
0.00001
0.000008
ta 0000006
f a.
OOOOO()4
0000002
0.0001
000009
o ooooa
000007
000006 room temperaf:.lft, peak @15733 f'im
000005
OOOOf'...r4
000003
000001
000001
O~~~~~~~~~~~~~~+-~~~ 3
15745 1572 15725 1573 1573.5 1574
Wavelength. nrn
Figure 8. Plot shows how the lidar peak changes position with changing the temperature of KTP crystals. The peak moves to smaller wavelengths with increasing the crystals temperature.
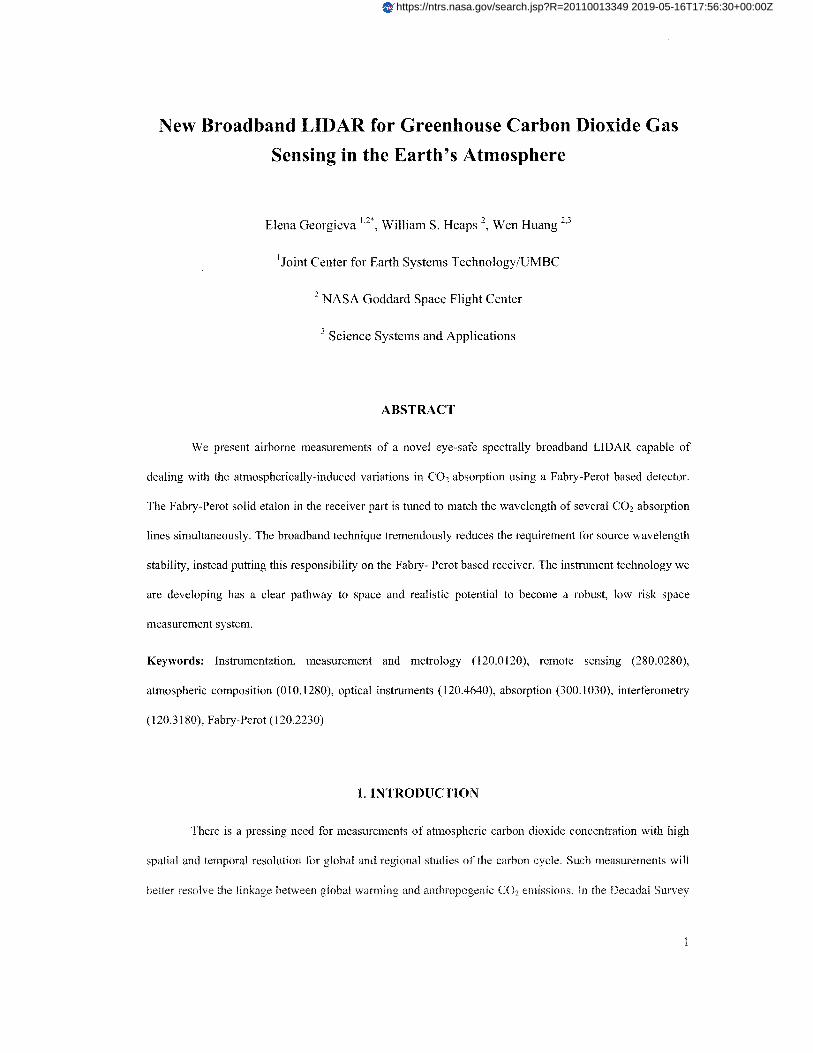
The DC-8's flight track is shown in red for its flight on Tuesday August 9, 20 II to Tucson and back to
Palmdale, CA. During the flight, the broadband lidar instrument was tested at variety of altitudes and over
different surface terrains. Figure shows the change in ratio during descent.
Figure 9 As the altitude of the plane is changing, the ratio changes as well.
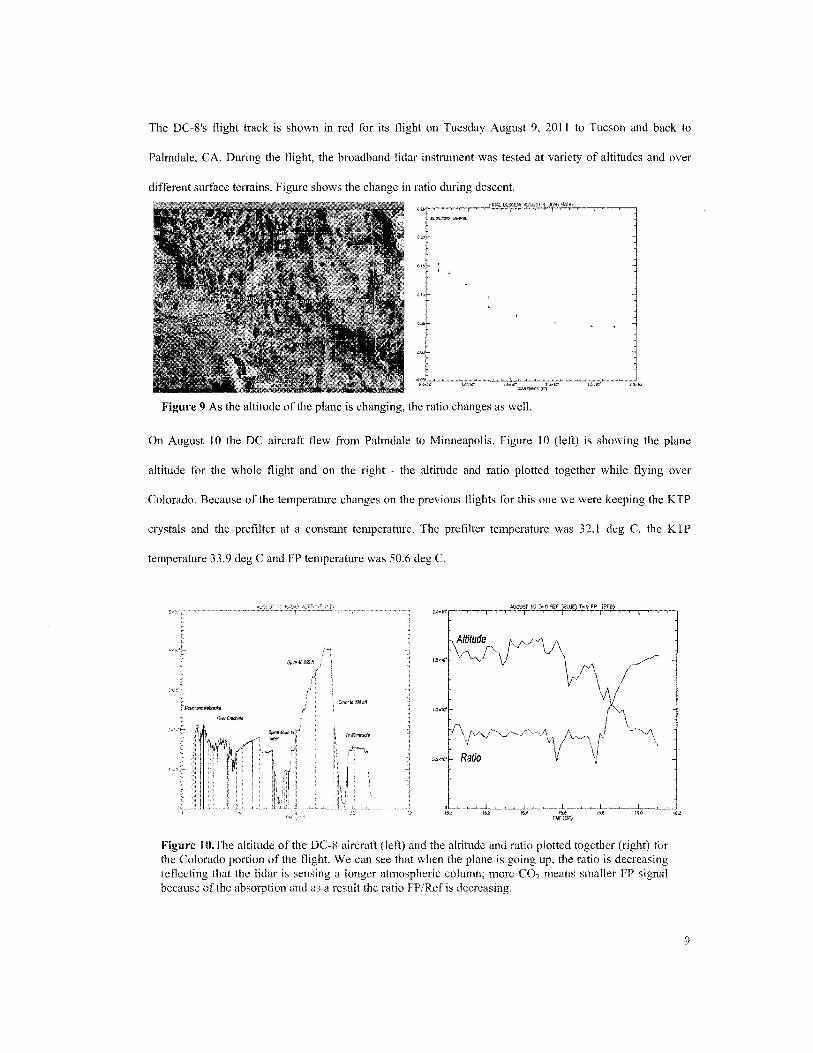
On August 10 the DC aircraft flew from Palmdale to Minneapolis. Figure 10 (left) is showing the plane
altitude for the whole flight and on the right - the altitude and ratio plotted together while flying over
Colorado. Because of the temperature changes on the previous flights for this one we were keeping the KTP
crystals and the prefilter at a constant temperature. The prefilter temperature was 32.1 deg C, the KTP
temperature 33.9 deg C and FP temperature was 50.6 deg C.
~,~~~,,~,~~,+' .. ~~~,,~.~~~ .. ,~~+',~~. ~~,,> 'I£(£>Tj
Figure to.The altitude of the DC-8 aircraft (left) and the altitude and ratio plotted together (right) for the Colorado portion of the flight. We can see that when the plane is going up, the ratio is decreasing reflecting that the lidar is sensing a longer atmospheric column; more CO2 means smaller FP signal because of the absorption and as a result the ratio FP/Ref is decreasing.
9

Far field Ratio
Figure 11. The amplitude far field ratio (right) is a measurement of CO2, the bell shape when going down and up around the WBTT tower (left) in Iowa shows that we can see CO2 change with our Mar. Spike after bell is because the plane is rapidly turning.
On August 11 we flew back from Minneapolis to Palmdale. There were a lot of clouds on this flight so the
analysis algorithm has to differentiate between a ground return and a cloud return. Fig. 12 shows the lidar
range obtained using our custom algorithm for finding the lidar peaks and the radar altimeter range. The
good agreement illustrates that the algorithm is finding the correct peak. Range is plotted in feet.
, \
Figure 12. Lidar range (red) plotted with radar altimeter range (blue).
0,10
I<JJGl!ST 11 UQAR: RAno FOR FIRST DEscrnr (S SEC AvERAGES)
, ,
,.ooO!---'~~-""',"-:i:"::;-"~~~':-::/"'':::''';-'--~~''''IS:':",:7. ~~-'-c.::-:'",w """(fm)
Figure 13. The FP/Refratio is changing during descent of the plane.
For the three descents on August 3, August 9 and August 11 the ratio changes vs altitude show repeatability.
From the plots we can calculate that for 6.1 km i\R=0.105, for 4.3 km i\R=0.07 and for 3.35 km i\R= 0.06,
and those numbers are consistent; however the instrument is not stable enough to measure with a precision of
10

Ippm yet. The data collected with the broadband lidar over different terrains will be further analyzed more
precisely using retrieval algorithms and the results will be compared to the results of other researchers. The
airborne campaign and the very preliminary analysis here provide an insight of how useful is the broadband
technique and how the instrument can be further improved to become a candidate for NASA's ASCENDS
miSSIon.
5. CONCLUSIONS
The broad band lidar has succeeded in detecting CO2 from the DC-8 aircraft. The major objective
and our preliminary results show that the sensor is responding accordingly to changes of the aircraft altitude,
demonstrating sensitivity, which could be scaled to a measurement from space. It exhibited strong signals at
an altitude of 39,000 ft as well as while flying above snow where the reflectance at 1.57 microns is less than
5%. The system is still sensitive to misalignments that can be caused by aircraft vibration and temperature
changes. Many factors including primarily cost induced us to make the choices for implementation that we
made for the Broad Band Lidar. There are several aspects of the design which need to be optimized like the
replacement of the off-the shelf bandpass prefilter with a custom-made one; the ovens, so we can better
control the temperature of the optics and the receiving telescope. In this way we will improve signal-to-noise
ratio (SNR) and the overall instrument performance.
The preliminary results over different terrain and under variety of atmospheric conditions give
encouragement that we will be able to reach the required accuracy after making some necessary
improvements.
ACKNOWLEDGMENTS:
This research was sponsored by NASA's Earth Science Technology Office. The authors want to thank John
Burris for his help and support during the last part of the flight campaign.
REFERENCES
Abshire, J.8.et ai, "Laser Sounder for Global Measurements of C02 Concentrations from Space", 4th International Working Group on Greenhouse Gas Measurementsfrom Space, (2007).
Abshire J. 8., H. Riris, et al."Pulsed airborne Iidar measurements of atmospheric C02 column absorption," Tellus B 62 770-783, (2010).
Born, M., and E. Wolf, Principles o/Optics, 360-371 pp., Cambridge University Press, Cambridge, 1999. Browell E. V., J. Dobler, S. Kooi, Y. Choi, F. Harrison, B. Moore, and T. Zaccheo, "Airborne validation of
active C02 LAS measurements," EOS 90, A34C-04 (2009), Fall Meeting Supplement,abstract. Browell, E. V., M.E. Dobbs, and B. Moore, Airborne Demonstration of a CW Laser System for C02 Column
Measurements, International Workshop on Greenhouse Gas Measurementsfrom Space, (2007). Chevallier F., Maksyutov S., Bousquet P.,Francois-Marie Breon, Saito R., Yoshida Y.,and Yokota T, " On
the accuracy of the C02 surface fluxes to be estimated from the GOSAT observations", Geophysical Research Letters, vol. 36, (2009).
Chevallier F.,Francois-Marie Breon,and Rayner P., "Contribution of the Orbiting Carbon Observatory to the estimation of C02 sources and sinks: Theoretical study in a variational data assimilation framework", Journal Of Geophysical Research, vol. 112, (2007).
Flamant Pierre H., "Atmospheric CO2 measurements by Lidar: an itinerary from ground to space," 4th International Working Group on Greenhouse Gas Measurements from Space, CNES HQ, Paris, June 27,(2007).
Georgieva E.M.,Wilson E.L., Miodek M., Heaps W.S., "Total Column Oxygen Detection Using Fabry-Perot Interferometer", Optical Engineering, 45( 11), 115001, November, (2006).
Georgieva E.M., W. S. Heaps, E. L. Wilson.: "Differential Radiometers using Fabry-Perot Interferometric Technique for Remote Sensing of Greenhouse Gases", IEEE Transactions on Geoscience and Remote Sensing (TGARS), 46,10, October special issue, (2008).
Heaps, W.S., and S.R. Kawa, Fabry-Perot Interferometer for Column C02, in NASA Earth Science Technology Conference, (2002).
Heaps, W.S., E.L. Wilson, Georgieva E.M, Precision Measurement of Atmospheric Trace Constituents Using a Compact Fabry-Perot Radiometer", International Journal of High Speed Electronics and Systems (IJHSES), 18,3, September, (2008).
Heaps W.S., "Broadband lidar technique for precision C02 measurement", Proc. SPIE, Vol. 71/1, 711102, (2008).
Ingle, J.D., and S.R. Crouch, Spectrochemical Analysis, Prentice-Hall, Inc., New Jersey, (1988). King, A.W., ( Dilling, G.P. Zimmerman et al. , What Is the Carbon Cycle and Why Care? In: The First State
of the Carbon Cycle Report (SOCCR): The North American Carbon Budget and Implications for the Global Carbon Cycle, A Report by the U.S. Climate Change Science Program and the Subcommittee on Global Change Research: National Oceanic and Atmospheric Administration, National Climatic Data Center, Asheville, NC, 15-20, (2007).
Koch G., 1. Y. Beyon, F. Gibert, B. W. Barnes, S. Ismail, M. Petros, P. 1. Petzar, 1. Yu, E. A. Modlin, K. J. Davis, and U. N.Singh, "Side-line tunable laser transmitter for differential absorption Iidar measurements of C02: design and application to atmospheric measurements," Appl. Opt. 47, 944-956 (2008).
Neff BR, Dobbs ME, Gypson M, Pruitt J, Sharp WE, "C02 monitoring with a field deployable NIR standoff environmental sensor", Proc. SPIE, Vol. 5154,118-125, (2003).
NRC, Earth Science and Applications from Space: National Imperatives for the Next Decade and Beyond, The National Academies Press. Committee on Earth Science and Applications[rom Space: A Community Assessment and Strategy for the Future Space Studies Board, (2007).
Parkes AM, Keen KA, MeNaghten ED, "Trace gas detection using a novel cantilever-based photoacoustic spectrometer with multiplexed optical fiber-coupled diode lasers and fiber-amplification ",Proc. SPIE, VoI.6770, C7701-C7701, (2007).
Pruitt J, Dobbs ME, Gypson M, Neff BR, Sharp WE, "High-speed CW lidar retrieval using spectral lock-in algorithm", Proc. SPIE, Vol. 5154,138-145, (2003).
Rayner P.and O'Brien D., "The utility of remotely sensed C02 concentration data in surface source inversions," Geophys.Res. Lett. 28,175-178 (2001).
Spiers G., Menzies R., Jacob et a!., " Atmospheric CO2 measurements with a 2 11m airborne laser absorption spectrometer employing coherent detection", Applied Optics, Vol. 50, No. 14, (2011).
Stultz R.D. and Ehritz M.E., "Temperature (-32degC to+90degC) Performance of a 20 Hz Potassium Titanyl Phosphate Optical Parametric Oscillator", OSA TOPS on Advanced Solid-State Lasers, VoU, Stephen A.Payne and Clifford Pollock (eds.), (1996).
Wilson E.L., Georgieva E.M., Heaps W.S., "Development of a Fabry-Perot interferometer for ultra-precise measurements of column CO2 ", Meas. Sci. Technology, 18, 1495-1502, (2007).