new at 50 1960– - annualreports.co.ukannual report 2007 1960– pennsylvania real estate...
TRANSCRIPT

Annual Report 2007
1960–Pennsylvania Real Estate Investment TrustAnnual Report 2009
NEW AT 50

Pennsylvania Real Estate Investment Trust, founded in 1960 and one of the first equity REITs in the U.S., has a primary investment
focus on retail shopping malls and power centers. As of December 31, 2009, the Company’s 54 properties are comprised of 38
shopping malls, 13 strip and power centers, and three properties held for development. These properties are located in 13 states
in the eastern half of the United States, primarily in the Mid-Atlantic region. The Company’s operating retail properties have a
total of approximately 35 million square feet. PREIT is headquartered in Philadelphia, Pennsylvania. The Company’s website can
be found at www.preit.com. PREIT is publicly traded on the New York Stock Exchange under the symbol PEI.
PENNSYLVANIA REAL ESTATE INVESTMENT TRUST (In thousands, except per share amounts)
Year Ended December 31, 2009 2008 2007
Funds from operations * $ 73,087 $ 141,012 $ 158,517 Total revenue $ 463,088 $ 467,993 $ 460,590 (Loss) income from continuing operations $ (101,797) $ (18,904) $ 14,348 Net (loss) income from continuing operations available to common shareholders $ (97,682) $ (18,363) $ 17,936 (Loss) income from continuing operations per diluted share $ (2.40) $ (0.50) $ 0.44 Net (loss allocable) income available to common shareholders per diluted share $ (2.11) $ (0.43) $ 0.67 Investment in real estate, at cost $ 3,684,313 $ 3,708,048 $ 3,367,294 Total assets $ 3,346,580 $ 3,444,277 $ 3,264,074 Distributions paid to common shareholders/unitholders $ 32,474 $ 94,702 $ 94,057 Distributions paid per common share $ 0.74 $ 2.28 $ 2.28 Number of common shares and OP Units outstanding 46,944 41,669 41,348 Total market capitalization $ 3,146,241 $ 3,062,271 $ 3,675,927 * Reconciliation to GAAP can be found on page 18.
For 50 years, PREIT has distinguished itself
through an uncanny ability to recognize and seize opportunities
for adding value to properties and communities. As one of the
first equity REITs in the country, PREIT has a long history of adding
innovations to assets – whether providing office space for local
workers, renovating apartments for local residents, or enhancing
retail spaces for local shoppers. Since the 1997 merger with The
Rubin Organization, PREIT has honed its focus primarily on the
retail sector, with the expertise to add NeW elements to properties
as needed, all to best serve the interests of local communities and
deliver greater value for shareholders.
NeW aT 50
The new Plaza Shops at Plymouth Meeting Mall, Plymouth Meeting, PA
Cover: Cherry Hill Mall, Cherry Hill, NJ
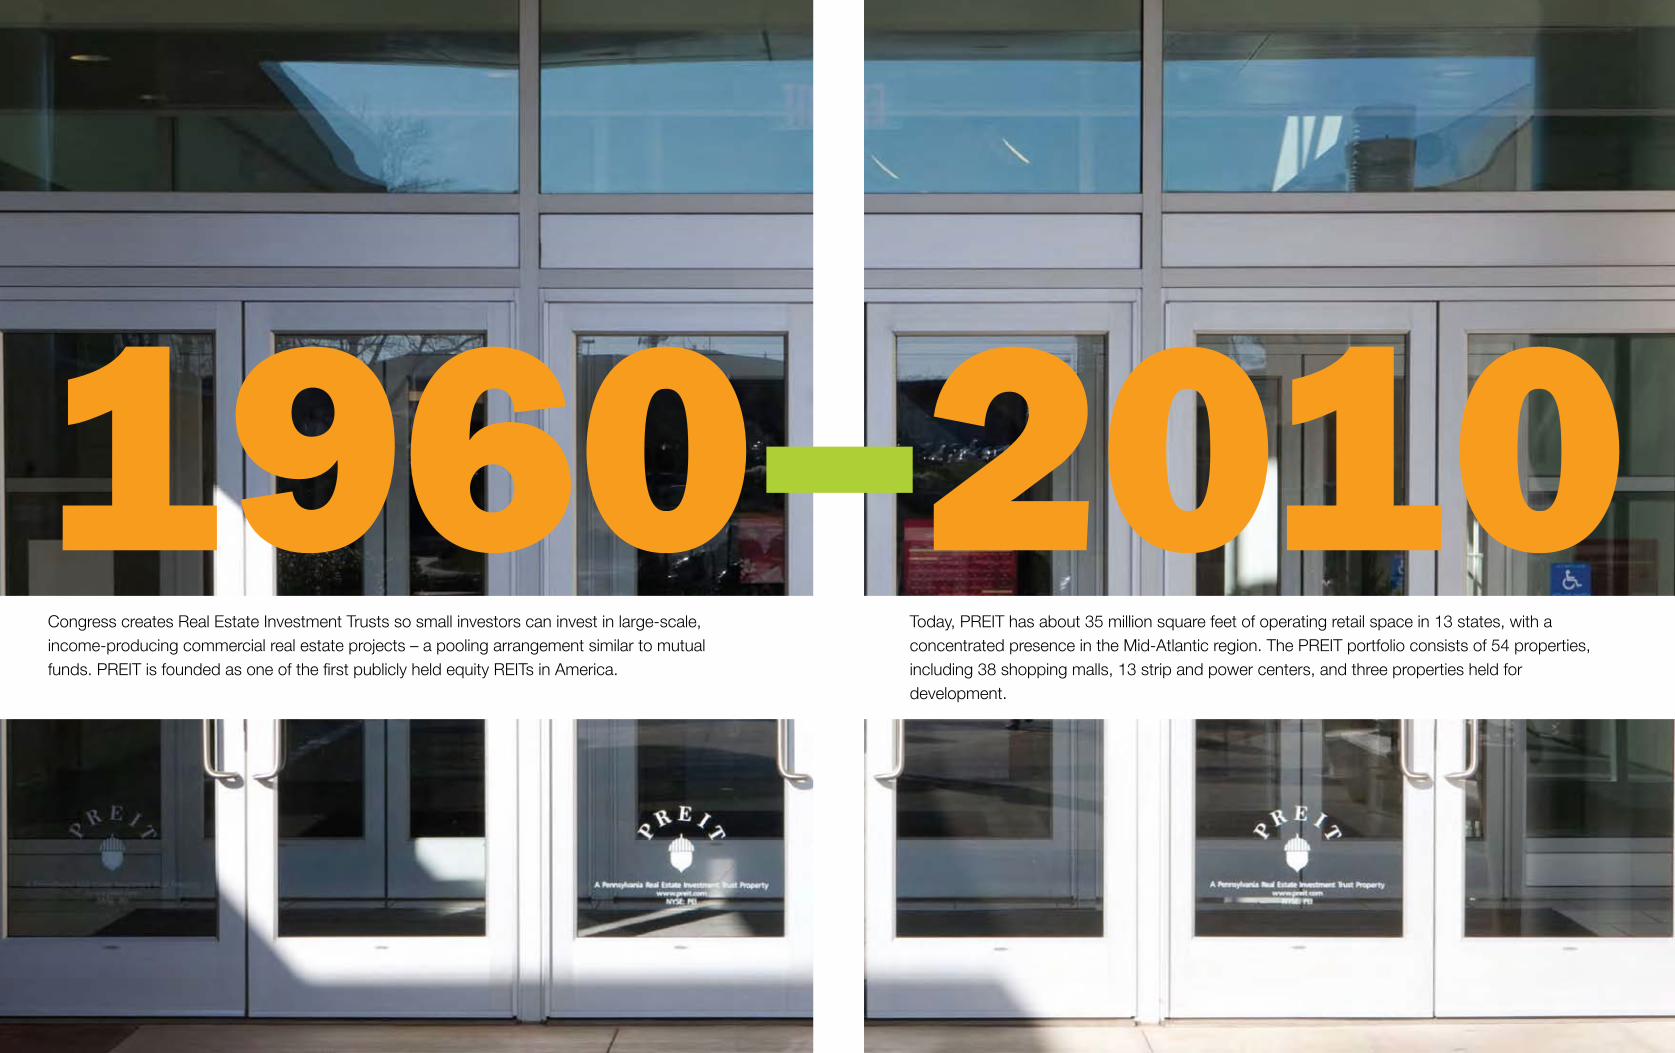
1960 – 2010Congress creates Real Estate Investment Trusts so small investors can invest in large-scale, income-producing commercial real estate projects – a pooling arrangement similar to mutual funds. PREIT is founded as one of the first publicly held equity REITs in America.
Today, PREIT has about 35 million square feet of operating retail space in 13 states, with a concentrated presence in the Mid-Atlantic region. The PREIT portfolio consists of 54 properties, including 38 shopping malls, 13 strip and power centers, and three properties held for development.

THe NeW CHerry HILL MaLL
CHerry HILL MaLL
Cherry Hill, New Jersey1.3 million square feet
Upscale. Grand scale. Grand experience. Where customers can experience a little bit of everything in a shopping-dining-meeting-socializing-fun space…and tenants benefit from the large and growing inflow of customer traffic to the property.
An ambitious redevelopment effort has revitalized the historic Cherry Hill Mall. Once the first enclosed shopping mall on the East Coast; once again a compelling shopping environment and an attractive location to open new stores. The expansive grand court promenade sets the tone, with an airiness that brightens the interior and energizes customers.
More than a mall, it’s a destination. As PREIT continues to secure the right merchants for the market, customer traffic is being drawn from across New Jersey and the greater Philadelphia metropolitan area.
NeW IN ’09:
• An expanded selection of quality merchandise, with Nordstrom, J. Crew, Urban Outfitters, Tilly’s, Brighton Collectibles, PS from Aeropostale, Swarovski Crystal, Teavana, Pandora, American Apparel, Metropark, and an expanded Forever 21
• Bistro Row and its signature restaurants: The Capital Grille, Seasons 52, California Pizza Kitchen, and Maggiano’s Little Italy
• In-line occupancy was 93.5% at the end of the year
More IN 2010:
• Joining the notable line-up of tenants: 77kids, GUESS?, and The Buckle
• Expected sales productivity in 2010: more than $500 per square foot, based on the uptick in sales since the opening of Nordstrom

For the past half-century, PREIT has been adding value to its portfolio. We have identified under-utilized properties and successfully financed and managed redevelopments and renovations. We have expanded our footprint to nearly 35 million square feet of operating retail properties. Today, we are creating enhanced shopping experiences at our redeveloped properties and, at several locations, adding a complementary mix of uses.
For PREIT, 2009 was a year of contrasts. The construction phase of our redevelopment program is now substantially complete, and we believe our properties are well positioned to capture a larger share of consumer spending when the retail environment improves. While the fragile economy squeezed credit markets and put a dent in consumer spending, we saw dramatic increases in customer traffic at major store openings, such as Nordstrom at Cherry Hill Mall and, in January 2010, Whole Foods Market and Café at Plymouth Meeting Mall. We see this as confirmation that we’re putting the right retailers in the right settings to tap shopper interest and enthusiasm. Further, we were able to lease or renew nearly three million square feet of retail space, a major accomplishment in a difficult market.
The issue of financing took center stage in 2009. Facing tight credit markets and the need to source construction capital, we took steps to conserve cash and raise liquidity. We cut operating expenses and reduced the dividend payout, while successfully refinancing a number of maturing mortgages, completing several new secured financings, and selling assets.
In March 2010, with the unanimous support and participation of our banks, we closed on a $670 million credit facility that replaced our previous facilities. This transaction provides the financial foundation to allow us to focus on improving our operations, realizing the benefits of our redevelopment program, and implementing strategic plans for the future.
Valuable propertiesOur five-year, 24-property, $1 billion redevelopment and development program has infused a new look and feel to many of our properties, introducing amenities and distinctive elements that position them well to benefit from the eventual turnaround in the retail industry. We are now focused on filling our properties with the kind of retail stores and restaurants that will attract more consumers, drive more revenue for tenants, and create more value for our shareholders.PREIT is expanding the concept of malls by incorporating mixed-use components in our redevelopment projects, such as offices, residences, movie theatres, upscale restaurants, and natural and organic grocers. It takes just one return visit to a completed redevelopment property to see the transformation in form and function. Many of our first-to-market tenants have opened their doors to long lines and enthusiastic crowds, even against the headwinds of economic uncertainty. As people gain the confidence to shop more freely, and retailers sense the return of demand, our properties are providing attractive locations to meet these needs.
Cherry Hill Mall, in Cherry Hill, New Jersey, reflects our most ambitious redevelopment effort to date. We saw an opportunity to transform this local mall, acquired in 2003, into a regional center by bringing in national retailers not currently in the southern New Jersey market. Today, its potential is being realized, with a revitalized property and noteworthy additions in 2009 – Nordstrom, J.Crew, Urban Outfitters, among others – and the new “Bistro Row” of casual and upscale restaurants.
Plymouth Meeting Mall, in Plymouth Meeting, Pennsylvania, is located near one of the highest traffic corridors on the East Coast – where Interstate 476 meets the Pennsylvania Turnpike, with 80 million commuters passing through each year. Our transformation of this property started with a cluster of popular restaurants, followed by a new lifestyle wing that opened in May 2009. The recent addition of Whole Foods
Ronald RubinChairman and Chief Executive Officer
Edward A. Glickman President and Chief Operating Officer
To oUr FeLLoW sHareHoLDers,
Ronald Rubin Chairman and Chief Executive Officer
Edward A. Glickman President and Chief Operating Officer
April 16, 2010
aT 50 years sTroNg, We see a LoT oF poTeNTIaL aHeaD. We beLIeve THaT We’ve MaDe THe rIgHT INvesTMeNTs IN oUr properTIes, aND are NoW IN a MUCH earLIer pHase oF THe asseT MaTUrITy CyCLe.
Market and Café has dramatically increased foot traffic throughout the property, and there is a marked increase in interest by retailers eager to capture some of this new energy.
Voorhees Town Center, in Voorhees, New Jersey, has become a distinctive mixed-use property, the first of its kind and scale in the region. The resized and renovated two-story mall combines specialty retail stores with department store anchors Macy’s and Boscov’s. Adjacent to the mall, we have developed a mixed-use town center with our residential development partner. When completed, Town Center Boulevard is expected to create a sense of community by tying together upscale dining, street retail boutiques, offices, and new residences.
The Gallery at Market East, in Philadelphia, Pennsylvania, is the largest retail complex in Center City, stretching over three city blocks. The property houses one of the busiest commuter transportation hubs on the East Coast, with approximately 40,000 people passing through its doors on a daily basis. When it comes to location, The Gallery has every advantage: it’s adjacent to the Pennsylvania Convention Center, and just blocks away from major cultural and historical attractions, including Chinatown, the Liberty Bell, the National Constitution Center, and Independence Hall. Our initial focus has been on redeveloping the former Strawbridge & Clothier flagship department store at the east end of the property. In August 2009, we reopened three upper floors as office space, which now houses 600 employees of the Commonwealth of Pennsylvania. We expect retail space to occupy the floors closest to street level that connect with the existing mall.
Fit at 50PREIT is 50 years strong, with an entrepreneurial approach and a proven team of leaders. In the year ahead, we will continue to focus on decreasing our financial leverage and restructuring our balance sheet. Among the strategies we are pursuing are to access the equity capital markets, venture existing assets with partners, and continue to sell non-strategic properties. We believe our capital strategy will give us flexibility in facing the continuing challenges of today’s economy.
Our immediate plans for growth are primarily organic, based on realizing improved returns from the investment to enhance properties. When the economy improves, we may also generate growth through horizontal expansion of our properties by adding complementary uses. This could mean adding office buildings or residences to an existing mall, as we are doing at Voorhees Town Center.
Many of our properties are located close to mass transportation and are highly visible, making them attractive spaces for adding complementary uses that appeal to today’s time-constrained households. Innovative transformations look to serve unmet needs of the community, rejuvenate the functionality of the site, increase the productivity of the asset and deliver the experience consumers want.
Whatever we do, we’re in this business for the long term, and the decisions we make today will play out over a long life cycle. So while we are managing through today’s difficult economy, we are still planning for what happens next – and what happens after that. In short, we are making the best use of the assets we have in place to move PREIT forward and to prepare for the next upswing in the economy. Now is the time to think about the future – and look forward to the next 50 years.
A Heartfelt Thank YouFor 25 years, PREIT has benefitted from the wisdom of Lee Javitch, our longest serving trustee, who has decided not to seek re-election to the PREIT Board when his term expires on June 3, 2010. The Company has been served well by Lee’s thoughtfulness and guidance, and we thank him deeply for his years of service and for his meaningful contributions.
As always, we are grateful for our trustees, employees, partners, and shareholders. We value your continuing support.
To oUr FeLLoW sHareHoLDers,

a NeW sHoppINg eXperIeNCe
pLyMouTH MeeTINg MaLL
Plymouth Meeting, Pennsylvania0.9 million square feet
The Plymouth Meeting Mall that opened in 1966 may bear some resemblance to today’s redeveloped property – but it has become so much more for its tenants and their customers. Now, it is an attractive draw for local residents and office workers. Currently, 82% of the planned expansion is open for business.
sTroNg LINeup draWs More CusToMers• Anchor stores Macy’s, Boscov’s, and the new Whole Foods Market and Café,
which has dramatically increased customer traffic to the property
• 100 specialty stores, with the new open-air Plaza Shops, including Chico’s, Ann Taylor LOFT,
OLLY Shoes Fit For A Kid, Coldwater Creek, and Jos. A Bank
• “Hot concept” restaurants, such as California Pizza Kitchen, P.F. Chang’s, Dave & Buster’s,
Redstone American Grill, and Benihana
• An expansive food court and double-decker carousel ride
• 12-screen AMC movie theatre, with stadium seating
• New 345-space underground parking garage

NeW aT 50
ToWN CeNTer CoNCepT CoMbINes Four aspeCTs
• The Mall, now resized and renovated, with major anchors Macy’s and Boscov’s
• The Office – The Star Group, the region’s largest advertising agency – with an award winning state-of-the-art facility
• The Boulevard, featuring Rizzieri Aveda Salon and Institute, boutique street retail, and Intoxx Fitness, which opened in March 2010 with 13,000 square feet of space
• Abitare Residences, a mixture of luxury apartments and condominiums; two of four residential buildings on the boulevard are currently open, with approximately 80% of the units leased
voorHees ToWN CeNTer
Voorhees, New Jersey0.7 million square feet
Once the Echelon Mall, the new Voorhees Town Center has been transformed into an award winning, smart growth, mixed-use redevelopment that draws a loyal and affluent customer base.

EnclosEd Malls
city
statE
ownErshipintErEst
acquirEd
squarE FEEt
BEAVER VALLEY MALL MONACA PA 100% 2002 1,161,578
CAPITAL CITY MALL CAMP HILL PA 100% 2003 608,911
CHAMBERSBURG MALL CHAMBERSBURG PA 100% 2003 454,350
CHERRY HILL MALL CHERRY HILL NJ 100% 2003 1,276,899
CrOSSrOADS MALL BECKLEY WV 100% 2003 448,735
CuMBerLAND MALL ViNeLAND NJ 100% 2005 941,357
DArTMOuTH MALL DArTMOuTH MA 100% 1997 670,921
ExTON SqUARE MALL ExTON PA 100% 2003 1,086,862
FRANCIS SCOTT KEY MALL FreDeriCK MD 100% 2003 706,225
GADSDeN MALL GADSDeN AL 100% 2005 503,626
THE GALLERY AT MARKET EAST PHiLADeLPHiA PA 100% 2003 1,079,998
JACKSONVILLE MALL JACKSONVILLE NC 100% 2003 489,471
LEHIGH VALLEY MALL ALLENTOWN PA 50% 1973 1,157,353
LOGAN VALLEY MALL ALTOONA PA 100% 2003 778,385
LYCOMING MALL PeNNSDALe PA 100% 2003 835,218
MAGNOLIA MALL FLORENCE SC 100% 1997 616,435
MOORESTOWN MALL MOORESTOWN NJ 100% 2003 1,059,470
NEW RIVER VALLEY MALL CHRISTIANSBURG VA 100% 2003 441,063
NITTANY MALL STATE COLLEGE PA 100% 2003 532,160
NORTH HANOVER MALL HANOVER PA 100% 2003 356,491
OrLANDO FASHiON SquAre OrLANDO FL 100% 2004 1,085,651
PALMER PARK MALL EASTON PA 100% 1972/2003 457,702
PATRICK HENRY MALL NEWPORT NEWS VA 100% 2003 714,330
PHILLIPSBURG MALL PHILLIPSBURG NJ 100% 2003 578,925
PLYMOUTH MEETING MALL PLYMOUTH MEETING PA 100% 2003 939,594
THE MALL AT PRINCE GEORGES HYATTSVILLE MD 100% 1998 910,590
SOUTH MALL ALLENTOWN PA 100% 2003 405,199
SPriNGFieLD MALL SPriNGFieLD PA 50% 2005 609,998
UNIONTOWN MALL UNIONTOWN PA 100% 2003 698,011
VALLEY MALL HAGERSTOWN MD 100% 2003 917,059
VALLEY VIEW MALL LA CROSSE WI 100% 2003 598,155
VIEWMONT MALL SCRANTON PA 100% 2003 747,194
VOORHEES TOWN CENTER VOORHEES NJ 100% 2003 677,397
WASHINGTON CROWN CENTER WASHINGTON PA 100% 2003 676,117
WILLOW GROVE PARK WILLOW GROVE PA 100% 2000/2003 1,203,420
WIREGRASS COMMONS DOTHAN AL 100% 2003 638,554
WOODLAND MALL GrAND rAPiDS MI 100% 2005 1,158,651
WYOMING VALLEY MALL WILKES-BARRE PA 100% 2003 912,027
ToTal EnclosEd Malls 29,134,082
strip and powEr cEntErs
city
statE
ownErship intErEst
dEvElopEd
squarE FEEt
CHRISTIANA CENTER NEWARK De 100% 1998 302,409
CREEKVIEW CENTER WARRINGTON PA 100% 2001 425,002
THE COMMONS AT MAGNOLIA FLORENCE SC 100% 2002 234,535
METROPLEx SHOPPING CENTER PLYMOUTH MEETING PA 50% 2001 778,190
MONROE MARKETPLACE SELINSGROVE PA 100% 2008 449,610
NEW RIVER VALLEY CENTER CHRISTIANSBURG VA 100% 2007 164,663
THe COurT AT OxFOrD VALLey LANGHORNE PA 50% 1996 704,526
PAxTON TOWNE CENTRE HARRISBURG PA 100% 2001 717,518
PiTNey rOAD PLAzA LANCASTER PA 100% 2009 183,848
reD rOSe COMMONS LANCASTER PA 50% 1998 463,042
SPriNGFieLD PArK SPriNGFieLD PA 50% 1998 274,480
SuNriSe PLAzA FOrKeD riVer NJ 100% 2007 254,260
WHITEHALL MALL ALLENTOWN PA 50% 1998 557,501
ToTal sTrip and powEr cEnTErs 5,509,584
TOTAL RETAIL PORTFOLIO 34,643,666
pr
op
er
TIe
s

17
Financial ContentsSelected Financial Information 18
Consolidated Financial Statements 19
Notes to Consolidated Financial Statements 24
Management’s Report on Internal Control Over Financial Reporting 48
Reports of Independent Registered Public Accounting Firm 48
Management’s Discussion and Analysis 50
Trustees and Officers 72
Investor Information Inside Back Cover
PERFORMANCE GRAPH | The five-year performance graph atright compares our cumulative total shareholder return withthe NAREIT Equity Index, the S&P 500 Index and the Russell2000 Index. Equity real estate investment trusts are definedas those which derive more than 75% of their income fromequity investments in real estate assets. The graph assumesthat the value of the investment in each of the four was $100on the last trading day of 2004 and that all dividends werereinvested.
PREIT Equity REITs S&P 500 Russell 2000
Share Performance Graph
Comparison of Five-Year Total Return among PREIT, Equity REITs, S&P 500, and Russell 2000
40
60
20
02004 2005 2006 2007 2008 2009
80
120
100
160
140
Do
llars

18 SELECTED FINANCIAL INFORMATION
Selected Financial Information (unaudited)(in thousands, except per share amounts) Year Ended December 31,
Operating Results 2009 2008 2007 2006 2005Total revenue $ 463,088 $ 467,993 $ 460,590 $ 453,445 $ 422,616
(Loss) income from continuing operations $ (101,797) $ (18,904) $ 14,348 $ 29,985 $ 53,604
Net (loss) income $ (90,091) $ (16,355) $ 23,120 $ 31,309 $ 65,033
Net (loss allocable) income attributable to PREIT $ (85,738) $ (15,766) $ 26,510 $ 14,408 $ 44,016
(Loss) income from continuing operations per share – basic $ (2.40) $ (0.50) $ 0.45 $ 0.34 $ 0.90(Loss) income from continuing operations per share – diluted $ (2.40) $ (0.50) $ 0.44 $ 0.34 $ 0.89
Net (loss) income per share – basic $ (2.11) $ (0.43) $ 0.68 $ 0.37 $ 1.19Net (loss) income per share – diluted $ (2.11) $ (0.43) $ 0.67 $ 0.37 $ 1.17
Cash FlowsCash provided by operating activities $ 136,148 $ 124,963 $ 149,486 $ 164,405 $ 130,182Cash used in investing activites $ (103,405) $ (353,239) $ (242,377) $ (187,744) $ (326,442)Cash provided by financing activities $ 31,714 $ 210,137 $ 105,008 $ 16,299 $ 178,956
Cash DistributionsCash distributions per share – common shares $ 0.74 $ 2.28 $ 2.28 $ 2.28 $ 2.25Cash distributions per share – preferred shares $ — $ — $ 3.50 $ 5.50 $ 5.50
Balance Sheet ItemsInvestment in real estate, at cost $3,684,313 $3,708,048 $3,367,294 $3,132,370 $2,867,436
Total assets $3,346,580 $3,444,277 $3,264,074 $3,145,609 $3,018,547
Long Term DebtConsolidated properties
Mortgage loans payable, including debt premium $1,777,121 $1,760,296 $1,656,942 $1,599,571 $1,372,1322003 Credit Facility $ 486,000 $ 400,000 $ 330,000 $ 332,000 $ 342,500Exchangeable notes, net of debt discount $ 132,236 $ 230,079 $ 268,245 $ — $ —Senior unsecured 2008 Term Loan $ 170,000 $ 170,000 $ — $ — $ —Corporate notes payable $ — $ — $ — $ 1,148 $ 94,400
Company’s share of partnershipsMortgage loans payable $ 181,776 $ 184,064 $ 188,089 $ 189,940 $ 134,500
Funds From Operations(1)
Net (loss) income $ (90,091) $ (16,355) $ 23,120 $ 31,309 $ 65,033Dividends on preferred shares — — (7,941) (13,613) (13,613)Redemption of preferred shares — — 13,347 — —Gains on sales of interests in real estate (923) — (579) — (5,586)Gains on sales of discontinued operations (9,503) — (6,699) (1,414) (6,158)Depreciation and amortization:
Wholly owned and consolidated partnerships, net 164,284 147,435 128,370 119,490 106,252Unconsolidated partnerships 8,144 8,361 7,130 7,017 4,582Discontinued operations 1,176 1,571 1,769 5,471 2,327
Funds from operations $ 73,087 $ 141,012 $ 158,517 $ 148,260 $ 152,837
Weighted average number of shares outstanding 40,953 38,807 37,577 36,256 36,090Weighted average effect of full conversion OP Units 2,268 2,236 3,308 4,083 4,580Effect of common share equivalents 12 14 325 599 673Total weighted average shares outstanding including OP Units 43,233 41,057 41,210 40,938 41,343
Funds from operations per share $ 1.69 $ 3.43 $ 3.85 $ 3.62 $ 3.70
(1) Funds From Operations (“FFO”) is defined as income before gains and losses on sales of operating properties and extraordinary items (computed in accordance withgenerally accepted accounting principles (“GAAP”)) plus real estate depreciation; plus or minus adjustments for unconsolidated partnerships to reflect funds from oper-ations on the same basis. FFO should not be construed as an alternative to net income (as determined in accordance with GAAP) as an indicator of the Company’soperating performance, or to cash flows from operating activities (as determined in accordance with GAAP) as a measure of liquidity. In addition, the Company’smeasure of FFO as presented may not be comparable to similarly titled measures as reported by other companies. For additional information about FFO, please referto page 62.

PENNSYLVANIA REAL ESTATE INVESTMENT TRUST 2009 ANNUAL REPORT 19
Consolidated Balance Sheets(as revised)
December 31, December 31,(in thousands of dollars, except share and per share amounts) 2009 2008
Assets:Investments in real estate, at cost:
Operating properties $ 3,459,745 $ 3,287,232Construction in progress 215,231 411,479Land held for development 9,337 9,337
Total investments in real estate 3,684,313 3,708,048Accumulated depreciation (623,309) (516,832)
Net investments in real estate 3,061,004 3,191,216
Investments in partnerships, at equity 32,694 36,164
Other assets:Cash and cash equivalents 74,243 9,786Tenant and other receivables (net of allowance for doubtful accounts of $19,981and $16,895 at December 31, 2009 and 2008, respectively) 55,303 57,970
Intangible assets (net of accumulated amortization of $198,984 and $164,666 atDecember 31, 2009 and 2008, respectively) 38,978 68,296
Deferred costs and other assets 84,358 80,845Total assets $ 3,346,580 $ 3,444,277
Liabilities:Mortgage loans (including debt premium of $2,744 and $4,026 atDecember 31, 2009 and 2008, respectively) $ 1,777,121 $ 1,760,296
Exchangeable notes (net of debt discount of $4,664 and $11,421 atDecember 31, 2009 and 2008, respectively) 132,236 230,079
2003 Credit Facility 486,000 400,000Senior unsecured 2008 Term Loan 170,000 170,000Tenants’ deposits and deferred rent 13,170 13,112Distributions in excess of partnership investments 48,771 48,788Accrued construction expenses 11,778 38,859Fair value of derivative instruments 14,610 29,169Accrued expenses and other liabilities 58,090 55,711
Total liabilities 2,711,776 2,746,014
Commitments and Contingencies (Note 12)Equity:
Shares of beneficial interest, $1.00 par value per share; 100,000,000 shares authorized;issued and outstanding 44,615,647 shares at December 31, 2009 and 39,468,523shares at December 31, 2008 44,616 39,469
Capital contributed in excess of par 881,735 853,281Accumulated other comprehensive loss (30,016) (45,341)Distributions in excess of net income (317,682) (201,080)
Total equity – Pennsylvania Real Estate Investment Trust 578,653 646,329Noncontrolling interest 56,151 51,934
Total equity 634,804 698,263Total liabilities and equity $ 3,346,580 $ 3,444,277
See accompanying notes to consolidated financial statements.

20 CONSOLIDATED FINANCIAL STATEMENTS
Consolidated Statements of OperationsFor the Year Ended December 31,
(as revised) (as revised)(in thousands of dollars, except per share amounts) 2009 2008 2007
Revenue:Base rent $ 298,185 $ 295,608 $ 288,509Expense reimbursements 137,759 138,331 135,080Percentage rent 5,357 7,157 9,067Lease termination revenue 2,154 4,114 1,589Other real estate revenue 16,598 18,284 19,369Interest and other income 3,035 4,499 6,976
Total revenue 463,088 467,993 460,590
Expenses:Operating expenses:
CAM and real estate tax (141,758) (133,943) (127,955)Utilities (24,074) (24,837) (24,965)Operating expenses (27,744) (27,740) (26,090)
Total operating expenses (193,576) (186,520) (179,010)Depreciation and amortization (166,570) (150,041) (130,632)Other expenses:
General and administrative expenses (37,558) (40,324) (41,415)Impairment of assets and abandoned project costs (75,012) (28,889) (1,531)Income taxes and other expenses (169) (237) (413)
Total other expenses (112,739) (69,450) (43,359)Interest expense, net (133,460) (115,013) (100,188)Gain on extinguishment of debt 27,047 27,074 —
Total expenses (579,298) (493,950) (453,189)(Loss) income before equity in income of partnerships, gains on sales of real estate,and discontinued operations (116,210) (25,957) 7,401
Equity in income of partnerships 10,102 7,053 4,637Gains on sales of real estate 4,311 — 2,310(Loss) income from continuing operations (101,797) (18,904) 14,348Discontinued operations:
Operating results from discontinued operations 2,203 2,549 2,073Gains on sales of discontinued operations 9,503 — 6,699
Income from discontinued operations 11,706 2,549 8,772Net (loss) income (90,091) (16,355) 23,120Net loss (income) attributed to noncontrolling interest 4,353 589 (2,016)Net (loss) income before redemption of and dividends on preferred shares (85,738) (15,766) 21,104Redemption of preferred shares — — 13,347Dividends on preferred shares — — (7,941)Net (loss) income attributable to Pennsylvania Real Estate Investment Trust $ (85,738) $ (15,766) $ 26,510
See accompanying notes to consolidated financial statements.

PENNSYLVANIA REAL ESTATE INVESTMENT TRUST 2009 ANNUAL REPORT 21
Consolidated Statements of Operations (continued)Earnings per Share
For the Year Ended December 31,(as revised) (as revised)
(in thousands of dollars, except per share amounts) 2009 2008 2007
(Loss) income from continuing operations $ (101,797) $ (18,904) $ 14,348Noncontrolling interest – continuing operations 4,115 541 (1,818)Redemption of preferred shares — — 13,347Dividends on preferred shares — — (7,941)
(Loss) income from continuing operations available to common shareholders (97,682) (18,363) 17,936Dividends on restricted shares (797) (1,222) (1,088)
(Loss) income from continuing operations used to calculate earnings per share –basic and diluted $ (98,479) $ (19,585) $ 16,848
Income from discontinued operations 11,706 2,549 8,772Noncontrolling interest – discontinued operations 238 48 (198)
Income from discontinued operations used to calculate earnings per share –basic and diluted $ 11,944 $ 2,597 $ 8,574
Basic (loss) earnings per share:(Loss) income from continuing operations $ (2.40) $ (0.50) $ 0.45Income from discontinued operations 0.29 0.07 0.23
$ (2.11) $ (0.43) $ 0.68
Diluted (loss) earnings per share:(Loss) income from continuing operations $ (2.40) $ (0.50) $ 0.44Income from discontinued operations 0.29 0.07 0.23
$ (2.11) $ (0.43) $ 0.67
Weighted average shares outstanding – basic 40,953 38,807 37,577Effect of dilutive common share equivalents(1) — — 325Weighted average shares outstanding – diluted 40,953 38,807 37,902
(1) For the years ended December 31, 2009 and December 31, 2008, there are net losses allocable to common shareholders from continuing operations, so theeffect of common share equivalents of 12 and 14 for the years ended December 31, 2009 and December 31, 2008, respectively, is excluded from thecalculation of diluted loss per share.
See accompanying notes to consolidated financial statements.

22 CONSOLIDATED FINANCIAL STATEMENTS
Shares of Capital AccumulatedBeneficial Preferred Contributed Other Distributions
Total Comprehensive Interest Shares in Excess Comprehensive in Excess of Non-controlling(in thousands of dollars, except per share amounts) Equity Income (Loss) $1.00 Par $0.01 Par of Par Loss Net Income (Loss) InterestBalance January 1, 2007 $ 1,043,664 $ — $ 36,947 $ 25 $ 917,322 $ 7,893 $ (32,886) $ 114,363Comprehensive income (loss):Net income 23,120 23,120 — — — — 21,104 2,016Unrealized loss on derivatives (14,644) (14,644) — — — (14,644) — —Other comprehensive loss (217) (217) — — — (217) — —Total comprehensive income 8,259 $ 8,259 2,016Shares issued upon redemption
of Operating Partnership Units — 2,053 — 51,231 — — (53,284)Shares issued upon exercise of options 221 76 — 145 — — —Shares issued under distribution
reinvestment and share purchase plan 3,883 98 — 3,785 — — —Shares issued under employee
share purchase plans 762 20 — 742 — — —Shares issued under equity incentive
plans, net of retirements (2,090) 93 — (2,183) — — —Repurchase of common shares (5,444) (153) — (3,291) — (2,000) —Preferred share redemption (129,956) — (25) (143,278) — 13,347 —Capped calls (12,578) — — (12,578) — — —Exchangeable notes discount 19,255 — — 19,255 — — —Amortization of deferred compensation 7,071 — — 7,071 — — —Distributions paid to common
shareholders ($2.28 per share) (86,475) — — — — (86,475) —Distributions paid to preferred
shareholders ($3.50 per share) (8,659) — — — — (8,659) —Distributions paid to
noncontrolling interest:Distributions paid to OperatingPartnership unitholders ($2.28 per unit) (7,582) — — — — — (7,582)Distributions to noncontrolling
interest, net (347) — — — — — (347)Balance December 31, 2007 $ 829,984 $ 39,134 $ — $ 838,221 $ (6,968) $ (95,569) $ 55,166Comprehensive income (loss):Net loss (16,355) (16,355) — — — (15,766) (589)Unrealized loss on derivatives (38,415) (38,415) — — (38,415) — —Other comprehensive income 42 42 — — 42 — —Total comprehensive loss (54,728) $ (54,728) (589)Shares issued upon redemption of
Operating Partnership Units — 42 973 — — (1,015)Shares issued upon exercise
of options 610 26 584 — — —Shares issued under distribution
reinvestment and sharepurchase plan 1,329 70 1,259 — — —
Shares issued under employeeshare purchase plans 729 45 684 — — —
Shares issued under equity incentiveplans, net of retirements (28) 176 (204) — — —
Repurchase of common shares (624) (24) (600) — — —Adjustment for Outperformance plan (note 9) 2,911 — 2,911 — — —Amortization of deferred compensation 9,453 — 9,453 — — —Distributions paid to common
shareholders ($2.28 per share) (89,745) — — — (89,745) —Distributions paid to noncontrolling interest:Distributions paid to OperatingPartnership unitholders ($2.28 per unit) (4,957) — — — — (4,957)Contributions from noncontrolling
interest, net 3,329 — — — — 3,329Balance December 31, 2008 $ 698,263 $ 39,469 $ 853,281 $ (45,341) $ (201,080) $ 51,934Comprehensive income (loss):Net loss (90,091) (90,091) — — — (85,738) (4,353)Unrealized gain on derivatives 14,558 14,558 — — 13,836 — 722Other comprehensive income 1,567 1,567 — — 1,489 — 78Total comprehensive loss (73,966) $ (73,966) (3,553)Shares issued upon redemption of
Operating Partnership Units — 13 276 — — (289)Shares issued under distribution
reinvestment and share purchase plan 260 45 215 — — —Shares issued under employee share
purchase plans 502 102 400 — — —Shares issued under equity incentive
plans, net of retirements (207) 687 (894) — — —Shares issued for repurchase of
exchangeable notes 24,988 4,300 20,688 — — —Amortization of deferred compensation 7,769 — 7,769 — — —Distributions paid to common shareholders
($0.74 per share) (30,864) — — — (30,864) —Distributions paid to noncontrolling interest:Distributions paid to Operating Partnership
unitholders ($0.74 per unit) (1,610) — — — — (1,610)Contributions from noncontrolling
interest, net 9,669 — — — — 9,669Balance December 31, 2009 $ 634,804 $ 44,616 $ 881,735 $ (30,016) $ (317,682) $ 56,151
See accompanying notes to consolidated financial statements
Consolidated Statements of Equity and Comprehensive IncomeFor the years ended December 31, 2009, 2008 and 2007 PREIT Shareholders

PENNSYLVANIA REAL ESTATE INVESTMENT TRUST 2009 ANNUAL REPORT 23
Consolidated Statements of Cash FlowsFor the Year Ended December 31,
(as revised) (as revised)(in thousands of dollars) 2009 2008 2007
Cash flows from operating activities:Net (loss) income $ (90,091) $ (15,766) $ 21,104Adjustments to reconcile net (loss) income to net cash provided by operating activities:
Depreciation 134,301 117,988 100,020Amortization 40,672 28,915 22,278Straight-line rent adjustments (1,308) (2,338) (2,439)Provision for doubtful accounts 6,567 4,666 2,414Amortization of deferred compensation 7,769 8,634 7,071Amortization of Outperformance Program — 819 819Gain on sales of real estate investments and discontinued operations (13,814) — (9,009)Net gain on forward starting swap activities — (2,002) —Impairment of assets and abandoned project costs 75,012 28,889 1,531Gain on extinguishment of debt (27,047) (27,074) —
Change in assets and liabilities:Net change in other assets (1,914) (9,393) (5,979)Net change in other liabilities 6,001 (8,375) 11,676
Net cash provided by operating activities 136,148 124,963 149,486Cash flows from investing activities:Additions to construction in progress (128,364) (307,411) (213,761)Investments in real estate improvements (39,113) (25,027) (32,524)Investments in real estate acquisitions, net of cash acquired (458) (11,914) (11,657)Additions to leasehold improvements (317) (762) (945)Investments in partnerships (1,811) (4,006) (13,654)Capitalized leasing costs (4,341) (5,314) (4,830)Cash proceeds from sales of real estate investments 62,595 126 32,286Decrease in cash escrows 3,313 7,181 1,130Increase in notes receivable from tenants — (10,000) —Cash distributions from partnerships in excess of equity in income 5,091 3,888 1,578
Net cash used in investing activities (103,405) (353,239) (242,377)Cash flows from financing activities:Net borrowing from (repayment of) 2003 Credit Facility 86,000 70,000 (2,000)Borrowings from senior unsecured 2008 Term Loan — 170,000 —Proceeds from mortgage loans 75,602 633,265 150,000Proceeds from sale of exchangeable notes — — 281,031Repayment of mortgage loans (39,933) (506,514) (56,663)Repayment of corporate notes — — (1,148)Principal installments on mortgage loans (17,561) (21,603) (23,123)Repurchase of exchangeable notes (47,156) (15,912) —Net payment from settlement of forward-starting interest swap agreements — (16,503) 4,069Payment of deferred financing costs (3,397) (10,487) (4,201)Purchase of capped calls — — (12,578)Dividends paid to common shareholders (30,864) (89,745) (86,475)Dividends paid to preferred shareholders — — (8,659)Distributions paid to Operating Partnership unitholders and noncontrolling interest (1,610) (4,957) (7,582)Shares of beneficial interest issued 659 3,217 19,157Shares of beneficial interest repurchased, other (114) (624) (6,983)Shares of beneficial interest repurchased under share repurchase program — — (5,444)Redemption of preferred shares — — (129,955)Operating Partnership units purchased or redeemed — — (4,438)Contributions from investor with noncontrolling interest in project 10,088 — —
Net cash provided by financing activities 31,714 210,137 105,008Net change in cash and cash equivalents 64,457 (18,139) 12,117Cash and cash equivalents, beginning of year 9,786 27,925 15,808Cash and cash equivalents, end of year $ 74,243 $ 9,786 $ 27,925
See accompanying notes to consolidated financial statements.

24 NOTES TO CONSOLIDATED FINANCIAL STATEMENTS
Notes To Consolidated Financial StatementsFor the Years Ended December 31, 2009, 2008 and 2007
1. Summary of Significant Accounting Policies
NATURE OF OPERATIONS | Pennsylvania Real Estate Investment Trust, aPennsylvania business trust founded in 1960 and one of the first equityreal estate investment trusts (“REITs”) in the United States, has aprimary investment focus on retail shopping malls and strip and powercenters located in the eastern half of the United States, primarily in theMid-Atlantic region. As of December 31, 2009, the Company’s portfo-lio consisted of a total of 54 properties in 13 states, including 38shopping malls, 13 strip and power centers and three properties underdevelopment. The ground-up development portion of the Company’sportfolio contained three properties in two states, with two classified as“mixed use” (a combination of retail and other uses), and one classifiedas “other.”
The Company holds its interest in its portfolio of properties through itsoperating partnership, PREIT Associates, L.P. (the “OperatingPartnership”). The Company is the sole general partner of theOperating Partnership and, as of December 31, 2009, the Companyheld a 95.0% interest in the Operating Partnership, and consolidates itfor reporting purposes. The presentation of consolidated financialstatements does not itself imply that the assets of any consolidatedentity (including any special-purpose entity formed for a particularproject) are available to pay the liabilities of any other consolidatedentity, or that the liabilities of any consolidated entity (including anyspecial-purpose entity formed for a particular project) are obligations ofany other consolidated entity.
The Company evaluates operating results and allocates resources on aproperty-by-property basis, and does not distinguish or evaluate con-solidated operations on a geographic basis. No individual propertyconstitutes more than 10% of consolidated revenue or assets, and thusthe individual properties have been aggregated into one reportablesegment based upon their similarities with regard to the nature of theCompany’s properties and the nature of the Company’s tenants andoperational processes, as well as long-term financial performance. Inaddition, no single tenant accounts for 10% or more of consolidatedrevenue, and none of the Company’s properties are located outside theUnited States.
Pursuant to the terms of the partnership agreement of the OperatingPartnership, each of the limited partners has the right to redeem suchpartner’s units of limited partnership interest in the OperatingPartnership (“OP Units”) for cash or, at the election of the Company, theCompany may acquire such OP Units for common shares of theCompany on a one-for-one basis, in some cases beginning one yearfollowing the respective issue date of the OP Units and in other casesimmediately. In the event of the redemption of all of the outstanding OPUnits held by limited partners for cash, the total amount that wouldhave been distributed as of December 31, 2009 would have been$19.7 million, which is calculated using the Company’s December 31,2009 closing share price on the New York Stock Exchange of $8.46multiplied by the number of outstanding OP Units held by limited part-ners.
The Company provides its management, leasing and real estate devel-opment services through two companies: PREIT Services, LLC (“PREITServices”), which generally develops and manages properties that theCompany consolidates for financial reporting purposes, and PREIT-RUBIN, Inc. (“PRI”), which generally develops and manages properties
that the Company does not consolidate for financial reporting pur-poses, including properties owned by partnerships in which theCompany owns an interest and properties that are owned by thirdparties in which the Company does not have an interest. PREITServices and PRI are consolidated. PRI is a taxable REIT subsidiary, asdefined by federal tax laws, which means that it is able to offer anexpanded menu of services to tenants without jeopardizing theCompany’s continuing qualification as a REIT under federal tax law.
CONSOLIDATION | The Company consolidates its accounts and theaccounts of the Operating Partnership and other controlled sub-sidiaries and reflects the remaining interest of such entities asnoncontrolling interest. All significant intercompany accounts andtransactions have been eliminated in consolidation.
CURRENT ECONOMIC DOWNTURN, CHALLENGING CAPITAL MARKET
CONDITIONS, THE COMPANY’S LEVERAGE AND NEAR TERM CAPITAL NEEDS
| The downturn in the overall economy and the disruptions in the finan-cial markets have reduced consumer confidence and negativelyaffected employment and consumer spending on retail goods. As aresult, the sales and profit performance of retailers in general hasdecreased, sales at the Company’s properties in particular havedecreased, and the Company has experienced delays or deferred deci-sions regarding the openings of new retail stores and of lease renewals.The Company is adjusting its plans and actions to take into accountthe difficult current environment.
In addition, credit markets have experienced significant dislocationsand liquidity disruptions. These circumstances have materially affectedliquidity in the debt markets, making financing terms for borrowers lessattractive, and in certain cases have resulted in the limited availability orunavailability of certain types of debt financing.
The difficult conditions in the market for debt capital and commercialmortgage loans, including the commercial mortgage backed securitiesmarket, and the downturn in the general economy and its effect onretail sales, as well as the Company’s significant leverage resulting fromthe use of debt to fund its redevelopment program and other develop-ment activity, have combined to necessitate that the Company vary itsapproach to obtaining, using and recycling capital. The Companyintends to consider all of its available options for accessing the capitalmarkets, given its position and constraints.
The amounts remaining to be invested in the last phases of theCompany’s current redevelopment projects are significantly less than in2009, and the Company believes it has access to sufficient capital tofund these remaining amounts.
The Company is contemplating ways to reduce its leverage through avariety of means available to it, and subject to and in accordance withthe terms of the 2010 Credit Facility. These steps might include obtain-ing equity capital, including through the issuance of equity securities ifmarket conditions are favorable, through joint ventures or other part-nerships or arrangements involving the contribution of assets withinstitutional investors, private equity investors or other REITs, throughsales of properties with values in excess of their mortgage loans or allo-cable debt and application of the excess proceeds to debt reduction,or through other actions.
PARTNERSHIP INVESTMENTS | The Company accounts for its invest-ments in partnerships that it does not control using the equity method

PENNSYLVANIA REAL ESTATE INVESTMENT TRUST 2009 ANNUAL REPORT 25
of accounting. These investments, each of which represent a 40% to50% noncontrolling ownership interest at December 31, 2009, arerecorded initially at the Company’s cost and subsequently adjusted forthe Company’s share of net equity in income and cash contributionsand distributions. The Company does not control any of these equitymethod investees for the following reasons:
• Except for two properties that the Company co-manages with itspartner, the other entities are managed on a day-to-day basis byone of the Company’s other partners as the managing generalpartner in each of the respective partnerships. In the case of the co-managed properties, all decisions in the ordinary course of businessare made jointly.
• The managing general partner is responsible for establishing theoperating and capital decisions of the partnership, includingbudgets, in the ordinary course of business.
• All major decisions of each partnership, such as the sale, refinanc-ing, expansion or rehabilitation of the property, require the approvalof all partners.
• Voting rights and the sharing of profits and losses are in proportionto the ownership percentages of each partner.
STATEMENTS OF CASH FLOWS | The Company considers all highly liquidshort-term investments with an original maturity of three months or lessto be cash equivalents. At December 31, 2009 and 2008, cash andcash equivalents totaled $74.2 million and $9.8 million, respectively,and included tenant security deposits of $4.1 million and $4.5 million,respectively. Cash paid for interest, including interest related to discon-tinued operations, was $124.9 million, $117.5 million and $109.5million for the years ended December 31, 2009, 2008 and 2007,respectively, net of amounts capitalized of $5.6 million, $16.0 millionand $16.3 million, respectively.
SIGNIFICANT NON-CASH TRANSACTIONS | Accrued constructionexpenses decreased $27.1 million in the twelve months endedDecember 31, 2009, representing a non-cash decrease in constructionin progress.
In October 2009, the Company repurchased $35.0 million in aggregateprincipal amount of its 4% Senior Exchangeable Notes due in 2012(“Exchangeable Notes”) in exchange for 1.3 million common shareswith a fair market value of $10.0 million and $13.3 million of cash. InJune 2009, the Company repurchased $25.0 million in aggregate prin-cipal amount of its Exchangeable Notes in exchange for 3.0 millioncommon shares with a fair market value of $15.0 million.
In February 2008, the Company acquired a 0.1% general partner inter-est and a 49.8% limited partner interest in Bala Cynwyd Associates,L.P. (“BCA”) for $3.9 million. In June 2009, the Company acquired anadditional 49.9% of the limited partner interest in BCA for 140,745 OPUnits pursuant to a put/call arrangement. In connection with the acqui-sition of partnership interests in BCA in 2008, the Companyconsolidated an $8.0 million mortgage loan.
On June 6, 2007, the Company issued 1,580,211 common shares inexchange for a like number of OP Units in a transaction with an entitythat is an affiliate of Mark Pasquerilla, a trustee of the Company.
Accounting Policies
USE OF ESTIMATES | The preparation of financial statements in conform-ity with accounting principles generally accepted in the United Statesof America requires the Company’s management to make estimatesand assumptions that affect the reported amounts of assets and liabil-ities and disclosure of contingent assets and liabilities at the date of thefinancial statements, and the reported amounts of revenue andexpense during the reporting periods. Actual results could differ fromthose estimates.
The Company’s management makes complex or subjective assump-tions and judgments in applying its critical accounting policies. Inmaking these judgments and assumptions, management considers,among other factors:
• events and changes in property, market and economic conditions;
• estimated future cash flows from property operations; and
• the risk of loss on specific accounts or amounts.
The estimates and assumptions made by the Company’s managementin applying its critical accounting policies have not changed materiallyover time, and none of these estimates or assumptions have proven tobe materially incorrect or resulted in the Company recording any signif-icant adjustments relating to prior periods. The Company will continueto monitor the key factors underlying its estimates and judgments, butno change is currently expected.
REVENUE RECOGNITION | The Company derives over 95% of its revenuefrom tenant rent and other tenant-related activities. Tenant rentincludes base rent, percentage rent, expense reimbursements (such ascommon area maintenance, real estate taxes and utilities), amortizationof above-market and below-market intangibles (as described belowunder “Intangible Assets”) and straight-line rent. The Company recordsbase rent on a straight-line basis, which means that the monthly baserent income according to the terms of the Company’s leases with itstenants is adjusted so that an average monthly rent is recorded foreach tenant over the term of its lease. When tenants vacate prior to theend of their lease, the Company accelerates amortization of any relatedunamortized straight-line rent balances, and unamortized above-market and below-market intangible balances are amortized as adecrease or increase to real estate revenue, respectively. The straight-line rent adjustment increased revenue by approximately $1.3 million in2009, $2.3 million in 2008 and $2.4 million in 2007. The straight-linereceivable balances included in tenant and other receivables on theaccompanying balance sheet as of December 31, 2009 and December31, 2008 were $24.9 million and $24.2 million, respectively.
Percentage rent represents rental income that the tenant pays basedon a percentage of its sales, either as a percentage of their total salesor as a percentage of sales over a certain threshold. In the latter case,the Company does not record percentage rent until the sales thresholdhas been reached. Revenue for rent received from tenants prior to theirdue dates is deferred until the period to which the rent applies.
In addition to base rent, certain lease agreements contain provisionsthat require tenants to reimburse a fixed or pro rata share of certaincommon area maintenance costs and real estate taxes. Tenants gen-erally make expense reimbursement payments monthly based on abudgeted amount determined at the beginning of the year. During theyear, the Company’s income increases or decreases based on actual

26 NOTES TO CONSOLIDATED FINANCIAL STATEMENTS
expense levels and changes in other factors that influence the reim-bursement amounts, such as occupancy levels. As of December 31,2009 and 2008, the Company’s accounts receivable included accruedincome of $8.9 million and $11.7 million, respectively, because actualreimbursable expense amounts able to be billed to tenants under appli-cable contracts exceeded amounts actually billed. Subsequent to theend of the year, the Company prepares a reconciliation of the actualamounts due from tenants. The difference between the actual amountdue and the amounts paid by the tenant throughout the year is billedor credited to the tenant, depending on whether the tenant paid toolittle or too much during the year.
Payments made to tenants as inducements to enter into a lease aretreated as deferred costs that are amortized as a reduction of rentalrevenue over the term of the related lease.
No single tenant represented 10% or more of the Company’s rentalrevenue in any period presented.
Lease termination fee income is recognized in the period when a termi-nation agreement is signed, collectibility is assured and the Companyis no longer obligated to provide space to the tenant. In the event thata tenant is in bankruptcy when the termination agreement is signed,termination fee income is deferred and recognized when it is received.
The Company also generates revenue by providing management serv-ices to third parties, including property management, brokerage,leasing and development. Management fees generally are a percentageof managed property revenue or cash receipts. Leasing fees are earnedupon the consummation of new leases. Development fees are earnedover the time period of the development activity and are recognized onthe percentage of completion method. These activities are collectivelyincluded in “Interest and other income” in the consolidated statementsof operations.
FAIR VALUE | Fair value accounting applies to reported balances that arerequired or permitted to be measured at fair value under existingaccounting pronouncements; the standard does not require any newfair value measurements of reported balances.
These new accounting requirements emphasize that fair value is amarket-based measurement, not an entity-specific measurement.Therefore, a fair value measurement should be determined based onthe assumptions that market participants would use in pricing the assetor liability. As a basis for considering market participant assumptions infair value measurements, these accounting requirements establish afair value hierarchy that distinguishes between market participantassumptions based on market data obtained from sources independ-ent of the reporting entity (observable inputs that are classified withinLevels 1 and 2 of the hierarchy) and the reporting entity’s own assump-tions about market participant assumptions (unobservable inputsclassified within Level 3 of the hierarchy).
Level 1 inputs utilize quoted prices (unadjusted) in active markets foridentical assets or liabilities that the Company has the ability to access.
Level 2 inputs are inputs other than quoted prices included in Level 1that are observable for the asset or liability, either directly or indirectly.Level 2 inputs may include quoted prices for similar assets and liabili-ties in active markets, as well as inputs that are observable for theasset or liability (other than quoted prices), such as interest rates,foreign exchange rates, and yield curves that are observable at com-monly quoted intervals.
Level 3 inputs are unobservable inputs for the asset or liability, whichare typically based on an entity’s own assumptions, as there is little, ifany, related market activity.
In instances where the determination of the fair value measurement isbased on inputs from different levels of the fair value hierarchy, the levelin the fair value hierarchy within which the entire fair value measurementfalls is based on the lowest level input that is significant to the fair valuemeasurement in its entirety. The Company’s assessment of the signifi-cance of a particular input to the fair value measurement in its entiretyrequires judgment, and considers factors specific to the asset or liabil-ity. The Company utilizes the fair value hierarchy in its accounting forderivatives (level 2), financial instruments (level 3) and in its impairmentreviews of real estate assets (level 3) and goodwill (level 3).
DERIVATIVES | Currently, the Company uses interest rate swaps andcaps to manage its interest rate risk. The valuation of these instrumentsis determined using widely accepted valuation techniques, includingdiscounted cash flow analysis on the expected cash flows of eachderivative. This analysis reflects the contractual terms of the deriva-tives, including the period to maturity, and uses observablemarket-based inputs.
The Company incorporates credit valuation adjustments to appropri-ately reflect both its own nonperformance risk and the respectivecounterparty’s nonperformance risk in the fair value measurements. Inadjusting the fair value of its derivative contracts for the effect of non-performance risk, the Company has considered the impact of nettingand any applicable credit enhancements. Although the Company hasdetermined that the majority of the inputs used to value its derivativesfall within Level 2 of the fair value hierarchy, the credit valuation adjust-ments associated with its derivatives utilize Level 3 inputs, such asestimates of current credit spreads, to evaluate the likelihood of defaultby itself and its counterparties. However, as of December 31, 2009, theCompany has assessed the significance of the effect of the credit val-uation adjustments on the overall valuation of its derivative positionsand has determined that the credit valuation adjustments are not sig-nificant to the overall valuation of its derivatives. As a result, theCompany has determined that its derivative valuations in their entiretyare classified in Level 2 of the fair value hierarchy.
FINANCIAL INSTRUMENTS | Carrying amounts reported on the balancesheet for cash and cash equivalents, tenant and other receivables,accrued expenses, other liabilities and the 2003 Credit Facility approx-imate fair value due to the short-term nature of these instruments. Themajority of the Company’s variable-rate debt is subject to interest rateswaps that have effectively fixed the interest rates on the underlyingdebt. The estimated fair value for fixed-rate debt, which is calculatedfor disclosure purposes, is based on the borrowing rates available tothe Company for fixed-rate mortgage loans and corporate notespayable with similar terms and maturities.
ASSET IMPAIRMENT | Real estate investments and related intangibleassets are reviewed for impairment whenever events or changes in cir-cumstances indicate that the carrying amount of the property might notbe recoverable. A property to be held and used is considered impairedonly if management’s estimate of the aggregate future cash flows, lessestimated capital expenditures, to be generated by the property, undis-counted and without interest charges, are less than the carrying valueof the property. This estimate takes into consideration factors such asexpected future operating income, trends and prospects, as well as theeffects of demand, competition and other factors. In addition, theseestimates may consider a probability weighted cash flow estimation

PENNSYLVANIA REAL ESTATE INVESTMENT TRUST 2009 ANNUAL REPORT 27
approach when alternative courses of action to recover the carryingamount of a long-lived asset are under consideration or when a rangeof possible values is estimated.
The determination of undiscounted cash flows requires significant esti-mates by management, including the expected course of action at thebalance sheet date that would lead to such cash flows. Subsequentchanges in estimated undiscounted cash flows arising from changes inthe anticipated action to be taken with respect to the property couldimpact the determination of whether an impairment exists and whetherthe effects could materially impact the Company’s net income. To theextent estimated undiscounted cash flows are less than the carryingvalue of the property, the loss will be measured as the excess of thecarrying amount of the property over the estimated fair value of theproperty.
Assessment of the recoverability by the Company of certain leaserelated costs must be made when the Company has a reason tobelieve that the tenant might not be able to perform under the terms ofthe lease as originally expected. This requires the Company to makeestimates as to the recoverability of such costs.
An other than temporary impairment of an investment in an unconsoli-dated joint venture is recognized when the carrying value of theinvestment is not considered recoverable based on evaluation of theseverity and duration of the decline in value. To the extent impairmenthas occurred, the excess carrying value of the asset over its estimatedfair value is charged to income.
GOODWILL | The Company conducts an annual review of its goodwillbalances for impairment to determine whether an adjustment to thecarrying value of goodwill is required. The Company has determinedthe fair value of its properties and the goodwill that is associated withcertain of its properties. Fair value is determined by applying a capital-ization rate to the Company’s estimate of projected income at thoseproperties. The Company also considers factors such as property salesperformance, market position and current and future operating results.
The Company’s intangible assets on the accompanying consolidatedbalance sheets at December 31, 2009 and 2008 included $7.2 million(net of $1.1 million of amortization expense recognized prior to January1, 2002) of goodwill recognized in connection with the acquisition ofThe Rubin Organization in 1997.
Changes in the carrying amount of goodwill for the three years endedDecember 31, 2009 were as follows:
Accumulated Impairment(in thousands of dollars) Basis Amortization Write-Offs TotalBalance,January 1, 2007 $ 12,877 $ (1,073) $ — $ 11,804Goodwill divested — — — —Balance,December 31, 2007 12,877 (1,073) — 11,804Impairment — — (4,648) (4,648)Balance,December 31, 2008 12,877 (1,073) (4,648) 7,156Goodwill divested — — — —Balance,December 31, 2009 $ 12,877 $ (1,073) $ (4,648) $ 7,156
REAL ESTATE | Land, buildings, fixtures and tenant improvements arerecorded at cost and stated at cost less accumulated depreciation.Expenditures for maintenance and repairs are charged to operations asincurred. Renovations or replacements, which improve or extend thelife of an asset, are capitalized and depreciated over their estimateduseful lives.
For financial reporting purposes, properties are depreciated using thestraight-line method over the estimated useful lives of the assets. Theestimated useful lives are as follows:
Buildings 30-50 yearsLand improvements 15 yearsFurniture/fixtures 3-10 yearsTenant improvements Lease term
The Company is required to make subjective assessments as to theuseful lives of its real estate assets for purposes of determining theamount of depreciation to reflect on an annual basis with respect tothose assets based on various factors, including industry standards,historical experience and the condition of the asset at the time ofacquisition. These assessments have a direct impact on theCompany’s net income. If the Company were to determine that a longerexpected useful life was appropriate for a particular asset, it would bedepreciated over more years, and, other things being equal, result inless annual depreciation expense and higher annual net income.
Gains from sales of real estate properties and interests in partnershipsgenerally are recognized using the full accrual method provided thatvarious criteria are met relating to the terms of sale and any subsequentinvolvement by the Company with the properties sold.
REAL ESTATE ACQUISITIONS | The Company accounts for its propertyacquisitions by allocating the purchase price of a property to the prop-erty’s assets based on management’s estimates of their fair value. Debtassumed in connection with property acquisitions is recorded at fairvalue at the acquisition date, and the resulting premium or discount isamortized through interest expense over the remaining term of thedebt, resulting in a non-cash decrease (in the case of a premium) orincrease (in the case of a discount) in interest expense. The determina-tion of the fair value of intangible assets requires significant estimatesby management and considers many factors, including the Company’sexpectations about the underlying property and the general marketconditions in which the property operates. The judgment and subjec-tivity inherent in such assumptions can have a significant impact on themagnitude of the intangible assets that the Company records.
INTANGIBLE ASSETS | The Company allocates a portion of the purchaseprice of a property to intangible assets. The Company’s methodology forthis allocation includes estimating an “as-if vacant” fair value of the physi-cal property, which is allocated to land, building and improvements. Thedifference between the purchase price and the “as-if vacant” fair value isallocated to intangible assets. There are three categories of intangibleassets to be considered: (i) value of in-place leases, (ii) above- and below-market value of in-place leases and (iii) customer relationship value.
The value of in-place leases is estimated based on the value associatedwith the costs avoided in originating leases comparable to the acquired in-place leases, as well as the value associated with lost rental revenue duringthe assumed lease-up period. The value of in-place leases is amortized asreal estate amortization over the remaining lease term.
28 NOTES TO CONSOLIDATED FINANCIAL STATEMENTS
Above-market and below-market in-place lease values for acquired prop-erties are recorded based on the present value of the difference between(i) the contractual amounts to be paid pursuant to the in-place leases and(ii) management’s estimates of fair market lease rates for the comparablein-place leases, based on factors such as historical experience, recentlyexecuted transactions and specific property issues, measured over aperiod equal to the remaining non-cancelable term of the lease. The valueof above-market lease values is amortized as a reduction of rental incomeover the remaining terms of the respective leases. The value of below-market lease values is amortized as an increase to rental income over theremaining terms of the respective leases, including any below-marketoptional renewal periods.
The Company allocates purchase price to customer relationship intangi-bles based on management’s assessment of the value of suchrelationships.
The following table presents the Company’s intangible assets and liabili-ties, net of accumulated amortization, as of December 31, 2009 and 2008:
As of December 31,
(in thousands of dollars) 2009 2008
Value of in-place lease intangibles $ 28,360 $ 55,745Above-market lease intangibles 3,462 5,395Subtotal 31,822 61,140Goodwill (see above) 7,156 7,156Total intangible assets $ 38,978 $ 68,296Below-market lease intangibles $ (5,942) $ (7,996)
Amortization of in-place lease intangibles was $27.4 million, $29.1million and $29.0 million for the years ended December 31, 2009, 2008and 2007, respectively.
Amortization of above-market and below-market lease intangiblesincreased revenue by $0.1 million in 2009 and decreased revenue by$0.6 million and $0.1 million in 2008 and 2007, respectively.
In the normal course of business, the Company’s intangible assets willamortize in the next five years and thereafter as follows:
(in thousands of dollars) In-Place Lease Above/(Below)For the Year Ended December 31, Intangibles Market Leases
2010 $ 22,042 $ 1422011 5,086 1972012 1,189 (29)2013 43 (249)2014 — (437)2015 and thereafter — (2,104)Total $ 28,360 $ (2,480)
ASSETS HELD FOR SALE AND DISCONTINUED OPERATIONS | The determi-nation to classify an asset as held for sale requires significant estimates bythe Company about the property and the expected market for the prop-erty, which are based on factors including recent sales of comparableproperties, recent expressions of interest in the property, financial metricsof the property and the condition of the property. The Company must alsodetermine if it will be possible under those market conditions to sell theproperty for an acceptable price within one year. When assets are identi-fied by management as held for sale, the Company discontinuesdepreciating the assets and estimates the sales price, net of selling costs,of such assets. The Company generally considers operating properties tobe held for sale when they meet the criteria which include factors such aswhether the sale transaction has been approved by the appropriate levelof management and there are no known material contingencies relating to
the sale such that the sale is probable and is expected to qualify for recog-nition as a completed sale within one year. If, in management’s opinion,the net sales price of the asset that has been identified as held for sale isless than the net book value of the asset, the asset is written down to fairvalue less the cost to sell. Assets and liabilities related to assetsclassified as held for sale are presented separately in the consolidatedbalance sheet.
Assuming no significant continuing involvement, a sold operating realestate property is considered a discontinued operation. In addition, oper-ating properties classified as held for sale are considered discontinuedoperations. Operating properties classified as discontinued operations arereclassified as such in the consolidated statement of operations for eachperiod presented. Interest expense that is specifically identifiable to theproperty is used in the computation of interest expense attributable to dis-continued operations. See note 2 for a description of the propertiesincluded in discontinued operations. Land parcels and other portions ofoperating properties, non-operating real estate and investments in part-nerships are excluded from discontinued operations treatment.
CAPITALIZATION OF COSTS | Costs incurred in relation to development andredevelopment projects for interest, property taxes and insurance arecapitalized only during periods in which activities necessary to preparethe property for its intended use are in progress. Costs incurred forsuch items after the property is substantially complete and ready for itsintended use are charged to expense as incurred. Capitalized costs, aswell as tenant inducement amounts and internal and external commis-sions, are recorded in construction in progress. The Companycapitalizes a portion of development department employees’ compen-sation and benefits related to time spent involved in development andredevelopment projects.
The Company capitalizes payments made to obtain options to acquirereal property. Other related costs that are incurred before acquisitionthat are expected to have ongoing value to the project are capitalizedif the acquisition of the property is probable. If the property is acquired,such costs are included in the amount recorded as the initial value ofthe asset. Capitalized pre-acquisition costs are charged to expensewhen it is probable that the property will not be acquired. TheCompany recorded abandoned project costs of $0.8 million, $1.3million and $1.5 million for the years ended December 31, 2009, 2008and 2007, respectively.
The Company capitalizes salaries, commissions and benefits related totime spent by leasing and legal department personnel involved in orig-inating leases with third-party tenants.
The following table summarizes the Company’s capitalized salaries andbenefits, real estate taxes and interest for the years ended December31, 2009, 2008 and 2007:
For the Year Ended December 31,
(in thousands of dollars) 2009 2008 2007
Development/Redevelopment:Salaries and benefits $ 2,123 $ 3,276 $ 2,349Real estate taxes $ 951 $ 2,380 $ 2,236Interest $ 5,613 $ 15,968 $ 16,259
Leasing:Salaries, commissions and
benefits $ 4,341 $ 5,314 $ 4,830

PENNSYLVANIA REAL ESTATE INVESTMENT TRUST 2009 ANNUAL REPORT 29
TENANT RECEIVABLES | The Company makes estimates of the collectibil-ity of its tenant receivables related to tenant rent including base rent,straight-line rent, expense reimbursements and other revenue orincome. The Company specifically analyzes accounts receivable,including straight-line rent receivable, historical bad debts, customercreditworthiness and current economic and industry trends when eval-uating the adequacy of the allowance for doubtful accounts. Thereceivables analysis places particular emphasis on past-due accountsand considers the nature and age of the receivables, the paymenthistory and financial condition of the payor, the basis for any disputesor negotiations with the payor, and other information that could affectcollectibility. In addition, with respect to tenants in bankruptcy, theCompany makes estimates of the expected recovery of pre-petitionand post-petition claims in assessing the estimated collectibility of therelated receivable. In some cases, the time required to reach an ulti-mate resolution of these claims can exceed one year. These estimateshave a direct effect on the Company’s net income because higher baddebt expense results in less net income, other things being equal. Forstraight-line rent, the collectibility analysis considers the probability ofcollection of the unbilled deferred rent receivable given the Company’sexperience regarding such amounts.
BOSCOV’S INC. NOTE RECEIVABLE | The Company has a note receiv-able from a subsidiary of Boscov’s, Inc. with an outstanding principalbalance of $10.0 million as of December 31, 2009 and 2008. The notewas originated in December 2008. The note bears interest at the rateof 18.0% per annum, of which 10.0% is payable monthly, and 8.0% isdeferred and either paid annually in January of each year that the noteis outstanding or added to the principal balance. The note matures inDecember 2013 at which time all principal and deferred interest ispayable. The note may be prepaid in whole or in part at any timewithout premium or penalty. Interest payments under the note werecurrent as of December 31, 2009. Boscov’s, Inc. owns 39 Boscov’sdepartment stores, eight of which are located at properties owned bythe Company, and one of which is located at a property owned by apartnership in which the Company owns a 50% interest. Boscov’s, Inc.filed for bankruptcy protection in August 2008, and exited from bank-ruptcy in September 2009.
INCOME TAXES | The Company has elected to qualify as a real estateinvestment trust under Sections 856-860 of the Internal Revenue Codeof 1986, as amended, and intends to remain so qualified.
Earnings and profits, which determine the taxability of distributions toshareholders, will differ from net income (loss) reported for financialreporting purposes due to differences in cost basis, differences in theestimated useful lives used to compute depreciation and differencesbetween the allocation of the Company’s net income and loss for finan-cial reporting purposes and for tax reporting purposes.
The Company is subject to a federal excise tax computed on a calen-dar year basis. The excise tax equals 4% of the excess, if any, of 85%of the Company’s ordinary income plus 95% of the Company’s capitalgain net income for the year plus 100% of any prior year shortfall overcash distributions during the year, as defined by the Internal RevenueCode. The Company has, in the past, distributed a substantial portionof its taxable income in the subsequent fiscal year and might also followthis policy in the future.
No provision for excise tax was made for the years ended December31, 2009, 2008, and 2007, as no excise tax was due in those years.
The per share distributions paid to shareholders had the following com-ponents for the years ended December 31, 2009, 2008, and 2007:
For the Year Ended December 31,
2009 2008 2007
Ordinary income $ 0.63 $ 2.25 $ 2.11Capital gains 0.11 — —Return of capital — 0.03 0.17
$ 0.74 $ 2.28 $ 2.28
The Company follows accounting requirements that prescribe a recog-nition threshold and measurement attribute for the financial statementrecognition and measurement of a tax position taken in a tax return.The Company must determine whether it is “more likely than not” thata tax position will be sustained upon examination, including resolutionof any related appeals or litigation processes, based on the technicalmerits of the position. Once it is determined that a position meets themore likely than not recognition threshold, the position is measured atthe largest amount of benefit that is greater than 50% likely of beingrealized upon settlement to determine the amount of benefit to recog-nize in the financial statements.
PRI is subject to federal, state and local income taxes. The Companyhad no provision or benefit for federal or state income taxes in theyears ended December 31, 2009, 2008 and 2007. The Company hadnet deferred tax assets of $5.1 million and $5.3 million for the yearsended December 31, 2009 and 2008, respectively. The deferred taxassets are primarily the result of net operating losses. A valuationallowance has been established for the full amount of the deferred taxassets, since it is more likely than not that these will not be realized.
The Company recorded expense of $0.1 million, $0.2 million and $0.2million related to Philadelphia net profits tax for each of the years endedDecember 31, 2009, 2008 and 2007, respectively.
The aggregate cost basis and depreciated basis for federal income taxpurposes of the Company’s investment in real estate was approxi-mately $3,921.7 million and $3,091.2 million, respectively, at December31, 2009, and $3,864.4 million and $3,108.1 million, respectively, atDecember 31, 2008.
DERIVATIVES | In the normal course of business, the Company isexposed to financial market risks, including interest rate risk on itsinterest-bearing liabilities. The Company endeavors to limit these risksby following established risk management policies, procedures andstrategies, including the use of derivative financial instruments. TheCompany does not use derivative financial instruments for trading orspeculative purposes.
Derivative financial instruments are recorded on the balance sheet asassets or liabilities based on the instruments’ fair value. Changes in thefair value of derivative financial instruments are recognized currently inearnings, unless the derivative financial instrument meets the criteria forhedge accounting. If the derivative financial instruments meet the crite-ria for a cash flow hedge, the gains and losses in the fair value of theinstrument are deferred in other comprehensive income. Gains andlosses on a cash flow hedge are reclassified into earnings when theforecasted transaction affects earnings. A contract that is designatedas a hedge of an anticipated transaction that is no longer likely to occuris immediately recognized in earnings.
The anticipated transaction to be hedged must expose the Companyto interest rate risk, and the hedging instrument must reduce the expo-sure and meet the requirements for hedge accounting. The Company

30 NOTES TO CONSOLIDATED FINANCIAL STATEMENTS
must formally designate the instrument as a hedge and document andassess the effectiveness of the hedge at inception and on a quarterlybasis. Interest rate hedges that are designated as cash flow hedgeshedge future cash outflows on debt.
OPERATING PARTNERSHIP UNIT REDEMPTIONS | Shares issued uponredemption of OP Units are recorded at the book value of the OP Unitssurrendered.
SHARE-BASED COMPENSATION EXPENSE | The Company follows theexpense recognition provisions of required accounting provisions,which require all share based payments to employees, including grantsof employee stock options and restricted shares, to be valued at fairvalue on the date of grant, and to be expensed over the applicablevesting period.
EARNINGS PER SHARE | The difference between basic weighted averageshares outstanding and diluted weighted average shares outstanding isthe dilutive impact of common stock equivalents. Common stockequivalents consist primarily of shares to be issued under employeeshare compensation programs and outstanding share options whoseexercise price was less than the average market price of theCompany’s share during these periods.
RECENT ACCOUNTING PRONOUNCEMENTS | ACCOUNTING FOR
CONVERTIBLE DEBT | Effective January 1, 2009, the Company adoptednew accounting requirements that clarify the accounting treatment forconvertible debt instruments that may be settled in cash upon eithermandatory or optional conversion (including partial cash settlement). TheCompany’s Exchangeable Notes are within the scope of these newaccounting requirements. The Company was required to retrospectivelyapply these new accounting requirements to prior periods, and recordedthe impact of its adoption of these new accounting requirements as ofthe issuance date of the Exchangeable Notes (May 2007). Pursuant tothese new accounting requirements, the value assigned to the debtcomponent is the estimated fair value of a similar bond without the con-version feature, which would result in the debt being recorded at adiscount. The Company determined that the fair value of the conversionfeature at the date of the issuance was $19.3 million, which wasrecorded as an increase to capital contributed in excess of par and adecrease to Exchangeable Notes in the accompanying consolidatedbalance sheets at inception. The amount that was recorded for the con-version feature is not amortized. The debt discount is amortized asadditional non-cash interest expense over the period during which thedebt is expected to be outstanding. The unamortized discount on theExchangeable Notes was $4.7 million and $11.4 million as of December31, 2009 and December 31, 2008, respectively, following repurchases ofsome outstanding Exchangeable Notes by the Company in 2009 and2008. The implementation of this new accounting requirement resultedin an increase to interest expense and net loss of $3.5 million and $2.1million from amounts previously reported for the years ended December31, 2008 and December 31, 2007, respectively.
BUSINESS COMBINATIONS | Effective January 1, 2009, the Companyprospectively adopted new accounting requirements relating to busi-ness combinations. These new accounting requirements apply to alltransactions or other events in which an entity obtains control of one ormore businesses, including those combinations achieved without thetransfer of consideration. These new accounting requirements expandthe scope of the acquisition method of accounting to include all busi-ness combinations and require an acquirer to recognize the assetsacquired, the liabilities assumed, and any noncontrolling interests in the
acquiree at their fair values as of the acquisition date. Additionally,these new accounting requirements change the way entities accountfor business combinations achieved in stages by requiring the identifi-able assets and liabilities to be measured at fair value at the acquisitiondate. These new accounting requirements require entities to directlyexpense transaction costs. The adoption of these new accountingrequirements did not have a material effect on the Company’s consoli-dated financial statements.
CLASSIFICATION AND MEASUREMENT OF REDEEMABLE SECURITIES |Effective January 1, 2009, the Company adopted new accountingrequirements related to the classification and measurement ofredeemable securities. The ownership interests in a subsidiary that areheld by owners other than the parent are noncontrolling interests(which were previously reported on the consolidated balance sheet as“Minority interest”). Under these new accounting requirements, non-controlling interest represents the portion of equity in a subsidiary notattributable, directly or indirectly, to a parent. Under these newaccounting requirements, such noncontrolling interests are reported onthe consolidated balance sheets within equity, separately from theCompany’s equity. Consolidated statements of equity are included forboth quarterly and annual financial statements, including beginning bal-ances, activity for the period and ending balances. On the consolidatedstatements of operations, revenue, expenses and net loss are reportedat the consolidated amounts including both the amounts attributable tothe Company and to noncontrolling interests. However, in accordancewith these new accounting requirements, securities (including thoseconsidered to be noncontrolling interests) that are redeemable for cashor other assets at the option of the holder, not solely within the controlof the issuer, must be classified outside of permanent equity. TheCompany makes this determination based on terms in applicableagreements, specifically in relation to redemption provisions.Additionally, with respect to noncontrolling interests for which theCompany has a choice to settle the contract by delivery in its ownshares, the Company considered the guidance relating to the account-ing for derivative financial instruments indexed to, and potentiallysettled in, a company’s own stock, to evaluate whether such provisionsare solely within the Company’s control. The Company has concludedthat for its noncontrolling interests that allow for redemption in eithercash or Company shares, all such provisions are solely within itscontrol. As a result of its evaluation, the Company has determined thatall of its noncontrolling interests qualify as permanent equity, and there-fore are not subject to the classification and measurement provisions ofthese new accounting requirements.
Also as a result of the adoption of these new accounting requirements,the statement of operations captions entitled “Income (loss) beforeminority interest,” “Minority interest” and “Net income (loss)” are nowentitled “Net income (loss),” “Net income (loss) attributable to noncon-trolling interest” and “Net income (loss) attributable to PREIT,”respectively.
As of December 31, 2009, the Company has a 99.8% interest in BalaCynwyd Associates, L.P. (“BCA”) and an option to purchase theremaining interests, as described in note 3. BCA owns an office build-ing. The Company has consolidated the assets, liabilities and results ofoperations of BCA in the Company’s consolidated financial statements.The interest that was not owned by the Company is reflected in non-controlling interest on the accompanying consolidated balance sheetsof $15,000 and $3.8 million as of December 31, 2009 and December31, 2008, respectively.
PENNSYLVANIA REAL ESTATE INVESTMENT TRUST 2009 ANNUAL REPORT 31
DISCLOSURES ABOUT DERIVATIVE INSTRUMENTS AND HEDGING
ACTIVITIES | Effective January 1, 2009, the Company adopted newaccounting requirements relating to disclosures about derivative instru-ments and hedging activities, which require enhanced disclosuresabout an entity’s derivative and hedging activities and thereby improvethe transparency of financial reporting (see note 5 for the Company’sdisclosure relating to its derivative activities).
ACCOUNTING FOR TRANSFERS OF FINANCIAL ASSETS | On January 1,2010, the Company adopted new accounting requirements relating toaccounting for transfers of financial assets. The recognition and meas-urement provisions of these new accounting requirements are appliedto transfers that occur on or after the effective date. The disclosure pro-visions of these new accounting requirements are applied to transfersthat occurred both before and after the effective date of the newaccounting requirements. The adoption of these new accountingrequirements did not have a material effect on the Company’s consoli-dated financial statements.
VARIABLE INTEREST ENTITIES | On January 1, 2010, the Companyadopted new accounting requirements relating to variable interest enti-ties. These new accounting requirements amend the existingaccounting guidance as follows: a) to require an enterprise to performan analysis to determine whether the enterprise’s variable interest orinterests give it a controlling financial interest in a variable interest entity,identifying the primary beneficiary of a variable interest entity; b) torequire ongoing reassessment of whether an enterprise is the primarybeneficiary of a variable interest entity, rather than only when specificevents occur; c) to eliminate the quantitative approach previouslyrequired for determining the primary beneficiary of a variable interest; d)to amend certain guidance for determining whether an entity is a vari-able interest entity; e) to add an additional reconsideration event whenchanges in facts and circumstances pertinent to a variable interestentity occur; f) to eliminate the exception for troubled debt restructur-ing regarding variable interest entity reconsideration; and g) to requireadvanced disclosures that will provide users of financial statementswith more transparent information about an enterprise’s involvement ina variable interest entity. The adoption of these new accounting require-ments did not have a material effect on the Company’s consolidatedfinancial statements.
FASB ACCOUNTING STANDARDS CODIFICATION | Effective September30, 2009, the Company adopted the Financial Accounting StandardsBoard Accounting Standards Codification (“ASC”). The ASC is the solesource of authoritative United States GAAP for interim and annualperiods ending after September 15, 2009, except for rules and inter-pretive releases of the SEC, which are sources of authoritative GAAPfor SEC registrants. The adoption of the ASC did not have a significanteffect on the Company’s consolidated financial statements.
2. Real Estate Activities
Investments in real estate as of December 31, 2009 and 2008 werecomprised of the following:
As of December 31,
(in thousands of dollars) 2009 2008
Buildings, improvements andconstruction in progress $ 3,129,354 $ 3,140,371
Land, including land held fordevelopment 554,959 567,677
Total investments in real estate 3,684,313 3,708,048Accumulated depreciation (623,309) (516,832)Net investments in real estate $ 3,061,004 $ 3,191,216
IMPAIRMENT OF ASSETS AND ABANDONED PROJECT COSTS | During theyears ended December 31, 2009 and December 31, 2008, theCompany recorded asset impairment charges and abandoned projectcosts totaling $75.0 million and $28.9 million, respectively, which areincluded in “Impairment of assets and abandoned project costs” in theconsolidated statement of operations. Details about the assets thatwere written down are as follows:
As of December 31,
(in thousands of dollars) 2009 2008 2007
Orlando Fashion Square $ 62,700 $ — $ —Springhills 11,484 — —Monroe Marketplace 70 — —White Clay Point — 11,799 —Sunrise Plaza — 7,027 —Goodwill — 4,648 —Valley View Downs — 3,032 —Predevelopment costs — 936 —Land held for development — 150 —Abandoned project costs 758 1,297 1,531Total $ 75,012 $ 28,889 $ 1,531
2009 IMPAIRMENTS | During 2009, Orlando Fashion Square experiencedsignificant decreases in non-anchor occupancy and net operatingincome as a result of unfavorable economic conditions in the Orlandomarket combined with negative trends in the retail sector. The occu-pancy declines resulted from store closings from bankrupt andunderperforming tenants. Net operating income at this property wasalso impacted by an increase in the number of tenants paying a per-centage of their sales in lieu of minimum rent combined with decliningtenant sales. As a result of these conditions, in connection with thepreparation of the Company’s 2010 business plan and budgets, man-agement determined that its estimate of future cash flows, net ofestimated capital expenditures, to be generated by the property wereless than the carrying value of the property. As a result, the Companydetermined that the property was impaired and a write down of$62.7 million to the property’s estimated fair value of $40.2 millionwas necessary.
Springhills is a mixed use ground-up development project located inGainesville, Florida. During the fourth quarter of 2009, in connectionwith the Company’s 2010 business planning process, which included astrategic review of its future development projects, management deter-mined that the development plans for Springhills were uncertain.Consequently, the Company recorded an impairment loss of $11.5million, to write down the carrying amount of the project to the esti-mated fair value of $22.0 million.
In May 2009, the Company sold an outparcel and related land improve-ments containing an operating restaurant at Monroe Marketplace inSelinsgrove, Pennsylvania for $0.9 million. The Company recorded anasset impairment charge of $0.1 million immediately prior to this trans-action because the sales price of the parcel was less than the carryingvalue of the parcel.
2008 IMPAIRMENTS | White Clay Point is a mixed use ground-up devel-opment project located in Landenberg, Pennsylvania. During the fourthquarter of 2008, in connection with the Company’s 2009 businessplanning process, which included a strategic review of its future devel-opment projects, management determined that the development plansfor White Clay Point were uncertain. Consequently, the Company
32 NOTES TO CONSOLIDATED FINANCIAL STATEMENTS
recorded an impairment loss of $11.8 million, which represents theaggregate of the costs excluding the purchase price of the land thathad been capitalized to date for this development.
Sunrise Plaza is an operating power center located in Forked River,New Jersey. During the fourth quarter 2008, in connection with theCompany’s 2009 business planning process, which included a strate-gic review of its future development projects, management determinedthat Sunrise Plaza’s carrying value exceeded its fair value.Consequently, the Company recorded an impairment loss of $7.0million, which represents the excess of the carrying value of theproject’s assets over their fair value determined by their future dis-counted cash flows.
In September 2008, the Company entered into an AmendmentAgreement with Valley View Downs, LP (“Valley View”) and CentaurPennsylvania, LLC (“Centaur”) with respect to the development of aproposed harness racetrack and casino in western Pennsylvania (the“Project”) to be owned and operated by Valley View. The AmendmentAgreement amends the terms of the Binding Memorandum ofUnderstanding dated October 7, 2004, as amended by AmendmentNo. 1 to the Binding Memorandum of Understanding dated October 1,2007, among the Company, Valley View and Centaur (the “MOU”).
Pursuant to the Amendment Agreement, the Company will permitCentaur and Valley View to suspend any payments to the Companyotherwise required by the MOU and the related development agree-ment until September 30, 2010. If there is a sale or other disposition byValley View and Centaur of all or substantially all of their economicinterest in the project on or prior to September 30, 2010, the Companyand Valley View have agreed (i) that the Company will accept a cashpayment of $13.0 million to the Company in satisfaction of the obliga-tions of Valley View to the Company under the MOU and developmentagreement, and (ii) upon such payment, the MOU and the developmentagreement will be terminated. If a disposition and payment do notoccur on or prior to September 30, 2010, the obligations of Centaurand Valley View to make the payments to the Company required by theMOU and development agreement will be reinstated. In the fourthquarter of 2008, the Company recorded a $3.0 million impairmentcharge against the amounts the Company has spent in connection withthe MOU and the fees the Company has earned under the develop-ment agreement. The decision was made following a downgrade inCentaur’s credit rating by major rating agencies, which caused theCompany to conclude that there is significant uncertainty that it willrecover the carrying amounts of the accounts receivable and the origi-nal investment associated with this project.
Valley View has obtained a harness racing license for the proposedracetrack and has applied for a license to operate a casino, but hasadvised the Company of the prospect of the sale or other dispositionof its economic interest in the Project.
During the fourth quarter of 2008, the Company determined that therewas significant uncertainty about the likelihood that it would continue inits plans to acquire a site in West Chester, Pennsylvania for a futuremixed use project. The Company recorded an impairment charge of$0.9 million related to this project, representing the costs incurredrelated to this project to date.
During the fourth quarter of 2008, the Company determined that thecarrying value of an undeveloped land parcel adjacent to its ViewmontMall exceeded its fair value based on the Company’s estimate of dis-
counted cash flows associated with this parcel. Consequently, theCompany recorded an impairment loss of $0.2 million.
2009 DISPOSITIONS | In May 2009, the Company sold an outparcel andrelated land improvements containing an operating restaurant atMonroe Marketplace in Selinsgrove, Pennsylvania for $0.9 million. TheCompany recorded an asset impairment charge of $0.1 million immedi-ately prior to this transaction. No gain or loss was recorded fromthis sale.
In June 2009, the Company sold a land parcel adjacent to WoodlandMall in Grand Rapids, Michigan for $2.7 million. The parcel contained adepartment store that was subject to a ground lease. The Companyrecorded a gain of $0.2 million from this sale.
In June 2009, the Company sold two outparcels and related improve-ments adjacent to North Hanover Mall in Hanover, Pennsylvania for $2.0million. The Company recorded a gain of $1.4 million from this sale.
In August 2009, the Company sold Crest Plaza in Allentown,Pennsylvania for $15.8 million. The Company recorded a gain of $3.4million from this sale.
In October 2009, the Company sold two outparcels and relatedimprovements adjacent to Monroe Marketplace in Selinsgrove,Pennsylvania for $2.8 million. No gain or loss was recorded fromthis sale.
In October 2009, the Company sold a parcel and related land improve-ments at Pitney Road Plaza in Lancaster, Pennsylvania for $10.2 million.The parcel contained a home improvement store that was subject to aground lease. The Company recorded a gain of $2.7 million fromthis sale.
In October 2009, the Company sold a controlling interest in NortheastTower Center in Philadelphia, Pennsylvania for $30.4 million. TheCompany recorded a gain of $6.1 million from this sale. In connectionwith the sale, the Company repaid the mortgage loan associated withthe Northeast Tower Center, with a balance of $20.0 million at closing.
2007 DISPOSITIONS | In March 2007, the Company sold Schuylkill Mallin Frackville, Pennsylvania for $17.6 million. The Company recorded again of $6.7 million from this sale. In connection with the sale, theCompany repaid the mortgage loan associated with Schuylkill Mall,with a balance of $16.5 million at closing.
In May 2007, the Company sold an outparcel and related land improve-ments containing an operating restaurant at New River Valley Mall inChristiansburg, Virginia for $1.6 million. The Company recorded a $0.6million gain from this sale.
In May 2007, the Company sold an outparcel and related land improve-ments at Plaza at Magnolia in Florence, South Carolina for $11.3million. The Company recorded a $1.5 million gain from this sale.
In August 2007, the Company sold undeveloped land adjacent toWiregrass Commons in Dothan, Alabama for $2.1 million. TheCompany recorded a $0.3 million gain from this sale.
In December 2007, the Company sold undeveloped land in MonroeTownship, Pennsylvania for $0.8 million. There was no gain or lossrecorded from this sale.

PENNSYLVANIA REAL ESTATE INVESTMENT TRUST 2009 ANNUAL REPORT 33
DISCONTINUED OPERATIONS | The Company has presented as discontin-ued operations the operating results of Crest Plaza, Northeast TowerCenter, Schuylkill Mall, South Blanding Village and Festival at Exton.
The following table summarizes revenue and expense information forthe Company’s discontinued operations:
For the year ended December 31,
(in thousands of dollars) 2009 2008 2007
Real estate revenue $ 4,665 $ 6,086 $ 7,055Expenses:
Operating expenses (1,182) (1,431) (2,260)Depreciation and amortization (1,176) (1,571) (1,768)Interest expense (104) (535) (954)
Total expenses (2,462) (3,537) (4,982)Operating results from discontinued
operations 2,203 2,549 2,073Gains on sales of discontinued
operations 9,503 — 6,699Income from discontinued
operations $ 11,706 $ 2,549 $ 8,772
2009 AND 2008 ACQUISITIONS | In January 2008, the Company enteredinto an agreement under which it acquired a 0.1% general partnershipinterest and a 49.8% limited partnership interest in Bala CynwydAssociates, L.P. (“BCA”), and an option to purchase the remainingpartnership interests in BCA in two closings in the second quarter of2009 and the second quarter of 2010. BCA is the owner of One CherryHill Plaza, an office building located within the boundaries of theCompany’s Cherry Hill Mall in Cherry Hill, New Jersey. The Companyacquired its interests in BCA for $3.9 million in cash paid at the firstclosing in February 2008. See note 11 for further discussion. TheCompany has consolidated BCA for financial reporting purposes.In June 2009, the Company acquired an additional 49.9%ownership interest.
In July 2008, the Company acquired a parcel in Lancaster,Pennsylvania for $8.0 million plus customary closing costs. This prop-erty was developed by the Company and is currently operating asPitney Road Plaza.
In July 2008, the Company acquired land previously subject to groundlease at Wiregrass Commons in Dothan, Alabama for $3.2 million.
2007 ACQUISITIONS | In August 2007, the Company purchased a 116acre land parcel in Monroe Township, Pennsylvania for $5.5 million. TheCompany had previously acquired an aggregate of approximately 10acres on adjacent parcels. This property was developed by theCompany and is currently operating as Monroe Marketplace.
In August 2007, the Company purchased Plymouth Commons, anoffice building adjacent to Plymouth Meeting Mall, for $9.2 million.
DEVELOPMENT ACTIVITIES | As of December 31, 2009 and 2008, theCompany had capitalized $228.3 million and $421.2 million, respec-tively, related to construction and development activities. Of thebalance at December 31, 2009, $2.1 million is included in “Deferredcosts and other assets” in the accompanying consolidated balancesheets, $215.2 million is included in “Construction in progress,” $1.7million is included in “Investments in partnerships, at equity,” and $9.3million is included in “Land held for development.” The Company had$0.4 million of deposits on land purchase contracts at December 31,2009, of which $0.1 million was nonrefundable.
3. Investments in Partnerships
The following table presents summarized financial information of theequity investments in the Company’s unconsolidated partnerships as ofDecember 31, 2009 and 2008:
As of December 31,
(in thousands of dollars) 2009 2008
Assets:Investments in real estate, at cost:Retail properties $ 393,197 $ 390,341Construction in progress 3,602 4,402
Total investments in real estate 396,799 394,743Accumulated depreciation (116,313) (102,804)Net investments in real estate 280,486 291,939Cash and cash equivalents 5,856 5,887Deferred costs and other assets, net 21,254 22,848
Total assets 307,596 320,674Liabilities and Partners’ Equity (deficit):Mortgage loans 365,565 370,206Other liabilities 13,858 18,308
Total liabilities 379,423 388,514Net deficit (71,827) (67,840)Partners’ share (37,382) (33,659)Company’s share (34,445) (34,181)Excess investment(1) 13,733 16,143Advances 4,635 5,414Net investments and advances $ (16,077) $ (12,624)Investment in partnerships, at equity $ 32,694 $ 36,164Distributions in excess of
partnership investments (48,771) (48,788)Net investments and advances $ (16,077) $ (12,624)
(1) Excess investment represents the unamortized difference between theCompany’s investment and the Company’s share of the equity in the under-lying net investment in the partnerships. The excess investment is amortizedover the life of the properties, and the amortization is included in “Equity inincome of partnerships.”
The Company records distributions from its equity investments up to anamount equal to the equity in income of partnerships as cash fromoperating activities. Amounts in excess of the Company’s share of theincome in the equity investments are treated as a return of partnershipcapital and recorded as cash from investing activities.
Mortgage loans, which are secured by eight of the partnership proper-ties (including one property under development), are due in installmentsover various terms extending to the year 2018, with interest ratesranging from 0.88% to 8.02% and a weighted-average interest rate of3.41% at December 31, 2009. The liability under each mortgage loanis limited to the partnership that owns the particular property. TheCompany’s proportionate share, based on its respective partnershipinterest, of principal payments due in the next five years and thereafteris as follows:
Company’s Proportionate Share(in thousands of dollars)For the Year Ended Principal Balloon PropertyDecember 31, Amortization Payments Total Total
2010 $ 1,750 $ 112,562 $ 114,312 $ 228,6872011 1,260 56,745 58,005 116,0732012 246 3,708 3,954 9,7952013 195 — 195 3912014 209 — 209 4192015 and thereafter 953 4,148 5,101 10,200
$ 4,613 $177,163 $181,776 $365,565

34 NOTES TO CONSOLIDATED FINANCIAL STATEMENTS
The following table summarizes the Company’s share of equity inincome of partnerships for the years ended December 31, 2009, 2008and 2007:
For the Year Ended December 31,
(in thousands of dollars) 2009 2008 2007
Real estate revenue $ 74,693 $ 75,168 $ 70,116Expenses:
Operating expenses (24,737) (23,112) (22,095)Interest expense (13,851) (21,226) (24,472)Depreciation and amortization (15,489) (16,458) (13,763)
Total expenses (54,077) (60,796) (60,330)Net income 20,616 14,372 9,786Less: Partners’ share (10,206) (7,154) (4,893)Company’s share 10,410 7,218 4,893Amortization of excess investment (308) (165) (256)Equity in income of partnerships $ 10,102 $ 7,053 $ 4,637
FINANCING ACTIVITY | In October 2008, the unconsolidated partnershipthat owns Whitehall Mall in Allentown, Pennsylvania entered into a new$12.4 million, 10-year mortgage loan with a fixed interest rate of 7.00%to replace the prior mortgage loan on the property. The Company’sinterest in the unconsolidated partnership is 50%.
In July 2006, Lehigh Valley Associates entered into a $150.0 millionmortgage loan that is secured by Lehigh Valley Mall. The Companyowns an indirect 50% partnership interest in this entity. The mortgageloan had an initial term of 12 months, during which monthly paymentsof interest only were required. The loan bears interest at the one monthLIBOR rate, reset monthly, plus a spread of 0.56%. There were threeseparate one-year extension options. In August 2007, June 2008 andJuly 2009, the partnership that owns the mall exercised the first,second and third one-year extension options, respectively.
In October 2009, Red Rose Commons Associates, LP entered into a$23.9 million mortgage loan that is secured by Red Rose Commons inLancaster, Pennsylvania. The Company owns an indirect 50% partner-ship interest in this entity. The mortgage loan has an initial term of twoyears, during which monthly payments of interest only are required. Theloan bears interest at a variable rate of LIBOR plus 4.00%, with a floorof 6.00% per annum. The proceeds from the mortgage loan were usedto repay the previous mortgage loan that was secured by Red RoseCommons, of which the Company’s share was $12.3 million.
In November 2005, the unconsolidated partnership that ownsSpringfield Mall in Springfield, Pennsylvania entered into a $76.5 millionmortgage loan that is secured by Springfield Mall. The Company ownsan indirect 50% ownership interest in this entity. The mortgage loanhad an initial term of two years, during which interest only paymentswere required. The mortgage loan bears interest at an annual rate equalto, at the election of the Company, LIBOR plus 1.10% or at a base rateequal to the prime rate, or if greater, the federal funds rate plus 0.50%.There were three separate one-year extension options, provided thatthere is no event of default and provided that certain other conditionsare met, as required under the loan agreement. In November 2007, thepartnership that owns the mall exercised the first extension option, inNovember 2008, the partnership exercised the second extensionoption and made a principal payment of $4.2 million, and in December2009, the partnership exercised the third extension option.
4. Financing Activity
AMENDED, RESTATED AND CONSOLIDATED SENIOR SECURED CREDIT
AGREEMENT | On March 11, 2010, PREIT Associates and PRI (collec-tively, the “Borrower”), together with PR Gallery I Limited Partnership(“GLP”) and Keystone Philadelphia Properties, L.P. (“KPP”), two othersubsidiaries of the Company, entered into an Amended, Restated andConsolidated Senior Secured Credit Agreement comprised of 1) anaggregate $520.0 million term loan made up of a $436.0 million termloan (“Term Loan A”) to PALP and PRI and a separate $84.0 millionterm loan (“Term Loan B”) to the other two subsidiaries (collectively, the“2010 Term Loan”) and 2) a $150.0 million revolving line of credit (the“Revolving Facility,” and, together with the 2010 Term Loan, the “2010Credit Facility”) with Wells Fargo Bank, National Association, and theother financial institutions signatory thereto.
The 2010 Credit Facility replaces the previously existing $500.0 millionunsecured revolving credit facility, as amended (the “2003 CreditFacility”), and a $170.0 million unsecured term loan (the “2008 TermLoan”) that had been scheduled to mature on March 20, 2010. All cap-italized terms used and not otherwise defined in the description of the2010 Credit Facility have the meanings ascribed to such terms in the2010 Credit Facility.
The initial term of the 2010 Credit Facility is three years, and theBorrower has the right to one 12-month extension of the initial maturitydate, subject to certain conditions and to the payment of an extensionfee of 0.50% of the then outstanding Commitments.
The Company used the initial proceeds from the 2010 Credit Facilityto repay outstanding balances under the 2003 Credit Facility and 2008Term Loan. At closing, the $520.0 million 2010 Term Loan wasfully outstanding and $70.0 million was outstanding under theRevolving Facility.
Amounts borrowed under the 2010 Credit Facility bear interest at a ratebetween 4.00% and 4.90% per annum, depending on the Company’sleverage, in excess of LIBOR, with no floor. The initial rate in effect was4.90% per annum in excess of LIBOR. In determining the Company’sleverage (the ratio of Total Liabilities to Gross Asset Value), the capital-ization rate used to calculate Gross Asset Value is 8.00%. The unusedportion of the Revolving Facility is subject to a fee of 0.40% per annum.
The obligations under Term Loan A are secured by first priority mort-gages on 20 of the Company’s properties and a second lien on oneproperty, and the obligations under Term Loan B are secured by firstpriority leasehold mortgages on the properties ground leased by GLPand KPP (the “Gallery Properties”). The foregoing properties constitutesubstantially all of our previously unencumbered retail properties.
PREIT and certain of its subsidiaries that are not otherwise preventedfrom doing so serve as guarantors for funds borrowed under the 2010Credit Facility.
The aggregate amount of the lender Revolving Commitments and 2010Term Loan under the 2010 Credit Facility is required to be reduced by$33.0 million by March 11, 2011, by a cumulative total of $66.0 millionby March 11, 2012 and by a cumulative total of $100.0 million byMarch 11, 2013 (if the Company exercises its right to extend theTermination Date), including all payments (except payments pertainingto the Release Price of a Collateral Property) resulting in permanentreduction of the aggregate amount of the Revolving Commitments and2010 Term Loan.
The 2010 Credit Facility contains provisions regarding the applicationof proceeds from a Capital Event. A Capital Event is any event by whichthe Borrower raises additional capital, whether through an asset sale,

PENNSYLVANIA REAL ESTATE INVESTMENT TRUST 2009 ANNUAL REPORT 35
joint venture, additional secured or unsecured debt, issuance of equity,or from excess proceeds after payment of a Release Price. CapitalEvents do not include Refinance Events or other specified events. Afterpayment of interest and required distributions, the Remaining CapitalEvent Proceeds will generally be applied in the following order:
If the Facility Debt Yield is less than 11.00% or the Corporate DebtYield is less than 10.00%, Remaining Capital Event Proceeds will beallocated 25% to pay down the Revolving Facility (repayments of theRevolving Facility generally may be reborrowed) and 75% to pay downand permanently reduce Term Loan A (or Term Loan B if Term Loan Ais repaid in full) or, if the Revolving Facility balance is or would become$0 as a result of such payment, to pay down the Revolving Facility infull and to use any remainder of that 25% to pay down and perma-nently reduce Term Loan A (or Term Loan B if Term Loan A is repaid infull). So long as the Facility Debt Yield is greater than or equal to11.00% and the Corporate Debt Yield is greater than or equal to10.00% and each will remain so immediately after the Capital Event,and so long as either the Facility Debt Yield is less than 12.00% or theCorporate Debt Yield is less than 10.25% and will remain so immedi-ately after the Capital Event, the Remaining Capital Event Proceeds willbe allocated 75% to pay down the Revolving Facility and 25% to paydown and permanently reduce Term Loan A (or Term Loan B if TermLoan A is repaid in full) or, if the Revolving Facility balance is or wouldbecome $0 as a result of such payment, to pay down the RevolvingFacility in full and to use any remainder of that 75% for general corpo-rate purposes. So long as the Facility Debt Yield is greater than orequal to 12.00% and the Corporate Debt Yield is greater than or equalto 10.25% and each will remain so immediately after the Capital Event,Remaining Capital Event Proceeds will be applied 100% to pay downthe Revolving Facility, or if the Revolving Facility balance is or wouldbecome $0 as a result of such payment, to pay down the RevolvingFacility in full and to use any remainder for general corporate purposes.Remaining proceeds from a Capital Event or Refinance Eventrelating to Cherry Hill Mall will be used to pay down the RevolvingFacility and may be reborrowed only to repay the Company’sunsecured indebtedness.
The 2010 Credit Facility also contains provisions regarding the applica-tion of proceeds from a Refinance Event. A Refinance Event is anyevent by which the Company raises additional capital from refinancingof secured debt encumbering an existing asset, not including collateralfor the 2010 Credit Facility. The proceeds in excess of the amountrequired to retire an existing secured debt will be applied, afterpayment of interest, to pay down the Revolving Facility, or if theRevolving Facility balance is or would become $0 as a result of suchpayment, to pay down the Revolving Facility in full and to use anyremainder for general corporate purposes. Remaining proceeds from aCapital Event or Refinancing Event relating to the Gallery Propertiesmay only be used to pay down and permanently reduce Term Loan B(or, if the outstanding balance on Term Loan B is or would become $0as a result such payment, to pay down Term Loan B in full and to payany remainder in accordance with the preceding paragraph).
A Collateral Property will be released as security upon a sale or refi-nancing, subject to payment of the Release Price and the absence ofany default or Event of Default. If, after release of a Collateral Property(and giving pro forma effect thereto), the Facility Debt Yield will be lessthan 11.00%, the Release Price will be the Minimum Release Price plusan amount equal to the lesser of (A) the amount that, when paid andapplied to the 2010 Term Loan, would result in a Facility Debt Yieldequal to 11.00% and (B) the amount by which the greater of (1) 100.0%of net cash proceeds and (2) 90.0% of the gross sales proceedsexceeds the Minimum Release Price. The Minimum Release Price is
110% (120% if, after the Release, there will be fewer than 10 CollateralProperties) multiplied by the proportion that the value of the property tobe released bears to the aggregate value of all of the CollateralProperties on the closing date of the 2010 Credit Facility, multiplied bythe amount of the then Revolving Commitments plus the aggregateprincipal amount then outstanding under the 2010 Term Loan. Ingeneral, upon release of a Collateral Property, the post-release FacilityDebt Yield must be greater than or equal to the pre-release FacilityDebt Yield. Release payments must be used to pay down and perma-nently reduce the amount of the Term Loan.
The 2010 Credit Facility contains affirmative and negative covenantscustomarily found in facilities of this type, including, without limitation,requirements that the Company maintain, on a consolidated basis: (1)minimum Tangible Net Worth of not less than $483.1 million, minusnon-cash impairment charges with respect to the Properties recordedin the quarter ended December 31, 2009, plus 75% of the NetProceeds of all Equity Issuances effected at any time after September30, 2009; (2) maximum ratio of Total Liabilities to Gross Asset Value of0.75:1; (3) minimum ratio of EBITDA to Interest Expense of 1.60:1; (4)minimum ratio of Adjusted EBITDA to Fixed Charges of 1.35:1; (5)maximum Investments in unimproved real estate and predevelopmentcosts not in excess of 3.0% of Gross Asset Value; (6) maximumInvestments in Persons other than Subsidiaries, Consolidated Affiliatesand Unconsolidated Affiliates not in excess of 1.0% of Gross AssetValue; (7) maximum Investments in Indebtedness secured byMortgages in favor of the Company, the Borrower or any otherSubsidiary not in excess of 1.0% of Gross Asset Value on the basis ofcost; (8) the aggregate value of the Investments and the other itemssubject to the preceding clauses (5) through (7) shall not exceed 5.0%of Gross Asset Value; (9) maximum Investments in ConsolidationExempt Entities not in excess of 20.0% of Gross Asset Value; (10) amaximum Gross Asset Value attributable to any one Property not inexcess of 15.0% of Gross Asset Value; (11) maximum Projects UnderDevelopment not in excess of 10.0% of Gross Asset Value; (12)maximum Floating Rate Indebtedness in an aggregate outstandingprincipal amount not in excess of one-third of all Indebtedness of theCompany, its Subsidiaries, its Consolidated Affiliates and itsUnconsolidated Affiliates; (13) minimum Corporate Debt Yield of9.50%, provided that such Corporate Debt Yield may be less than9.50% for one period of two consecutive fiscal quarters, but may notbe less than 9.25%; and (14) Distributions may not exceed 110% ofREIT taxable income for a fiscal year, but if the Corporate Debt Yieldexceeds 10.00%, then the aggregate amount of Distributions may notexceed the greater of 75% of FFO and 110% of REIT Taxable Income(unless necessary for the Company to retain its status as a REIT), andif a Facility Debt Yield of 11.00% and a Corporate Debt Yield of 10.00%are achieved and continuing, there are no limits on Distributions underthe 2010 Credit Facility, so long as no Default or Event of Default wouldresult from making such Distributions. The Company is required tomaintain its status as a REIT at all times.
2003 CREDIT FACILITY | As of December 31, 2009, the amounts bor-rowed under the Company’s $500.0 million 2003 Credit Facility boreinterest at a rate between 0.95% and 2.00% per annum over LIBORbased on leverage. In determining leverage, the capitalization rate usedto calculate Gross Asset Value was 7.50%. In the determination of theCompany’s Gross Asset Value, when the Company completes theredevelopment or development of a property and it was Placed inService, the amount of Construction in Progress of such propertyincluded in Gross Asset Value was gradually reduced over a fourquarter period. The availability of funds under the 2003 Credit Facilitywas subject to compliance with financial and other covenants andagreements. In October 2008, the Company exercised an option toextend the term of the 2003 Credit Facility to March 2010.
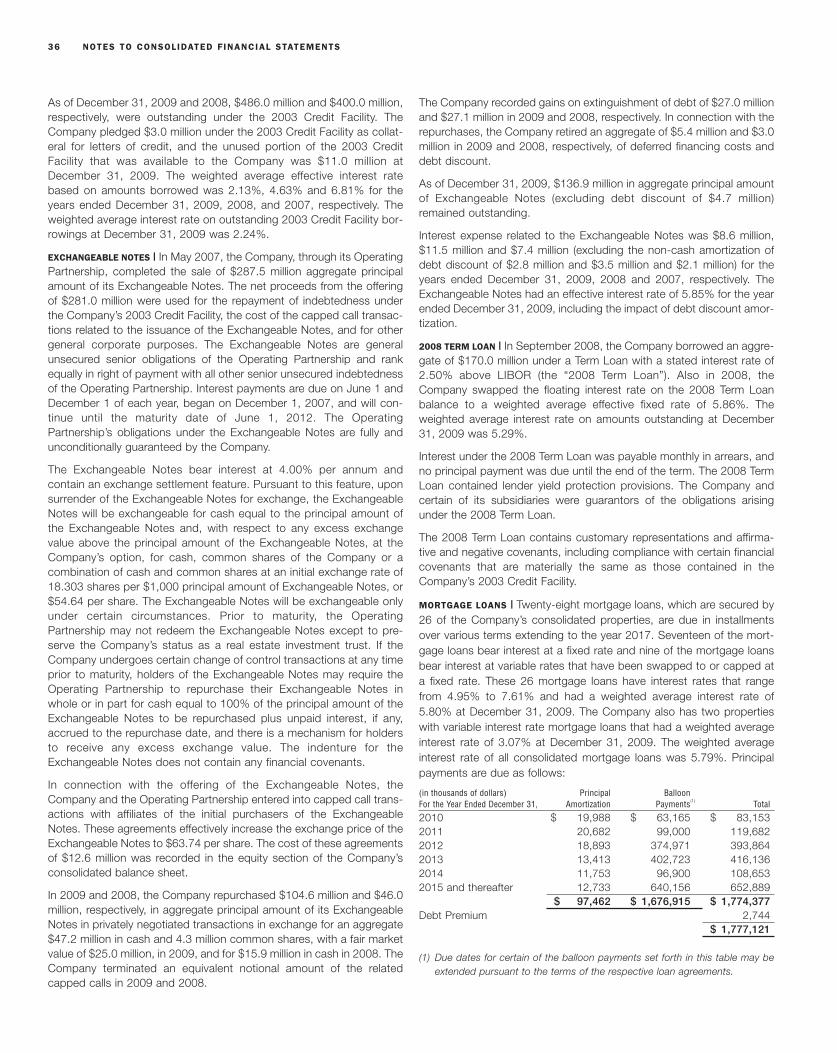
36 NOTES TO CONSOLIDATED FINANCIAL STATEMENTS
As of December 31, 2009 and 2008, $486.0 million and $400.0 million,respectively, were outstanding under the 2003 Credit Facility. TheCompany pledged $3.0 million under the 2003 Credit Facility as collat-eral for letters of credit, and the unused portion of the 2003 CreditFacility that was available to the Company was $11.0 million atDecember 31, 2009. The weighted average effective interest ratebased on amounts borrowed was 2.13%, 4.63% and 6.81% for theyears ended December 31, 2009, 2008, and 2007, respectively. Theweighted average interest rate on outstanding 2003 Credit Facility bor-rowings at December 31, 2009 was 2.24%.
EXCHANGEABLE NOTES | In May 2007, the Company, through its OperatingPartnership, completed the sale of $287.5 million aggregate principalamount of its Exchangeable Notes. The net proceeds from the offeringof $281.0 million were used for the repayment of indebtedness underthe Company’s 2003 Credit Facility, the cost of the capped call transac-tions related to the issuance of the Exchangeable Notes, and for othergeneral corporate purposes. The Exchangeable Notes are generalunsecured senior obligations of the Operating Partnership and rankequally in right of payment with all other senior unsecured indebtednessof the Operating Partnership. Interest payments are due on June 1 andDecember 1 of each year, began on December 1, 2007, and will con-tinue until the maturity date of June 1, 2012. The OperatingPartnership’s obligations under the Exchangeable Notes are fully andunconditionally guaranteed by the Company.
The Exchangeable Notes bear interest at 4.00% per annum andcontain an exchange settlement feature. Pursuant to this feature, uponsurrender of the Exchangeable Notes for exchange, the ExchangeableNotes will be exchangeable for cash equal to the principal amount ofthe Exchangeable Notes and, with respect to any excess exchangevalue above the principal amount of the Exchangeable Notes, at theCompany’s option, for cash, common shares of the Company or acombination of cash and common shares at an initial exchange rate of18.303 shares per $1,000 principal amount of Exchangeable Notes, or$54.64 per share. The Exchangeable Notes will be exchangeable onlyunder certain circumstances. Prior to maturity, the OperatingPartnership may not redeem the Exchangeable Notes except to pre-serve the Company’s status as a real estate investment trust. If theCompany undergoes certain change of control transactions at any timeprior to maturity, holders of the Exchangeable Notes may require theOperating Partnership to repurchase their Exchangeable Notes inwhole or in part for cash equal to 100% of the principal amount of theExchangeable Notes to be repurchased plus unpaid interest, if any,accrued to the repurchase date, and there is a mechanism for holdersto receive any excess exchange value. The indenture for theExchangeable Notes does not contain any financial covenants.
In connection with the offering of the Exchangeable Notes, theCompany and the Operating Partnership entered into capped call trans-actions with affiliates of the initial purchasers of the ExchangeableNotes. These agreements effectively increase the exchange price of theExchangeable Notes to $63.74 per share. The cost of these agreementsof $12.6 million was recorded in the equity section of the Company’sconsolidated balance sheet.
In 2009 and 2008, the Company repurchased $104.6 million and $46.0million, respectively, in aggregate principal amount of its ExchangeableNotes in privately negotiated transactions in exchange for an aggregate$47.2 million in cash and 4.3 million common shares, with a fair marketvalue of $25.0 million, in 2009, and for $15.9 million in cash in 2008. TheCompany terminated an equivalent notional amount of the relatedcapped calls in 2009 and 2008.
The Company recorded gains on extinguishment of debt of $27.0 millionand $27.1 million in 2009 and 2008, respectively. In connection with therepurchases, the Company retired an aggregate of $5.4 million and $3.0million in 2009 and 2008, respectively, of deferred financing costs anddebt discount.
As of December 31, 2009, $136.9 million in aggregate principal amountof Exchangeable Notes (excluding debt discount of $4.7 million)remained outstanding.
Interest expense related to the Exchangeable Notes was $8.6 million,$11.5 million and $7.4 million (excluding the non-cash amortization ofdebt discount of $2.8 million and $3.5 million and $2.1 million) for theyears ended December 31, 2009, 2008 and 2007, respectively. TheExchangeable Notes had an effective interest rate of 5.85% for the yearended December 31, 2009, including the impact of debt discount amor-tization.
2008 TERM LOAN | In September 2008, the Company borrowed an aggre-gate of $170.0 million under a Term Loan with a stated interest rate of2.50% above LIBOR (the “2008 Term Loan”). Also in 2008, theCompany swapped the floating interest rate on the 2008 Term Loanbalance to a weighted average effective fixed rate of 5.86%. Theweighted average interest rate on amounts outstanding at December31, 2009 was 5.29%.
Interest under the 2008 Term Loan was payable monthly in arrears, andno principal payment was due until the end of the term. The 2008 TermLoan contained lender yield protection provisions. The Company andcertain of its subsidiaries were guarantors of the obligations arisingunder the 2008 Term Loan.
The 2008 Term Loan contains customary representations and affirma-tive and negative covenants, including compliance with certain financialcovenants that are materially the same as those contained in theCompany’s 2003 Credit Facility.
MORTGAGE LOANS | Twenty-eight mortgage loans, which are secured by26 of the Company’s consolidated properties, are due in installmentsover various terms extending to the year 2017. Seventeen of the mort-gage loans bear interest at a fixed rate and nine of the mortgage loansbear interest at variable rates that have been swapped to or capped ata fixed rate. These 26 mortgage loans have interest rates that rangefrom 4.95% to 7.61% and had a weighted average interest rate of5.80% at December 31, 2009. The Company also has two propertieswith variable interest rate mortgage loans that had a weighted averageinterest rate of 3.07% at December 31, 2009. The weighted averageinterest rate of all consolidated mortgage loans was 5.79%. Principalpayments are due as follows:
(in thousands of dollars) Principal BalloonFor the Year Ended December 31, Amortization Payments(1) Total
2010 $ 19,988 $ 63,165 $ 83,1532011 20,682 99,000 119,6822012 18,893 374,971 393,8642013 13,413 402,723 416,1362014 11,753 96,900 108,6532015 and thereafter 12,733 640,156 652,889
$ 97,462 $ 1,676,915 $ 1,774,377Debt Premium 2,744
$ 1,777,121
(1) Due dates for certain of the balloon payments set forth in this table may beextended pursuant to the terms of the respective loan agreements.

PENNSYLVANIA REAL ESTATE INVESTMENT TRUST 2009 ANNUAL REPORT 37
Financing Date Property
or Extended(in millionsof dollars): Stated Rate
HedgedRate Maturity
2007 Activity:
May The Mall at Prince Georges(1) $ 150.0 5.51 % fixed n/a June 20172008 Activity:
January Cherry Hill Mall(2)(3) 55.0 5.51% fixed n/a October 2012February One Cherry Hill Plaza(1)(4) 5.6 LIBOR plus 1.30% n/a August 2010May Creekview Center(5) 20.0 LIBOR plus 2.15% 5.56% June 2010June Christiana Center(1)(6) 45.0 LIBOR plus 1.85% 5.87% June 2011July Paxton Towne Centre(1)(6) 54.0 LIBOR plus 2.00% 5.84% July 2011September Patrick Henry Mall(7) 97.0 6.34% fixed n/a October 2015September Jacksonville Mall(1)(8) 56.3 LIBOR plus 2.10% 5.83% September 2013September Logan Valley Mall(1)(8)(9) 68.0 LIBOR plus 2.10% 5.79% September 2013September Wyoming Valley Mall(1)(8)(10) 65.0 LIBOR plus 2.25% 5.85% September 2013November Francis Scott Key Mall(1) 55.0 LIBOR plus 2.35% 5.25% December 2013November Viewmont Mall(1) 48.0 LIBOR plus 2.35% 5.25% December 2013December Exton Square Mall(11) 70.0 7.50% fixed n/a January 2014
2009 Activity:
March New River Valley Center(12) 16.3 LIBOR plus 3.25% 5.75% March 2012June Pitney Road Plaza(13) 6.4 LIBOR plus 2.50% n/a June 2010June Lycoming Mall(14) 33.0 6.84% fixed n/a June 2014September Northeast Tower Center(15) 20.0 LIBOR plus 2.75% n/a September 2011
2010 Activity:
January New River Valley Mall(1)(16) 30.0 LIBOR plus 4.50% 6.33% January 2013March Lycoming Mall(14) 2.5 6.84% fixed n/a June 2014
MORTGAGE LOAN ACTIVITY | The following table presents the mortgage loans that the Company entered into beginning January 1, 2007:
(1) Interest only.(2) Supplemental financing with a maturity date that coincides with the existing first mortgage loan.(3) First 24 payments are interest only followed by principal and interest payments based on a 360-month amortization schedule.(4) In February 2008, the Company entered into this mortgage loan as a result of the acquisition of BCA. The original maturity date of the mortgage loan was
August 2009, with two separate one year extension options. In June 2009, the Company made a principal payment of $2.4 million and exercised the first exten-sion option.
(5) The mortgage loan has a term of two years and three one-year extension options.(6) The mortgage loan has a term of three years and two one-year extension options.(7) Payments based on 25 year amortization schedule, with a balloon payment in October 2015.(8) The mortgage loan has a term of five years and two one-year extension options.(9) The mortgage loan bears interest at an annual rate equal to, at our election, LIBOR plus 2.10%, or a base rate equal to the prime rate, or if greater, the federal
funds rate plus 0.50%, plus a margin of 0.50%.(10) The mortgage loan bears interest at an annual rate equal to, at our election, LIBOR plus 2.25%, or a base rate equal to the prime rate, or if greater, the federal
funds rate plus 0.50%, plus a margin of 0.50%.(11) Payments based on 30 year amortization schedule, with balloon payment in January 2014. The mortgage loan has a term of three years and two one-year
extension options.(12) Mortgage loan has a term of three years and two one-year extension options.(13) The Company has made draws of $6.4 million and a one time principal payment of $1.9 million in connection with the sale of a parcel at the property. The loan
has one six-month extension option during the construction period. The Company has the option to convert the loan to a two-year loan at the end of the con-struction period.
(14) The mortgage loan agreement provides for a maximum loan amount of $38.0 million. The initial amount of the mortgage loan was $28.0 million. The Companytook additional draws of $5.0 million in October 2009 and $2.5 million in March 2010.
(15) In October 2009, the Company repaid the $20.0 million mortgage loan on Northeast Tower Center in connection with the sale of a controlling interest in thisproperty.
(16) The mortgage loan has a three year term and one one-year extension option. $25.0 million of the principal amount was swapped to a fixed rate of 6.33%
AmountFinanced
The estimated fair values of mortgage loans based on year-end inter-est rates and market conditions at December 31, 2009 and 2008 areas follows:
(in millions of dollars) 2009 2008Carrying Value Fair Value Carrying Value Fair Value
Mortgage loans $1,777.1 $1,549.6 $ 1,760.3 $ 1,681.7
The mortgage loans contain various affirmative and negative covenantscustomarily found in loans such as these. As of December 31, 2009,the Company was in compliance with all of these covenants.

38 NOTES TO CONSOLIDATED FINANCIAL STATEMENTS
In July 2008, the Company repaid a $12.7 million mortgage loan onCrossroads Mall in Beckley, West Virginia, using funds from its 2003Credit Facility and available working capital.
In December 2008, the Company repaid a $93.0 million mortgage loanon Exton Square Mall in Exton, Pennsylvania using $70.0 million froma new mortgage loan on the property, the Company’s 2003 CreditFacility, the Company’s 2008 Term Loan and available working capital.
In January 2009, the Company repaid a $15.7 million mortgage loan onPalmer Park Mall in Easton, Pennsylvania using funds from its 2003Credit Facility and 2008 Term Loan.
In June 2009, the Company made a principal payment of $2.4 millionand exercised the first one-year renewal option on the mortgage loanon the One Cherry Hill Plaza office building in Cherry Hill, New Jersey.
In October 2009, the Company repaid the $20.0 million mortgage loanon Northeast Tower Center, a power center located in Philadelphia,Pennsylvania, in connection with a sale of a controlling interest in theproperty.
In November 2009, the Company entered into a one-year extension ofa $34.3 million mortgage loan secured by Valley View Mall in LaCrosse, Wisconsin, with two additional six-month extension options.
REMIC | In September 2008, the Company used the proceeds from fourmortgage loans totaling $286.3 million, and borrowings under its 2003Credit Facility and 2008 Term Loan to repay the Company’s $400.9million, 15 property real estate mortgage investment conduit (the“REMIC”) in full. In connection with this repayment, the 15 malls werereleased from the liens under the REMIC, and four of these malls wereused to secure new mortgage loan financings. The Company assumedthe REMIC in connection with its 2003 merger with Crown AmericanRealty Trust.
5. Derivatives
In the normal course of business, the Company is exposed to financialmarket risks, including interest rate risk on its interest bearing liabilities.The Company attempts to limit these risks by following established riskmanagement policies, procedures and strategies, including the use offinancial instruments. The Company does not use financial instrumentsfor trading or speculative purposes.
CASH FLOW HEDGES OF INTEREST RATE RISK | The Company’s objectivesin using interest rate derivatives are to add stability to interest expenseand to manage its exposure to interest rate movements. To accomplishthis objective, the Company uses interest rate swaps and caps as partof its interest rate risk management strategy. The Company’s outstand-ing derivatives have been designated as cash flow hedges. Theeffective portion of changes in the fair value of derivatives designatedas, and that qualify as, cash flow hedges is recorded in “Accumulatedother comprehensive income (loss)” and is subsequently reclassifiedinto earnings in the period that the hedged forecasted transactionaffects earnings. To the extent these instruments are ineffective as cashflow hedges, changes in the fair value of these instruments arerecorded in “Interest expense, net.” The Company recognizes all deriv-atives at fair value as either assets or liabilities in the accompanyingconsolidated balance sheets. The Company’s derivative assets and lia-bilities are recorded in “Fair value of derivative instruments.” During theyear ended December 31, 2009, the Company’s derivatives were usedto hedge the variable cash flows associated with existing variable-ratedebt.
During the years ended December 31, 2009 and 2007, the Companyrecorded no amounts associated with hedge ineffectiveness in earn-ings.
In 2008, the Company recorded a gain due to hedge ineffectiveness of$46,000 and a net loss of $358,000 due to hedge ineffectiveness.Also, for several of these swaps, the result of this change in estimateswas that the swaps were no longer designated as cash flow hedgessince they no longer met the requirements for hedge accounting. TheCompany recorded a net gain of $2.4 million in 2008 in connection withthese swaps. The net gain represents the change in the fair marketvalue of the swaps from the date of de-designation to the date whenthe swaps were either settled or redesignated.
Amounts reported in “Accumulated other comprehensive income(loss)” that are related to derivatives will be reclassified to “Interestexpense, net” as interest payments are made on the Company’s debt.During the next twelve months, the Company estimates that $14.2million would be reclassified as an increase to interest expense in con-nection with derivatives.

PENNSYLVANIA REAL ESTATE INVESTMENT TRUST 2009 ANNUAL REPORT 39
The following table summarizes the terms and fair values of the Company’s interest rate swap and cap derivative instruments at December 31,2009 and December 31, 2008. The notional amounts at December 31, 2009 and 2008 provide an indication of the extent of the Company’sinvolvement in these instruments at that time, but do not represent exposure to credit, interest rate or market risks.
Fair Value at Fair Value at InterestNotional Value December 31, 2009(1) December 31, 2008(1) Balance Sheet Location Rate(2) Maturity Date
Interest Rate Swaps
$25.0 million $ (0.2) million $ (0.6) million Fair Value of derivative instruments 2.86% March 20, 2010$75.0 million (0.4) million (1.7) million Fair Value of derivative instruments 2.83% March 20, 2010$30.0 million (0.2) million (0.7) million Fair Value of derivative instruments 2.79% March 20, 2010$40.0 million (0.2) million (0.8) million Fair Value of derivative instruments 2.65% March 22, 2010$20.0 million (0.2) million (0.7) million Fair Value of derivative instruments 3.41% June 1, 2010$45.0 million (1.9) million (2.8) million Fair Value of derivative instruments 4.02% June 19, 2011$54.0 million (2.2) million (3.3) million Fair Value of derivative instruments 3.84% July 25, 2011$65.0 million (2.5) million (4.7) million Fair Value of derivative instruments 3.60% September 9, 2013$68.0 million (2.8) million (5.2) million Fair Value of derivative instruments 3.69% September 9, 2013$56.3 million (2.4) million (4.4) million Fair Value of derivative instruments 3.73% September 9, 2013$55.0 million (0.9) million (2.3) million Fair Value of derivative instruments 2.90% November 29, 2013$48.0 million (0.7) million (2.0) million Fair Value of derivative instruments 2.90% November 29, 2013
Interest Rate Cap$16.3 million 0.0 million n/a Fair Value of derivative instruments 2.50% April 2, 2012
$ (14.6) million $ (29.2) million
(1) As of December 31, 2009 and December 31, 2008, derivative valuations in their entirety are classified in Level 2 of the fair value hierarchy. As of December 31,2009 and December 31, 2008, the Company does not have any significant fair value measurements using significant unobservable inputs (Level 3).
(2) Interest rate does not include the spread on the designated debt.
CREDIT-RISK-RELATED CONTINGENT FEATURES | The Company has agree-ments with some of its derivative counterparties that contain aprovision pursuant to which, if the entity that originated such derivativeinstruments defaults on any of its indebtedness, including defaultwhere repayment of the indebtedness has not been accelerated by thelender, then the Company could also be declared in default on its deriv-ative obligations. As of December 31, 2009, the Company was not indefault on any of its derivative obligations.
The Company has an agreement with a derivative counterparty thatincorporates the loan covenant provisions of the Company’s loanagreement with a lender affiliated with the derivative counterparty.Failure to comply with the loan covenant provisions would result in theCompany being in default on any derivative instrument obligationscovered by the agreement.
As of December 31, 2009, the fair value of derivatives in a net liabilityposition, which excludes accrued interest but includes any adjustmentfor nonperformance risk, related to these agreements was $14.6million. As of December 31, 2009, the Company has not posted anycollateral related to these agreements. If the Company had breachedany of these provisions as of December 31, 2009, it would have beenrequired to settle its obligations under the agreements at their termina-tion value (including accrued interest) of $18.4 million. The Companyhas not breached any of the provisions as of December 31, 2009.
The table below presents the effect of the Company’s derivativefinancial instruments on the statement of operations as of December31, 2009.
Year ended Statement ofDecember 31, 2009 Operations location
Derivatives in cash flowhedging relationships
Interest rate productsLoss recognized in Other
Comprehensive Income onderivatives (effective portion) $(2.5) million N/A
Gain reclassified fromAccumulated OtherComprehensive Income (loss)into income (effective portion) $18.6 million Interest Expense
Gain (loss) recognized in incomeon derivatives (ineffective portionand amount excluded fromeffectiveness testing) $ — Interest Expense

40 NOTES TO CONSOLIDATED FINANCIAL STATEMENTS
FORWARD STARTING INTEREST RATE SWAPS | During the year endedDecember 31, 2008, the Company cash settled all of its forward-start-ing interest rate swaps with an aggregate notional amount of $400.0million. The Company paid an aggregate of $16.5 million in cash tosettle these swaps. The swaps were settled in anticipation of theCompany’s issuance of long-term debt. Accumulated other compre-hensive loss as of December 31, 2009 includes a net loss of $13.2million relating to forward-starting swaps that the Company cashsettled that are being amortized over 10 year periods commencing onthe closing dates of the debt instruments that are associated withthese settled swaps.
INTEREST RATE SWAPS AND CAP | As of December 31, 2009, theCompany had entered into 12 interest rate swap agreements and oneinterest rate cap agreement that have a weighted average interest rateof 3.29% on a notional amount of $597.5 million maturing on variousdates through November 2013.
The Company entered into these interest rate swap agreements andthe cap agreement in order to hedge the interest payments associatedwith the Company’s 2008 issuances of variable interest rate long-termdebt. The Company assessed the effectiveness of these swap agree-ments and cap agreement as hedges at inception and on December31, 2009 and considered these swap agreements and cap agreementto be highly effective cash flow hedges. The Company’s interest rateswap agreements and cap agreement will be settled in cash.
6. Preferred Share Redemption
On July 31, 2007, the Company redeemed all of its 11% non-convert-ible senior preferred shares for $129.9 million, or $52.50 per preferredshare, plus accrued and unpaid dividends to the redemption date of$1.9 million. The preferred shares were issued in November 2003 inconnection with the merger with Crown American Realty Trust(“Crown”), and were initially recorded at $57.90 per preferred share, thefair value based on the market value of the corresponding Crown pre-ferred shares as of May 13, 2003, the date on which the financial termsof the merger with Crown were substantially complete. In order tofinance the redemption, the Company borrowed $131.8 million under its2003 Credit Facility. As a result of the redemption, the $13.3 millionexcess of the carrying amount of the preferred shares, net of expenses,over the redemption price is included in “Net (loss) income attributed toPennsylvania Real Estate Investment Trust” in the year ended December31, 2007.
7. Benefit Plans
401(K) PLAN | The Company maintains a 401(k) Plan (the “Plan”) inwhich substantially all of its employees are eligible to participate. ThePlan permits eligible participants, as defined in the Plan agreement, todefer up to 15% of their compensation, and the Company, at its dis-cretion, may match a specified percentage of the employees’contributions. The Company’s and its employees’ contributions arefully vested, as defined in the Plan agreement. The Company’s contri-butions to the Plan were $1.0 million for each of the years endedDecember 31, 2009, 2008 and 2007.
SUPPLEMENTAL RETIREMENT PLANS | The Company maintainsSupplemental Retirement Plans (the “Supplemental Plans”) coveringcertain senior management employees. Expenses recorded by theCompany under the provisions of the Supplemental Plans were $0.6million for the each of years ended December 31, 2009, 2008 and2007.
EMPLOYEE SHARE PURCHASE PLANS | The Company maintains sharepurchase plans through which the Company’s employees may pur-chase common shares at a 15% discount to the fair market value (asdefined therein). In the years ended December 31, 2009, 2008, and2007, approximately 102,000, 45,000 and 20,000 shares, respectively,were purchased for total consideration of $0.4 million, $0.7 million and$0.6 million for the years ended December 31, 2009, 2008, and 2007,respectively. The Company recorded an expense of $0.1 million, $0.1million and $0.2 million in the years ended December 31, 2009, 2008and 2007, respectively, related to the share purchase plans.
PERFORMANCE INCENTIVE UNIT PROGRAM | In 2009, the Company madeawards of Performance Incentive Units (“PIUs”) that are subject tomarket based vesting. The PIUs vest in equal installments over a threeyear period if specified total return to shareholders goals (as defined inthe PIU plan) established at the time of the award are met each year.Payments under the PIU program, if any, will be made in cash. Theamount of the payment is variable based on the total return to theCompany’s shareholders relative to the total return achieved for anindex of real estate investment trusts, as defined on the PIU plan. TheCompany records compensation expense for the PIU program pro rataover the vesting period based on estimates of future cash paymentsunder the plan. The Company issued 221,022 PIUs in 2009 with aninitial value of $0.8 million, and recorded compensation expense relat-ing to these awards of $0.4 million.

PENNSYLVANIA REAL ESTATE INVESTMENT TRUST 2009 ANNUAL REPORT 41
8. Common Share Repurchase Program
In December 2007, the Company’s Board of Trustees authorized aprogram to repurchase up to $100.0 million of the Company’s commonshares through solicited or unsolicited transactions in the open marketor in privately negotiated or other transactions from January 1, 2008until December 31, 2009, subject to the Company’s authority to termi-nate the program earlier. Previously, in October 2005, the Company’sBoard of Trustees had authorized a program to repurchase up to$100.0 million of the Company’s common shares. That programexpired by its terms on December 31, 2007. The 2007 program was ineffect until the end of 2009, when it expired according to its terms.
Repurchased shares are treated as authorized but unissued shares.The Company accounts for the purchase price of the shares repur-chased as a reduction of equity and allocates the purchase pricebetween retained earnings, shares of beneficial interest and capitalcontributed in excess of par as required. The Company did not repur-chase any shares in 2009 or 2008. In 2007, the Company repurchased152,500 shares at an average price of $35.67, or an aggregate pur-chase price of $5.4 million.
9. Share Based Compensation
SHARE BASED COMPENSATION PLANS | As of December 31, 2009, therewere two share based compensation plans under which the Companycontinues to make awards: its 2003 Equity Incentive Plan and its 2008Restricted Share Plan for Non-Employee Trustees, which wasapproved in 2007. Previously, the Company maintained five other planspursuant to which it granted awards of restricted shares or options.Certain restricted shares and certain options granted under these pre-vious plans remain subject to restrictions or outstanding andexercisable, respectively. In addition, the Company previously main-tained a plan pursuant to which it granted options to its non-employeetrustees.
The Company recognizes expense on share based payments byemployees valuing all share based payments at their fair value on thedate of grant, and by expensing them over the applicable vestingperiod.
For the years ended December 31, 2009, 2008 and 2007, theCompany recorded aggregate compensation expense for share basedawards of $7.7 million, $9.4 million and $8.0 million, respectively, inconnection with the equity programs described below. There was noincome tax benefit recognized in the income statement for share basedcompensation arrangements. The Company capitalized compensationcosts related to share based awards of $0.3 million in 2009, and $0.4million in each of 2008 and 2007.
2003 EQUITY INCENTIVE PLAN | Subject to any future adjustments forshare splits and similar events, the total remaining number of commonshares that may be issued under the Company’s 2003 Equity IncentivePlan (pursuant to options, restricted shares or otherwise) was 801,209as of December 31, 2009. The share based awards described below inthis section were all made under the 2003 Equity Incentive Plan.
RESTRICTED SHARES | In 2009, 2008 and 2007, the Company madegrants of restricted shares subject to time based vesting. The aggre-gate fair value of the restricted shares that the Company granted to itsemployees in 2009, 2008 and 2007 was $2.9 million, $5.0 million, and$6.0 million, respectively. As of December 31, 2009, there was $7.3million of total unrecognized compensation cost related to unvestedshare based compensation arrangements granted under the 2003Equity Incentive Plan. The cost is expected to be recognized over aweighted average period of 0.9 years. The total fair value of sharesvested during the years ended December 31, 2009, 2008, and 2007was $5.4 million, $4.4 million, and $4.0 million, respectively.
The Company will record future compensation expense in connectionwith the vesting of existing time based restricted share awardsas follows:
Future(in thousands of dollars) CompensationYear ended December 31, Expense
2010 $ 3,8872011 2,9842012 463Total $ 7,334
A summary of the status of the Company’s unvested restricted sharesas of December 31, 2009 and changes during the year endedDecember 31, 2009 is presented below:
WeightedAverage
Grant DateShares Fair Value
Unvested at January 1, 2009 532,930 $ 35.62Shares granted 777,274 3.85Shares vested (167,396) 34.05Shares forfeited (65,328) 35.82Unvested at December 31, 2009 1,077,480 $ 12.93
42 NOTES TO CONSOLIDATED FINANCIAL STATEMENTS
RESTRICTED SHARES SUBJECT TO MARKET BASED VESTING | In 2003,2004, and 2005, the Company granted restricted shares that weresubject to market based vesting. These restricted shares would havevested in equal installments over a five-year period if specified totalreturn to shareholders (as defined in the grant) goals established at thetime of the grant were met in each year. If the goal was not met in anyyear, the awards provided for excess amounts of total return to share-holders in a prior or subsequent year to be carried forward or carriedback to the year in which the goals were not met. No market basedrestricted shares vested in 2007 or 2008 since the Company’s totalreturn to shareholders was less than the annual total return to share-holders goal for the 2003 and 2004 awards. The annual total return toshareholders goal for the market based restricted shares awarded in2005 was set at the greater of (i) 110% of the total return to sharehold-ers of a specified index of real estate investment trusts for each of thefive years or (ii) the dividends paid by the Company during the year,expressed as a percentage of the market value of a share, as of thebeginning of the year, plus 1%. The Company granted a total of 67,147restricted shares subject to market based vesting in 2005, of which10,056 shares were previously issued and 2,450 were forfeited in con-nection with employee severance arrangements. The Company met thereturn criteria for the portion relating to 2009, and thus 10,927 sharesvested in February 2010. Because the vesting of the market basedrestricted shares granted in 2005 relating to the years 2005-2008depended upon the achievement of certain total return to shareholdersgoals by December 31, 2009, and because the Company did not meetthis objective by that date, the remaining 43,714 shares granted in 2005have been forfeited. However, as of December 31, 2009, these shareshad not yet been characterized as “shares forfeited” in the table abovepending a formal determination by the compensation committee of theBoard of Trustees of the Company in accordance with the terms of the2003 Equity Incentive Plan, which typically occurs early in the followingyear. Recipients were entitled to receive an amount equal to the divi-dends on the shares prior to vesting. The grant date fair value of theseawards was determined using a Monte Carlo simulation probabilisticvaluation model and was $29.00 for 2005. For purposes of the simula-tion, the Company assumed an expected quarterly total return toshareholders of a specified index of real estate investment trusts of2.2%, a standard deviation of 6.4%, and a 0.92 correlation of theCompany’s total return to shareholders to that of the specified index ofreal estate investment trusts for the 2005 awards. Compensation costrelating to these market based vesting awards was recorded ratablyover the five-year period. The Company recorded $0.4 million, $0.6million, and $1.1 million of compensation expense related to marketbased restricted shares for the years ended December 31, 2009, 2008and 2007, respectively.
RESTRICTED SHARES SUBJECT TO TIME BASED VESTING | The Companymakes grants of restricted shares subject to time based vesting. Theawarded shares vest over periods of two to five years, typically in equalannual installments, as long as the recipient is an employee of theCompany on the vesting date. For all grantees, the shares generallyvest immediately upon death or disability. Recipients are entitled toreceive an amount equal to the dividends on the shares prior to vesting.The Company granted a total of 757,273, 195,285 and 132,430restricted shares subject to time based vesting to its employees in2009, 2008 and 2007, respectively. The weighted average grant datefair value of time based restricted shares, which were determined
based on the average of the high and low sales price of a commonshare on the date of grant, was $3.81 per share in 2009, $25.74 pershare in 2008 and $45.11 per share in 2007. Compensation cost relat-ing to time based restricted shares awards is recorded ratably over therespective vesting periods. The Company recorded $5.0 million, $5.1million and $4.3 million of compensation expense related to time basedrestricted shares for the years ended December 31, 2009, 2008 and2007, respectively.
On March 12, 2010, the Company granted 474,088 time basedrestricted shares to employees with a grant date fair value of $5.5million. The shares awarded in 2010 vest over periods of two to threeyears, in annual installments.
RESTRICTED SHARE UNIT PROGRAM | In February 2008 and February2007, the Company’s Board of Trustees established the 2008-2010RSU Program and the 2007-2009 RSU Program, respectively (the“RSU Programs”). Under the RSU Programs, the Company may makeawards in the form of market based performance-contingent restrictedshare units, or RSUs. The RSUs represent the right to earn commonshares in the future depending on the Company’s performance in termsof total return to shareholders (as defined in the RSU Programs) for thethree year periods ending December 31, 2010 and 2009 (each, a“Measurement Period”) relative to the total return to shareholders forthe applicable Measurement Period of companies comprising an indexof real estate investment trusts (the “Index REITs”). If the Company’stotal return to shareholders performance is below the 25th percentile ofthe Index REITs, then no shares will be earned. If the Company’s totalreturn to shareholders over the applicable Measurement Period isabove the 25th, 50th or 75th percentiles of the Index REITs, then a per-centage of the awards ranging from 50% to 150% will be earned.Dividends are deemed credited to the RSU accounts and are appliedto “acquire” more RSUs for the account of the participants at the 20-day average price per common share ending on the dividend paymentdate. If earned, awards will be paid in common shares in an amountequal to the applicable percentage of the number of RSUs in the par-ticipant’s account at the end of the applicable Measurement Period.The aggregate fair value of the RSU awards in 2008 and 2007 wasdetermined using a Monte Carlo simulation probabilistic valuationmodel and was $2.6 million ($21.68 per share) and $3.4 million ($50.58per share), respectively. For purposes of the 2008 simulation, theCompany assumed volatility of 26.3%, which is calculated based onthe volatility of the Company’s share price over the prior three years, arisk-free interest rate of 2.43%, which reflects the yield on a three-yearTreasury bond, and a stock beta of 0.973 compared to the Dow JonesUS Real Estate Index based on three years of historical price data. Forthe purpose of the 2007 simulation, the Company assumed volatility of22.0%, which is calculated based on the volatility of the Company’sshare price over three prior years, a risk-free interest rate of 4.74%,which reflects the yield on a three-year Treasury bond, and a stock betaof 1.029 compared to the Dow Jones US Real Estate Index based onthree years of historical price data.
Compensation cost relating to these RSU awards is being expensedover the applicable three year vesting period. The Company granted atotal of 122,113 RSUs in 2008 and 67,430 RSUs in 2007. However, asdescribed above, recipients of RSUs only earn common shares if theCompany’s total return to shareholders for the applicable MeasurementPeriod exceeds certain percentiles of the Index REITs, and as such,
PENNSYLVANIA REAL ESTATE INVESTMENT TRUST 2009 ANNUAL REPORT 43
none of the RSUs were earned as of December 31, 2009. TheCompany recorded $2.1 million and $2.6 million of compensationexpense related to the RSU Programs for the years ended December31, 2009 and 2008, respectively. The Company will record future com-pensation expense related to the existing awards under the RSUPrograms as follows:
Future(in thousands of dollars) CompensationYear ended December 31, Expense
2010 $ 1,0452011 122Total $ 1,167
On March 12, 2010, the Company granted 317,749 restricted shareunits to employees. The 2010 RSUs have a three year measurementperiod which ends on December 31, 2012. The aggregate fair value ofthe 2010 RSU award has yet to be determined.
OUTPERFORMANCE PROGRAM | In January 2005, the Company’s Boardof Trustees approved the 2005-2008 Outperformance Program(“OPP”), a performance-based incentive compensation program thatwas designed to pay a bonus (in the form of common shares) if theCompany’s total return to shareholders (as defined in the OPP)exceeded certain thresholds over a four year measurement periodbeginning on January 1, 2005. The grant date fair value of the OPPawards in 2005 was determined using a Monte Carlo simulation prob-abilistic valuation model and the aggregate value of $3.7 million wasexpensed over the four year vesting period. For purposes of the simu-lation, the Company assumed an expected quarterly total return toshareholders of a specified index of real estate investment trusts of2.2%, a standard deviation of 6.2% and a 0.92 correlation of theCompany’s total return to shareholders to that of the specified index ofreal estate investment trusts. The Compensation Committee of theCompany’s Board of Trustees determined that the Company’s totalreturn to shareholders for the measurement period of January 1, 2005through December 31, 2008 did not exceed the thresholds set forth inthe OPP, and thus no shares were awarded under the OPP. TheCompany recorded $0.8 million of compensation expense related tothe OPP in each of the years ended December 31, 2008 and 2007,respectively.
SERVICE AWARDS | In 2009, 2008 and 2007, the Company issued1,725, 1,275, and 1,475 shares, respectively, without restrictions tonon-officer employees as service awards. The aggregate fair value ofthe awards of $8,000, $25,000, and $60,000 in each of the yearsended December 31, 2009, 2008 and 2007, respectively, wasrecorded as compensation expense.
RESTRICTED SHARE PLAN FOR NON-EMPLOYEE TRUSTEES | The 2008Restricted Share Plan for Non-Employee Trustees approved in 2007provides for the granting of restricted share awards to non-employeetrustees of the Company. In 2009 and 2008, the Company madegrants of restricted shares to non-employee trustees under the 2008Restricted Share Plan. In 2007, the Company made grants of restrictedshares to non-employee trustees subject to time based vesting undera predecessor plan. The aggregate fair value of the restricted sharesthat the Company granted to its non-employee trustees in 2009, 2008and 2007 was $0.1 million, $0.2 million, and $0.4 million, respectively.
The Company recorded $0.2 million, $0.3 million and $0.4 million ofcompensation expense related to time based vesting of non-employeetrustee restricted share awards in 2009, 2008 and 2007, respectively.As of December 31, 2009, there was $0.1 million of total unrecognizedcompensation cost related to unvested restricted share grants to non-employee trustees. The cost is expected to be recognized over aweighted average period of 0.5 years. The total fair value of sharesgranted to non-employee trustees that vested was $0.3 million in theyear ended December 31, 2009, and $0.4 million during each of theyears ended December 31, 2008 and 2007. There were 31,000 sharesavailable for grant to non-employee trustees at December 31, 2009.The Company will record future compensation expense in connectionwith the vesting of existing non-employee trustee restricted shareawards as follows:
Future(in thousands of dollars) CompensationYear ended December 31, Expense
2010 $ 1242011 21Total $ 145
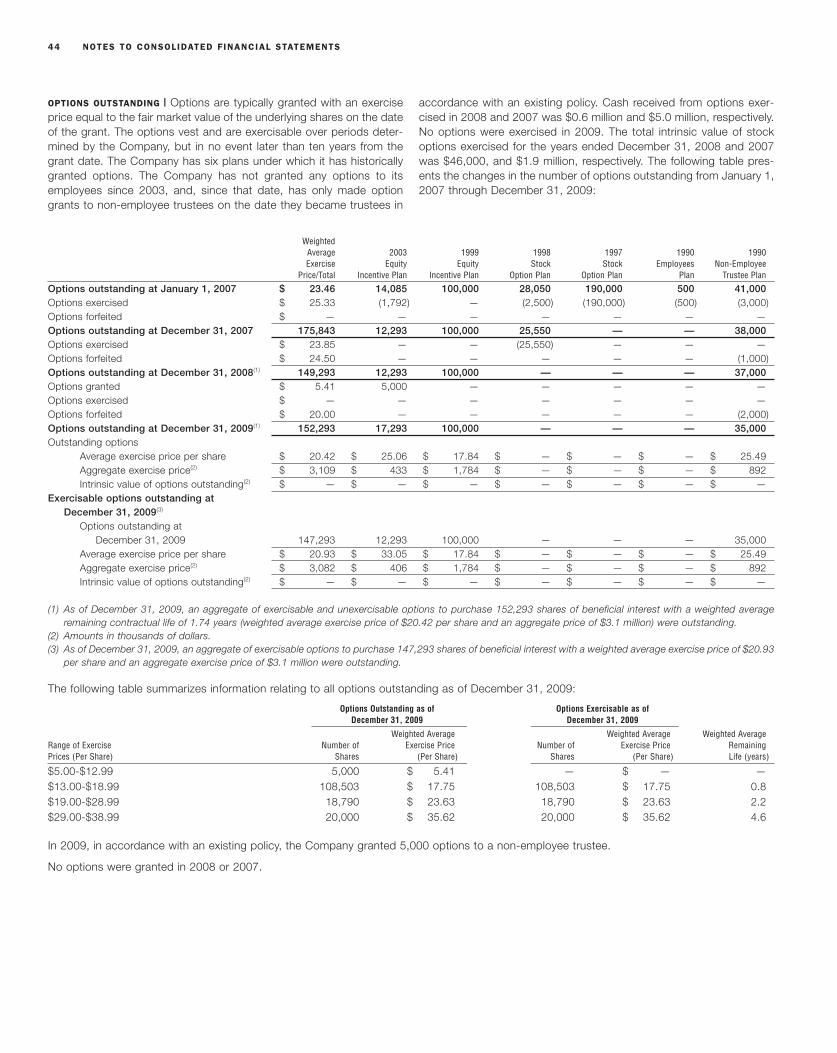
44 NOTES TO CONSOLIDATED FINANCIAL STATEMENTS
WeightedAverage 2003 1999 1998 1997 1990 1990Exercise Equity Equity Stock Stock Employees Non-Employee
Price/Total Incentive Plan Incentive Plan Option Plan Option Plan Plan Trustee Plan
Options outstanding at January 1, 2007 $ 23.46 14,085 100,000 28,050 190,000 500 41,000Options exercised $ 25.33 (1,792) — (2,500) (190,000) (500) (3,000)Options forfeited $ — — — — — — —Options outstanding at December 31, 2007 175,843 12,293 100,000 25,550 — — 38,000Options exercised $ 23.85 — — (25,550) — — —Options forfeited $ 24.50 — — — — — (1,000)Options outstanding at December 31, 2008(1) 149,293 12,293 100,000 — — — 37,000Options granted $ 5.41 5,000 — — — — —Options exercised $ — — — — — — —Options forfeited $ 20.00 — — — — — (2,000)Options outstanding at December 31, 2009(1) 152,293 17,293 100,000 — — — 35,000Outstanding options
Average exercise price per share $ 20.42 $ 25.06 $ 17.84 $ — $ — $ — $ 25.49Aggregate exercise price(2) $ 3,109 $ 433 $ 1,784 $ — $ — $ — $ 892Intrinsic value of options outstanding(2) $ — $ — $ — $ — $ — $ — $ —
Exercisable options outstanding atDecember 31, 2009(3)
Options outstanding atDecember 31, 2009 147,293 12,293 100,000 — — — 35,000
Average exercise price per share $ 20.93 $ 33.05 $ 17.84 $ — $ — $ — $ 25.49Aggregate exercise price(2) $ 3,082 $ 406 $ 1,784 $ — $ — $ — $ 892Intrinsic value of options outstanding(2) $ — $ — $ — $ — $ — $ — $ —
(1) As of December 31, 2009, an aggregate of exercisable and unexercisable options to purchase 152,293 shares of beneficial interest with a weighted averageremaining contractual life of 1.74 years (weighted average exercise price of $20.42 per share and an aggregate price of $3.1 million) were outstanding.
(2) Amounts in thousands of dollars.(3) As of December 31, 2009, an aggregate of exercisable options to purchase 147,293 shares of beneficial interest with a weighted average exercise price of $20.93
per share and an aggregate exercise price of $3.1 million were outstanding.
The following table summarizes information relating to all options outstanding as of December 31, 2009:
Options Outstanding as of Options Exercisable as ofDecember 31, 2009 December 31, 2009
Weighted Average Weighted Average Weighted AverageRange of Exercise Number of Exercise Price Number of Exercise Price RemainingPrices (Per Share) Shares (Per Share) Shares (Per Share) Life (years)
$5.00-$12.99 5,000 $ 5.41 — $ — —$13.00-$18.99 108,503 $ 17.75 108,503 $ 17.75 0.8$19.00-$28.99 18,790 $ 23.63 18,790 $ 23.63 2.2$29.00-$38.99 20,000 $ 35.62 20,000 $ 35.62 4.6
In 2009, in accordance with an existing policy, the Company granted 5,000 options to a non-employee trustee.
No options were granted in 2008 or 2007.
OPTIONS OUTSTANDING | Options are typically granted with an exerciseprice equal to the fair market value of the underlying shares on the dateof the grant. The options vest and are exercisable over periods deter-mined by the Company, but in no event later than ten years from thegrant date. The Company has six plans under which it has historicallygranted options. The Company has not granted any options to itsemployees since 2003, and, since that date, has only made optiongrants to non-employee trustees on the date they became trustees in
accordance with an existing policy. Cash received from options exer-cised in 2008 and 2007 was $0.6 million and $5.0 million, respectively.No options were exercised in 2009. The total intrinsic value of stockoptions exercised for the years ended December 31, 2008 and 2007was $46,000, and $1.9 million, respectively. The following table pres-ents the changes in the number of options outstanding from January 1,2007 through December 31, 2009:

PENNSYLVANIA REAL ESTATE INVESTMENT TRUST 2009 ANNUAL REPORT 45
10. Leases
AS LESSOR | The Company’s retail properties are leased to tenantsunder operating leases with various expiration dates ranging through2099. Future minimum rent under noncancelable operating leases withterms greater than one year are as follows:
(in thousands of dollars)For the Year Ended December 31,
2010 $ 271,3052011 236,4672012 197,0382013 173,9132014 154,4822015 and thereafter 586,413
$ 1,619,618
The total future minimum rent as presented does not include amountsthat may be received as tenant reimbursements for certain operatingcosts or contingent amounts that may be received as percentage rent.
AS LESSEE | Assets recorded under capital leases, primarily office andmall equipment, are capitalized using interest rates appropriate at theinception of each lease. The Company also has operating leases for itscorporate office space (see note 11) and for various computer, officeand mall equipment. Furthermore, the Company is the lessee underthird-party ground leases for portions of the land at seven of its prop-erties (Crossroads Mall, Voorhees Town Center, Exton Square Mall, TheGallery at Market East, Orlando Fashion Square, Plymouth MeetingMall and Uniontown Mall). Total amounts expensed relating to leaseswere $4.8 million for each of the years ended December 31, 2009,2008 and 2007, respectively. The Company accounts for ground rentand capital lease expense on a straight line basis. Minimum futurelease payments due in each of the next five years and thereafter are asfollows:
(in thousands of dollars) Operating GroundFor the Year Ended December 31, Leases Leases
2010 $ 2,263 $ 9922011 2,089 9922012 1,874 8532013 1,626 7242014 1,263 7362015 and thereafter — 49,146
$ 9,115 $ 53,443
The Company had assets of $0.2 million and $0.4 million (net of accu-mulated depreciation of $3.5 million and $3.3 million, respectively)recorded under capital leases as of December 31, 2009 and 2008,respectively.
11. Related Party Transactions
GENERAL | PRI provides management, leasing and development serv-ices for eight properties owned by partnerships and other entities inwhich certain officers or trustees of the Company and of PRI ormembers of their immediate families and affiliated entities have indirectownership interests. Total revenue earned by PRI for such services was$0.9 million, $1.1 million and $0.9 million for the years endedDecember 31, 2009, 2008 and 2007, respectively. As of December 31,2009, $0.2 million was due from the property-owning partnerships toPRI.
The Company leases its principal executive offices from BellevueAssociates (the “Landlord”), an entity in which certain officers/trusteesof the Company have an interest. Total rent expense under this leasewas $1.6 million for each of the years ended December 31, 2009,2008, and 2007. Ronald Rubin and George F. Rubin, collectively withmembers of their immediate families and affiliated entities, own approx-imately a 50% interest in the Landlord. The office lease has a 10 yearterm that commenced on November 1, 2004. The Company has theoption to renew the lease for up to two additional five-year periods atthe then-current fair market rate calculated in accordance with theterms of the office lease. In addition, the Company has the right on oneoccasion at any time during the seventh lease year (2011) to terminatethe office lease upon the satisfaction of certain conditions. EffectiveJune 1, 2004, the Company’s base rent was $1.4 million per yearduring the first five years of the office lease and is $1.5 million per yearduring the second five years.
The Company uses an airplane in which Ronald Rubin owns a frac-tional interest. The Company did not incur any expenses in 2009 forthis service. The Company paid $174,000 and $35,000 in the yearsended December 31, 2008 and 2007, respectively, for flight time usedby employees exclusively for Company-related business.
As of December 31, 2009, nine officers of the Company had employ-ment agreements with terms of one year that renew automatically foradditional one-year terms. Their 2008 employment agreements pro-vided for aggregate base compensation for the year ended December31, 2009 of $3.4 million, subject to increases as approved by theCompany’s Board compensation committee in future years, as well asadditional incentive compensation.
See “Tax Protection Agreements” in note 12.
BALA CYNWYD ASSOCIATES, L.P. | On January 22, 2008, PREIT, PREITAssociates, L.P. and another subsidiary of PREIT entered into aContribution Agreement with Bala Cynwyd Associates, L.P. (“BCA”),City Line Associates (“CLA”), Ronald Rubin, George F. Rubin, JosephF. Coradino, and two other individuals to acquire all of the partnershipinterests in BCA. BCA had also entered into a tax deferred exchangeagreement with the owners of One Cherry Hill Plaza, an office buildinglocated within the boundaries of PREIT’s Cherry Hill Mall (the “OfficeBuilding”), to acquire title to the Office Building in exchange for an officebuilding located in Bala Cynwyd, Pennsylvania owned by BCA.
Ronald Rubin, George F. Rubin, Joseph F. Coradino and two other indi-viduals owned 100% of CLA, which in turn directly or indirectly owned100% of BCA immediately prior to the initial closing. Each of RonaldRubin and George F. Rubin owned 40.53% of the partnership interests

46 NOTES TO CONSOLIDATED FINANCIAL STATEMENTS
in CLA, and Joseph F. Coradino owned 3.16% of the partnership inter-ests. At the initial closing under the Contribution Agreement in 2008and in exchange for a 0.1% general partner interest and 49.8% limitedpartner interest in BCA, PREIT made a capital contribution to BCA inan approximate amount of $3.93 million.
In June 2009, a second closing occurred pursuant to a put/callarrangement, at which time PREIT acquired an additional 49.9% of thelimited partner interest in BCA for approximately $199,000 in cash and140,745 units of Class A limited partnership interest (“OP Units”) inPREIT Associates, L.P. A third closing is expected to occur pursuant toa put/call arrangement approximately one year after the secondclosing, at which time the remaining interest in BCA will be acquired byPREIT in exchange for approximately $1,000 in cash and 564 OPUnits. None of Ronald Rubin, George F. Rubin or Joseph F. Coradinoreceived any consideration from PREIT in connection with the firstclosing. At the second closing, Ronald Rubin received 60,208 OPUnits, George Rubin received 60,208 OP Units, and Joseph Coradinoreceived 4,691 OP Units.
The acquisition of the Office Building was financed in part by a mort-gage loan in the principal amount of $8.0 million.
In accordance with PREIT’s related party transactions policy, a specialcommittee consisting exclusively of independent members of PREIT’sBoard of Trustees considered and approved the terms of the transac-tion. The approval was subject to final approval of PREIT’s Board ofTrustees, and the disinterested members of PREIT’s Board of Trusteesapproved the transaction.
12. Commitments And Contingencies
DEVELOPMENT AND REDEVELOPMENT ACTIVITIES | In connection with itscurrent ground-up development and its redevelopment projects, theCompany has made contractual commitments on some of these proj-ects in the form of tenant allowances, lease termination fees andcontracts with general contractors and other professional serviceproviders. As of December 31, 2009, the remainder to be paid (exclud-ing amounts already accrued) against such contractual and othercommitments was $2.3 million, which is expected to be financedthrough the 2010 Credit Facility or through various other capitalsources.
LEGAL ACTIONS | In the normal course of business, the Company hasand may become involved in legal actions relating to the ownership andoperation of its properties and the properties it manages for thirdparties. In management’s opinion, the resolutions of any such pendinglegal actions are not expected to have a material adverse effect on theCompany’s consolidated financial position or results of operations.
ENVIRONMENTAL | The Company is aware of certain environmentalmatters at some of its properties, including ground water contamina-tion and the presence of asbestos containing materials. The Companyhas, in the past, performed remediation of such environmental matters,and is not aware of any significant remaining potential liability relatingto these environmental matters. The Company may be required in thefuture to perform testing relating to these matters. The Company doesnot expect these matters to have any significant impact on its liquidityor results of operations. However, the Company can provide no assur-ance that the amounts reserved will be adequate to cover furtherenvironmental costs. The Company has insurance coverage for certainenvironmental claims up to $10.0 million per occurrence and up to$20.0 million in the aggregate.
TAX PROTECTION AGREEMENTS | As part of the BCA transaction, theCompany and PREIT Associates have agreed to indemnify certain ofthe owners of CLA, including Ronald Rubin, George Rubin and JosephCoradino, from and against certain tax liabilities resulting from a sale ofthe office building that was involved in the BCA transaction during theeight years following the initial closing.
The Company has agreed to provide tax protection related to its acqui-sition of Cumberland Mall Associates in 2005 and New CastleAssociates in 2003 and 2004 to the prior owners of Cumberland MallAssociates and New Castle Associates, respectively, for a period ofeight years following the respective closings. Ronald Rubin and GeorgeF. Rubin are beneficiaries of these tax protection agreements.
The Company did not enter into any other guarantees or tax protectionagreements in connection with its merger, acquisition or dispositionactivities in 2009, 2008 and 2007.
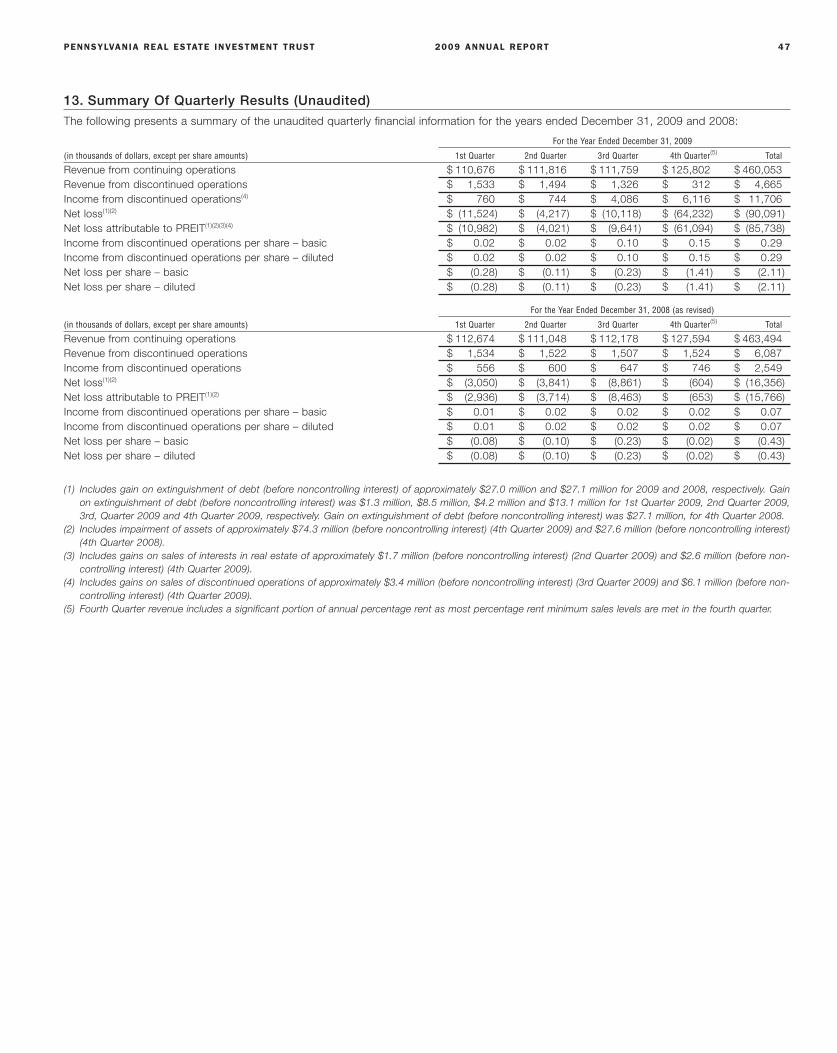
PENNSYLVANIA REAL ESTATE INVESTMENT TRUST 2009 ANNUAL REPORT 47
13. Summary Of Quarterly Results (Unaudited)
The following presents a summary of the unaudited quarterly financial information for the years ended December 31, 2009 and 2008:
For the Year Ended December 31, 2009
(in thousands of dollars, except per share amounts) 1st Quarter 2nd Quarter 3rd Quarter 4th Quarter(5) Total
Revenue from continuing operations $ 110,676 $ 111,816 $ 111,759 $ 125,802 $ 460,053Revenue from discontinued operations $ 1,533 $ 1,494 $ 1,326 $ 312 $ 4,665Income from discontinued operations(4) $ 760 $ 744 $ 4,086 $ 6,116 $ 11,706Net loss(1)(2) $ (11,524) $ (4,217) $ (10,118) $ (64,232) $ (90,091)Net loss attributable to PREIT(1)(2)(3)(4) $ (10,982) $ (4,021) $ (9,641) $ (61,094) $ (85,738)Income from discontinued operations per share – basic $ 0.02 $ 0.02 $ 0.10 $ 0.15 $ 0.29Income from discontinued operations per share – diluted $ 0.02 $ 0.02 $ 0.10 $ 0.15 $ 0.29Net loss per share – basic $ (0.28) $ (0.11) $ (0.23) $ (1.41) $ (2.11)Net loss per share – diluted $ (0.28) $ (0.11) $ (0.23) $ (1.41) $ (2.11)
For the Year Ended December 31, 2008 (as revised)
(in thousands of dollars, except per share amounts) 1st Quarter 2nd Quarter 3rd Quarter 4th Quarter(5) Total
Revenue from continuing operations $ 112,674 $ 111,048 $ 112,178 $ 127,594 $ 463,494Revenue from discontinued operations $ 1,534 $ 1,522 $ 1,507 $ 1,524 $ 6,087Income from discontinued operations $ 556 $ 600 $ 647 $ 746 $ 2,549Net loss(1)(2) $ (3,050) $ (3,841) $ (8,861) $ (604) $ (16,356)Net loss attributable to PREIT(1)(2) $ (2,936) $ (3,714) $ (8,463) $ (653) $ (15,766)Income from discontinued operations per share – basic $ 0.01 $ 0.02 $ 0.02 $ 0.02 $ 0.07Income from discontinued operations per share – diluted $ 0.01 $ 0.02 $ 0.02 $ 0.02 $ 0.07Net loss per share – basic $ (0.08) $ (0.10) $ (0.23) $ (0.02) $ (0.43)Net loss per share – diluted $ (0.08) $ (0.10) $ (0.23) $ (0.02) $ (0.43)
(1) Includes gain on extinguishment of debt (before noncontrolling interest) of approximately $27.0 million and $27.1 million for 2009 and 2008, respectively. Gainon extinguishment of debt (before noncontrolling interest) was $1.3 million, $8.5 million, $4.2 million and $13.1 million for 1st Quarter 2009, 2nd Quarter 2009,3rd, Quarter 2009 and 4th Quarter 2009, respectively. Gain on extinguishment of debt (before noncontrolling interest) was $27.1 million, for 4th Quarter 2008.
(2) Includes impairment of assets of approximately $74.3 million (before noncontrolling interest) (4th Quarter 2009) and $27.6 million (before noncontrolling interest)(4th Quarter 2008).
(3) Includes gains on sales of interests in real estate of approximately $1.7 million (before noncontrolling interest) (2nd Quarter 2009) and $2.6 million (before non-controlling interest) (4th Quarter 2009).
(4) Includes gains on sales of discontinued operations of approximately $3.4 million (before noncontrolling interest) (3rd Quarter 2009) and $6.1 million (before non-controlling interest) (4th Quarter 2009).
(5) Fourth Quarter revenue includes a significant portion of annual percentage rent as most percentage rent minimum sales levels are met in the fourth quarter.
48 MANAGEMENT’S REPORT ON INTERNAL CONTROL OVER FINANCIAL REPORTING
Management’s Report on Internal ControlOver Financial ReportingManagement of Pennsylvania Real Estate Investment Trust (“us” or the“Company”) is responsible for establishing and maintaining adequateinternal control over financial reporting. As defined in the rules of theSecurities and Exchange Commission, internal control over financialreporting is a process designed by, or under the supervision of, ourprincipal executive and principal financial officers and effected by ourBoard of Trustees, management and other personnel, to provide rea-sonable assurance regarding the reliability of financial reporting and thepreparation of consolidated financial statements for external purposesin accordance with U.S. generally accepted accounting principles.
Our internal control over financial reporting includes those policies andprocedures that:
(1) Pertain to the maintenance of records that, in reasonable detail,accurately and fairly reflect the Company’s transactions and the dis-positions of assets of the Company;
(2) Provide reasonable assurance that transactions are recorded asnecessary to permit preparation of consolidated financial state-ments in accordance with generally accepted accounting principles,and that receipts and expenditures of the Company are being madeonly in accordance with authorizations of the Company’s manage-ment and trustees; and
(3) Provide reasonable assurance regarding prevention or timely detec-tion of unauthorized acquisition, use or disposition of theCompany’s assets that could have a material effect on the financialstatements.
Because of its inherent limitations, a system of internal control overfinancial reporting can provide only reasonable assurance with respectto financial statement preparation and presentation and may notprevent or detect misstatements. Also, projections of any evaluation ofeffectiveness to future periods are subject to the risk that controls maybecome inadequate because of changes in conditions, or that thedegree of compliance with the policies or procedures may deteriorate.
In connection with the preparation of the Company’s annual consoli-dated financial statements, management has conducted anassessment of the effectiveness of our internal control over financialreporting based on the framework set forth in Internal Control—Integrated Framework issued by the Committee of SponsoringOrganizations of the Treadway Commission (COSO). Management’sassessment included an evaluation of the design of the Company’sinternal control over financial reporting and testing of the operationaleffectiveness of those controls. Based on this evaluation, we have con-cluded that, as of December 31, 2009, our internal control overfinancial reporting was effective to provide reasonable assuranceregarding the reliability of financial reporting and the preparation offinancial statements for external purposes in accordance with U.S.generally accepted accounting principles.
Our independent registered public accounting firm, KPMG LLP, inde-pendently assessed the effectiveness of the Company’s internal controlover financial reporting. KPMG has issued a report concurring withmanagement’s assessment, which is included on page 48 inthis report.
Report of Independent Registered PublicAccounting FirmThe Board of Trustees and ShareholdersPennsylvania Real Estate Investment Trust:
We have audited the accompanying consolidated balance sheets ofPennsylvania Real Estate Investment Trust (a Pennsylvania businesstrust) and subsidiaries as of December 31, 2009 and 2008, and therelated consolidated statements of operations, equity and comprehen-sive income, and cash flows for each of the years in the three-yearperiod ended December 31, 2009. These consolidated financial state-ments are the responsibility of the Company’s management. Ourresponsibility is to express an opinion on these consolidated financialstatements based on our audits.
We conducted our audits in accordance with the standards of thePublic Company Accounting Oversight Board (United States). Thosestandards require that we plan and perform the audit to obtain reason-able assurance about whether the financial statements are free ofmaterial misstatement. An audit includes examining, on a test basis,evidence supporting the amounts and disclosures in the financial state-ments. An audit also includes assessing the accounting principles usedand significant estimates made by management, as well as evaluatingthe overall financial statement presentation. We believe that our auditsprovide a reasonable basis for our opinion.
In our opinion, the consolidated financial statements referred to abovepresent fairly, in all material respects, the financial position ofPennsylvania Real Estate Investment Trust and subsidiaries as ofDecember 31, 2009 and 2008, and the results of their operations andtheir cash flows for each of the years in the three-year period endedDecember 31, 2009, in conformity with U.S. generally acceptedaccounting principles.
As discussed in Note 1 to the consolidated financial statements, theCompany has changed its method of accounting for noncontrollinginterests and Exchangeable Notes due to the adoption of FASBAccounting Standard 160 Noncontrolling Interests In ConsolidatedFinancial Statements and FASB Staff Positions 14-1 Accounting ForConvertible Debt Instruments That May Be Settled in Cash UponConversion (Including Partial Cash Settlement), respectively, (includedin FASB ASC Topics 805 Business Combinations and 470 Debt,respectively) as of January 1, 2009.
We also have audited, in accordance with the standards of the PublicCompany Accounting Oversight Board (United States), PennsylvaniaReal Estate Investment Trust’s internal control over financial reportingas of December 31, 2009, based on criteria established in InternalControl—Integrated Framework issued by the Committee ofSponsoring Organizations of the Treadway Commission (COSO), andour report dated March 15, 2010 expressed an unqualified opinion onthe effectiveness of the Company’s internal control over financialreporting.
KPMG LLP
Philadelphia, PennsylvaniaMarch 15, 2010
PENNSYLVANIA REAL ESTATE INVESTMENT TRUST 2009 ANNUAL REPORT 49
Report of Independent Registered Public Accounting FirmThe Board of Trustees and ShareholdersPennsylvania Real Estate Investment Trust:
We have audited Pennsylvania Real Estate Investment Trust’s internalcontrol over financial reporting as of December 31, 2009, based on cri-teria established in Internal Control—Integrated Framework issued bythe Committee of Sponsoring Organizations of the TreadwayCommission (COSO). Pennsylvania Real Estate Investment Trust’smanagement is responsible for maintaining effective internal controlover financial reporting and for its assessment of the effectiveness ofinternal control over financial reporting, included in the accompanyingManagement’s Report on Internal Control Over Financial Reporting.Our responsibility is to express an opinion on the Company’s internalcontrol over financial reporting based on our audit.
We conducted our audit in accordance with the standards of the PublicCompany Accounting Oversight Board (United States). Those stan-dards require that we plan and perform the audit to obtain reasonableassurance about whether effective internal control over financial report-ing was maintained in all material respects. Our audit includedobtaining an understanding of internal control over financial reporting,assessing the risk that a material weakness exists, and testing andevaluating the design and operating effectiveness of internal controlbased on the assessed risk. Our audit also included performing suchother procedures as we considered necessary in the circumstances.We believe that our audit provides a reasonable basis for our opinion.
A company’s internal control over financial reporting is a processdesigned to provide reasonable assurance regarding the reliability offinancial reporting and the preparation of financial statements for exter-nal purposes in accordance with generally accepted accountingprinciples. A company’s internal control over financial reportingincludes those policies and procedures that (1) pertain to the mainte-nance of records that, in reasonable detail, accurately and fairly reflectthe transactions and dispositions of the assets of the company; (2)provide reasonable assurance that transactions are recorded as neces-sary to permit preparation of consolidated financial statements inaccordance with generally accepted accounting principles, and thatreceipts and expenditures of the company are being made only inaccordance with authorizations of management and trustees of thecompany; and (3) provide reasonable assurance regarding preventionor timely detection of unauthorized acquisition, use, or disposition ofthe company’s assets that could have a material effect on the financialstatements.
Because of its inherent limitations, internal control over financial report-ing may not prevent or detect misstatements. Also, projections of anyevaluation of effectiveness to future periods are subject to the risk thatcontrols may become inadequate because of changes in conditions, orthat the degree of compliance with the policies or procedures maydeteriorate.
In our opinion, Pennsylvania Real Estate Investment Trust maintained,in all material respects, effective internal control over financial reportingas of December 31, 2009, based on criteria established in InternalControl—Integrated Framework issued by the Committee ofSponsoring Organizations of the Treadway Commission.
We also have audited, in accordance with the standards of the PublicCompany Accounting Oversight Board (United States), the consoli-dated balance sheets of Pennsylvania Real Estate Investment Trust andsubsidiaries as of December 31, 2009 and 2008, and the related con-solidated statements of operations, equity and comprehensive income,and cash flows for each of the years in the three-year period endedDecember 31, 2009, and our report dated March 15, 2010 expressedan unqualified opinion on those consolidated financial statements.
KPMG LLP
Philadelphia, PennsylvaniaMarch 15, 2010

50 MANAGEMENT’S DISCUSSION AND ANALYSIS
The following analysis of our consolidated financial condition and results of oper-
ations should be read in conjunction with our consolidated financial statements
and the notes thereto included elsewhere in this report.
Overview
Pennsylvania Real Estate Investment Trust, a Pennsylvania businesstrust founded in 1960 and one of the first equity REITs in the UnitedStates, has a primary investment focus on retail shopping malls andstrip and power centers located in the eastern half of the United States,primarily in the Mid-Atlantic region. Our portfolio currently consists of atotal of 54 properties in 13 states, including 38 shopping malls, 13 stripand power centers and three properties under development. The oper-ating retail properties have a total of approximately 34.6 million squarefeet. The operating retail properties that we consolidate for financialreporting purposes have a total of approximately 30.1 million squarefeet, of which we own approximately 23.8 million square feet. The oper-ating retail properties that are owned by unconsolidated partnershipswith third parties have a total of approximately 4.5 million square feet, ofwhich 2.9 million square feet are owned by such partnerships. Theground-up development portion of our portfolio contains three proper-ties in two states, with two classified as “mixed use” (a combination ofretail and other uses) and one classified as “other.”
Our primary business is owning and operating shopping malls and stripand power centers. We evaluate operating results and allocateresources on a property-by-property basis, and do not distinguish orevaluate our consolidated operations on a geographic basis. No individ-ual property constitutes more than 10% of our consolidated revenue orassets, and thus the individual properties have been aggregated intoone reportable segment based upon their similarities with regard to thenature of our properties and the nature of our tenants and operationalprocesses, as well as long-term financial performance. In addition, nosingle tenant accounts for 10% or more of our consolidated revenue,and none of our properties are located outside the United States.
We hold our interests in our portfolio of properties through our operat-ing partnership, PREIT Associates, L.P. (“PREIT Associates”). We arethe sole general partner of PREIT Associates and, as of December 31,2009, held a 95.0% controlling interest in PREIT Associates. We con-solidate PREIT Associates for financial reporting purposes. We hold ourinvestments in seven of the 51 retail properties and one of the threeground-up development properties in our portfolio through unconsoli-dated partnerships with third parties in which we own a 40% to 50%interest. We hold a non-controlling interest in each unconsolidated part-nership, and account for such partnerships using the equity method ofaccounting. We do not control any of these equity method investees forthe following reasons:
• Except for two properties that we co-manage with our partner, all ofthe other entities are managed on a day-to-day basis by one of ourother partners as the managing general partner in each of therespective partnerships. In the case of the co-managed properties,all decisions in the ordinary course of business are made jointly.
• The managing general partner is responsible for establishing theoperating and capital decisions of the partnership, includingbudgets, in the ordinary course of business.
• All major decisions of each partnership, such as the sale, refinanc-ing, expansion or rehabilitation of the property, require the approvalof all partners.
• Voting rights and the sharing of profits and losses are generally inproportion to the ownership percentages of each partner.
We record the earnings from the unconsolidated partnerships using theequity method of accounting under the income statement caption enti-tled “Equity in income of partnerships,” rather than consolidating theresults of the unconsolidated partnerships with our results. Changes inour investments in these entities are recorded in the balance sheetcaption entitled “Investment in partnerships, at equity.” In the case ofdeficit investment balances, such amounts are recorded in“Investments in partnerships, deficit balances.”
We hold our interest in three of our unconsolidated partnershipsthrough tenancy in common arrangements. For each of these proper-ties, title is held by us and another person or persons, and each has anundivided interest in the property. With respect to each of the threeproperties, under the applicable agreements between us and the otherpersons with ownership interests, we and such other persons havejoint control because decisions regarding matters such as the sale, refi-nancing, expansion or rehabilitation of the property require theapproval of both us and the other person (or at least one of the otherpersons) owning an interest in the property. Hence, we account foreach of the properties using the equity method of accounting. Thebalance sheet items arising from these properties appear under thecaption “Investments in partnerships, at equity.” The income statementitems arising from these properties appear in “Equity in incomeof partnerships.”
For further information regarding our unconsolidated partnerships, seenote 3 to our consolidated financial statements.
We provide our management, leasing and real estate developmentservices through PREIT Services, LLC (“PREIT Services”), which gen-erally develops and manages properties that we consolidate forfinancial reporting purposes, and PREIT-RUBIN, Inc. (“PRI”), whichgenerally develops and manages properties that we do not consolidatefor financial reporting purposes, including properties we own interestsin through partnerships with third parties and properties that are ownedby third parties in which we do not have an interest. PRI is a taxableREIT subsidiary, as defined by federal tax laws, which means that it isable to offer an expanded menu of services to tenants without jeopard-izing our continuing qualification as a REIT under federal tax law.
Our revenue consists primarily of fixed rental income, additional rent inthe form of expense reimbursements, and percentage rent (rent that isbased on a percentage of our tenants’ sales or a percentage of salesin excess of thresholds that are specified in the leases) derived fromour income producing retail properties. We also receive income fromour real estate partnership investments and from the management andleasing services PRI provides.
Our net loss increased by $73.7 million to a net loss of $90.1 million forthe year ended December 31, 2009 from a net loss of $16.4 million forthe year ended December 31, 2008. The increase in the loss wasaffected by challenging conditions in the economy, the impairment ofassets, the effects of ongoing redevelopment initiatives, increased
Management’s Discussion and Analysis ofFinancial Condition and Results of Operations
PENNSYLVANIA REAL ESTATE INVESTMENT TRUST 2009 ANNUAL REPORT 51
depreciation and amortization and interest expense as a result of devel-opment and redevelopment assets having been placed in service,increased interest expense as a result of a higher aggregate debtbalance and increased property operating expenses compared to theyear ended December 31, 2008. These factors were offset by gains onthe extinguishment of debt in connection with repurchases of a portionof our 4% Senior Exchangeable Notes due in 2012 (“ExchangeableNotes”).
CURRENT ECONOMIC DOWNTURN, CHALLENGING CAPITAL MARKET
CONDITIONS, OUR LEVERAGE AND OUR NEAR TERM CAPITAL NEEDS | Thedownturn in the overall economy and the disruptions in the financialmarkets have reduced consumer confidence and negatively affectedemployment and consumer spending on retail goods. As a result, thesales and profit performance of retailers in general has decreased, salesat our properties in particular have decreased, and we have experienceddelays or deferred decisions regarding the openings of new retail storesand of lease renewals. We are adjusting our plans and actions to takeinto account the difficult current environment.
In addition, credit markets have experienced significant dislocations andliquidity disruptions. These circumstances have materially affected liq-uidity in the debt markets, making financing terms for borrowers lessattractive, and in certain cases have resulted in the limited availability orunavailability of certain types of debt financing.
The difficult conditions in the market for debt capital and commercialmortgage loans, including the commercial mortgage backed securitiesmarket, and the downturn in the general economy and its effect on retailsales, as well as our significant leverage resulting from use of debt tofund our redevelopment program and other development activity, havecombined to necessitate that we vary our approach to obtaining, usingand recycling capital. We intend to consider all of our available optionsfor accessing the capital markets, given our position and constraints.
The amounts remaining to be invested in the last phases of our currentredevelopment projects are significantly less than in 2009, andwe believe that we have access to sufficient capital to fund theseremaining amounts.
We are contemplating ways to reduce our leverage through a variety ofmeans available to us, and subject to and in accordance with the termsof the 2010 Credit Facility. These steps might include obtaining equitycapital, including through the issuance of equity securities if market con-ditions are favorable, through joint ventures or other partnerships orarrangements involving our contribution of assets with institutionalinvestors, private equity investors or other REITs, through sales of prop-erties with values in excess of their mortgage loans or allocable debtand application of the excess proceeds to debt reduction, or throughother actions.
2009 DISPOSITIONS | In May 2009, we sold an outparcel and relatedland improvements containing an operating restaurant at MonroeMarketplace in Selinsgrove, Pennsylvania for $0.9 million. We recordedan asset impairment charge of $0.1 million immediately prior to thistransaction. No gain or loss was recorded from this sale.
In June 2009, we sold two outparcels and related improvements adja-cent to North Hanover Mall in Hanover, Pennsylvania for $2.0 million.We recorded a gain of $1.4 million from this sale.
In June 2009, we sold a land parcel adjacent to Woodland Mall inGrand Rapids, Michigan for $2.7 million. The parcel contained a
department store that was subject to a ground lease. We recorded again of $0.2 million from this sale.
In August 2009, we sold Crest Plaza in Allentown, Pennsylvania for$15.8 million. We recorded a gain of $3.4 million from this sale.
In October 2009, we sold two outparcels and related improvementsadjacent to Monroe Marketplace in Selinsgrove, Pennsylvania for $2.8million. No gain or loss was recorded from this sale.
In October 2009, we sold a parcel and related land improvements atPitney Road Plaza in Lancaster, Pennsylvania for $10.2 million. Theparcel contained a home improvement store that was subject to aground lease. We recorded a gain of $2.7 million from this sale.
In October 2009, we sold a controlling interest in Northeast TowerCenter in Philadelphia, Pennsylvania, for $30.4 million. We recorded again of $6.1 million from this sale. In connection with the sale, werepaid the mortgage loan associated with Northeast Tower Center, witha balance of $20.0 million at closing.
2007 DISPOSITIONS | In March 2007, we sold Schuylkill Mall inFrackville, Pennsylvania for $17.6 million. We recorded a $6.7 milliongain on the sale. In connection with the sale, we repaid the mortgageloan associated with Schuylkill Mall, with a balance of $16.5 million atclosing.
In May 2007, we sold an outparcel and related land improvements con-taining an operating restaurant at New River Valley Mall inChristiansburg, Virginia for $1.6 million. We recorded a $0.6 million gainfrom this sale.
In May 2007, we sold an outparcel and related land improvements atPlaza at Magnolia in Florence, South Carolina for $11.3 million. Werecorded a $1.5 million gain from this sale.
In August 2007, we sold undeveloped land adjacent to WiregrassCommons Mall in Dothan, Alabama for $2.1 million. We recorded a$0.3 million gain from this sale.
In December 2007, we sold undeveloped land in Monroe Township,Pennsylvania for $0.8 million. There was no gain or loss recorded fromthis sale.
2009 AND 2008 ACQUISITIONS | In February 2008, we acquired a 49.9%ownership interest in Bala Cynwyd Associates, L.P. See “Related PartyTransactions” for further information about this transaction. In June2009, we acquired an additional 49.9% ownership interest.
In July 2008, we acquired a parcel in Lancaster, Pennsylvania for $8.0million plus customary closing costs. We developed this property andit is currently operating as Pitney Road Plaza.
In July 2008, we acquired land previously subject to a ground leaselocated at Wiregrass Commons in Dothan, Alabama for $3.2 million.
2007 ACQUISITIONS | In August 2007, we purchased a 116 acre landparcel in Monroe Township, Pennsylvania for $5.5 million. We had pre-viously acquired an aggregate of approximately 10 acres on adjacentparcels. We developed this property and it is currently operating asMonroe Marketplace.
In August 2007, we purchased Plymouth Commons, a 60,000 squarefoot office building adjacent to Plymouth Meeting Mall, for $9.2 million.

52 MANAGEMENT’S DISCUSSION AND ANALYSIS
DEVELOPMENT AND REDEVELOPMENT | We have reached the last phasesof the projects in our current redevelopment program. Since the begin-ning of 2009, we reached several major milestones for four of ourlargest projects, including the opening of Nordstrom and the restau-rants of Bistro Row at Cherry Hill Mall, the opening of Whole FoodsMarket and Café at Plymouth Meeting Mall, the opening of the officesof the Commonwealth of Pennsylvania at The Gallery at Market Eastand the opening of retail and office space at Voorhees Town Center. Wealso completed the redevelopment of Wiregrass Commons Mall withthe second of two new anchors opening in 2009.
The following table sets forth the amount of the currently estimatedproject cost and the amount invested as of December 31, 2009 foreach ongoing redevelopment project:
Estimated Invested as ofRedevelopment Project Project Cost(1) December 31, 2009
Cherry Hill Mall $ 218.0 million $ 211.3 millionPlymouth Meeting Mall 97.7 million 90.5 millionThe Gallery at Market East 81.6 million 81.5 millionVoorhees Town Center 83.0 million 67.6 million
$ 450.9 million
(1) Our projected share of costs is net of any expected tenant reimbursements,parcel sales, tax credits or other incentives.
We are engaged in the ground-up development of three mixed use andother projects, although we do not expect to make material invest-ments in these projects in the short term. As of December 31, 2009,we had incurred $77.6 million of costs related to these three projects.The details of the White Clay Point, Springhills and Pavilion at MarketEast projects and related costs have not been determined. In eachcase, we will evaluate the financing opportunities available to us at thetime a project requires funding. In cases where the project is under-taken with a partner, our flexibility in funding the project might begoverned by the partnership agreement or the covenants contained inour 2010 Credit Facility, which limit our involvement in such projects.
The following table sets forth the amount of our intended investmentand the amounts invested as of December 31, 2009 in each ground-up development project:
Invested as ofDevelopment Project December 31, 2009
White Clay Point(1) $ 43.5 millionSpringhills(2) 33.4 millionPavilion at Market East(3) 0.7 million
$ 77.6 million
(1) Amount invested as of December 31, 2009 does not reflect an $11.8 millionimpairment charge that we recorded in December 2008. See the notes to ourconsolidated financial statements for further discussion of this charge.
(2) Amount invested as of December 31, 2009 does not reflect an $11.5 millionimpairment charge that we recorded in 2009. See the notes to our consoli-dated financial statements for further discussion of this charge.
(3) The property is unconsolidated. The amount shown represents our share.
In connection with our current redevelopment and ground-up develop-ment projects, we have made contractual and other commitments onthese projects in the form of tenant allowances, lease termination feesand contracts with general contractors and other professional serviceproviders. As of December 31, 2009, the unaccrued remainder to bepaid against these contractual and other commitments was $2.3million, which is expected to be financed through our 2010 Credit
Facility or through various other capital sources. The projects on whichthese commitments have been made have total expected remainingcosts of $40.4 million.
Off Balance Sheet Arrangements
We have no material off-balance sheet items other than the partner-ships described in note 3 to the consolidated financial statements andin the “Overview” section above.
Related Party Transactions
GENERAL | PRI provides management, leasing and development serv-ices for eight properties owned by partnerships and other entities inwhich certain officers or trustees of the Company and of PRI ormembers of their immediate families and affiliated entities have indirectownership interests. Total revenue earned by PRI for such services was$0.9 million, $1.1 million and $0.9 million for the years endedDecember 31, 2009, 2008 and 2007, respectively. As of December 31,2009, $0.2 million was due from the property-owning partnershipsto PRI.
We lease our principal executive offices from Bellevue Associates (the“Landlord”), an entity in which certain of our officers/trustees have aninterest. Total rent expense under this lease was $1.6 million for eachof the years ended December 31, 2009, 2008, and 2007. RonaldRubin and George F. Rubin, collectively with members of their immedi-ate families and affiliated entities, own approximately a 50% interest inthe Landlord. The office lease has a 10 year term that commenced onNovember 1, 2004. We have the option to renew the lease for up totwo additional five-year periods at the then-current fair market rate cal-culated in accordance with the terms of the office lease. In addition, wehave the right on one occasion at any time during the seventh leaseyear (2011) to terminate the office lease upon the satisfaction of certainconditions. Effective June 1, 2004, our base rent was $1.4 million peryear during the first five years of the office lease and is $1.5 million peryear during the second five years.
We use an airplane in which Ronald Rubin owns a fractional interest.We did not incur any expenses in 2009 for this service. We paid$174,000 and $35,000 in the years ended December 31, 2008 and2007, respectively, for flight time used by employees exclusively forCompany-related business.
As of December 31, 2009, nine of our officers had employment agree-ments with terms of one year that renew automatically for additionalone-year terms. Their 2008 employment agreements provided foraggregate base compensation for the year ended December 31, 2009of $3.4 million, subject to increases as approved by our Board com-pensation committee in future years, as well as additional incentivecompensation.
TAX PROTECTION AGREEMENTS | We have agreed to provide tax protec-tion related to our acquisition of Cumberland Mall Associates in 2005and New Castle Associates in 2003 and 2004 to the prior owners ofCumberland Mall Associates and New Castle Associates, respectively,for a period of eight years following the respective closings. RonaldRubin and George F. Rubin are beneficiaries of these tax protectionagreements.
BALA CYNWYD ASSOCIATES, L.P. | On January 22, 2008, PREIT, PREITAssociates, L.P. and another subsidiary of PREIT entered into aContribution Agreement with Bala Cynwyd Associates, L.P. (“BCA”),
PENNSYLVANIA REAL ESTATE INVESTMENT TRUST 2009 ANNUAL REPORT 53
City Line Associates (“CLA”), Ronald Rubin, George F. Rubin, JosephF. Coradino, and two other individuals to acquire all of the partnershipinterests in BCA. BCA had also entered into a tax deferred exchangeagreement with the owners of One Cherry Hill Plaza, an office buildinglocated within the boundaries of our Cherry Hill Mall (the “OfficeBuilding”), to acquire title to the Office Building in exchange for an officebuilding located in Bala Cynwyd, Pennsylvania owned by BCA. RonaldRubin, George F. Rubin, Joseph F. Coradino and two other individualsowned 100% of CLA, which in turn directly or indirectly owned 100%of BCA immediately prior to the initial closing. Each of Ronald Rubinand George F. Rubin owned 40.53% of the partnership interests inCLA, and Joseph F. Coradino owned 3.16% of the partnership inter-ests. At the initial closing under the Contribution Agreement in 2008and in exchange for a 0.1% general partner interest and 49.8% limitedpartner interest in BCA, we made a capital contribution to BCA in anapproximate amount of $3.93 million.
In June 2009, a second closing occurred pursuant to a put/callarrangement, at which time we acquired an additional 49.9% of thelimited partner interest in BCA for approximately $199,000 in cash and140,745 units of Class A limited partnership interest (“OP Units”) inPREIT Associates, L.P. A third closing is expected to occur pursuant toa put/call arrangement approximately one year after the secondclosing, at which time the remaining interest in BCA will be acquired byus in exchange for approximately $1,000 in cash and 564 OP Units.None of Ronald Rubin, George Rubin or Joseph Coradino received anyconsideration from us in connection with the first closing. At thesecond closing, Ronald Rubin received 60,208 OP Units, George F.Rubin received 60,208 OP Units, and Joseph F. Coradino received4,691 OP Units.
The acquisition of the Office Building was financed in part by a mort-gage loan in the principal amount of $8.0 million.
In accordance with our related party transactions policy, a special com-mittee consisting exclusively of independent members of our Board ofTrustees considered and approved the terms of the transaction. Theapproval was subject to final approval of our Board of Trustees, and thedisinterested members of our Board of Trustees approved thetransaction.
CROWN | In connection with the merger (the “Merger”) with CrownAmerican Realty Trust (“Crown”) in 2003, we entered into a tax protec-tion agreement with Mark E. Pasquerilla (one of our trustees) andentities affiliated with Mr. Pasquerilla (the “Pasquerilla Group”). Underthis tax protection agreement, we agreed not to dispose of certain pro-tected properties acquired in the Merger in a taxable transaction untilNovember 20, 2011 or, if earlier, until the Pasquerilla Group collectivelyowns less than 25% of the aggregate of the shares and OP Units thatthey acquired in the Merger. If we were to sell any of the protectedproperties during the first five years of the protection period, we wouldhave owed the Pasquerilla Group an amount equal to the sum of thehypothetical tax owed by the Pasquerilla Group, plus an amountintended to make the Pasquerilla Group whole for taxes that may bedue upon receipt of such payments. From the end of the first five yearsthrough the end of the tax protection period, the payments wereintended to compensate the affected parties for interest expenseincurred on amounts borrowed to pay the taxes incurred on the sale.We paid $2,000 and $8,000 to the Pasquerilla Group in 2008 and 2007pursuant to this agreement, respectively. As of December 31, 2009, thePasquerilla Group collectively owns less than 25% of the aggregate ofthe shares and OP Units that they acquired in the Merger.
Critical Accounting Policies
Critical Accounting Policies are those that require the application ofmanagement’s most difficult, subjective, or complex judgments, oftenbecause of the need to make estimates about the effect of matters thatare inherently uncertain and that might change in subsequent periods.In preparing the consolidated financial statements, management hasmade estimates and assumptions that affect the reported amounts ofassets and liabilities at the date of the financial statements, and thereported amounts of revenue and expenses during the reportingperiods. In preparing the financial statements, management has utilizedavailable information, including the Company’s past history, industrystandards and the current economic environment, among otherfactors, in forming its estimates and judgments, giving due considera-tion to materiality. Actual results may differ from these estimates. Inaddition, other companies may utilize different estimates, which mayimpact comparability of our results of operations to those of companiesin similar businesses. The estimates and assumptions made by man-agement in applying critical accounting policies have not changedmaterially during 2009, 2008 and 2007, except as otherwise noted,and none of these estimates or assumptions have proven to be mate-rially incorrect or resulted in our recording any significant adjustmentsrelating to prior periods. We will continue to monitor the key factorsunderlying our estimates and judgments, but no change is currentlyexpected. Set forth below is a summary of the accounting policies thatmanagement believes are critical to the preparation of the consolidatedfinancial statements. This summary should be read in conjunction withthe more complete discussion of our accounting policies included innote 1 to our consolidated financial statements.
Our management makes complex or subjective assumptions and judg-ments with respect to applying its critical accounting policies. Inmaking these judgments and assumptions, management considers,among other factors:
• events and changes in property, market and economic conditions;
• estimated future cash flows from property operations; and
• the risk of loss on specific accounts or amounts.
REVENUE RECOGNITION | We derive over 95% of our revenue from tenantrent and other tenant related activities. Tenant rent includes base rent,percentage rent, expense reimbursements (such as common areamaintenance, real estate taxes and utilities), amortization of above- andbelow-market intangibles and straight-line rent. We record base rent ona straight-line basis, which means that the monthly base rent incomeaccording to the terms of our leases with tenants is adjusted so that anaverage monthly rent is recorded for each tenant over the term of itslease. When tenants vacate prior to the end of their lease, we acceler-ate amortization of any related unamortized straight-line rent balances,and unamortized above-market and below-market intangible balancesare amortized as a decrease or increase to real estate revenue, respec-tively.
Percentage rent represents rental income that the tenant pays basedon a percentage of its sales, either as a percentage of their total salesor as a percentage of sales over a certain threshold. In the latter case,we do not record percentage rent until the sales threshold has beenreached. Revenue for rent received from tenants prior to their duedates is deferred until the period to which the rent applies.
In addition to base rent, certain lease agreements contain provisionsthat require tenants to reimburse a fixed or pro rata share of certain
54 MANAGEMENT’S DISCUSSION AND ANALYSIS
common area maintenance costs and real estate taxes. Tenants gen-erally make expense reimbursement payments monthly based on abudgeted amount determined at the beginning of the year. During theyear, our income increases or decreases based on actual expenselevels and changes in other factors that influence the reimbursementamounts, such as occupancy levels. Subsequent to the end of theyear, we prepare a reconciliation of the actual amounts due fromtenants. The difference between the actual amount due and theamounts paid by the tenant throughout the year is billed or credited tothe tenant, depending on whether the tenant paid too little or too muchduring the year.
Payments made to tenants as inducements to enter into a lease aretreated as deferred costs that are amortized as a reduction of rentalrevenue over the term of the related lease.
Lease termination fee income is recognized in the period when a termi-nation agreement is signed, collectibility is assured, and we are nolonger obligated to provide space to the tenant. In the event that atenant is in bankruptcy when the termination agreement is signed, ter-mination fee income is deferred and recognized when it is received.
We also generate revenue by providing management services to thirdparties, including property management, brokerage, leasing and devel-opment. Management fees generally are a percentage of managedproperty revenue or cash receipts. Leasing fees are earned upon theconsummation of new leases. Development fees are earned over thetime period of the development activity and are recognized on the per-centage of completion method. These activities collectively areincluded in “Interest and other income” in the consolidated statementsof operations.
FAIR VALUE | On January 1, 2008, we adopted new accounting require-ments that define fair value, establish a framework for measuring fairvalue, and expand disclosures about fair value measurements. Thesenew accounting requirements apply to reported balances that arerequired or permitted to be measured at fair value under existingaccounting pronouncements; the standard does not require any newfair value measurements of reported balances.
These new accounting requirements emphasize that fair value is amarket-based measurement, not an entity-specific measurement.Therefore, a fair value measurement should be determined based onthe assumptions that market participants would use in pricing the assetor liability. As a basis for considering market participant assumptions infair value measurements, a fair value hierarchy was established thatdistinguishes between market participant assumptions based onmarket data obtained from sources independent of the reporting entity(observable inputs that are classified within Levels 1 and 2 of the hier-archy) and the reporting entity’s own assumptions about marketparticipant assumptions (unobservable inputs classified within Level 3of the hierarchy).
Level 1 inputs utilize quoted prices (unadjusted) in active markets foridentical assets or liabilities that we have the ability to access.
Level 2 inputs are inputs other than quoted prices included in Level 1that are observable for the asset or liability, either directly or indirectly.Level 2 inputs may include quoted prices for similar assets and liabili-ties in active markets, as well as inputs that are observable for theasset or liability (other than quoted prices), such as interest rates,foreign exchange rates, and yield curves that are observable at com-monly quoted intervals.
Level 3 inputs are unobservable inputs for the asset or liability, whichare typically based on an entity’s own assumptions, as there is little, ifany, related market activity.
In instances where the determination of the fair value measurement isbased on inputs from different levels of the fair value hierarchy, the levelin the fair value hierarchy within which the entire fair value measurementfalls is based on the lowest level input that is significant to the fair valuemeasurement in its entirety. Our assessment of the significance of aparticular input to the fair value measurement in its entirety requiresjudgment, and considers factors specific to the asset or liability. Weutilize the fair value hierarchy in our accounting for derivatives and inour impairment reviews of real estate assets and goodwill.
DERIVATIVES | Currently, we use interest rate swaps and caps tomanage its interest rate risk. The valuation of these instruments isdetermined using widely accepted valuation techniques, including dis-counted cash flow analysis on the expected cash flows of eachderivative. This analysis reflects the contractual terms of the deriva-tives, including the period to maturity, and uses observablemarket-based inputs.
We incorporate credit valuation adjustments to appropriately reflectboth our own nonperformance risk and the respective counterparty’snonperformance risk in the fair value measurements. In adjusting thefair value of our derivative contracts for the effect of nonperformancerisk, we have considered the impact of netting and any applicablecredit enhancements. Although we have determined that the majorityof the inputs used to value its derivatives fall within Level 2 of the fairvalue hierarchy, the credit valuation adjustments associated with itsderivatives utilize Level 3 inputs, such as estimates of current creditspreads, to evaluate the likelihood of default by itself and its counter-parties. However, as of December 31, 2009, we have assessed thesignificance of the effect of the credit valuation adjustments onthe overall valuation of its derivative positions and we have determinedthat the credit valuation adjustments are not significant to the overallvaluation of its derivatives. As a result, we have determined that itsderivative valuations in their entirety are classified in Level 2 of the fairvalue hierarchy.
FINANCIAL INSTRUMENTS | Carrying amounts reported on the balancesheet for cash and cash equivalents, tenant and other receivables,accrued expenses, other liabilities and the 2003 Credit Facility approx-imate fair value due to the short-term nature of these instruments. Themajority of our variable-rate debt is subject to interest rate swaps thathave effectively fixed the interest rates on the underlying debt has anestimated fair value that is approximately the same as the recordedamounts in the balance sheets. The estimated fair value for fixed-ratedebt, which is calculated for disclosure purposes, is based on the bor-rowing rates available to us for fixed-rate mortgage loans andcorporate notes payable with similar terms and maturities.
ASSET IMPAIRMENT | Real estate investments and related intangibleassets are reviewed for impairment whenever events or changes in cir-cumstances indicate that the carrying amount of the property might notbe recoverable. A property to be held and used is considered impairedonly if our estimate of the aggregate future cash flows, less estimatedcapital expenditures, to be generated by the property, undiscountedand without interest charges, are less than the carrying value of theproperty. This estimate takes into consideration factors such asexpected future operating income, trends and prospects, as well as theeffects of demand, competition and other factors. In addition, these

PENNSYLVANIA REAL ESTATE INVESTMENT TRUST 2009 ANNUAL REPORT 55
estimates may consider a probability weighted cash flow estimationapproach when alternative courses of action to recover the carryingamount of a long lived asset are under consideration or when a rangeof possible values is estimated.
The determination of undiscounted cash flows requires significant esti-mates by us, including the expected course of action at the balancesheet date that would lead to such cash flows. Subsequent changes inestimated undiscounted cash flows arising from changes in the antici-pated action to be taken with respect to the property could impact thedetermination of whether an impairment exists and whether the effectscould materially impact our results of operations. To the extent esti-mated undiscounted cash flows are less than the carrying value of theproperty, the loss will be measured as the excess of the carryingamount of the property over the estimated fair value of the property.
Our assessment of the recoverability of certain lease related costs mustbe made when we have a reason to believe that the tenant mightnot be able to perform under the terms of the lease as originallyexpected. This requires us to make estimates as to the recoverability ofsuch costs.
An other than temporary impairment of an investment in an unconsoli-dated joint venture is recognized when the carrying value of theinvestment is not considered recoverable based on evaluation of theseverity and duration of the decline in value, including the results of dis-counted cash flow and other valuation techniques. To the extentimpairment has occurred, the excess carrying value of the asset overits estimated fair value is charged to income.
REAL ESTATE | Land, buildings, fixtures and tenant improvements arerecorded at cost and stated at cost less accumulated depreciation.Expenditures for maintenance and repairs are charged to operations asincurred. Renovations or replacements, which improve or extend thelife of an asset, are capitalized and depreciated over their estimateduseful lives.
For financial reporting purposes, properties are depreciated using thestraight-line method over the estimated useful lives of the assets. Theestimated useful lives are as follows:
Buildings 30–50 yearsLand improvements 15 yearsFurniture/fixtures 3–10 yearsTenant improvements Lease term
We are required to make subjective assessments as to the useful livesof our properties for purposes of determining the amount of deprecia-tion to reflect on an annual basis with respect to those propertiesbased on various factors, including industry standards, historical expe-rience and the condition of the asset at the time of acquisition. Theseassessments have a direct impact on our results of operations. If wewere to determine that a longer expected useful life was appropriate fora particular asset, it would be depreciated over more years, and, otherthings being equal, result in less annual depreciation expense andhigher annual net income.
Gains from sales of real estate properties and interests in partnershipsgenerally are recognized using the full accrual method provided thatvarious criteria are met relating to the terms of sale and any subsequentinvolvement by us with the properties sold.
REAL ESTATE ACQUISITIONS | We account for our property acquisitionsby allocating the purchase price of a property to the property’s assetsbased on our estimates of their fair value.
Debt assumed in connection with property acquisitions is recorded atfair value at the acquisition date, and the resulting premium or discountis amortized through interest expense over the remaining term of thedebt, resulting in a non-cash decrease (in the case of a premium) orincrease (in the case of a discount) in interest expense.
INTANGIBLE ASSETS | The determination of the fair value of intangibleassets requires significant estimates by management and considersmany factors, including our expectations about the underlying propertyand the general market conditions in which the property operates. Thejudgment and subjectivity inherent in such assumptions can have a sig-nificant impact on the magnitude of the intangible assets that werecord.
A portion of the purchase price of a property is allocated to intangibleassets. Our methodology for this allocation includes estimating an “as-if vacant” fair value of the physical property, which is allocated to land,building and improvements. The difference between the purchase priceand the “as-if vacant” fair value is allocated to intangible assets. Thereare three categories of intangible assets to be considered: (i) value ofin-place leases, (ii) above- and below-market value of in-place leasesand (iii) customer relationship value.
The value of in-place leases is estimated based on the value associatedwith the costs avoided in originating leases comparable to the acquiredin-place leases, as well as the value associated with lost rental revenueduring the assumed lease-up period. The value of in-place leases isamortized as real estate amortization over the remaining lease term.
Above-market and below-market in-place lease values for acquiredproperties are recorded based on the present value of the differencebetween (i) the contractual amounts to be paid pursuant to the in-placeleases and (ii) our estimates of fair market lease rates for the compara-ble in-place leases, based on factors including historical experience,recently executed transactions and specific property issues, measuredover a period equal to the remaining non-cancelable term of the lease.The value of above-market lease values is amortized as a reduction ofrental income over the remaining terms of the respective leases. Thevalue of below-market lease values is amortized as an increase torental income over the remaining terms of the respective leases, includ-ing any below-market optional renewal periods.
We allocate purchase price to customer relationship intangibles basedon our assessment of the value of such relationships.
GOODWILL | We conduct an annual review of our goodwill balances forimpairment to determine whether an adjustment to the carrying valueof goodwill is required. We determined the fair value of our propertiesand the goodwill that is associated with the properties by applying acapitalization rate to our estimate of projected income at those proper-ties. We also consider factors such as property sales performance,market position and current and future operating results.
ASSETS HELD FOR SALE AND DISCONTINUED OPERATIONS | The determi-nation to classify an asset as held for sale requires significant estimatesby us about the property and the expected market for the property,which are based on factors including recent sales of comparable prop-erties, recent expressions of interest in the property, financial metrics ofthe property and the condition of the property. We must also determineif it will be possible under those market conditions to sell the property
56 MANAGEMENT’S DISCUSSION AND ANALYSIS
TENANT RECEIVABLES | We make estimates of the collectibility of ourtenant receivables related to tenant rent including base rent, straight-line rent, expense reimbursements and other revenue or income. Wespecifically analyze accounts receivable, including straight-line rentreceivable, historical bad debts, customer creditworthiness and currenteconomic and industry trends when evaluating the adequacy of theallowance for doubtful accounts. The receivables analysis places par-ticular emphasis on past-due accounts and considers the nature andage of the receivables, the payment history and financial condition ofthe payor, the basis for any disputes or negotiations with the payor, andother information that could affect collectibility. In addition, with respectto tenants in bankruptcy, we make estimates of the expected recoveryof pre-petition and post-petition claims in assessing the estimated col-lectibility of the related receivable. In some cases, the time required toreach an ultimate resolution of these claims can exceed one year.These estimates have a direct effect on our results of operationsbecause higher bad debt expense results in less net income, otherthings being equal. For straight line rent, the collectibility analysis con-siders the probability of collection of the unbilled deferred rentreceivable given our experience regarding such amounts.
for an acceptable price within one year. When assets are identified bymanagement as held for sale, we discontinue depreciating the assetsand estimate the sales price, net of selling costs of such assets. Wegenerally consider operating properties to be held for sale when theymeet the criteria, which include factors such as whether the sale trans-action has been approved by the appropriate level of management andthere are no known material contingencies relating to the sale such thatthe sale is probable within one year. If, in management’s opinion, thenet sales price of the asset that has been identified as held for sale isless than the net book value of the asset, the asset is written down tofair value less the cost to sell. Assets and liabilities related to assetsclassified as held for sale are presented separately in the consolidatedbalance sheet.
Assuming no significant continuing involvement, a sold operating realestate property is considered a discontinued operation. In addition,operating properties classified as held for sale are considered discon-tinued operations. Operating properties classified as discontinuedoperations are reclassified as such in the consolidated statement ofoperations for each period presented. Interest expense that is specifi-cally identifiable to the property is used in the computation of interestexpense attributable to discontinued operations. See note 2 to ourconsolidated financial statements for a description of the propertiesincluded in discontinued operations. Land parcels and other portionsof operating properties, non-operating real estate and investments inpartnerships are excluded from discontinued operations treatment.
CAPITALIZATION OF COSTS | Costs incurred in relation to developmentand redevelopment projects for interest, property taxes and insuranceare capitalized only during periods in which activities necessary toprepare the property for its intended use are in progress. Costsincurred for such items after the property is substantially complete andready for its intended use are charged to expense as incurred.Capitalized costs, as well as tenant inducement amounts and internaland external commissions, are recorded in construction in progress.We capitalize a portion of development department employees’ com-pensation and benefits related to time spent involved in developmentand redevelopment projects.
We capitalize payments made to obtain options to acquire real prop-erty. Other related costs that are incurred before acquisition that areexpected to have ongoing value to the project are capitalized if theacquisition of the property or of an option to acquire the property isprobable. If the property is acquired, such costs are included in theamount recorded as the initial value of the asset. Capitalized pre-acqui-sition costs are charged to expense when it is probable that theproperty will not be acquired.
We capitalize salaries, commissions and benefits related to time spentby leasing and legal department personnel involved in originatingleases with third-party tenants.
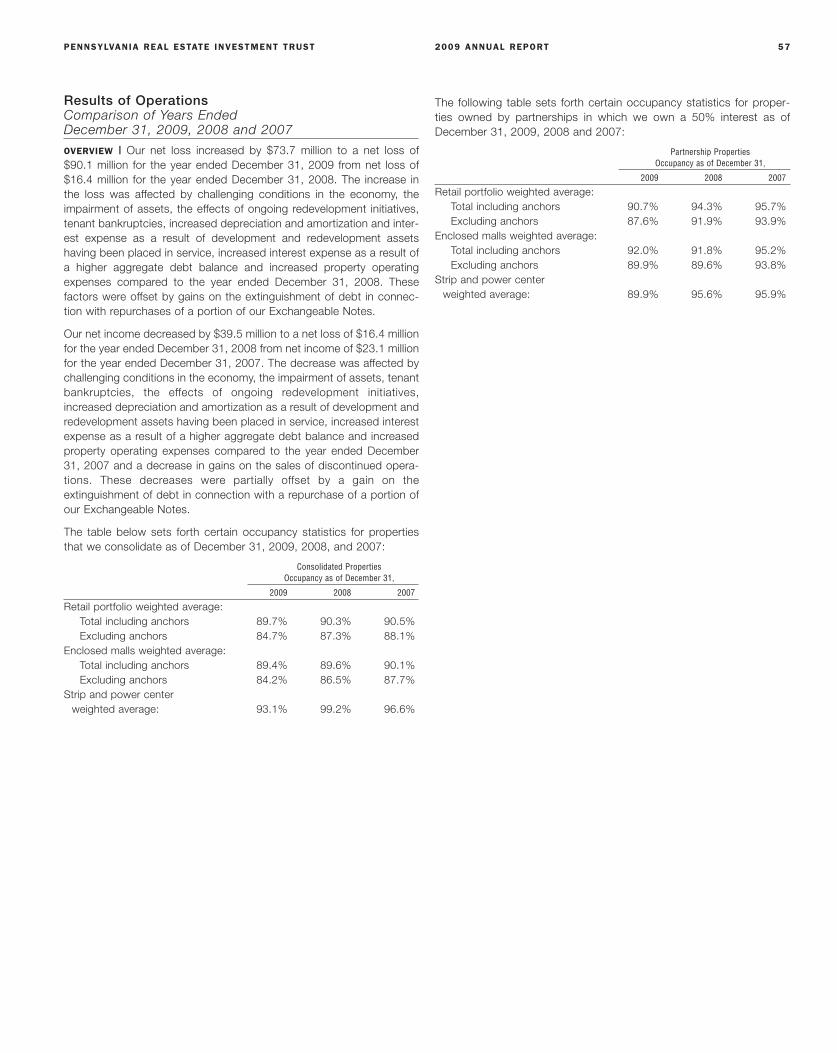
PENNSYLVANIA REAL ESTATE INVESTMENT TRUST 2009 ANNUAL REPORT 57
Results of OperationsComparison of Years EndedDecember 31, 2009, 2008 and 2007
OVERVIEW | Our net loss increased by $73.7 million to a net loss of$90.1 million for the year ended December 31, 2009 from net loss of$16.4 million for the year ended December 31, 2008. The increase inthe loss was affected by challenging conditions in the economy, theimpairment of assets, the effects of ongoing redevelopment initiatives,tenant bankruptcies, increased depreciation and amortization and inter-est expense as a result of development and redevelopment assetshaving been placed in service, increased interest expense as a result ofa higher aggregate debt balance and increased property operatingexpenses compared to the year ended December 31, 2008. Thesefactors were offset by gains on the extinguishment of debt in connec-tion with repurchases of a portion of our Exchangeable Notes.
Our net income decreased by $39.5 million to a net loss of $16.4 millionfor the year ended December 31, 2008 from net income of $23.1 millionfor the year ended December 31, 2007. The decrease was affected bychallenging conditions in the economy, the impairment of assets, tenantbankruptcies, the effects of ongoing redevelopment initiatives,increased depreciation and amortization as a result of development andredevelopment assets having been placed in service, increased interestexpense as a result of a higher aggregate debt balance and increasedproperty operating expenses compared to the year ended December31, 2007 and a decrease in gains on the sales of discontinued opera-tions. These decreases were partially offset by a gain on theextinguishment of debt in connection with a repurchase of a portion ofour Exchangeable Notes.
The table below sets forth certain occupancy statistics for propertiesthat we consolidate as of December 31, 2009, 2008, and 2007:
Consolidated PropertiesOccupancy as of December 31,
2009 2008 2007
Retail portfolio weighted average:Total including anchors 89.7% 90.3% 90.5%Excluding anchors 84.7% 87.3% 88.1%
Enclosed malls weighted average:Total including anchors 89.4% 89.6% 90.1%Excluding anchors 84.2% 86.5% 87.7%
Strip and power centerweighted average: 93.1% 99.2% 96.6%
The following table sets forth certain occupancy statistics for proper-ties owned by partnerships in which we own a 50% interest as ofDecember 31, 2009, 2008 and 2007:
Partnership PropertiesOccupancy as of December 31,
2009 2008 2007
Retail portfolio weighted average:Total including anchors 90.7% 94.3% 95.7%Excluding anchors 87.6% 91.9% 93.9%
Enclosed malls weighted average:Total including anchors 92.0% 91.8% 95.2%Excluding anchors 89.9% 89.6% 93.8%
Strip and power centerweighted average: 89.9% 95.6% 95.9%

58 MANAGEMENT’S DISCUSSION AND ANALYSIS
REAL ESTATE REVENUE | Real estate revenue decreased by $3.4million, or 1%, in 2009 as compared to 2008. Real estate revenue in2009 was significantly affected by tenant bankruptcies and store clos-ings, resulting in lower occupancy and expense reimbursements andhigher bad debt expense compared to 2008. Real estate revenue fromproperties that were owned by us for the entire period from January 1,2008 to December 31, 2009 (“2009 Same Store Properties”)decreased by $7.2 million in 2009, primarily due to decreases of $1.9million in lease termination revenue, $1.8 million in percentage rent,$1.7 million in other revenue, $1.3 million in expense reimbursementsand $0.5 million in base rent, which is comprised of minimum rent,straight line rent and rent from tenants that pay a percentage of salesin lieu of minimum rent. These changes in real estate revenue areexplained below in further detail. Real estate revenue increased $3.8million from one property under development during 2008 that wasplaced in service in 2009.
Lease termination revenue from 2009 Same Store Propertiesdecreased by $1.9 million in 2009, primarily due to amounts receivedfrom two tenants during 2008 that did not recur in 2009. Percentagerent from 2009 Same Store Properties decreased by $1.8 million duein part to a decrease in tenant sales from $333 per square foot in 2008to $325 per square foot in 2009. This decrease was also partially dueto a trend in certain more recent leases that have higher thresholds atwhich percentage rent begins. Other revenue from 2009 Same StoreProperties decreased by $1.7 million in 2009, primarily due to a $1.1million decrease in marketing revenue, a $0.2 million decrease in cor-porate sponsorship revenue and a $0.1 million decrease in gift cardrevenue. The decrease in marketing revenue was offset by a corre-sponding $1.1 million decrease in marketing expense. Marketingrevenue is generally recognized in tandem with marketing expense.
Expense reimbursements from 2009 Same Store Properties decreasedby $1.3 million in 2009 as compared to 2008. At many of our malls, wehave continued to recover a lower proportion of common area mainte-nance and real estate tax expenses. In addition to being affected bystore closings, our properties are experiencing a trend towards moregross leases (leases that provide that tenants pay a higher base rentamount in lieu of contributing toward common area maintenance costsand real estate taxes), as well as more leases that provide for the rentamount to be determined on the basis of a percentage of sales inlieu of minimum rent or any contribution toward common area mainte-nance or real estate tax expenses. We are also experiencing rentalconcessions made to tenants affected by our redevelopment activities
and to tenants experiencing financial difficulties, that resulted inlower recoveries.
Base rent from 2009 Same Store Properties decreased by $0.5 millionin 2009 as compared to 2008. Base rent decreased by $5.5 million dueto store closings and liquidations associated with tenant bankruptcyfilings during 2009 and 2008. Partially offsetting these decreases, baserent at Cherry Hill Mall, Voorhees Town Center and Plymouth MeetingMall, three projects in the current redevelopment program, increasedby $2.4 million, $1.6 million and $1.1 million, respectively, due toincreased occupancy from newly opened tenants. Partially offsettingthe increases at Voorhees Town Center and Plymouth Meeting Mallwere lease inducement and straight line rent receivable write-offs of$0.6 million and $0.2 million, respectively, associated with tenant delin-quencies, which reduced base rent.
Interest and other income decreased by $1.5 million, or 33%, in 2009as compared to 2008 due to lower interest rates on excess cashinvestments and non-recurring development fees and leasing commis-sions recorded in 2008.
We believe that the current downward trend in the overall economy andthe recent disruptions in the financial markets have reduced consumerconfidence in the economy and negatively affected employment andconsumer spending on retail goods, and have consequently decreasedthe demand for retail space and the revenue generated by our proper-ties. The weaker operating performance of retailers has resulted indelays or deferred decisions regarding the opening of new retail storesand renewals of existing leases at our properties and has affected theability of our current tenants to meet their obligations to us, which hasand is anticipated to continue to adversely affect our ability to generatereal estate revenue during the duration of the current downturnand disruptions.
Real estate revenue increased by $9.9 million, or 2%, in 2008 as com-pared to 2007, including an increase of $4.1 million from propertiesthat were under development during 2007 that were placed in servicein 2008 and an increase of $1.5 million from One Cherry Hill Plaza(acquired in February 2008). Real estate revenue from properties thatwere owned by us for the entire period from January 1, 2007 toDecember 31, 2008 (“2008 Same Store Properties”) increased by $4.3million in 2008, primarily due to increases of $2.7 million in expensereimbursements, $2.5 million in lease termination revenue and $2.1million in base rent, partially offset by decreases of $1.9 million in per-centage rent and $1.1 million in other revenue.
The following information sets forth our results of operations for the years ended December 31, 2009, 2008 and 2007:
Year Ended % Change Year Ended % Change Year Ended(in thousands of dollars) December 31, 2009 2008 to 2009 December 31, 2008 2007 to 2008 December 31, 2007
Results of operations:Revenue $ 463,088 (1%) $ 467,993 2% $ 460,590Operating expenses (193,576) 4% (186,520) 4% (179,010)General and administrative expenses (37,558) (7%) (40,324) (3%) (41,415)Income taxes and other (169) (29%) (237) (43%) (413)Impairment of assets and abandoned project costs (75,012) 160% (28,889) 1,787% (1,531)Interest expense, net (133,460) 16% (115,013) 15% (100,188)Depreciation and amortization (166,570) 11% (150,041) 15% (130,632)Equity in income of partnerships 10,102 43% 7,053 52% 4,637Gain on extinguishment of debt 27,047 — 27,074 — —Gains on sales of real estate 923 — — — 579Gains on sales of non-operating real estate 3,388 — — — 1,731Income from discontinued operations 11,706 359% 2,549 (71%) 8,772Net (loss) income $ (90,091) 451% $ (16,355) (171%) $ 23,120
The amounts reflected as income from continuing operations in the preceding table reflect our consolidated properties, with the exception ofproperties that are classified as discontinued operations. Our unconsolidated partnerships are presented under the equity method of accountingin the line item “Equity in income of partnerships.”
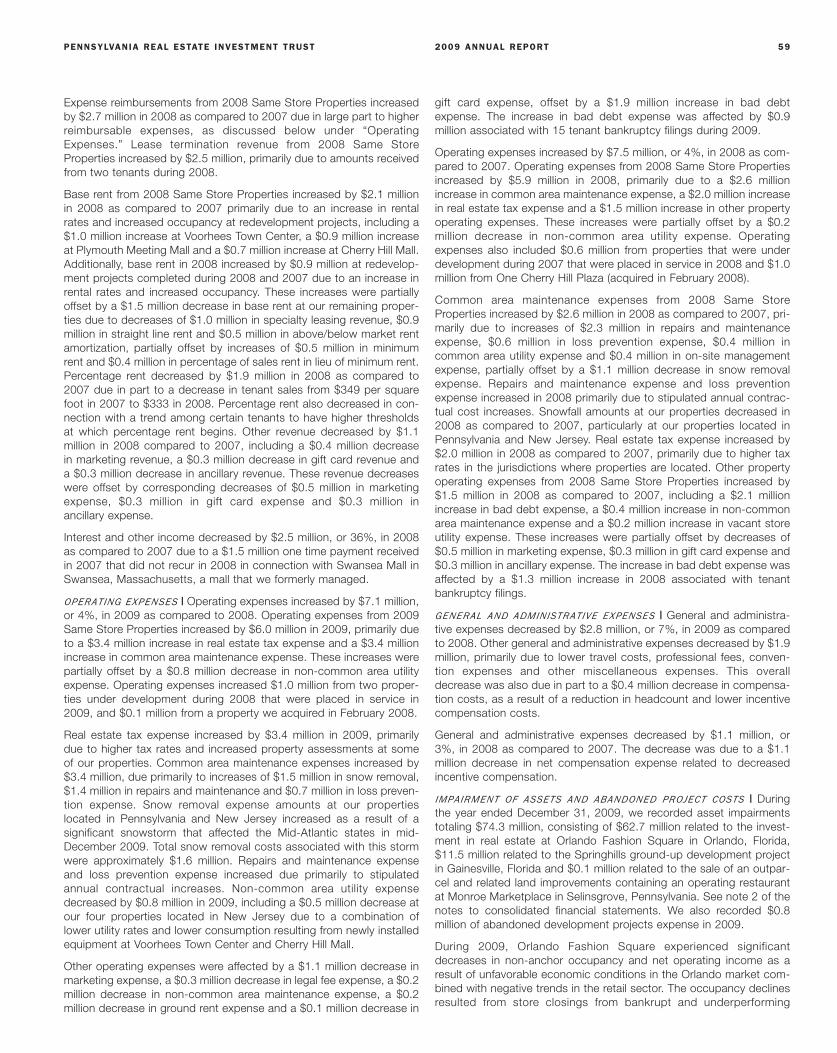
PENNSYLVANIA REAL ESTATE INVESTMENT TRUST 2009 ANNUAL REPORT 59
Expense reimbursements from 2008 Same Store Properties increasedby $2.7 million in 2008 as compared to 2007 due in large part to higherreimbursable expenses, as discussed below under “OperatingExpenses.” Lease termination revenue from 2008 Same StoreProperties increased by $2.5 million, primarily due to amounts receivedfrom two tenants during 2008.
Base rent from 2008 Same Store Properties increased by $2.1 millionin 2008 as compared to 2007 primarily due to an increase in rentalrates and increased occupancy at redevelopment projects, including a$1.0 million increase at Voorhees Town Center, a $0.9 million increaseat Plymouth Meeting Mall and a $0.7 million increase at Cherry Hill Mall.Additionally, base rent in 2008 increased by $0.9 million at redevelop-ment projects completed during 2008 and 2007 due to an increase inrental rates and increased occupancy. These increases were partiallyoffset by a $1.5 million decrease in base rent at our remaining proper-ties due to decreases of $1.0 million in specialty leasing revenue, $0.9million in straight line rent and $0.5 million in above/below market rentamortization, partially offset by increases of $0.5 million in minimumrent and $0.4 million in percentage of sales rent in lieu of minimum rent.Percentage rent decreased by $1.9 million in 2008 as compared to2007 due in part to a decrease in tenant sales from $349 per squarefoot in 2007 to $333 in 2008. Percentage rent also decreased in con-nection with a trend among certain tenants to have higher thresholdsat which percentage rent begins. Other revenue decreased by $1.1million in 2008 compared to 2007, including a $0.4 million decreasein marketing revenue, a $0.3 million decrease in gift card revenue anda $0.3 million decrease in ancillary revenue. These revenue decreaseswere offset by corresponding decreases of $0.5 million in marketingexpense, $0.3 million in gift card expense and $0.3 million inancillary expense.
Interest and other income decreased by $2.5 million, or 36%, in 2008as compared to 2007 due to a $1.5 million one time payment receivedin 2007 that did not recur in 2008 in connection with Swansea Mall inSwansea, Massachusetts, a mall that we formerly managed.
OPERATING EXPENSES | Operating expenses increased by $7.1 million,or 4%, in 2009 as compared to 2008. Operating expenses from 2009Same Store Properties increased by $6.0 million in 2009, primarily dueto a $3.4 million increase in real estate tax expense and a $3.4 millionincrease in common area maintenance expense. These increases werepartially offset by a $0.8 million decrease in non-common area utilityexpense. Operating expenses increased $1.0 million from two proper-ties under development during 2008 that were placed in service in2009, and $0.1 million from a property we acquired in February 2008.
Real estate tax expense increased by $3.4 million in 2009, primarilydue to higher tax rates and increased property assessments at someof our properties. Common area maintenance expenses increased by$3.4 million, due primarily to increases of $1.5 million in snow removal,$1.4 million in repairs and maintenance and $0.7 million in loss preven-tion expense. Snow removal expense amounts at our propertieslocated in Pennsylvania and New Jersey increased as a result of asignificant snowstorm that affected the Mid-Atlantic states in mid-December 2009. Total snow removal costs associated with this stormwere approximately $1.6 million. Repairs and maintenance expenseand loss prevention expense increased due primarily to stipulatedannual contractual increases. Non-common area utility expensedecreased by $0.8 million in 2009, including a $0.5 million decrease atour four properties located in New Jersey due to a combination oflower utility rates and lower consumption resulting from newly installedequipment at Voorhees Town Center and Cherry Hill Mall.
Other operating expenses were affected by a $1.1 million decrease inmarketing expense, a $0.3 million decrease in legal fee expense, a $0.2million decrease in non-common area maintenance expense, a $0.2million decrease in ground rent expense and a $0.1 million decrease in
gift card expense, offset by a $1.9 million increase in bad debtexpense. The increase in bad debt expense was affected by $0.9million associated with 15 tenant bankruptcy filings during 2009.
Operating expenses increased by $7.5 million, or 4%, in 2008 as com-pared to 2007. Operating expenses from 2008 Same Store Propertiesincreased by $5.9 million in 2008, primarily due to a $2.6 millionincrease in common area maintenance expense, a $2.0 million increasein real estate tax expense and a $1.5 million increase in other propertyoperating expenses. These increases were partially offset by a $0.2million decrease in non-common area utility expense. Operatingexpenses also included $0.6 million from properties that were underdevelopment during 2007 that were placed in service in 2008 and $1.0million from One Cherry Hill Plaza (acquired in February 2008).
Common area maintenance expenses from 2008 Same StoreProperties increased by $2.6 million in 2008 as compared to 2007, pri-marily due to increases of $2.3 million in repairs and maintenanceexpense, $0.6 million in loss prevention expense, $0.4 million incommon area utility expense and $0.4 million in on-site managementexpense, partially offset by a $1.1 million decrease in snow removalexpense. Repairs and maintenance expense and loss preventionexpense increased in 2008 primarily due to stipulated annual contrac-tual cost increases. Snowfall amounts at our properties decreased in2008 as compared to 2007, particularly at our properties located inPennsylvania and New Jersey. Real estate tax expense increased by$2.0 million in 2008 as compared to 2007, primarily due to higher taxrates in the jurisdictions where properties are located. Other propertyoperating expenses from 2008 Same Store Properties increased by$1.5 million in 2008 as compared to 2007, including a $2.1 millionincrease in bad debt expense, a $0.4 million increase in non-commonarea maintenance expense and a $0.2 million increase in vacant storeutility expense. These increases were partially offset by decreases of$0.5 million in marketing expense, $0.3 million in gift card expense and$0.3 million in ancillary expense. The increase in bad debt expense wasaffected by a $1.3 million increase in 2008 associated with tenantbankruptcy filings.
GENERAL AND ADMINISTRATIVE EXPENSES | General and administra-tive expenses decreased by $2.8 million, or 7%, in 2009 as comparedto 2008. Other general and administrative expenses decreased by $1.9million, primarily due to lower travel costs, professional fees, conven-tion expenses and other miscellaneous expenses. This overalldecrease was also due in part to a $0.4 million decrease in compensa-tion costs, as a result of a reduction in headcount and lower incentivecompensation costs.
General and administrative expenses decreased by $1.1 million, or3%, in 2008 as compared to 2007. The decrease was due to a $1.1million decrease in net compensation expense related to decreasedincentive compensation.
IMPAIRMENT OF ASSETS AND ABANDONED PROJECT COSTS | Duringthe year ended December 31, 2009, we recorded asset impairmentstotaling $74.3 million, consisting of $62.7 million related to the invest-ment in real estate at Orlando Fashion Square in Orlando, Florida,$11.5 million related to the Springhills ground-up development projectin Gainesville, Florida and $0.1 million related to the sale of an outpar-cel and related land improvements containing an operating restaurantat Monroe Marketplace in Selinsgrove, Pennsylvania. See note 2 of thenotes to consolidated financial statements. We also recorded $0.8million of abandoned development projects expense in 2009.
During 2009, Orlando Fashion Square experienced significantdecreases in non-anchor occupancy and net operating income as aresult of unfavorable economic conditions in the Orlando market com-bined with negative trends in the retail sector. The occupancy declinesresulted from store closings from bankrupt and underperforming

60 MANAGEMENT’S DISCUSSION AND ANALYSIS
tenants. Net operating income at this property was also impacted byan increase in the number of tenants paying a percentage of their salesin lieu of minimum rent combined with declining tenant sales. As aresult of these conditions, in connection with the preparation of our2010 business plan and budgets, management determined that itsestimate of future cash flows, net of estimated capital expenditures, tobe generated by the property were less than the carrying value of theproperty. As a result, we determined that the property was impairedand a write down of $62.7 million to the property’s estimated fair valueof $40.2 million was necessary.
Springhills is a mixed use ground-up development project located inGainesville, Florida. During the fourth quarter of 2009, in connectionwith our 2010 business planning process, which included a strategicreview of our future development projects, management determinedthat the development plans for Springhills were uncertain.Consequently, we recorded an impairment loss of $11.5 million, towrite down the carrying amount of the project to the estimated fairvalue of $22.0 million.
During the year ended December 31, 2008, we recorded asset impair-ments totaling $27.6 million, consisting of $11.8 million related to theWhite Clay Point ground-up development project, $7.0 million relatedto the Sunrise Plaza power center project, $4.6 million related to good-will, $3.0 million related to our investment in and receivables from ValleyView Downs, $0.9 million related to a proposed commercial project inWest Chester, Pennsylvania and $0.2 million related to an undevelopedparcel adjacent to Viewmont Mall classified as land held for develop-ment. See note 2 of the notes to consolidated financial statements. Wealso recorded $1.3 million of abandoned development projectsexpense in 2008.
INTEREST EXPENSE | Interest expense increased by $18.4 million, or16%, in 2009 as compared to 2008. This increase was primarily attrib-utable to assets placed in service with an aggregate cost basis of$286.7 million in 2009. Interest on these assets was capitalized duringconstruction periods on our development and redevelopment projects,and was expensed during periods after the improvements were placedin service. This increase resulted in part from a higher aggregate debtbalance. Interest expense in 2008 was reduced by $2.0 million as aresult of a gain from hedging activities.
Interest expense increased $14.8 million, or 15%, in 2008 as comparedto 2007. The increase was attributable to a $12.6 million increaserelated to new mortgage financings in 2008, a $2.7 million increaserelated to the Term Loan financing completed in September 2008 anda $5.7 million increase in interest arising from the revolving 2003 CreditFacility and our Exchangeable Notes (due to larger amounts outstand-ing in the aggregate in 2008 as compared to 2007). These increaseswere partially offset by a decrease in mortgage loan interest of $4.2million related to the repayment of the 15 property real estate mortgageinvestment conduit (“REMIC”), a $2.0 million gain from hedging activi-ties and the repayment of the mortgage loan on Crossroads Mall in2008 and a $0.3 million decrease in interest paid on mortgage loansoutstanding during 2008 due to principal amortization, as well as theeffects of lower average interest rates.
DEPRECIATION AND AMORTIZATION | Depreciation and amortizationexpense increased by $16.5 million, or 11%, in 2009 as compared to2008. Depreciation and amortization expense from 2009 Same StoreProperties increased by $15.4 million, primarily due to a higher assetbase resulting from capital improvements at our properties, particularlyat properties where we have recently completed redevelopments andthat are now placed in service. We placed assets with an aggregatebasis of $286.0 million in service in 2009. Depreciation and amortiza-tion expense increased $1.4 million from one property underdevelopment during 2008 that is now placed in service and decreased$0.3 million from One Cherry Hill Plaza (acquired February 2008).
Depreciation and amortization expense increased by $19.4 million, or15%, in 2008 as compared to 2007. Depreciation and amortizationexpense from 2008 Same Store Properties increased by $16.3 million,primarily due to a higher asset base resulting from capital improve-ments at our properties, particularly at redevelopment properties.Depreciation and amortization expense increased $1.9 million fromproperties under development during 2007 that were placed in servicein 2008 and $1.2 million from One Cherry Hill Plaza.
GAIN ON EXTINGUISHMENT OF DEBT | In 2009, we repurchased $104.6million in aggregate principal amount of our Exchangeable Notes in pri-vately-negotiated transactions in exchange for $47.2 million in cashand 4.3 million common shares with a fair market value of $25.0 million.This resulted in a gain on extinguishment of debt of $27.0 million. Inconnection with the repurchases, we retired an aggregate of $5.4million of deferred financing costs and debt discount.
In 2008, we repurchased $46.0 million in aggregate principal amount ofour Exchangeable Notes in privately-negotiated transactions for $15.9million in cash. This resulted in a gain on extinguishment of debt of$27.1 million. In connection with the repurchases, we retired an aggre-gate of $3.0 million of deferred financing costs and debt discount.
During 2007, we did not repurchase any of our Exchangeable Notes.
GAINS ON SALES OF REAL ESTATE | Gains on sales of interests in realestate were $4.3 million in 2009 due to a $2.7 million gain from the saleof a parcel and related land improvements at Pitney Road Plaza, a $1.4million gain from the sale of land adjacent to North Hanover Mall and a$0.2 million gain from the sale of a land parcel adjacent to WoodlandMall.
There were no gains on sales of real estate in 2008.
Gains on sales of interests in real estate were $2.3 million in 2007 dueto a $1.5 million gain from the sale of a parcel and related land improve-ments at Plaza at Magnolia, a $0.6 million gain from the sale of anoutparcel and related land improvements containing an operatingrestaurant at New River Valley Mall, and a $0.2 million gain from thesale of land adjacent to Wiregrass Commons.
DISCONTINUED OPERATIONS | We have presented as discontinuedoperations the operating results of Crest Plaza (a strip center inAllentown, Pennsylvania), Northeast Tower Center (a power center inPhiladelphia, Pennsylvania), Schuylkill Mall (a mall in Frackville,Pennsylvania), South Blanding Village (a strip center in Jacksonville,Florida) and Festival at Exton (a strip center in Exton, Pennsylvania).
Operating results and gains on sales of discontinued operations for theproperties in discontinued operations for the periods presented wereas follows:
For the Year Ended December 31,
(in thousands of dollars) 2009 2008 2007
Operating results of:Northeast Tower Center $ 1,820 $ 1,965 $ 1,697Crest Plaza 383 584 506Schuylkill Mall — — (97)Festival at Exton — — (28)South Blanding Village — — (5)
Operating results fromdiscontinued operations 2,203 2,549 2,073
Gains on sales ofdiscontinued operations 9,503 — 6,699
Income from discontinuedoperations $ 11,706 $ 2,549 $ 8,772

PENNSYLVANIA REAL ESTATE INVESTMENT TRUST 2009 ANNUAL REPORT 61
For the Year Ended December 31, 2009 For the Year Ended December 31, 2008Real Estate Operating Net Operating Real Estate Operating Net Operating
(in thousands of dollars) Revenue Expenses Income Revenue Expenses Income
Same Store $ 490,584 $ (202,489) $ 288,095 $ 497,773 $ (196,348) $ 301,425Non Same Store 11,431 (4,060) 7,371 9,178 (3,286) 5,892Total $ 502,015 $ (206,549) $ 295,466 $ 506,951 $ (199,634) $ 307,317
GAINS ON SALES OF DISCONTINUED OPERATIONS | Gains on sales ofdiscontinued operations were $9.5 million for 2009 due to the gain onthe sale of a controlling interest Northeast Tower Center of $6.1 millionand a gain on the sale of Crest Plaza of $3.4 million.
There were no gains on sales of discontinued operations in 2008.
Gains on sales of discontinued operations were $6.7 million for 2007due to the sale of Schuylkill Mall.
Net Operating IncomeNet operating income (a non-GAAP measure) is derived from realestate revenue (determined in accordance with GAAP) minus propertyoperating expenses (determined in accordance with GAAP). It does notrepresent cash generated from operating activities in accordance withGAAP and should not be considered to be an alternative to net income(determined in accordance with GAAP) as an indication of our financialperformance or to be an alternative to cash flow from operating activi-ties (determined in accordance with GAAP) as a measure of ourliquidity; nor is it indicative of funds available for our cash needs, includ-ing our ability to make cash distributions. We believe that net income isthe most directly comparable GAAP measurement to net operatingincome. We believe that net operating income is helpful to manage-ment and investors as a measure of operating performance because itis an indicator of the return on property investment, and provides amethod of comparing property performance over time.
Net operating income excludes interest and other income, general andadministrative expenses, interest expense, depreciation and amortiza-tion, gains on sales of interests in real estate, gains or sales ofnon-operating real estate, gains on sales of discontinued operations,gain on extinguishment of debt, impairment losses, abandoned projectcosts and other expenses.
The following table presents net operating income results for the yearsended December 31, 2009 and 2008. The results are presented usingthe “proportionate-consolidation method” (a non-GAAP measure),which presents our share of the results of our partnership investments.Under GAAP, we account for our partnership investments under theequity method of accounting. Operating results for retail properties thatwe owned for the full periods presented (“Same Store”) exclude prop-erties acquired or disposed of during the periods presented:
% Change 2009 vs. 2008
Same Store Total
Real estate revenue (1.4%) (1.0%)Operating expenses 3.1% 3.5%Net operating income (4.4%) (3.9%)
Primarily because of the items discussed above under “Revenue” and“Operating Expenses,” total net operating income decreased by $11.9million in 2009 compared to 2008, and Same Store net operatingincome decreased by $13.3 million in 2009 compared to 2008.
The following information is provided to reconcile net loss to net oper-ating income:
For the Year Ended December 31,
(in thousands of dollars) 2009 2008
Net loss $ (90,091) $ (16,355)Adjustments:Depreciation and amortization
Wholly owned and consolidated partnerships 166,570 150,041Unconsolidated partnerships 8,144 8,361Discontinued operations 1,176 1,571
Interest expenseWholly owned and consolidated partnerships 133,460 115,013Unconsolidated partnerships 7,260 10,274Discontinued operations 104 535
Gains on sales of interests in real estate (923) —Gains on sales of non-operating real estate (3,388) —Gains on sales of discontinued operations (9,503) —Gain on extinguishment of debt (27,047) (27,074)Impairment of assets and abandoned
project costs 75,012 28,889Other expenses 37,727 40,561Interest and other income (3,035) (4,499)Net operating income $ 295,466 $ 307,317

62 MANAGEMENT’S DISCUSSION AND ANALYSIS
Funds From Operations
The National Association of Real Estate Investment Trusts (“NAREIT”)defines Funds From Operations, which is a non-GAAP measure, asincome before gains and losses on sales of operating properties andextraordinary items (computed in accordance with GAAP); plus realestate depreciation; plus or minus adjustments for unconsolidatedpartnerships to reflect funds from operations on the same basis. Wecompute Funds From Operations by taking the amount determinedpursuant to the NAREIT definition and subtracting dividends on pre-ferred shares (“FFO”) (for periods during which we had preferredshares outstanding).
Funds From Operations is a commonly used measure of operating per-formance and profitability in the real estate industry, and we use FFOand FFO per diluted share and OP Unit as supplemental non-GAAPmeasures to compare our Company’s performance for different periodsto that of our industry peers. Similarly, FFO per diluted share and OPUnit is a measure that is useful because it reflects the dilutive impact ofoutstanding convertible securities. In addition, we use FFO and FFOper diluted share and OP Unit as one of the performance measures fordetermining bonus amounts earned under certain of our performance-based executive compensation programs. We compute Funds FromOperations in accordance with standards established by NAREIT, lessdividends on preferred shares (for periods during which we had pre-ferred shares outstanding), which may not be comparable to FundsFrom Operations reported by other REITs that do not define the term inaccordance with the current NAREIT definition, or that interpret thecurrent NAREIT definition differently than we do.
FFO does not include gains and losses on sales of operating real estateassets, which are included in the determination of net income in accor-dance with GAAP. Accordingly, FFO is not a comprehensive measure ofour operating cash flows. In addition, since FFO does not includedepreciation on real estate assets, FFO may not be a useful perform-ance measure when comparing our operating performance to that ofother non-real estate commercial enterprises. We compensate for
these limitations by using FFO in conjunction with other GAAP financialperformance measures, such as net income and net cash provided byoperating activities, and other non-GAAP financial performancemeasures, such as net operating income. FFO does not represent cashgenerated from operating activities in accordance with GAAP andshould not be considered to be an alternative to net income (deter-mined in accordance with GAAP) as an indication of our financialperformance or to be an alternative to cash flow from operating activi-ties (determined in accordance with GAAP) as a measure of ourliquidity, nor is it indicative of funds available for our cash needs, includ-ing our ability to make cash distributions.
We believe that net income is the most directly comparable GAAPmeasurement to FFO. We believe that FFO is helpful to managementand investors as a measure of operating performance because itexcludes various items included in net income that do not relate to orare not indicative of operating performance, such as various non-recur-ring items that are considered extraordinary under GAAP, gains onsales of operating real estate and depreciation and amortization ofreal estate.
FFO was $73.1 million for the year ended December 31, 2009, adecrease of $67.9 million, or 48%, compared to $141.0 million for2008. FFO decreased because of the decrease in net income as aresult of impairment losses, higher property operating expenses andhigher interest expense, partially offset by a gain on extinguishment ofdebt. FFO per share decreased $1.74 per share to $1.69 per share forthe year ended December 31, 2009, compared to $3.43 per share forthe year ended December 31, 2008.
The shares used to calculate both FFO per basic share and FFOper diluted share include common shares and OP Units not held by us.FFO per diluted share also includes the effect of commonshare equivalents.
The following information is provided to reconcile net loss to FFO, andto show the items included in our FFO for the periods indicated:
For the Year Ended Per share For the Year Ended Per share(in thousands of dollars) December 31, 2009 (including OP Units) December 31, 2008 (including OP Units)
Net loss $ (90,091) $ (2.08) $ (16,355) $ (0.40)Adjustments:Gains on sales of discontinued operations (9,503) (0.22) — —Gains on sales of interest in real estate (923) (0.02) — —Depreciation and amortization:
Wholly owned and consolidated partnerships(1) 164,284 3.80 147,435 3.59Unconsolidated partnerships(1) 8,144 0.19 8,361 0.20Discontinued operations(1) 1,176 0.02 1,571 0.04
Funds from operations(2) $ 73,087 $ 1.69 $ 141,012 $ 3.43Impairment of assets 74,254 1.72 27,592 0.67Gain on extinguishment of debt (27,047) (0.63) (27,074) (0.66)Funds from operations as adjusted $ 120,294 $ 2.78 $ 141,530 $ 3.45Weighted average number of shares outstanding 40,953 38,807Weighted average effect of full conversion of OP Units 2,268 2,236Effect of common share equivalents 12 14Total weighted average shares outstanding, including OP Units 43,233 41,057
(1) Excludes depreciation of non-real estate assets and amortization of deferred financing costs.(2) Includes the non-cash effect of straight-line rent of $1.3 million and $2.0 million for the twelve months ended December 31, 2009 and 2008, respectively.
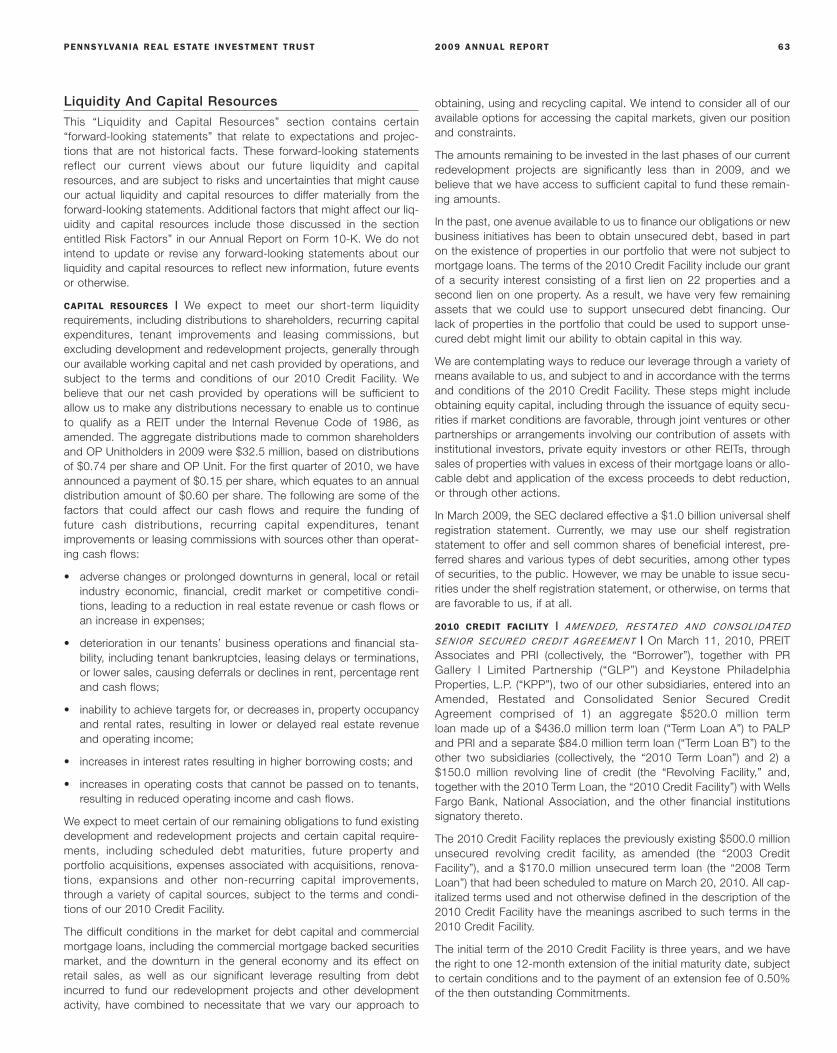
PENNSYLVANIA REAL ESTATE INVESTMENT TRUST 2009 ANNUAL REPORT 63
Liquidity And Capital Resources
This “Liquidity and Capital Resources” section contains certain“forward-looking statements” that relate to expectations and projec-tions that are not historical facts. These forward-looking statementsreflect our current views about our future liquidity and capitalresources, and are subject to risks and uncertainties that might causeour actual liquidity and capital resources to differ materially from theforward-looking statements. Additional factors that might affect our liq-uidity and capital resources include those discussed in the sectionentitled Risk Factors” in our Annual Report on Form 10-K. We do notintend to update or revise any forward-looking statements about ourliquidity and capital resources to reflect new information, future eventsor otherwise.
CAPITAL RESOURCES | We expect to meet our short-term liquidityrequirements, including distributions to shareholders, recurring capitalexpenditures, tenant improvements and leasing commissions, butexcluding development and redevelopment projects, generally throughour available working capital and net cash provided by operations, andsubject to the terms and conditions of our 2010 Credit Facility. Webelieve that our net cash provided by operations will be sufficient toallow us to make any distributions necessary to enable us to continueto qualify as a REIT under the Internal Revenue Code of 1986, asamended. The aggregate distributions made to common shareholdersand OP Unitholders in 2009 were $32.5 million, based on distributionsof $0.74 per share and OP Unit. For the first quarter of 2010, we haveannounced a payment of $0.15 per share, which equates to an annualdistribution amount of $0.60 per share. The following are some of thefactors that could affect our cash flows and require the funding offuture cash distributions, recurring capital expenditures, tenantimprovements or leasing commissions with sources other than operat-ing cash flows:
• adverse changes or prolonged downturns in general, local or retailindustry economic, financial, credit market or competitive condi-tions, leading to a reduction in real estate revenue or cash flows oran increase in expenses;
• deterioration in our tenants’ business operations and financial sta-bility, including tenant bankruptcies, leasing delays or terminations,or lower sales, causing deferrals or declines in rent, percentage rentand cash flows;
• inability to achieve targets for, or decreases in, property occupancyand rental rates, resulting in lower or delayed real estate revenueand operating income;
• increases in interest rates resulting in higher borrowing costs; and
• increases in operating costs that cannot be passed on to tenants,resulting in reduced operating income and cash flows.
We expect to meet certain of our remaining obligations to fund existingdevelopment and redevelopment projects and certain capital require-ments, including scheduled debt maturities, future property andportfolio acquisitions, expenses associated with acquisitions, renova-tions, expansions and other non-recurring capital improvements,through a variety of capital sources, subject to the terms and condi-tions of our 2010 Credit Facility.
The difficult conditions in the market for debt capital and commercialmortgage loans, including the commercial mortgage backed securitiesmarket, and the downturn in the general economy and its effect onretail sales, as well as our significant leverage resulting from debtincurred to fund our redevelopment projects and other developmentactivity, have combined to necessitate that we vary our approach to
obtaining, using and recycling capital. We intend to consider all of ouravailable options for accessing the capital markets, given our positionand constraints.
The amounts remaining to be invested in the last phases of our currentredevelopment projects are significantly less than in 2009, and webelieve that we have access to sufficient capital to fund these remain-ing amounts.
In the past, one avenue available to us to finance our obligations or newbusiness initiatives has been to obtain unsecured debt, based in parton the existence of properties in our portfolio that were not subject tomortgage loans. The terms of the 2010 Credit Facility include our grantof a security interest consisting of a first lien on 22 properties and asecond lien on one property. As a result, we have very few remainingassets that we could use to support unsecured debt financing. Ourlack of properties in the portfolio that could be used to support unse-cured debt might limit our ability to obtain capital in this way.
We are contemplating ways to reduce our leverage through a variety ofmeans available to us, and subject to and in accordance with the termsand conditions of the 2010 Credit Facility. These steps might includeobtaining equity capital, including through the issuance of equity secu-rities if market conditions are favorable, through joint ventures or otherpartnerships or arrangements involving our contribution of assets withinstitutional investors, private equity investors or other REITs, throughsales of properties with values in excess of their mortgage loans or allo-cable debt and application of the excess proceeds to debt reduction,or through other actions.
In March 2009, the SEC declared effective a $1.0 billion universal shelfregistration statement. Currently, we may use our shelf registrationstatement to offer and sell common shares of beneficial interest, pre-ferred shares and various types of debt securities, among other typesof securities, to the public. However, we may be unable to issue secu-rities under the shelf registration statement, or otherwise, on terms thatare favorable to us, if at all.
2010 CREDIT FACILITY | AMENDED, RESTATED AND CONSOLIDATED
SENIOR SECURED CREDIT AGREEMENT | On March 11, 2010, PREITAssociates and PRI (collectively, the “Borrower”), together with PRGallery I Limited Partnership (“GLP”) and Keystone PhiladelphiaProperties, L.P. (“KPP”), two of our other subsidiaries, entered into anAmended, Restated and Consolidated Senior Secured CreditAgreement comprised of 1) an aggregate $520.0 million termloan made up of a $436.0 million term loan (“Term Loan A”) to PALPand PRI and a separate $84.0 million term loan (“Term Loan B”) to theother two subsidiaries (collectively, the “2010 Term Loan”) and 2) a$150.0 million revolving line of credit (the “Revolving Facility,” and,together with the 2010 Term Loan, the “2010 Credit Facility”) with WellsFargo Bank, National Association, and the other financial institutionssignatory thereto.
The 2010 Credit Facility replaces the previously existing $500.0 millionunsecured revolving credit facility, as amended (the “2003 CreditFacility”), and a $170.0 million unsecured term loan (the “2008 TermLoan”) that had been scheduled to mature on March 20, 2010. All cap-italized terms used and not otherwise defined in the description of the2010 Credit Facility have the meanings ascribed to such terms in the2010 Credit Facility.
The initial term of the 2010 Credit Facility is three years, and we havethe right to one 12-month extension of the initial maturity date, subjectto certain conditions and to the payment of an extension fee of 0.50%of the then outstanding Commitments.
64 MANAGEMENT’S DISCUSSION AND ANALYSIS
We used the initial proceeds from the 2010 Credit Facility to repay out-standing balances under the 2003 Credit Facility and 2008 Term Loan.At closing, the $520.0 million 2010 Term Loan was fully outstandingand $70.0 million was outstanding under the Revolving Facility.
Amounts borrowed under the 2010 Credit Facility bear interest at a ratebetween 4.00% and 4.90% per annum, depending on our leverage, inexcess of LIBOR, with no floor. The initial rate in effect was 4.90% perannum in excess of LIBOR. In determining our leverage (the ratio ofTotal Liabilities to Gross Asset Value), the capitalization rate used tocalculate Gross Asset Value is 8.00%. The unused portion of theRevolving Facility is subject to a fee of 0.40% per annum.
The obligations under Term Loan A are secured by first priority mort-gages on 20 of our properties and a second lien on one property, andthe obligations under Term Loan B are secured by first priority lease-hold mortgages on the properties ground leased by GLP and KPP (the“Gallery Properties”). The foregoing properties constitute substantiallyall of our previously unencumbered retail properties.
We and certain of our subsidiaries that are not otherwise preventedfrom doing so serve as guarantors for funds borrowed under the 2010Credit Facility.
The aggregate amount of the lender Revolving Commitments and 2010Term Loan under the 2010 Credit Facility is required to be reduced by$33.0 million by March 11, 2011, by a cumulative total of $66.0 millionby March 11, 2012 and by a cumulative total of $100.0 million byMarch 11, 2013 (if we exercise our right to extend the TerminationDate), including all payments (except payments pertaining to theRelease Price of a Collateral Property) resulting in permanent reductionof the aggregate amount of the Revolving Commitments and 2010Term Loan.
The 2010 Credit Facility contains provisions regarding the applicationof proceeds from a Capital Event. A Capital Event is any event by whichwe raise additional capital, whether through an asset sale, joint venture,additional secured or unsecured debt, issuance of equity, or fromexcess proceeds after payment of a Release Price. Capital Events donot include Refinance Events or other specified events. After paymentof interest and required distributions, the Remaining Capital EventProceeds will generally be applied in the following order:
If the Facility Debt Yield is less than 11.00% or the Corporate DebtYield is less than 10.00%, Remaining Capital Event Proceeds will beallocated 25% to pay down the Revolving Facility (repayments of theRevolving Facility generally may be reborrowed) and 75% to pay downand permanently reduce Term Loan A (or Term Loan B if Term Loan Ais repaid in full) or, if the Revolving Facility balance is or would become$0 as a result of such payment, to pay down the Revolving Facility infull and to use any remainder of that 25% to pay down and perma-nently reduce Term Loan A (or Term Loan B if Term Loan A is repaid infull). So long as the Facility Debt Yield is greater than or equal to11.00% and the Corporate Debt Yield is greater than or equal to10.00% and each will remain so immediately after the Capital Event,and so long as either the Facility Debt Yield is less than 12.00% or theCorporate Debt Yield is less than 10.25% and will remain so immedi-ately after the Capital Event, the Remaining Capital Event Proceeds willbe allocated 75% to pay down the Revolving Facility and 25% to paydown and permanently reduce Term Loan A (or Term Loan B if TermLoan A is repaid in full) or, if the Revolving Facility balance is or wouldbecome $0 as a result of such payment, to pay down the RevolvingFacility in full and to use any remainder of that 75% for general corpo-rate purposes. So long as the Facility Debt Yield is greater than or
equal to 12.00% and the Corporate Debt Yield is greater than or equalto 10.25% and each will remain so immediately after the Capital Event,Remaining Capital Event Proceeds will be applied 100% to pay downthe Revolving Facility, or if the Revolving Facility balance is or wouldbecome $0 as a result of such payment, to pay down the RevolvingFacility in full and to use any remainder for general corporate purposes.Remaining proceeds from a Capital Event or Refinance Event relatingto Cherry Hill Mall will be used to pay down the Revolving Facility andmay be reborrowed only to repay our unsecured indebtedness.
The 2010 Credit Facility also contains provisions regarding the applica-tion of proceeds from a Refinance Event. A Refinance Event is anyevent by which we raise additional capital from refinancing of secureddebt encumbering an existing asset, not including collateral for the2010 Credit Facility. The proceeds in excess of the amount required toretire an existing secured debt will be applied, after payment of inter-est, to pay down the Revolving Facility, or if the Revolving Facilitybalance is or would become $0 as a result of such payment, to paydown the Revolving Facility in full and to use any remainder for generalcorporate purposes. Remaining proceeds from a Capital Event orRefinancing Event relating to the Gallery Properties may only be usedto pay down and permanently reduce Term Loan B (or, if the outstand-ing balance on Term Loan B is or would become $0 as a result suchpayment, to pay down Term Loan B in full and to pay any remainder inaccordance with the preceding paragraph).
A Collateral Property will be released as security upon a sale or refi-nancing, subject to payment of the Release Price and the absence ofany default or Event of Default. If, after release of a Collateral Property(and giving pro forma effect thereto), the Facility Debt Yield will be lessthan 11.00%, the Release Price will be the Minimum Release Price plusan amount equal to the lesser of (A) the amount that, when paid andapplied to the 2010 Term Loan, would result in a Facility Debt Yieldequal to 11.00% and (B) the amount by which the greater of (1) 100.0%of net cash proceeds and (2) 90.0% of the gross sales proceedsexceeds the Minimum Release Price. The Minimum Release Price is110% (120% if, after the Release, there will be fewer than 10 CollateralProperties) multiplied by the proportion that the value of the property tobe released bears to the aggregate value of all of the CollateralProperties on the closing date of the 2010 Credit Facility, multiplied bythe amount of the then Revolving Commitments plus the aggregateprincipal amount then outstanding under the 2010 Term Loan. Ingeneral, upon release of a Collateral Property, the post-release FacilityDebt Yield must be greater than or equal to the pre-release FacilityDebt Yield. Release payments must be used to pay down and perma-nently reduce the amount of the Term Loan.
The 2010 Credit Facility contains affirmative and negative covenantscustomarily found in facilities of this type, including, without limitation,requirements that we maintain, on a consolidated basis: (1) minimumTangible Net Worth of not less than $483.1 million, minus non-cashimpairment charges with respect to the Properties recorded in thequarter ended December 31, 2009, plus 75% of the Net Proceeds ofall Equity Issuances effected at any time after September 30, 2009; (2)maximum ratio of Total Liabilities to Gross Asset Value of 0.75:1; (3)minimum ratio of EBITDA to Interest Expense of 1.60:1; (4) minimumratio of Adjusted EBITDA to Fixed Charges of 1.35:1; (5) maximumInvestments in unimproved real estate and predevelopment costs notin excess of 3.0% of Gross Asset Value; (6) maximum Investments inPersons other than Subsidiaries, Consolidated Affiliates andUnconsolidated Affiliates not in excess of 1.0% of Gross Asset Value;(7) maximum Investments in Indebtedness secured by Mortgages infavor of the Company, the Borrower or any other Subsidiary not in

PENNSYLVANIA REAL ESTATE INVESTMENT TRUST 2009 ANNUAL REPORT 65
excess of 1.0% of Gross Asset Value on the basis of cost; (8) theaggregate value of the Investments and the other items subject to thepreceding clauses (5) through (7) shall not exceed 5.0% of Gross AssetValue; (9) maximum Investments in Consolidation Exempt Entities notin excess of 20.0% of Gross Asset Value; (10) a maximum Gross AssetValue attributable to any one Property not in excess of 15.0% of GrossAsset Value; (11) maximum Projects Under Development not in excessof 10.0% of Gross Asset Value; (12) maximum Floating RateIndebtedness in an aggregate outstanding principal amount not inexcess of one-third of all Indebtedness of the Company, itsSubsidiaries, its Consolidated Affiliates and its UnconsolidatedAffiliates; (13) minimum Corporate Debt Yield of 9.50%, provided thatsuch Corporate Debt Yield may be less than 9.50% for one period oftwo consecutive fiscal quarters, but may not be less than 9.25%; and(14) Distributions may not exceed 110% of REIT taxable income for afiscal year, but if the Corporate Debt Yield exceeds 10.00%, then theaggregate amount of Distributions may not exceed the greater of 75%of FFO and 110% of REIT Taxable Income (unless necessary for theCompany to retain its status as a REIT), and if a Facility Debt Yield of11.00% and a Corporate Debt Yield of 10.00% are achieved and con-tinuing, there are no limits on Distributions under the 2010 CreditFacility, so long as no Default or Event of Default would result frommaking such Distributions. We are required to maintain our status as aREIT at all times.
We may prepay the Revolving Facility at any time without premium orpenalty. We must repay the entire principal amount outstanding underthe 2010 Credit Facility at the end of its term, as the term may havebeen extended.
Upon the expiration of any applicable cure period following an event ofdefault, the lenders may declare all of the obligations in connection withthe 2010 Credit Facility immediately due and payable, and theCommitments of the lenders to make further loans under the 2010Credit Facility will terminate. Upon the occurrence of a voluntary orinvoluntary bankruptcy proceeding of the Company, PALP, PRI, anyowner of a Collateral Property or any Material Subsidiary, all outstand-ing amounts will automatically become immediately due and payableand the Commitments of the lenders to make further loans will auto-matically terminate.
EXCHANGEABLE NOTES | In May 2007, we, through PREIT Associates,completed the sale of $287.5 million aggregate principal amount of 4%Senior Exchangeable Notes due 2012 (“Exchangeable Notes”). The netproceeds from the offering of $281.0 million were used for the repay-ment of indebtedness under the 2003 Credit Facility, the cost of therelated capped call transactions, and for other general corporate pur-poses. The Exchangeable Notes are general unsecured seniorobligations of PREIT Associates and rank equally in right of paymentwith all other senior unsecured indebtedness of PREIT Associates.Interest payments, which are due on June 1 and December 1 of eachyear, began on December 1, 2007 and will continue until the maturitydate of June 1, 2012. PREIT Associates’ obligations under theExchangeable Notes are fully and unconditionally guaranteed by PREIT.
The Exchangeable Notes bear interest at 4.00% per annum andcontain an exchange settlement feature. Pursuant to this feature, uponsurrender of the Exchangeable Notes for exchange, the ExchangeableNotes will be exchangeable for cash equal to the principal amount ofthe Exchangeable Notes and, with respect to any excess exchangevalue above the principal amount of the Exchangeable Notes, at ouroption, for cash, common shares of the Company or a combination of
cash and common shares at an initial exchange rate of 18.303 sharesper $1,000 principal amount of Exchangeable Notes, or $54.64 pershare. The Exchangeable Notes will be exchangeable only undercertain circumstances. Prior to maturity, PREIT Associates may notredeem the Exchangeable Notes except to preserve our status as areal estate investment trust. If we undergo certain change of controltransactions at any time prior to maturity, holders of the ExchangeableNotes may require PREIT Associates to repurchase their ExchangeableNotes in whole or in part for cash equal to 100% of the principalamount of the Exchangeable Notes to be repurchased plus unpaidinterest, if any, accrued to the repurchase date, and there is a mecha-nism for the holders to receive any excess exchange value. TheIndenture for the Exchangeable Notes does not contain any financialcovenants.
In connection with the offering of the Exchangeable Notes, we andPREIT Associates entered into capped call transactions with affiliates ofthe initial purchasers of the Exchangeable Notes. These agreementseffectively increase the exchange price of the Exchangeable Notes to$63.74 per share. The cost of these agreements of $12.6 million wasrecorded in the shareholders’ equity section of our balance sheet.
Our Exchangeable Notes had a balance of $136.9 million and $241.5million (excluding debt discount of $4.7 million and $11.4 million) as ofDecember 31, 2009 and December 31, 2008, respectively. Interestexpense related to the Exchangeable Notes was $8.6 million, $11.5million and $7.4 million (excluding non-cash amortization of debt dis-count of $2.8 million, $3.5 million and $2.1 million) for the years endedDecember 31, 2009, 2008, and 2007 respectively. The ExchangeableNotes bear interest at a contractual rate of 4.00% per annum. TheExchangeable Notes had an effective interest rate of 5.85% for the yearended December 31, 2009, including the effect of the debt discountamortization.
In 2009 and 2008, we repurchased $104.6 million and $46.0 million,respectively, in aggregate principal amount of our Exchangeable Notesin privately negotiated transactions in exchange for an aggregate $47.2million in cash and 4.3 million common shares, with a fair market valueof $25.0 million, in 2009, and for $15.9 million in cash in 2008. We ter-minated an equivalent notional amount of the related capped calls in2009 and 2008.
We recorded gains on extinguishment of debt of $27.0 million and$27.1 million in 2009 and 2008, respectively. In connection with therepurchases, we retired an aggregate of $5.4 million and $3.0 million in2009 and 2008, respectively, of deferred financing costs anddebt discount.

66 MANAGEMENT’S DISCUSSION AND ANALYSIS
MORTGAGE FINANCE ACTIVITY | The following table presents the mortgage loans we or partnerships in which we own interests entered into sinceJanuary 1, 2007:
(in millions of dollars) Amount FinancedFinancing Date Property or Extended Stated Rate Hedged Rate Maturity
2007 Activity:May The Mall at Prince Georges(1) $ 150.0 5.51% fixed NA June 2017
2008 Activity:January Cherry Hill Mall(2)(3) 55.0 5.51% fixed NA October 2012February One Cherry Hill Plaza(1)(4) 5.6 LIBOR plus 1.30% NA August 2010May Creekview Center(5) 20.0 LIBOR plus 2.15% 5.56% June 2010June Christiana Center(1)(6) 45.0 LIBOR plus 1.85% 5.87% June 2011July Paxton Towne Centre(1)(6) 54.0 LIBOR plus 2.00% 5.84% July 2011September Patrick Henry Mall(7) 97.0 6.34% fixed NA October 2015September Jacksonville Mall(1)(8) 56.3 LIBOR plus 2.10% 5.83% September 2013September Logan Valley Mall(1)(8)(9) 68.0 LIBOR plus 2.10% 5.79% September 2013September Wyoming Valley Mall(1)(8)(10) 65.0 LIBOR plus 2.25% 5.85% September 2013October Whitehall Mall(11) 12.4 7.00% fixed NA November 2018November Francis Scott Key Mall(1) 55.0 LIBOR plus 2.35% 5.25% December 2013November Viewmont Mall(1) 48.0 LIBOR plus 2.35% 5.25% December 2013December Exton Square Mall(12) 70.0 7.50% fixed NA January 2014
2009 Activity:March New River Valley Center(13) 16.3 LIBOR plus 3.25% 5.75% March 2012June Pitney Road Plaza(14) 6.4 LIBOR plus 2.50% NA June 2010June Lycoming Mall(15) 33.0 6.84% fixed NA June 2014September Northeast Tower Center(16) 20.0 LIBOR plus 2.75% NA September 2011October Red Rose Commons(17) 23.9 LIBOR plus 4.00% NA October 2011
2010 Activity:January New River Valley Mall(1)(18) 30.0 LIBOR plus 4.50% 6.33% January 2013March Lycoming Mall(15) 2.5 6.84% fixed NA June 2014
(1) Interest only.(2) Supplemental financing with a maturity date that coincides with the existing first mortgage loan.(3) First 24 payments are interest only followed by principal and interest payments based on a 360-month amortization schedule.(4) In February 2008, we entered into this mortgage loan as a result of the acquisition of Bala Cynwyd Associates, L.P. The original maturity date of the mortgage loan was
August 2009, with two separate one year extension options. In June 2009, we made a principal payment of $2.4 million and exercised the first extension option.(5) The mortgage loan has a term of two years and three one-year extension options.(6) The mortgage loan has a term of three years and two one-year extension options.(7) Payments based on 25 year amortization schedule, with a balloon payment in October 2015.(8) The mortgage loan has a term of five years and two one-year extension options.(9) The mortgage loan bears interest at an annual rate equal to, at our election, LIBOR plus 2.10%, or a base rate equal to the prime rate, or if greater, the federal funds rate
plus 0.50%, plus a margin of 0.50%.(10) The mortgage loan bears interest at an annual rate equal to, at our election, LIBOR plus 2.25%, or a base rate equal to the prime rate, or if greater, the federal funds rate
plus 0.50%, plus a margin of 0.50%.(11) The unconsolidated partnership that owns Whitehall Mall entered into the mortgage loan. Our interest in the unconsolidated partnership is 50%.(12) Payments based on 30 year amortization schedule, with balloon payment in January 2014. The mortgage loan has a term of three years and two one-year extension
options.(13) The mortgage loan has a term of three years and two one-year extension options.(14) We have made draws of $6.4 million and a one time principal payment of $1.9 million in connection with the sale of a parcel at the property. The loan has one six-month
extension option during the construction period. We have the option to convert the loan to a two-year loan at the end of the construction period.(15) The mortgage loan agreement provides for a maximum loan amount of $38.0 million. The initial amount of the mortgage loan was $28.0 million. We took additional draws
of $5.0 million in October 2009 and $2.5 million in March 2010.(16) In October 2009, we repaid the $20.0 million mortgage loan on Northeast Tower Center in connection with the sale of a controlling interest in this property.(17) Interest only in its initial term. The unconsolidated partnership that owns Red Rose Commons entered into the mortgage loan. Our interest in the unconsolidated partner-
ship is 50%.(18) The mortgage loan has a three year term and one one-year extension option. $25.0 million of the principal amount was swapped to a fixed rate of 6.33%.

PENNSYLVANIA REAL ESTATE INVESTMENT TRUST 2009 ANNUAL REPORT 67
In July 2008, we repaid a $12.7 million mortgage loan on CrossroadsMall in Beckley, West Virginia, using funds from the 2003 Credit Facilityand available working capital.
In December 2008, we repaid a $93.0 million mortgage loan on ExtonSquare Mall in Exton, Pennsylvania using $70.0 million from a newmortgage on the property, the 2003 Credit Facility, the 2008 Term Loanand available working capital.
In January 2009, we repaid a $15.7 million mortgage loan on PalmerPark Mall in Easton, Pennsylvania using funds from the 2003 CreditFacility and the 2008 Term Loan.
In June 2009, we made a principal payment of $2.4 million and exer-cised the first one-year extension option on the mortgage loan on theOne Cherry Hill Plaza office building in Cherry Hill, New Jersey.
In July 2009, the unconsolidated partnership that owns Lehigh ValleyMall exercised its third extension option of a $150.0 million mortgageloan. We own an indirect 50% ownership interest in this entity.
In October 2009, we repaid the $20.0 million mortgage loan onNortheast Tower Center in Philadelphia, Pennsylvania in connectionwith the sale of a controlling interest in this property.
In November 2009, we entered into a one-year extension of a $34.3million mortgage loan secured by Valley View Mall in La Crosse,Wisconsin, with two additional six-month extension options.
In November 2009, the unconsolidated partnership that ownsSpringfield Mall exercised its third extension option of a $72.3 millionmortgage loan. We own an indirect 50% ownership interest inthis entity.
INTEREST RATE DERIVATIVE AGREEMENTS | As of December 31, 2009,we had entered into 12 interest rate swap agreements and one capagreement that have a weighted average rate of 3.29% on a notionalamount of $597.5 million maturing on various dates throughNovember 2013.
We entered into these interest rate derivatives in order to hedge theinterest payments associated with our 2009 and 2008 issuances offloating rate long-term debt. We assessed the effectiveness of theseswaps as hedges at inception and on December 31, 2009 and consid-ered these swaps to be highly effective cash flow hedges. Our interestrate swaps are net settled monthly.
As of December 31, 2009, the aggregate estimated unrealized net lossattributed to these interest rate derivatives was $14.6 million. The car-rying amount of the derivative assets is reflected in deferred costs andother assets, the associated liabilities are reflected in accruedexpenses and other liabilities and the net unrealized loss is reflected inaccumulated other comprehensive loss in the accompanyingbalance sheets.
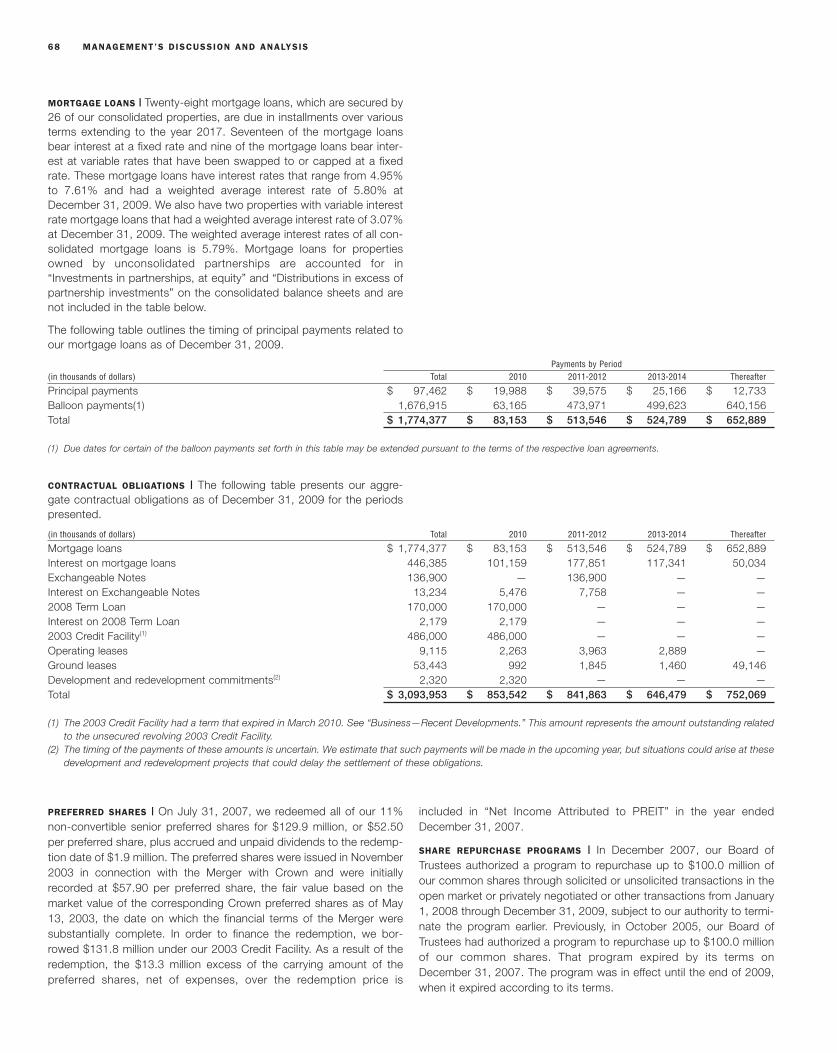
68 MANAGEMENT’S DISCUSSION AND ANALYSIS
MORTGAGE LOANS | Twenty-eight mortgage loans, which are secured by26 of our consolidated properties, are due in installments over variousterms extending to the year 2017. Seventeen of the mortgage loansbear interest at a fixed rate and nine of the mortgage loans bear inter-est at variable rates that have been swapped to or capped at a fixedrate. These mortgage loans have interest rates that range from 4.95%to 7.61% and had a weighted average interest rate of 5.80% atDecember 31, 2009. We also have two properties with variable interestrate mortgage loans that had a weighted average interest rate of 3.07%at December 31, 2009. The weighted average interest rates of all con-solidated mortgage loans is 5.79%. Mortgage loans for propertiesowned by unconsolidated partnerships are accounted for in“Investments in partnerships, at equity” and “Distributions in excess ofpartnership investments” on the consolidated balance sheets and arenot included in the table below.
The following table outlines the timing of principal payments related toour mortgage loans as of December 31, 2009.
Payments by Period(in thousands of dollars) Total 2010 2011-2012 2013-2014 Thereafter
Principal payments $ 97,462 $ 19,988 $ 39,575 $ 25,166 $ 12,733Balloon payments(1) 1,676,915 63,165 473,971 499,623 640,156Total $ 1,774,377 $ 83,153 $ 513,546 $ 524,789 $ 652,889
(1) Due dates for certain of the balloon payments set forth in this table may be extended pursuant to the terms of the respective loan agreements.
CONTRACTUAL OBLIGATIONS | The following table presents our aggre-gate contractual obligations as of December 31, 2009 for the periodspresented.
(in thousands of dollars) Total 2010 2011-2012 2013-2014 Thereafter
Mortgage loans $ 1,774,377 $ 83,153 $ 513,546 $ 524,789 $ 652,889Interest on mortgage loans 446,385 101,159 177,851 117,341 50,034Exchangeable Notes 136,900 — 136,900 — —Interest on Exchangeable Notes 13,234 5,476 7,758 — —2008 Term Loan 170,000 170,000 — — —Interest on 2008 Term Loan 2,179 2,179 — — —2003 Credit Facility(1) 486,000 486,000 — — —Operating leases 9,115 2,263 3,963 2,889 —Ground leases 53,443 992 1,845 1,460 49,146Development and redevelopment commitments(2) 2,320 2,320 — — —Total $ 3,093,953 $ 853,542 $ 841,863 $ 646,479 $ 752,069
(1) The 2003 Credit Facility had a term that expired in March 2010. See “Business—Recent Developments.” This amount represents the amount outstanding relatedto the unsecured revolving 2003 Credit Facility.
(2) The timing of the payments of these amounts is uncertain. We estimate that such payments will be made in the upcoming year, but situations could arise at thesedevelopment and redevelopment projects that could delay the settlement of these obligations.
PREFERRED SHARES | On July 31, 2007, we redeemed all of our 11%non-convertible senior preferred shares for $129.9 million, or $52.50per preferred share, plus accrued and unpaid dividends to the redemp-tion date of $1.9 million. The preferred shares were issued in November2003 in connection with the Merger with Crown and were initiallyrecorded at $57.90 per preferred share, the fair value based on themarket value of the corresponding Crown preferred shares as of May13, 2003, the date on which the financial terms of the Merger weresubstantially complete. In order to finance the redemption, we bor-rowed $131.8 million under our 2003 Credit Facility. As a result of theredemption, the $13.3 million excess of the carrying amount of thepreferred shares, net of expenses, over the redemption price is
included in “Net Income Attributed to PREIT” in the year endedDecember 31, 2007.
SHARE REPURCHASE PROGRAMS | In December 2007, our Board ofTrustees authorized a program to repurchase up to $100.0 million ofour common shares through solicited or unsolicited transactions in theopen market or privately negotiated or other transactions from January1, 2008 through December 31, 2009, subject to our authority to termi-nate the program earlier. Previously, in October 2005, our Board ofTrustees had authorized a program to repurchase up to $100.0 millionof our common shares. That program expired by its terms onDecember 31, 2007. The program was in effect until the end of 2009,when it expired according to its terms.

PENNSYLVANIA REAL ESTATE INVESTMENT TRUST 2009 ANNUAL REPORT 69
In 2007, we repurchased 152,500 shares at an average price of$35.67, or an aggregate purchase price of $5.4 million. The cumulativeamount of shares repurchased from the inception of our prior repur-chase program to December 31, 2008 was 371,200 shares, at anaverage price of $37.15, or an aggregate purchase price of $13.8million. We did not repurchase any shares in 2009.
Cash Flows
Net cash provided by operating activities totaled $136.1 million for theyear ended December 31, 2009, compared to $125.0 million for theyear ended December 31, 2008, and $149.5 million for the year endedDecember 31, 2007. The increase in 2009 as compared to 2008 wasprimarily due to changes in working capital, including a $2.4 millionincrease in accrued expenses compared to a $12.4 million decrease inaccrued expenses in 2008 and a $2.7 million decrease in tenantdeposits and deferred rent, partially offset by the factors discussed in“Results of Operations.”
Cash flows used for investing activities were $103.4 million for the yearended December 31, 2009, compared to $353.2 million for the yearended December 31, 2008, and $242.4 million for the year endedDecember 31, 2007. Investing activities for 2009 reflect investment inconstruction in progress of $128.4 million and real estate improve-ments of $39.1 million, all of which primarily relate to our developmentand redevelopment activities. Investing activities for 2009 also reflectproceeds of $62.6 million from the sale of real estate investments.Cash flows from investing activities for the year ended December 31,2008 reflect investment in construction in progress of $307.4 million,real estate improvements of $25.0 million and real estate acquisitionsof $11.9 million.
Cash flows provided by financing activities were $31.7 million for theyear ended December 31, 2009, compared to $210.1 million for theyear ended December 31, 2008, and $105.0 million for the year endedDecember 31, 2007. Cash flows provided by financing activities for theyear ended December 31, 2009 were primarily affected by $75.6million of proceeds from the mortgage loans on New River ValleyCenter, Pitney Road Plaza, Lycoming Mall and Northeast Tower Centeras well as $86.0 million in borrowings from the 2003 Credit Facility and$10.1 million of contributions from noncontrolling interests. We usedsome of these proceeds to repay the $20.0 million mortgage loan onNortheast Tower Center and to repay the $15.7 million mortgage loanon Palmer Park Mall, and to make a $2.4 million principal payment onthe mortgage loan on One Cherry Hill Plaza. Cash flows from financingactivities for the year ended December 31, 2009 were also affected bydividends and distributions of $32.5 million, principal installments onmortgage loans of $17.6 million, and payments of $47.2 million for therepurchase of Exchangeable Notes.
Commitments
At December 31, 2009, we had $2.3 million of unaccrued contractual obli-gations to complete current development and redevelopment projects.Total remaining costs for the particular projects with such commitmentsare $40.4 million. We expect to finance these amounts through borrow-ings under the 2010 Credit Facility or through various other capitalsources. See “— Liquidity and Capital Resources—Capital Resources.”
Environmental
We are aware of certain environmental matters at some of our proper-ties, including ground water contamination and the presence ofasbestos containing materials. We have, in the past, performed reme-diation of such environmental matters, and we are not aware of anysignificant remaining potential liability relating to these environmentalmatters. We may be required in the future to perform testing relating tothese matters. We have insurance coverage for certain environmentalclaims up to $10.0 million per occurrence and up to $20.0 million in theaggregate.
Competition and Tenant Credit Risk
Competition in the retail real estate industry is intense. We competewith other public and private retail real estate companies, includingcompanies that own or manage malls, strip centers, power centers,lifestyle centers, factory outlet centers, theme/festival centers andcommunity centers, as well as other commercial real estate developersand real estate owners, particularly those with properties near ourproperties, on the basis of several factors, including location and rentcharged. We compete with these companies to attract customers toour properties, as well as to attract anchor and in-line store tenants.We also compete to acquire land for new site development, duringmore favorable economic conditions. Our malls and our strip andpower centers face competition from similar retail centers, includingmore recently developed or renovated centers that are near our retailproperties. We also face competition from a variety of different retailformats, including internet retailers, discount or value retailers, homeshopping networks, mail order operators, catalogs, and telemarketers.This competition could have a material adverse effect on our ability tolease space and on the amount of rent that we receive. Our tenantsface competition from companies at the same and other properties andfrom other retail formats as well.
The development of competing retail properties and the relatedincreased competition for tenants might require us to make capitalimprovements to properties that we would have deferred or would nothave otherwise planned to make and might also affect the occupancyand net operating income of such properties. Any such capitalimprovements, undertaken individually or collectively, would be subjectto the terms and conditions of the 2010 Credit Facility and involvecosts and expenses that could adversely affect our resultsof operations.
We compete with many other entities engaged in real estate investmentactivities for acquisitions of malls, other retail properties and otherprime development sites, including institutional pension funds, otherREITs and other owner-operators of retail properties. Our efforts tocompete are also subject to the terms and conditions of our 2010Credit Facility. Given current economic, capital market and retail indus-try conditions, however, there has been substantially less competitionwith respect to acquisition activity in recent quarters. When we seek tomake acquisitions, these competitors might drive up the price we mustpay for properties, parcels, other assets or other companies or mightthemselves succeed in acquiring those properties, parcels, assets orcompanies. In addition, our potential acquisition targets might find ourcompetitors to be more attractive suitors if they have greaterresources, are willing to pay more, or have a more compatible operat-ing philosophy. In particular, larger REITs might enjoy significant
70 MANAGEMENT’S DISCUSSION AND ANALYSIS
competitive advantages that result from, among other things, a lowercost of capital, a better ability to raise capital, a better ability to financean acquisition, and enhanced operating efficiencies. We might notsucceed in acquiring retail properties or development sites that weseek, or, if we pay a higher price for a property and/or generate lowercash flow from an acquired property than we expect, our investmentreturns will be reduced, which will adversely affect the value ofour securities.
We receive a substantial portion of our operating income as rent underlong-term leases with tenants. At any time, any tenant having space inone or more of our properties could experience a downturn in its busi-ness that might weaken its financial condition. These tenants mightdefer or fail to make rental payments when due, delay or defer leasecommencement, voluntarily vacate the premises or declare bankruptcy,which could result in the termination of the tenant’s lease, and couldresult in material losses to us and harm to our results of operations.Also, it might take time to terminate leases of underperforming or non-performing tenants and we might incur costs to remove such tenants.Some of our tenants occupy stores at multiple locations in our portfo-lio, and so the effect of any bankruptcy of those tenants might be moresignificant to us than the bankruptcy of other tenants. In addition,under many of our leases, our tenants pay rent based on a percentageof their sales. Accordingly, declines in these tenants’ sales directlyaffect our results of operations. Also, if tenants are unable to complywith the terms of their leases, we might modify lease terms in ways thatare less favorable to us.
Seasonality
There is seasonality in the retail real estate industry. Retail propertyleases often provide for the payment of a portion of rent based on apercentage of a tenant’s sales revenue over certain levels. Income fromsuch rent is recorded only after the minimum sales levels have beenmet. The sales levels are often met in the fourth quarter, during theDecember holiday season. Also, many new and temporary leases areentered into later in the year in anticipation of the holiday season andthere is a higher concentration of tenants vacating their space early inthe year. As a result, our occupancy and cash flows are generallyhigher in the fourth quarter and lower in the first quarter, excluding theeffect of ongoing redevelopment projects. Our concentration in theretail sector increases our exposure to seasonality and is expected tocontinue to result in a greater percentage of our cash flows beingreceived in the fourth quarter.
Inflation
Inflation can have many effects on financial performance. Retail prop-erty leases often provide for the payment of rent based on apercentage of sales, which may increase with inflation. Leases mayalso provide for tenants to bear all or a portion of operating expenses,which may reduce the impact of such increases on us. However, rentincreases might not keep up with inflation, or if we recover a smallerproportion of property operating expenses, we might bear more costsif such expenses increase because of inflation.
Forward Looking Statements
This Annual Report for the year ended December 31, 2009, togetherwith other statements and information publicly disseminated by us,contain certain “forward-looking statements” within the meaning of theU.S. Private Securities Litigation Reform Act of 1995, Section 27A ofthe Securities Act of 1933 and Section 21E of the Securities ExchangeAct of 1934. Forward-looking statements relate to expectations,beliefs, projections, future plans, strategies, anticipated events, trendsand other matters that are not historical facts. These forward-lookingstatements reflect our current views about future events and aresubject to risks, uncertainties and changes in circumstances that mightcause future events, achievements or results to differ materially fromthose expressed or implied by the forward-looking statements. In par-ticular, our business might be affected by uncertainties affecting realestate businesses generally as well as the following, among otherfactors:
• our substantial debt and our high leverage ratio;
• constraining leverage, interest and tangible net worth covenantsunder our 2010 Credit Facility, as well as mandatory pay down andcapital application provisions;
• our ability to refinance our existing indebtedness when it matures;
• our ability to raise capital, including through the issuance of equitysecurities if market conditions are favorable, through joint venturesor other partnerships, through sales of properties, or through otheractions;
• our short- and long-term liquidity position;
• the effects on us of dislocations and liquidity disruptions in thecapital and credit markets;
• the current economic downturn and its effect on consumer confi-dence and consumer spending, tenant business and leasingdecisions and the value and potential impairment of our properties;
• increases in operating costs that cannot be passed on to tenants;
• our ability to maintain and increase property occupancy, sales andrental rates, including at our recently redeveloped properties;
• risks relating to development and redevelopment activities;
• changes in the retail industry, including consolidation and storeclosings;
• general economic, financial and political conditions, including creditmarket conditions, changes in interest rates or unemployment;
• concentration of our properties in the Mid-Atlantic region;
• changes in local market conditions, such as the supply of ordemand for retail space, or other competitive factors;
• potential dilution from any capital raising transactions;
• possible environmental liabilities;
• our ability to obtain insurance at a reasonable cost; and
• existence of complex regulations, including those relating to ourstatus as a REIT, and the adverse consequences if we were to failto qualify as a REIT.

PENNSYLVANIA REAL ESTATE INVESTMENT TRUST 2009 ANNUAL REPORT 71
Additional factors that might cause future events, achievements orresults to differ materially from those expressed or implied by ourforward-looking statements include those discussed in the sectionentitled “Risk Factors” in our Annual Report on Form 10-K. We do notintend to update or revise any forward-looking statements to reflectnew information, future events or otherwise.
Except as the context otherwise requires, references in this Annual Reportto “we,” “our,” “us,” the “Company” and “PREIT” refer to PennsylvaniaReal Estate Investment Trust and its subsidiaries, including our operatingpartnership, PREIT Associates, L.P. References in this Annual Report to“PREIT Associates” refer to PREIT Associates, L.P. References in thisAnnual Report to “PRI” refer to PREIT-RUBIN, Inc.
Quantitative And Qualitative Disclosures AboutMarket Risk
The analysis below presents the sensitivity of the market value of ourfinancial instruments to selected changes in market interest rates. As ofDecember 31, 2009, our consolidated debt portfolio consisted prima-rily of $486.0 million borrowed under our revolving 2003 Credit Facility,which bore interest at a LIBOR rate plus an applicable margin atDecember 31, 2009, $136.9 million of Exchangeable Notes, whichbear interest at 4.00%, excluding debt discount of $4.7 million, $170.0million borrowed under our senior unsecured 2008 Term Loan, whichbore interest at a weighted-average swapped fixed interest rate of5.29% at December 31, 2009 and $1,777.1 million in fixed and variablerate mortgage loans, including $2.7 million of mortgage debt premium.
Twenty-eight mortgage loans, which are secured by 26 of our consoli-dated properties, are due in installments over various terms extendingto the year 2017. Seventeen of the mortgage loans bear interest at afixed rate and nine of the mortgage loans bear interest at variable ratesthat have been swapped to or capped at a fixed rate. These mortgageloans have interest rates that range from 4.95% to 7.61% and had aweighted average interest rate of 5.80% at December 31, 2009. Wealso have two properties with variable interest rate mortgage loans thathad a weighted average interest rate of 3.07% at December 31, 2009.The weighted average interest rate of all consolidated mortgage loansis 5.79%. Mortgage loans for properties owned by unconsolidatedpartnerships are accounted for in “Investments in partnerships, atequity” and “Distributions in excess of partnership investments” on theconsolidated balance sheets and are not included in the table below.
Our interest rate risk is monitored using a variety of techniques. Thetable below presents the principal amounts of the expected annualmaturities and the weighted average interest rates for the principal pay-ments in the specified periods:
Fixed-Rate Debt Variable-Rate DebtWeighted Weighted
(in thousands of dollars) Principal Average Principal AverageYear Ended December 31, Payments Interest Rate Payments Interest Rate2010 $ 243,061 5.66% $ 496,092(1) 2.26% (2)
2011 $ 119,682 5.82% — —2012 $ 530,764 5.45% — —2013 $ 416,136 5.48% — —2014 $ 108,653 6.57% — —2015 and thereafter $ 652,889 5.60% — —
(1) Includes the unsecured revolving 2003 Credit Facility, which had a term thatwould have expired in March 2010. The 2003 Credit Facility was replacedby the 2010 Credit Facility.
(2) The 2003 Credit Facility interest rate is based on the weighted averageinterest rate in effect as of December 31, 2009.
Changes in market interest rates have different impacts on the fixedand variable portions of our debt portfolio. A change in market interestrates applicable to the fixed portion of the debt portfolio affects the fairvalue, but it has no effect on interest incurred or cash flows. A changein market interest rates applicable to the variable portion of the debtportfolio affects the interest incurred and cash flows, but does notaffect the fair value. The following sensitivity analysis related to the fixeddebt portfolio, which includes the effects of our interest rate swapagreements, assumes an immediate 100 basis point change in interestrates from their actual December 31, 2009 levels, with all other vari-ables held constant. A 100 basis point increase in market interest rateswould have resulted in a decrease in our net financial instrument posi-tion of $67.9 million at December 31, 2009. A 100 basis point decreasein market interest rates would have resulted in an increase in our netfinancial instrument position of $70.7 million at December 31, 2009.Based on the variable-rate debt included in our debt portfolio as ofDecember 31, 2009, a 100 basis point increase in interest rates wouldhave resulted in an additional $5.0 million in interest annually. A 100basis point decrease would have reduced interest incurred by $5.0million annually.
At December 31, 2008, a 100 basis point increase in market interestrates would have resulted in a decrease in our net financial instrumentposition of $56.5 million. A 100 basis point decrease in market interestrates would have resulted in an increase in our net financial instrumentposition of $59.5 million at December 31, 2008. Based on the variable-rate debt included in our debt portfolio as of December 31, 2008, a100 basis point increase in interest rates would have resulted in anadditional $4.0 million in interest annually. A 100 basis point decreasewould have reduced interest incurred by $4.0 million annually.
To manage interest rate risk and limit overall interest cost, we mayemploy interest rate swaps, options, forwards, caps and floors or acombination thereof, depending on the underlying exposure. Interestrate differentials that arise under swap contracts are recognized ininterest expense over the life of the contracts. If interest rates rise, theresulting cost of funds is expected to be lower than that which wouldhave been available if debt with matching characteristics was issueddirectly. Conversely, if interest rates fall, the resulting costs would beexpected to be higher. We may also employ forwards or purchasedoptions to hedge qualifying anticipated transactions. Gains and lossesare deferred and recognized in net income in the same period that theunderlying transaction occurs, expires or is otherwise terminated. Seenote 5 of the notes to our consolidated financial statements.
We have an aggregate $597.5 million in notional amount of swapagreements settling on various dates through November 2013.
Because the information presented above includes only those expo-sures that existed as of December 31, 2009, it does not considerchanges, exposures or positions which could arise after that date. Theinformation presented herein has limited predictive value. As a result,the ultimate realized gain or loss or expense with respect to interestrate fluctuations will depend on the exposures that arise during theperiod, our hedging strategies at the time and interest rates.

TRUSTEESUppEr row (FROM LEFT TO RIGHT)
dorriT J. BErn (3) Trustee Since 2009
Former Chairman, President and CEO
Charming Shoppes, Inc.
sTEphEn B. cohEn (2)(3) Trustee Since 2004
Professor of Law
Georgetown University
JosEph F. coradino Trustee Since 2006
President PREIT Services, LLC and PREIT-RUBIN, Inc.
Pennsylvania Real Estate Investment Trust
walTEr d’alEssio (1)(2) Trustee Since 2005
Vice Chairman
NorthMarq Capital
Edward a. GlickMan Trustee Since 2004
President and Chief Operating Officer
Pennsylvania Real Estate Investment Trust
rosEMariE B. GrEco (2) Trustee Since 1997
Senior Advisor, on Health Care Reform, to the
Governor of the Commonwealth of Pennsylvania
MiddlE row (FROM LEFT TO RIGHT)
lEE JaviTch (1)(3) Trustee Since 1985
Private Investor
Former Chairman and Chief Executive Officer
Giant Food Stores, Inc.
lEonard i. korMan (1)(2) Trustee Since 1996
Chairman and Chief Executive Officer
Korman Commercial Properties, Inc.
ira M. lUBErT (1) Trustee Since 2001Chairman Independence Capital Partners &Lubert-Adler Partners, L.P.donald F. MazzioTTi (1)(3) Trustee Since 2003
Managing Partner
Development equities & Advisories, LLC
lowEr row (FROM LEFT TO RIGHT)
Mark pasqUErilla Trustee Since 2003
President
Pasquerilla Enterprises, LP
Former Chairman and Chief Executive Officer
Crown American Realty Trust
John J. roBErTs (2)(3) Trustee Since 2003
Former Global Managing Partner
PricewaterhouseCoopers LLP
GEorGE F. rUBin Trustee Since 1997
Vice Chairman
Pennsylvania Real Estate Investment Trust
ronald rUBin Trustee Since 1997
Chairman and Chief Executive Officer
Pennsylvania Real Estate Investment Trust
OFFICE OF THE CHAIRMANronald rUBin
Chairman and Chief Executive Officer
GEorGE F. rUBin
Vice Chairman
Edward a. GlickMan
President and Chief Operating Officer
JosEph F. coradino
President PREIT Services, LLC and PREIT-RUBIN, Inc.
OFFICERSBrUcE GoldMan
Executive Vice President – General Counsel and
Secretary
doUGlas s. Grayson
executive Vice President – Development
JEFFrEy a. linn
Executive Vice President – Acquisitions
roBErT F. MccaddEn
Executive Vice President and Chief Financial Officer
TiMoThy r. rUBin
Executive Vice President – Leasing
(1) Member of Nominating and Governance Committee(2) Member of Executive Compensation and
Human Resources Committee(3) Member of Audit Committee
OFFICERS (CONTiNueD)
JosEph J. arisTonE
Senior Vice President – Leasing
JUdiTh E. BakEr
Senior Vice President – Human Resources
JonaThEn BEll
Senior Vice President and Chief Accounting Officer
ElainE BErGEr
Senior Vice President – Specialty Leasing
andrEw M. ioannoU
Senior Vice President – Capital Markets and Treasurer
dEBra l. laMBErT
Senior Vice President – Legal
Mario c. vEnTrEsca, Jr.
Senior Vice President – Asset Management
andrEw h. BoTTaro
Vice President – Development
BETh dEsisTa
Vice President – Specialty Leasing
anThony dilorETo
Vice President – Mall Leasing
daniEl G. donlEy
Vice President – Acquisitions
OFFICERS (CONTiNueD)
MichaEl a. FEnchak
Vice President – Asset Management
TiMoThy havEnEr
Vice President – Mall Leasing
david Marshall
Vice President – Financial Services
r. scoTT pETriE
Vice President – Retail Management
dan rUBin
Vice President – Redevelopment
M. daniEl scoTT
Vice President – Anchor and Outparcel Leasing
TiMoThy M. TrEMEl
Vice President – Construction and Design Services
JUdiTh G. Trias
Vice President – Retail Marketing
vincE vizza
Vice President – Mall Leasing
Mark T. wassErMan
Vice President – Development
nUriT yaron
Vice President – Investor Relations
72

INVESTOR INFORMATION
HEAdquARTERS 200 South Broad Street, Third Floor Philadelphia, PA 19102-3803 215.875.0700 215.875.7311 Fax 866.875.0700 Toll Free www.preit.com
INdEPENdENT REGISTEREd PuBLIC ACCOuNTING FIRM KPMG LLP 1601 Market Street Philadelphia, PA 19103–2499
LEGAL COuNSEL Drinker Biddle & reath LLP One Logan Square 18th & Cherry Streets Philadelphia, PA 19103–6996
TRANSFER AGENT ANd REGISTRAR For change of address, lost dividend checks, shareholder records and other shareholder matters, contact:
Mailing Address: Wells Fargo Shareowner Services P.O. Box 64856 St. Paul, MN 55164-0856 651.450.4064 (outside the United States) 651.450.4085 Fax 800.468.9716 Toll Free www.wellsfargo.com/shareownerservices
Street or Courier Address: Wells Fargo Shareowner Services 161 North Concord Exchange South St. Paul, MN 55075-1139
dISTRIBuTION REINVESTMENT ANd SHARE PuRCHASE PLAN The Company has a Distribution reinvestment and Share Purchase Plan for common shares (NYSE:PEI) that allows investors to invest directly in shares of the Company at a 1% discount with no transaction fee, and to reinvest their dividends at no cost to the shareholder. The minimum initial investment is $250, the minimum subsequent investment is $50, and the maximum monthly amount is $5,000, without a waiver.
Further information and forms are available on our web site at
www.preit.com under investor relations, DriP/Stock Purchase. You may also contact the Company or the Plan Administrator, Wells Fargo Shareowner Services, at 800.468.9716 or 651.450.4064.
INVESTOR INquIRIES Shareholders, prospective investors and analysts seeking information about the Company should direct their inquiries to:
INVESTOR RELATIONS Pennsylvania Real Estate Investment Trust 200 South Broad Street, Third Floor Philadelphia, PA 19102–3803 215.875.0735 215.546.2504 Fax 866.875.0700 ext. 50735 Toll Free Email: [email protected]
FORMS 10-K ANd 10-q; CEO ANd CFO CERTIFICATIONS The Company’s Annual Report on Form 10-K, including financial statements and a schedule, and quarterly Reports on Form 10-q, which are filed with the Securities and Exchange Commission, may be obtained without charge from the Company.
The Company’s chief executive officer certified to the New York Stock Exchange (NYSE) that, as of June 5, 2009, he was not aware of any violation by the Company of the NYSE’s corporate governance listing standards. The certifications of our chief executive officer and chief financial officer required under Section 302 of the Sarbanes-Oxley Act of 2002 were filed as Exhibits 31.1 and 31.2, respectively, to our Annual Report on Form 10-K for the year ended December 31, 2009.
NYSE MARKET PRICE ANd dISTRIBuTION RECORd The following table shows the high and low prices for the Company’s common shares and cash distributions paid for the periods indicated.
Distributions Paid per quarter Ended Common Calendar Year 2009 High Low Share
March 31 $ 8.71 $ 2.20 $ 0.29 June 30 $ 7.86 $ 3.45 0.15 September 30 $ 9.13 $ 3.87 0.15 December 31 $ 8.95 $ 6.80 0.15 $ 0.74
Distributions Paid per quarter Ended Common Calendar Year 2008 High Low Share
March 31 $ 29.70 $ 22.00 $ 0.57 June 30 $ 27.88 $ 23.00 0.57 September 30 $ 24.29 $ 16.57 0.57 December 31 $ 19.86 $ 2.21 0.57 $ 2.28
In February 2010, our Board of Trustees declared a cash dividend of $0.15 per share payable in March 2010. Our future payment of distributions will be at the discretion of our Board of Trustees and will depend on numerous factors, including our cash flow, financial condition, capital requirements, annual distribution requirements under the REIT provisions of the Internal Revenue Code and other factors that our Board of Trustees deems relevant.
As of December 31, 2009, there were approximately 3,500 registered shareholders and 18,600 beneficial holders of record of the Company’s common shares of beneficial interest. The Company had an aggregate of approximately 712 employees as of December 31, 2009.
STOCK MARKET New York Stock Exchange Common Ticker Symbol: PEI
ANNuAL MEETING The Annual Meeting of Shareholders is scheduled for 11:00 a.m. on Thursday, June 3, 2010 at the Hyatt at the Bellevue, 200 South Broad Street, Philadelphia, Pennsylvania.
PREIT IS A MEMBER OF: National Association of Real Estate Investment Trusts International Council of Shopping Centers Pension Real Estate Association Urban Land Institute
Des
ign:
Alle
man
n A
lmq
uist
& J
ones
; ed
itoria
l: A
my
Bin
der
; Maj
or P
hoto
grap
hy: A
llem
ann
Alm
qui
st &
Jon
es

Annual Report 2007
The paper used in this report contains 30%
recycled post-consumer waste.
The use of this recycled paper is consistent with
PREIT’s Green Enterprise Initiative.
1960–Pennsylvania Real Estate Investment Trust
Annual Report 2009
NEW AT 50
®
PENNSYLVANIA REAL ESTATE INVESTMENT TRUST
200 SOUTH BROAD STREET
PHILADELPHIA, PA 19102–3803
WWW.PREIT.COM
PE
NN
SY
LV
AN
IA R
EA
L E
STA
TE
INV
ES
TM
EN
T T
RU
ST
20
09
AN
NU
AL
RE
PO
RT