new approaches to monitoring of cardiac function - diva portal
TRANSCRIPT

New approaches to monitoring of cardiac function emil söderqvist
doctoral thesis, royal institute of technology, 2006
kth school of technology and health

- 2 -
© Emil Söderqvist, 2006
Division of Medical Engineering
Karolinska Institutet
KTH School of Technology and Health
ISBN-10: 91-7178-507-8
ISBN-13: 978-91-7178-507-7
TRITA-STH Report 2006:04
ISSN: 1653-3836
ISRN KTH /STH/--06:4--SE

- 3 -
“Science will always win.” - Fred Hassan, at the time chairman of the Board of Pharmacia, now
Chairman of the Board and Chief Executive Officer of the Schering-Plough Corporation.
“I have never created a more fictional character than the researching ‘I’ in my doctorate /.../ a
self that begins in pretended ignorance and then slowly arrives at knowledge, not at all in the
fitful, chancy way I myself arrived at it, but step by step, proof by proof, according to the rules.“
Sven Lindqvist, author and literature researcher.

- 4 -
Abstract
Left ventricular pumping performance may be described by intraventricular pressure and volume
variables, usually presented as a pressure-volume plot. However, on-line monitoring of left
ventricular pressure and volume with high temporal resolution requires the use of an invasive
catheter technique such as, for example, the conductance catheter method. On the other hand,
the very invasiveness and complexity of this approach makes it less suitable for clinical use. It is
then not surprising that there has been long-felt need to make the conductance method less
invasive and attempts have been made to adjust the method to clinical demands and routine in
order to extract more information from pressure-volume interplay and possibly translate relevant
data to their non-invasive estimates.
In the present studies, a standard five segmental conductance catheter was used in animal (pig)
experiments. Segmental conductances were compared to global conductance. Since the mid-
ventricular segment was shown to reflect global volume, which was also shown on theoretical
basis, it was concluded that a single segmental catheter most probably could be used to estimate
global left ventricular volume.
Subsequently, a thin and flexible single segmental conductance catheter was constructed and
applied to an animal (pig) experimental model. Results were reproducible and very few arrythmias
were detected.
At the next stage, left ventricular isovolumic phases were investigated using the standard
conductance catheter method, as well as echocardiographically derived tissue velocity doppler.
Conductance was shown to decrease during isovolumic contraction, and an adjustment method
was proposed in order to account for the subsequent decrease in pressure-volume loop area.
In separate experiments, the left ventricular pressure wave form during left ventricular systole
was examined, and an algorithm was proposed to discriminate between the changes in afterload,
preload and contractility. Results showed clearly discernible patterns of the respective load and
contractility alternation.
Finally, the left ventricular continuous area was monitored continuously during the entire cardiac
cycle as a measure of left ventricular volume dynamics in normal subjects and three patients with
left ventricular abnormalities using echocardiographic automatic boundary detection. The left
ventricular area thus obtained was plotted against its first derivative, to form a flow-volume
estimates loop, in accordance with the flow-volume examinations used in respiratory physiology.
Data obtained from the abnormal ventricles were presented as flow-volume estimates loops,
exemplifying the possible use of the method.

- 5 -
Contents
Abstract 214
Abbreviations and terminology 216
List of publications 217
Acknowledgements 218
Preface 219
Aims 210
(Patho-) Physiological background 211
Methods to measure and monitor left ventricular function 120
Methods 135
Results 144
Discussion 156
Conclusions 169
References 270
Appendix (papers) 179

- 6 -
Abbreviations and terminology (most relevant)
Much medical t erminology i s introduced and explained in the f i rs t paragraphs o f the thes is . adrenalin hormone that e.g. increases heart rate and contractility afterload load encountered by muscle during contraction aorta main artery, leading blood from the left ventricle arteriosclerosis calcification of artery artery vessel leading blood from the heart atrium chamber in the heart AV atrioventricular CAD coronary artery disease CT computed tomography, 3D x-ray imaging cardiac output blood volume pumped by the heart (per minute) cardiomyopathy disease exclusively in heart muscle CHF congestive heart failure cardiac relates to 'heart' cardiovascular heart and vessels conductance ability to lead current, opposite of electrical impedance contractility contraction ability coronary vessel supplying the heart with blood diastole heart's relaxation phase ECG electrocardiography, measuring electrical activity of the heart echocardiography ultrasound measurement on the heart EDPVR end-diastolic pressure-volume relationship ejection fraction percent of ventricular volume ejected during one heart beat ESPVR end-systolic pressure-volume relationship EW external stroke work gamma camera imaging technique using scintigraphy hypertrophy abnormal growth impedance here alternating pressure divided by alternating flow ischemia oxygen deficiency of local tissue isometric with constant length isovolumic with constant volume mitral valve valve between left atrium and ventricle MR magnetic resonance (imaging), 3D imaging technique myocardium heart muscle noradrenalin hormone that e.g. increases heart rate and contractility papillary muscle situated in the ventricles, connected to atrioventricular valves parallel conductance ~conductivity of tissues surrounding left ventricular blood volume preload load encountered by muscle before contraction PRSW preload recruitable stroke work pulmonary relates to 'lung' PV pressure-volume PVA total energy, EW plus potential energy SA sino-atrial scintigraphy technique to detect radio-isotope decay stroke volume ejected volume during one heart beat systole heart's contraction phase vein vessel leading blood to the heart vena cava vein ending in the right atrium ventricle chamber (in the heart)

- 7 -
List of publications
This thesis is based on the eight publications listed below, and will be referred to throughout this
work by their roman number, respectively.
I. AB. Ericsson, H. Kronander, E. Söderqvist, E. Vaage, LÅ. Brodin. Correlation between a mid-
ventricular volume segment and global left ventricular volume measured by the conductance
catheter. Scand Cardiovasc J, 35, pp. 129-135, May 2001.
II. E. Söderqvist, C. Carlsson, LÅ. Brodin, H. Elmqvist, H. Kronander, AB. Ericsson, Design of
a single segment conductance catheter for measurement of left ventricular volume. Proc. EMBC
2001, Istanbul, October 25-28, 2001, ISBN 0-7803-7213-1, IEEE catalogue number
01CH37272C.
III. C. Carlsson, E. Söderqvist, LÅ. Brodin, G. Källner, J. Hultman, H. Elmqvist, S. Saha, Initial
experience with A thin single segment pressure and conductance catheter for measurement of left
ventricular volume. Proc. EMBC 2001, Istanbul, October 25-28, 2001, ISBN 0-7803-7213-1,
IEEE catalogue number 01CH37272C.
IV. E. Söderqvist, C. Carlsson and LÅ. Brodin. Conductance measurements in the left ventricle: a
pressure-flow approach. IFMBE proc., ISSN 1680-0737, Vol 3, 2002, 2nd Eur. Medical and
Biological Engineering Conf., EMBEC '02, part 2, pp. 1012-3.
V. E. Söderqvist, H. Lang, G. Källner, J. Hultman, B. Lind, LÅ. Brodin. Left ventricular pressure
indicies help to evaluate loading conditions and contractility. IFMBE proc., ISSN 1680-0737, Vol
3, 2002, 2nd Eur. Medical and Biological Engineering Conf., EMBEC '02, part 2, pp. 1014-5.
VI. E. Söderqvist, C. Storaa A.B. Ericsson and LÅ. Brodin. Ultrasound tissue doppler
measurements imply that conductance changes in the left ventricle during isovolumic phases are
due to tissue motion. IFMBE proc., ISSN 1680-0737, Vol 3, 2002, 2nd Eur. Medical and
Biological Engineering Conf., EMBEC '02, part 2, pp. 1016-7.
VII. E. Söderqvist, J. Hultman, G. Källner, J. Nowak and LÅ. Brodin. Assessment of acute load
and contractility changes by left ventricular pressure measurements. Accepted 2006 for
publication in Physiological Measurement.
VIII. E. Söderqvist, P. Cain, J. Nowak and LÅ. Brodin. Feasibility of creating estimates of left
ventricular flow-volume dynamics using echocardiography
Accepted 2006 for publication in Cardiovascular Ultrasound.

- 8 -
Acknowledgements
There are a number of persons who have been inevitable for the process of writing this thesis,
and some others to mention for the process of keeping the author inspired and alive.
I am grateful to Lars-Åke Brodin for letting me be part of his fantastic world of ideas. Most of
the work presented has evolved from there. Jacek Nowak has introduced the difficult words
‘why’ and ‘how’ in my vocabulary; he has also been supportive whenever I could find the
answers. It is obvious that this thesis could not have been written without his generous help. Stig
Ollmar has supported me with scientific stringency seriousness and positve encouragement.
Håkan Elmqvist has always been supportive, with full of ideas, and was positive and encouraging.
Camilla Brown, my former co-worker in the project, particularly during the hard days of animal
experiments, and Camilla Storaa, also a former graduate student at the institution have been
wonderfull to discuss science with, or just talk to during, you know, the ‘black’ days.
Tommy Ribbe has been very helpful and has made a lot of contributions to the construction of
the measurement equipment, as has been Jan Bergholm. All of the staff at the division of Medical
Engineering, Karolinska Institutet, have been supportive throughout the years. I am thankful to
them for their patience with me.
I am indebted to Anders Ericsson and Håkan Kronander who introduced me into the subject,
and shared data, knowledgde, and time with great generosity.
Göran Källner and Jan Hultman, the respective experts in thoracic surgery and anaesthesia, have
been the central, positive and helpful during all of the experiments. I am also thankful to the staff
at The Animal Research Laboratory, Uppsala University, Agneta and Karin. You were most kind
and professional.
Many thanks to Britta Lind for being always positive, with helpful attitude, and moreover for
teaching me how to deal with the scientists! And to Peter Cain: to work with him was joyful and
rewarding.
While writing this, my thoughts is with my family. Thank you for all support, all help, and love.
I dedicate my thesis to my children.
_________________________________
The studies were also supported, by grants, from
Swedish Heart Lung Foundation, Swedish Medical Research Council (grant no. 11235), NUTEK
/ VINNOVA (grant no. P11343), Swedish Foundation for Strategic Research through
CORTECH (grant no. R98:023), Karolinska Institutet and Karolinska University Hospital

- 9 -
Preface
In our days and in the western part of the world, cardiovascular disease is the most common
cause of death. In EU, 39 % of all deaths are caused by cardiovascular disease, and in particular,
17 % of all deaths are caused by coronary heart disease. In Sweden, the figures are even greater -
47 and 22 %, respectively. (All data valid for 2004. Source: WHO.)
However, no one lives forever, and data above may not be too discouraging. It is remarkable,
though, that people in productive age increasingly die from cardiovascular disease, which perhaps
could be prevented. It is known, for example, that different behavioural factors, such as smoking,
high blood pressure, and disturbed balance of blood fat, increase the risk of cardiovascular
disease (Persson 2003). Anyhow, cardiovascular disease is common, and resarch in risk factors,
pathophysiology, diagnosis, and therapy is getting even broader and deeper. In the following
survey, a small number of cardiovascular research topics will be presented.
Firstly, the physiology and some pathophysiology of the heart, relevant for the thesis, is
overviewed. Secondly, different cardiac monitoring techniques is presented. Pressure and volume
measurements and analysis are in focus. Thirdly, the work is presented in terms of methods,
results, discussion and conclusions.
The main focus of this thesis has been on the pumping performance of the left ventricle of the
heart that pumps oxygenated blood to all the cells in the body. However, the obtained results
may be applicable to the right ventricle as well.
The text is intended match a reader who is used to the research literature, but who is not familiar
with medical terminology. Every such term is defined when first used. The presentation goes
from a medical overview to a more detailed technological survey, and from prerequisites to
conclusions. It also quite well follows the author’s development and knowledge.
Huddinge 9th of November, 2006.

- 10 -
Aims
The pumping performance of the ventricles of the heart, both right and left, can be well
described through continuous monitoring of the intraventricular pressure and volume. This type
of monitoring is rarely used due to the invasiveness of the method and complexity of the
procedure.
One problem regarding the presently used evaluations of the pumping ability of the heart,
especially on the left side, is that they are mostly indirect, and hence that conclusions are drawn
from estimates. Pressure values such as end-diastolic pressure and systolic pressure is estimated
from the pulmonary artery and arterial systemic pressure, respectively. Volumes are even more
complicated to estimate on-line.
The general aims have therefore been to both develop invasive measurement techniques that is
harmless and accurate, and to develop other and hopefully better estimates of cardiac
performance. Hence, the aims were can be summarized as:
o To develop a thin and less harmful pressure-volume catheter in order to monitor left
ventricular performance
o To investigate if single segments of the conductance catheter accurately reflects acute
volume changes
o To evaluate conductance data in order to determine the cause of and possibly adjust for
isovolumic irregularities
o To evaluate volume and pressure data in order to extract more information, potentially
useful also for non-invasive estimates of left ventricular function
o To evaluate echocardiographically obtained left ventricular continuous area, in order to
improve the non-invasive detection of abnormalities in left ventricular function

- 11 -
(Patho-) Physiological background
Diseases influencing cardiac performance
Briefly, some frequently occuring heart diseases are presented here, with focus on cause, and
effect on left ventricular performance:
- Coronary artery disease, CAD, develops in most cases as a result of coronary arteriosclerosis.
Both predisposing heredity and factors such as age, smoking, diabetes mellitus, and disturbed
lipid metabolism increase risk. CAD may lead to several different complications, such as angina
pectoris, caused by constricted coronary arteries and insufficient blood supply to the heart muscle
which becomes ischemic (i.e. not enough perfused and oxygenated). Myocardial infarction (heart
attack) is another common complication. As the myocardium becomes hypoxic, the heart may
fail to increase coronary blood flow to meet increased demands, and the characteristic pain in the
chest and left arm might develop. In the chronic state, the heart might compensate through
myocardial hypertrophy (myocardial growth), to increase its capacity.
- Congestive heart failure, CHF, is more of a symptom than a disease, and may have several
different causes. CHF is therefore a state in which the heart (e.g. the left ventricle) is incapable of
delivering enough blood volume (cardiac output) to meet the oxygen demands of the body. One
of the causes might be myocardial infarction, with myocardial cell death and reduced pumping
ability as a consequence.
- Cardiomyopathy is best characterised as a diffuse myocardial disease that is not attributable to
pressure or volume overload, or to segmental loss of muscle function secondary to ischemic
damage. The cause might be hereditary and the disease includes several subgroups such as, for
example, hypertrophic cardiomyopathy, resulting in restricted diastolic filling and obstructed
systolic ejection, or dilated cardiomyopathy with ventricular dilatation and impairment of systolic
function.
The heart and the circulatory system
Deoxygenated blood returns through the veins to the right atrium, and flows further through the
tricuspid valve into the right ventricle. It is subsequently ejected by the contraction of the right
ventricle through the pulmonary valve into the pulmonary artery to be oxygenated in the lungs, in
the capillaries surrounding the pulmonary alveoli. The oxygenated blood returns to the left
atrium through pulmonary veins. As the mitral valve opens, the blood flows into the left ventricle
and is subsequently ejected by the left ventricular contraction via the aortic valve into the aorta
that branches into several arteries, arteriole, and capillaries, to supply oxygen to all cells. The
cardiac valves permit only unidirectional blood flow, and prevent backflow.

- 12 -
Every heart beat is initiated by electrical pulses generated by specialized cells in the sino-atrial
(SA) node, located in the upper part of the right atrium. The SA node-generated pulses spread
through the atrial tissue causing atrial contraction, and then further down to the atrio-ventricular
(AV) node and specialized conducting system in the ventricles, finally inducing ventricular
contraction.
The left ventricle, basics
The contracting left ventricle supplies energy to the systemic vascular system by building up
arterial pressure. As a consequence, the blood flows forward to the lower pressure compartment
of the capillaries.
Since this flow normally requires a mean systemic arterial pressure of about 100 mmHg (13.3
kPa), the left ventricle, contracting at rates of 60 beats per minute at rest and increasing during
exercise, is constantly exposed to high load and has to deliver enough work to overcome this
load. Since about 100 ml is ejected with every beat, the required 'lifetime achievement' of the left
ventricle can be calculated through multiplying pressure and volume, which expressed in Joules
amounts closely to as many seconds as it has to work. This amount of work, 2500-3000 MJ, is
almost equal to the work required to lift the Empire State Building one meter, or to lift an
elephant from sea level up to Mount Everest peak 10 times. The power developed in the left
ventricular contraction is about 2.5 W, since contraction time constitutes about 40% of the heart
cycle.
The phases of the left ventricle
- Ventricular systole: After the electrical pulse has passed through the AV node at atrio-
ventricular junction and spreads through intraventricular conducting system, the myocardium of
the ventricle starts to contract. This results in a torsional (wringing) motion, accompanied by
longitudinal shortening pulling the AV plane downwards towards the apex (Lundback 1986,
Henein and Gibson 1999). The intracavital pressure rises and the mitral valve closes. Pressure
rises until it exceeds aortic pressure - and ejection of blood into the aorta can start. Systole ends
when the ventricle starts to relax. The pressure falls, and the aortic valve closes (backward flow
mediated).
- Ventricular diastole: As the aortic valve closes, pressure in the relaxing ventricle continues to
fall. When the left ventricular pressure falls below left atrial pressure, the mitral valve opens and
filling from the atrium starts, accompanied by the recoil of the AV plane towards the base.
Diastolic left ventricular filling is divided into two portions, rapid and slow, based on the rate of

- 13 -
change of ventricular volume with respect to time. The rapid filling phase is normally short, with
a high filling rate, and ends when pressures in atrium and ventricle are equilibrated and slow
filling ensues. Late in diastole the atrium contracts (atrial systole), and an additional small amount
of blood pass into the ventricle, while the AV plane moves upwards towards the base of the
heart.
- Isovolumic or isovolumetric phases: During short periods of time before and after the
systolic ejection, both valves of the left ventricle are closed and no blood enters or leaves the
ventricle. These periods are therefore called isovolumic phases: IVC for contraction and IVR for
relaxation. Both are of diagnostic interest since the rates of pressure rise and fall, and changes in
myocardial motion velocities during these phases may reflect myocardial ischemia. (Gibson et al.
1976).
Left ventricular pressure, volume, and flow
Left ventricular pressure and volume during one cardiac cycle are plotted in figure 1, to the left.
The blood volume is decreasing (ejected into the aorta) during systole and increasing during
diastole (flow from the left atrium). To the right, the first derivatives of pressure (dp/dt) and
volume (dV/dt) are presented. Maximum dP/dt is sometimes used to estimate the contraction
ability of the myocardium. dV/dt can be regarded as flow into and out from the left ventricle.
This will be further explored below.
Figure 1. To the left, pressure (P) and volume (V) are plotted against time. The pressure
curve is dashed. To the right, the first derivatives, dP/dt (dashed) and dV/dt, of the data are
presented.
Time
Pre
ssur
e an
d V
olum
e
Time
dP/d
t an
d dV
/dt

- 14 -
Preload
Preload on a single muscle is established by a force before the start of contraction, stretching the
muscle to an initial length (Sonnenblick 1962a). For an intact heart, preload may be defined as
left ventricular volume, since increasing volume stretches the myocardium, and thus the length of
all the individual cardiac muscles. It has been shown that, to a certain extent, the longer the
muscle, the more work can be performed by the muscle (Sonnenblick 1962a, Sonnenblick and
Downing 1963). Hence, for an intact heart, the greater the volume in the ventricle at the onset of
the contraction, the greater volume will be ejected (into the aorta). This is also known as Frank-
Starling's law (Frank 1895, Patterson et al. 1914).
Preload may change on a beat-to-beat basis as part of normal physiological variations, for
example as a result of increased venous return when a person lies down. The increased preload
will result in increased pumping ability of the left ventricle due to lengthening of muscle fibres,
and the extra volume will be ejected.
On the other hand, in pathological situations, when the distensibility of the myocardium is
decreased, preload may not increase sufficiently to match the needs of the tissues. For example, it
has been shown that normal increase in sympathetic activity leading to increased contractility
does not change the distensibility of the left ventricular myocardium (Sonnenblick et al. 1963),
but ischemic heart disease does so. Through compensatory mechanisms, pathological decrease of
distensibility will produce high end-diastolic pressures (Smiseth et al. 1991). In such situations, a
normal increase in preload will result in a pathological increase in filling pressure, regulated to
some extent by atrial contraction.
Afterload
Afterload is defined as the load on the single muscle when attempting to shorten. For an intact
heart, afterload may be regarded as the resistance to shortening of the ventricular myocardium,
and is encountered only during contraction (Sonnenblick and Downing 1963).
Sonnenblick et al. used mean aortic pressure as an estimate of afterload, but many other
suggestions have been discussed, e.g. mean left ventricular pressure, peak left ventricular pressure
and aortic input impedance (Noble 1979, Nichols and Pepine 1982, Piene and Myhre 1984).
Elzinga and Westerhof showed that the curve shape of left ventricular pressure changes in
accordance to arterial impedance, which fact can be taken to imply that mean left ventricular
pressure would be better measure of left ventricular load than peak pressure (Elzinga and
Westerhof 1973, Noble 1979). Elzinga et al. used a mean value over a complete heart cycle, but a

- 15 -
more appropriate load characterisation would perhaps be the mean left ventricular pressure
during ejection (Buoncristiani et al. 1973).
Taken together, afterload is somewhat difficult to estimate in the intact heart. A longer discussion
will follow below.
Contractility
For a given preload and afterload of a muscle, contractility (or inotropy) may be defined as the
ability to perform a certain amount of work given these premises. Contractility may be altered
using pharmacological interventions, e.g. increased through infusion of noradrenalin.
Contractility also changes with heart rate and nervous (sympathetic) stimulation.
In a myocardium with given preload and afterload, an increase in myocardial contractility will
result in increase of the force developed by the muscle and increased velocity of contraction, but
will also decrease the time of contraction (Sonnenblick 1962a). (In skeletal muscle, velocity of
contraction is constant during physiological conditions.)
In the intact heart, contractility of the left ventricle is difficult to estimate. The maximum first
derivative of pressure (dP/dt) max, mostly timed within the contraction phase before opening of
the aortic valve, i.e. during isovolumic contraction phase, is not affected by afterload unless aortic
end-diastolic pressure is low (Mason 1969). It is, however, dependent on preload since increased
preload and thus increased muscle length results in increased isometric contraction velocity
(Sonnenblick 1962a, Siegel and Sonnenblick 1963). On the other hand, the maximum of the first
derivative of force divided by integrated isometric force (dT/IIT) should be constant (Siegel and
Sonnenblick 1963). In that perspective, (dP/dt/P)max for the intact heart should be a better
estimate; this quotient for isometric (i.e for the left ventricle: isovolumic) contraction has been
shown to be almost independent of preload and afterload, but increases with heart rate,
noradrenalin infusion and Ca2++ infusion (Siegel and Sonnenblick 1963, Mason et al. 1970, Mason
et al. 1971). It should be noted that dP/dt and P should be timed within the isovolumic phase
and be simultaneous.
However, Kass et al showed that the contractility indices (dP/dt)max, (dP/dt/P)max, and
(dP/dt)max/Ved (Ved : end-diastolic volume) were all dependent on loading, although the two latter
to a lesser degree (Kass et al. 1987).
Another index could be (dP/dt/∫P), in concordance with the single muscle preparations
mentioned above (the quotient dT/IIT being constant for constant contractility), and with intra-
isovolumic limits as mentioned. Contractility indices will be further explored in sections of the
pressure-volume measurements, below.

- 16 -
Stroke volume and cardiac output
The stroke volume (SV) of a normal man is about 100 ml; for a woman about 80. At rest, normal
heart rate (HR) is 60 beats/min, giving a cardiac output (CO) of 4-7 litres/min. CO is regulated
to be proportional to body demand of oxygen. During exercise, CO can increase to 25 litres/min,
or more. CO increases or decreases mainly by changes in heart rate, although there may be
present an SV regulation, too (Warner and Toronto 1960). A long term effect of exercise is an
increase in SV and decrease in resting HR. Stroke volume is obviously affected by preload and
contractility.
Ejection fraction
A commonly used measure of left ventricular performance is ejection fraction (EF), defined as
stroke volume expressed as percentage of end-diastolic volume. Values above 50 % are
considered to indicate normal systolic left ventricular function. (This implies that 50% of
ventricular volume will not be ejected during systole and constitutes left ventricular residual
volume.)
EF does not say anything about stroke volume, or cardiac output, or whether the heart ejects
volume matching the systemic requirements of oxygenated blood or not, but it only implicates if
the pump function is normal (Carabello 2003). EF may be calculated from ultrasound
data/images.
In patients with diastolic heart failure as, for example, left ventricular hypertrophy, ejection
fraction may be normal despite clear clinical signs and symptoms of diastolic heart failure (Zile et
al. 2001). It seems that in these cases EF alone is not sufficiently good measure of left ventricular
function, but other echocardiographic methods may be employed in order to confirm the
diastolic dysfunction.
Work of the left ventricle
The work or power of the left ventricle depends on inotropic state of the cardiac muscle, its
initial length and the afterload (Sonnenblick 1962b).
The experiments of Sonnenblick and Downing showed that for a given left ventricular preload
and contractility, left ventricular work is primarily dependent on afterload (Sonnenblick and
Downing 1963). These experiments, performed both on a single papillary muscle and on an
intact feline heart, demonstrated that work performed by the left ventricle, or by the cardiac
single muscle preparation, is a function of arterial blood pressure or afterload, whereas stroke
volume is independent of arterial blood pressure (within physiological ranges). This implies that

- 17 -
in order to decrease left ventricular work load with sustained stroke volume and performance,
arterial blood pressure has to be decreased.
Coupling between the left ventricle and the arteries
It should be emphasized that the left ventricle is a part of the circulatory system. Consequently,
changes in either venous return or peripheral resistance or compliance will affect left ventricular
performance.
For example, imagine yourself about to lift a very heavy stone. As you are preparing for this
enormous task, your nervous system might signal to adrenal glands to infuse adrenalin into your
circulatory system - in order to increase your muscle capacity. But as you take a big breath and
finally lift the stone you discover that it is made of papier-mâché. Surprised by the lightness of
the object, and your muscles already tense and in a lifting dynamic state, you will not be able to
adjust the power of the muscles. Therefore the lift will be too fast and uncontrolled. You might
even loose balance and fall backwards. Next time, however, you will probably not make the same
mistake.
It should not be forgotten in this context, that for different people there exists a maximum
weight of a real stone that is possible to lift, and probably also an ideal weight at which the stone
can be lifted with speed and control.
In this example, in order to explain the muscular performance, it is necessary to describe not only
the strength of the muscles or the tension before lifting, but also the shape and weight of the
stone. The example thus illustrates the aspect of heart physiology regarding preload, afterload and
contractility.
In order to explain left ventricular performance and function, it is necessary to include parts of
the circulatory system coupled to the left ventricle and affecting its performance during diastole
or systole.
Arterial impedance
It should be kept in mind that the arterial tree is more or less compliant to the pressure pulses. A
mathematical model of the arterial tree using a three-element windkessel was proposed (Tozeren
and Chien 1985), along with electrical equivalents (Piene 1984). Elzinga and Westerhof
performed experiments on isolated feline hearts, in which the heart ejected into an arrangement
of tubes that could be easily adjusted to desired resistance and compliance (Elzinga and
Westerhof 1973). The results indicated that the arterial tree can be described by an input
impedance (Noble et al. 1967), independent of the heart having its own internal impedance. In

- 18 -
other words, pressure waves and flow waves look different for the same heart working against
arteries differing in either compliance or resistance.
Flow and pressure, and the arterial tree, may thus be described with electrical equivalents, i.e.
current and voltage for flow and pressure, and resistance, capacitance and inductance for radius,
compliance, and blood mass, respectively.
Further, if source impedance is calculated, i.e. mean left ventricular pressure divided by mean
flow, a measure of pumping ability may be calculated. The pumping ability calculated in this way
was shown to decrease during myocardial infarction (Elzinga and Westerhof 1976).
Arterial pressure wave form and reflections
Taking into account the results of research on afterload and arterial impedance, it is not possible
to disregard the impact of the reflected pressure waves in the arterial system. Since the arterial
input impedance has a frequency dependence, it also has a characteristic impedance. It has been
shown that the characteristic impedance is the average of absolute impedance at frequencies > 2
Hz, and that oscillations around the characteristic impedance are due to reflections of the
pressure (Noble 1979, Nichols et al. 1980).
The pressure wave propagates from the proximal aorta to the distal arteries with a pulse wave
velocity of about 5 m/s. In the distal arteries, due to bifurcations and increased muscular content
of the vessel walls, parts of the pulse wave are reflected. During physiological conditions, the
returning wave returns to the ascending aorta during diastole, thus increasing diastolic pressure.
With age or high blood pressure, pulse wave velocity is increased due to increased stiffnes of the
central arteries (e.g. aorta) and the reflected waves coincide with the late phase of ventricular
systole (Safar et al. 2003).
Reflections returning during ventricular systole, i.e. when the aortic valve is open, augment
central aortic and left ventricular systolic pressure, but reduce central aortic diastolic pressure
(Safar et al. 2003, O'Rourke and Pauca 2004). Such systolic augmentation has been shown to
increase risk for coronary artery disease (Weber et al. 2004) and left ventricular hypertrophy
(O'Rourke 2004).
The ascending aortic wave form can be deducted from pulse wave in the radial artery, using
empirical mathematical equations (Soderstrom et al. 2002, Adji and O'Rourke 2004).
Recently, wave-intensity analysis has been applied to the investigation of arterial blood flow and
pressure waves. The analysis can in a more precise way deduce origin and effect of any wave.
Application of this technique to coronary blood flow has highlighted the importance of the
diastolic decompression of the coronary microvasculature. This decompression is disturbed and

- 19 -
reduced in patients with left ventricular hypertrophy (Davies et al. 2006). A disadvantage of the
method is its invasive nature of measurement, i.e. both instant pressure and flow must be
measured intraarterially.
Matching of left ventricular - aortic coupling
Ross suggested in 1976 that there exists some form of matching between the left ventricle and
arterial pressure, and that alterations in left ventricular function, e.g. acute heart failure, leads to
some degree of mismatch (Ross 1976). One line of research made probable that the left ventricle
normally performs at work optimum or power optimum, as a function of stroke volume (van den
Horn et al. 1985, Myhre et al. 1986, van den Horn et al. 1986, Myhre et al. 1988, Toorop et al.
1988). A flaw of this concept is the fact that the authors cannot present any possible
physiological regulatory mechanism.
Sunagawa and colleagues have suggested a model, based on end-systolic elastance, valid for the
ventricle and corresponding elastance for the arterial tree (Sunagawa et al. 1984). Matching would
then occur when slopes of these elastances are equal, transferring maximal energy from the
ventricle to the arteries. However, this model does not take into account the time-varying
properties of arterial elastance, which in fact has been shown to vary along with pressure (Berger
and Li 1992).
Another study suggests that matching strives to adapt the system to optimal oxygen consumption
(i.e. maximising of output power/oxygen consumption) by the left ventricle (Burkhoff and
Sagawa 1986).
The outcome of this research is unclear, but the raised questions may have some clinical
implications, for example, choice of therapy in the peri- and post-operative phases for thoracic
surgery (Ross 1976).

- 20 -
Methods to measure and monitor left ventricular function
Overview
Apart from physical examination that include the important methodology of auscultation (i.e.
listening with stethoscope), a number of more technically advanced methods are available to
diagnose and differentiate heart diseases. ECG detects abnormalities in cardiac electrical activity;
a number of x-ray type examinations (including computed tomography, CT) can be performed to
detect coronary stenosis, hypertrophy, anatomical irregularities, etc. Using cardiac catheterisation,
pressures and flows values can be obtained, whereas regional myocardial blood flow may be
qualitatively determined using radio-isotope injection followed by scintigraphy using a gamma
camera. The method of magnetic resonance (MR) has now quite high frame rate and may be used
both to answer morphological questions and to measure flow and myocardial displacement
(Persson 2003).
Below, two methods to measure left (or right) ventricular function are presented: pressure-
volume measurements using a designated catheter, and cardiac ultrasound. A number of studies
can be performed using these techniques. Pressure-volume measurements are invasive, and more
often used in animal experiments as a reference method to evaluate, for example, ultrasound
methodology.
Pressure and volume measurements
The pumping function of the cardiac ventricles can be described by simultaneously measured
pressure and volume (figure 2). Pressure is plotted against volume to form a pressure-volume
(PV) loop.
Figure 2. Pressure and volume (PV) loop for one heart beat. Systole starts with a rapid
pressure increase in the lower right hand corner. Blood ejection into the aorta starts between
80 and 90 mmHg.

- 21 -
Pressure measurement
Pressure is measured using a transducer mounted on a catheter, positioned to measure the static
part of the pressure, and hopefully not any kinetic components. Absolute pressure values of the
left ventricle can only be obtained invasively. Some comments about bandwidth of fluid-filled
pressure catheters and sampling frequency are made in the Discussion.
Volume measurements
Volume measurements of the left ventricle are far more difficult, since for most of the time, the
valves (i.e. aortic and mitral valves) are open and the atrio-ventricular (AV) plane is moving.
Hence, the volume of the left ventricle is not easy to define and measure.
Regarding spatial resolution, volume can be measured by, for example, ultrasound, magnetic
resonance (MR) or computed tomography (CT), but the temporal resolution of these techniques
is still not enough high for on-line monitoring. Furthermore, practical reasons limit their use in
on-line, long-term measurements.
There are some other techniques, e.g. metallic radiopaque markers and sonomicrometry, but they
are not used in clinical practice because of their invasiveness (Rankin et al. 1976, Vine et al. 1976).
Conductance
In 1981, Baan and co-workers presented a new volume measurement technique, which was based
on conductance measurement (Baan et al. 1981, Baan et al. 1984). A weak alternating current (0.4
mA peak-to-peak, 20 kHz) between two electrodes induces an electrical field in the blood. The
potential is measured by six sensing electrodes in between the two current electrodes. The six
sensing elctrodes thus form five segments, each one delivering a voltage output. Since the
conductance of the blood itself is constant (neglecting long term changes in haematocrite) the
measured voltage will be proportional to blood resistivity, and thus inversely proportional to the
conductance or amount of blood between the sensing electrodes. The segmental conductances
are then summed to reflect total cavity volume.
Baan and his collegues proposed to use the method to measure blood volume in the left ventricle
with the catheter positioned inside the ventricle, via the aortic valve.
Since then, improvements have been made in the calibration methods, in the positioning of the
electrodes, and in electrical field characteristics (see below). However, the method is basically the
same today as it was initially described

- 22 -
Figure 3. The multi-electrode conductance catheter introduced by Baan et al.
- Calibration methods -
A calibration method for the conductance catheter has been proposed by Baan and his co-
workers (Baan et al. 1981, Baan et al. 1984, Baan et al. 1989). The slope factor α and parallel
conductance Gp must be determined, and blood conductivity must be measured at least every
half hour for long term studies, and after fluid injections. α and Gp function as gain and offset,
where α is determined through a cardiac output measurement, and Gp through injection of a
hypertonic bolus of saline. The bolus can be injected in the pulmonary artery, or if this is
impossible, in vena cava inferior (Steendijk and Baan 2000).
In other words, the dynamic range of the conductance signal has to be multiplied with a
calibration factor (α) to reflect the amount of blood ejected into aorta per beat. Then, as parallel
conductance is contributing with an offset to the volume signal, since current leaking out of the
left ventricle will decrease the current density within the ventricle and thus decrease the measured
voltage. This offset (Gp) has to be removed to allow the conductance signal to reflect 'true'
volume.
Since the introduction of the conductance catheter, other calibration techniques have been
described - particularly regarding the parallel conductance Gp. Three different techniques are
presented: 1) the dual frequency method, 2) development of the dilution technique, and 3) the
volume reduction technique.
The dual frequency technique, described originally by Gawne et al. 1987, is based on the
observation that surrounding structures have different frequency characteristics compared to
blood: a dual frequency catheter system could then, in theory, automatically separate the two
(blood from tissue), and thus calculate Gp (Gawne et al. 1987). This concept has been later

- 23 -
evaluated in another study that produced negative results (White et al. 1998). However, the
method is still of interest in Gp-determination in mice (Feldman et al. 2000, Georgakopoulos and
Kass 2000, Uemura et al. 2004). Theoretically, this technique is very elegant, since Gp can be
estimated without any further manipulation that might be harmful to the patient.
The dilution technique still uses a bolus of hypertonic saline, but instead of extrapolating to the
point where blood conductivity is zero, the area below the dilution curve is analysed (Kornet et
al. 2000). In this way, a better reproducibility is achieved, and fewer injections are needed.
The third technique described is a development of a suction technique, where the left ventricle is
emptied – the conductance thus measured is equal to Gp (Baan et al. 1984, Tachibana et al. 1997).
The method is for understandable reasons not applicable in clinical use. Instead, the inflow of
blood from vena cava inferior or superior is reduced, and the volume curve is extrapolated to
zero (White et al. 2001), allowing calculation of Gp. The procedure may save both time and
decrease risk for the patient: since this is the same method to determine the slope of ESPVR (see
below), Gp and ESPVR can be determined simultaneously.
- Calibration discussion -
The parallel conductance Gp has become thouroughly investigated, probably because of the
difficulty to measure it accurately. For example, the saline bolus itself has been reported to effect
the measured variable, as well as bolus temperature (Herrera et al. 1999). Other evaluated
variables possibly affecting parallel conductance include lung insufflation, and left ventricular
volume (Boltwood et al. 1989, Applegate et al. 1990, Szwarc et al. 1994, Szwarc and Ball 1998).
Furthermore, different studies propose that Gp does or does not vary during the cardiac cycle,
and that the slope factor α varies during a heart beat (Lankford et al. 1990, Szwarc et al. 1995).
The results of a recent study imply though, that Gp does indeed vary significantly during the
cardiac cycle (Kornet et al. 2001).
In one early study, relative volumes were measured, but with a much lower frequency than
otherwise used (McKay et al. 1984). These investigators suggested that, for current with lower
frequencies, a bigger percent of the current will stay within the ventricle, due to the myocardium’s
much higher impedance at lower frequencies (typically < 5kHz). These results are in favour of
the dual frequency method.

- 24 -
- Dual field catheters -
Implicit in the volume calculation from conductance data, an assumption is made that the
electrical field is homogeneous. Since this is not the case, especially in larger ventricles, a dual-
field catheter was introduced (Steendijk et al. 1992, Steendijk et al. 1993). Proximal and distal to
the existing pair of current electrodes, another electrode pair was positioned. These electrodes
generate current with the same frequency, but with opposite polarity. The combination of two
pairs of current electrodes was suggested to give a more homogenous field, and thus a more
linear relation between true volume and volume estimate from the conductance method
(Steendijk et al. 1992). This was reported to be generally true although results were not perfect,
especially not for larger ventricles (Steendijk et al. 1993, Wu et al. 1997).
Regarding II and III, the small diameter of the catheter makes it impossible to add an extra pair
of electrodes, and thus two extra cables inside the catheter. Hence, the dual field technique is not
applicable.
- Number of electrodes and electrode positions -
Baan et al. introduced at first a catheter with 8 electrodes (which was later modified to include 10
or 12 electrodes), forming 5 measuring segments. However, during the 90s, studies have been
carried out in mice, rats and rabbits using different types of single-segment conductance catheters
(Abe et al. 1995, Georgakopoulos et al. 1998, Feldman et al. 2000). In these cases, only global
volume was of interest since, for example, the analysis of PV-relations in mice are often done to
relate gene products to phenotype (Feldman et al. 2000). Since a global decrease (or increase) of
the heart function was expected, a single segment catheter was assumed to be sufficient to
estimate left ventricular function in these settings.
In the studies mentioned here, the single segment was covering almost the entire length of the
ventricle (long axis), which made it possible, at least in theory, to measure true volume. If, on the
other hand, the segment is shorter than the ventricle, only the part of the volume in between the
electrodes will be included. Thus, the measurement can not, even in theory, be anything else but
an estimate of true left ventricular volume. Some related measurements and calculations are made
in I and II.
To add to this discussion, Spinelli and Valentinuzzi have performed theoretical studies on the 8-
electrode conductance catheter (Spinelli and Valentinuzzi 1986). They suggest that the most
proximal current electrode should be positioned outside the aortic valve, and the closest
measuring electrode should be positioned within the ventricle as far away as possible from the
proximal current electrode. Thus, these electrode positions should constitute a compromise

- 25 -
between linearity (conductance to volume), and the volume not seen by the first measuring
segment. A similar discussion can be made for the distal electrodes.
- Conductance catheters in the clinic -
Most studies using the conductance catheter are experimental and concern animal models. In the
clinic, the conductance catheter is not used in daily routine, but constitutes an analytical tool for
evaluation of different methods in cardiac surgery, effects of drug therapy, and so on (Caputo et
al. 2000). A few studies will be mentioned here:
Only one year after introducing the conductance technique in 1981, Baan et al. reported on the
use of this catheter in humans for measurements of relative volumes (i.e. without calibration)
(Baan et al. 1982). Two years later, the same group introduced the technique for measurements of
true volume, including calibration methods to determine the gain factor (α) and the parallel
conductance (Gp) (Baan et al. 1984).
Kass et al. reported on the use of the same technique in humans, but the pressure-volume
relationship was measured through inferior vena cava occlusion (Kass et al. 1988). More on this
in sections below. Apart from a pressure-conductance catheter which was positioned in the left
ventricle, an IVC (inferior vena cava) balloon occlusion catheter was introduced through a
femoral vein.
The conductance derived pressure-volume loops were obtained in seven patients undergoing
cardiac bypass surgery, implying that the catheter technique may be a useful tool for the
estimation of left ventricular performance after by-pass surgery (Schreuder et al. 1991). Bishop et
al. studied the conductance technique in the right ventricle (RV) and found the method
applicable as well (Bishop et al. 1997a, Bishop et al. 1997b).
Another study showed no interference of conditions normally encountered during cardiac
surgery (e.g. changes in heart rate, viscosity, temperature, salinity) on the conductance-measured
volume (Al-Khalidi et al. 1998).
In all studies mentioned in this section, calibrations were done using of saline or glucose bolus
injection for parallel conductance determination and thermodilution for α. Later on, new
methods have been developed. See Calibration methods for details.
Differentiation between calibration with opened contra closed thorax are important, as the
different pressure situations will affect both pressure and volume.

- 26 -
- Some limitations of the conductance catheter technique -
There are some limitations in the technique described above. For example, the calibration
methods alone can not be used in patients suffering from aortic regurgitation (Dekker et al.
2002). In such cases, the amount of regurgitation has to be determined by another method.
Some studies have, on theoretical grounds, pointed out some methodological problems, because
some of the model concepts presupposed in the method are not true, e.g. left ventricular
segments are not cylindrical in shape, electrical field is not homogenous, and the catheter is
neither immobile during measurements nor positioned in the center of the left ventricle, etc.
(Spinelli and Valentinuzzi 1986, Salo 1989, Woodard et al. 1989, Kun and Peura 1993).
Unfortunately, most of the suggestions for corrections emanating from these studies have not
been applied to experimental set-ups in vivo.
- Concluding remarks on conductance volumetry -
In the clinical situations, many causes of errors must be avoided and problems have to be solved.
For example respiration, opened or closed chest, frequency (or dual frequency) choice, changes in
blood resistivity, position and displacement of the catheter, and electrode positioning will all
affect the conductance signal or the true volume itself.
The quality and usefulness of the obtained data are probably correlated both to the applicability
of the method (how user-friendly it could be), and to the risk for the patient.

- 27 -
Pressure and volume analysis
The pressure-volume (PV) loop was used for the first time for measurments of the output power
in the age of steam engines. In medicine, the first man to apply the pressure-volume relations was
Frank who measured these variables in frog hearts (Frank 1895). Due to misinterpretation of the
data, these relations did not arouse any interest until more than half a century later, when Sarnoff
(Sarnoff and Berglund 1954) popularised the use of the stroke work-preload relationship (Sagawa
et al. 1988).
The PV-loop has some interesting features. First, its area is equal to performed work per heart
beat. Second, for a heart with given contractility, a change in preload or afterload will change the
appearence of the PV-loop, but the changes will not exceed the established limits of the end-
systolic pressure-volume relationship, ESPVR, and the end-diastolic pressure-volume
relationship, EDPVR (figure 4). These relations were first assumed to be independent of loading
conditions (see Alternatives to ESPVR, below). However, ESPVR changes with contractility and
may be used as a contractility index.
Third, the energy consumption of the heart is closely related to the PV-loop area plus the area
representing the potential energy, i.e. area defined by ESPVR, the isovolumic relaxation period of
the PV-loop, and a straight line from V0 to Ved (Suga et al. 1981, Foex and Leone 1994).
Figure 4. PV-loop with principal end-systolic and end-diastolic relations.

- 28 -
- Determination of ESPVR -
The ESPVR can neither be determined from a single PV-loop, nor from a set of practically
similar loops. This is because the intercept with the volume axis (V0) is not equal to zero. V0 also
changes with increasing or decreasing contractility, and with different kinds of heart diseases
(Sagawa et al. 1988).
ESPVR must be determined from the upper left corner of the PV-loop, at end-systole. However,
end-systole must then be defined. End-ejection would be intuitive to use, but another definition
has been suggested: end-systole as the point of maximum elastance Emax=P/(V-V0) (Sagawa et al.
1988). This point is in most cases close to end-ejection, but for some cases it is not. For example,
in the case of low pulmonary resistance, the PV-loop measured in the right ventricle will have a
pronounced rounded upper left “corner”. End-systole without the above mentioned definition of
maximum elastance, will be hard to find.
Since V0 is not known but necessary in order to calculate Emax, an iterative algorithm is used.
An accurate method to practically determine the slope of ESPVR and its intercept with the
volume axis, seems to be to inflate a balloon in the vena cava inferior (i.e. to reduce preload), and
thus decrease pressure in the left ventricle as much as 20 to 30 % within 6-8 beats (Kass et al.
1986). This makes it possible to determine the slope and intercept before the baroreceptors react
and cause a sympathetic change in contractility (figure 5). Elevation of airway pressure in order to
reduce preload has also been proposed (Haney et al. 2002).
Figure 5. The vena cava inferior is occluded, which induces a volume decrease. The ESPVR
can be calculated by linear regression. EDPVR can be determined through the same preload
reduction manoevre, but must be fitted to an exponential function.

- 29 -
- External stroke work, pressure-volume area and energy consumption -
The energy imparted to the blood, i.e. external stroke work EW, equals the area of the PV-loop.
The energy consumed by the heart during a cardiac cycle, excluding basal metabolism and
calcium handling, is represented by the PV-loop area (EW) plus the area named potential energy
in figure 6.
Figure 6. The potential energy defined as the area limited by the two straight lines and the
left hand side of the PV-loop. The straight lines are calculated from the formula E=P/(V-V0),
i.e. maximum and minimum elastance.
The sum of the areas, the systolic pressure-volume area (PVA), is thus closely related to
myocardial oxygen consumption. A formula for use in dogs has been proposed (Sagawa et al.
1988):
VO2 = 1.8*10-5 * PVA + 0.0018*Emax + 0.010 = A + B + C
where VO2 denotes myocardial oxygen consumption, and Emax is equal to the slope of ESPVR.
The formula consists of three parts, where A is referring to actual tension and shortening of the
myocardium, i.e. total mechanical work, B corresponds to increased energy needed for calcium
handling at increased inotropy, and C constitutes the constant basal metabolism. Since energy
consumption linked to calcium handling seems to increase with heart rate, a term D dependent
on heart rate could be introduced (Kiyooka et al. 2002).
The quotient EW/PVA has been used in a clinical study in patients with remodelled left ventricle
after myocardial infarction (Takaoka et al. 2002). Compared to a control group, EW/PVA
decreased significantly.
The usefulness of this approach to the heart’s energetics is evident, but requires calibrated
volume and pressure, and the determination of the ESPVR.
- 30 -
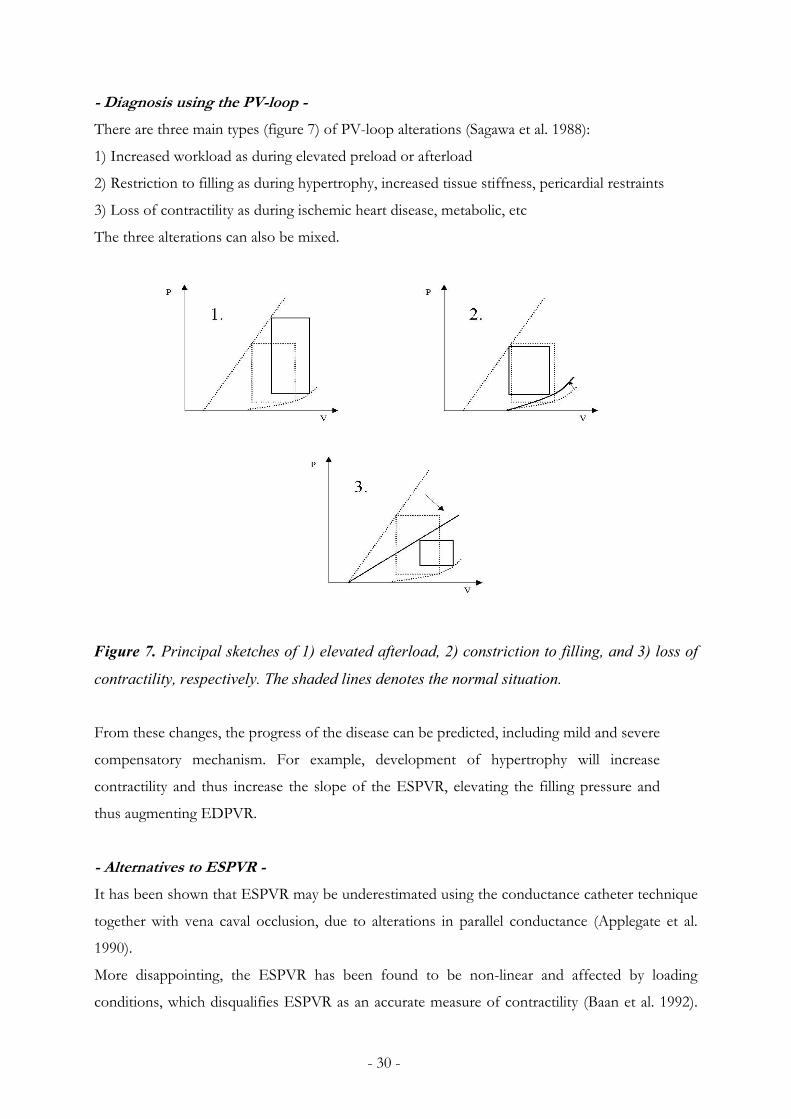
- Diagnosis using the PV-loop -
There are three main types (figure 7) of PV-loop alterations (Sagawa et al. 1988):
1) Increased workload as during elevated preload or afterload
2) Restriction to filling as during hypertrophy, increased tissue stiffness, pericardial restraints
3) Loss of contractility as during ischemic heart disease, metabolic, etc
The three alterations can also be mixed.
Figure 7. Principal sketches of 1) elevated afterload, 2) constriction to filling, and 3) loss of
contractility, respectively. The shaded lines denotes the normal situation.
From these changes, the progress of the disease can be predicted, including mild and severe
compensatory mechanism. For example, development of hypertrophy will increase
contractility and thus increase the slope of the ESPVR, elevating the filling pressure and
thus augmenting EDPVR.
- Alternatives to ESPVR -
It has been shown that ESPVR may be underestimated using the conductance catheter technique
together with vena caval occlusion, due to alterations in parallel conductance (Applegate et al.
1990).
More disappointing, the ESPVR has been found to be non-linear and affected by loading
conditions, which disqualifies ESPVR as an accurate measure of contractility (Baan et al. 1992).

- 31 -
Hence, it has been suggested that V13 instead of Vo should be used. V13 is the intercept with a
horizontal line in the PV-diagram at 13 kPa (about 100 mmHg).
In 1985, Glower proposed the concept of preload recruitable stroke work, PRSW (Glower et al.
1985), which is more linear, and more independent of preload and afterload, and therefore a
better measure of contractility. PRSW is determined as ESPVR, i.e. through preload reduction,
and is defined as the slope of the relation between end-diastolic volume (x-axis) and the external
work (y-axis) of the following beat. PRSW is probably preferable to ESPVR regarding
contractility.
Kass et al. proposed an empirical measure of contractility with non-invasive possibilities (Kass
and Beyar 1991), defined as maximal instant power divided by the square of the preceding end-
diastolic volume. This index has been evaluated and found to have non-invasive, clinical
possibilities (Mandarino et al. 1998).

- 32 -
Ultrasound measurement of left ventricular function
Ultrasound is a non-invasive imaging technique using sound waves of 2-10 MHz, which are sent
from an ultrasound transducer into the body, and are partly reflected at interfaces between tissues
with different acoustic impedances. One transmitted pulse give rise to numerous reflections at
different depths of the body. The returning reflected waves are registered by the same equipment,
visualised and stored. About 100 pulses are required to create an image, and thus a 100 times the
frame rate to achieve real-time moving images. Frame rate is number of images per second.
If the objects (e.g. the myocardium or the blood cells) are moving, the ultrasound pulse will
change frequency when reflected. This frequency shift (i.e. the doppler shift) is proportional to
the velocity of the object.
Since no absolute pressures can be measured by ultrasound, much effort has been made to
validate estimates of left ventricular function.
Ultrasound investigations performed on the heart are summarized in the term 'echocardiography'.
Below will be presented only a few types of echocardiographic procedures, relevant to this thesis.
- Ejection fraction -
Ejection fraction can be determined from 2-dimensional images, using assumptions of left
ventricular geometry (Parisi et al. 1979), e.g. modified Simpson's rule for off-line determination of
ejection fraction. This method was used in III and VII. The more echocardiographic projections
(views) used, the better accuracy. A single-plane short-axis model was proposed for the best
accuracy of on-line quantification of ejection fraction during transient events (Parisi et al. 1979).
- Continuous area measurement as estimate of volume -
During the last 15 years, it has been possible to automatically detect and measure the area of the
left ventricle in each echocardiographic frame. Left ventricular area vs. time can be presented on-
line as a curve, and data can be stored for off-line analysis. Area changes (short axis or apical 4
chamber view) have been shown to correlate well with changes in volume measured with the
conductance catheter (Appleyard and Glantz 1990, Gorcsan et al. 1996, Chen et al. 1997,
Schmidlin et al. 2000), or with other volume measures in controlled experiments (Appleyard and
Glantz 1990, Aakhus et al. 1994, Oe et al. 1995). Regional myocardial dysfunction poses,
however, limitations to the use of the method since linearity may be then violated (Appleyard and
Glantz 1990). On the other hand, volume calculated from area using automated boundary
detection seems to under-estimate true volume, the variability of the estimates being considerable
(Weiss et al. 1983, Sapra et al. 1998). To summarize, it seems that measured area accurately

- 33 -
reflects volume changes, and that any conclusions about true volume should be done with care.
This will be further discussed in connection with I, II and VIII.
- 3D measurement of volume -
Intuitively, 3-dimensional echocardiographic data would be preferrable to 2-dimensional. On the
other hand, the quantification of left ventricular function using this technique is so far less
developed, i.e. no tissue or blood doppler data can be measured in 3D at present. Furthermore,
most calcualtions have to be done off-line, which is sometimes too time consuming (Krenning et
al. 2003, Monaghan 2006). Nevertheless, in some cases it might be superior. For example,
determination of ejection fraction from 2D images is based on geometrical assumptions that may
fail as, for example, in patients with left ventricular aneurysms (Monaghan 2006).
It is today possible to obtain 3D data with a frame rate of 25 images per second (and reported to
increase), in only a few seconds measuring time. Accuracy and reproducibility in volume or
ejection fraction determinations have been reported to increase compared to conventional 2D
echocardiography (Monaghan 2006).
- Myocardial velocities with tissue doppler (TVE) -
It is possible to separate doppler shift originating from myocardial tissue and from blood, by use
of low-pass filtering, since myocardial velocities are relatively low. The filtering is accompanied by
delimitation of the reflections originating from the blood having relatively low amplitudes.
Longitudinal velocities are more often measured, since they are uniform in direction (towards the
base or the apex during diastole and systole, respectively), and easily obtained in the 4-chamber
view.
The velocity in different discrete locations as, for example, in basal septum, can be determined
for each frame. Hence, a velocity-time curve for the complete heart cycle can be obtained. It has
been shown that post- and pre-ejectional as well as systolic velocities change in a predictable
pattern during myocardial ischemia (Edvardsen et al. 2000, Jensen et al. 2001, Edvardsen et al.
2002). Disturbed relaxation has been shown to alter isovolumic relaxation velocities (Thomas et
al. 1992). Longitudinal movement, i.e. the time integral of longitudinal velocity of the mitral
annulus correlates (although non-linearly) to ejection fraction (Emilsson et al. 2000). Implications
to VI.

- 34 -
- Frame rate requirement for TVE -
For the conductance catheter and modern pressure sensors, bandwidth and thus possible
sampling rate is not an issue in physiological measurements.
However, in order to calculate a contractility index (Vogel et al. 2002, Vogel et al. 2003), the peak
velocity during the isovolumic contraction phase (IVC) is required, and, given its short duration
in time, it is necessary to use quite high sampling rates (frame rates).
To estimate the necessary frame rate, the first positive wave of IVC may be considered to
increase and decrease linearly with maximum velocity in mid-IVC. The duration is set to 50 ms
(Lind et al. 2004). In order to measure peak IVC velocities not less than 90% of true velocity, i.e.
measured with very high frame rate, sampling must occur at least every 50 x 0.10 ms. That
corresponds to a frame rate of 200 frames/s. Maximal error of 20 % thus corresponds to a frame
rate of 100 frames/s. An empirically determined value of at least 100 frames/s has been
suggested , with appreciation to noise inherent with high frame rates (Lind et al. 2002).

- 35 -
Methods
Ethical approval
I-VII All the animals received humane care in compliance with the European Convention on
Animal Care. The studies were approved by the Ethics Committee for Animal Research at
Karolinska Institutet, Stockholm, Sweden (I-II, VI), and the Ethics Committee for Animal
Research, Uppsala (III, IV,V, VII).
VI, VII, VIII The studies were approved by the ethics committee at Karolinska Institutet -
Huddinge University Hospital (VI, VIII), and Uppsala University (VII), and all the study subjects
gave their informed consent to participate.
Experimental set-up (I-VII)
- Anaesthesia and surgical procedures -
Main characteristics are presented. For full details, see manuscripts.
Pigs with a body weight of I: 38-42 kg, n = 6; II: 38 to 43 kg, n=18, III: 30-33 kg, n=4; IV: 30-
34 kg, n=5; V: 33-37 kg, n=7 kg, VI: 38-43 kg, n=6, VII: 30-40 kg, n=8, were premedicated with
intramuscular ketamine hydrochloride (20 mg/kg) and atropine sulphate (0.5 mg). Anaesthesia
was induced with intravenous sodium pentobarbital (15 mg/kg) and maintained with a cocktail
(0.35m l/kg/h) containing 2 mg fentanyl citrate, 25 mg midazolam and 24 mg pancuronium
bromide in a volume of 57 ml. The infusion was preceded by a bolus of 0.15 ml/kg. (I, II, VI),
or after an overnight fast, the pigs were premedicated with intramuscular azaperon 2-4 mg/kg.
Anaesthesia was induced by intramuscular bolus of tiletamin/zolazepam 6 mg/kg, xylazin 2.2
mg/kg and atropin 0.04 mg/kg, and was maintained by a continuous infusion of clomethiazol 16
mg/kg/h (VII, ketamine 30 mg/kg/h), fentanyl 4µg/kg/h and pancuronium bromide 0.08
mg/kg/h (III, IV, V, VII: 0.3 mg/kg/h).
After meticulous hemostasis, 10000 IU of heparin sodium was given. Heparin infusion was
repeated with 5000 IU every hour. (III, IV, V, VII).
The pigs were intubated and ventilated with a volume cycled ventilator (Engström 300, Datex-
Engström AB, Bromma, Sweden). Blood gases were analysed and kept within normal limits. An
electrocardiogram was recorded using surface electrodes.
At least 1 l Ringer’s acetate solution was given for fluid substitution during the experiment, more
if signs of hypovolaemia were observed by visual inspection of the heart, or if arterial pressure
fell. Catheters were inserted into the right femoral artery and vein for drug and fluid
administration, blood sampling, and pressure monitoring. A Swan-Ganz catheter (Baxter
Healthcare Corp., Santa Ana, CA, I, II, VI CritiCath SP5107-H, BD, Franklin Lakes, NJ, U.S.A.,

- 36 -
III, IV, V, VII) was placed in the pulmonary artery through the right external jugular vein for
cardiac output measurements (I-VII) and injections of hypertonic saline solution for parallel
conductance calibrations (I, II, VI, VII), or by EF measurements (III, IV, V, VII).
After a median sternotomy, the pericardium was opened (I, II, VI) or kept intact (III, IV, V,
VII). A 5F transducer-tipped pressure catheter (Mikro-Tip, Millar Instruments Inc., Houston,
TX, I, II, VI), or a guidewire-mounted pressure sensor, diameter 0.36 mm (Pressure Wire, Radi
Medical Systems AB, Uppsala, Sweden) was inserted and was connected to a PWI-10 pressure
wire interface (Radi Medical Systems AB, Uppsala, Sweden) (III see below, IV, V, VII). A 7F,
12-pole apex conductance catheter (Cordis Webster, Baldvin Park, CA) (I, II, IV, VI, VII) with 7
mm spacing between the electrodes was introduced into the left ventricle through a stab wound
in the apex (I, II, VI), or introduced into the left carotid artery and advanced into the left
ventricle (III see below, IV, V, VII). The tip of the conductance catheter was brought through
the aortic valve (I, II, VI), but in IV and VII, the proximal electrode was kept outside the
ventricle. Before taking each set of measurements, the exact position of the catheter was
confirmed by inspecting the pressure and volume signals (I-VII), or by using ultrasound (III, IV,
VII), see below.
In V, only a pressure catheter (Radi Medical, described above) was inserted from apex through
the intact pericardium, into the left ventricle through a 1.0 mm peripheral venous catheter.
- Other equipment -
III - An intravascular ultrasonic probe (Acuson AcuNav), linked to Acuson Sequoia 512, was
advanced through the right external jugular vein into the right ventricle for measurement of
ejection fraction. EF was determined throughout the experiment. In addition, in collaboration
with Radi Medical Systems, Uppsala Sweden, we designed a thin and soft conductance catheter.
The diameter of the catheter was 0.36 mm, the same as that of an ordinary guide wire. The
catheter has four electrodes placed accordingly to II. It was also equipped with a high bandwidth
pressure sensor manufactured with Radi Medical’s Pressure Wire technology. An 8.5 F vascular
introducer was advanced from the right carotid artery into the LV over a J-tipped guide wire.
Passage into the LV was verified with pressure measurement in the vascular introducer. The 0.36
mm pressure-conductance catheter was placed through the introducer in the LV. The introducer
was then withdrawn to the ascending aorta.
IV, VII - Ultrasound imaging was performed using the commercially available Vivid 7 (General
Electrics Vingmed Sound, Horten, Norway) with a standard 2.5 MHz phased array transducer
with a frame rate of 175±46 Hz. The transducer was placed directly onto the pericardium in an

- 37 -
apical position giving a 4-chamber view. Mitral and aortic valves were examined with doppler
technique (IV). EF was determined throughout the experiments employing modified Simpson’s
method.
- Haemodynamic data -
Haemodynamic data were acquired during disconnection of the ventilation in end-expiration to
minimize the effects of intrathoracic pressure variations (I-VII). To decrease preload, the inferior
vena cava was occluded (I-VII, not IV). To increase afterload, the descending thoracic aorta was
clamped during a few beats (I, II, VI), or by infusion of phenylephrine (0.05-0.3 mg) (III, V,
VII). Contractility was increased by infusion of adrenalin (10-20 µg) (V, VII).
- Data acquisition -
Sampling frequency was 200 to 250 Hz using an AD converting board (DAS-1601, Keithley Data
Acquisition, Taunton, MA) (I, II, VI), or 400-1000 Hz using a data acquisition card inserted into
a PC (NI DAQCard-6036E/1200 for PCMCIA, National Instruments, Austin, Tx) (III, IV, V,
VII). The digitized signals were later treated with a low-pass filter with cut-off frequency of 100–
125 Hz, depending on sampling frequency (I, II, VI).
- Use of conductance catheter -
The conductance catheter was connected to a Leycom Sigma-5-DF signalconditioner processor
(CardioDynamics BV, Zoetermeer, The Netherlands) (I, II, IV, VI, VII). The volume signal was
processed and stored (Conductance-PC software, CardioDynamics BV) (I, II, VI), or directly
stored on the computer hard disk for later analysis (III, V, VII). The absolute total LV volume
was reached by calibrating the signal for blood resistivity, for parallel conductance and for cardiac
output measured by thermodilution. The cardiac output was measured by thermodilution 3–5
times for each determination.
- Ischemia -
An apical myocardial infarction was induced by ligating the left anterior descending coronary
artery (LAD) immediately distal to the second diagonal branch (I).

- 38 -
Experimental protocol
After preparation, the animals were stabilized for 20-30 minutes (I-VII). Following calibrating
procedures, haemodynamic data were acquired at baseline, or during changes in loading
conditions or contractility, respectively. After 60 min of apical ischaemia, haemodynamic data
were again acquired (I). Finally, the pig was given a lethal injection of pentobarbital and
potassium (I-VII).
Measurements in humans
VI - Using ultrasound tissue doppler, 18 healthy men were studied. Longitudinal velocities were
measured in the LV septum and lateral wall. Velocities were integrated to displacement, i.e.
movement in LV wall.
VII - Measurements were done in a 60-year old man undergoing coronary bypass surgery shortly
after acute myocardial infarction. After sternotomy, but before establishment of cardiopulmonary
bypass circuit, a guide-wire mounted pressure sensor (Radi Medical as described above) was
introduced into the left ventricle through one of the pulmonary veins and left atrium. The
measurements were then performed during repeated gentle compressions of vena cava, during
one measurement even accompanied by lowering of the legs (reduction of preload), and during
repeated gentle compressions of the ascending part of the aorta (afterload increase).
VIII - The study population consisted of nine individuals (5 men and 4 women, 39±23 years old)
without any signs of coronary artery disease and normal left ventricular function, and 3 patients
(2 men, 84 and 50 years old, and 1 woman, 75 years old) with severe valvular abnormalities (aorta
stenosis, aorta insufficiency, and mitral stenosis, respectively) for demonstration of potential
pathological flow-volume loop morphology. All the study participants were subject to resting
echocardiography. Individuals with poor image quality, complex atrial or ventricular arrhythmias,
or previous revascularisation were excluded from the study.
Echocardiographic imaging was performed with the subjects in left lateral position using a
commercially available system (Aloka PhD Prosound SSD 5500, Aloka, Tokyo, Japan). Images
were obtained in the three standard apical views (four chamber, long axis, two chamber) using a
standard 3MHz transducer. Two-dimensional gray scale images with real-time left ventricular
endocardial detection were stored digitally for subsequent off-line analysis.
Using commercially available software (ASMA, Aloka, Tokyo, Japan), an ellipsoid region of
interest (ROI) was defined so that the left ventricular endocardium could be encapsulated for the
whole cardiac cycle while taking care to avoid inclusion of data external to the left ventricular
cavity. The left ventricular endocardium was then automatically detected in real time for each

- 39 -
frame throughout the cardiac cycle (100 frames/s). The left ventricular cavity thus delineated was
subsequently displayed 'filled in' with orange pixels. Using the quantitative features of the ASMA
software the cardiac cycle volume characteristics based on this area of orange pixels was then
obtained in graphical form for the whole of the left ventricle as well as for six regional segments
of the ROI. Thse segments of ROI varied from the accepted standard of segmentation of the left
ventricle (Henry et al. 1980) and, in particular, the regions of interest of the basal segments
crossed the mitral valve plane in the apical views. The six segments did however allow
separations of data into basal, mid-level, and apical regions. All images were stored as digital
cineloops in DICOM format for reference of segment location while global and regional data
characteristics were also exported in a hexadecimal numerical format to a standard PC for off-line
data analysis.
Data analysis and calculations
All calculations, except in I and all statistical analysis, were made using Matlab (The MathWorks
Inc, Natick, MA, U.S.A.) software.
In III, IV, and partly in VII, stroke volume (SV) was calculated from cardiac output divided by
heart rate for which the volume signal was calibrated. The maximum of the volume curve was
given by end-diastolic volume, calculated as stroke volume divided by ejection fraction. Ejection
fraction was derived from ultrasound measurements.
- The respective studies -
I - End-diastole was defined as maximum global volume and end-systole as the point of
maximum elastance, i.e. the maximal value of LV pressure/ LV global volume. Global stroke
volume (SV) was calculated as enddiastolic minus end-systolic volume. A computer algorithm
was constructed to compare the curve shape of segmental volumes with the curve shape of global
volume. Global volume was obtained by summarizing the segmental volumes. In order to analyse
the absolute difference between curve shapes of segmental versus global volume, segmental
volumes were normalized to equalize the corresponding global volume 1:1 at global end-diastole
and end-systole. For the calculation at baseline and during apical ischaemia, the mean of 10 beats
was used. During vena cava and aortic occlusion the first beat in each acquisition was used as
reference. Both the mean and peak differences are presented as percentages of global stroke
volume.
II - A global volume curve was obtained by summing the inverted segmental voltages, as
described. A potential profile was calculated for every sample of each measurement (figure 8),

- 40 -
giving a 3-dimensional matrix with time, position of the potential, and potential. The
interpolation of the potential profile along the catheter length was done in 50 steps, i.e. each
segment was divided into ten equidistant steps, which gave 50 intervals defined by 51 positions.
The first virtual electrode (on the single-segmental catheter) was positioned at position 1, and the
second at, for example position 11. Volume was then calculated at each sample using these
positions of the electrodes, rendering a volume curve. The same was then made for each possible
position of the virtual electrodes for that particular measurement. All volume curves calculated
were then scaled twice, giving them the same mean, maximum and minimum value as the global
volume curve, and were then compared to the global volume curve using a mean square error
algorithm.
Figure 8. Interpolation of the electric field along the catheter at one single time sample
position of the potential, and potential.
Each deviation calculation was summed and divided with the number of measurements,
rendering a three-dimensional matrix with position of (virtual) electrode one, electrode two, and a
mean volume deviation in percent for each pair of electrode positions. At the minimum volume
deviation, the best electrode positions were found.
III - All data were analysed off-line, and each measurement was inspected visually. The
conductance signals were upsampled with Lagrangian interpolation to 1 kHz and synchronised
with the pressure and ECG signals. All signals were low pass filtered with a digital IIR 3-pole
Butterworth low pass filter having a cut off frequency of 33 Hz.
IV - All conductance-derived volume derivatives were set to zero during IVCT and IVRT, with
care taken to let volume changes be equal in both IVCT and IVRT. Volume derivatives were
then integrated back to volume. The area of the pressure-volume loop was calculated, both with
and without manipulated volume.
V - Maximum pressure, for all measurements, was determined with software instructions. This
was controlled on a plot.
0 10 20 30 40 50 600
0.005
0.01
0.015
0.02
0.025
Catheter position [1:51]
Pote
ntia
l [ar
b. u
nits]
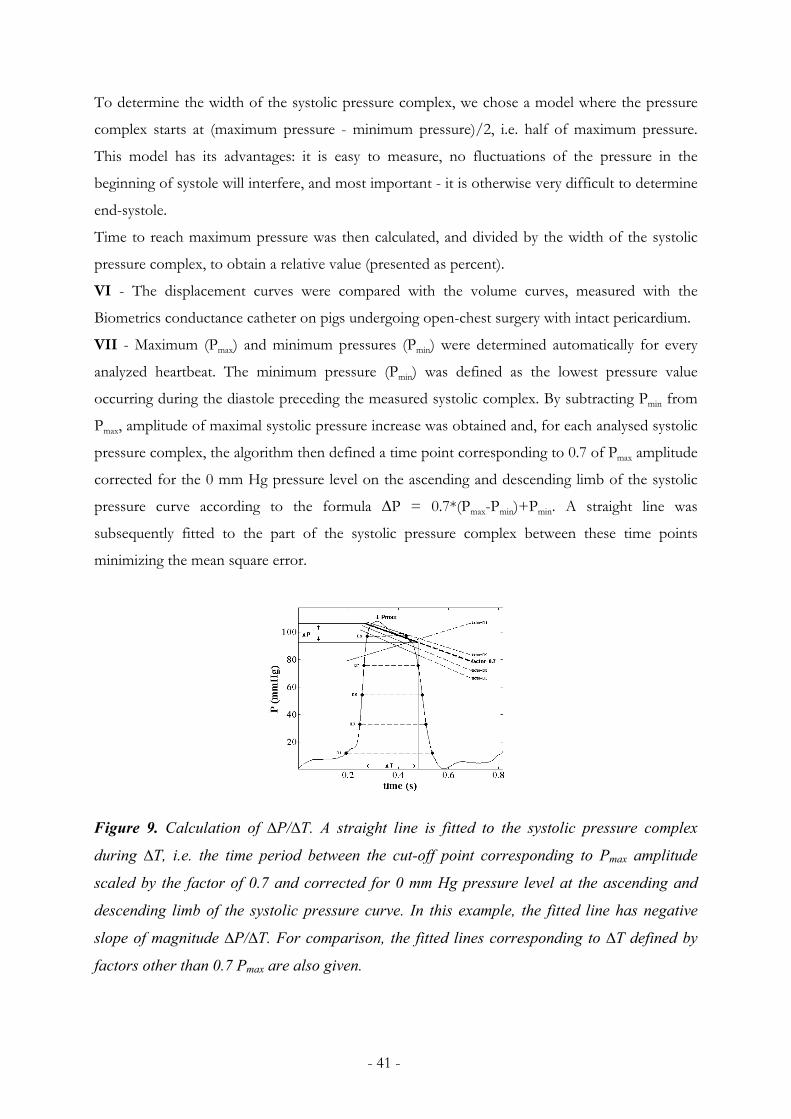
- 41 -
To determine the width of the systolic pressure complex, we chose a model where the pressure
complex starts at (maximum pressure - minimum pressure)/2, i.e. half of maximum pressure.
This model has its advantages: it is easy to measure, no fluctuations of the pressure in the
beginning of systole will interfere, and most important - it is otherwise very difficult to determine
end-systole.
Time to reach maximum pressure was then calculated, and divided by the width of the systolic
pressure complex, to obtain a relative value (presented as percent).
VI - The displacement curves were compared with the volume curves, measured with the
Biometrics conductance catheter on pigs undergoing open-chest surgery with intact pericardium.
VII - Maximum (Pmax) and minimum pressures (Pmin) were determined automatically for every
analyzed heartbeat. The minimum pressure (Pmin) was defined as the lowest pressure value
occurring during the diastole preceding the measured systolic complex. By subtracting Pmin from
Pmax, amplitude of maximal systolic pressure increase was obtained and, for each analysed systolic
pressure complex, the algorithm then defined a time point corresponding to 0.7 of Pmax amplitude
corrected for the 0 mm Hg pressure level on the ascending and descending limb of the systolic
pressure curve according to the formula ∆P = 0.7*(Pmax-Pmin)+Pmin. A straight line was
subsequently fitted to the part of the systolic pressure complex between these time points
minimizing the mean square error.
Figure 9. Calculation of ∆P/∆T. A straight line is fitted to the systolic pressure complex
during ∆T, i.e. the time period between the cut-off point corresponding to Pmax amplitude
scaled by the factor of 0.7 and corrected for 0 mm Hg pressure level at the ascending and
descending limb of the systolic pressure curve. In this example, the fitted line has negative
slope of magnitude ∆P/∆T. For comparison, the fitted lines corresponding to ∆T defined by
factors other than 0.7 Pmax are also given.

- 42 -
The factor 0.7 was chosen empirically after analysis of several different types of systolic pressure
curves in order to: a) maximize the inclusion of aortic valve opening time in the analysis,
minimizing at the same time the influence of isovolumic contraction and relaxation (figure 9),
and b) to make the algorithm robust and to render the greatest possible amplitudes of ∆P/∆T.
Following the data analysis, the slope of the fitted line (∆P/∆T, mm Hg/s) was plotted versus
∆Pmax using Matlab software with ∆P/∆T on the y-axis, and ∆Pmax on the x-axis. The slope was
designated negative when Pmax occurred early in systole whereas late systolic Pmax resulted in a
positive slope. All the ∆P/∆T and Pmax values were normalized by subtraction of the respective
baseline values and hence, the plots originated always at zero. For each baseline analysis including
measurements on 5 – 10 heartbeats prior to each provocation only a single pair of ∆P/∆T and
Pmax values representative of one heartbeat was utilized for normalization procedure. All
heartbeats at baseline and during changes in loading conditions and contractility normalized in
this way were graphically presented.
VIII - Hexadecimal numerical data (figure 10A) were converted to decimal format and imported
to Matlab (Version 6.5, TheMathWorks Inc., Natick, MA, U.S.A.). The values were then adjusted
by a calibrating factor exported from the ASMA acquisition software and expressed in cm2. After
low grade temporal filtering using polynomial fitting (Savitzky and Golay 1964), graphs of both
global and segmental area versus time were established in each cardiac view (figure 10B). The
area (estimate of left ventricular volume) was then plotted against its first derivative (area change
- indicative of ventricular flow) to create loop plots for the whole ventricle and for each segment,
Figure 10. Derivation of the flow-volume estimates loop. (A) Hexadecimal area information
are exported. (B) All values converted to decimal format are plotted as area (estimate of left
ventricular volume) versus time. (C) The area ("volume") is the plotted against its first
derivative (indicative of ventricular flow) to form the final flow-volume estimates loop.
(A) HEXIDECIMAL OUTPUT (B) INTERMEDIATE PROCESSING (C) FINAL FLOW-VOLUME LOOP(A) HEXIDECIMAL OUTPUT (B) INTERMEDIATE PROCESSING (C) FINAL FLOW-VOLUME LOOP

- 43 -
called global and segmental (regional) estimates of flow-volume loops, respectively (figure 10C).
The loops created in this way lack time scale and, instead, have the estimate of left ventricular
volume (left ventricular 2-D area) as x-axis. Consequently, expressions pointing to early/late
diastolic/systolic maximum flows mean in reality maximum flows at small/large left ventricular
volumes, respectively.
Statistical analysis
I - Data are presented as medians (range) unless otherwise stated. The haemodynamic data at
baseline and during ischaemia were compared using the Wilcoxon matched pairs test.
VII - Pairwise comparisons were performed using Student’s test for paired samples (two-tailed).
The significance level was set at p<0.05.
VIII - All statistical analyses was performed using standard statistical software (SPSS version
11.01). Continuous data are presented as mean and standard deviation while categorical data are
presented as frequency. Mean values for each variable were compared by independent t-test and
ANOVA. Frequency analysis between categories was achieved with the χ2 test.

- 44 -
Results
Study I
Baseline stroke volume for segment 3 constituted 34 (14–39)% of global stroke volume, and for
segment 4 29 (20–44)%. The baseline differences in curve shape between normalized segmental
and global volume are presented in figure 11.
The mean absolute difference for segment 3 over a cardiac cycle was 4 (1–8)%. For this segment
the peak difference in four of the six subjects never exceeded 9% of global stroke volume.
However, in subjects 5 and 6 the peak differences for short periods in mid-systole were
approximately 10% and 18%, respectively, and almost 30% in mid-early diastole.
- Apical myocardial ischaemia -
After 60 min of apical ischaemia, a marked dyskinesia appeared in the two most apical segments
(1 and 2) represented by a greater difference between segmental and global volume (figure 11).
However, this lack of agreement was not seen in the adjacent segment 3 where the mean absolute
difference was in the range of 2–3% with no peak over 7%.
- Preload reduction -
With an end-systolic LV pressure declining to 60% of “preload”-baseline during occlusion of the
vena cava, the mean absolute volume difference for segment number 3 was 3–7% in five of the
six subjects. In subject 5 a mean difference of 39% was seen in early diastole, probably a result of
dyskinesia caused by the decreasing LV volume.
- Afterload increase -
During occlusion of the descending aorta, only the “afterload”-baseline and two additional beats
were analysed since LV end-systolic pressure had reached its maximum already within a few
beats. The mean difference increased from 3 (2–10)% at “afterload”- baseline to 7 (3–12)% at the
third beat. The peak difference, located to the “isovolumic relaxation period” was temporarily
high in subjects 3–5.
- General observations -
During the heart cycle, short episodes of increased difference between segmental and global
volume occurred. In two of the six subjects the difference occasionally peaked over 10% at
baseline, in the same two subjects over 15% during vena cava occlusion and in three subjects the
difference peaked over 20% during aortic occlusion.

- 45 -
Figure 11. The maximal absolute difference in curve shape between normalized segmental
and global volume as a percentage of global stroke volume, calculated in individual subjects
at baseline (n = 6) and after 60 min of apical ischaemia(n = 5), at 5 time points insystole and
10 in diastole. Segment 5 is located at the heartbase, segment 3 at midventricular level and
segment 1 at the apex. Subject no. 6 ismarked (+), no. 5 (x), and nos.1–4 (□).

- 46 -
Study II
Figure 12 shows a three-dimensional plot of the total mean deviation in percent per time sample
per measurement, including all measurements (i.e. steady state, preload reduction, afterload
increase, infarction), with position of the virtual electrodes on the x- and y-axis. As can be seen,
half of the data is zero. This is due to the fact that in the calculations, electrode one was not
allowed to be more proximal than electrode two. Had this been allowed, the calculations would
have been made twice, resulting in a mirror of the existing plot.
Figure 12. 3D-plot of the deviation. x1 and x2 are positions of electrode 1 and 2, respectively.
The 3D-plot has one minimum (deviation 0.05% per sample). This suggests that the best way to
position the electrodes, in order to obtain a volume curve as similar as possible to one obtained
with the 5-segmental catheter, is position 11 for (virtual) electrode 1, and position 51 for
electrode 2. Thus, 4/5 of the whole length of the catheter should be used, disregarding the apical
region.
Study III
The ultrasound images (figure 13, left) shows that the catheter was positioned along the
myocardium. Movements in the myocardium may contribute to the notches in the volume curve,
figure 14, right.
However, the method seems to be stable and delivers consistent and reproducible volume and
pressure data from the individual animal.
Dev
iatio
n [%
per
sam
ple]

- 47 -
Figure 13. To the left, an ultrasound image of the left ventricle with electrodes of the catheter
marked with arrows. To the right, measured volume and ECG as functions of time.
Study IV
All P - dV/dt plots (figure 14, left) showed a non-zero flow signal during IVC and IVR. No pig
had any but small physiological mitral regurgitation. There were small signs of aortic regurgitation
due to the conductance catheter position through the aortic valve.
The area of the pressure-volume loop, using the calculated volume (figure 14, right), increased
with on average 22% ranging from 12 to 43%.
Figure 14. To the left, a plot of left ventricular pressure and the first derivative of the volume
(flow). Flow into the left ventricle is defined as positive. To the right: pressure plotted against
volume with and without manipulated volume. The original data forms the smaller loop.
Time (ms)0 100 200 300 400 500 600 700 800 900
100
70
90
80
Vol
ume
(ml)
P
dV/dt
P
V
P
dV/dt
P
V

- 48 -
Study V
As shown in figure 15, the pressure curves
originating from a single pig have different
appearance, with early, mid-, or late peak values
depending on loading state.
In figure 16, data from all subjects are shown in
the (time-to-max/maximum pressure)-diagram.
The different loading conditions and
contractility are grouped in the plot. The
reduced preload measurements have a tendency
downwards to the left, and increased afterload a
tendency upwards and to the right. The
adrenalin infusion gives values down to the
right. Three beats (a, b, c) are considered to be
outliers. They originate from the same animal.
Figure 16. Relative time to maximum pressure vs. maximum pressure. Beats from the
provocations are presented as reduced preload (∇), increased contractility(◊), increased
afterload( ).
Figure 15. Baseline (top left), preload reduction
(top right), afterload increase (bottom left),
contractility increase (bottom right).
20 40 60 80 100 120 140 1600
10
20
30
40
50
60
70
80
90time to maximum P vs. maximum P
maximum P, mmHg
time
rela
tive
tow
idth
, %
a b
c
20 40 60 80 100 120 140 1600
10
20
30
40
50
60
70
80
90time to maximum P vs. maximum P
maximum P, mmHg
time
rela
tive
tow
idth
, %
20 40 60 80 100 120 140 1600
10
20
30
40
50
60
70
80
90
20 40 60 80 100 120 140 1600
10
20
30
40
50
60
70
80
90time to maximum P vs. maximum P
maximum P, mmHg
time
rela
tive
tow
idth
, %
a b
c

- 49 -
Study VI
The curves from the two types of measurements were similar, with almost identical appearance
during IVC and IVR. In figure 17, four plots are shown - two originating from conductance
measurements, and the other two from tissue doppler measurements. The left two plots show
conductance (i.e. volume) and displacement versus time, respectively. In figure 17, to the right,
conductance and displacement are plotted against their own first derivatives. The isovolumic
phases are marked in all plots. Displacement in the septum was more pronounced than that in
the lateral wall.
Figure 17. To the left: displacement from tissue doppler, and volume from conductance.
Displacement towards apex is defined as negative. To the right: Displacement vs velocity
(top), and conductance (volume) vs flow (dvolume/dt). Flow into the left ventricle is defined
as positive.
Furthermore, figure 18 shows the same kind
of plots from unpublished data. In the top
frame, volume from conductance is plotted
against flow, and in the bottom frame tissue
displacement is plotted against velocity. In
these measurements in pigs (same as in VII)
conductance and tissue velocities were
obtained simultaneously. All data points
within the isovolumic phases are marked with
black squares. As can be seen, isovolumic
phases indicate opposite directions. Data are
being evaluated.
IVR
IVC
IVR
IVC
IVC
IVC
IVR
IVR
Figure 18. See text for details.

- 50 -
Study VII
Typical beat-to-beat plots of end-diastolic and end-systolic volumes (EDV, ESV) for each
intervention type are shown in figure 19. As can be seen, the respective left ventricular volumes
changed significantly in a way that could be expected from the performed interventions, thus
being indicative of expected changes in loading and contractility states. Examples of typical
systolic pressure complexes are shown in figure 15, in Study V, above.
Figure 19. Typical end-diastolic (EDV) and end-systolic volumes (ESV) from conductance
catheter measurements presented in a beat-to-beat plot for each intervention type (left to
right): vena cava occlusion, phenylephrine injection, and adrenalin injection.
A slight decrease in heart rate occurred during preload reduction and afterload increase. On the
other hand, administration of adrenalin caused, as expected, a substantial increase (p<0.001) in
heart rate.
During vena cava occlusion (reduced preload), the lower peak systolic pressure occurring early in
systole and followed by rapid pressure decrease produced negative ∆P/∆T values and their shift
to the left lower square of the plot area (figure 20/a). On the other hand, the increased peak
systolic pressure occurring during late systole after administration of phenylephrine (increased
afterload) resulted in positive ∆P/∆T values that shifted to the right upper square of the plot
(figure 20/b). The administration of adrenalin produced most often biphasic response. Initially,
the increased early systolic peak pressure resulted in negative ∆P/∆T values at increasing Pmax
values and hence shifted the plot to the right lower square (figure 20/c).
Subsequently, the form of the systolic curve changed and the ∆P/∆T values became increasingly
less negative moving toward the right upper square of the plot as the peak systolic left ventricular
pressure continued to increase (figure 20/c). In three of the animals (animals 3, 7, and 8), this
biphasic response to adrenalin was preceded by increasing ∆P/∆T and Pmax for a brief period of
time (3 to 11 heartbeats, i.e. not exceeding 7 seconds). This resulted in triphasic response pattern

- 51 -
with the first phase mimicking the pattern obtained during the phenylephrine-induced increase in
afterload, i.e. the shift of the plot toward right upper square.
Figure 20. Individual ∆P/∆T versus Pmax plots for all the 8 experimental animals during
different provocations. In response to preload reduction, the ∆P/∆T values shift to the left
lower square of the plot (a) whereas during afterload increase the values shift to the right
upper (b) and during increased contractility to the right lower square (c) of the plot.
The changes in ∆P/∆T and Pmax values during the very gentle manipulations of preload and
afterload in the patient undergoing coronary bypass grafting were, accordingly, smaller than those
observed in animals. However, the reaction pattern, as reflected by ∆P/∆T vs. P max plot, was
fully consistent with the pattern found in animal experiments. The plot is shown in appendix VII.

- 52 -
Study VIII
- Echocardiographic data and feasibility -
All individuals in the normal group had normal resting ventricular wall motion. Of the 36
echocardiographic images available for acquisition in this group, 28 (75%) provided sufficient
resolution to allow adequate automated endocardial border detection. The 4-chamber view was
most favorable in this respect with all the images obtained in this view allowing adequate
delineation of the left ventricular cavity whereas the percentage of qualitatively satisfactory
images in the two other views was lesser (67% of the images in apical 2-chamber view and 55%
of the images in apical long axis view, p=0.001). There were several reasons for exclusion of
images from analysis, sub-optimal image quality being the most prominent factor. Another
important reason was inability to obtain the region of interest closely enough to the shape of the
left ventricular endocardium throughout the cardiac cycle which fact would result in
underestimation of global and regional data and their contamination with extraneous signal
components from outside the left ventricular cavity. An irregular RR-interval of the cardiac cycle
and poor breath holding resulted in poor reproducibility of the flow-volume loops and the
corresponding images were therefore excluded from the analysis as well.
- Estimated global and regional flow-volume curves -
Figure 21 provides a schematic diagram of an estimated global left ventricular flow-volume loop
whereas typical estimated regional curves and a typical global flow-volume loop from a healthy
individual are shown in figure 22.
As illustrated in figure 22A, the loop proceeds in clockwise direction with positive values for flow
into the left ventricle during diastole and negative flow values for flow out of the ventricle during
the systolic ejection. As could be expected, the loop indicates maximum left ventricular volume at
end-diastole and minimum volume at end-systole. Besides the main systolic and diastolic cardiac
events (systolic ejection , diastolic E- and A-waves) that are clearly identifiable within the
estimated flow-volume loop, the systolic and diastolic isovolumic events can be identified as well.
Estimated regional flow-volume loops were more complex in their forms in comparison to the
global ones and there occurred differences in curve morphology between the loops from
different left ventricular cavity segments (figure 22). As can be seen from figure 22, the regional
loops tend to display, in general, somewhat more pronounced isovolumic changes in the septal
segments (segments 4-6) then in the free wall segments (segments 1-3). In turn, estimated volume
changes during rapid diastolic filling and systolic ejection appear to be more pronounced in the
free wall segments.

- 53 -
Normal ranges of estimated global and regional flow-volume loop variables were determined, as
well as examples of loops from patients with severe valvular abnormalities, see VIII.
Figure 21. (A) A schematic diagram of a left ventricular global flow-volume estimates loop.
The flow-volume estimates loop proceeds in a clock wise direction. Minimum and maximum
volumes are readily identified as well as maximum systolic and maximum diastolic flow.
Isovolumic systolic and diastolic events are also identifiable. Integrals of the flow-volume
estimates loop are also shown representing the (B) diastolic, (C) systolic, (D) early diastolic,
and (E) early systolic volume changes.
Figure 22. Global and segmental left
ventricular flow-volume estimates loops
derived from image obtained in 4-chmber
view obtained in four chamber view. Note
the variation in the forms of segmental
flow-volume estimates loops depending on
segment location.
(C) SYSTOLIC AREA(B) DIASTOLIC AREA
(D) EARLY DIASTOLIC AREA
(E) EARLY SYSTOLIC AREA
(C) SYSTOLIC AREA(B) DIASTOLIC AREA
(D) EARLY DIASTOLIC AREA
(E) EARLY SYSTOLIC AREA
(D) EARLY DIASTOLIC AREA
(E) EARLY SYSTOLIC AREA
VOLUME
FLO
W
SYSTOLIC ISOVOLUMIC
EVENTS
DIASTOLIC ISOVOLUMIC
EVENTS
(A) LEFT VENTRICULAR FLOW-VOLUME CURVE
0VOLUME
FLO
W
SYSTOLIC ISOVOLUMIC
EVENTS
DIASTOLIC ISOVOLUMIC
EVENTS
(A) LEFT VENTRICULAR FLOW-VOLUME CURVE
0
SEGMENTAL LOOPS
- 54 -
Summary of the results
The question addressed in I was how well a single mid-ventricular segment of the conductance
catheter describes the curve shape of global left ventricular volume. Given certain assumptions
and limitations, the conclusion was that it is possible to use a single-segment conductance
catheter, or to echocardiographically measure the short-axis area at mid-ventricular level, in order
to describe the dynamics of global left ventricular volume.
In II, calculations were presented how to position electrodes on a single-segment catheter, using
conductance data from the five segment catheter. The conclusion was that the measuring
segment should include most part of the left ventricle, except for the apical region.
As presented in III, a thin and flexible pressure-conductance catheter was constructed, with
electrode positions as described in II, and was used in animal experiments. Both left ventricular
volume and pressure could be measured with good reproducibility. Isovolumic events were more
pronounced than was usually seen using the rigid five segmental catheter.
Left ventricular isovolumic events were investigated in IV and VI. Study VI presents the
observation that the myocardial displacement and conductance signal have similar appearence,
especially during the isovolumic phases, thus indicating a relation between geometry and
conductance. Furthermore, as presented in IV, the first derivative of conductance, that can be
seen as an estimate of flow, revealed non-zero values during the isovolumic phases, despite the
fact that no regurgitation was present. It was suggested to use these findings to adjust the
conductance signal during the isovolumic phases.
In V and VII, the systolic left ventricular pressure wave form was described. The first attempt,
made in V, was to determine the part of systolic time to reach maximum pressure. Systole was
defined as the width of the systolic pressure complex, at half of maximum pressure level. The
results indicated that discrimination between different loading conditions and contractility could
be achieved by analysis of the systolic pressure wave form, even if baseline values showed
considerable variation.
This methodology was modified in VII, in which only the systolic pressure complex above 70%
of the amplitude of the pressure signal was used in order to include most of the ejection phase
and exclude most of all other phases. Through interpolation, a straight line was used to represent

- 55 -
that pressure interval. Using this approach, discrimination between the induced changes in
contractility and loading conditions was possible, and baseline variation was considerably
decreased.
In VIII, continuous left ventricular area was measured using automated border detection. The
obtained area was subsequently employed as an estimate of left ventricular volume (as in I). The
first derivative of the area, representing area change, was suggested to relate to blood flow. The
measured area was plotted against its first derivative to form flow-volume estimates loops, and
loops from three patients with valve abnormalities exemplified the possible applicability of such
an approach.
- 56 -
Discussion
The most important starting point for this thesis has been the pressure-volume relationship in the
left ventricle. From there, attempts have been made not only to measure but also to evaluate
these variables in order to translate pressure-volume data into non-invasive equivalents. Hence,
the presented work contains both technical and physiological contributions.
Conductance and volume (I, II, III)
Measurements of left ventricular volume are important in the evaluation of left ventricular
function (Chuang et al. 2000). If true volume could be measured with high enough sampling
frequency, variables such as, for example, ejection fraction, or end-diastolic volume or rate of
filling could be easily calculated.
However, many methods used for measurements of left ventricular volume, such as contrast
ventriculography (Vine et al. 1976), radioisotope imaging, magnetic resonance, 3D
echocardiography (Aakhus et al. 1994) and computed tomography have disadvantages of being
invasive, lacking of on-line data presentation facilities or demanding gated data sampling during
several heart beats. Depending on the diagnostic requirements, each technique may however be
sufficiently good.
As far as on-line, long-term measurements of left ventricular volume are concerned, some
techniques have been presented and explored. The use of radiopaque metallic markers (Vine et al.
1976), sonomicrometry (Rankin et al. 1976), or the conductance catheter (Baan et al. 1981) will
deliver on-line volume data, but unfortunately, they are all invasive and, in most cases, not
suitable for clinical use.
Hence, the technical development should be focused on making the methods mentioned above
less invasive, and on designing better on-line estimates of left ventricular volume. For example,
left ventricular cross sectional area can be measured on-line, with high sampling frequency, using
echocardiography.
In I, the aim was to evaluate the respective segments of the five segmental conductance catheter,
in order to investigate the possibility to construct and use a single segment conductance catheter.
It was shown that a mid-ventricular segment of the conductance catheter reflected global volume
changes most accurately, even during induced apical ischemia.

- 57 -
Provided that the electrical field is homogeneous and parallel to the catheter, the measured
conductance will reflect exactly the blood volume of the ventricle between the electrodes,
excluding blood above and below these electrodes. Indeed, at mid-ventricular level, this has been
shown to be the case (Steendijk et al. 1992). Furthermore, since in most cases the distance
between the measuring electrodes is small, it is reasonable to assume that left ventricular short
axis cross-sectional area mesured echocardiographically at mid-ventricular level will reflect global
volume much to the same extent as mid-ventricular conductance. This is in accordance with
studies performed by Gorcsan, Moynihan and others (Parisi et al. 1979, Moynihan et al. 1980,
Gorcsan et al. 1993).
It was also shown in I that the end-systolic and end-diastolic mid-ventricular segmental
conductance changed proportionally to global conductance during the induced changes in
loading conditions, although the difference between global and segmental curve shape during the
heart cycle were not negligible.
The mid-segmental volume constituted as much as 30% of the global volume. It is therefore
reasonable to assume that the single segmental conductance catheter can be used to estimate
global left ventricular volume. However, the comparison between mid-ventricular segmental
conductance and global conductance was consequently biased by a margin of 30 %, since no
independent reference method was used. In addition, the assumption that segmental volume is
comparable to short axis area is conditioned by the fact that this area represents only a thin mid-
ventricular disc of considerably smaller volume.
For the reasons mentioned above, mid-ventricular segmental conductance could constitute an
estimate of global volume dynamics, with the estimating strengths somewhere in between the
strengths of total conductance derived from the five segmental conductance catheter, and
echocardiographic short axis area measured at mid-ventricular level. Each method seems to have
strengths and weaknesses, but all of them may be useful depending on experimental and
diagnostic purpose.
Since the segments on the five segmental catheter are discrete and not changeable, an effort was
made in II to optimise the positions of the measuring electrodes of a single segment catheter.
Data from measurements using the the five segmental catheter during steady state as well as

- 58 -
during changes in loading condtions were included in the calculations, and as many
measurements from as many different animals as possible were used. It was assumed that the
obtained result would then be generally applicable to left ventricular conductance measurements.
However, since every induced change in loading condition is preceeded by a steady state phase,
included in the measurement, a majority of steady state beats were included in the calculations.
This might have slightly affected the result of the calculations.
On the other hand, the calculated electrode positions were used to ‘re-run’ the experiments.
During these ‘re-runs’, no significant differences in curve shape, or any proportional differences
in end-diastolic or end-systolic volume during provocations were found. This, together with the
fact that the number of measurements and animals included in the calculations were considerable,
supports our belief that our initial approach to the problem was sufficiently appropriate, even if it
would be of advantage to validate the calculated positions of the electrodes on independent data.
The electrical field was calculated from segmental data using cubic interpolation, which approach
simply seemed to be reasonable. Cubic interpolation is very smooth in space and this should also
be the case for the electrical field in the left ventricle and surrounding tissue.
Since data from the commercially available five segmental catheter were used in this study, the
calculations are valid for a single segment catheter having the same dimensions and mechanical
properties as the catheter used. Furthermore, the calculations were made on data from a dual-
field catheter. In order to experimentally verify the validity of the calculations, such a dual-field
single segmental catheter should be constructed. However, this would be pointless, since the goal
of constructing a single segment catheter would be both to maintain the quality of the volume
measurements, and to reduce the number of electrodes and thus cables inside (and consequently
the diameter), allowing the catheter to be soft and flexible and thus avoiding risk of damaging the
valves or inducing arrythmias. The calculated positions of the measuring electrodes may thus be
seen as a starting point of further development.
As presented in III, a single segment conductance catheter, including a pressure transducer, was
constructed inspired by calculations performed in II. The catheter was aimed to be very soft and
thin, minimising thereby a possible interference with cardiac electrophysiology.

- 59 -
As discussed above, calculations from II are perhaps not quite valid for this type of flexible
catheter. During the animal experiments, the catheter could only be positioned, as expected,
along the myocardial septum and not in the center of the ventricle. Thus, it is likely that the
electrical field induced in the intraventricular blood volume was considerably inhomogeneous.
Furthermore, due to its flexible properties, the catheter probably moved or was bent during the
cardiac cycle, which could have induced a heart cycle-varying electrical field and thus
measurement artefacts.
For such a small diameter of a catheter (below 0.5 mm), the distance between the cables or leads
become very small. Since currents of several kHz are used, there is capacitive coupling between
the cables (i.e. microphony). During the construction phase, the level of microphony was tested,
and was found to be acceptable in the frequency range of use (<50kHz). However, some noise
would be inavoidable.
The problems discussed above were anticipated to occur. And yet, due to the difficulties and
complexity of the conductance technique, a series of animal experiments had to be performed to
test the properties of the catheter in reality. It must be stressed that not only the quality of the
measurements were evaluated, but also the practical usefulness of the catheter from the surgeon’s
point of view (user persective), and in terms of interference with the cardiac electrophysiology
(patient perspective).
The obtained results showed, as was expected, pronounced changes in conductance during the
isovolumic phases, especially during the isovolumic contraction. This may have been caused by
movement or bending of the catheter. However, the measurements were consistent within each
animal in terms of curve shape and volume change during provocations, and very few arrythmias
were induced. The practical use of the catheter was also evaluated, revealing that the small
diameter and flexibility of the catheter can make it somewhat difficult to handle before the
insertion. However, this is of minor importance.
In III, no reference method was used. It would have been desirable to compare the results from
the single segmental catheter with simultaneously measured data from commercially available five
segmental conductance catheter. It is, however, not possible to measure conductance
simultaneously, since the respective electrical fields will interfere with each other and the
measurements would have to be performed anyway one at a time. Comparisons that may be of

- 60 -
interest are for example comparisons of curve shapes during the cardiac cycle, proportional
changes during different provocations, parallel conductances, and estimated noise level.
The comparison between data obtained simultaneously with the commercially available five
segmental catheter and the single segment catheter as suggested above has been performed
subsequently in animal experiments by our group (Carlsson 2002). In terms of data quality (noise)
and expected behaviour during provocations, the five segmental catheter may be preferable. On
the other hand, data from the single segmental catheter showed that it delivers an expected
volume curve appearence, regarding percentage of atrial contribution, and decrasing or increasing
total volume during provocations. Cardiac function may thus be evaluated using a single segment
catheter. Furthermore, the small diameter and flexibility of the single segment catheter constitute
properties that are clinically preferable.
Area as volume estimate (VIII)
In VIII, the feasibility of a non-invasive assessment of left ventricular flow-volume relationship
throughout the cardiac cycle was explored using transthoracic echocardiography technique. Flow-
volume measurement is well established as a clinical measure of lung function through its ability
to demonstrate the dynamic nature of an underlying obstructive or restrictive process (Petty
1981). Although there are differences in the underlying dynamics, potentially, the same measure
may be applied to the function of the left ventricle.
A flow-volume loop does not represent any known physical property as energy or such. Its
advantage lies in its visual appearance. If cardiac flow-volume presentation of data shares the
same features as for the respiratory case, obstructive and restrictive flow patterns will be revealed
in the plot. A glance will be sufficient to differentiate healthy from diseased.
Flow will be greater in big than in small hearts and will also change along with the heart rate. This
puts forward the need of normalising the data with respect to heart rate, body area, age, etc. On
the other hand we do not know at this moment whether loops from big and small ventricles
generally have the same features or not. It is therefore perhaps too early to normalise data, given
the small amount of research in this field.
The reliability of presented methodology is based on certain assumptions. The assessment of
changes of global left ventricular volume, described in VIII, was obtained by measuring left

- 61 -
ventricular 2-D areas in echocardiographic images and the measured 2-D areas were the same as
those used for calculation of left ventricular volumes and ejection fraction with Simpson’s rule
algorithm (Folland et al. 1979, Parisi et al. 1979, Moynihan et al. 1980). The Simpson’s algorithm
has been shown to perform sufficiently robustly in the clinical setting (Chuang et al. 2000) and
the left ventricular area measurements have been shown to accurately reflect changes in the left
ventricular volume measured with conductance volumetry (Gorcsan et al. 1993). Hence, the
currently measured left ventricular area would constitute a reasonably good estimate of left
ventricular volume dynamics.
It has to be emphasized that, in VIII, left ventricular volume was not calculated but, instead,
time-dependent left ventricular area was measured and then employed to calculate its first
derivative in order to obtain an estimate of time-dependent volume, i.e. flow. It has to be
remembered, however, that area so measured may differ in its dynamic behavior (and then
amplified in its first derivative) from corresponding volume data, although both data sets still
reflecting the same underlying (patho-) physiological processes, as discussed in connection with I.
Consequently, the area-based measures in this study are called flow-volume estimates.
A study in which employment of the concept of flow-volume loops onto 3D echocardiographic
data is presently ongoing at our department.
Volume curve artefacts (IV, VI)
Estimates of left ventricular volume, either by the conductance catheter method or by
echocardiographic area measurements, seem to reflect not only volume, but also changes in
geometry. This can be seen with both methods during the isovolumic phases (Salisbury et al.
1965). As for the conductance catheter method, the measured conductance most often decreases
during isovolumic contraction (although volume should be constant) and increases during
isovolumic relaxation. It has been argued that these changes reflect true volume changes, caused
by mitral and aortic valve insufficiencies. However, in IV, no insufficiencies were detected, at
least not during the isovolumic contraction phase, since no mitral regurgitation was found by
performing simultaneous ultrasound doppler measurements. Nevertheless, the conductance
signal decreased during isovolumic contraction and, whatever the cause for this, the decrease
must be seen as erroneous if interpreted as volume. In this case as well as for the conductance
increase during isovolumic relaxation, an adjustment should be made independently of type of

- 62 -
measurement or provocation, and type of patient or animal, if an adjustment of the conductance
signal is desirable.
In IV, we used the left ventricular pressure measured simultaneously with conductance, in order
to determine the duration of the isovolumic phases. Subsequently, during these phases,
conductance change (i.e. first derivative of conductance) was forced to zero. This type of
modification is probably not accurate in the case of mitral or aortic regurgitation.
By performing such an adjustment, the curve shapes during systole and diastole are maintained.
The obtained volume curve are thus very suitable to use in a flow-volume plot, as was discussed
above, since only the conductance changes reflecting volume changes will be used.
On the other hand, when plotting the first derivative of conductance (~flow) against pressure
(figure 14, Results), the isovolumic events are made clearly visible. If there is no isovolumic
volume change, it must be another physiological process influencing the conductance
measurement. Our guess is that conductance to some extent reflects the geometry of the left
ventricle and the obtained data may be possibly used to quantify these events. This could be of
clinical importance, for example in order to detect ischemia (Edvardsen et al. 2000, Jensen et al.
2001, Edvardsen et al. 2002).
During calculations, two major problems were encountered. Firstly, changes during the respective
isovolumic changes were not equal. This resulted in a disturbed balance in estimated flow, i.e. for
each heart beat, the flow into the ventricle was greater than the flow out from the ventricle and
into the aorta. This was adjusted manually, but it needs to be handled if this type of adjustment is
to be made automatically. Secondly, subsequent to this adjustment, all transitions, as for example
the transition from isovolumic contraction phase to ejection phase, were somewhat abrupt, and
thus not physiological. A softer transition can be achieved using some form of polynomial to
interpolate the transition, with end slope values of zero for the isovolumic ‘side’ and the end-
point derivative of the conductance signal at onset of ejection.
However, the isovolumic changes in conductance apparently result in the decrease of the area of
the pressure volume loop and, consequently, also in the decrease of the estimated energy
imparted to the blood. Our study also revealed that the extent of loop area decrease differs from
animal to animal. The pressure-volume loop area may thus hypothetically depend on the position

- 63 -
of the catheter, the geometrical shape of the ventricle, the loading condition of the ventricle, or
the contractility. Without any adjustment in order to account for isovolumic conductance
changes, the loop area may be inaccurate.
If, and only if, the end-diastolic and the end-systolic
volumes measured with the conductance catheter are
correct, perhaps a simplified loop should be used for
monitoring purposes (figure 23). Volumes previously
mentioned should be used, together with minimum and
mean ejection pressure.
In VI, which was mainly presented as an observation and
an idea, the same kind of pattern in curve shape as in the
conductance signal was seen in myocardial longitudinal displacement, echocardiographically
measured using doppler velocity imaging. Displacement was calculated from the velocity signal.
From this observation, it is natural to hypothesize that the geometry of the left ventricle is related
to the conductance signal.
A limitation is that, apart from the different species (pigs-humans), measurements were
performed in an open chest model (pigs), and in a normal clinical setting for the humans
(apparently with closed chest).
Hence, considering Laplace’s law, an isovolumic inrease in pressure should result in a more
spheric shape of the ventricle (minimising energy). Consequently, conductance should increase.
As presented in VI, longitudinal displacement towards the apex (increasing spherity) and a
simultaneous decrease in conductance are contradictory, in respect of geometry vs. displacement.
Unpublished data reveals, however (figure 18, Results), that in an open chest animal model the
directions of change in simultaneously measured myocardial longitudinal displacement and
conductance are opposite and thus coherent regarding geometry assumptions.
Systolic pressure wave form (V, VII)
Given the impracticability of intraventricular simultaneous pressure and volume measurements,
alternative ways to obtain the information about alterations in cardiac function have been
explored, mostly by analyzing the influence of varying hemodynamics on central arterial pressure
P
V
P
VFigure 23. A simplified pressure-
volume loop constituting of only
four pairs of data.

- 64 -
wave form (Murgo et al. 1980) and by reconstruction of central arterial pressure curves from
those recorded more peripherally (Adji and O'Rourke 2004, Gallagher et al. 2004). However, the
approach is not optimal since central arterial and left ventricular pressure wave forms during
systole are not identical due to different compliance compartments, Venturi effect and the
occurrence of the reflected pulse waves (Noble 1979, Nichols and Pepine 1982). The influence of
load and contractility on the left ventricular pressure wave form has, to our knowledge, not yet
been studied systematically.
In a number of studies, however, changes in left ventricular curve shape accompanying load
changes have been presented, even if not explicitly analysed (Elzinga and Westerhof 1973, Ishide
et al. 1980, Piene and Myhre 1984, Ishide et al. 1985, Yaginuma et al. 1985, Myhre et al. 1986,
Yaginuma et al. 1986). Pressure recordings from the right ventricle (Vogel 2003) also showed the
same kind of changes in systolic pressure wave form induced by changes in loading conditions.
In the course of the animal experiments, performed to evaluate the conductance catheter, we
noticed that the systolic pressure curve shape changed during changes both in loading conditions
and in contractility. It was even so that during the measurements, the engineers behind the PC
and thus having access to the continuous left ventricular pressure curve had better control over
tendencies of subject hypovolemia than the surgeon. However, this observation needed to be
quantified in some way.
In V, our first attempt in that direction was presented. The systolic pressure complex used was
defined between time points corresponding to 50% of the pressure amplitude. Hence the data
used in each beat covered an interval from about mid-isovolumic contraction phase to mid-
isovolumic relaxation phase. The choice of 50% was made ad hoc, using intuitive sense of
reasonable compromise between including as much of systole as possible, and always excluding
diastolic events.
Since the choice of quantification of the systolic pressure complex was time to maximum
pressure related to the width of the systolic complex (as defined above), at least baseline heart
beats showed great variability in respect of the time-to-max parameter. This comes out of the fact
that at baseline, the pressure is approximately constant during the ejection phase. In the worst
cases, maximum pressure varied between early and late systole from beat to beat.

- 65 -
In VII, the approach was different. In order to decrease baseline variability and still discriminate
between changed loading conditions and contractility, some other variable than time to maximum
pressure, used in V, had to be considered. Pmax decreases with decreasing preload, but increases
both with increasing contractility and afterload. Another variable used together with Pmax should
then have some other behaviour, during inotropic and loading changes.
The well documented variables (dP/dt)max and (dP/dt/P)max are usually used as measures of
contractility, but are more or less loading dependent (Kass et al. 1987). Furthermore, these
variables do not reflect the curve shape.
As far as (dP/dt)max is concerned, the absolute maximal values for this variable are obtained
during the isovolumic phases. Hence, both (dP/dt)max and (dP/dt/P)max are coupled to aortic
impedance only in an indirect manner. Furthermore, (dP/dt)max values during provocations are to
a considerable extent proportional to those of Pmax and, consequently, cannot be expected to
provide any substantial additional information.
During ejection phase, the pressure waveform will in most (if not all) cases have its maximum
and minimum (dP/dt) values at the opening and closing of the aortic valve, respectively. These
values are also proportional to Pmax as above.
If dP/dt were measured, for example in the middle of the ejection phase, in order to evaluate the
slope of the pressure curve during ejection, it might be sensitive to transient events that in some
cases would be included in the measurements as, for example, the initial overshoot during
adrenalin provocation. However, in many cases, the value of dP/dt may be close to zero,
although some transient early or late events still may take place during the ejection phase. More
smoothing of the data will inevitably result in considerable loss of information.
Taking together, in order to account for early as well as for middle and late events during the
ejection phase, a mean dP/dt of the ejection phase should be calculated (using mean square error
linear interpolation). This variable (∆P/∆T) appears to be a good compromise between stability,
acceptable signal-to-noise ratio, and sensitivity.
The present results may have several clinical implications since during various surgical procedures
and especially during cardiac surgery, early detection and management of alterations in loading

- 66 -
conditions and contractility are of a great importance. The method described in VII may provide,
for example, a sensitive tool for monitoring of intravascular volume since hypo- and
hypervolemia will cause changes in pre- and afterload that will be reflected by clear-cut and
opposite changes in ∆P/∆T versus Pmax plot. Consequently, an early detection of intra-operative
bleeding or fluid retention would be made and the effects of appropriate action could be
immediately evaluated.
Furthermore, adrenalin, owing to its positive chronotropic/inotropic effect and dose-dependent
vasodilatation or vasoconstriction, is frequently used to counteract low-output state and shock
that may occur in connection with various surgical procedures. The primary aim of such a
pharmacological intervention is increased cardiac output. Since modern infusion devices allow
precise titration of adrenalin doses adjusted to obtain a desirable effect, an enhancement of
cardiac output without too strong energy consuming inotropic effect would thus be possible.
With the use of the presented monitoring method, a negative shift of ∆P/∆T values accompanied
by increased left ventricular pressure, i.e. the descending limb of the currently observed
adrenalin-induced ∆P/∆T loop, would clearly indicate the occurrence of such an effect.
As can be seen in the results of VII, baseline values of ∆P/∆T were different from animal to
animal, although all animals were young and healthy. This is likely due to inter-individual
differences in baseline hemodynamics in terms of for example blood volume, combined with
differencies in contractility.
Thus, preload and afterload can be
regarded as relative to the contractility of
the myocardium. The straight line formed
by the interventions of increased after-
load and decreased preload (figure 24),
may change in position (x-axis intercept).
The slope could be interpreted as dyna-
mic range and the intercept as a
contractility measure. That means that a
steeper slope will be due to a greater
increase in ∆P/∆T (than is usually seen)
for a given increase in maximum
Figure 24. A parallel shift of data
reflects contractility changes, and a cha-
nge in the angle φ probably reflects the
dynamic range (probably compliance) of
the circulatory system.
φ
Pmax
∆P/∆T
φ
Pmax
∆P/∆T

- 67 -
pressure. This example probably partly reflects an arterial tree with low compliance. An increased
contractility will show as a parallel shift downwards and towards the right, thus moving the x-axis
intercept to the right.
Sampling frequency and bandwidth of the pressure signal
It is probably always better to use a transducer and a measuring system with broad bandwidth,
compared to one with a narrow one. However, the challenge is most often not to construct a new
system, but to choose one that is sufficiently good for the measurement. It is also important to
choose high enough sampling frequency for the measurement. Given that the pressure signal
contains only low-frequency components, not exceeding 30 Hz (Nichols and O'Rourke 2005),
and that the sampling frequency should be 3-4 times higher than bandwidth of the signal to be
measured (Sigwart 1978), a sampling frequency of 120 Hz should be sufficient.
A system using a fluid-filled catheter for pressure measurement could in theory be used to
measure the systolic curve shape. Such a system has high enough bandwidth, given that the
catheter is accurately flushed, in order to decrease the number of micro-bubbles.
However, damping might be a big problem. If the system is under-damped, considerable
oscillations will occur after the isovolumic contraction phase (at the onset of ejection) thus
distorting the pressure signal. It is likely that these oscillations will increase with increased
contractility. The ∆P/∆T value will then be more negative than otherwise. An over-damped
system will show a too low pressure value at the onset of ejection. ∆P/∆T will thus be more
positive than otherwise. Hence, it is recommended not to use such a system when monitoring left
ventricular pressure curve shape.
Monitoring of pressure and volume
As a conclusion from experimental experiences
gathered during the performed measurements
preceding and leading to this thesis, the use of
a simplified pressure-volume loop may be an
applicable alternative for pressure and volume
monitoring, as described in figure 25. Discrete
pressure values from the end of the isovolumic
relaxation phase and from end-diastole should
P
V
P
VFigure 25. A PV-loop using only using discrete
values. Suggested for monitoring purposes.

- 68 -
be used together with calculated pressure values at onset of ejection and at end-ejection, obtained
from the interpolation of ∆P/∆T (in respect of time). The volumes or their estimates used to
construct the simplified loop should only be end-systolic and end-diastolic.
On the other hand, the curve shape will then be hidden. As has been discussed, the volume curve
shape, whatever the measuring method, reflects some known or unknown physiological events.
Isovolumic changes may be quantified, and flow-volume loops may be constructed.
Power in a pressure-volume context
It has been shown, that velocity of contraction may be increased without any change in force, e.g.
with heart rate (Sonnenblick 1962b). In this respect, pressure-volume loops hide the velocity
component, since work per beat and thus area of the loop remain the same regardless of heart
rate.
Calculations done for a MSc thesis at Division of Medical Engineering in collaboration with the
author (Elmgren 2005), aimed to plot pressure and volume data divided by the square root of
heart cycle time (T), respectively (figure 26 below). The area of the loop would then reflect the
power of the heart cycle: (PxV)/(√Tx√T), and change position and size with heart rate. Further,
the loop would not change in shape compared to its pressure-volume equivalent. An evident
drawback is that instant power is not measured, and that data itself does not reflect power. This
concept could easily be combined with the suggestion given in the previous paragraph.
Figure 26. To the left, PV-loops during infusion of adrenalin. To the right, the same
measurement, but with axes scaled with 1/√T, respectively. The area of the loops to the right
thus reflecting mean developed power.
0 50 100 150 200
0
50
100
150
Volym[ml]
Try
ck[m
mH
g]
0 50 100 150 200
0
50
100
150
Volym[ml/s0.5]
Try
ck[m
mH
g/s0.
5 ]
P P/√T
V V√T

- 69 -
Conclusions
A number of measurement techniques and data anlyses and display modes have been evaluated.
Results suggest that cardiac monitoring could be improved by the use of a thin, flexible single
segmental conductance catheter and by automatically applying some of the results to standard
measurement equipment.
• Mid-ventricular segmental conductance seems to be a good estimate of left ventricular
volume, even during induced apical ischemia.
• With strategically positioned electrodes on a single segment conductance catheter it is
theoretically possible to achieve the same performance as from the five segmantal
conductance catheter.
• A thin and flexible single segmental pressure-volume catheter produces reproducible data.
The conductance changes as expected during changes in loading conditions.
• The conductance signal changes during the isovolumic phases, despite that left ventricular
volume is constant. This observation can be applied to adjustment of the conductance
curve shape.
• The curve shape of left ventricular pressure reflects changes in loading conditions and
contractility. The curve shape can be described using a simple computerized algorithm
and changes can be discriminated and categorized.
• Left ventricular area, continuously measured during the entire cardiac cycle using
echocardiography with automated boundary detection, and its first derivative can be
presented as a flow-volume estimates loop in order to potentially detect and visualize
abnormalities of left ventricular function.

- 70 -
References Aakhus, S, J Maehle and K Bjoernstad 1994 A new method for echocardiographic computerized
three-dimensional reconstruction of left ventricular endocardial surface: in vitro accuracy and clinical repeatability of volumes J Am Soc Echocardiogr 7(6): 571-81.
Abe, S, J Ohtomo, I Yamaguchi, E Tsuchida, T Fujinuma, K Sunagawa and H Tomoike 1995 Continuous measurement of left ventricular volume in rabbit, using a two-electrode catheter Heart Vessels 10(3): 138-45.
Adji, A and M F O'Rourke 2004 Determination of central aortic systolic and pulse pressure from the radial artery pressure waveform Blood Press Monit 9(3): 115-21.
Al-Khalidi, A H, J N Townend, R S Bonser and J H Coote 1998 Validation of the conductance catheter method for measurement of ventricular volumes under varying conditions relevant to cardiac surgery Am J Cardiol 82(10): 1248-52.
Applegate, R J, C P Cheng and W C Little 1990 Simultaneous conductance catheter and dimension assessment of left ventricle volume in the intact animal Circulation 81(2): 638-48.
Appleyard, R F and S A Glantz 1990 Two dimensions describe left ventricular volume change during hemodynamic transients Am J Physiol 258(1 Pt 2): H277-84.
Baan, J, T Aouw Jong, P L Kerkhof, R J Moene, A D van Dijk, E T van der Velde and J Koops 1982 Continuous registration of relative left ventricular volume in man. (Abstract) Circulation (suppl.) 66(II): II-277.
Baan, J, T T Jong, P L Kerkhof, R J Moene, A D van Dijk, E T van der Velde and J Koops 1981 Continuous stroke volume and cardiac output from intra-ventricular dimensions obtained with impedance catheter Cardiovasc Res 15(6): 328-34.
Baan, J, E T van der Velde, H G de Bruin, G J Smeenk, J Koops, A D van Dijk, D Temmerman, J Senden and B Buis 1984 Continuous measurement of left ventricular volume in animals and humans by conductance catheter Circulation 70(5): 812-23.
Baan, J, E T van der Velde and P Steendijk 1992 Ventricular pressure-volume relations in vivo Eur Heart J 13 Suppl E: 2-6.
Baan, J, E T van der Velde, P Steendijk and J Koops 1989 Calibration and application of the conductance catheter for ventricular volume measurement Automedica 11: 357-365.
Berger, D S and J K Li 1992 Temporal relationship between left ventricular and arterial system elastances IEEE Trans Biomed Eng 39(4): 404-10.
Bishop, A, P White, R Chaturvedi, C Brookes, A Redington and P Oldershaw 1997a Resting right ventricular function in patients with coronary artery disease: pressure volume analysis using conductance catheters Int J Cardiol 58(3): 223-8.
Bishop, A, P White, P Oldershaw, R Chaturvedi, C Brookes and A Redington 1997b Clinical application of the conductance catheter technique in the adult human right ventricle Int J Cardiol 58(3): 211-21.
Boltwood, C M, Jr., R F Appleyard and S A Glantz 1989 Left ventricular volume measurement by conductance catheter in intact dogs. Parallel conductance volume depends on left ventricular size Circulation 80(5): 1360-77.
Buoncristiani, J F, A J Liedtke, R M Strong and C W Urschel 1973 Parameter estimates of a left ventricular model during ejection IEEE Trans Biomed Eng 20(2): 110-4.
Burkhoff, D and K Sagawa 1986 Ventricular efficiency predicted by an analytical model Am J Physiol 250(6 Pt 2): R1021-7.
Caputo, M, J Schreuder, C Fino, J Baan and O Alfieri 2000 Assessment of myocardial performance with ventricular pressure-volume relations: clinical applications in cardiac surgery Ital Heart J 1(4): 269-74.
Carabello, B A 2003 The ten most commonly asked questions about measuring left ventricular function Cardiol Rev 11(2): 58-9.

- 71 -
Carlsson, C 2002 Development of a thin, soft, single segment conductance catheter for monitoring left ventricular pressure and volume. Licentiate thesis, Royal Institute of Technology.
Chen, C H, E Nevo, B Fetics, M Nakayama, P H Pak, W L Maughan and D A Kass 1997 Comparison of continuous left ventricular volumes by transthoracic two-dimensional digital echo quantification with simultaneous conductance catheter measurements in patients with cardiac diseases Am J Cardiol 80(6): 756-61.
Chuang, M L, M G Hibberd, C J Salton, R A Beaudin, M F Riley, R A Parker, P S Douglas and W J Manning 2000 Importance of imaging method over imaging modality in noninvasive determination of left ventricular volumes and ejection fraction: assessment by two- and three-dimensional echocardiography and magnetic resonance imaging J Am Coll Cardiol 35(2): 477-84.
Davies, J E, Z I Whinnett, D P Francis, C H Manisty, J Aguado-Sierra, K Willson, R A Foale, I S Malik, A D Hughes, K H Parker and J Mayet 2006 Evidence of a dominant backward-propagating "suction" wave responsible for diastolic coronary filling in humans, attenuated in left ventricular hypertrophy Circulation 113(14): 1768-78.
Dekker, A L A J, L D Sauren, F H van der Veen, B Mochtar and J G Maessen 2002 Pressure-volume loops in aortic regurgitation. (Abstract) Proceedings, Int Congress on Ventricular function and failure, Maastricht, NL, Jan 17-19: 58.
Edvardsen, T, S Aakhus, K Endresen, R Bjomerheim, O A Smiseth and H Ihlen 2000 Acute regional myocardial ischemia identified by 2-dimensional multiregion tissue Doppler imaging technique J Am Soc Echocardiogr 13(11): 986-94.
Edvardsen, T, S Urheim, H Skulstad, K Steine, H Ihlen and O A Smiseth 2002 Quantification of left ventricular systolic function by tissue Doppler echocardiography: added value of measuring pre- and postejection velocities in ischemic myocardium Circulation 105(17): 2071-7.
Elmgren, P 2005 Analysverktyg för hjärtats pumparbete. Exam work MSc. Dep of Medical Engineering, Karolinska Institutet Report number 278.
Elzinga, G and N Westerhof 1973 Pressure and flow generated by the left ventricle against different impedances Circ Res 32(2): 178-86.
Elzinga, G and N Westerhof 1976 The pumping ability of the left heart and the effect of coronary occlusion Circ Res 38(4): 297-302.
Emilsson, K, M Alam and B Wandt 2000 The relation between mitral annulus motion and ejection fraction: a nonlinear function J Am Soc Echocardiogr 13(10): 896-901.
Feldman, M D, Y Mao, J W Valvano, J A Pearce and G L Freeman 2000 Development of a multifrequency conductance catheter-based system to determine LV function in mice Am J Physiol Heart Circ Physiol 279(3): H1411-20.
Foex, P and B J Leone 1994 Pressure-volume loops: a dynamic approach to the assessment of ventricular function J Cardiothorac Vasc Anesth 8(1): 84-96.
Folland, E D, A F Parisi, P F Moynihan, D R Jones, C L Feldman and D E Tow 1979 Assessment of left ventricular ejection fraction and volumes by real-time, two-dimensional echocardiography. A comparison of cineangiographic and radionuclide techniques Circulation 60(4): 760-6.
Frank, O 1895 Zur Dynamik der Herzmuskels Zeitschrift für Biologie(32): 370-447. Gallagher, D, A Adji and M F O'Rourke 2004 Validation of the transfer function technique for
generating central from peripheral upper limb pressure waveform Am J Hypertens 17(11 Pt 1): 1059-67.
Gawne, T J, K S Gray and R E Goldstein 1987 Estimating left ventricular offset volume using dual-frequency conductance catheters J Appl Physiol 63(2): 872-6.
Georgakopoulos, D and D A Kass 2000 Estimation of parallel conductance by dual-frequency conductance catheter in mice Am J Physiol Heart Circ Physiol 279(1): H443-50.

- 72 -
Georgakopoulos, D, W A Mitzner, C H Chen, B J Byrne, H D Millar, J M Hare and D A Kass 1998 In vivo murine left ventricular pressure-volume relations by miniaturized conductance micromanometry Am J Physiol 274(4 Pt 2): H1416-22.
Gibson, D G, T A Prewitt and D J Brown 1976 Analysis of left ventricular wall movement during isovolumic relaxation and its relation to coronary artery disease Br Heart J 38(10): 1010-9.
Glower, D D, J A Spratt, N D Snow, J S Kabas, J W Davis, C O Olsen, G S Tyson, D C Sabiston, Jr. and J S Rankin 1985 Linearity of the Frank-Starling relationship in the intact heart: the concept of preload recruitable stroke work Circulation 71(5): 994-1009.
Gorcsan, J, 3rd, S Morita, W A Mandarino, L G Deneault, A Kawai, R L Kormos, B P Griffith and M R Pinsky 1993 Two-dimensional echocardiographic automated border detection accurately reflects changes in left ventricular volume J Am Soc Echocardiogr 6(5): 482-9.
Gorcsan, J, III, A Denault, W A Mandarino and M R Pinsky 1996 Left ventricular pressure-volume relations with transesophageal echocardiographic automated border detection: comparison with conductance-catheter technique Am Heart J 131(3): 544-52.
Haney, M F, G Johansson, S Haggmark and B Biber 2002 Method of preload reduction during LVPVR analysis of systolic function: airway pressure elevation and vena cava occlusion Anesthesiology 97(2): 436-46.
Henein, M Y and D G Gibson 1999 Normal long axis function Heart 81(2): 111-3. Henry, W L, A DeMaria, R Gramiak, D L King, J A Kisslo, R L Popp, D J Sahn, N B Schiller, A
Tajik, L E Teichholz and A E Weyman 1980 Report of the American Society of Echocardiography Committee on Nomenclature and Standards in Two-dimensional Echocardiography Circulation 62(2): 212-7.
Herrera, M C, J M Olivera and M E Valentinuzzi 1999 Parallel conductance estimation by hypertonic dilution method with conductance catheter: effects of the bolus concentration and temperature IEEE Trans Biomed Eng 46(7): 830-7.
Ishide, N, Y Maruyama, S Isoyama, O Nishioka and T Takishima 1985 Responses of left ventricle to changes in aortic input impedance Jpn Circ J 49(2): 215-23.
Ishide, N, Y Shimizu, Y Maruyama, Y Koiwa, T Nunokawa, S Isoyama, S Kitaoka, K Tamaki, E Ino-Oka and T Takishima 1980 Effects of changes in the aortic input impedance on systolic pressure-ejected volume relationships in the isolated supported canine left ventricle Cardiovasc Res 14(4): 229-43.
Jensen, J, L A Brodin, B Lind, S V Eriksson, M Jensen-Urstad and C Sylven 2001 Deterioration in peak systolic velocity is closely related to ischaemia during angioplasty: a vectorcardiographic and tissue Doppler imaging study Clin Sci (Lond) 100(2): 137-43.
Kass, D A and R Beyar 1991 Evaluation of contractile state by maximal ventricular power divided by the square of end-diastolic volume Circulation 84(4): 1698-708.
Kass, D A, W L Maughan, Z M Guo, A Kono, K Sunagawa and K Sagawa 1987 Comparative influence of load versus inotropic states on indexes of ventricular contractility: experimental and theoretical analysis based on pressure-volume relationships Circulation 76(6): 1422-36.
Kass, D A, M Midei, W Graves, J A Brinker and W L Maughan 1988 Use of a conductance (volume) catheter and transient inferior vena caval occlusion for rapid determination of pressure-volume relationships in man Cathet Cardiovasc Diagn 15(3): 192-202.
Kass, D A, T Yamazaki, D Burkhoff, W L Maughan and K Sagawa 1986 Determination of left ventricular end-systolic pressure-volume relationships by the conductance (volume) catheter technique Circulation 73(3): 586-95.
Kiyooka, T, G Iribe, J Shimizu, J Araki, H Suga and F Kajiya 2002 Effects of heart rate on calcium handling energetics in canine left ventricle. (Abstract) Proceedings, Int Congress on Ventricular function and failure, Maastricht, NL, Jan 17-19: 56.
- 73 -
Kornet, L, J J Schreuder, E T van der Velde, J Baan and J R Jansen 2000 A new approach to determine parallel conductance for left ventricular volume measurements Cardiovasc Res 48(3): 455-63.
Kornet, L, J J Schreuder, E T van der Velde and J R Jansen 2001 The volume-dependency of parallel conductance throughout the cardiac cycle and its consequence for volume estimation of the left ventricle in patients Cardiovasc Res 51(4): 729-35.
Krenning, B J, M M Voormolen and J R Roelandt 2003 Assessment of left ventricular function by three-dimensional echocardiography Cardiovasc Ultrasound 1: 12.
Kun, S and R A Peura 1993 Conductance volumetric model of an eccentrically positioned catheter within a three-compartment ellipsoidal ventricle IEEE Trans Biomed Eng 40(6): 589-92.
Lankford, E B, D A Kass, W L Maughan and A A Shoukas 1990 Does volume catheter parallel conductance vary during a cardiac cycle? Am J Physiol 258(6 Pt 2): H1933-42.
Lind, B, J Nowak, P Cain, M Quintana and L A Brodin 2004 Left ventricular isovolumic velocity and duration variables calculated from colour-coded myocardial velocity images in normal individuals Eur J Echocardiogr 5(4): 284-93.
Lind, B, J Nowak, J Dorph, J van der Linden and L A Brodin 2002 Analysis of temporal requirements for myocardial tissue velocity imaging Eur J Echocardiogr 3(3): 214-9.
Lundback, S 1986 Cardiac pumping and function of the ventricular septum Acta Physiol Scand Suppl 550: 1-101.
Mandarino, W A, M R Pinsky and J Gorcsan, 3rd 1998 Assessment of left ventricular contractile state by preload-adjusted maximal power using echocardiographic automated border detection J Am Coll Cardiol 31(4): 861-8.
Mason, D T 1969 Usefulness and limitations of the rate of rise of intraventricular pressure (dp-dt) in the evaluation of myocardial contractility in man Am J Cardiol 23(4): 516-27.
Mason, D T, E Braunwald, J W Covell, E H Sonnenblick and J Ross, Jr. 1971 Assessment of cardiac contractility. The relation between the rate of pressure rise and ventricular pressure during isovolumic systole Circulation 44(1): 47-58.
Mason, D T, J F Spann, Jr. and R Zelis 1970 Quantification of the contractile state of the intact human heart. Maximal velocity of contractile element shortening determined by the instantaneous relation between the rate of pressure rise and pressure in the left ventricle during isovolumic systole Am J Cardiol 26(3): 248-57.
McKay, R G, J R Spears, J M Aroesty, D S Baim, H D Royal, G V Heller, W Lincoln, R W Salo, E Braunwald and W Grossman 1984 Instantaneous measurement of left and right ventricular stroke volume and pressure-volume relationships with an impedance catheter Circulation 69(4): 703-10.
Monaghan, M J 2006 Role of real time 3D echocardiography in evaluating the left ventricle Heart 92(1): 131-6.
Moynihan, P F, A F Parisi, E D Folland, D R Jones and C L Feldman 1980 A system for quantitative evaluation of left ventricular function with two-dimensional ultrasonography Med Instrum 14(2): 111-6.
Murgo, J P, N Westerhof, J P Giolma and S A Altobelli 1980 Aortic input impedance in normal man: relationship to pressure wave forms Circulation 62(1): 105-16.
Myhre, E S, A Johansen, J Bjornstad and H Piene 1986 The effect of contractility and preload on matching between the canine left ventricle and afterload Circulation 73(1): 161-71.
Myhre, E S, A Johansen and H Piene 1988 Optimal matching between canine left ventricle and afterload Am J Physiol 254(6 Pt 2): H1051-8.
Nichols, W W and M F O'Rourke 2005 McDonald's Blood flow in arteries Hodder Arnold. Nichols, W W and C J Pepine 1982 Left ventricular afterload and aortic input impedance:
implications of pulsatile blood flow Prog Cardiovasc Dis 24(4): 293-306.

- 74 -
Nichols, W W, C J Pepine, E A Geiser and C R Conti 1980 Vascular load defined by the aortic input impedance spectrum Fed Proc 39(2): 196-201.
Noble, M I 1979 Left ventricular load, arterial impedance and their interrelationship Cardiovasc Res 13(4): 183-98.
Noble, M I, I T Gabe, D Trenchard and A Guz 1967 Blood pressure and flow in the ascending aorta of conscious dogs Cardiovasc Res 1(1): 9-20.
Oe, M, J Gorcsan, 3rd, W A Mandarino, A Kawai, B P Griffith and R L Kormos 1995 Automated echocardiographic measures of right ventricular area as an index of volume and end-systolic pressure-area relations to assess right ventricular function Circulation 92(4): 1026-33.
O'Rourke, M F 2004 Ascending aortic pressure wave indices and cardiovascular disease Am J Hypertens 17(8): 721-3.
O'Rourke, M F and A L Pauca 2004 Augmentation of the aortic and central arterial pressure waveform Blood Press Monit 9(4): 179-85.
Parisi, A F, P F Moynihan, C L Feldman and E D Folland 1979 Approaches to determination of left ventricular volume and ejection fraction by real-time two-dimensional echocardiography Clin Cardiol 2(4): 257-63.
Patterson, S W, H Piper and E H Starling 1914 The regulation of the heart beat J Physiol 48(6): 465-513.
Persson, S 2003 Kardiologi - hjärtsjukdomar hos vuxna Studentlitteratur. Petty, T L 1981 Spirometry in clinical practice Postgrad Med 69(4): 122-32. Piene, H 1984 Impedance matching between ventricle and load Ann Biomed Eng 12(2): 191-207. Piene, H and E S Myhre 1984 Left ventricle-aortic coupling: prediction of contraction pattern
Am J Physiol 247(4 Pt 2): H531-40. Rankin, J S, P A McHale, C E Arentzen, D Ling, J C Greenfield, Jr. and R W Anderson 1976 The
three-dimensional dynamic geometry of the left ventricle in the conscious dog Circ Res 39(3): 304-13.
Ross, J, Jr. 1976 Afterload mismatch and preload reserve: a conceptual framework for the analysis of ventricular function Prog Cardiovasc Dis 18(4): 255-64.
Safar, M E, B I Levy and H Struijker-Boudier 2003 Current perspectives on arterial stiffness and pulse pressure in hypertension and cardiovascular diseases Circulation 107(22): 2864-9.
Sagawa, K, W L Maughan, H Suga and K Sunagawa 1988 Cardiac contraction and the pressure-volume relationship. Oxford University Press.
Salisbury, P F, C E Cross and P A Rieben 1965 Phasic dimensional changes in the left ventricle Arch Int Physiol Biochim 73(2): 188-208.
Salo, R W 1989 The theoretical basis of a computational model for the determination of volume by impedance. Automedica 11: 299-310.
Sapra, R, B Singh, D Thatai, D Prabhakaran, A Malhotra and S C Manchanda 1998 Critical appraisal of left ventricular function assessment by the automated border detection method on echocardiography. Is it good enough? Int J Cardiol 65(2): 193-9.
Sarnoff, S J and E Berglund 1954 Ventricular function. I. Starling's law of the heart studied by means of simultaneous right and left ventricular function curves in the dog Circulation 9(5): 706-18.
Savitzky, A and M J E Golay 1964 Smoothing and differentiation of data by simplified least squares procedures. Analytical Chemistry 36(8): 1627-1630.
Schmidlin, D, S Aschkenasy, P R Vogt, J Schmidli, R Jenni and E R Schmid 2000 Left ventricular pressure-area relations as assessed by transoesophageal echocardiographic automated border detection: comparison with conductance catheter technique in cardiac surgical patients Br J Anaesth 85(3): 379-88.

- 75 -
Schreuder, J J, J D Biervliet, E T van der Velde, K ten Have, A D van Dijk, N G Meyne and J Baan 1991 Systolic and diastolic pressure-volume relationships during cardiac surgery J Cardiothorac Vasc Anesth 5(6): 539-45.
Siegel, J H and E H Sonnenblick 1963 Isometric time-tension relationships as an index of myocardial contractility Circ Res 12: 597-610.
Sigwart, U 1978 Automation in cardiac diagnosis. Basel: Schwabe & Co. AG. Smiseth, O A, M A Frais, M Junemann, I Kingma, H Refsum, E R Smith, M J Lipton and J V
Tyberg 1991 Left and right ventricular diastolic function during acute pericardial tamponade Clin Physiol 11(1): 61-71.
Soderstrom, S, G Nyberg, M F O'Rourke, J Sellgren and J Ponten 2002 Can a clinically useful aortic pressure wave be derived from a radial pressure wave? Br J Anaesth 88(4): 481-8.
Sonnenblick, E H 1962a Force-velocity relations in mammalian heart muscle Am J Physiol 202: 931-9.
Sonnenblick, E H 1962b Implications of muscle mechanics in the heart Fed Proc 21: 975-90. Sonnenblick, E H and S E Downing 1963 Afterload as a primary determinant of ventricular
performance Am J Physiol 204: 604-10. Sonnenblick, E H, J H Siegel and S J Sarnoff 1963 Ventricular distensibility and pressure-volume
curve during sympathetic stimulation Am J Physiol 204: 1-4. Spinelli, J C and M E Valentinuzzi 1986 Conductivity and geometrical factors affecting volume
measurements with an impedancimetric catheter Med Biol Eng Comput 24(5): 460-4. Steendijk, P and J Baan 2000 Comparison of intravenous and pulmonary artery injections of
hypertonic saline for the assessment of conductance catheter parallel conductance Cardiovasc Res 46(1): 82-9.
Steendijk, P, E T van der Velde and J Baan 1992 Single and dual excitation of the conductance-volume catheter analysed in a spheroidal mathematical model of the canine left ventricle Eur Heart J 13 Suppl E: 28-34.
Steendijk, P, E T Van der Velde and J Baan 1993 Left ventricular stroke volume by single and dual excitation of conductance catheter in dogs Am J Physiol 264(6 Pt 2): H2198-207.
Suga, H, T Hayashi, M Shirahata, S Suehiro and R Hisano 1981 Regression of cardiac oxygen consumption on ventricular pressure-volume area in dog Am J Physiol 240(3): H320-5.
Sunagawa, K, K Sagawa and W L Maughan 1984 Ventricular interaction with the loading system Ann Biomed Eng 12(2): 163-89.
Szwarc, R S and H A Ball 1998 Simultaneous LV and RV volumes by conductance catheter: effects of lung insufflation on parallel conductance Am J Physiol 275(2 Pt 2): H653-61.
Szwarc, R S, D Laurent, P R Allegrini and H A Ball 1995 Conductance catheter measurement of left ventricular volume: evidence for nonlinearity within cardiac cycle Am J Physiol 268(4 Pt 2): H1490-8.
Szwarc, R S, L L Mickleborough, S Mizuno, G J Wilson, P Liu and S Mohamed 1994 Conductance catheter measurements of left ventricular volume in the intact dog: parallel conductance is independent of left ventricular size Cardiovasc Res 28(2): 252-8.
Tachibana, H, M Takaki, S Lee, H Ito, H Yamaguchi and H Suga 1997 New mechanoenergetic evaluation of left ventricular contractility in in situ rat hearts Am J Physiol 272(6 Pt 2): H2671-8.
Takaoka, H, T Shinke, K Hata and M Yokoyama 2002 Cardiac mechanics and energetics in patients with remodeled heart after myocardial infarction. (Abstract) Proceedings, Int Congress on Ventricular function and failure, Maastricht, NL, Jan 17-19: 62.
Thomas, J D, F A Flachskampf, C Chen, J L Guererro, M H Picard, R A Levine and A E Weyman 1992 Isovolumic relaxation time varies predictably with its time constant and aortic and left atrial pressures: implications for the noninvasive evaluation of ventricular relaxation Am Heart J 124(5): 1305-13.

- 76 -
Toorop, G P, G J Van den Horn, G Elzinga and N Westerhof 1988 Matching between feline left ventricle and arterial load: optimal external power or efficiency Am J Physiol 254(2 Pt 2): H279-85.
Tozeren, A and S Chien 1985 Modeling of time-variant coupling between left ventricle and aorta in cardiac cycle Am J Physiol 249(3 Pt 2): H560-9.
Uemura, K, T Kawada, M Sugimachi, C Zheng, K Kashihara, T Sato and K Sunagawa 2004 A self-calibrating telemetry system for measurement of ventricular pressure-volume relations in conscious, freely moving rats Am J Physiol Heart Circ Physiol 287(6): H2906-13.
van den Horn, G J, N Westerhof and G Elzinga 1985 Optimal power generation by the left ventricle. A study in the anesthetized open thorax cat Circ Res 56(2): 252-61.
van den Horn, G J, N Westerhof and G Elzinga 1986 Feline left ventricle does not always operate at optimum power output Am J Physiol 250(6 Pt 2): H961-7.
Warner, H R and A F Toronto 1960 Regulation of cardiac output through stroke volume Circ Res 8: 549-52.
Weber, T, J Auer, M F O'Rourke, E Kvas, E Lassnig, R Berent and B Eber 2004 Arterial stiffness, wave reflections, and the risk of coronary artery disease Circulation 109(2): 184-9.
Weiss, J L, L W Eaton, C H Kallman and W L Maughan 1983 Accuracy of volume determination by two-dimensional echocardiography: defining requirements under controlled conditions in the ejecting canine left ventricle Circulation 67(4): 889-95.
White, P A, C I Brookes, H Ravn, V Hjortdal, R R Chaturvedi and A N Redington 2001 Validation and utility of novel volume reduction technique for determination of parallel conductance Am J Physiol Heart Circ Physiol 280(1): H475-82.
White, P A, C I Brookes, H B Ravn, E E Stenbog, T D Christensen, R R Chaturvedi, K Sorensen, V E Hjortdal and A N Redington 1998 The effect of changing excitation frequency on parallel conductance in different sized hearts Cardiovasc Res 38(3): 668-75.
Vine, D L, H T Dodge, M Frimer, D K Stewart and J Caldwell 1976 Quantitative measurement of left ventricular volumes in man from radiopaque epicardial markers Circulation 54(3): 391-8.
Vogel, M, M M Cheung, J Li, S B Kristiansen, M R Schmidt, P A White, K Sorensen and A N Redington 2003 Noninvasive assessment of left ventricular force-frequency relationships using tissue Doppler-derived isovolumic acceleration: validation in an animal model Circulation 107(12): 1647-52.
Vogel, M, M R Schmidt, S B Kristiansen, M Cheung, P A White, K Sorensen and A N Redington 2002 Validation of myocardial acceleration during isovolumic contraction as a novel noninvasive index of right ventricular contractility: comparison with ventricular pressure-volume relations in an animal model Circulation 105(14): 1693-9.
Woodard, J C, C D Bertram and B S Gow 1989 Effect of radial position on volume measurements using the conductance catheter Med Biol Eng Comput 27(1): 25-32.
Wu, C C, T C Skalak, T R Schwenk, C M Mahler, A Anne, P W Finnerty, H L Haber, R M Weikle, 2nd and M D Feldman 1997 Accuracy of the conductance catheter for measurement of ventricular volumes seen clinically: effects of electric field homogeneity and parallel conductance IEEE Trans Biomed Eng 44(4): 266-77.
Yaginuma, T, A Avolio, M O'Rourke, W Nichols, J J Morgan, P Roy, D Baron, J Branson and M Feneley 1986 Effect of glyceryl trinitrate on peripheral arteries alters left ventricular hydraulic load in man Cardiovasc Res 20(2): 153-60.
Yaginuma, T, T Noda, M Tsuchiya, K Takazawa, H Tanaka, K Kotoda and S Hosoda 1985 Interaction of left ventricular contraction and aortic input impedance in experimental and clinical studies Jpn Circ J 49(2): 206-14.

- 77 -
Zile, M R, W H Gaasch, J D Carroll, M D Feldman, G P Aurigemma, G L Schaer, J K Ghali and P R Liebson 2001 Heart failure with a normal ejection fraction: is measurement of diastolic function necessary to make the diagnosis of diastolic heart failure? Circulation 104(7): 779-82.