new approach based on solid-phase microextraction to estimate polydimethylsiloxane fibre...
TRANSCRIPT

A
dtpK(w©
Ke
1
iSsfbcus
brccIr
0d
Journal of Chromatography A, 1124 (2006) 121–129
New approach based on solid-phase microextraction to estimatepolydimethylsiloxane fibre coating–water distribution
coefficients for brominated flame retardants
Maria Polo, Vanessa Casas, Maria Llompart ∗, Carmen Garcıa-Jares, Rafael CelaDepartamento de Quımica Analıtica, Nutricion y Bromatologıa, Facultad de Quımica, Instituto de Investigacion y Analisis Alimentario,
Universidad de Santiago de Compostela, E-15782 Santiago de Compostela, Spain
Available online 30 June 2006
bstract
A depletion solid-phase microextraction (SPME) method based on multiple SPME extraction was applied to estimate fibre coating–wateristribution constants (Kfs) of brominated flame retardants. Several polybrominated diphenyl ethers (PBDEs) including compounds present inhe commercial mixture “Pentamix”, and two polybrominated biphenyls (PBBs) were considered as target analytes. One hundred-micrometeroly(dimethylsiloxane) (PDMS) coating fibre was selected to estimate partition coefficients. SPME kinetics studies at 25 and 100 ◦C were performed.fs values obtained at both temperatures for brominated flame retardants were compared with the corresponding octanol–water partition coefficients
Kow) values found in literature. A linear log–log relationship between Kow with Kfs was found. To the best of our knowledge, this is the first studyhere brominated flame retardants Kfs values are estimated.2006 Elsevier B.V. All rights reserved.
eywords: Solid-phase microextraction; Brominated flame retardants; Microextraction coefficients; Octanol–water partition coefficients; Polybrominated diphenyl
otmsbK
dc[aivta
thers; Polybrominated biphenyls
. Introduction
Solid-phase microextraction (SPME) was first introducedn 1990 by Arthur and Pawliszyn as analytical technique [1].PME, mainly coupled to gas chromatography (GC), has beenuccessfully applied for the analysis of organic pollutant in dif-erent matrices [2], such as the well-known polychlorinatediphenyls (PCBs), polyaromatic hydrocarbons (PAHs), pesti-ides, etc. [3–6]. More recently, the SPME technique has beensed for the analysis of new concerning groups of pollutantsuch as brominated flame retardants [7].
Apart from the development of analytical methods, SPME haseen applied in other research areas, as measuring bioavailableather than total concentration of analyte in different matri-es [8–15], biomimetic studies [16] and determining polymer
oating/extraction matrix partition coefficients (Kfs) [17–22].n this way, several studies have attempted to establish a cor-elation between water microextraction coefficients (Kfs) and∗ Corresponding author. Tel.: +34 981 563100x14225; fax: +34 981 595012.E-mail address: [email protected] (M. Llompart).
o
mr[us
021-9673/$ – see front matter © 2006 Elsevier B.V. All rights reserved.oi:10.1016/j.chroma.2006.06.014
ctanol–water partition coefficients (Kow) [23–25]. Traditionalechniques used to estimate Kow, based mainly on slow-stirring
ethods, are extremely tedious [25–28]; so, SPME could con-titute a simple alternative to measure lipophilicity and potentialioaccumulation of organic compounds, if a correlation betweenfs and Kow is demonstrated.
Although the relationship between Kfs and Kow has beenemonstrated for analytes having low molecular weights, noonsensus exists for more hydrophobic organic compounds21–23,25]. These problems result partly from inappropri-te experimental procedures as discussed in several stud-es [19,20,24,29]. The long equilibrium time, the losses byolatilization and adsorption onto recipient surfaces, as well as,he difficulty to dissolve very hydrophobic compounds in waternd to keep them in true solution appear to be the main causesf the above-mentioned problems [30].
On other hand, for determining Kfs values, a precise esti-ation of the amount of compound extracted by the fibre is
equired. This is usually done by liquid injection calibration13,21,25,29]. In this case, sample transfer into the GC col-mn by both direct solvent injection and SPME fibre injectionhould be complete; nevertheless, liquid injection is influenced

1 togr.
bstctficiucbaahcat
nSg(kutcb
(rmbnoaaoB4w(sotd
1
ttbpea
n
b
α
Vtpsait
ta
n
if
n
dA
de
n
gS
A
wtw
l
((l
caps
22 M. Polo et al. / J. Chroma
y different factors such as the expansion associated with theolvent vaporization, which could cause analyte loss if injec-ion method is not optimized [31]. On-column injection is theonfiguration which provides the best results [32]. A quantita-ion alternative is the multiple extractions approach. That wasrstly used for quantitative determination of volatile organicompounds in complex matrices by direct headspace injectionn the gas chromatograph [33]. This approach has also beensed for SPME quantitation [34–36]. Depending on the partitionoefficient of the compounds, it is possible to deplete the sampley doing multiple extractions of the same vial and the analytemount can be determined by the depletion peak areas curvefter extrapolation to exhaustive extraction [37]. This methodave been used for the determination of water–PDMS partitionoefficients, by Urruty and Montury [38] and Zimmermman etl. [39] using direct immersion SPME, and by Nardi using in-ube SPME [40].
Brominated flame retardants are a new group of contami-ants, which have received special attention in the last years.everal compounds make up the brominated flame retardantroup and some of them are polybrominated diphenylethersPBDEs) and polybrominated biphenyls (PBBs). Little is stillnown about their effect on human health, although toxic effectspon animals have been detected. So, there is a need for fur-her investigations on physical–chemical properties of theseompounds, with the aim to know their potential distribution,ioaccumulation and toxicity within the environment.
In the present study, the water–poly(dimethylsiloxane)PDMS) partition coefficients (Kfs) of several brominated flameetardants, including seven PBDEs and PBBs have been esti-ated and their correlation with Kow has been studied. As the
est of our knowledge, Kfs values for PBDEs and PBBs haveot yet been determined. A depletion SPME method basedn multiple SPME extraction as a self-calibration method waspplied to estimate Kfs at 25 and 100 ◦C. Obtained log Kfst 100 ◦C values ranged from 3.47 to 5.21. At 25 ◦C, it wasnly possible to estimate log Kfs values for four compounds,DE-3, PBB-15, PBB-49 and BDE-47, and they ranged from.23 to 6.05. log Kfs values for brominated flame retardantsere compared with the log octanol–water partition coefficients
log Kow) found in literature. Since a linear log–log relation-hip between log Kow and log Kfs was found, the feasibilityf the SPME technique to estimate lipophilicity and poten-ial bioaccumulation of brominated flame retardants has beenemonstrated.
.1. Theoretical background of the depletion method
In this study, a static quantification strategy based on mul-iple SPME extraction of the same sample was adopted. Forheoretical considerations, the extraction efficiency (α) proposedy Urruty and Montury [38] was considered. It represents theroportion of the analyte extracted by the fibre (n for the first
f1xtraction) versus the analyte initially present in the sample (ns0)nd only depends on both the polymeric coating and the analyte:f1 = αns0 (1)
K
p
A 1124 (2006) 121–129
eing α for a three phases equilibrium system (αeq):
eq = KfsVf
KhsVh + KfsVf + Vs(2)
f, Vs and Vh are the volumes of the fibre coating, the sample andhe headspace above the sample, respectively, while Kfs is theartition coefficient between the fibre coating and the aqueousample and Khs is the partition coefficient between the samplend the headspace. In this case, headspace capacity was deemednsignificant compared with aqueous phase capacity based onhe Henry’s law constant values of the target compounds [41].
After the first extraction, the amount of analyte remaining inhe sample (ns1) can be calculated as a proportion of its initialmount (ns0):
s1 = ns0 − nf1 = ns0 − αns0 = ns0(1 − α) (3)
By running several consecutive x extractions, the decreasen the extracted amount of analyte can be determined by theollowing general equation [39]:
sx = ns0(1 − α)x (4)
Using this equation, the amount of analyte in the sampleecreases exponentially according to previously published byrthur et al. [37].Regarding to the amount extracted by the fibre, it can be
efined by the following relationship between two consecutivextractions:
fx = nsx−1 − nsx = ns0(1 − α)x−1 − ns0(1 − α)x
= ns0α(1 − α)x−1 (5)
A similar expression can be written in terms of chromato-raphic response, according to the linear relationship betweenPME response and initial concentration in the sample [7]:
x = ATα(1 − α)x−1 (6)
here Ax is the observed chromatographic signal (peak area) forhe extraction x and AT (total area) is the signal obtained if thehole analyte initially present in the sample was extracted.Eq. (6) can be rewritten in logarithmic form [39]:
og(Ax) = log(ATα) + (x − 1) log(1 − α) (7)
Therefore, plotting log Ax versus the number of extractionsx − 1) results in a linear regression, and the extraction efficiencyα) can be easily determined from the slope of the equationog(1 − α).
In this way, under equilibrium conditions partition coeffi-ients (Kfs) can be calculated from Eq. (2) using only αeq asvariable independent of the detector response for each com-
ound, and without knowledge of the initial concentration in theample:
fs = αeqVs
(1 − αeq)Vf(8)
The time required to reach SPME equilibrium at room tem-erature for high molecular weight compounds, such as PBBs

togr.
ats
Pndw
n
r
A
bct
ao
α
bt
α
o
K
(tt
2
2
mG2pmpL2iD(Ip
pstiwotwvtw
Swm
2
lattw(fiiibfc2
r
Go2
2
gntsv2cw2at
M. Polo et al. / J. Chroma
nd PBDEs, is very long and the risk of losses due to degrada-ion or adsorption onto glass walls of the vials might becomeignificant.
According to Ai [42], the amount of analyte extracted byDMS fibre can be related to the extraction time by an expo-ential equation since the SPME process occurs via a first orderiffusion of the compounds between the fibre coating and theater phase:
ft = nfeq(1 − e−bt) (9)
This equation can also be expressed as chromatographicesponses (peak area):
t = Aeq(1 − e−bt) (10)
eing Aeq the obtained response at equilibrium and b, a kineticonstant related to the type of polymeric coating, the analyte andhe sample volume.
Dividing Eq. (9) by ns0:
nft
ns0=
(nfeq
ns0
)(1 − e−bt)
nd taking into account Eq. (1), the following equation isbtained:
t = αeq(1 − e−bt) (11)
eing αt the extraction efficiency obtained at the extraction time. Eq. (8) can be rearranged to calculate Kfs, since:
eq = αt
1 − e−bt
btaining the expression:
fs = αtVs
(1 − e−bt − αt)Vf(12)
Therefore, Kfs can be estimated using the depletion methodunder non-equilibrium conditions) to calculate αt (Eq. (7)) andhe extraction kinetics to obtain b (Eq. (10)) by fitting the extrac-ion time profiles.
. Experimental
.1. Reagents and materials
4-Bromophenylphenyl ether (BDE-3) at 100 �g/mL inethanol was supplied by Dr. Ehrenstorfer (Augsburg,ermany). 2,2′,4,4′-Tetrabromodiphenylether (BDE-47),,2′,4,4′,5-pentabromodiphenylether (BDE-99), 2,2′,4,4′,6-entabromodiphenylether (BDE-100), 2,2′,4,4′,5,5′-hexabro-odiphenylether (BDE-153) and 2,2′,4,4′,5,6′-hexabromodi-
henylether (BDE-154) were purchased to Wellingtonaboratories (Ontario, Canada) at 50 �g/mL in nonane.,2′,3,4,4′-Pentabromodiphenylether (BDE-85) at 50 �g/mL insooctane was from AccuStandard (New Haven, USA). 4,4′-
ibromobiphenyl (PBB-15) and 2,2′,4,5′-tetrabromobiphenylPBB-49) were supplied by Supelco (Bellefonte, PA, USA).sooctane stock solutions of PBB-15 and PBB-49 were pre-ared. Isooctane, cyclohexane, acetone and NaCl, were all
tfl2t
A 1124 (2006) 121–129 123
urchased to Merck (Mollet del Valles, Barcelona, Spain). Allolvents and reagents were of analytical grade. Working solu-ions were obtained by appropriate dilutions in cyclohexane,sooctane and acetone and stored at −20 ◦C before use. Spikedater solutions were prepared by adding different volumesf acetone solutions (between 10 and 100 �L) containing thearget analytes. The content of organic solvent in the sampleas kept as low as possible (below 0.5%) and constant, sinceariations in the composition may influence the partitioning ofhe analytes. Spiked solutions were let to stabilize for 12–20 h,ithout stirring, at 4 ◦C until the analysis.The SPME manual holders and fibres were obtained from
upelco. In this study, 100-�m poly(dimethylsiloxane) fibresere used. The fibres were conditioned as recommended by theanufacturer.
.2. Experimental SPME procedure
Aliquots of Milli-Q water spiked at pg/mL concentrationevel were poured in headspace vials. Vials were sealed withheadspace aluminium cap furnished with a PTFE-faced sep-
um and immersed in a water bath maintained at the extractionemperature selected for the experiment (25 or 100 ◦C). Samplesere let to equilibrate for 5 min, before placing the SPME device
a 100 �m PDMS fibre in a manual holder). Afterwards, theber was exposed to the headspace over the sample (or directly
mmersed into the water sample) for the selected time, depend-ng on the experiment. When agitation was applied, a metal stirar was introduced in the vial and magnetic stirring was per-ormed during all the sampling process. Kinetic studies werearried out from 0 to 240 min at 100 ◦C, and from 0 to 8 days at5 ◦C.
Depletion experiments at 25 and 100 ◦C were carried out byunning five consecutive extractions from a single water sample.
After extraction, the fibre was immediately inserted into theC injector and GC–MS/MS analysis was carried out. Des-rption time was set at 5 min and desorption temperature was80 ◦C.
.3. Instrumental parameters
GC–MS/MS analyses were performed on a Varian 3800as chromatograph (Varian Chromatography Systems, Wal-ut Creek, CA, USA) equipped with an ion trap mass detec-or Varian Saturn 2000 with a waveboard for MS–MS analy-is. The system was operated by Saturn GC–MS WorkStation5.4 software. Brominated compounds were separated on a5 m length × 0.25 mm i.d., CP-Sil8 CB Lowbleed/MS columnoated with a 0.25 �m film. The GC oven temperature programas: 60 ◦C hold 2 min, rate 30 ◦C/min to 250 ◦C, rate 5 ◦C/min to80 ◦C, hold for 8 min. Helium (purity 99,999%) was employeds carrier gas, with a constant column flow of 1.2 mL/min. Injec-or was operated in the splitless mode and programmed to return
o the split mode after 2 min from the beginning of a run. Splitow was set at 50 mL/min. Injector temperature was between50 and 300 ◦C depending on the fibre used. The mass spec-rometer was operated in the electron ionization (EI) mode. The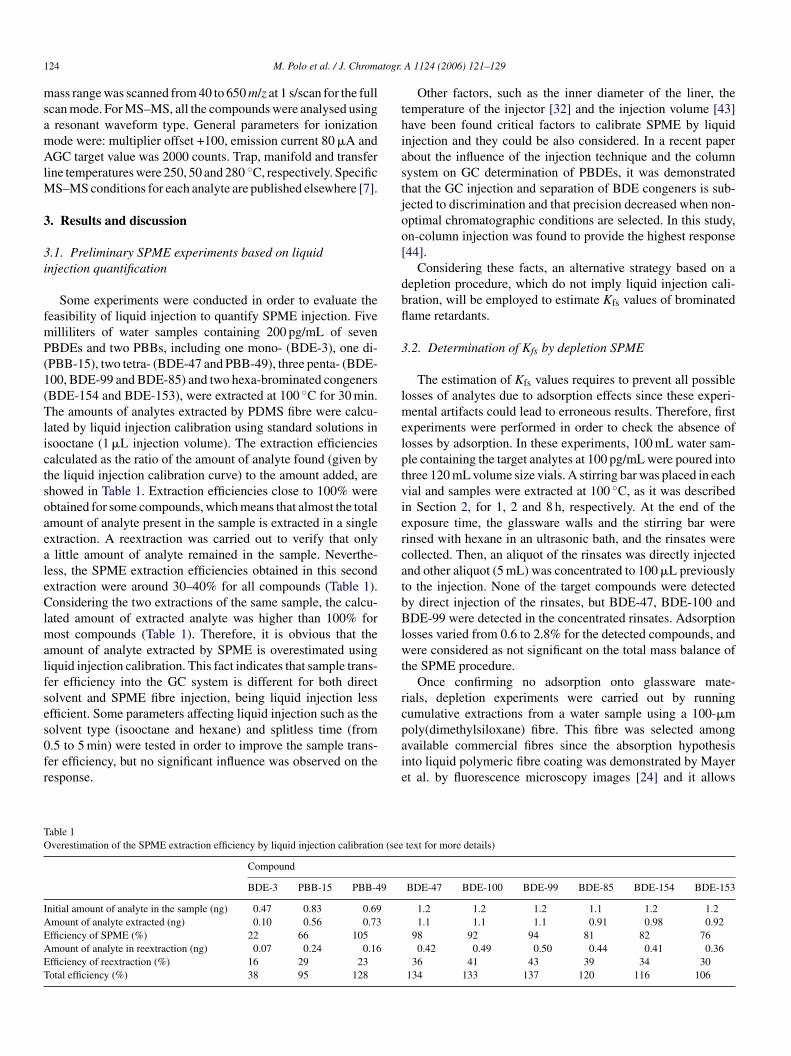
1 togr.
msamAlM
3
3i
fmP(1(TlictsoaealeClmalfses0fr
thiastjoo[
dbfl
3
lmelptviercatbBlwt
rc
TO
IAEAET
24 M. Polo et al. / J. Chroma
ass range was scanned from 40 to 650 m/z at 1 s/scan for the fullcan mode. For MS–MS, all the compounds were analysed usingresonant waveform type. General parameters for ionizationode were: multiplier offset +100, emission current 80 �A andGC target value was 2000 counts. Trap, manifold and transfer
ine temperatures were 250, 50 and 280 ◦C, respectively. SpecificS–MS conditions for each analyte are published elsewhere [7].
. Results and discussion
.1. Preliminary SPME experiments based on liquidnjection quantification
Some experiments were conducted in order to evaluate theeasibility of liquid injection to quantify SPME injection. Fiveilliliters of water samples containing 200 pg/mL of sevenBDEs and two PBBs, including one mono- (BDE-3), one di-PBB-15), two tetra- (BDE-47 and PBB-49), three penta- (BDE-00, BDE-99 and BDE-85) and two hexa-brominated congenersBDE-154 and BDE-153), were extracted at 100 ◦C for 30 min.he amounts of analytes extracted by PDMS fibre were calcu-
ated by liquid injection calibration using standard solutions insooctane (1 �L injection volume). The extraction efficienciesalculated as the ratio of the amount of analyte found (given byhe liquid injection calibration curve) to the amount added, arehowed in Table 1. Extraction efficiencies close to 100% werebtained for some compounds, which means that almost the totalmount of analyte present in the sample is extracted in a singlextraction. A reextraction was carried out to verify that onlylittle amount of analyte remained in the sample. Neverthe-
ess, the SPME extraction efficiencies obtained in this secondxtraction were around 30–40% for all compounds (Table 1).onsidering the two extractions of the same sample, the calcu-
ated amount of extracted analyte was higher than 100% forost compounds (Table 1). Therefore, it is obvious that the
mount of analyte extracted by SPME is overestimated usingiquid injection calibration. This fact indicates that sample trans-er efficiency into the GC system is different for both directolvent and SPME fibre injection, being liquid injection lessfficient. Some parameters affecting liquid injection such as the
olvent type (isooctane and hexane) and splitless time (from.5 to 5 min) were tested in order to improve the sample trans-er efficiency, but no significant influence was observed on theesponse.paie
able 1verestimation of the SPME extraction efficiency by liquid injection calibration (see
Compound
BDE-3 PBB-15 PBB-49
nitial amount of analyte in the sample (ng) 0.47 0.83 0.69mount of analyte extracted (ng) 0.10 0.56 0.73fficiency of SPME (%) 22 66 105mount of analyte in reextraction (ng) 0.07 0.24 0.16fficiency of reextraction (%) 16 29 23otal efficiency (%) 38 95 128
A 1124 (2006) 121–129
Other factors, such as the inner diameter of the liner, theemperature of the injector [32] and the injection volume [43]ave been found critical factors to calibrate SPME by liquidnjection and they could be also considered. In a recent paperbout the influence of the injection technique and the columnystem on GC determination of PBDEs, it was demonstratedhat the GC injection and separation of BDE congeners is sub-ected to discrimination and that precision decreased when non-ptimal chromatographic conditions are selected. In this study,n-column injection was found to provide the highest response44].
Considering these facts, an alternative strategy based on aepletion procedure, which do not imply liquid injection cali-ration, will be employed to estimate Kfs values of brominatedame retardants.
.2. Determination of Kfs by depletion SPME
The estimation of Kfs values requires to prevent all possibleosses of analytes due to adsorption effects since these experi-
ental artifacts could lead to erroneous results. Therefore, firstxperiments were performed in order to check the absence ofosses by adsorption. In these experiments, 100 mL water sam-le containing the target analytes at 100 pg/mL were poured intohree 120 mL volume size vials. A stirring bar was placed in eachial and samples were extracted at 100 ◦C, as it was describedn Section 2, for 1, 2 and 8 h, respectively. At the end of thexposure time, the glassware walls and the stirring bar wereinsed with hexane in an ultrasonic bath, and the rinsates wereollected. Then, an aliquot of the rinsates was directly injectednd other aliquot (5 mL) was concentrated to 100 �L previouslyo the injection. None of the target compounds were detectedy direct injection of the rinsates, but BDE-47, BDE-100 andDE-99 were detected in the concentrated rinsates. Adsorption
osses varied from 0.6 to 2.8% for the detected compounds, andere considered as not significant on the total mass balance of
he SPME procedure.Once confirming no adsorption onto glassware mate-
ials, depletion experiments were carried out by runningumulative extractions from a water sample using a 100-�m
oly(dimethylsiloxane) fibre. This fibre was selected amongvailable commercial fibres since the absorption hypothesisnto liquid polymeric fibre coating was demonstrated by Mayert al. by fluorescence microscopy images [24] and it allowstext for more details)
BDE-47 BDE-100 BDE-99 BDE-85 BDE-154 BDE-153
1.2 1.2 1.2 1.1 1.2 1.21.1 1.1 1.1 0.91 0.98 0.92
98 92 94 81 82 760.42 0.49 0.50 0.44 0.41 0.36
36 41 43 39 34 30134 133 137 120 116 106

M. Polo et al. / J. Chromatogr. A 1124 (2006) 121–129 125
F tions:s
as
gtipoidbePactrTouaqdptccmlefbctwbfi
s[
according to Eq. (8) if the system is under equilibrium con-ditions, or employing αt by Eq. (12) if the system has notreached equilibrium. In this second case, the kinetic constant(b) is included in the equation.
ig. 1. TIC SPME–GC–MS/MS chromatograms of a sample (extraction condicale).
ssuming a non-competitive and concentration-independentorption mechanism [19].
First depletion experiments were performed at 100 ◦C. A sin-le sample (10 mL) spiked at 200 pg/mL was extracted samplinghe headspace (10 mL) for 2 h and then the fibre was injectedn the chromatographic system. After that, the fibre was newlylaced in the vial to perform the next extraction. Chromatogramsf five subsequent extractions of the same sample are mergedn Fig. 1. As can be seen, the peak areas of each compoundecrease from extraction to extraction, but different depletionehaviours between the target compounds can be observed. Forxample, while the peak area of PBB-49 is larger than that ofBB-15 at the first extraction, in the second extraction the peakrea for both compounds is similar. Fig. 2A shows the depletionurves for the target compounds by plotting peak areas versushe number of extractions (x) −1. An exponential decay of theesponses is observed for most compounds according to Eq. (6).his decrease in the signal is due to a decrease in the amountf analyte remaining in the sample. As can be seen in the fig-re, for most compounds, the sample is significantly depletedfter five extractions, so multiple extraction could be used as auantitative technique with a few number of extractions. Theseifferences between the target compounds are more plausiblelotting logarithmical peak areas as shown in Fig. 2B. Accordingo Eq. (7), the extraction efficiency (αt = 2 h) for each compoundan be obtained from the line slope. Together with the slopes,alculated αt = 2 h and linear regression coefficients (r2), are sum-arized in Table 2. The obtained results fit well with a first order
inear model obtaining r2 > 0.99 for most analytes. Regardingxtraction efficiency (αt = 2 h), the lowest values were obtainedor the lowest brominated analytes, BDE-3 and PBB-15. As cane seen in Fig. 2A, the depletion of the amount of these twoompounds was not as clearly noticed after consecutive extrac-
ions as for the rest of the compounds. Extraction efficiencyas higher for the highest brominated compounds, for whichetween 50 and 70% of analyte amount was transferred to thebre after only one extraction. This fact explains the high sen-Fnw
100 ◦C, PDMS coating, 2 h) after the first to fifth extraction (in grey decrease
itivity obtained for the analysis of PBDEs and PBBs by SPME7].
Partition coefficient (Kfs) can be easily derived from αeq
ig. 2. Depletion experiment at 100 ◦C. (A) Decrease in peak area with theumber of extractions and (B) log (peak area) vs. number of extractions. Resultsere fitted by Eqs. (6) and (7), respectively.

126 M. Polo et al. / J. Chromatogr. A 1124 (2006) 121–129
Table 2Slopes, calculated α, linear regression coefficients (r2) and log Kfs values obtained from depletion experiments at 100 ◦C
Compound Slope (1 − α) Regression coefficients (r2) Extraction efficiency (αt = 2 h) log Kfs
BDE-3 −0.07 ± 0.01 0.978 0.15 ± 0.01 3.47PBB-15 −0.18 ± 0.01 0.994 0.34 ± 0.01 3.91PBB-49 −0.50 ± 0.02 0.998 0.68 ± 0.01 4.55BDE-47 −0.43 ± 0.03 0.999 0.63 ± 0.01 4.47BDE-100 −0.43 ± 0.02 0.995 0.63 ± 0.01 4.73BDE-99 −0.40 ± 0.03 0.991 0.60 ± 0.01 4.81BDE-85 −0.31 ± 0.02 0.994 0.51 ± 0.02 4.77BB
tstirrccscaeThbpaoaup
fccc(
Fp
av
dswsoobserved for low molecular weight analytes according to Eq. (6),while for high brominated compounds (penta- and hexaBDEs),the decrease on the response is not as noticeable. By plottinglogarithmical peak areas as shown in Fig. 4B, the depletion is
DE-154 −0.38 ± 0.03 0.990DE-153 −0.32 ± 0.03 0.987
In order to study if the system is under equilibrium condi-ions, a kinetic study was carried out from 0 to 240 min. Fig. 3hows the extraction time profiles obtained for some represen-ative compounds. As can be seen, less brominated compounds,ncluding mono-, di- and tetra-congeners, reach the equilib-ium conditions in 2 h. However, penta- and hexaBDEs did noteach equilibrium within 4 h, although they seem to be verylose to this condition. Eq. (10) gives a good fit of kineticurves (r2 > 0.99) and thus allows obtaining the kinetic con-tant (b). The logarithms of Kfs calculated by Eq. (8) for theompounds that had reached equilibrium in 2 h (αeq = αt = 2 h)nd by Eq. (12) for the target compounds that had not reachedquilibrium (penta- and hexaBDEs) are also given in Table 2.hey ranged from 3.47 to 5.21. Kfs values increased with theydrophobicity of the compounds, which is determined by theromine substitution degree; so, the highest brominated com-ounds present the highest Kfs values underlining their highffinities to PDMS coating. No decrease of Kfs values wasbserved for molecular weight increase confirming that onlybsorption mechanisms control the partitioning of high molec-lar weight analytes from water to PDMS fibre as published inrevious studies [20,24].
The depletion procedure at 100 ◦C was repeated with dif-erent PDMS fibres, under same SPME and chromatographiconditions, several months after the first experiment in order to
heck the reproducibility of the proposed approach. No signifi-ant differences have been observed for the extraction efficiencyα) and Kfs.ig. 3. Curve fitted extraction time profiles for some representative target com-ounds at 100 ◦C.
FDn
0.58 ± 0.03 5.210.51 ± 0.03 –
These experiments performed at 100 ◦C demonstrated thepplicability of the depletion method in the estimation of Kfsalues.
The depletion procedure was also carried out at 25 ◦C byirect sampling and the extraction time selected between con-ecutive extractions was 24 h. The total number of extractionsas five. Fig. 4A shows the depletion curves for some repre-
entative compounds by plotting peak areas versus the numberf extractions (x − 1). An exponential decay of the responses is
ig. 4. Depletion experiment at 25 ◦C for representative compounds. (A)ecrease in peak area with the number of extractions and (B) log (peak area) vs.umber of extractions. Results were fitted with Eqs. (6) and (7), respectively.
M. Polo et al. / J. Chromatogr. A 1124 (2006) 121–129 127
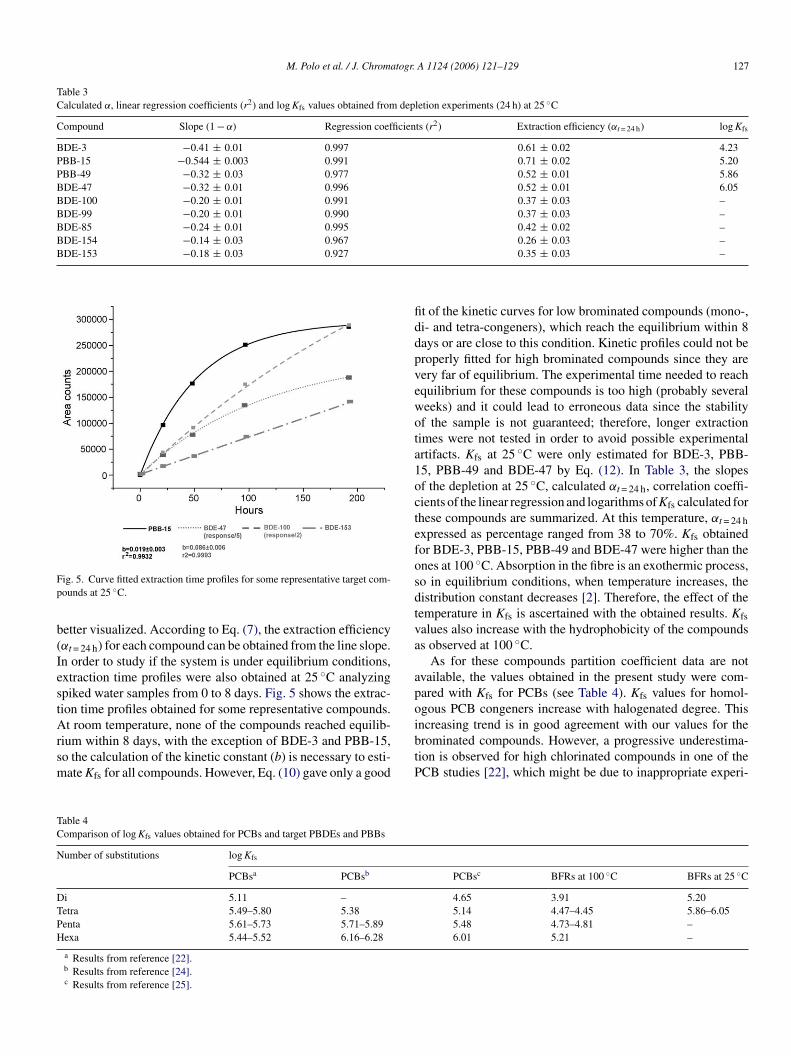
Table 3Calculated α, linear regression coefficients (r2) and log Kfs values obtained from depletion experiments (24 h) at 25 ◦C
Compound Slope (1 − α) Regression coefficients (r2) Extraction efficiency (αt = 24 h) log Kfs
BDE-3 −0.41 ± 0.01 0.997 0.61 ± 0.02 4.23PBB-15 −0.544 ± 0.003 0.991 0.71 ± 0.02 5.20PBB-49 −0.32 ± 0.03 0.977 0.52 ± 0.01 5.86BDE-47 −0.32 ± 0.01 0.996 0.52 ± 0.01 6.05BDE-100 −0.20 ± 0.01 0.991 0.37 ± 0.03 –BDE-99 −0.20 ± 0.01 0.990 0.37 ± 0.03 –BDE-85 −0.24 ± 0.01 0.995 0.42 ± 0.02 –BDE-154 −0.14 ± 0.03 0.967 0.26 ± 0.03 –BDE-153 −0.18 ± 0.03 0.927
Fp
b(IestArsm
fiddpvewota1octefosdtva
apo
TC
N
DTPH
ig. 5. Curve fitted extraction time profiles for some representative target com-ounds at 25 ◦C.
etter visualized. According to Eq. (7), the extraction efficiencyαt = 24 h) for each compound can be obtained from the line slope.n order to study if the system is under equilibrium conditions,xtraction time profiles were also obtained at 25 ◦C analyzingpiked water samples from 0 to 8 days. Fig. 5 shows the extrac-ion time profiles obtained for some representative compounds.
t room temperature, none of the compounds reached equilib-ium within 8 days, with the exception of BDE-3 and PBB-15,o the calculation of the kinetic constant (b) is necessary to esti-ate Kfs for all compounds. However, Eq. (10) gave only a good
ibtP
able 4omparison of log Kfs values obtained for PCBs and target PBDEs and PBBs
umber of substitutions log Kfs
PCBsa PCBsb
i 5.11 –etra 5.49–5.80 5.38enta 5.61–5.73 5.71–5.89exa 5.44–5.52 6.16–6.28
a Results from reference [22].b Results from reference [24].c Results from reference [25].
0.35 ± 0.03 –
t of the kinetic curves for low brominated compounds (mono-,i- and tetra-congeners), which reach the equilibrium within 8ays or are close to this condition. Kinetic profiles could not beroperly fitted for high brominated compounds since they areery far of equilibrium. The experimental time needed to reachquilibrium for these compounds is too high (probably severaleeks) and it could lead to erroneous data since the stabilityf the sample is not guaranteed; therefore, longer extractionimes were not tested in order to avoid possible experimentalrtifacts. Kfs at 25 ◦C were only estimated for BDE-3, PBB-5, PBB-49 and BDE-47 by Eq. (12). In Table 3, the slopesf the depletion at 25 ◦C, calculated αt = 24 h, correlation coeffi-ients of the linear regression and logarithms of Kfs calculated forhese compounds are summarized. At this temperature, αt = 24 hxpressed as percentage ranged from 38 to 70%. Kfs obtainedor BDE-3, PBB-15, PBB-49 and BDE-47 were higher than thenes at 100 ◦C. Absorption in the fibre is an exothermic process,o in equilibrium conditions, when temperature increases, theistribution constant decreases [2]. Therefore, the effect of theemperature in Kfs is ascertained with the obtained results. Kfsalues also increase with the hydrophobicity of the compoundss observed at 100 ◦C.
As for these compounds partition coefficient data are notvailable, the values obtained in the present study were com-ared with Kfs for PCBs (see Table 4). Kfs values for homol-gous PCB congeners increase with halogenated degree. This
ncreasing trend is in good agreement with our values for therominated compounds. However, a progressive underestima-ion is observed for high chlorinated compounds in one of theCB studies [22], which might be due to inappropriate experi-PCBsc BFRs at 100 ◦C BFRs at 25 ◦C
4.65 3.91 5.205.14 4.47–4.45 5.86–6.055.48 4.73–4.81 –6.01 5.21 –

128 M. Polo et al. / J. Chromatogr.
Fbt
mtt
3
tSpbctvawrpbTwsttftlt
fctcapt(
A
0
aPwd
R
[
[
[[[
[
[
[[[[[
[
[
[[[
[
[
[[[
[
[[
ig. 6. Experimentally determined octanol–water partition coefficients (Kow)y Braekevelt et al. [28] vs. partition coefficients (Kfs) obtained in this study forhe target compounds at 25 and 100 ◦C.
ental procedures as discussed in Section 1. This fact underlineshat depletion procedure could be a more accurate alternativehan traditional techniques to estimate partition coefficients.
.3. Correlation between log Kfs–log Kow
Kow is frequently used as measure of bioaccumulation and,herefore, toxicity of organic compounds. In last years, thePME method has been developed to rapidly estimate Kow sinceartition coefficients between polymeric phase and water resem-le octanol–water partitioning. Several authors have studied theorrelation between log Kfs and log Kow, in order to use log Kfso predict the environmental fate of pollutants [21–25]. A largeariability in the results obtained was observed; some authorschieved a good correlation in all the range of Kow [24] or onlyhen log Kow < 6 [14,20], and other authors obtained a poor cor-
elation between the coefficients in all the range [19,25]. In theresent study, a regression analysis of log Kfs and log Kow forrominated flame retardants target compounds was carried out.he log Kow values for PBDEs were taken from a recent study inhich Kow values of nine PBDEs were directly measured using a
low-stirring technique [28]. This process is more labour-intensehan SPME. In fact, more than 2 months were needed to obtainhe result. log Kow values of the target BDE compounds rangedrom 6.81 for BDE-47 to 7.90 for BDE-153, and were relatedo bromine content of the compounds as mentioned before forog Kfs values obtained in this study. PBBs Kow values wereaken from Pijnenburg et al. [45].
Kfs and Kow values fit quite well with a first order linear modelor both 25 and 100 ◦C as can be seen in Fig. 6. The correlationoefficient are for both temperatures very high (r2 > 0.99), andhe slope at 25 ◦C is close to the unity, which means that partitionoefficients (Kfs) could be used to evaluate compounds bioavail-bility in the environment. Therefore, it can be concluded theartition coefficient (Kfs) is as suitable as Kow value to estimatehe concentration of organic compounds in animal lipid tissueslipid surrogate).
cknowledgements
This research was supported by the projects BQU2003-2090 from CICYT, Spanish Commission for Research
[[
[
A 1124 (2006) 121–129
nd Development (Ministerio de Ciencia y Tecnologıa) andGIDIT04PXIC23701PN from Xunta de Galicia. M.P. and V.C.ould like to acknowledge the Xunta de Galicia and the Fun-acion Gil Davila, respectively, for their doctoral grants.
eferences
[1] C.L. Arthur, J. Pawliszyn, Anal. Chem. 62 (1990) 2145.[2] J. Pawliszyn, Applications of Solid-Phase Microextraction, The Royal
Society of Chemistry, Cambridge, UK, 1999.[3] S.A. Scheppers-Wercinski, Solid-Phase Microextraction: A Practical
Guide, Marcel Dekker, New York, 1999 (Chapter 5).[4] M. Sakamoto, T. Tsutsumi, J. Chromatogr. A 1028 (2004) 63.[5] Y. Yang, D.J. Miller, S.B. Hawthorne, J. Chromatogr. A 800 (2) (1998)
257.[6] P. Landın, M. Llompart, M. Lourido, C. Garcıa-Jares, A. Carro, R. Cela,
J. AOAC Int. 86 (2003) 44.[7] M. Polo, G. Gomez-Noya, J.B. Quintana, M. Llompart, C. Garcıa-Jares,
R. Cela, Anal. Chem. 76 (2004) 1054.[8] P. Mayer, Partitioning based approaches to study exposure and effects of
hydrophobic organic substances, Doctoral Thesis, University of Utrecht,The Netherlands, June 2000.
[9] S. Lee, J. Gan, W.P. Liu, M.A. Anderson, Environ. Sci. Technol. 37(2003) 5597.
10] E.U. Ramos, S.N. Meijer, W.H.J. Vaes, H.J.M. Verhaar, J.L.M. Hermens,Environ. Sci. Technol. 32 (1998) 3430.
11] D. Lambropoulou, V.A. Sakkas, T.A. Albanis, J. Chromatogr. A 952(2002) 215.
12] W. Chen, K.F. Poon, H.W. Lam, Environ. Sci. Technol. 32 (1998) 3816.13] R.U. Holt, J. Chromatogr. A 937 (2001) 107.14] J. Hall, M. Satterfield-Doerr, R. Parikh, S. Brodbelt, Anal. Chem. 70
(1998) 1788.15] B.I. Escher, M. Berg, J. Muhlemann, M.A.A. Schwarz, L.M. Hermens,
W.H.J. Vaes, R.P. Schwarsenbach, Analyst 127 (2002) 42.16] A. Leslie Heather, J.P. Oosthoek, J.M. Busser, H.S. Kraak, L.M. Her-
mens, Environ. Toxicol. Chem. 21 (2002) 229.17] P.A. Martos, J. Pawliszyn, Anal. Chem. 69 (1997) 402.18] P. Pollien, D. Roberts, J. Chromatogr. A 864 (1999) 183.19] B. Shurmer, J. Pawliszyn, Anal. Chem. 72 (2000) 3660.20] R. Doong, S.M. Chan, Anal. Chem. 72 (2000) 3467.21] I. Valor, M. Perez, C. Cortada, D. Apraiz, J.C. Molto, G. Font, J. Sep.
Sci. 24 (2001) 39.22] E.Y. Zeng, D. Tsukada, J.A. Noblet, J. Peng, J. Chromatogr. A 1066
(2005) 165.23] Y. Yang, S.B. Hawthorne, D.J. Miller, Y. Liu, M.L. Lee, Anal. Chem.
70 (1998) 1866.24] P. Mayer, W.H.J. Vaes, J.L.M. Hermens, Anal. Chem. 72 (2000) 459.25] A. Paschke, P. Popp, J. Chromatogr. A 999 (2003) 35.26] J.H.M. de Bruijn, F. Busser, W. Seinen, J. Hermens, Environ. Toxicol.
Chem. 8 (1989) 499.27] A.G. van Haelst, P.F. Hessen, F.W.N. van der Wielen, H.A.J. Govers,
Chemosphere 29 (1994) 1651.28] E. Braekevelt, S.A. Titlemier, G.T. Tomy, Chemosphere 51 (2003)
563.29] J. Dugay, C. Miege, M.C. Hennion, J. Chromatogr. A 795 (1998) 27.30] J. Poerschmann, T. Gorecki, Environ. Sci. Technol. 34 (2000) 3824.31] K. Grob, Split and Splitless Injection for Quantitative Gas Chromatog-
raphy, Wiley-VCH, Weinheim, 2001.32] G. Ouyang, Y. Chen, L. Setkova, J. Pawliszyn, J. Chromatogr. A 1097
(2005) 9.33] S. Kolb, Chromatographia 15 (1982) 587.34] O. Ezquerro, B. Pons, M.T. Pena, J. Chromatogr. A 985 (2003) 247.
35] Z. Penton, SPME, Application Note 17, Varian, Bellefonte, PA, 1995.36] D. de la Calle, M. Reichenbacher, K. Danzar, C. Hurlbeck, C. Bartzsch,K.H. Feller, Fresenius J. Anal. Chem. 360 (1998) 784.37] C.L. Arthur, M.L. Killam, K.D. Buchholz, J. Pawliszyn, Anal. Chem.
64 (1992) 1960.

atogr.
[[
[[
[
M. Polo et al. / J. Chrom
38] L. Urruty, M. Montury, J. Chromatogr. Sci. 37 (1999) 277.
39] T. Zimmermman, W.J. Ensinger, T.C. Schmidt, J. Chromatogr. A 1102(2006) 51.40] L. Nardi, J. Chromatogr. A 985 (2003) 39.41] S.A. Titlemier, T. Halldorson, G.A. Stern, G.T. Tomy, Environ. Toxicol.
Chem. 21 (2002) 1804.
[[
[
A 1124 (2006) 121–129 129
42] J. Ai, Anal. Chem. 69 (1997) 179.
43] L. Tuduri, V. Desauziers, J.L. Fanlo, J. Microcol. Sep. 12 (2000) 550.44] J. Bjorklund, P. Tollback, C. Hiarne, E. Dyremark, C. Ostman, J. Chro-matogr. A 1041 (2004) 20.45] A.M.C.M. Pijnenburg, J.W. Evets, J. de Boer, J.P. Boon, Rev. Environ.
Contam. Toxicol. 141 (1995) 1.