nevada transitioning from measuring status and reporting ayp, to measuring growth and reporting on...
TRANSCRIPT

Nevada
Transitioning from measuring status and reporting AYP, to measuring growth and reporting on School
Performance

Status to Growth
• 2003 – state reports student performance on state CRT program assessments, schools evaluated based on achievement of AYP for reading and math.
• 2009 state legislature passed a bill requiring the NDE to develop a new model for evaluating schools that included students’ academic growth as part of the equation.

Motivation for change
• AYP model identified increasing number (%) of schools as in need of improvement.
• 55% of schools did not make AYP in 2011• Limited ability to identify schools making
progress• Focus on “bubble students” instead of
increasing proficiency of all students

Annual Measurable Objectives (AMO) 2010-2014
School Year
Elementary School Middle School High School
ELA Math ELA Math ELA Math
2010-11 63.7% 65.9% 63.8% 65.9% 86.7% 71.3%
2011-12 75.9% 77.2% 75.9% 77.2% 91.1% 80.8%
2012-13 88% 88.5% 88% 88.5% 95.5% 90.3%
2013-14 100% 100% 100% 100% 100% 100%

School AYP Profile
Population ELAParticipation
ELA Achievement MathParticipation
Math Achievement OtherIndicator
ELAStatus
ELASafe Harbor
MathStatus
MathSafe Harbor
School Yes Yes NA Yes Yes NA Yes
American Indian/Alaskan Native
Yes Yes NA Yes Yes NA NA
Asian/Pacific Islander
Yes Yes NA Yes Yes NA NA
Hispanic Yes Yes NA Yes Yes NA NA
African American Yes Yes NA Yes Yes NA NA
White Yes Yes NA Yes Yes NA NA
IEP Yes Yes NA Yes No NA NA
LEP Yes No NA Yes Yes NA NA
Low SES (FRL) Yes Yes NA Yes Yes NA NA

AYP model reporting – HSPE math

How the results are reported
• AYP model– School achieved AYP – School didn’t make AYP (In need of improvement)


Nevada’s Growth Model
• In 2010, State panel recommended use of the Student Growth Percentile (SGP) model– Nevada model based on the work of D. Betebenner in
Colorado.• Growth model adopted by State Board and
included as part of the state’s RTTT proposal• Growth model was included as a core component
of the Waiver Application and is basis for new school performance framework and educator evaluation system

What values are used to compute school performance
• AYP model – Percent of students at or above the cut score for
meeting the standards– Other indicator (ADA)
• School Performance model– Growth*– Status (% of students meeting proficiency targets)– Gap– Other indicator (ADA)

Growth*
• SGP – all students with two consecutive years of data (>90% of all students in grades 4-8)
• MGP – school Median Growth Percentiles reported for all schools and subgroups
• AGP – Adequate Growth Percentile, growth to a standard, target is proficiency within 3 years or by grade 8.

Why SGP
• Nevada assessments are vertically aligned but not vertically scaled
• Relatively simple to explain• Graphical display easy to understand• Relatively easy to calculate• Affordable• Significant support from school districts

How the results are reported for students
• Student reports include growth relative to their academic peers, and also indications of whether they are growing at a rate to attain or maintain proficiency. – Growth score• Catching up• Keeping up

Reporting student growth

How the results are reported for schools
• Nevada School Performance Framework (NSFP) model uses both status (proficiency) and growth (SGP, AGP and gap reduction) to calculate an index score for each school
• School receives an STAR rating (1-5 Star) based on an NSPF index score

NV growth model –bubble chart

Using growth as part of school evaluation
Elementary/Middle School Index (100 points)
Growth (40 points)
Math Reading
School Median Growth Percentile (MGP)10 10
Overall % of Students Meeting Adequate Growth Percentile (AGP)
10 10
Status (30 points)
Overall % of Students Meeting Proficiency Expectations15 15
Gap (20 points)
% of IEP, ELL, and FRL Students Meeting AGP 10 10
Average Daily Attendance (ADA) or Other State-Approved Indicator (10 points)
Other Indicator 10
Table 2.A.4 Elementary/Middle School Index

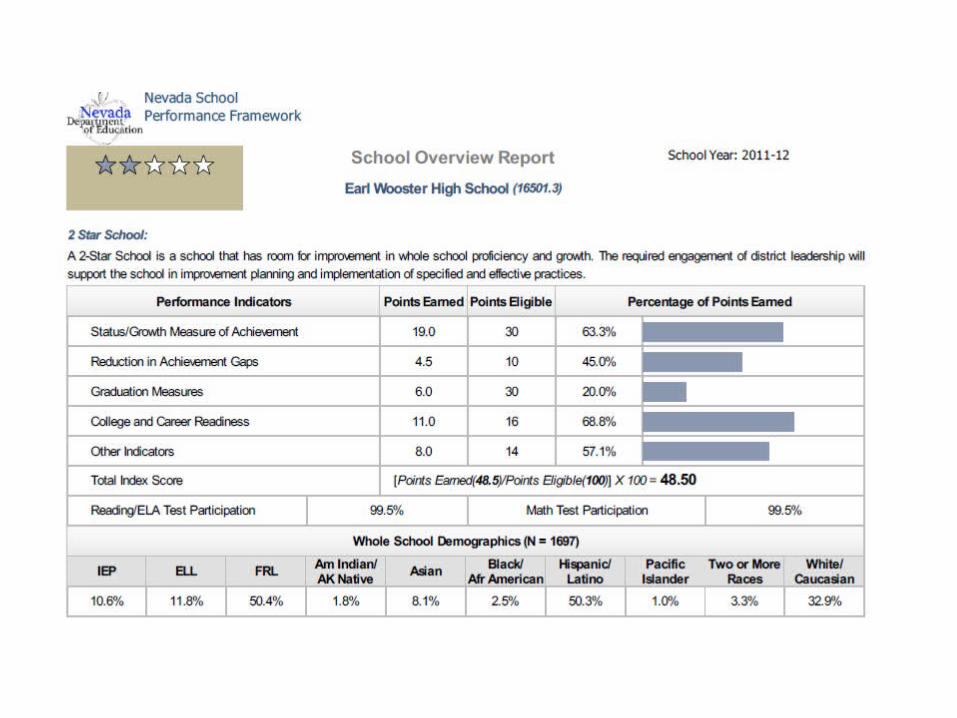
High School Index (100 points)
Status/Growth (30 points)
Math
Reading
Overall % of 10th Grade Students Meeting Proficiency Expectations
5 5
Cumulative % of 11th Grade Students Meeting Proficiency Expectations
5 5
School Median Growth Percentile for grade 10 (MGP) 5 5
Gap (10 points)Cumulative % of 11th Grade IEP, ELL, FRL Proficiency Gap
5 5
Graduation (30 points)
Overall Graduation Rate 15
Graduation Rate Gap for IEP, ELL, and FRL Students 15
College and Career Readiness (16 points)
% of Students in NV Colleges Requiring Remediation 4
% of Students Earning an Advanced Diploma 4
AP Participation/Proficiency 4
ACT/SAT Participation/Proficiency 4
Other (14 points)Average Daily Attendance (ADA) or Other State-Approved Indicator
10
% of 9th Grade Students who are Credit Deficient 4

How index scores are computed Elementary School Point Attribution
Status (school) points 3 6 9 12 15Reading/ELA proficiency rate
<35 35 and <49 49 and <70 70 and <81 ≥ 81
Math proficiency rate <49 49 and <62 62 and <79 79 and <89 ≥ 89
Growth (School) points 2 4 6 8 10Median Reading/ELA SGP <34 34 and <44 44 and <58 58 and <67 ≥ 67 Median Math SGP <32 32 and < 43 43 and <58 58 and <69 ≥ 69 % meeting Reading/ELA AGP
<35 35 and <48 48 and <68 68 an d<79 ≥ 79
% meeting Math AGP <34 34 and < 46 46 and <66 66 and <79 ≥ 79

Index score computation (contd)Gap (Subgroup) points 0 1 2 3.33 3.33%FRL meeting R/ELA AGP <31 31 and <43 43 and <61 61 and <71 ≥ 71%FRL meeting Math AGP <30 30 and <42 42 and <59 59 and <71 ≥ 71%ELL meeting R/ELA AGP <9 9 and <18 18 and <38 38 and <56 ≥ 56%ELL meeting Math AGP <14 14 and <27 27 and <50 50 and <66 ≥ 66%IEP meeting R/ELA AGP <1 1 and <15 15 and <36 36 and <58 ≥ 58 %IEP meeting Math AP <9 9 and <20 20 and <48 48 and <68 ≥ 68Gap (Supergroup) points 0 3 6 10 10% Supergroup meeting R/ELA AGP
<31 31 and <42 42 and <58 58 and <68 ≥ 68
% Supergroup meeting Math AGP
<28 28 and <41 41 and <58 58 and <70 ≥ 70
Other indicator points 2 4 6 8 10All students ADA <94 94 and <95 95 and <96 96 and <97 ≥ 97

Index Scores and Star RatingsPerformance Classification Index points
5 Stars ≥ 77
4 Stars 68 and < 77
3 Stars 50 and < 68
2 Stars 32 and < 50
1 Star < 32


Growth as a measure of educator effectiveness
• 2011 legislature required development of a new educator evaluation system for the state
• New system must use student performance as at least 50% of the final rating
• Student performance rating includes:– Growth (SGP) 35%– Proficiency (status) 15%– Gap Reduction 5%

Cautionary note
• Study of the stability of school level classifications using the SGP model
• Looked at classification error in designation of schools relative to measures of status and growth.
• Need to use multiple years of data to be relatively confident in classifications.
• Take away message: “You can use SGP to classify schools, but proceed with caution.”

• Richard N. Vineyard• Supervisor of Assessment Programs• Nevada Department of Education • [email protected]