neutralization of acid mine water and sludge disposal … hub documents/research reports/1057-1...
TRANSCRIPT

NEUTRALIZATION OF ACID MINE WATER
AND SLUDGE DISPOSAL
Report to the WATER RESEARCH COMMISSION
by
J P Maree, W F Strydom, C J L Adlem, M de Beer, G J van Tonder and B J van Dijk
Division of Water, Environment and Forestry Technology CSIR
WRC Report No 1057/1/04 ISBN No 1-77005-221-6

Disclaimer This report emanates from a project financed by the Water Research Commission (WRC) and is approved for publication. Approval does not signify that the contents necessarily reflect the views and policies of the WRC or the members of the project steering committee, nor does mention of trade names or commercial products constitute endorsement or recommendation for use.

ii
NOVEMBER 2004
EXECUTIVE SUMMARY
1. Background
Acid mine waters contain high concentrations of dissolved heavy metals and sulphate, and can have
pH values as low as 2.5. Unless treated, such waters may not be discharged into public streams. The
acid water is formed as a result of bacterial oxidation when pyrites are exposed to oxygen and water
after or during the mining process. Currently, acid water is neutralized with lime before it is re-used
(e.g. for coal washing in the coal mining industry) or discharged into public streams. The following
disadvantages can be linked to lime neutralization:
· Scaling of equipment by the unstable water produced.
· Malfunctioning of lime dosing equipment. Settling of lime particles in pipelines and valves often
causes blockages, which may result in under-dosage and acid corrosion.
· Lime is costly. The cost of slaked lime (HDS process), unslaked lime (HDS process), unslaked
lime (modified HDS process) and limestone amounts to R4.93/m3, R3.36/m3, R2.48/m3 and
R1.57/m3 respectively for the treatment of water with an acidity of 10 g/l (as CaCO3).
Neutralization is generally the first step in treating acid mine water (gold, operational and abandoned
coal mines). In Gauteng a volume of 240 Ml/d of acid mine water from gold mining requires
treatment. At an acidity of 3 g/l (as CaCO3), a lime (CaO) price of R360 and a purity of 93 % the
neutralization cost would amount to R57 million/a. It is therefore essential that the most suitable and
cost-effective technology should be identified or developed.
The aim of this project (see Objectives) is to identify the most cost effective neutralization process
which meets the following criteria for water with a specific chemical composition:
1. Treated water which is neutral and stable with respect to gypsum crystallisation.
2. Sludge with a high solids content.
3. Minimum alkali cost.
4. Minimum capital cost of plant and
5. Confidence in the selected process.

ii
Legislation requires that sludge from neutralization plants be discharged into lined ponds to prevent
metal leachate from polluting underground water. If leachate studies could show that sludge is stable
with respect to leachate of metals, as long as it is not contacted with acid water, such information
could be used to assist in formulating a strategy for sludge disposal in a less costly way (e.g. to use
open cast or underground voids for discard of sludge) than in costly lined ponds.
Sludge disposal in lined ponds is costly due to the following:
· Large masses of sludge is produced. An estimated amount of 20 t/d of sludge is produced
from 1 Ml/d of discard leachate when neutralized with lime or limestone.
· Plastic lining of sludge pond. Sludge produced from acid mine water is classified as a class
3 waste due to its metal content and must be discharged into a lined pond.
Other, more cost effective methods of sludge discharge, such as worked out open cast or
underground voids, may be used for this purpose. This approach would be in line with the accepted
backfill approach in the gold, nickel and copper mining industry where waste rock is returned to
underground. With the proposed approach, ferric hydroxide (Fe(OH)3), which is stable, would be
returned to its origin, and not pyrites (FeS2), which could be oxidized to generate acid. Acid water in
underground voids can be pumped to the surface and treated in an integrated plant. The amount of
sludge produced from the integrated process will amount only to 5% the volume of dischard leachate
with an acidity of 15 g/l (as CaCO3). Benefits of this approach are:
· Cost reduction as costly sludge disposal ponds are not required.
· Reduced seepage to underground water. Settled sludge has a low permeability and will reduce the
rate of seepage to underground water.
· Neutralization capacity is created in terms of underground acid water. Sludge contains unused
alkali (e.g. 10% to 30 % of the lime used for neutralization in the HDS process is not utilized for
neutralization) which can be used to neutralize underground acid water.
· Aesthetic benefits. No waste from water treatment needs to be stored at the surface.

iii
2. Objectives
Against this background the following aims were set for the project:
1 Biological iron(II) oxidation. Determine the conditions required for rapid iron(II) oxidation under
acidic conditions within a residence time of one hour.
2 Integrated neutralization process. Obtain design criteria for the treatment of low acidity water (2
000 mg/l acidity (as CaCO3) and 300 mg/l iron(II) (as Fe)) with the integrated neutralization and
iron(II) oxidation process.
3 High density sludge (HDS) process. Optimize the process flow diagram of the HDS process to
meet the following criteria for different water qualities:
- produce sludge with a high solids content (greater than 25% for water containing 10 g/l acidity
(as CaCO3))
- produce sludge with a rapid settling rate
- achieve maximum lime utilization (greater than 95%).
4 Leachate studies. Determine the stability of mine water sludge (neutralized with lime and
limestone) with respect to re-dissolution and metal leachate as a function of pH, for the following
wastes:
- Sludge produced during treatment of acid mine water with lime or limestone.
- Coal discard (rich in FeS2) to confirm that discard leachate is the main source of acid generation
of the various wastes produced during coal mining.
3. Findings
The following findings were made during the investigation:

iv
Biological iron(II) oxidation
Iron(II) should be oxidized to iron(III) before the neutralization of acid water with limestone, otherwise
the oxidation will occur downstream of the neutralization plant with the formation of acid. This study
aimed at investigating the kinetics of biological iron(II) oxidation in a plate reactor and to identify the
suitability of a plate reactor for biological iron(II) oxidation. The study showed that the highest
achievable rate was 120 g Fe2+/(l.d) (O2-flow= 70 ml/min; T = 20.5°C; surface area = 847 m2/m3). The
kinetics of the biological iron(II) oxidation in a plate reactor can be described as: d[Fe2+]/dt =
k.[Fe2+]0.5.[RSA]1.[O2]0.5
Biological iron(II) oxidation to achieve low iron(II) concentrations is needed as pre-treatment to enable
effective limestone neutralization. The effect of various parameters on biological iron(II) oxidation was
investigated, including oxygen transfer, iron(II) concentration, support medium surface area, type of
support medium, reactor configurations and flow regime. The study showed that the kinetics of
biological iron(II) oxidation follow the rate equation:
0.15.0f
5.0 AR)]II(Fe[kdt
)]II(Fe[d=−
where, Rf = reciprocating frequency (oxygenation), and
A = support medium surface area.
By treating acid water with a pH of 2 and an iron(II) concentration of 3000 mg/l , an oxidation rate of
74 g Fe/(l medium.d) and effluent iron(II) concentration of 300 mg/l was attained in a continuously
operated submersed packed-column reactor (at 24 °C). The medium used was silica sand (particle
size of 4.75 to 6.35 mm) at a cost of R100/t. At a loading rate of 20 g Fe/(l medium.d) the iron(II) is
removed to less than 60 mg/l in the effluent.
Integrated neutralization process.
A novel process is described for the neutralization of acid streams produced during coal mining and
processing. The leachate from a waste coal dump was neutralized with limestone for the removal of
iron, aluminium and sulphate. Specific aspects studied were the process configuration, the rates of
iron(II) oxidation, limestone neutralization and gypsum crystallization, the chemical composition of the
effluents before and after treatment, the efficiency of limestone utilization and the sludge solids

v
content.
The study showed that the acid content was reduced from 12 000 to 300 mg/l (as CaCO3), sulphate
from 15 000 to 2 600 mg/l (as SO4), iron from 5 000 to 10 mg/l (as Fe), aluminium from 100 to 5 mg/l
(as Al) while the pH increased from 2,2 to 7,0. Reaction times of 2.0 and 4.5 h are required under
continuous and batch operations respectively for the removal of 4 g/l iron(II) (as Fe) . The iron(II)
oxidation rate equation is a function of the iron(II), hydroxide, oxygen and suspended solids
concentrations. The optimum suspended solids concentration for iron(II) oxidation in a fluidized-bed
reactor is 190 g/l. Upflow velocity has no influence on the rate of iron(II) oxidation in the range 5 to 45
m/h. Sludge with a high solids content of 55% is produced. This compares well with the typical 20%
solids content that can be achieved with the High Density Sludge process in the case of lime
neutralization. Neutralization cost of acid water can be reduced significantly with the integrated iron(II)
oxidation and limestone neutralization process as limestone instead of lime is used and sludge with a
high solids content is produced. The alkali cost to treat discard leachate with an acidity of 10 g/l (as
CaCO3) amounts to R5.15/m3, R2.79/m3, R1.37/m3 and R1.95/m3 for slaked lime, unslaked lime,
limestone when milled on-site and purchased limestone respectively. The expected capital cost for a
1 Ml/d integrated iron(II) oxidation and neutralization plant is R1.87 million when the alkali is purchased
and R1.95 million when limestone is milled on-site.
Design criteria are provided for application on full-scale.
High density sludge (HDS) process.
Acid mine drainage (AMD) poses serious pollution problems if discharged untreated into public
streams. Up to date, the conventional and High Density Sludge (HDS) processes are used to
neutralized AMD. The conventional neutralization process produces sludge with low sludge solids
content. Although the HDS process produces sludge with high sludge solids content, one of the
disadvantages is the difficulty to control the process, especially where there is fluctuation in flow rates
and acid concentrations. It is thus priority to improve the existing HDS process. Less pH fluctuation
occurred during the operation of the Modified HDS process due to better pH control. The pH
fluctuated between pH 7.47 and 7.59. Existing lime neutralization plants can be adapted with minor
changes to accommodate the modified HDS process.
This investigation compared the HDS and modified HDS process configurations with beaker studies
and an laboratory pilot plant scale. Results from the continuous laboratory pilot scale studies

vi
confirmed findings from the laboratory beaker studies. The Modified HDS process gave better lime
utilization, higher sludge solids concentrations, and faster settling rates.
The more CaCO3 added during the beaker studies, the less lime was used; the higher the sludge solids
content; and the faster the settling rates.
Water with high sulphate concentrations is less suitable for treatment with the HDS or Modified HDS
processes due to gypsum scaling.
Leachate studies
Coal discard, fines and high density sludge (HDS-sludge) are generated during coal mining. Both,
discard and HDS-sludge can be classified as hazardous wastes which require special disposal
criteria. Discard dumps need to be designed in such a way that contact between discard, water and
air is minimized to ensure minimum acid formation. For the disposal of hazardous HDS-sludge,
legislation requires that it be discharged into lined ponds, which is costly, to prevent metal leachate
from polluting groundwater. The purpose of this study was to investigate the benefits associated with
co-disposal of HDS-sludge and coal discard. It is argued that there is little environmental benefit in
disposal of HDS-sludge in lined ponds compared to the co-disposal of HDS-sludge with coal discard.
Co-disposal of High Density sludge (HDS-sludge) with coal discard would offer the following benefits:
cost reduction as costly sludge disposal ponds are not required and neutralization capacity is created
as HDS-sludge usually contains unused alkali. Permission for such co-disposal, however, is
dependant on an Environmental Impact Assessment as required by DWAF.
The purpose of this investigation was to:
• Demonstrate that co-disposal of HDS-sludge and coal discard offers an effective alternative to
disposal of HDS-sludge in lined landfills.
• Compare the efficiency of HDS with other methods for the control of pyrite oxidation in coal
discard.
• Determine the potential toxicity of leachate from the untreated and treated coal discard.
It was found that:
1. HDS-sludge from Brugspruit liming plant contains 50 g/kg alkali (as CaCO3) which can be used
for the neutralization of coal discard,

vii
2. The rate of pyrite oxidation and metal leachate are reduced significantly when HDS-sludge is
co-disposed with coal discard, compared with that of coal discard on its own.
3. Acid generation from coal discard can also be controlled with methods such as addition of
activated sludge (to create reducing conditions) or submersion (to eliminate oxygen ingress).
Full-scale application
A CaCO3 handling and dosing has been developed and demonstrated on full-scale that: (i) powdered
calcium carbonate in a dump can be slurried to a constant density and applied for treatment of acid
water; (ii) Acid water, rich in iron(II) can be treated with calcium carbonate for neutralization, complete
removal of metals (iron(II), iron(III) and aluminium) and partial sulphate removal (to saturation level).
4. Recommendations for further research
It is recommended that further work be done in order to provide an integrated solution to treat water to
the level suitable for discharge into public streams and for drinking water. This would entail the
following :
· Evaluate the calcium carbonate/lime/gypsum crystallization process for partial sulphate removal to
less than 1 100 mg/l. In this process sulphate is reduced to less than 1 100 mg/l through gypsum
crystallization by raising the pH with lime to 12. Increased sulphate removal is achieved as
magnesium and sulphate associated with magnesium is removed. Due to the high calcium
concentration in solution at pH 12, sulphate is removed to lower levels due tot the solubility product
of calcium and sulphate ions.
· Evaluate the biological sulphate removal process for the reduction of sulphate to levels less than
500 mg/l using coal gas as energy source. It has been demonstrated on pilot-scale (400 m3/d) that
sulphate can be removed to less than 200 mg/l provided that sufficient energy source is dosed.
Ethanol was used as energy source. Ethanol, unfortunately has the following disadvantages:
- Costly. At a dosage of 0.8 g/l and a price of R3 750/ton the ethanol cost amount to R3/m3.
- An aerobic stage is required for removal of residual organic material as a portion of the ethanol
is converted to acetate and is not utilized for sulphate reduction.
· Develop a spreadsheet based model to identify the most cost-effective combination of processes
for a specific application. Sulphate for instance can be removed at the lowest cost with limestone
(14 c/kg SO4 for chemical cost, but only to a level of 2 500 mg/l), or at a higher cost with lime (41
c/kg SO4 for chemical cost, to a level of 1 100 mg/l) or to low levels with the biological process
(R1.50/kg SO4, to a level less than 500 mg/l). Such a model will determine the chemical

viii
composition of the treated water, size and cost of the various capital items, total capital and
running cost. As input the model will require the flow rate of the various feed water streams and
their chemical compositions.
· Estimate the total volume and chemical composition of mining effluents (coal, gold and platinum)
that need to be treated.

ix
ACKNOWLEDGEMENTS
The research in this report emanated from a project funded by the Water Research Commission and
entitled:
"Underground neutralization of mine water with limestone".
The Steering Committee responsible for this project consisted of the following persons:
MEMBER AFFILIATION
Mr H M du Plessis Water Research Commission
Mr G N Steenveld Water Research Commission
Ms M de Beer CSIR
Mr N C Swiegelaar Department of Water Affairs and Forestry
Mr W H Peek Department of Water Affairs and Forestry
The financing of the project by the Water Research Commission and the contribution of the members
of the Steering Committee are acknowledged gratefully.

x
TABLE OF CONTENTS
EXECUTIVE SUMMATY........................................................................................................i
ACKNOWLEDGEMENTS ......................................................................................................ix
TABLE OF CONTENTS .........................................................................................................x
LIST OF TABLES....................................................................................................................xvii
LIST OF FIGURES..................................................................................................................xix
CHAPTER 1 : INTRODUCTION.............................................................................................1
1.1 SOURCE OF ACID MINE WATER.....................................................................1
1.2 QUANTITY AND QUALITY OF MINE WATER ..................................................1
1.3 PROBLEMS ASSOCIATED WITH ACID MINE WATER ..................................2
1.4 TREATMENT OF ACID MINE WATER .............................................................3
1.5 ALTERNATIVE SOLUTIONS AS PROPOSED IN THIS INVESTIGATION .....4
1.5.1 Limestone Neutralization......................................................................................4
1.5.2 Sludge Disposal...................................................................................................5
1.6 AIMS....................................................................................................................6
CHAPTER 2 : LITERATURE SURVEY..................................................................................8
2.1 INTRODUCTION.................................................................................................8
2.2 LIME TREATMENT PROCESSES ....................................................................8
2.2.1 Conventional Treatment with Lime.......................................................................8
2.2.2 High Density Sludge (HDS) Process ...................................................................9
2.3 LIMESTONE TREATMENT SYSTMS ...............................................................10
2.3.1 Aerated Limestone Powder Reactor....................................................................10
2.3.2 Stationary Limestone Grit Reactor ......................................................................11
2.3.3 Stationary Aerated Limestone Grit Reactor.........................................................12
2.3.4 Rotating Drum......................................................................................................14
2.3.5 Limestone Lime Treatment ..................................................................................15
2.3.6 Fluidized-bed Neutralization Process...................................................................15
2.3.7 Integrated Limestone Neutralization Process ......................................................17
2.3.8 Biological Iron (II) Oxidation.................................................................................18
2.3.9 Limestone Properties and its Selection ...............................................................19
2.4 SLUDGE..............................................................................................................21

xi
CHAPTER 3 : CHEMICAL AND BIOLOGICAL OXIDATION OF IRON IN ACID
MINE WATER.........................................................................................................................22
3.1 INTRODUCTION.................................................................................................22
3.2 MATERIALS ........................................................................................................22
3.2.1 Experimental Procedure.......................................................................................24
(a) Biological Iron Oxidation......................................................................................24
(b) Chemical Iron Oxidation ......................................................................................24
3.2.2 Analytical Procedures ..........................................................................................24
3.3 RESULTS AND DISCUSSION ...........................................................................25
3.3.1 Nutrients, CO2, Air flow, pH and Temperature .....................................................27
3.3.2 Continuous Studies ..............................................................................................28
3.3.3 Kinetic Studies .....................................................................................................28
3.3.4 Conclusions..........................................................................................................29
CHAPTER 4 : BIOLOGICAL IRON (II) OXIDATION AS PRETREATMENT TO
LIMESTONE NEUTRALIZATION ..........................................................................................31
4.1 INTRODUCTION.................................................................................................31
4.2 MATERIALS AND METHODS ...........................................................................32
4.2.1 Feed Solution.......................................................................................................32
4.2.2 Reactor Configurations ........................................................................................32
4.2.3 Media ...................................................................................................................33
4.2.4 Operation Procedure............................................................................................33
4.2.5 Analyses...............................................................................................................34
4.3 RESULTS AND DISCUSSION ...........................................................................34
4.3.1 Kinetics ................................................................................................................34
4.3.2 Support Media .....................................................................................................35
4.3.3 Upflow Velocity ....................................................................................................36
4.3.4 Effect of Oxygen Concentration...........................................................................37
4.3.5 Continuous Operation..........................................................................................37
4.3.6 General.................................................................................................................39
4.4 CONCLUSIONS ..................................................................................................39

xii
CHAPTER 5 : INTEGRATED PROCESS FOR LIMESTONE NEUTRALIZATION OF
ACIDIC EFFLUENT AND METAL AND PARTIAL SULPHATE REMOVAL.........................40
5.1 INTRODUCTION.................................................................................................40
5.2 MATERIALS AND METHODS ...........................................................................40
5.2.1 Feedstock ............................................................................................................40
5.2.2 Batch Studies in Beakers .....................................................................................41
5.2.3 Batch and Continuous Studies on Pilot Scale ......................................................41
5.2.4 Analytical..............................................................................................................41
5.3 RESULTS AND DISCUSSION ...........................................................................42
5.3.1 Water Quality .......................................................................................................42
5.3.2 Kinetics ................................................................................................................43
5.3.3 Design Criteria Continuous Operation .................................................................47
(a) Oxygen versus air................................................................................................47
(b) Suspended solids concentration..........................................................................47
(c) Upflow Velocity ....................................................................................................48
(d) Residence time and mode of operation...............................................................48
5.3.4 Sequential Batch Mode Operation.......................................................................49
5.3.5 Sludge Characteristics .........................................................................................50
(a) Settling rate and solids content............................................................................50
(b) Utilization of excess CaCO3 in the waste sludge.................................................51
5.3.6 Economic Feasibility............................................................................................51
5.4 CONCLUSIONS ..................................................................................................52
CHAPTER 6 : DESIGN OF FULL-SCALE LIMESTONE NEUTRALIZATION PLANT .........53
6.1 INTRODUCTION.................................................................................................53
6.2 PROCESS DESCRIPTION.................................................................................53
6.2.1 Limestone Neutralization......................................................................................53
6.2.2 Iron (II) Oxidation .................................................................................................54
6.3 PLANT CONFIGURATION .................................................................................54
6.4 CONTROL PHILOSOPHY ..................................................................................55
6.4.1 Iron (II) Oxidation .................................................................................................55
6.4.2 Limestone Neutralization......................................................................................55
6.5 PROCESS FLOW DIAGRAM AND COSTING ..................................................55

xiii
CHAPTER 7 : LIME NEUTRALIZATION WITH THE MODIFIED HDS PROCESS .............63
7.1 INTRODUCTION.................................................................................................63
7.1.1 Background ..........................................................................................................63
(a) Comparing the HDS process with the conventional liming process....................63
(b) The HDS process ................................................................................................64
(c) Ferric hydroxide precipitation and polymerization ...............................................65
(d) Sludge recycle to precipitation ratios...................................................................65
(e) Settling rates........................................................................................................66
7.1.2 Purpose of Investigation......................................................................................66
SECTION I : LIME NEUTRALIZATION WITH HDS, MODIFIED HDS AND
NEUTRAL PROCESSES DURING LABORATORY BEAKER STUDIES ............................67
7.2 INTRODUCTION.................................................................................................67
7.3 MATERIALS AND METHODS ...........................................................................67
7.3.1 Experimental ........................................................................................................67
(a) Beaker Studies ....................................................................................................67
(i) High Density Sludge Process..............................................................................69
(ii) Modified High Density Sludge Process ...............................................................69
(iii) Neutral HDS Process ..........................................................................................70
7.3.2 Analytical..............................................................................................................70
7.4 RESULTS AND DISCUSSION ...........................................................................70
7.4.1 Contact Time .......................................................................................................71
(a) Lime Utilization ....................................................................................................71
(b) Settling Rates ......................................................................................................72
7.4.2 Process Configuration.........................................................................................72
(a) Lime Utilization.....................................................................................................72
(b) Sludge solids contents .........................................................................................73
(c) Settling Rates.......................................................................................................74
7.4.3 Iron Content .........................................................................................................74
(a) Lime Utilization.....................................................................................................74
(b) Sludge Solids Contents........................................................................................75
(c) Settling Rates.......................................................................................................75
7.4.4 Calcium Carbonate Addition................................................................................76
7.4.5 Acidity ..................................................................................................................76
7.4.6 pH ........................................................................................................................77
7.5 CONCLUSIONS ..................................................................................................77

xiv
SECTION II : LIME NEUTRALIZATION WITH HDS AND MODIFIED HDS
PROCESSES DURING CONTINUOUS OPERATION WITH LABORATORY-
SCALE PLANTS .....................................................................................................................82
7.6 INTRODUCTION.................................................................................................82
7.7 MATERIALS AND METHODS ...........................................................................82
7.7.1 Feedstock ............................................................................................................82
7.7.2 Equipment ............................................................................................................83
7.7.3 Procedure ............................................................................................................84
(a) Operation .............................................................................................................84
(b) The HDS Process................................................................................................85
(c) The modified HDS process..................................................................................86
(d) Maintenance ........................................................................................................86
7.7.4 Experimental Programme ....................................................................................88
7.7.5 Analytical..............................................................................................................88
(a) Sampling..............................................................................................................88
7.8 RESULTS AND DISCUSSION ...........................................................................89
7.8.1 Starting of Experiments........................................................................................89
7.8.2 Sludge Age...........................................................................................................90
7.8.3 Process Configuration.........................................................................................91
(a) Lime Utilization ....................................................................................................91
(b) Settling Rates ......................................................................................................91
(c) Sludge Solids Concentrations .............................................................................92
7.8.4 Gypsum Scaling ...................................................................................................92
7.9 CONCLUSIONS ..................................................................................................93
CHAPTER 8 : CONTROL OF ACID GENERATION IN COAL DISCARD DUMPS
USING LIMING PLANT SLUDGE ..........................................................................................94
8.1 BACKGROUND...................................................................................................94
8.2 MATERIAL AND METHODS..............................................................................95
8.2.1 Materials ..............................................................................................................95
8.2.2 Column Leaching Studies.....................................................................................96
8.2.3 Beaker Tests for Evaluating the Stability of HDS................................................97
8.2.4 Waste Classification Studies ...............................................................................97
8.2.5 Analytical..............................................................................................................97

xv
8.3 RESULTS AND DISCUSSION ...........................................................................97
8.3.1 Control of Acid Generation from Coal Discard with HDS-Sludge........................98
(a) Coal discard (control)...........................................................................................98
(b) HDS-sludge .........................................................................................................101
(c) Comparison between coal discard (control) and HDS-sludge.............................101
8.3.2 Comparison between HDS and Other Treatment Options...................................103
(a) Acid generation....................................................................................................103
(b) Sulphate behaviour...............................................................................................105
8.3.3 Waste Classification of HDS-sludge and Coal Discard.......................................107
8.3.4 Practical Considerations ......................................................................................108
8.4 CONCLUSIONS ..................................................................................................110
CHAPTER 9 : LIMESTONE HANDLING AND DOSING SYSTEM FOR FULL-
SCALE APPLICATION ...........................................................................................................112
9.1 INTRODUCTION.................................................................................................112
9.2 MATERIALS AND METHODS ...........................................................................114
9.2.1 Feedstock ............................................................................................................114
9.2.2 Equipment ............................................................................................................114
9.2.3 Experimental ........................................................................................................117
9.2.4 Analytical..............................................................................................................117
9.3 RESULTS AND DISCUSION..............................................................................117
9.3.1 CaCO3 Handling and Dosing System...................................................................117
9.3.2 CaCO3 Neutralization of Coal Discard Leachate .................................................118
9.4 CONCLUSIONS ..................................................................................................119
CHAPTER 10 : CONCLUSIONS............................................................................................120
10.1 Biological Iron (II) Oxication.................................................................................120
10.2 Integrated Neutralization Process........................................................................121
10.3 High Density Sludge (HDS) Process ...................................................................121
10.4 Leachate Studies .................................................................................................122
10.5 Full-Scale Application...........................................................................................123
CHAPTER 11 : RECOMMENDATIONS ................................................................................124
11.1 RECOMMENDATIONS ......................................................................................124

xvi
CHAPTER 12 : REFERENCES..............................................................................................126

xvii
LIST OF TABLES
Page Table 1.1 Comparison between water volumes and sulphate load of fresh water usage and excess mine water discharges in the Upper Olifants River Catchment ................................................................................................................ 2 Table 1.2 Price comparison of neutralization alkalies (2001 cost figures; 1US$ = SA R9)...................................................................................................................... 3 Table 1.3 Capital and running cost of various treatment processes (treatment module Of 15 Ml/d ................................................................................................................ 3 Table 2.1 Chemical quality of acid water fed to the rotating drum............................................ 15 Table 3.1 Effect of the support medium on the rate of iron oxidation...................................... 26 Table 3.2 Change in surface area of the geotextile and iron oxidation rate with respect to the number of iterations ........................................................................... 27 Table 3.3 Effect of Fe(ii) concentration on the iron oxidation rate ........................................... 27 Table 3.4 Effect of different parameters on the iron oxidation rate.......................................... 28 Table 3.5 Effect of the support media and nutrients on the iron oxidation rate ........................ 29 Table 3.6 Effect of various factors on the kinetics of biological iron oxidation........................ 29 Table 4.1 Effect of various parameters on the kinetics of iron (II) oxidation (feed iron(II)
concentration = 3g/l, pH = 2 and temperature = 25ºC)............................................. 35 Table 4.2 Iron(II) oxidation rate with various support media (1 USD = SA R6; initial iron (II) concentration = 3g/l, temperature = 25ºC; pH = 2) ...................................... 36 Table 5.1 Dimensions of pilot plant .......................................................................................... 42 Table 5.2 Chemical composition of feed and treated water (in mg/l where applicable) when synthetic discard leachate was treated with limestone .................................... 43 Table 5.3 Effect of various factors on the kinetics of iron(II) oxidation.................................... 45 Table 5.4 Effect of oxygen concentration on the rate of iron(II) oxidation ............................... 47 Table 5.5 Effect of suspended solids on the rate of iron(II) oxidation...................................... 48 Table 5.6 Suspended solids contents of the sludge at different dilutions (1, 2, 5, 10 and 20 times) before and after settling, as well as the settling rate at each dilution (Exp 11.1)..................................................................................................... 51 Table 5.7 Partial neutralization of discard leachate with CaCO3-rich waste sludge.................. 51 Table 6.1 Design calculations for limestone neutralization of typical acid mine water at 1.2 Ml/d..................................................................................................................... 58 Table 6.2 Equipment sizing for limestone neutralization of typical acid mine water at 1.2Ml/d...................................................................................................................... 60 Table 6.3 Capital cost for limestone neutralization of typical acid mine water at 1.2 Ml/d..................................................................................................................... 61 Table 6.4 Operating cost for limestone neutralization of typical acid mine water at 1.2 Ml/d..................................................................................................................... 62 Table 7.1 Summary of variables investigated during beaker studies........................................ 68 Table 7.2 Results of beaker studies where the influence of contact times were compared. Different oxidation stages of iron water were neutralized with the HDS process ...................................................................................................... 78 Table 7.3 Results of beaker studies where the influence of contact times were compared. Different oxidation stages of iron water were neutralized with the Modified HDS or Neutral processes .................................................................. 78 Table 7.4 Results of beaker studies where the influence of the HDS and Modified HDS neutralization processes on Fe(II) and Fe(III) water were compared............... 79 Table 7.5 Results of beaker studies where the influence of the HDS and Modified HDS neutral neutralization processes on Fe(II) and (III) water were compared ................................................................................................................. 79 Table 7.6 Results of beaker studies where the influence of the HDS and Modified HDS neutralization processes on Fe(II)(III)Ac water were compared ...................... 80

xviii
Table 7.7 Results of beaker studies where the influence of the iron oxidation stages of the feed waters were compared when neutralized with the HDS process ................ 80 Table 7.8 Results of beaker studies where the influence of the oxidation states of the feed waters were compared when neutralized with the Modified HDS process..................................................................................................................... 81 Table 7.9 Resutls of beaker studies where the influence of limestone addition on the different parameters were compared when feed waters were neutralized with the HDS or Modified HDS processes............................................................... 81 Table 7.10 Chemical compositions of feed waters used in continuous studies ......................... 82 Table 7.11 Comparative parameter values during steady state for each of the process configurations ............................................................................................. 91 Table 7.12 Summary of suspended solids results obtained with Fe(II) water (feed water A) and Fe(III) water (feed water B).................................................................. 92 Table 8.1 Chemical composition of HDS-sludge ..................................................................... 96 Table 8.2 Effect of HDS-sludge and other treatment options (submersed and activated sludge) on the specific weekly load of environmental parameters in the leachate from coal discard.............................................................................. 99 Table 8.3 Dissolution of HDS-sludge (50 g) as a function of acid concentration (24 h contact period........................................................................................................... 103 Table 8.4 Acid generation rates for the various treatment options........................................... 104 Table 8.5 Comparison of HDS-sludge and coal discard waste classification.......................... 108 Table 8.6 Contribution of HDS-sludge to metal load in the leachate of coal discard during co-disposal (as measured in TCLP extracts)................................................. 109 Table 9.1 Dimensions of CaCO3 neutralization pilot plant ........................................................ 117 Table 9.2 Chemical composition of feed (synthetic discard leachate) and CaCO3 treated water............................................................................................................. 118

xix
LIST OF FIGURES Page
Figure 2.1 The conventional process for acid water neutralization............................................ 8 Figure 2.2 The High Density Sludge process for acid water neutralization ............................... 9 Figure 2.3 Aerated powder limestone reactor ........................................................................... 11 Figure 2.4 Stationary limestone grit reactor with vertical fluid flow............................................ 12 Figure 2.5 Stationary limestone grit reactor with horizontal fluid flow........................................ 12 Figure 2.6 Stationary aerated limestone grit reactor ................................................................. 13 Figure 2.7 Stationary aerated limestone grit reactor with intermittent wash by upflow expansion ................................................................................................................. 13 Figure 2.8 Schematic diagram of a rotating drum reactor......................................................... 14 Figure 3.1 Set-up for chemical iron oxidation studies................................................................ 23 Figure 3.2 Schematic flow diagram for biological iron oxidation studies................................... 23 Figure 3.3 Effect of pellets concentration on the iron oxidation rate ......................................... 25 Figure 3.4 Effect of the number of iterations on the iron oxidation rate .................................... 25 Figure 4.1 Reciprocating disc-pack reactor............................................................................... 32 Figure 4.2 Submersed packed-column reactor.......................................................................... 33 Figure 4.3 Effect of upflow velocity and oxygen concentration for medium G at 24ºC (initial iron (II) concentration = 3 g/l; pH = 2) ............................................................ 37 Figure 4.4 Iron (II) oxidation in a submersed packed-bed column reactor under continuous operation (medium G; feed iron(II) concentration = 3g/l; temperature = 24ºC; pure oxygen and pH = 2)......................................................... 38 Figure 5.1 Schematic diagram of integrated iron(II) oxidation/limestone neutralization pilot plant .................................................................................................................. 42 Figure 5.2 Comparison between batch and continuous operation during iron(iII) oxidation................................................................................................................... 49 Figure 5.3 Behaviour of various parameters during batch operation of the integrated iron(II) oxidation and limestone neutralization process............................................. 50 Figure 6.1 Iron(II) oxidation reactor ........................................................................................... 56 Figure 6.2 Fluidized-bed limestone neutralization reactor.......................................................... 57 Figure 7.1 The conventional treatment of acid mine water ........................................................ 63 Figure 7.2 The HDS process for treatment of acid mine water................................................. 64 Figure 7.3 HDS vs Mod HDS treatment of AMD : Settling rates as a function of number of repetitions................................................................................................ 75 Figure 7.4 HDS vs Mod HDS treatment of AMD : Sludge solids concentration as a function of number of repetitions .............................................................................. 76 Figure 7.5 HDS and Modified HDS laboratory-scale plants in operation.................................. 83 Figure 7.6 Diagram of HDS laboratory scale plant.................................................................... 85 Figure 7.7 Diagram of Modified HDS laboratory scale plant..................................................... 87 Figure 7.8 The settled sludge concentration as a function of the total feed flow through the HDS plant (feedwater A)........................................................................ 89 Figure 7.9 Settling rates as a function of total feed flow through the HDS system (feed water A)........................................................................................................... 90 Figure 7.10 Sludge age as a function of total feed flow through the HDS system (feed water A)........................................................................................................... 90 Figure 8.1 Leachate of acid and iron from coal discard (control) – W6..................................... 101 Figure 8.2 Comparison of the acid leached from coal discard and HDS-sludge....................... 102 Figure 8.3 Effect of various control methods on the acid generated by coal discard................ 105 Figure 8.4 Effect of various control methods on sulphate generated by coal discard............... 107 Figure 9.1 Limestone handling and dosing system.................................................................... 115 Figure 9.2 Process flow diagram for the treatment of coal discard leachate ............................ 116

1
CHAPTER 1 : INTRODUCTION
1.1 SOURCE OF ACID MINE WATER
Acid mine waters contain high concentrations of dissolved heavy metals and sulphate, and can have
pH values as low as 2.5. In South Africa emphasis is placed the removal of sulphate from such
effluents due to salinisation of surface water (low dilution effect when discharged into public streams
due to small rivers in South Africa compared to North America and Europe). In the USA emphasis is
placed the removal of heavy metals due to its toxicity. Acid is produced biologically when pyrites in
the coal waste is oxidized as indicated by the following reactions (Barnes, 1968):
4FeS2 + 7O2 + 4H2O --> 4FeSO4 + 4H2SO4
4FeSO4 + 2H2SO4 + O2 --> 2Fe2(SO4)3 + 2H2O
2Fe2(SO4)3 + 12H2O --> 4Fe(OH)3 + 6H2SO4
___________________________________________
4FeS2 + 15O2 + 14H2O --> 4Fe(OH)3 + 8H2SO4 (1)
Unless treated such waters may not be discharged into public streams.
1.2 QUANTITY AND QUALITY OF MINE WATER
In Gauteng about 240 Ml/d of acid mine water from gold mining requires treatment. Mine water
discharged from coal mines in the Upper Olifants River Catchment currently amounts to approximately
44 Ml/d during an average hydrological year (van Zyl et al., 2000) (Table 1.1). It is expected that this
figure will increase to an estimated 131 Ml/d by 2020. The quality of mine water is generally poor with
a sulphate concentration between 800 and 3 000 mg/l . It is not acceptable to discharge such poor
quality mine water into high quality surface water. The current background sulphate load of water in
the Upper Olifants River Catchment is estimated at 28,4 t/d (as SO4) (947 Ml/d @ 30 mg/l SO4),
which is small compared to the estimated 102,9 t/d sulphate load associated with excess mine water
(2 337 mg/l SO4 @ 44 Ml/d). The above-mentioned figures show that a relatively small volume of
excess mine water is responsible for a major contribution of salinity. Excess mine water in the
Olifants River Catchment currently amounts, volume wise, to only 4,6% of the total water usage, but
contributes 78,4% of the sulphate load.

2
Table 1.1 : Comparison between water volumes and sulphate load of fresh water usage and excess mine water discharges in the Upper Olifants River Catchment
Parameter
Fresh
water
Mine
Water Total
Fresh
water
Mine
water
Ml/d Ml/d Ml /d % %
Volume (Ml /d)
947
44,0
991
95,6
4,4
Sulphate concen-
tration (mg/l )
30
2337
Sulphate load (t/d) 28,4 102,9 131,3 21,6 78,4
1.3 PROBLEMS ASSOCIATED WITH ACID MINE WATER
Acid mine water is associated with the following problems:
· Acidification and salinisation of surface water due to the presence of acid and high concentrations
of sulphate and metal pollution.
· Corrosion to and scaling of equipment. When the pH is below 5.5, water can be toxic to plant and
fish life and corrosive to pipelines and equipment. When acid water is neutralized with lime and
often over-saturated with respect to gypsum. This practice results in the scaling of equipment by
the unstable water produced, malfunctioning of dosing equipment and settling of particles in
pipelines and valves. The latter often causes blockages which may result in under-dosage, which in
turn leads to acid corrosion.
· High treatment cost. Lime is generally used for neutralization of acid mine water. Should limestone
be used for the neutralization of acid water the cost could be reduced significantly as shown in
Table 1.2. Desalinisation of neutralized mine water is not applied yet due to high treatment cost. A
number of alternative desalinisation treatment technologies were considered when treated mine
water must meet more stringent quality requirements for industrial reuse, discharge to a public
stream, drinking or power station cooling water (van Zyl et al., 2000). Table 1.3 shows the cost
associated with various treatment processes including Aqua K, Barium, Biological sulphate
removal, EDR, Electrolytic, GYPCIX, RO or Savmin.
· Sludge disposal. Legislation requires that sludge from neutralization plants be discharged into lined
ponds to prevent metal leachate from polluting ground water. Construction of lined ponds are

3
costly. The volume of sludge to be disposed also influences the cost and processes that produce
sludge with a high solids content would be preferred.
Table 1.2 : Price comparison of neutralization alkalies (2001 cost figures; 1 US$ = S A R9) Cost Sodium hydroxide Hydrated lime Unhydrated lime Lime-stone
Cost (R/t)
2000
500
480
110
Cost (c/kl )† 320 74 53.8 22
† Treatment cost for the neutralization of water with an acid content of 2 g/l as CaCO3. Total
utilization and 100% purity are assumed.
Table 1.3 : Capital and running cost of various treatment processes (treatment module of 15 Ml /d).
Treatment Process SO4 level in
treated water
Capital cost
(R million / (Ml /d))
Running cost
(R/m³)
Limestone neutralization (incl. iron(II) oxidation)
2 500
0,50
0,59
Lime neutralization (pH 8)
1 500
0,53
1,36
Limestone/lime treatment (pH 11) & gypsum
crystallisation
1 100
0,88
1,02
Lime treatment (pH 11.5) & gypsum crystallization
1 100
0,57
1,61
Advanced sulphate removal (including neutralization
pre-treatment
200
4,0 to 10,0
2,0 to 5,0
1.4 TREATMENT OF ACID MINE WATER
Acid water required treatment for both neutralization and desalinisation. Neutralization is required as
pre-treatment to desalinisation. Various processes are developed for desalinisation and includes the
following: Biological sulphate removal, SAVMIN, Aqua-K, Reverse Osmosis, Electro dialysis. This
investigation only deals with neutralization and only with desalinisation that is associated with gypsum
crystallization.
Currently, acid water is neutralized with lime and then re-used. The following disadvantages can be
linked to lime neutralization:

4
· Scaling of equipment by the unstable water produced.
· Malfunctioning of lime dosing equipment. Settling of lime particles in pipelines and valves often
causes blockages, which may result in under-dosage and acid corrosion.
· Lime is costly. The cost of slaked lime (HDS process), unslaked lime (HDS process), unslaked
lime (modified HDS process) and limestone amounts to R4.93/m3, R3.36/m3, R2.48/m3 and
R1.57/m3 respectively for the treatment of water with an acidity of 10 g/l (as CaCO3).
Neutralization is generally the first step in treating acid mine water (gold, operational and abandoned
coal mines). In Gauteng about 240 Ml/d of acid mine water from gold mining requires treatment. At
an acidity of 3 g/l (as CaCO3), a lime (CaO) price of R360 and a purity of 93% the neutralization cost
would amount to R57 million/a. It is, therefore, essential that the most suitable and cost-effective
technology be identified or developed.
Passive treatment is also evaluated for treatment of acid and sulphate-rich mining effluents. This
method would be suitable to treat water with low acid concentrations (less than 300 mg/l CaCO3).
1.5 ALTERNATIVE SOLUTIONS AS PROPOSED IN THIS INVESTIGATION
1.5.1 Limestone Neutralization
In contrast to lime treatment, limestone is relatively cheap and readily available, process control is
simplified (no pH-control is required as limestone dissolution essentially occurs at pH-values below
7), and material wastage through overdosage is minimized. Also limestone is non-hazardous and
easy to store. Raw material can be stockpiled in the open as CaCO3 is not readily soluble in neutral
water.
Notwithstanding these advantages, limestone neutralization has had limited application as a result of
low neutralization rates compared to other alkalies and the phenomenon of surface scaling, which
inhibits the reaction rate (Maree and du Plessis, 1993). The CSIR has overcome these limitations by
developing a fluidized-bed process (Maree and Clayton, 1992), which ensures a high effective
limestone concentration in the reactor and counters scale formation by particle attrition.
Despite this developments, the following areas still need to be solved:
· Iron(II) need to be oxidized to iron(III) upstream of the neutralization stage or simultaneously.
· Sludge of high density need to be produced to minimize sludge volumes.

5
· Sludge disposal criteria need to be relaxed.
1.5.2 Sludge Disposal
Legislation requires that sludge from neutralization plants be discharged into lined ponds to prevent
metal leachate from polluting ground water as it is classified as a class 3 waste. If leachate studies
would show that sludge is stable with respect to leachate of metals, as long as it is not acidified, such
information could be used to assist in formulating a strategy for sludge disposal in a less costly way.
(e.g. to use open cast or underground voids for discard of sludge rather than in costly lined ponds if
the pH is kept neutral where metals will not redissolve).
Sludge disposal in lined ponds is costly due to the following:
· Large mass of sludge. An estimated amount of 20 t/d of sludge is produced from 1 Ml/d of
discard leachate when neutralized with lime or limestone.
· Plastic lining of sludge pond. Sludge produced from acid mine water is classified as a class 3
waste due to its metal content and must therefore be discharged into a lined pond.
Other, more cost effective methods of sludge discharge, such as worked out open casts or
underground voids, may be used for this purpose. This approach would be in line with the accepted
backfill approach in the gold, nickel and copper mining industry where waste rock is returned to
underground. With the proposed approach, ferric hydroxide (Fe(OH)3), which is stable, would be
returned to its origin, and not pyrites (FeS2), which could be oxidized to generate acid. Acid water in
underground voids can be pumped to surface and treated. The amount of sludge produced from the
integrated process will amount only to 5% of the volume of discard leachate with an acidity of 15 g/l
(as CaCO3). Benefits of this approach are:
· Cost reduction. Costly sludge disposal ponds are not required.
· Reduced seepage to ground water when pond is lined. Settled sludge has a low permeability and
will reduce the rate of seepage to underground water.
· Neutralization capacity is created in terms of acid ground water. Sludge contains unused alkali
(e.g. 10% to 30% of the lime used for neutralization in the HDS process is not utilized for
neutralization) which can be used to neutralize underground acid water.
· Aesthetic benefits. No waste from water treatment needs to be stored at the surface.
1.6 AIMS

6
The overall aim underlying research conducted as part of this and complementary projects, is to
identify the most suitable neutralization process which meets the following criteria for water with a
specific chemical composition:
1. Treated water which is neutral and stable with respect to gypsum crystallization.
2. Sludge with a high solids content.
3. Minimum alkali cost.
4. Minimum capital cost of plant and
5. Confidence in the selected process.
The specific aims set for this project were: (The chapter(s) in Report where a specific aim is
addressed in brackets):
1. Biological iron(II) oxidation. Determine the conditions required for rapid iron(II) oxidation under
acidic conditions within a residence time of one hour (Chapters 3 & 4).
2. Integrated neutralization process. Obtain design criteria for the treatment of low acidity water (2
000 mg/l acidity (as CaCO3) and 300 mg/l iron(II) (as Fe)) with the integrated neutralization and
iron(II) oxidation process (Chapters 5 & 6).
3. High density sludge (HDS) process. Optimize the process flow diagram of the HDS process to
meet the following criteria for different water qualities:
- produce sludge with a high solids content (greater than 25% for water containing 10 g/l
acidity (as CaCO3)
- produce sludge with a rapid settling rate
- achieve maximum lime utilization (greater than 95%) (Chapter 7).
4. Leachate studies. Determine the stability of mine water sludge (neutralized with lime and
limestone) with respect to re-dissolution and metal leachate as a function of pH for the following
wastes:
- Sludge produced during treatment of acid mine water with lime or limestone.
- Slimes (fine waste coal).
- Coal discard (rich in FeS2) to confirm that discard leachate is the main source of acid
generation of the various wastes produced during coal mining (Chapter 8).

7
All of the above aims were addressed through laboratory studies. Full-scale application of the findings
are discussed in Chapter 9, while overall conclusions are reported in Chapter 10 and
recommendations for further research and follow-on studies are made in Chapter 11.
The various aspects of the investigation were investigated individually and reported on in separate
chapters. Chapters were written largely in a format and style suitable for publication.

8
CHAPTER 2 : LITERATURE SURVEY
2.1 INTRODUCTION
Lime and limestone is generally used for the treatment of acid water. Lime has been used in the past
as the main neutralization agent but might be replaced with limestone as progress is made with
technology development.
2.2 LIME TREATMENT PROCESSES
The conventional lime treatment process was first applied for neutralization of acid mine water. The
next development was the High Density Sludge Process which offers the benefit of sludge with a
higher density that is produced. Limestone is currently evaluated as an alternative to lime due to cost
advantages.
2.2.1 Conventional Treatment with Lime
The flow diagram of the conventional process is shown in Figure 2.1. The main disadvantage of this
process is that sludge with a low density is produced.
Figure 2.1 : The conventional process for acid water neutralization.

9
2.2.2 High Density Sludge (HDS) Process
The HDS process (Figure 2.2), which is a modification of the conventional lime treatment process and
aimed at producing a higher density sludge, consists of the following stages:
· pH correction/sludge conditioning stage
· aeration/neutralization stage, and
· solid/liquid separation stage.
The pH correction stage consists of a tank for the preparation of a lime solution and a sludge
conditioning tank which receives recycled settled sludge from the clarifier underflow and the lime
solution. The lime dosage in the pH correction stage is such that the pH of the final treated water is
pH 8.
The conditioned sludge from the pH correction stage overflows into the aeration tank. This tank
serves as mixer to keep the solids in suspension, to mix the conditioned sludge with the acid mine
water entering the tank and for aeration. In this tank ferrous iron is also oxidized to ferric iron.
The neutralized and oxidized effluent overflows to the clarifier where sludge is separated from the
liquid. A poly-electrolyte can be dosed to the clarifier to promote flocculation.
Figure 2.2 : The High Density Sludge process for acid water neutralization.
The HDS Process has the following advantages over the conventional process (Osuchowski, 1992):

10
· A sludge with a density 10 times higher than that of the conventional process is produced. As a
result less demanding sludge drying facilities are required. The capital costs associated with the
construction of sludge ponds (including pumping and piping facilities) vary between R1/m3 and
R3/m3 of sludge handling (2001 cost figures).
· The sludge settles faster, therefore, a smaller clarifier is required. The saving on the clarifier is
approximately 38%.
2.3 LIMESTONE TREATMENT SYSTEMS
Various limestone treatment systems have been investigated (Hill and Wilmoth,, 1971).
2.3.1 Aerated Limestone Powder Reactor
Volpicelli et al. (1982) showed that effluent from a sugar plant containing sulphuric acid can be
neutralized with powdered limestone. Two backmix reactors were used to perform the operation in
order to reduce the required residence time. The first reactor is working at pH 4 under steady state
conditions as the dissolution rate of limestone is fast at that low pH. The dissolution rate is very slow
as the system approaches neutrality. A single backmix reactor would require a high residence time.
Disadvantages associated with this system are that a long residence time is required unless powder is
dosed, and that dosages, higher than stoichiometrically required, are necessary.
Limestone powder was found to react rapidly with free acid, ferric and aluminium salts in AMD, but not
in the ferrous containing AMD (Glover et al, 1965). Ferrous containing AMD can only be treated if
aeration is also applied as it has the effect that iron(II) is slowly oxidized (Figure 2.3).

11
Figure 2.3 : Aerated powder limestone reactor.
2.3.2 Stationary Limestone Grit Reactor
Stationary limestone beds can be operated by vertical fluid flow (Figure 2.4) or horizontal fluid flow
(Figure 2.5). These approaches have the advantage that an excessive amount of limestone is in
contact with the acid water. Losses of limestone particles can still be recovered by a screening or
sedimentation device downstream of the limestone bed.
A disadvantage of this approach is that the vertical reactor and the channel blocks due to the formation
of reaction products such as gypsum or ferric hydroxide on the limestone particles.

12
Figure 2.4 : Stationary limestone grit reactor with vertical fluid flow.
Figure 2.5 : Stationary limestone grit reactor with horizontal fluid flow.
2.3.3 Stationary Aerated Limestone Grit Reactor
The purpose of stationary aerated grit reactors (Figure 2.6) is to treat ferrous containing acid water.
The reactivity of the limestone bed in these aerated stationary beds fell appreciably after one or two
per cent of the limestone has been consumed under continuous flow conditions, but it was possible to
restore the activity by upflow fluid expansion of the beds (Figure 2.7). However, after seven per cent
of the limestone had been consumed, a hard, dark-coloured scale formed on the limestone particles
and the activity could no longer be restored by upflow expansion (Glover et al, 1965).

13
Figure 2.6 : Stationary aerated limestone grit reactor.
Figure 2.7 : Stationary aerated limestone grit reactor with intermittent wash by upflow expansion.

14
2.3.4 Rotating Drum
The U S Bureau of Mines investigated the use of the tube mill for limestone neutralization (Deul and
Mihok, 1967; Mihok, et al., 1968; Mihok, 1970). In this process, 3 inch pieces of limestone were fed,
together with acid mine water, to a rotating tube mill. The drum had a diameter of 1 m, a length of 8 m,
and was rotated at a speed of 25 rpm. The rotation has the effect that the limestone is milled to a
powder of less than 400 mesh. Acid water was fed to the drum at a rate of 2,3 Ml/d. The retention
time of the water in the tube is calculated to be 0,25 min (2300 kl/d ÷ (24 h/d x 60 min/h x p x (0,5 m)2 x
8 m). The chemical composition of the water that was treated is shown in Table 2.1. A schematic
diagram of a rotating drum reactor is shown in Figure 2.8.
Figure 2.8 : Schematic diagram of a rotating drum reactor.
The pH of the water after treatment was 7,4. The process is not yet implemented. One disadvantage
of the process is high losses of limestone (about 40%).
At the Rochester and Pittsburgh Coal Co.'s Lucerne 3A mine (Coal Age, 1969), acid mine water
containing iron was continuously treated in a revolving drum charged with limestone chips. The treated
water was fully neutralized and all iron was removed. A drawback of the above systems is that CaCO3
is used inefficiently - a large portion being washed out with the treated effluent stream.

15
Table 2.1 : Chemical quality of acid water fed to the rotating drum.
Parameter Concentration (mg/l )
Acidity 1700 Iron(II) 36 Iron(III) 324 pH 2,8
2.3.5 Limestone Lime Treatment
Wilmoth (1974) compared in parallel studies the cost advantage associated with the use of limestone-
lime treatment versus lime in a completely mixed reactor. As limestone is not effective for the
treatment of iron(II)-rich effluents, he proposed a two-stage process where limestone is used in the
first stage and lime in the second stage. First, the AMD is treated with limestone to a pH of 4,0 to 4,5
to take advantage of the pH range when limestone is most effective. The water then passes through a
second reactor where lime is applied to raise the pH range to the desired level. Benefits associated
with this approach are the following:
· Iron(II) can be removed.
· Sludge of high density is produced which is characteristic of the limestone process.
· Cost is reduced by 25%.
Although this two-stage process is more cost effective than the conventional lime neutralization
process, it was not adopted in general by the mining industry because it is more complex (two stages
instead of one).
2.3.6 Fluidized-bed Neutralization Process
The CSIR has developed, with financial support from the WRC, a fluidized-bed neutralization process
which uses limestone or dolomite as the neutralizing agent ( Maree, et al., 1992; du Plessis and
Maree, 1994; Maree and du Plessis, 1994; Maree, et al., 1996a; Maree, et al., 1996b.). In this process
crushed limestone (particle size less than 4 mm) is dosed to a column type reactor. The particles are
kept in suspension by controlling the up-flow velocity by means of a recycle pump. In case of the
fluidized limestone process, no accurate control of the dosage is required. This is because limestone
only dissolves as long as the water is under-saturated with respect to CaCO3. This usually occurs at a
pH below 7.

16
By replacing lime with limestone, the following benefits can be achieved:
· Direct savings on the purchase cost of neutralization media.
· Simplified process control. No pH-control is required as limestone and dolomite dissolution occurs
mainly at pH-values below 7. Since the flow rate of underground mine water may vary by a factor
of 10 (Pulles et al., 1994), lime/soda ash systems can only function well if its dosing rates are
adjusted accordingly.
· Minimization of material wastage which would occur as a result of over-dosage (due to pH-
solubility relationship referred to above).
· Elimination of hazardous chemical usage for neutralization (limestone/dolomite is easy and safe to
handle).
· Simple bulk chemical storage facilities (the raw materials are not readily soluble in neutral water).
· Utilization of equipment at existing lime neutralization plants is possible.
A limitation of the fluidized-bed process is that acid water rich in iron(II) can not be treated directly.
Iron(II) pass through the fluidized-bed reactor. When aeration is applied to remove iron(II) it as ferric
hydroxide, the limestone particles become coated with a layer of gypsum and ferric hydroxide which
prevent dissolution of the limestone particles.
A three-stage neutralization process consisting of biological iron(II) oxidation, limestone neutralization
in a fluidized-bed reactor and gypsum crystallisation was evaluated for treatment of discard leachate
(Maree, 1994; Maree 1995). Laboratory studies at CSIR and on-site pilot plant studies at Navigation
Section of Landau Colliery over the period January 1995 to March 1997 showed that:
· Complete neutralization of discard leachate (10 g/l acid (as CaCO3) and 4 000 mg/l iron(II) (as Fe))
can be achieved in a limestone neutralization fluidized-bed reactor, provided that iron(II) is oxidized
beforehand.
· Iron(II) can be oxidized biologically to iron(III) at low pH-values (required as pre-treatment to
limestone neutralization). The rate of iron(II) oxidation is related to the surface area of the support
medium. With plastic medium (specific surface area of 200 m2/m3 a residence time of 18 h is
required for water containing 4 g/l iron(II) (as Fe).
· Sulphate can be reduced from 18 000 mg/l (as SO4) to less than 2 500 mg/l by gypsum
crystallization in a contact reactor (when 300 mg/l magnesium (as Mg) is present). With a fluidized-
bed contactor, a residence time of 2 h is required.
A disadvantage of the three-stage process is that the capital cost turned out to be unacceptably high
as a result of the long residence time of 18 h required for iron(II) oxidation.

17
2.3.7 lntegrated Limestone Neutralization Process
To overcome the disadvantages associated with the long residence time required for iron(II) oxidation
under acidic conditions, the CSIR developed the integrated iron(II) oxidation and limestone
neutralization process.
The integrated neutralization process consists of the following stages:
· Neutralization stage. Discard leachate is treated in a sludge reactor where powder limestone (<200
µm) is dosed (slightly in excess of stoichiometrical requirements) and aeration is applied to achieve
the following:
- Complete neutralization due to limestone dissolution.
- Iron(II) oxidation within a reaction time of 2 h when the plant is operated in sequential batch
mode and less than 5 h under continuous conditions. This is due to the relatively high pH
(greater than 5) obtained after addition of powder limestone to Toe dam water and the resulting
high suspended solids concentration (from reaction products such as gypsum and ferric
hydroxide).
- Gypsum crystallisation to an over-saturation index less than 1.1. The rate of gypsum
crystallization is rapid due to initial high over-saturation level (600%) and high gypsum crystal
concentration in suspension.
· Clarifier. A clarifier is required from which sludge is returned to the neutralization reactor to
maintain a minimum concentration of suspended solids.
Benefits of the integrated neutralization process are:
· A single-stage system is needed for removal of iron(II), acidity and gypsum.
· Sludge of high solids content (50%) is produced.
· Limestone is the most cost-effective alkali.
· It is flexible as both lime or limestone can be used in the same reactor.
· Pilot plant studies showed that discard leachate can be treated effectively in the integrated process
when limestone is used as alkali (Maree, et al., 1998). It was found that:
1. The integrated iron(II) oxidation and limestone neutralization process can be used for the removal

18
of acidity, iron(II), iron(III) and aluminium (less than 2 mg/l (as Al) and sulphate to a level of 2 500
mg/l (as SO4). All reactions take place simultaneously. For water containing 3 g/l iron(II) (as Fe), a
reaction time of 2 h is required when operated in sequencing batch mode and 5 h when operated on
a continuous basis.
2. The rate equation for iron(II) oxidation over the pH range 5 to 6 is influenced by iron(II), oxygen,
hydroxide and suspended solids concentrations, reactor surface area, mixing intensity and
temperature.
3. Sludge with a solids content of more than 50% can be produced with the integrated process.
2.3.8 Biological Iron(II) Oxidation
Both limestone and lime neutralization of acid water is influenced by the ratio of iron(II) to iron(III). If
acid feed water containing more than 200 mg/l iron(II) is treated in the fluidized bed limestone
neutralization process, the limestone particles are coated with a ferric hydroxide layer which prevents
further reaction between acid and limestone, (Maree et al., 1996).
Du Preez and Maree (1994) showed that iron(II) can be oxidized to iron(III) in the presence of
acidophilic iron-oxidizing bacteria, such as Ferrobacillus ferrooxidans, and precipitated as Fe(OH)3 at
pH values greater than 3:
2Fe2+ + ½O2 + 2H+ ⇒ 2Fe3+ + 2H2O (1)
2Fe3+ + 6H2O ⇒ 2Fe(OH)3 + 6H+ (2)
Maree, et al. (1998) showed that:
1. The relationship between rate of iron(II) oxidation and specific surface area is given by the
equation:
-d[Fe2+]/dt = 0.21 x S½
Where S - Surface area
2. Iron(II) (2 g/l) can be oxidized effectively under continuous conditions in a plastic medium filter at
an iron(II) oxidation rate of 2 g Fe/(l.d).
3. Ferric hydroxide precipitates slowly on the plastic medium as a result of the solubility of ferric

19
hydroxide that is exceeded during iron(II) oxidation under acidic conditions.
During lime neutralization in the HDS process, the optimum process configuration is determined by
the chemical composition of the feed water, in particular the ratio of iron(II) to iron(III).
Should the rate of iron(II) oxidation be reduced to less than 1 h, it will benefit both limestone and
lime neutralization. In the case of limestone, coarse particles can be used and not only fine
particles as the case is with the integrated process. In the case of lime neutralization, the preferred
modified HDS process can be used which has a better lime utilization efficiency.
2.3.9 Limestone Properties and its Selection
Limestone is composed primarily of calcium carbonate or combinations of calcium and magnesium
carbonate with varying amounts of impurities, the most common of which are silica and alumina
(Boynton, 1966). Since limestone does not have a constant chemical composition, it is important to
know what characteristics are necessary for a good neutralizing agent. Most limestones are rated by
the producer with regard to their calcium carbonate or calcium carbonate equivalent content. The
higher the CaCO3 content, the greater the alkalinity available and the fewer the impurities. In
comparing pure lime and limestone, it should be noted that when both are compared on the same
basis, such as CaCO3 equivalent, 1 kg of lime has 1,35 times the alkalinity of 1 kg of limestone.
Several investigators have reported that limestone that contains magnesium carbonate in appreciable
quantities reacts very slowly (Jacobs, 1947; Hoak et al., 1945; Ford, 1970). Hoak et al. (1945)
reported that dolomitic limestone's rate of reaction was approximately inversely proportional to the
quantity of magnesium carbonate it contained (above about 2%). Ford (1970) conducted studies with
14 limestones of various compositions by treating both artificial and actual mine drainage and found
that in general the neutralizing efficiency of a stone increased with higher percentages of CaCO3 and
lower percentages of MgCO3, thus, the calcites, CaCO3, were more effective than dolomites or
magnesites. Empirically he established that the efficiency of a limestone can be predicted by the
following equation:

20
Efficiency (%) = CaO + (SA x D)
where: CaO = CaO (as CaCO3) (%)
SA = Surface area (m2/g)
D = Density (g/ml)
A good limestone should have a high neutralizing rate, fast settling sludge, small volume of sludge, and
a sludge with a high solids content. The following factors should thus be considered in the selection of
a limestone:
· high calcium carbonate content,
· low magnesium content,
· low amount of impurities and
· large surface area, i.e. smallest particle size.
After a preliminary screening of the proposed stones by their chemical analysis, a simple laboratory
test is recommended. Twice the stoichiometric amount of limestone of the size to be used is added
to a sample of AMD. The sample is mixed by introducing air. The pH is recorded for 5 h. A pH-time
plot is used to evaluate the limestone.
In addition to the reaction rate, the characteristics of the sludge should also be considered. Three
characteristics of the sludge are important, i.e., settling rate, sludge volume and sludge solids content.
To perform these tests, a sample of the unsettled neutralized AMD is placed in a 1 000 ml graduated
cylinder and the depth of the sludge blanket determined periodically for 2 to 12 h. This data is then
plotted. The final reading is considered the sludge volume, usually expressed as a percent of the total
sample. The supernatant water should then be drained off.
The sludge is then dried and the percentage of solids is calculated.
In addition to the chemical properties of the limestone, the geological history of the stone and its
crystal structure play some role in its neutralization ability. Crystal structure has some bearing on the
surface area of the stone particle. Several investigators have shown that the reaction rate is a function
of the size of the particle (Jacobs, 1947; Hoak et al., 1945; Ford, 1970). The limit on the fineness of
the stone is an economic one. Cost of grinding increases at an accelerating rate as the particle size
decreases. The cheapest small particle size material in mining areas is 'rock dust' of which 60 to 70%

21
passes a 200 mesh. To obtain a smaller size may not be economically viable.
2.4 SLUDGE
Leachate studies need to be carried out to determine the stability of sludge with respect to dissolution
of metal as a function of pH. The sludge produced during neutralization of acid mine water has the
following characteristics:
· Low water permeability, once settled.
· No potential for acid generation. Acid can only be generated from iron or sulphur compounds that
are at a reduced oxidation state, such as FeS2. In FeS2 the oxidation state of Fe is “+2", compared
to its maximum state of “+3", while the oxidation state of S is “-1", compared to its maximum state
of “+6". Sludge produced during lime or limestone neutralization contains no FeS 2, only Fe(OH)3
and CaSO4.2H2O. In the latter case, both Fe and S are at their highest oxidation states, namely
“+3" and “+6" respectively.
· No iron leachate results if the sludge is contacted with rain water as iron(III) only dissolves at pH
values below 3.
It can thus be argued that there is no merit in discharging sludge produced during neutralization of acid
mine water to plastic lined dumps, while the coal discard, which is present in large tonnages and rich in
FeS2, is discharged directly on to the soil.

22
CHAPTER 3 : CHEMICAL AND BIOLOGICAL OXIDATION OF IRON IN
ACID MINE WATER
3.1 INTRODUCTION
A practical method of neutralizing acid mine drainage (AMD) with limestone has been developed and
is being commercially applied in South Africa (Maree et al. 1992). Neutralization of AMD with
limestone requires that ferrous iron, Fe(II), in the water should first be oxidized to Fe(III); otherwise, the
oxidation and hydrolysis will occur downstream of the neutralization plant, producing acidity (Maree et
al. 1998). Iron can be oxidized to Fe(III) chemically and biologically.
Biological oxidation is catalyzed by iron-oxidizing bacteria, such as Thiobacillus ferrooxidans, a
microorganism that lives in acidic conditions (Nemati and Webb 1996). The aim of this study was to
improve Fe(II) oxidation rates by determining the effect of support media, the surface area of the
support medium, the number of iterations, initial Fe(II) concentration, nutrients, CO2, pH, temperature,
air flow/concentration, and hydraulic retention time (HRT) on the rate of Fe(II) oxidation.
3.2 MATERIALS AND METHODS
Batch studies were conducted using a synthetic feed solution containing: 4 000 mg/l Fe(II), 40 mg/l P,
20 mg/l Mg, 30 mg/l N, 8 900 mg/l SO4 and 9 200 mg/l acidity (as CaCO3). Phosphorus and nitrogen
were added in the feed water as nutrients for bacterial growth when operating biological Fe oxidation
batch studies. Limestone from Springs, South Africa was used for neutralization.
During the continuous studies, AMD from the Toe Seep Dam at the Navigation mine site (South Africa,
Witbank) was used as feed water. The Fe (II) concentration was 4.5-5 g/l and the pH was 2.0. Hydroponic nutrients
(Kompel Chemicult products) were added to both the synthetic Fe (II) solution and the coal discard leachate.
Figure 3.1 shows the beaker reactors and stirring mechanisms that were used for the chemical Fe
oxidation studies. The solutions and support media in the beaker reactors were stirred continuously
and aerated at a flow rate of 3l/min with compressed air through diffusers (porosity no. 2, 210 x 8mm
(OD)).
Figure 3.2 shows the rectangular reactor that was used for the biological Fe (II) oxidation studies. The
geotextile sheets used were supported in vertical positions by plastic frames. Compressed air was

23
supplied through diffusers to the reactors at a flow rate of 3l/min for each diffuser.
Different support media (e.g., plastic rings, plastic pellets, coal discard, sand, anthracite, and
geotextile) were tested to study the possible increase in the Fe (II) oxidation rate. The plastic rings were
cut from pipes of approximately 5 mm diameter. The coal discard (particle size 4 mm) was a coal of
inferior quality, obtained from Navigation Mine, and the plastic pellets were made of polyethylene. The
sand that was used as a support medium was normal building sand. The anthracite coal had a particle
size of 2 mm. Geotextile is a fabric made of synthetic material used in road construction and
maintenance. The support media were added into the reactor vessel with the stirring mechanisms. The
geotextile was mounted on a perspex plate.
Figure 3.1 : Set -up for chemical iron oxidation studies
Figure 3.2 : Schematic flow diagram for biological iron oxidation studies
Aeration
Support media + feed water
Pump
Reactor
Aeration
Feed water
Effluent

24
3.2.1 Experimental Procedure
(a) Biological Iron Oxidation
The various reactors were inoculated by adding 5% (vol/vol) AMD from the Navigation Mine to the
water in the reactor vessels. Then:
• The reactor contents were aerated continuously until the Fe (II) was completely oxidized.
• Aeration was then stopped and the appropriate amount of the Fe (III) containing mixture was
replaced with a fresh Fe (II) solution.
• Aeration was restarted and the procedure was repeated.
• Each run was started by mixing treated water from the previous run with feedstock in the ratio
1:1 or 1:4.
• Samples were taken at 30 minutes intervals, filtered and analyzed for Fe (II) concentration and
pH.
(b) Chemical iron oxidation
During the chemical studies, the same procedure was followed as in the biological studies. However,
7.8 g/l CaCO3 was added at the start of each experiment to raise the pH to 6.5 and precipitate
Fe(OH)3 and CaSO4. The effects of support media concentration (0, 50, and 100 g/l pellets) and
increased iterations (1-6) on the chemical oxidation rate were assessed while holding the temperature,
pH, air flow, and initial Fe(II) concentration constant at T = 29 ºC, pH = 6.5, AF = 3 l/min, and Fe(II) =
2 g/l Fe(II), respectively.
3.2.2 Analytical Procedures
Samples (20 ml) were taken at 30 min intervals and filtered through Whatman No 1 filter paper. The
Fe(II) determinations were carried out as described by Vogel (1989). A 691 Metrohm meter was use to
measure pH. The surface areas of the support media were measured using a BET surface area
analyzer (Micromeritics FlowSorb II 2300). Iron oxidation rates were measured at the beginning of the
tests for several different initial concentrations of reactants by calculating the initial slope of the curve
of iron (II) concentration versus time.

25
3.3 RESULTS AND DISCUSSION
Figure 3.3 shows the experimental results after 6 iterations. When the initial slope was calculated for
the graphs in Figure 3.3, the oxidation rates were 48.9, 44.0, and 50.2 g Fe/(l·d) (d = experimental time
in days) using 100, 50, and 0 g/l pellets, respectively. These results showed that the pellets had no significant
effect on the Fe oxidation rates.
Figure 3.3 : Effect of pellets concentration on the iron oxidation rate
Figure 3.4 : Effect of the number of iterations on the iron oxidation rate
Figure 3.4 shows the effect of number of iterations when no support media was used. With one
iteration, the reaction time was 6 h; when the iterations increased (2, 3, 4, 5, and 6 iterations), the
reaction time decreased (from 4, to 3, to 2.5, to 1.5, and 1.5 h, respectively). As the number of
iterations increased, the reaction rates increased from 14.1 to 17.1, 24.6, 29.5, 36.9, and 40.2 g
Fe/(l·d), respectively. This increase in oxidation rate can be ascribed to the increase in CaCO3
0200400600800
1000120014001600180020002200
0.00 2.00 4.00 6.00 8.00
Time (h)
Fe
(II)
co
nc.
(m
g/L
))
It 1 It 2 It 3 It 4 It 5 It 6
0200400600800
1000120014001600180020002200
0.00 1.00 2.00 3.00 4.00
Time (h)
Fe
(II)c
on
c. (m
g/L
))
100 g/l pellets 50 g/l pellets 0 g/l pellets

26
concentration in the reactor and to the suspended solids (Fe(OH)3) and CaSO4) formed, both of which
act as catalysts for the reaction (Maree et al. 1997).
The effect of support media (sand, plastic rings, plastic pellets, coal discard, anthracite, and
geotextile), number of iterations (1-10), geotextile surface area, initial Fe(II) concentration (2 to 20 g/l),
nutrients (2 ml/l hydroponic nutrient), CO2, pH (1.7, 2.0, and temperature (25 to 30 ºC) on the
biological iron oxidation were assessed (Table 1 to 4). Temperature, pH, AF, and the initial Fe (II)
concentration were kept constant at T= 29 ºC, pH = 2.0, AF = 3 l/min, and Fe (II) conc. = 2 g/l respectively,
unless otherwise stated.
Table 3.1 shows the effect of support media on the rate of iron oxidation. It can be noted that the
geotextile was the best support medium, due presumably to the nature of the textile, which accelerated
bacterial adsorption and biofilm formation (a complex, multicellular structure formed when
microorganisms attach or colonize to a surface, Nemati and Webb 1999). Due to the porosity of the
geotextile, air can penetrate easily into the fibers and, due to its texture, the geotextile provides a large
surface area for the bacteria to adhere onto.
Table 3.1 : Effect of the support medium on the rate of iron oxidation
Support media Reaction rate g Fe/(l·d) Control 1.3 Rings 4.1 Pellets 4.7 Coal discard 7.0 Sand 7.7 Anthracite 9.0 Geotextile 18.1
Table 3.2 shows the effect of surface area (using the BET surface analyzer) on the rate of iron
oxidation relative to the number of iterations, when AMD was used as the feed water and geotextile
was used as a support medium. The iron oxidation rate increased with the number of iterations, while
the surface area of the geotextile decreased due to the biofilm formation.
Table 3.3 shows the effect of the initial Fe (II) concentration on the rate of iron oxidation, using artificial
Fe (II)-rich water and geotextile as the support medium. When 2 g/l Fe (II) was used, the oxidation rate
was 5.4 g Fe/(l·d). Further increases in Fe (II) concentration from 4 to 12 g/l increased the oxidation
rates from 9.5 to 27.6 g Fe/(l·d) respectively. Silvermann and Lundgren (1959) reported that the growth
of iron-oxidizing bacteria and its ability to oxidize ferrous iron is significantly influenced by the
concentration of ferrous iron. Similar observations were reported by Kelly and Jones (1978).
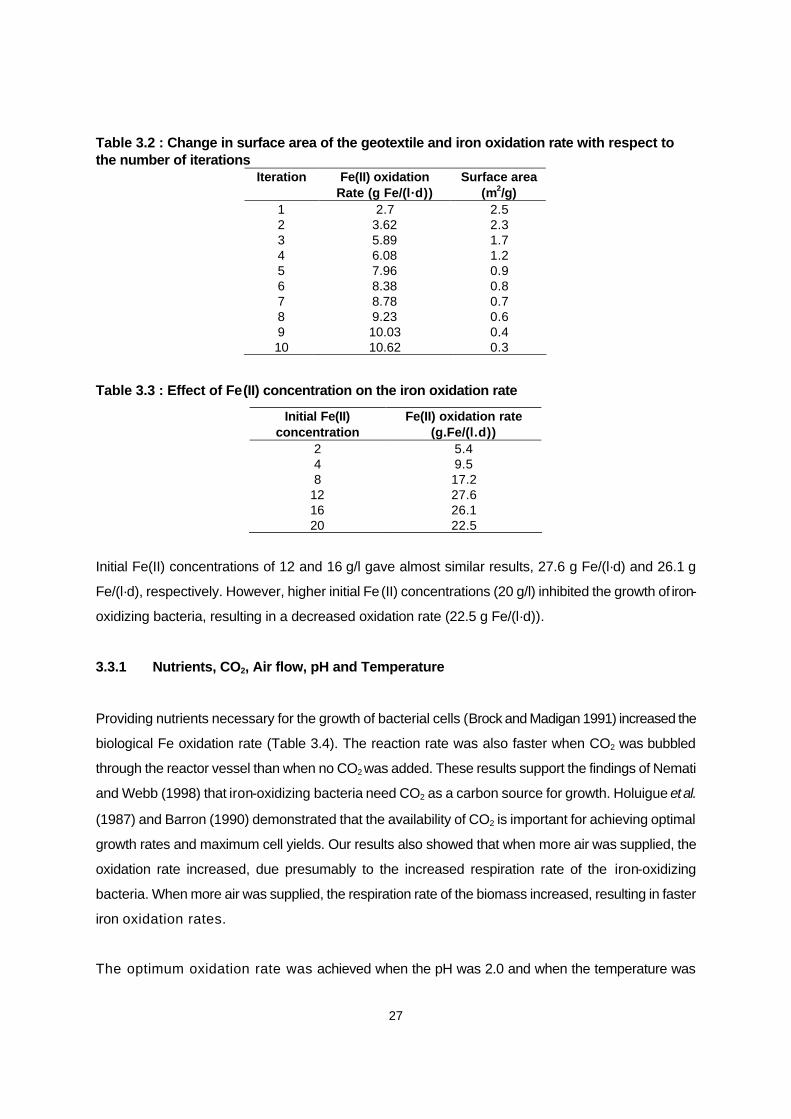
27
Table 3.2 : Change in surface area of the geotextile and iron oxidation rate with respect to the number of iterations
Iteration Fe(II) oxidation Rate (g Fe/(l·d))
Surface area (m2/g)
1 2.7 2.5 2 3.62 2.3 3 5.89 1.7 4 6.08 1.2 5 7.96 0.9 6 8.38 0.8 7 8.78 0.7 8 9.23 0.6 9 10.03 0.4 10 10.62 0.3
Table 3.3 : Effect of Fe (II) concentration on the iron oxidation rate
Initial Fe(II) concentration
Fe(II) oxidation rate (g.Fe/(l.d))
2 5.4 4 9.5 8 17.2
12 27.6 16 26.1 20 22.5
Initial Fe(II) concentrations of 12 and 16 g/l gave almost similar results, 27.6 g Fe/(l·d) and 26.1 g
Fe/(l·d), respectively. However, higher initial Fe (II) concentrations (20 g/l) inhibited the growth of iron-
oxidizing bacteria, resulting in a decreased oxidation rate (22.5 g Fe/(l·d)).
3.3.1 Nutrients, CO2, Air flow, pH and Temperature
Providing nutrients necessary for the growth of bacterial cells (Brock and Madigan 1991) increased the
biological Fe oxidation rate (Table 3.4). The reaction rate was also faster when CO2 was bubbled
through the reactor vessel than when no CO2 was added. These results support the findings of Nemati
and Webb (1998) that iron-oxidizing bacteria need CO2 as a carbon source for growth. Holuigue et al.
(1987) and Barron (1990) demonstrated that the availability of CO2 is important for achieving optimal
growth rates and maximum cell yields. Our results also showed that when more air was supplied, the
oxidation rate increased, due presumably to the increased respiration rate of the iron-oxidizing
bacteria. When more air was supplied, the respiration rate of the biomass increased, resulting in faster
iron oxidation rates.
The optimum oxidation rate was achieved when the pH was 2.0 and when the temperature was

28
29 ºC.
Table 3.4 : Effect of different parameters on the iron oxidation rate
Variables Value Fe (II) oxidation rate (g Fe/(l·d)
Nutrients 0 ml/l 2 ml/l
5.7 8.4
CO2 0% 3%
4.0 6.1
Air flow 3 ml/l 5.6 ml/l 8.9 ml/l
10.0 10.6 13.9
pH 1.7 2.0 2.3
15.4 20.8 11.4
Temperature 25 ºC 26 ºC 27 ºC 29 ºC 30 ºC
6.7 8.3 12.1 15.8 14.7
3.3.2 Continuous Studies
Further studies were carried out to determine process performance under continuous conditions using
AMD as feed water. The results (Table 3.5) show that when support media was used, the highest
oxidation rate was 11.02 g Fe/(l·d); when no support media was used, the highest oxidation rate was
8.30 g Fe/(l·d). It can be concluded that support media are important for the bacteria to adhere onto. It
can also be seen that the optimum HRT for the continuous study was obtained at 8 h when geotextile was used as
a support medium and when nutrients were added. Furthermore, when nutrients were added, the highest
oxidation rate was 12.10 g Fe/(l·d); when no nutrients were added, the oxidation rate was slightly lower
at 11.02 g Fe/(l·d) (Table 3.6).
3.3.3 Kinetic Studies
The data in Table 3.6 show the effect of various factors on the kinetics of biological iron oxidation.
The slopes of the graphs log R versus log (value of variable) show that the rate of iron oxidation is of
order 1, 1, and 0.5 with respect to Fe2+, support media, and O2 concentration, respectively. These
findings suggest that the rate equation for biological iron oxidation should be modified (Maree et al.
1998) for suspensions to:
-d[Fe2+]/dt = k[Fe2+]1.[SM]1.[O2]0.5 (5)

29
where -d[Fe2+]/dt = rate of iron oxidation; k = reaction rate constant; [Fe2+] = ferrous iron concentration;
SM= reactor surface area; and O2 = oxygen concentration.
Table 3.5 : Effect of the support media and nutrients on the iron oxidation rate
Feed rate (l/d)
HRT (h) Fe (II) oxidation rate(g Fe/(l·d)
No support media
Brown geotextile
Nutrients (2ml/l) & Geotextile
15 24.0 4.20 4.20 4.08 20 18.0 6.01 6.37 6.48 25 14.4 7.12 7.33 7.45 30 12.0 7.60 8.66 8.60 40 9.0 8.34 10.98 12.02 45 8.0 8.30 11.02 12.10 50 7.2 5.02 8.46 11.03 55 6.5 4.56 7.37 9.40 65 5.5 3.25 6.35 7.82
Other experimental parameters: Fe(II) concentration of the coal discard leachate varied from 4.5 to
4.8 g/l, pH = 2.0, temperature = 29 0C and air flow = 3 l/min
Table 3.6 : Effect of various factors on the kinetics of biological iron oxidation
Variable Conc. Rate (g Fe/(l·d))
Log C* Log R* Rxn order
Fe (II) (g/l)
2 4 8
12 16
5.4 9.5
17.2 27.6 26.1
0.30 0.60 0.90 1.08 1.20
0.73 0.98 1.24 1.44 1.42
1
Support media (m2/m3)
5 10 19
4.1 7.2
10.2
0.70 1.00 1.28
0.61 0.86 1.01
1
O2(in air) (mg/l)
0.05 0.5 1.0
7.8 9.5
13.5
-1.301 -0.30
0
0.89 0.98 1.14
0.5
*C = Fe (II) concentration; Type of support media = geotextile; *R = Iron oxidation rate; pH = 2.0; temperature = 29 0C
3.3.4 Conclusions
The chemical iron oxidation rate, conducted with an initial pH of 6.5, was increased by: the addition of
CaCO3, increasing the number of iterations, and increasing the level of suspended Fe(OH)3 and
CaSO4, which acted as catalysts in the reactor vessel. The addition of support medium did not
have a significant effect.

30
The biological iron oxidation rate was increased by: the addition of support media, an increase in support
media concentration, an increase in Fe (II) concentration, an increase in the number of iterations, the addition of
nutrients, the addition of CO2, and increased air flow. Optimum iron oxidation rates were obtained at: pH = 2,
temperature = 29°C, HRT = 8 h, Fe(II) concentration = 16 g/l, and when geotextile was used as support media.

31
CHAPTER 4 : BIOLOGICAL IRON(II) OXIDATION AS PRETREATMENT
TO LIMESTONE NEUTRALIZATION
4.1 INTRODUCTION
Laboratory and pilot plant studies showed that the limestone neutralization process is significantly
impaired by the presence of iron(II) (Maree and du Plessis, 1993; Van Tonder and Schutte, 1997).
Laboratory and pilot plant studies (Maree et al., 1997) further showed that limestone neutralization
takes place effectively (at acceptable reaction rates and limestone utilization levels), if biological
pre-oxidation (at low pH) of iron(II) to iron(III) is implemented (Equation 1). It was further found that the
biological iron(II) oxidation rate is related to the surface area available for bacterial growth (Maree et
al.,1998a).
Fe2+
+ ¼O2 + H+ ? Fe
3+ + ½H
2O (1)
Nemati and Webb (1996) showed that biological iron(II) oxidation rates of up to 822 g Fe/(l.d) could be
attained with polyurethane foam as biomass support medium (at a temperature of 30 °C, feed and
effluent iron(II) concentrations of 5 g/l and 3 g/l, respectively). It was further found that high iron(II)
concentrations (20 g/l) gave lower oxidation rates, indicating an inhibitory effect on the growth and
activity of Thiobacillus ferrooxidans at these concentrations. Nemati and Webb (1997) further
investigated the effect of reaction temperature on the biological iron(II) oxidation rate and found a
significantly higher oxidation rate at 30 °C (maximum of 31.7 g Fe/(l.d)) compared to that at 20 °C
(maximum of 21.5 g Fe/(l.d)). The performance of the system was also considerably less stable for
the latter temperature. These studies evaluated biological iron(II) oxidation in the presence of relatively
high iron(II) concentrations. However, beaker studies (van Tonder, 1997) indicated that the iron(II)
concentration needs to be less than 100 mg/l for 80% limestone utilization. To facilitate effective
limestone neutralization, biological iron(II) oxidation at low iron(II) concentrations therefore needs to be
optimized.
The aims of this investigation were to:
· Determine the effect of various parameters on biological iron(II) oxidation kinetics, including the
oxygen transfer, iron(II) concentration, support medium surface area, type of support medium, and
flow regime;

32
· Identify the most cost-effective support medium and reactor configuration. Such a configuration
needs to provide a consistent low effluent iron(II) concentration, which is a requirement for effective
limestone neutralization.
4.2 MATERIALS AND METHODS
4.2.1 Feed Solution
Artificial mine water was used as feed. The solution was prepared by dissolving the following
ingredients (concentrations in g/l given in brackets) in tap water: FeSO4.7H
2O (15.04), KH
2PO
4 (0.18),
MgSO4.7H
2O (0.23), (NH
4)2SO
4 (0.23) and H
2SO
4 (2.04).
4.2.2 Reactor Configurations
Two different reactor configurations were used in the investigation:
· Reciprocating disc-pack reactor (Figure 4.1): PVC medium (Table 4.2, medium A or B) was
reciprocated up and down, into and out of the reaction solution using a pneumatic cylinder. The
reactor volume was 5.0 l .
· Submersed packed-column reactors (Figure 4.2): Reaction solution was recycled through a silica
sand/gravel bed (Table 4.2, media C to G). Air was introduced at the bottom of the packing.
Different systems (column and recycle sump) were used with volumes of 1.8, 2.5 and 3.0 l. Oxygen
for oxidation was supplied by bubbling air or pure oxygen through the submersed packing.
Controlbox
Pneumaticcylinder
Reciprocatingpacking(PVC discs)
Reactortank
Compressed air
Electrical power
Figure 4.1 : Reciprocating disc-pack reactor

33
Air/Oxygen
Recyclesump
Recyclepump
Submersedpacked bedcolumn
Figure 4.2 : Submersed packed-column reactor
4.2.3 Media
The media used were PVC discs and various grades of silica sand (Table 4.2). The sand media’s
specific surface areas were estimated by a salt solution retention method: The amount of salt solution
retained on a known amount of medium (subsequent to submersion of the medium in the salt solution
and allowing it to drain freely) is proportional to the surface area of the medium. Salt retention was
measured by the change in the conductivity of a known amount of distilled water, when the medium
with the drained medium was submersed in the distilled water. A calibration curve was developed for a
medium with known surface area, and used to calculate the surface area of the irregular sand medium
from salt retention readings.
4.2.4 Operation Procudure
Reactors were operated both in batch and continuous mode. For batch tests the reactor (with packing)
was filled with an iron(II) stock solution. Time measurement commenced with the initiation of recycling
and aeration. The reactor content (i.e. reaction solution) was analyzed at periodic intervals (e.g. 2 or 4
hourly) for iron(II) concentration. The ambient air and reaction solution temperatures were monitored.
The experimental run was terminated when the reaction solution iron(II) concentration was below 30
mg/l. For bacterial acclimatisation, at least five runs (repetitions) were required before the iron(II)
oxidation rate stabilised at a maximum value. Only the packed-column reactor was operated
continuously and the feed water was introduced to the reactor system on the suction side of the
recycle pump (dotted arrows in Figure 4.2). The treated effluent overflowed from the recycle sump.

34
The recycle sump contents (i.e. effluent) was analyzed at periodic intervals (e.g. 4 hourly) for iron(II)
concentration. The ambient air and reaction solution temperatures were monitored.
4.2.5 Analyses
Iron(II) was determined by titration with potassium permanganate (Vogel, 1989).
4.3 RESULTS AND DISCUSSION
4.3.1 Kinetics
The effect of various parameters on the rate of iron(II) oxidation was determined in batch runs using
the reciprocating disc-pack reactor. Maree et al. (1998b) showed that the rate equation proposed by
Stumm and Lee (1961) in the absence of micro-organisms for clear solutions, should be adapted to
include a surface-related term for solid suspensions, to take the form:
db2
ba A]O[]OH[)]II(Fe[kdt
)]II(Fe[d −=− (2)
Where, [Fe(II)] = iron(II) concentration, [OH-] = hydroxide concentration, [O2] = oxygen
concentration/partial pressure, A = suspended solids surface area, and a, b, c & d = reaction order
constants. The biological iron(II) oxidation kinetics in the disc-pack reactor was analyzed according to
a rate equation of similar form:
cbf
a AR)]II(Fe[kdt
)]II(Fe[d=− (3)
Where, Rf denotes the reciprocating frequency (in cycles per minute), [Fe(II)] denotes the iron(II)
concentration (in mg/l), A denotes the disc-pack surface area (m2) and a, b & c denotes reaction order
constants. The reciprocating frequency gives a measure of the oxygenation intensity.
The reaction order constants were calculated from the slope of the log(rate) against log(variable)
regression line, when one variable was varied between a number of batch runs (Table 4.1).

35
Table 4.1 : Effect of various parameters on the kinetics of iron(II) oxidation (feed iron(II) concentration = 3 g/l , pH = 2 and temperature = 25 °C)
Parameter Value Rate g Fe/(l.d)
log(value) log(rate) Reaction order constant
Iron(II) concentration, mg/l
1.0 3.0 5.0 9.0
16.69 27.05 38.40 39.31
0.00 0.30 0.48 0.70
1.22 1.43 1.58 1.59
a = 0.41
(0.5)
Reciprocating frequency (R
f),
cycles/min
2.50
1.67 0.83
49.97
42.09 31.27
0.40
0.22 - 0.08
1.70
1.62 1.50
b = 0.43 (0.5)
Surface area (A), m
2
2.54 1.90 1.27 0.64
49.86 38.10 26.54 10.46
0.40 0.28 0.10
- 0.20
1.70 1.58 1.42 1.02
c = 1.13
(1.0)
4.3.2 Support Media
Table 4.2 shows the reaction rates obtained for the various media. From these results it is noted that
lower iron(II) oxidation rates were obtained with the finer particulate media (C, E and F), than with the
coarser media (D and G) notwithstanding the large surface areas of the fine media. The low reaction
rates obtained with the finer media are ascribed to poor liquid distribution in these media. The small
openings between the particles were rapidly blocked by biofilm and precipitate, causing channelling of
the water through the bed.
The relative high reaction rates that were obtained for media A and B was the result of optimum
mixing, contact and flow distribution that was obtained by using the reciprocating PVC disc-pack
set-up.

36
Table 4.2 : Iron(II) oxidation rate with various support media (1 USD = S.A. R6; initial iron(II) concentration = 3 g/l ; temperature = 25 °C; pH = 2)
Description
Specific surface area,
m2/m
3
Medium cost,
R/m3
Column upflow
velocity¶, m/h
Iron(II) oxidation rate,
g Fe/(l medium.d)
A 2 mm spaced PVC discs (1 mm thick) 630 5000 Disc-pack 23
B 12 mm spaced corrugated PVC (0.1mm thick) 373 560 Disc-pack 10.5
C Silica filtersand: 0.6 mm mean particle size 17300 800 9.6 7.1
D Silica filtersand: 6 mm silica particle size 2100 850 17.7 15.0
E Low grade silica sand: particle size < 2 mm 12500 80 10.6 7.4
F Low grade silica sand: particle size: 2.8 to 3.35 mm 7900 100 4.9 8.5
G Low grade silica sand: particle size: 4.75 to 6.35 mm 1200 100 10.6 9.4
Note: Media A and B were evaluated in the disc-pack unit, while the sand media were evaluated in the
submersed-column unit. The upflow velocity is based on the recycle flow rate and empty column
cross-sectional area.
4.3.3 Upflow Velocity
Figure 4.3 shows the iron(II) removal rate for medium G at various upflow velocities and oxygen
concentrations. The iron(II) oxidation rate increased from 9.0 to 12.8 g Fe/(l medium.d) between runs
9 and 10 (Figure 4.3) when the upflow velocity was increased from 10.6 to 21.5 m/h. The oxidation
rate therefore increased by a factor of 1.4 for an increase of the upflow velocity by a factor of 2, which
constitutes a relative gain of 70%.

37
Figure 4.3 : Effect of upflow velocity and oxygen concentration for medium G at 24 °C (initial iron(II) concentration = 3 g/l ; pH = 2)
4.3.4 Effect of Oxygen Concentration
Figure 4.3 further shows that the iron(II) oxidation rate increased from 12.8 to 21.7 g Fe/(l medium.d)
when the oxygen concentration of the gas bubbled through the medium in the submersed
packed-column reactor increased from 21 to 100%(v/v). According to Henry’s law the saturation
concentration of oxygen in solution is proportional to the oxygen concentration in the gas phase. The
rate of oxygen mass transfer is further proportional to the difference between the solution oxygen
concentration and the saturation concentration of oxygen in solution. The results obtained therefore
indicate that the dissolved oxygen concentration in the reaction solution increased as a result of the
change from air to pure oxygen. Oxygen transfer is therefore not rate limiting.
4.3.5 Continuous Operation
The performance of the submersed packed column with medium G is shown in Figure 4.4. In Figure
4.4 it was noted that:
0
5
10
15
20
25
30
Rat
e; g
Fe/
(l sa
nd.d
) &
Upf
low
; m/h
1200
1400
1600
1800
2000
2200
2400
Ave
rage
iron
(II)
con
c, m
g/l
0 5 10 15 20 25 Experimental run
Upflow Oxidation rate
Air Oxygen
0
20
40
60
80
100
Load
& R
emov
al r
ate;
g F
e/(l
med
ia.d
)
0
200
400
600
800
1000
Eff
Fe(
II) c
onc;
mg/
l & U
pflo
w; m
m/m
in
0 20 40 60 80 100 120 140 160 Elapsed time; h
Load Effluent concentration
Removal rate Upflow velocity
Increase O2
feed rate

38
Figure 4.4 : Iron(II) oxidation in a submersed packed-bed column reactor under continuous operation (medium G; feed iron(II) concentration = 3 g/l ; temperature = 24 °C; pure oxygen and pH = 2)
At low loading rates of 20 g Fe/(l.d) most of the iron(II) was oxidized giving effluent concentrations of
less than 60 mg/l iron(II). At 92 hours of operation the loading rate was increased to 62 g Fe/(l.d),
which resulted in the removal rate increasing to 53 g Fe/(l.d). To improve performance even further,
the upflow velocity was increased to 45 m/h (at 120 hours of operation) with concomittant increase in
removal rate to 58 g Fe/(l.d). At 143 hours of operation the oxygen feed rate was increased from 100
to 300 g O2/d, with a concomitant increase of iron(II) removal to 74 g Fe/(l.d) and effluent iron(II)
concentration of 300 mg/l .
This rate is significantly lower than that obtained by Nemati and Webb (1996) of 822 g Fe/(l.d) at an
effluent iron(II) concentration of 3000 mg/l with polyurethane medium (at 30 °C). However, if the
concentration effect is taken in account according to Equation 2, and the temperature effect is
accounted for (Nemati and Webb, 1997), the adapted rate for the sand medium would be 295 g
Fe/(l.d) {74.(3000/300)0.5
(1.26)}. The Arrhenius equation was used for temperature adaption and the
activation energy was estimated from the maximum rates obtained by Nemati and Webb at
temperatures of 20 and 30 °C.
0
20
40
60
80
100 Lo
ad &
Rem
oval
rat
e; g
Fe/
(l m
edia
.d)
0
200
400
600
800
1000
Eff
Fe(
II) c
onc;
mg/
l & U
pflo
w; m
m/m
in
0 20 40 60 80 100 120 140 160 Elapsed time; h
Load Effluent concentration
Removal rate Upflow velocity
Increase O2
feed rate

39
4.3.6 General
Factors that need to be taken into account in addition to rate considerations in the evaluation of
various biological iron(II) oxidation options as pre-treatment prior to limestone neutralization of acid
mine drainage, include the medium cost, reactor cost and the effluent iron(II) concentration. If the
media in Table 4.2 are compared on a rate per cost basis, then media A, B, D and G give values of
4.6; 18.8; 17.6 and 94 g Fe/(R.d). Medium G (silica sand with particle size of 4.75 to 6.35 mm) is
therefore the most cost-effective. To obtain both high oxidation rates as well as low effluent iron(II)
concentrations, a plug-flow type of system would be needed: for example, two or three submersed
packed-column reactors can be linked in series.
4.4 CONCLUSIONS
1. The kinetics of biological iron(II) oxidation was determined in a reciprocating disc-pack reactor to
follow the rate equation.
2. A relative gain of 70% in oxygenation rate was obtained by increasing the flow velocity through the
medium.
3. The reaction rate was improved by using pure oxygen rather than air. However, the oxygenation is
not rate limiting.
4. Silica sand medium (particle size of 4.75 to 6.35 mm, medium G) proved to be the most
cost-effective giving a rate per cost value of 94 g Fe/(R.d).
5. A biological iron(II) oxidation rate of 74 g/(l medium.d) and effluent iron(II) concentration of 300
mg/l has been attained in a continuously operated submersed packed-column reactor (at a feed
iron(II) concentration of 3000 mg/l and 24 °C). An effluent iron(II) concentration of below 60 mg/l
can be attained at a loading rate of 20 g/(l medium.d) under the same conditions. The medium
used was silica sand (particle size of 4.75 to 6.35 mm). The low cost of the medium and relatively
high oxidation rates at low effluent iron(II) concentration, would facilitate cost-effective
pre-treatment of acid mine drainage for limestone neutralization.

40
CHAPTER 5 : INTEGRATED PROCESS FOR LIMESTONE
NEUTRALIZATION OF ACIDIC EFFLUENT AND METAL AND PARTIAL
SULPHATE REMOVAL
5.1 INTRODUCTION
For treatment of iron(II)-rich water, a multiple-stage limestone neutralization system is required. The
expected capital cost of such a system is unacceptably high as a result of the long residence time
required for iron(II) oxidation. The integrated iron(II) oxidation and limestone neutralization process
was developed to overcome these disadvantages.
An integrated neutralization process consists of a neutralization reactor and a clarifier. Discard
leachate is treated in an aerated sludge reactor into which powder limestone (<200 µm) is dosed to a
level slightly in excess of stoichiometrical requirements. Iron(II) oxidation is achieved within 2 h when
the plant is operated in sequential batch mode and within 5 h under continuous conditions. Gypsum
crystallises to an over-saturation index less than 1.1. The clarifier is required to return sludge to the
neutralization reactor to maintain a minimum concentration of suspended solids.
The objectives of this investigation were to determine the quality of treated water and sludge solids
content when discard leachate is neutralized with the integrated iron(II) oxidation and limestone
neutralization process to determine the economic feasibility of the process and to obtain design
criteria for full-scale implementation.
5.2 MATERIALS AND METHODS
5.2.1 Feedstock
A synthetic solution, similar to leachate from a waste coal dump, was used as feed water. The
solution contained 4 000 mg/l Fe(II), 40 mg/l P, 20 mg/l Mg, 30 mg/l N, 8 900 mg/l SO4 and 9 200
mg/l acidity (as CaCO3). Limestone from Rustenburg and sodium hydroxide were used for
neutralization.

41
5.2.2 Batch Studies in Beakers
Batch studies were conducted in 0.5, 1.0, 2.0 and 5.0 l beakers at atmospheric pressure to determine
the rate of iron(II) oxidation and neutralization. The specific surface areas of the beakers were 58.1,
46.2, 36.8 and 27.3 m2/m3 respectively. The following steps were followed:
Each batch test was started by mixing the treated contents from the previous batch with the synthetic
feed, in a ratio varying from 1:1 to 1:4. An excess amount of CaCO3 (up to 40%) was applied over
the amount required to ensure complete iron(II) oxidation to iron(III) and precipitation of the latter as
Fe(OH)3. NaOH additions were made as required to maintain the pH at a specific value when the
influence of pH was determined.
The reactor contents was aerated continuously. Filtered samples were taken regularly and analyzed
for iron(II), oxygen, acidity, sulphate and pH.
Aeration was stopped when the iron(II) was completely oxidized to iron(III), whereafter the appropriate
Amount of the iron(III)-containing mixture was replaced with a fresh iron(II) solution.
Aeration was restarted and the procedure described above repeated.
5.2.3 Batch and Continuous Studies on Pilot Scale
A pilot plant (Figure 5.1 and Table 5.1) consisting of a fluidized-bed reactor and a sludge separator
was used for batch and continuous studies. During batch studies water was recycled through a
fluidized-bed consisting of slimes/limestone/gypsum and during continuous studies through both the
fluidized-bed reactor and the sludge separator. The purpose of the sludge separator during continuous
operation was to prevent wash-out of support medium in an uncontrolled manner. Compressed air
was used for iron(II) oxidation.
5.2.4 Analytical
Samples were collected regularly and filtered through Whatman No 1 filter paper. Sulphate, acidity and
pH determinations were carried out manually according to procedures described in Standard Methods
(APHA, 1985), and iron(II) as described in Vogel (1989). Calcium was analyzed using atomic
absorption spectrophotometry. Acidity was determined by titrating the solution to pH 8.3 using
NaOH.

42
P1 - Feed pump; P2 - Recycle pump; V1, V2, V3 & V4 - Valves
Figure 5.1 : Schematic diagram of integrated iron(II) oxidation/limestone neutralization pilot plant.
Table 5.1 : Dimensions of pilot plant.
Parameter Value Fluidized-bed Solids separation
Feed rate (l/h) Recycle (l/h)
24 200
Diameter (m) Water height (m) Specific surface area (m2/m3) Upflow velocity (m/h) Residence time (h)
0.20 4.99 20.2 6.37 6.53
0.53 0.35
- 0.91 3.22
5.3 RESULTS AND DISCUSSION
5.3.1 Water Quality
Limestone can be used in the integrated process for treatment of acid water. Table 5.2 shows the
results when synthetic discard leachate was treated with limestone. The water was neutralized
effectively and sulphate was reduced from 8 342 to 1 969 mg/l (as SO4).

43
5.3.2 Kinetics
Stumm and Lee (1961) determined the following relationship between the iron(II) oxidation rate and pH
in the absence of micro-organisms for clear solutions (Equation 1).
-d[Fe(II)]/dt = k[Fe(II)][OH-]2PO2 (1)
where
-d[Fe(II)]/dt - rate of iron(II) oxidation;
k - reaction rate constant;
[Fe(II)] - iron(II) concentration (moles/l);
[OH-] - hydroxide concentration (moles/l);
PO2 - partial pressure of oxygen (mm Hg).
Table 5.2 : Chemical composition of feed and treated water (in mg/l where applicable) when synthetic discard leachate was treated with limestone
It appears that iron(II) oxidation occurs either at pH levels less than 4 when catalyzed by bacterial
activity, or at pH values greater than 6 through chemical oxidation. Maree et al. (1987) showed that
the rate of chemical iron(II) oxidation is also catalyzed by suspended solids. The result is that the
lower limit of the pH range where the rate of chemical oxidation is fast enough for practical application
is reduced from 6.5 to 5.0. The integrated iron(II) oxidation and limestone neutralization process is
based on this finding as limestone can raise the pH of iron(II)-rich water to between 5 and 6.
Volumetric iron(II) oxidation rates exceeding 100 g/(l.d) were achieved when artificial acid mine water
Feed (Synthetic discard
leachate)
Treated (Limestone)
pH Acidity (as CaCO3) Sulphate Ortho phosphate (as P) Chloride Iron(II) Total iron Aluminium Manganese Magnesium Calcium Sodium
1.8
7 300 8 342
2.9 27
2 500 2 500 6.8
15.7 35 40
25.2
6.6 100
1 969
0.0 30 56 56 7.3 21.8 45 682 29.5
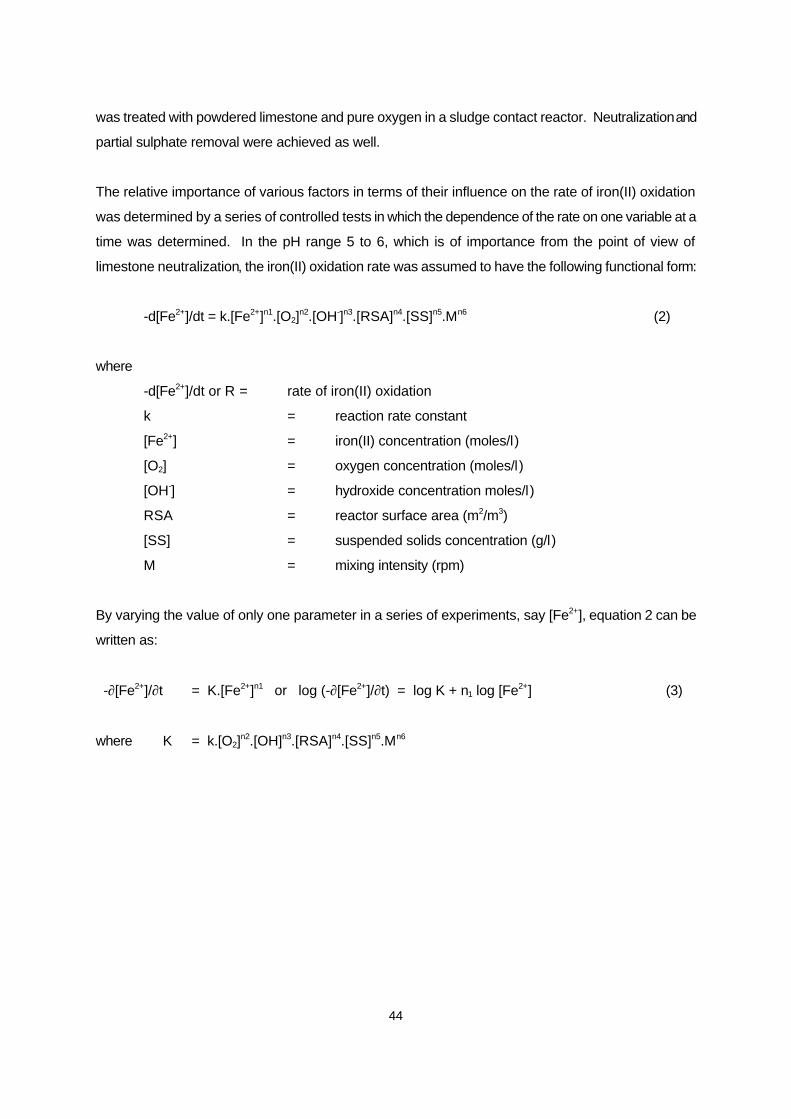
44
was treated with powdered limestone and pure oxygen in a sludge contact reactor. Neutralization and
partial sulphate removal were achieved as well.
The relative importance of various factors in terms of their influence on the rate of iron(II) oxidation
was determined by a series of controlled tests in which the dependence of the rate on one variable at a
time was determined. In the pH range 5 to 6, which is of importance from the point of view of
limestone neutralization, the iron(II) oxidation rate was assumed to have the following functional form:
-d[Fe2+]/dt = k.[Fe2+]n1.[O2]n2.[OH-]n3.[RSA]n4.[SS]n5.Mn6 (2)
where
-d[Fe2+]/dt or R = rate of iron(II) oxidation
k = reaction rate constant
[Fe2+] = iron(II) concentration (moles/l)
[O2] = oxygen concentration (moles/l)
[OH-] = hydroxide concentration moles/l)
RSA = reactor surface area (m2/m3)
[SS] = suspended solids concentration (g/l)
M = mixing intensity (rpm)
By varying the value of only one parameter in a series of experiments, say [Fe2+], equation 2 can be
written as:
-∂[Fe2+]/∂t = K.[Fe2+]n1 or log (-∂[Fe2+]/∂t) = log K + n1 log [Fe2+] (3)
where K = k.[O2]n2.[OH]n3.[RSA]n4.[SS]n5.Mn6

45
Table 5.3 : Effect of various factors on the kinetics of iron(II) oxidation
Exp No Variable Value
Rate g Fe/(l .d)
Log C Log R Reaction order
1. pH (no bacteria)
4.50 5.00 5.25 5.50
22.56 90.22 229.20 462.44
-9.50 -9.00 -8.75 -8.50
1.35 1.95 2.36 2.67
1.33
2. pH (with bacteria)
4.50 5.00 5.25 5.50
18.40 93.48 233.24 454.39
-9.50 -9.00 -8.75 -8.50
1.26 1.97 2.37 2.66
1.41
3. Fe(II) (g/l)
0.30 1.00 3.00 10.00
21.72 41.24 82.04 88.46
-0.52 0.00 0.48 1.00
1.34 1.62 1.91 1.95
0.42
4. SS (g/l )
0.00 4.70 12.00 49.30 75.20 152.00 328.10
30.36 42.93 53.15 66.07 129.25 155.75 136.34
0.67 1.08 1.69 1.88 2.18 2.52
1.48 1.63 1.73 1.82 2.11 2.19 2.13
0.37
5. O2 (air) (mg/l )
0.10 0.50 2.00 5.00
18.16 30.41 92.79 113.93
-1.00 -0.30 0.30 0.70
1.26 1.48 1.97 2.06
0.51
6. Stirring (rpm)
20 150
50.83 120.25
1.30 2.18
1.71 2.08
0.43
7. Stirring (pure O2)
(rpm)
50 150 300
80.09 136.92 163.73
1.70 2.18 2.48
1.90 2.14 2.21
0.41
8. RSA (m2/m3)
58.12 46.13 36.61 26.98
100.18 94.06 84.64 37.57
1.76 1.66 1.56 1.43
2.00 1.97 1.93 1.57
1.25
9. Tempe-rature (0C)
5.0 11.0 18.7 25.0 37.0 45.0
13.56 26.99 48.77 81.94 128.64 147.30
1/T 0.00265 0.00261 0.00256 0.00252 0.00244 0.00240
1.13 1.43 1.69 1.91 2.11 2.17
E (kcal/mole) 21.55
Typical values for various parameters: Iron(II) = 2.8 to 4.7 g/l; CaCO3 = 10 g/l; pH = 4.8 to 6.0; O2 = 1
to 24 mg/l; SS = 94 to 291 g/l; Temperature = 23 to 28 0 C; Bacteria only present in Experiments 1
and 2; Stirring rate = 150 rpm; Reactor volume = 0.5 to 4 l .
The contribution, n1, of iron(II), to the overall reaction rate was determined from the slope of the graph
obtained by plotting log R versus log [Fe2+]. From pH, log R was plotted against log[OH-] ([OH-] = 10pH
- 14). The data in Table 5.3 show that the rate of iron(II) oxidation is of order 0.42 (≈ 0.5), 1.41 (≈ 2),
0.51 (≈ 0.5), 0.37 (≈ 0.5) and 0.43 (≈ 0.5) in respect of Fe2+, OH-, O2 and SS concentrations, and
mixing intensity (M), respectively. The findings suggest that the rate equation as proposed by Stumm
and Lee (1961) for clear solutions, should be modified for suspensions to:

46
-d[Fe2+]/dt = k.[Fe2+]½.[OH-]1.5.[O2]½.[SS]½.M½(4)
Other conclusions to be drawn from Table 5.3 include the following:
· The rate of iron(II) oxidation in suspensions with high concentrations of suspended solids in the pH
range 4.5 to 5.5 is dominated by chemical oxidation. This was concluded from studies where
experiments were carried out on sterilized and unsterilized suspensions respectively (Table 5.3,
Experiments 1 and 2). This finding contradicts that reported by Maree et al. (1997). In the previous
study chemical iron(II) oxidation was studied by using a clear solution (the only solids present was
that which precipitated from solution during iron(II) oxidation and neutralization) and was compared
with biological iron(II) oxidation where solids were present from the start of the experiment (medium
to support bacterial growth). The slower oxidation rates determined for chemical iron(II) oxidation
at pH values between 5 and 5.5 should be ascribed to lower suspended solids concentrations and
not to the absence of bacterial activity.
· In a previous investigation Maree et al. (1997) determined that the rate of iron(II) oxidation in the
pH range 4.5 to 6 is influenced by the reactor surface area (RSA). It was pointed out that this
behaviour is in line with the behaviour of iron(II) oxidation in the pH range 2 to 3 where the rate is
directly proportional to the square root of the medium specific surface area (Maree et al., 1998).
The current investigation, however, shows that chemical iron(II) oxidation in the pH range 4.5 to 6 is
not influenced by the medium specific surface area (RSA), but by the mixing intensity, M. In the
previous investigation the values of RSA and M were varied simultaneously. This happened as
beakers of different sizes were used to provide different RSA values (see Table 5.3, Experiment 8
for the relationship between RSA and beaker volume). Unfortunately, the mixing intensity
decreases when larger beakers are used if the stirring rate is not adjusted accordingly (Table 5.3,
Experiments 6 and 7). The iron(II) oxidation rate increases with increased mixing intensity.
The Arrhenius equation log k = log A - E/(2.303RT) can be used to estimate the value of the reaction
rate k at other temperatures. The amounts E, R and log A have the values 21.55 kcal/mole (activation
energy), 13.70 (a constant) and 1.987 cal mole-1 degree-1 (gas constant) respectively (Table 5.3, Exp
9). A linear relationship was obtained over the range 5 to 25 0C. It is expected that the linear
relationship will fail at higher temperatures as optimum reaction rates are often achieved at 37 0C.
5.3.3 Design Criteria Continuous Operation
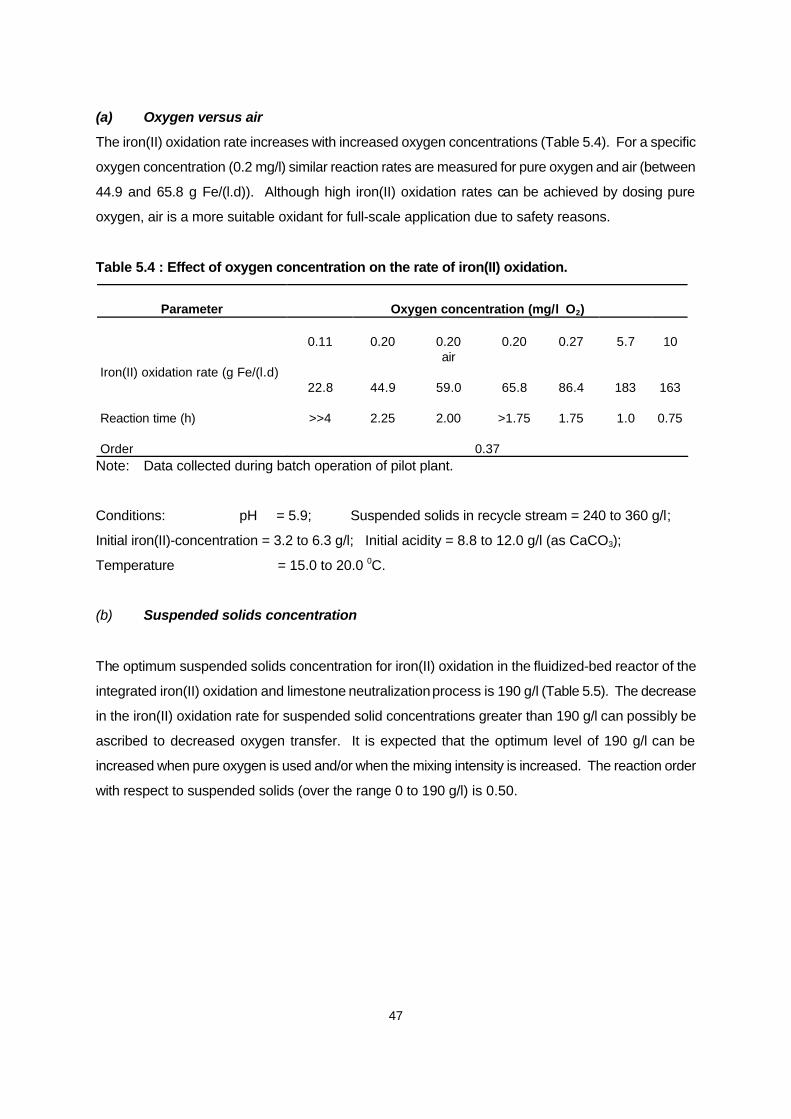
47
(a) Oxygen versus air
The iron(II) oxidation rate increases with increased oxygen concentrations (Table 5.4). For a specific
oxygen concentration (0.2 mg/l) similar reaction rates are measured for pure oxygen and air (between
44.9 and 65.8 g Fe/(l.d)). Although high iron(II) oxidation rates can be achieved by dosing pure
oxygen, air is a more suitable oxidant for full-scale application due to safety reasons.
Table 5.4 : Effect of oxygen concentration on the rate of iron(II) oxidation.
Parameter
Oxygen concentration (mg/l O2)
0.11
0.20
0.20 air
0.20
0.27
5.7
10
Iron(II) oxidation rate (g Fe/(l.d) 22.8
44.9
59.0
65.8
86.4
183
163
Reaction time (h)
>>4
2.25
2.00
>1.75
1.75
1.0
0.75
Order
0.37
Note: Data collected during batch operation of pilot plant.
Conditions: pH = 5.9; Suspended solids in recycle stream = 240 to 360 g/l;
Initial iron(II)-concentration = 3.2 to 6.3 g/l; Initial acidity = 8.8 to 12.0 g/l (as CaCO3);
Temperature = 15.0 to 20.0 0C.
(b) Suspended solids concentration
The optimum suspended solids concentration for iron(II) oxidation in the fluidized-bed reactor of the
integrated iron(II) oxidation and limestone neutralization process is 190 g/l (Table 5.5). The decrease
in the iron(II) oxidation rate for suspended solid concentrations greater than 190 g/l can possibly be
ascribed to decreased oxygen transfer. It is expected that the optimum level of 190 g/l can be
increased when pure oxygen is used and/or when the mixing intensity is increased. The reaction order
with respect to suspended solids (over the range 0 to 190 g/l) is 0.50.

48
Table 5.5 : Effect of suspended solids on the rate of iron(II) oxidation.
Parameter
Suspended solids (g/l)
41.1
91.2
95.6
190
277
462
Iron(II) oxidation rate (g Fe/(l.d)
28.7
38.6
47.7
61.9
42.3
32.3
Order
0.50
Note: Data collected during batch operation of pilot plant.
Conditions: pH of feed = 5.0;
Excess alkali dosage = 41 %;
Initial sulphate concentration = 5.7 to 12.2 g/l; Initial iron(II)-concentration = 2.4 to 5.6 g/l;
Initial acidity = 4.2 to 9.2 g/l (as CaCO3); Temperature = 14.5 to 17.5 0C.
(c) Upflow velocity
Upflow velocity has no influence on the rate of iron(II) oxidation in the range 5 to 45 m/h.
(d) Residence time and mode of operation
A shorter reaction time is required during batch operation than in continuous operation. For the
removal of 4 g/l iron(II) (as Fe) reaction times of 2.0 and 4.5 h are required for continuous and batch
operations respectively (Figure 5.2). The shorter reaction time required during batch operations can
be explained by the iron(II) oxidation rate equation:
-d[Fe2+]/dt = k.[Fe2+]½.[OH-]1.5.[O2]½.[SS]½.M½(5)
The values for O2 and SS are the same for batch and continuous operations. The oxygen level is
controlled at a specific concentration of say 2 mg/l (as O2) while the SS concentration is kept at a high
concentration of say 150 g/l. During continuous operation sludge would be withdrawn continuously to
maintain a specific level. During batch operation the suspended solids will increase during the course
of each batch operation. The increase would, however, be small compared to the initial
concentrations. The values of Fe2+ and OH- during batch operation are, except for the values at the
end of the batch experiment, higher than those measured during continuous operation. As the order of
the latter parameters are greater than 0, the reaction rate increases with increased values for the
parameters mentioned.

49
Figure 5.2 : Comparison between batch and continuous operation during iron(II) oxidation.
Note: Data collected during batch operation of pilot plant.
Conditions: pH of feed = 2.4; Excess alkali dosage = 2 to 20 %; Initial sulphate concentration
= 6.2 to 8.3 g/l; Initial iron(II)-concentration = 2.4 to 4.2 g/l; Initial acidity = 6.88.7 g/l (as
CaCO3); Oxygen = 0.2 mg/l O2; Suspended solids = 200 to 400 g/l; Temperature = 15 to 22 0C.
5.3.4 Sequential Batch Mode Operation
Sequential batch mode operation versus continuous operation of the integrated iron(II) oxidation and
limestone neutralization process offers the benefits of a faster reaction rate and better lime utilization.
The reaction rate is faster due to a greater driving force as a result of high iron(II) concentration in
solution, except for the final period of the reaction. Limestone utilization is better as unused limestone
can be contacted with acid feed water while final treated water can be contacted with fresh limestone
for maximum neutralization.
Figure 5.3 shows the behaviour of the most important parameters for a typical batch operation. It is
noted that iron(II) was removed during consecutive batch operations in less than 2 h at an average rate
of 35 g Fe/(l.d). The experimental conditions were as follows: Temperature = 24 0C and suspended
solids = 250 g/l. The pH was raised from 5.3 to 6.1 or higher while acidity was reduced from 5.6 g/l
(as CaCO3) to 0.3. Sulphate was reduced from 6.6 to 2.2 g/l (as SO4) due to gypsum crystallization.
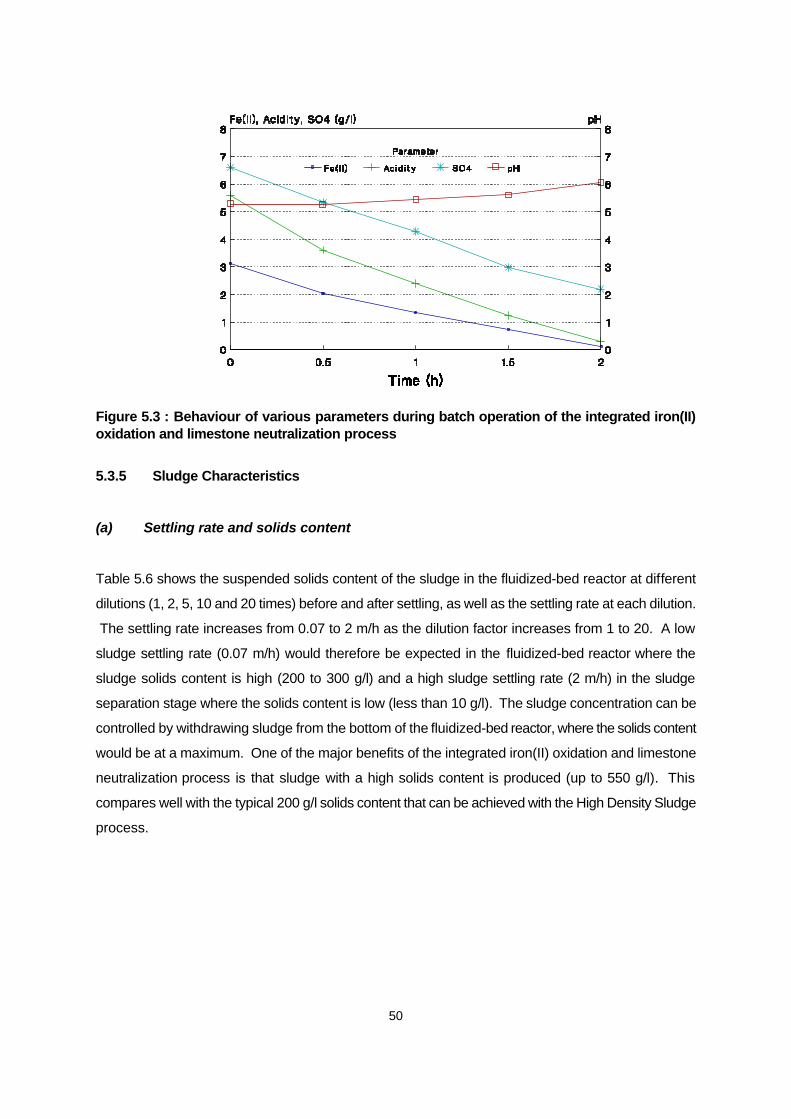
50
Figure 5.3 : Behaviour of various parameters during batch operation of the integrated iron(II) oxidation and limestone neutralization process
5.3.5 Sludge Characteristics
(a) Settling rate and solids content
Table 5.6 shows the suspended solids content of the sludge in the fluidized-bed reactor at different
dilutions (1, 2, 5, 10 and 20 times) before and after settling, as well as the settling rate at each dilution.
The settling rate increases from 0.07 to 2 m/h as the dilution factor increases from 1 to 20. A low
sludge settling rate (0.07 m/h) would therefore be expected in the fluidized-bed reactor where the
sludge solids content is high (200 to 300 g/l) and a high sludge settling rate (2 m/h) in the sludge
separation stage where the solids content is low (less than 10 g/l). The sludge concentration can be
controlled by withdrawing sludge from the bottom of the fluidized-bed reactor, where the solids content
would be at a maximum. One of the major benefits of the integrated iron(II) oxidation and limestone
neutralization process is that sludge with a high solids content is produced (up to 550 g/l). This
compares well with the typical 200 g/l solids content that can be achieved with the High Density Sludge
process.

51
Table 5.6 : Suspended solids content of the sludge at different dilutions (1, 2, 5, 10 and 20 times) before and after settling, as well as the settling rate at each dilution (Exp 11.1)
Parameter
Dilution
1x 2x 5x 10x 20x
Suspended solids before settling
(g/l)
Settling rate (m/h)
619
0.07
595
0.10
165
0.37
59
0.88
16
2.00
(b) Utilization of excess CaCO3 in the waste sludge
Waste sludge withdrawn from the bottom of the fluidized-bed reactor can contain between 0 and 30%
CaCO3 (m/m dry basis), depending on the limestone excess that is applied. If the sludge contains a
significant amount of CaCO3, it might be cost-effective to contact the waste sludge with acid feed
water prior to discharge in order to achieve maximum utilization of the CaCO3. Table 5.7 shows that
70.8% of the CaCO3 content of the waste sludge that was dosed to discard leachate was utilized for
neutralization of acid. The amount of acidity removed was 4.83 g/l (as CaCO3) as a result of CaCO3
dissolution from the waste sludge and 4.75 g/l (as CaCO3) as a result of acidity removed from the
discard leachate.
Table 5.7 : Partial neutralization of discard leachate with CaCO3-rich waste sludge.
Parameter Feed Treated CaCO3-rich waste sludge:
Dosage (ml/l) Suspended solids (g/l) CaCO3-content (%) CaCO3-content (g/l) CaCO3-utilized (g/l) CaCO3-utilized (%) Water composition: Acidity (g/l CaCO3) Acidity removed (g/l CaCO3) pH Iron(II) (g/l Fe) Sulphate (g/l SO4)
50.00 44.02 13.77 6.06
7.75
2.28 3.02 8.27
36.62 4.83 1.77 4.29 70.82
3.00 4.75 6.06 1.59 4.84
5.3.6 Economic Feasibility
The cost figures for the treatment of 1 Ml/d of discard leachate with an acidity of 10 g/l (as CaCO3)
are as follows:
· The estimated alkali cost to treat discard leachate with an acidity of 10 g/l (as CaCO3) is R5.15/m3,
R2.79/m3, R1.37/m3 and R1.95/m3 for slaked lime, unslaked lime, limestone (milled on-site) and

52
limestone (purchased) respectively. The corresponding cost ratios with respect to unslaked lime
are 1.84, 1.00, 0.49 and 0.70. The alkali cost per ton (purity and alkali utilization are shown in
brackets) was based on delivery prices (1999) of R500 (90%, 80%), R360 (90%, 80%), R99.84
(85%, 85%) and R140 (85%, 85%) respectively. The electricity cost for milling of limestone was
calculated to be R9.84/t (30 kW/h x R0.20/kW / 0.61 t/h).
· The capital cost for 1 Ml/d plant remains the same at R1.87 million when the alkali is purchased
and when limestone is milled on-site.
5.4 CONCLUSIONS
The following conclusions were reached:
1. The integrated iron(II) oxidation and limestone neutralization process can be used for the removal
of acidity, iron(II), iron(III), aluminium (to less than 2 mg/l (as Al) and sulphate (to a level of 2 500
mg/l (as SO4)). All reactions take place simultaneously. For water containing 3 g/l iron(II) (as Fe),
a reaction time of 2 h is required when operated in sequencing batch mode and 5 h when operated
on a continuous basis.
2. Sludge with a solids content of more than 50 % can be produced with the integrated process.
3. The estimated alkali cost to treat discard leachate with an acidity of 10 g/l (as CaCO3) is R5.15/m3,
R2.79/m3, R1.37/m3 and R1.95/m3 for slaked lime, unslaked lime, limestone (milled on-site) and
limestone (purchased) respectively.
4. The estimated capital cost for a 1 Ml/d plant remains the same at R1.87 million when the alkali is
purchased and when limestone is milled on-site.

53
CHAPTER 6 : DESIGN OF FULL-SCALE LIMESTONE
NEUTRALIZATION PLANT
6.1 INTRODUCTION
The design of a full-scale iron(II) oxidation / limestone neutralization system for a typical acid mine
drainage is discussed in this Chapter. The design basis used is as follows:
Flow rate: 1.2 Ml/d
Acid water composition:
HCO3- acidity: 4000 mg/l as CaCO3
Iron(II) concentration: 1000 mg Fe/l
Sulphate concentration: 5000 mg SO4/l
The following process design aspects are dealt with:
• Process description
• Plant configuration
• Control philosophy
• Process flow diagram with design calculations
• Equipment list
• Capital cost of the plant
• Running cost of the plant
6.2 PROCESS DESCRIPTION
6.2.1 Limestone Neutralization
The acid feed water is contacted with limestone particles in a fluidized-bed reactor. The limestone
dissolves and neutralizes the acid by the following reaction:
CaCO3 + 2H+(aq) ? Ca2+(aq) + H2O + CO2

54
As a result of this reaction the following side-reactions occurs:
When iron(III) is present, it precipitates due to the high pH level:
2Fe3+(aq) + 3CaCO3 + 3H2O ? 2Fe(OH)3(s) + 3Ca2+(aq) + 3CO2
When acid associated sulphate is present at concentrations above 2000 mg/l it precipitates as
gypsum due to the increased calcium concentration in the water:
Ca2+(aq) + SO42-(aq) + 2H2O ? CaSO4.2H2O(s)
6.2.2 Iron(II) Oxidation
The presence of iron(II) in the acid feed water, does however cause a highly persistent scale to form
on the limestone particles, which impairs limestone dissolution. To overcome this problem, iron(II)
oxidation is needed as pre-treatment to limestone neutralization, for waters that contains more than
100 mg Fe(II)/l .
The iron(II) oxidation reaction takes the following form at low pH:
4Fe2+ + O2 + 4H+ ? 4Fe3+ + 2H2O
The biological iron(II) oxidation reaction is dependent on surface area for bacterial support.
6.3 PLANT CONFIGURATION
A biologically aerated filter (BAF) set-up is used for iron(II) oxidation (Figure 6.1). A low-cost medium
is used to provide a large surface for bacterial support. The filter is operated submersed. Air or
oxygen is bubbled through from the bottom.
A fluidized-bed reactor with a cone at the top has been developed by the CSIR for limestone
neutralization (Figure 6.2). Water/slurry is recycled upward through the reactor column to effect
fluidisation. The top-cone acts as particle separator, preventing loss of limestone to the effluent.
The fluidized-bed configuration has the following benefits:

55
· A limestone concentration of up to 500 g/l can be attained, which provides a large surface area,
and therefore a high reaction rate.
· The fluidisation action causes attrition between particles that helps to prevent or minimize scaling.
6.4 CONTROL PHILOSOPHY
6.4.1 Iron(II) Oxidation
The level in the transfer sump subsequent to the iron(II) oxidation reactor needs to be controlled by
level measurement and changing the feed pump rate to the limestone neutralization column.
Backwash / air scouring of the iron(II) oxidation bed will be performed manually using an arrangement
of valves.
6.4.2 Limestone Neutralization
Limestone feed to the neutralization reactor can be controlled in two ways, dependent on the
characteristics of the limestone:
1. For powder limestone, the limestone is slurried to a specified consistency (using load cells and
level control in the slurry system) and fed to the reactor proportionally to the feed water. The feed
water flow rate are measured and used as control input. The daily manual acidity analysis of the
feed water is used additionally to fine tune the controller (i.e. adapt the controller constant).
2. For particulate limestone, the weight of the limestone bed in the first reactor column is monitored by
load cell and used to control the feed of limestone.
6.5 PROCESS FLOW DIAGRAM AND COSTING
The process flow diagram is given in Figure 6.3, which is supported by design calculations in Table
6.1. Table 6.2 gives the equipment list for this plant (1999 cost figures). The capital and running costs
for this plant are given in Tables 6.3 and 6.4 respectively (1999 cost figures).

56
Figure 6.1 : Iron(II) oxidation reactor.
OOxxyyggeenn
Iron(II) rich water
SSuuppppoorrtt mmeeddiiuumm
CCoommpprreessssoorr
SSeeppaarraattoorr wwaallll

57
Figure 6.2 : Fluidized-bed limestone neutralization reactor
AAcciidd ffeeeedd wwaatteerr
Neutralized effluent
FFBBRR
CCLLAARRIIFFIIEERR
RECYCLE PUMP
Limestone feed

58
DESIGN BASIS:Parameter Value Units
Leachate flow rate 50 kl/h 1.2 Ml/dIron(II) conc. 1.000 g/lAcidity 4.000 g/lSulphate conc. 5.000 g/l
IRON OXIDATION REACTOR (IOR) & EQUIPMENT:Parameter Value Units
Reactor:Pilot run reaction rate/air 11.25 g Fe/(liter reactor.d)Pilot run reaction rate/O2 22.5 g Fe/(liter reactor.d)Reactor volume 106.7 m3
Safety factor 20 %Design volume 128 m3
Dimensions: Height of bed 4.0 m Clear board 0.5 m Reactor height 4.5 m Area of bed 32.0 m² Area per cell 4.0 m² Number of cells 8 Reactor length 11.2 m Reactor width 2.9 mActual reactor volume 144.0 m3
Bed: packing material 179.2 tons R 44 800 (@R250/t)
Equipment:Delivery
Parameter Value UnitsAeration compressor/blower: 238.7 Nkl/h oxidation requirement 7.2 kg O2/h transfer efficiency 10.0 %Feed pump 50 kl/h8 Recycle pump(s): 60.0 kl/h upflow velocity/bed 15 m/h Normal operationLevel-control systemTransfer pump 50 kl/hNutrient feed tank 0.45 m^3 inventory 7.0 daysNutrient tank stirrerNutrient feed pump 2.7 l/h nitrogen requirement 20 g N/h (NH4)2SO4 94 g/h phosphorus requirement 4 g P/h
TABLE 6.1. DESIGN CALCULATIONS for LIMESTONE NEUTRALISATION of TYPICAL ACID MINE WATER at 1.2 Ml/d

59
LIMESTONE NEUTRALISATION REACTOR SYSTEM (LNR) & EQUIPMENT
Reactor:Delivery
Parameter Value UnitsColumn 1: 16.7 m3
reaction time 20 min height to dia ratio 5.5 diameter 1.6 m height 8.6 m specified upflow velocity 200 m/h recycle rate/pump 386 kl/h back-up fluidisation pump 386 kl/hColumn 2: 25.0 m3
reaction time 30 min height to dia ratio 3.5 diameter 2.1 m height 7.3 m specified upflow velocity 40 m/h recycle rate/pump 137 kl/h
Loadcell systemLimestone feed 0.25 t/h limestone utilisation eff. 80.0 %
Limestone silo / dump 30 m3
inventory 7.0 days diameter 5 m height 1.5 mSlurry system 0.25 t/hLimestone slurry consistency 10%Limestone density 2700 kg/m3
Slurry density 1067 kg/m3
Slurry feed rate 2.3 m3/hMake-up water flow rate 2.3 m3/hMOL slurry buffer tank
inventory 0.20 daysvolume 11.2 m3
Amounts Solids density Mass fracFerric hydroxide 1913 mg/l 95.7 kg/h 3400 kg/m3 0.30Gypsum 4479 mg/l 224.0 kg/h 2320 kg/m3 0.70Total: 319.6 kg/h 2564 kg/m3
Slurry consistency 0.64%Slurry density 1004 kg/m3
Slurry flow rate 52.4 m3/h
Effluent sump: 4.4 m3
hydraulic retention time 5 min height 1.7 m diameter 1.8 mEffluent return pump 52.4 m3/h
TABLE 6.1 (continue). DESIGN CALCULATIONS

60
TABLE 6.2. EQUIPMENT SIZING for LIMESTONE NEUTRALISATION of TYPICAL ACID MINE WATER at 1.2 Ml/d
REACTOR TANKSItem description Item type Throughflow HRT Inventory SLR Volume Area Height Diameter Length Width H/D
m3/h h days m/h m3 m2 m m m mFeed sump 50.0 0.08 4.2 1.7 1.8 1.0Iron(II) oxidation reactor square cells 50.0 2.56 144.0
per cell (8 cells) 6.3 18.0 4.0 4.5 2.8 1.4packing material silica gravel 128.0nutrient feed tank 7.0 0.45 2.3 0.5 4.6
Transfer sump 50.0 0.08 4.2 1.7 1.8 1.0Limestone neutralisation col 1 fluidised bed 50.0 0.33 16.7 8.6 1.6 5.5Limestone neutralisation col 2 fluidised bed 50.0 0.50 25.0 7.3 2.1 3.5Limestone hopper 7.0 30.0Limestone MOL tank cylindrical, fb 0.2 11.2 1.6 3.0 0.5Effluent sump 52.4 0.08 4.4 1.7 1.8 0.9
FLUID TRANSPORT EQUIPMENTFlow Gas Solids/O2 Fluid/slurry characteristics
Item description Item type m3/h Nm3/h kg/h Solids Density Viscositytype % kg/m3 kg/(m.s) cP
FeOX feed pump 50.0 noneAeration blower/compressor acid resist. 238.7FeOX recycle pump(s): 8 pumps centrifugal 60 none
Column 1 feed pump centrifugal 50 noneColumn 1 recycle pump + back-up centrifugal 386 LS, Fe(OH)3 slurry 1.00% 1004Column 2 recycle pump + back-up centrifugal 137 LS, Fe(OH)3 slurry 0.64% 1004LS slurry system 250Limestone MOL feed pump centrifugal 2.3 250 Limestone slurry 10.00% 1067Effluent to tailings pump centrifugal 52 LS, Fe(OH)3 slurry 0.64% 1004
SPECIALISED EQUIPMENTItem description Item type Inventory Capacity
days kgLoadcell control instrumentation 25000

61
REACTOR TANKSItem description Item type Cost Power
R kWFeed sump 15 000Iron(II) oxidation reactor square cells 172 800
per cell (8 cells)packing material silica gravel 44 800nutrient feed tank 2 000
Transfer sump 15 000Limestone neutralisation col 1 fluidised bed 41 667Limestone neutralisation col 2 fluidised bed 62 500Limestone hopper 100 000Limestone MOL tank cylindrical, fb 16 867Effluent sump 15 000
FLUID TRANSPORT EQUIPMENT
Item description Item type Cost PowerR kW
FeOX feed pump 34 000 10Aeration blower/compressor acid resist. 50 000 50Oxygen evaporator 10 000 0FeOX recycle pump(s): 8 pumps centrifugal 240 000 80Column 1 feed pump centrifugal 34 000 10Column 1 recycle pump + back-up centrifugal 150 000 75Column 2 recycle pump + back-up centrifugal 100 000 20LS screw feeder / slurry system 50 000 5Limestone MOL feed pump centrifugal 20 000 1Effluent to tailings pump centrifugal 34 000 10
SPECIALISED EQUIPMENTItem description Item type Cost Power
R kWOxygen tank pressure vessel 20 000Loadcell control instrumentation 30 000
BASIC EQUIPMENT COST 1 257 633 261
Piping & valves 20% 251 527Electrical & Instrumentation 10% 125 763Civils 10% 125 763
TOTAL INSTALLATION COST (CAPEX) 1 760 687
TABLE 6.3. CAPITAL COST for LIMESTONE NEUTRALISATION of TYPICAL ACID MINE WATER at 1.2 Ml/d

62
Chemical cost: R/month Limestone (R/month): 27 000 Limestone cost (R/t) 150 Actual limestone requirement (t/d) 6.0Total chemical cost (R/month) 27 000
Other running expenses: R/month Electrical (kW) 161 23 184 (@ R0.2/kWh) Maintenance (10% of EQUIP/a) 10 10 480 Operating labour (3 operators @R4000/month) 4000 12 000Sub-total 45 664
TOTAL OPERATING COST (R/month) 72 664
R/m3 2.02
TABLE 6.4. OPERATING COST for LIMESTONE NEUTRALISATION of TYPICAL ACID MINE WATER at 1.2 Ml/d

63
CHAPTER 7 : LIME NEUTRALIZATION WITH THE MODIFIED HDS PROCESS
7.1 INTRODUCTION
7.1.1 Background
Acid mine drainage (AMD) emanates from active and abandoned mining operations. Pyrite
(FeS2) is found in waste rock of mines. When pyrite is exposed to oxygen and water during or
after mining operations, it is oxidized, resulting in high concentrations iron in acid water
(Equation 1). This poses serious pollution problems.
FeS2 + 3.5O2 + H2O Fe2+ + 2SO42- + 2H+ (1)
(a) Comparing the HDS process with the conventional liming process
The conventional and High Density Sludge (HDS) processes are to date the most suitable
technologies for the treatment of acid water. The flow diagram of the conventional process
(Figure 7.1) explains this neutralization process. The main disadvantage of this process is that
sludge with a low density is produced, resulting in large volumes of sludge that have to be
disposed of.
·
·
Figure 7.1 : The conventional treatment of acid mine water
The main advantage of the HDS process (Figure 7.2) over the conventional lime treatment
process is (Osuchowski, 1992):
Effluent
Clarifier
Neutralization Tank
Lime
Feed water
Waste sludge
Aeration

64
· high density sludge produced – up to 10 times higher than the conventional process.
· less sludge drying facilities and disposal volume requirements, and
· the sludge settles faster, requiring smaller clarifiers
· cost saving implications
Figure 7.2 : The HDS process for treatment of acid mine water.
(b) The HDS process
The HDS process is still the preferred method for neutralization of AMD due to the wide
application of the process and extensive process knowledge available. Where the HDS process
has been installed, industry is reluctant to consider alternatives, due to the capital already
employed. One of the disadvantages of the HDS process is the difficulty to control the process,
especially where there is fluctuations in flow rates and acid concentrations. The clarifier is the
most costly item of a water neutralization plant. It is therefore important to use a process that
produces sludge with high solids contents and high settling rates resulting in a smaller clarifier
and lower disposal volume requirements.
It became thus priority to improve the existing HDS process in order to obtain sludge with higher
densities, better lime utilization, faster settling rates as well as easier operation.
Feed water
Lime
pH control
Waste sludge
Effluent
Recycle sludge Waste sludge
Clarifier
Conditionin
Aeratio
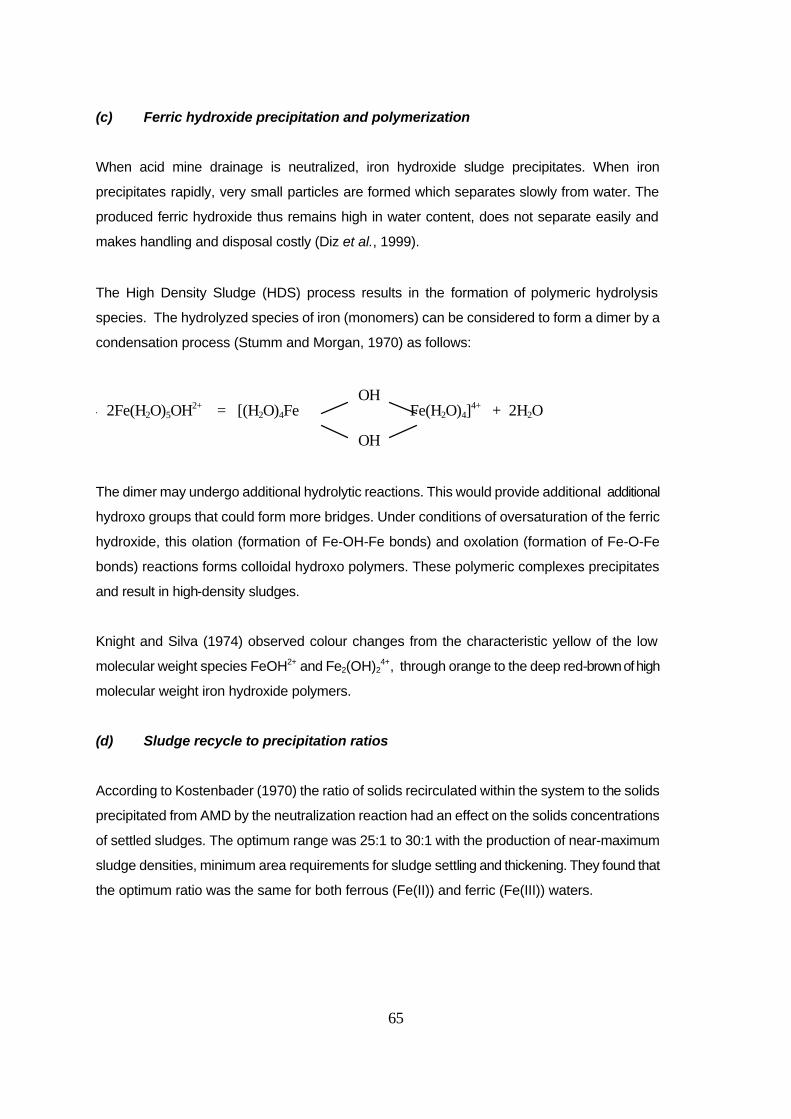
65
(c) Ferric hydroxide precipitation and polymerization
When acid mine drainage is neutralized, iron hydroxide sludge precipitates. When iron
precipitates rapidly, very small particles are formed which separates slowly from water. The
produced ferric hydroxide thus remains high in water content, does not separate easily and
makes handling and disposal costly (Diz et al., 1999).
The High Density Sludge (HDS) process results in the formation of polymeric hydrolysis
species. The hydrolyzed species of iron (monomers) can be considered to form a dimer by a
condensation process (Stumm and Morgan, 1970) as follows:
The dimer may undergo additional hydrolytic reactions. This would provide
The dimer may undergo additional hydrolytic reactions. This would provide additional additional
hydroxo groups that could form more bridges. Under conditions of oversaturation of the ferric
hydroxide, this olation (formation of Fe-OH-Fe bonds) and oxolation (formation of Fe-O-Fe
bonds) reactions forms colloidal hydroxo polymers. These polymeric complexes precipitates
and result in high-density sludges.
Knight and Silva (1974) observed colour changes from the characteristic yellow of the low
molecular weight species FeOH2+ and Fe2(OH)24+, through orange to the deep red-brown of high
molecular weight iron hydroxide polymers.
(d) Sludge recycle to precipitation ratios
According to Kostenbader (1970) the ratio of solids recirculated within the system to the solids
precipitated from AMD by the neutralization reaction had an effect on the solids concentrations
of settled sludges. The optimum range was 25:1 to 30:1 with the production of near-maximum
sludge densities, minimum area requirements for sludge settling and thickening. They found that
the optimum ratio was the same for both ferrous (Fe(II)) and ferric (Fe(III)) waters.
2Fe(H2O)5OH2+ = [(H2O)4Fe Fe(H2O)4]4+ + 2H2O
OH
OH

66
(e) Settling rates
Experiments, conducted by Diz et al. on AMD to investigate the behaviour of ferric iron
solutions after bicarbonate addition, concluded that the time needed for iron precipitation is a
function of pH and iron and sulphate concentrations. Increasing sulphate concentrations
increased the time from neutralization to the detection of iron precipitation. The time decreased
with increasing iron concentrations. The rate of iron precipitation in AMD is a function of the
particle size. The faster the iron precipitation, the smaller the particles that forms and the larger
the clarifiers needed to effectively separate the solids from the water. Precipitation times
depend on the Fe(III) concentration; higher Fe(III) concentrations decrease precipitation time.
7.1.2 Purpose of Investigation
The aim of this investigation was to compare the HDS and the Modified HDS neutralization
processes and identify the neutralization process that meets the following criteria for water with
a specific chemical composition:
· treated water that is neutral and stable with respect to gypsum crystallisation.
· sludge with a high solids content.
· minimum alkali cost.
· minimum capital cost of plant and
· confidence in the selected process.
The HDS and modified HDS processes were studied in order to meet the following criteria for
different water qualities:
· produce sludge with high suspended solids contents (greater than 25%)
· produce sludge with fast settling rates (>1 m/h)
· achieve maximum lime utilization (better than 95%)
· simple, easy to operate process
The influence of the oxidation state of iron, limestone addition, contact time as well as a high
sulphate concentration on the performance of the processes was investigated.

67
SECTION 1 : LIME NEUTRALIZATION WITH HDS, MODIFIED HDS AND NEUTRAL
PROCESSES DURING LABORATORY BEAKER STUDIES
7.2 INTRODUCTION
The purpose of this study was to determine the difference between the HDS, modified HDS and
neutral processes as far as lime utilization, sludge solids content, settling rates and simplicity of
operation are concerned. The influence of the oxidation state of iron, limestone addition, contact
time and high sulphate concentration on the performance of the processes were investigated.
7.3 MATERIALS AND METHODS
7.3.1 Experimental
(a) Beaker Studies
Synthetic iron-rich acid mine water, simulating various acid mine drainage (AMD) compositions
was neutralized with lime to pH 7 on a batch basis during the beaker studies. A total of 33
beaker studies, 16 repetitions each, were done.
The chemical compositions of the different waters that were prepared for this investigation were
as follows:
· Ferrous sulphate 1000 mg/l (as Fe)
· Ferric sulphate 1000 mg/l (as Fe)
· FeSO4 500 mg/l (as Fe) + Fe2(SO4)3 500 mg/l (as Fe)
· FeSO4 500 mg/l (as Fe) + Fe2(SO4)3 500 mg/l (as Fe) + H2SO4 10 000 mg/l Acidity (as
CaCO3) (over-saturated with respect to gypsum after neutralization).
Throughout this section Ferrous sulphate will be referred to as Fe(II), Ferric sulphate as Fe(III),
the Ferric- and Ferro sulphate mix as Fe(II)(III) and the Ferric- and Ferro sulphate mix with added
acidity as Fe(II)(III)Ac.

68
· Table 7.1 : Summary of variables investigated during beaker studies
Beaker study number
1 2 3 4 5 6 7 8 9 10 11 12 13 14 15 16 17 18 19 20 21 22 23 24 25 26 27 28 29 30 31 32 33
Process configuration:
HDS ü ü ü ü ü ü ü ü ü ü ü ü ü ü ü
Mod HDS ü ü ü ü ü ü ü ü ü ü ü ü ü ü ü
Neutral ü ü ü
Water Type:
Fe(II) ü ü ü ü ü ü
Fe(III) ü ü ü ü ü ü
Fe(II)(III) ü ü ü ü ü ü ü ü ü ü ü ü ü ü ü
Fe(II)(III)Ac ü ü ü ü ü ü
CaCO3 added ü ü ü ü ü ü
Contact Time:
5 minutes ü ü ü ü ü ü ü ü ü
10 minutes ü ü ü ü ü ü ü ü ü ü ü ü ü ü ü
20 minutes ü ü ü ü ü ü ü ü ü
The other process conditions varied as follows (summarised in Table 7.1):
· neutralizing processes:
HDS process
Mod HDS process
Neutral HDS process
· conditioning pH value (acid, neutral and alkali)
· conditioning residence time (5, 10, and 30 min)
· CaCO3 addition (0.2, 0.5 and 2 g/l)
Limestone of different concentrations namely 0.2 g/l, 0.5 g/l and 2 g/l were added to 6 of the
beakers. In the Modified HDS process the limestone was added together with the acid water to
the sludge from the previous repetition. In the HDS process the limestone was added to the acid
water and mixed for 10 minutes prior to adding to the conditioned sludge. This was done to
allow sufficient dissolution of the CaCO3 in the acid water.
The following parameters were monitored to evaluate the effect of the various conditions on the
different processes:
· sludge solids content,
· sludge settling rate and
· lime utilization efficiency

69
(i) High Density Sludge Process
The following procedure was used during the batch tests to simulate the HDS process:
1. 1 1000 ml iron-rich acid was neutralized with lime to a level between 7.0 and 8.0.
2. The sludge was allowed to settle in a measuring cylinder for 60 minutes.
3. The top 650 ml water (or water with sludge, if the sludge volume was more than 350 ml)
was discarded.
4. 50 ml of the remaining sludge/slurry was used for determination of suspended solids.
5. The remaining 300 ml sludge was transferred into a 1 000 ml beaker and lime (the
equivalent of 700 ml neutralized acid water) was added.
6. The sludge was conditioned for either 5, 10 or 20 minutes while being stirred.
7. The pH was measured in each beaker and 700 ml of an iron-rich acid water added.
8. After allowing for aeration time, which in each case would be the same as the conditioning
time, the pH was determined.
9. The contents of each beaker were emptied into a measuring cylinder and the sludge settled
for 60 minutes, while the settling rates were monitored.
10. Steps 3 to 9 were repeated 16 times for each beaker.
(ii) Modified High Density Sludge Process
The following procedure was used during the batch tests to simulate the Modified HDS process:
1. 1 000 ml iron-rich acid was neutralized with lime to a level between 7.0 and 8.0.
2. The sludge was allowed to settle in a measuring cylinder for 60 minutes.
3. The top 650 ml water (or water with sludge, if the sludge volume was more than 350 ml)
was discarded.
4. 50 ml of the remaining sludge/slurry was used for determination of suspended solids.
5. The remaining 300 ml sludge was transferred into a 1000 ml beaker and 700 ml iron-rich
acid water added
6. This slurry was aerated for either 5, 10 or 20 minutes while being stirred.
7. The pH was measured in each beaker and lime added to neutralized the acid.
8. After additional stirring, which in each case would be the same as the aeration time, the pH
was determined.
9. The contents of each beaker were emptied into a measuring cylinder and the sludge settled
for 60 minutes, while the settling rates were monitored.

70
10. Steps 3 to 9 were repeated 16 times for each beaker.
(iii) Neutral HDS Process
The following procedure was used during the batch tests to simulate the Neutral “HDS” process:
1. 1 000 ml iron-rich acid was neutralized with lime to a level between 7.0 and 8.0.
2. The sludge was allowed to settle in a measuring cylinder for 60 minutes.
3. The top 650 ml water (or water with sludge, if the sludge volume was more than 350 ml)
was discarded.
4. 50 ml were used for determination of suspended solids.
5. The remaining 300 ml sludge was transferred into a 1 000 ml beaker and 700 ml iron rich
acid water together with lime (the equivalent of 700 ml neutralized acid water), was added.
6. This slurry was aerated for either 5, 10 or 20 minutes while being stirred.
7. The pH was measured in each beaker.
8. The contents of each beaker were emptied into a measuring cylinder and the sludge settled
for 60 minutes, while the settling rates were monitored.
9. Steps 3 to 8 were repeated 16 times for each beaker.
7.3.2 Analytical
pH were measured with either a Mettler Toledo 320 or an Orion 710A pH-meter. Settling rates
were manually observed and suspended solids determined according to Standard Methods on
every third sample.
7.4 RESULTS AND DISCUSSION
The average of the results for repetitions 7 – 16, and in some cases repetitions 10 – 16, of each
experiment are presented below.

71
7.4.1 Contact Time
(a) Lime utilization
Shorter conditioning times appeared to result in better lime utilization (lower lime (as CaCO3)/Ac
ratio (as CaCO3)) when Fe(III), Fe(II) and Fe(II)(III) waters were neutralized using the HDS,
Modified HDS or Neutral HDS processes (Table7.2). When acid was added to the Fe(II)(III) mix
prior to neutralization, the results were indecisive. Ratios below 1.0 (above 100%) can be
ascribed to either incomplete oxidation, average pH values being low (<7.0) or CaO impurities in
the Ca(OH)2 chemical.
The lime utilization efficiency, indicated by lime dosage/acidity removed ratio, (expressed as %
between brackets), as a function of contact time for various processes (and feed water
compositions) is as follows:
HDS process (Table 7.2)
· Fe(III) Lime/Ac ratio increased from 1.01 (99%) for 5 min to 1.04 (96%) for 20 min
conditioning time (Exp.1-3)
· Fe(II) Lime/Ac ratio increased from 0.80 for 5 min to 1.04 (96%) for 20 min (Exp.
10-12)
· Fe(II)(III) Lime/Ac ratio increased from 0.89 for 5 min to 1.05 (95%) for 20 min (Exp.
16-18)
· Fe(II)(III)Ac There was no significant change with ratios of 1.0 (100%) for 5min and 0.97
for both 10 and 20 minutes conditioning time (Exp. 28-30)
Modified HDS process (Table 7.3)
· Fe(III) increased from 0.93 for 5 min to 1.02 (98%) for 20 min conditioning time
(Exp. 4-6)
· Fe(II) increased from 0.89 for 5 min to 1.04 (96%) for 20 min (Exp. 13-15)
· Fe(II)(III) increased from 0.89 for 5 min to 1.01 (99%) for 20 min (Exp. 22-24)
· Fe(II)(III)Ac There was no significant change in the Lime/Ac ratio: 1.0 for 5 min, 0.98 for
10 min and 1.0 (100%) for 20 minutes conditioning time (Exp. 31-33).

72
Neutral HDS process (Table 7.3):
There was no significant difference in the Lime/Ac ratio where the Neutral process was used.
· Fe(II)(III) 1.03 (97%) for 5 minutes contact time and 1.04 (96%) for both 10 and 20
minutes (Exp. 7-9)
(b) Settling rates
HDS process:
Best settling rates were achieved with shortest conditioning times, but little difference with the
Fe(III) and Fe(II)(III) water (Table 7.2).
· Fe(III) Settling Rate of 0.32 m/h for 5 minutes compared to 0.30 m/h for 20 minutes
(Exp. 1-3)
· Fe(II) 1.15 m/h for 5 minutes and 0.90 m/h for 20 minutes (Exp. 10-12)
· Fe(II)(III) 0.30 m/h for 5 minutes and 0.27 m/h for 20 minutes (Exp. 16-18)
· Fe(II)(III)Ac 0.74 m/h for 5 minutes and 0.57 m/h for 20 minutes (Exp. 28-30)
Mod HDS process:
In all experiments done the Modified HDS process gave the best settling rates when the shortest
conditioning or contact time was applied (Table 7.3) i.e.
· Fe(III) Settling Rate of 0.69 m/h for 5 minutes compared to 0.4 m/h for 20 minutes
(Exp. 4-6)
· Fe(II) 0.83 m/h for 5 minutes and 0.58 m/h for 20 minutes (Exp. 13-15)
· Fe(II)(III) 0.51 m/h for 5 minutes and 0.38 m/h for 20 minutes (Exp. 22-24)
· Fe(II)(III)Ac 0.53 m/h for 5 minutes and 0.45 m/h for 20 minutes (Exp. 31-33)
Neutral HDS process:
Contact time had no effect on the settling rates of Fe(II)(III) water when it was neutralized with
the neutral process (0.24 m/h) (Exp. 7-9, Table3).
7.4.2 Process Configuration
(a) Lime utilization
The Modified HDS process (results in bold), when compared to the HDS process and Neutral
process (Fe(II(III) water), gave better lime utilization when Fe(III), Fe(II) and Fe(II)(III) waters
were neutralized. The largest difference between the Mod HDS and HDS processes occur
mainly at 5 minutes conditioning times. The lime utilization is expressed as a ratio with

73
percentage between brackets.
· Fe(III) The Lime/Ac ratio were 0.93 (107%); 1.01 (99%) (Exp 4 and 1, Table 7.4)
for 5 minutes conditioning times. Both values are lower than expected due
to average pH below 7. The ratios for 10 minutes conditioning times (Exp. 5
and 2) where the average pH values were 7.17 and 7.19 respectively were
1.0 (100%); 1.03 (97%).
· Fe(II) The Lime/Ac ratio is 0.89; 0.80 for 5 min conditioning time (Exp 13 and 10,
Table 7.4) and 1.04 (96%);1.04 (96%) for 20 minutes conditioning time
(Exp. 15 and 12).
· Fe(II)(III) The Lime/Ac ratio is 1.01 (99%); 1.05 (95%) with 1.04 (96%) for the Neutral
process (Exp.24, 18 and 9, Table 7.5).
· Fe(II)(III)Ac The lime utilization is very much the same (Table 7.6):
· 1.0 (100%); 1.0 (100%) for 5 minutes (Exp. 31 and 28)
· 0.98 (102%); 0.97 (103%) for 10 minutes (Exp. 32 and 29) and slightly in
favour of the HDS process 1.0 (100%); 0.97 (103%) for 20 minute
conditioning times (Exp. 33 and 30).
(b) Sludge solids contents
The only instance where the HDS process yielded better sludge solids contents than the Mod
HDS process is where Fe(II) water was neutralized.
· Fe(III) Mod HDS process yields best sludge solids content irrespective of
conditioning times (Exp. 1-6, Table 7.4) i.e.
5 min 1.79% for Mod HDS process compared to 0.99% for HDS process
20 min 1.49% for mod HDS process compared to 1.04% for HDS process
· Fe(II) HDS process yields best sludge solids content irrespective of conditioning
times (Exp. 10-15, Table 4) i.e.
5 min 3.34% for HDS process compared to 3.08% for Mod HDS process
20 min 2.89% for HDS process compared to 1.60% for Mod HDS process
· Fe(II)(III) Mod HDS process yields best sludge solids content irrespective of
conditioning times (Table 7.5) i.e.
5 min 1.44% (Mod HDS), 1.08% (Neutral) and 0.95% (HDS process)
20 min 1.57% for Mod HDS process compared to 0.99% for the Neutral
and 1.1% for the HDS process

74
· Fe(II)(III)Ac Mod HDS process yields best sludge solids contents for 5 and 10 minute
conditioning times (Table 7.6) i.e.
5 min 14.66% (Mod HDS process) compared to 14.32% (HDS process)
10 min 13.64% (Mod HDS) compared to 13.35% for the HDS process
(c) Settling rates
The best settling rates were obtained with the Mod HDS process when Fe(III) and Fe(II)(III) water were
used (Tables 7.4, 7.5 and 7.6). The HDS process had slightly better settling rates than the Neutral
process when Fe(II)(III) water was neutralized. The differences between the settling rates of the Mod
HDS and HDS processes where 5 minutes contact time was allowed were up to twice that of the 20
minute contact times and very much the same for the 10 minute contact time. When Fe(II) water was
neutralized the difference between the HDS and Mod HDS process settling rates was the same. The
settling rates (Mod HDS process in bold, and the Neutral process between brackets) for the different
waters are given as:
· Fe(III) 5 minutes contact time 0.69 m/h; 0.32m/h and 20 minutes 0.40 m/h; 0.30
m/h (Exp. 1-6, Table 7.4)
· Fe(II) 0.83 m/h; 1.15 m/h and 0.58 m/h; 0.90m/h (Exp. 10-15, Table 7.4)
· Fe(II)(III) 0.51 m/h; 0.30 m/h; (0.23 m/h) and 0.38 m/h; 0.27m/h; (0.24m/h)
(Table 7.5)
· Fe(II)(III)Ac 0.53 m/h; 0.74 m/h and 0.45 m/h; 0.57 m/h for 20 minutes contact time
(Table 7.6)
7.4.3 Iron Content
(a) Lime utilization
The lime utilization, irrespective of the neutralization process followed, was always the best with the
Fe(II) water and the worst with the Fe(III) water. The Fe(II)(III) water’s lime utilization was in-between.
The Lime/Ac ratios for the Mod HDS (values in bold) and HDS process were as follows (Tables 7.7
and 7.8):
5 minutes contact time
· Fe(II) 0.89; 0.80 (Exp. 13, Table 7.8 and Exp. 10, Table 7.7)
· Fe(III) 0.93; 1.01 (Exp. 4, Table 7.8 and Exp. 1, Table 7.7)
· Fe(II)(III) 0.89; 0.89 (Exp. 22, Table 7.8 and Exp. 16, Table 7.7)
10 minutes contact time

75
· Fe(II) 0.95; 0.98 (Exp. 14, Table 7.8 and Exp. 11, Table 7.7)
· Fe(III) 1.00; 1.03 (Exp. 5, Table 7.8 and Exp. 2, Table 7.7)
· Fe(II)(III) 0.89; 0.95 (Exp. 23, Table 7.8 and Exp. 17, Table 7.7)
20 minutes contact time
· Fe(II) 1.04; 1.04 (Exp. 15, Table 7.8 and Exp. 12, Table 7.7)
· Fe(III) 1.02; 1.04 (Exp. 6, Table 7.8 and Exp. 3, Table 7.7)
· Fe(II)(III) 1.01; 1.05 (Exp. 24, Table 7.8 and Exp. 18, Table 7.7)
The values below 1 can be ascribed to the iron oxidation not being completed in the 5-minute period. A
contact time of more than 10 minutes is recommended where Fe(II) water needs to be neutralized.
(b) Sludge solids contents
The highest average (repetition 7 to 16) sludge solids content (3.34%) was obtained with Fe(II) water
during neutralization with the HDS process and 5 minutes conditioning time (Exp 10, Table 7.7). The
highest sludge solids content (5.56%) during neutralization with the HDS process was obtained during
repetition 13 with 5 minutes conditioning time (Exp 10). The highest sludge solids content (5.67%)
during neutralization with the Mod HDS process was obtained during repetition 16 with 5 minutes
conditioning time (Exp 13). The sludge solids content for both processes had an increasing trend as
repetition proceeded (Figure 7.4).
(c) Settling rates
Fe(II) water combined with the HDS process gave fastest settling rates (1.15 m/h), with the Fe(III) and
Fe(II)(III) water nearly the same (0.32 m/h and 0.30m/h respectively). When Fe(II) water was
neutralized with the Mod HDS process, higher settling rates (0.83 m/h) were achieved than with
Fe(II)(III) (0.51 m/h) or Fe(III) (0.69 m/h) water. Values given are for 5-minute contact times.
Figure 7.3 : HDS vs Mod HDS treatment of AMD: Settling rates as a function of number of repetitions.
0
0.5
1
1.5
2
1 3 5 7 9 11 13 15
Repetitions
Set
tlin
g R
ates
(m
/h)
HDS
ModHDS

76
Settling rates for experiments 10 and 13, expressed as a function of the number of repetitions, are
given in Figure 7.3.
Figure 7.4 : HDS vs Mod HDS treatment of AMD: Sludge solids concentration as a function of number of repetitions
The sludge solids content expressed as a function of the number of repetitions are shown in
Figure 7.4.
7.4.4 Calcium Carbonate Addition
Increasing amounts of CaCO3 were added to Fe(II)(III) water prior to being neutralized with the HDS or
Mod HDS processes. The Mod HDS process yielded better lime utilization, higher sludge solids
content as well as faster settling rates. Both neutralization processes used less lime, had higher sludge
solids contents and faster settling rates with increasing limestone concentrations. The results are
summarized in Table 7.9.
The limestone decreased the amount of lime needed to neutralized the acid water.
7.4.5 Acidity
Acid mine water consists seldom of stoichiometric quantities of iron and acidity. Iron precipitates with
carbonate with resulting formation of free acid. The addition of sulphuric acid to the iron water was to
simulate acid mine waters.
Figure 7.4. HDS vs Mod HDS treatment of AMD: Sludge solids concentration as a function of number of repetitions
0123456
1 4 7 10 13 16
Repetitions
Slu
dge
solid
s co
nten
t (%
) HDS
ModHDS
77
High sludge solids contents of nearly 15 % were measured when sulphuric acid was added to the iron
water prior to neutralization. Where the acidity was the stoichiometric quantity of the iron, it is assumed
that the sludge consisted of Fe(OH)3 . The resulting higher sludge concentrations can be ascribed to
the formation of gypsum together with iron hydroxide.
7.4.6 pH
The pH of the conditioning stage during the HDS process was between 11.5 and 12.0 for contact
times of 10 and 20 minutes. The pH of the slurry, after acid water was added to the sludge, during the
modified HDS process was between 2.4 and 2.5 for Fe(III) and Fe(II)(III) water, 4.3 for Fe(II) water
and between 1.5 and 1.7 for Fe(II)(III)Ac water. The electrode response time made it impossible to
obtain reliable readings for the experiments where the contact times were 5 minutes.
7.5 CONCLUSIONS
Shorter conditioning times resulted in
· better lime utilization irrespective of water type
· faster settling rates with Fe(II) water for both HDS and Mod HDS treatments
The Modified HDS process, compared to the HDS process, gave for all waters except Fe(II)
· better lime utilization
· higher sludge solids concentrations
· faster settling rates
Fe(II) water showed
· better lime utilization irrespective of neutralization process
· fastest settling rates with HDS process
The more CaCO3 added the
· Less lime was used
· Higher the sludge solids content
· Faster the settling rates
· Free acid in water caused higher sludge solids content due to gypsum in sludge.

78
Table 7.2 : Results of beaker studies where the influence of contact times were compared. Different oxidation stages of iron water were neutralized with the HDS process Exp no. 1 2 3 10 11 12 16 17 18 28 29 30
Process HDS HDS HDS HDS
Water type: Fe(III) Fe(III) Fe(III) Fe(III) Fe(III) Fe(III) Fe(III) Fe(III) Fe(III) Fe(III)
Fe (II) Fe(II) Fe(II) Fe(II) Fe(II) Fe(II) Fe(II) Fe(II) Fe(II) Fe(II)
Ac (H2SO4 10g/l as CaCO3 Ac Ac Ac
CaCO3 added)
Volume recycled sludge (ml/l)
300 300 300 300 300 300 300 300 300 300 300 300
Sludge conditioning time 5 10 20 5 10 20 5 10 20 5 10 20 Results (average repetitions 7-16):
Lime dosage (g/lCa(OH)2) 1.57 1.6 1.61 1.06 1.31 1.38 1.33 1.42 1.58 8.67 8.71 8.76
Lime ratio: Lime/Ac (mol/mol)
1.01 1.03 1.04 0.80 0.98 1.04 0.89 0.95 1.05 1.0 0.97 0.97
Solids content (%) 0.99 0.84 1.04 3.34 3.27 2.89 0.95 1.04 1.31 14.32 13.35 14.97
Settling rate (m/h) 0.32 0.24 0.30 1.15 1.21 0.90 0.30 0.30 0.27 0.74 0.71 0.57
pH of conditioned sludge - 11.55 11.96 - 11.55 11.88 - 11.52 11.83 - 11.64 12.01
pH of treated water 6.98 7.19 7.05 7.22 6.85 7.46 7.39 7.19 7.51 8.02 7.03 7.65
Table 7.3 : Results of beaker studies where the influence of contact times were compared. Different oxidation stages of iron water were neutralized with the Modified HDS or Neutral processes Exp no. 4 5 6 13 14 15 22 23 24 31 32 33 7 8 9
Process Modified HDS Modified HDS Modified HDS Modified HDS Neutral
Water type: Fe(III) Fe(III) Fe(III) Fe(III) Fe(III) Fe(III) Fe(III) Fe(III) Fe(III) Fe(III) Fe(III) Fe(III) Fe(III) Fe(II) Fe(II) Fe(II) Fe(II) Fe(II) Fe(II) Fe(II) Fe(II) Fe(II) Fe(II) Fe(II) Fe(II) Fe(II) Ac (H2SO4 10g/l as CaCO3) Ac Ac Ac CaCO3 added Volume recycled sludge (ml/l) 300 300 300 300 300 300 300 300 300 300 300 300 300 300 300 Sludge conditioning time 5 10 20 5 10 20 5 10 20 5 10 20 5 10 20 Results (average repetitions 7-16): Lime dosage (g/l Ca(OH)2) 1.44 1.55 1.59 1.16 1.17 1.38 1.34 1.34 1.52 8.79 8.89 9.05 1.54 1.56 1.56 Lime ratio: Lime/Ac (mol/mol) 0.93 1.00 1.02 0.89 0.95 1.04 0.89 0.89 1.01 1.00 0.98 1.00 1.03 1.04 1.04 Solids content (%) 1.79 1.27 1.49 3.08 2.42 1.60 1.44 2.21 1.57 14.6 13.6 14.3 1.08 1.21 0.99 Settling rate (m/h) 0.69 0.43 0.40 0.83 0.65 0.58 0.51 0.48 0.38 0.53 0.51 0.45 0.23 0.24 0.24
pH of conditioned sludge - 2.5 2.42 - 4.32 4.31 - 2.51 2.45 - 1.56 1.71 - - -
pH of treated water 6.74 7.17 6.94 6.87 7.44 7.43 7.06 7.1 7.31 7.89 7.19 7.35 7.32 7.21 7.18

79
Table 7.4 : Results of beaker studies where the influence of the HDS and Modified HDS neutralization processes on Fe(II) and Fe(III) water were compared Exp no. 1 4 2 5 3 6 10 13 11 14 12 15
Process HDS ModHDS HDS ModHDS HDS ModHDS HDS ModHDS HDS ModHDS HDS ModHDS
Water type: Fe(III) Fe(III) Fe(III) Fe(III) Fe(III) Fe(III) Fe(II) Fe(II) Fe(II) Fe(II) Fe(II) Fe(II) Volume recycled 300 300 300 300 300 300 300 300 300 300 300 300 Sludge 5 5 10 10 20 20 5 5 10 10 20 20 Results (average) Lime dosage (g/l) 1.57 1.44 1.6 1.55 1.61 1.59 1.06 1.16 1.31 1.17 1.38 1.38 Lime ratio: 1.01 0.93 1.03 1.00 1.04 1.02 0.80 0.89 0.98 0.95 1.04 1.04 Solids content 0.99 1.79 0.84 1.27 1.04 1.49 3.34 3.08 3.27 2.42 2.89 1.60 Settling rate 0.32 0.69 0.24 0.43 0.30 0.40 1.15 0.83 1.21 0.65 0.90 0.58 pH of conditioned - - 11.55 2.5 11.96 2.42 - - 11.55 4.32 11.88 4.31 pH of treated
water
6.98 6.74 7.19 7.17 7.05 6.94 7.22 6.87 6.85 7.44 7.46 7.43
Table 7.5 : Results of beaker studies where the influence of the HDS and Modified HDS neutral neutralization processes on Fe(II) and (III) water were compared Exp no. 7 16 22 8 17 23 9 18 24
Process N HDS ModHDS N HDS ModHDS N HDS ModHDS
Water type: Fe(III) Fe(III) Fe(III) Fe(III) Fe(III) Fe(III) Fe(III) Fe(III) Fe(III) Fe(III) Fe(II) Fe(II) Fe(II) Fe(II) Fe(II) Fe(II) Fe(II) Fe(II) Fe(II) Fe(II)
Ac (H2SO4 10g/l as CaCO3) CaCO3 added)
Volume recycled sludge (ml/l) 300 300 300 300 300 300 300 300 300 Sludge conditioning time 5 5 5 10 10 10 20 20 20 Results (average repetitions 7- Lime dosage (g/l Ca(OH)2) 1.54 1.33 1.34 1.56 1.42 1.34 1.56 1.58 1.52 Lime ratio: Lime/Ac (mol/mol) 1.03 0.89 0.89 1.04 0.95 0.89 1.04 1.05 1.01 Solids content (%) 1.08 0.95 1.44 1.21 1.04 2.21 0.99 1.31 1.57 Settling rate (m/h) 0.23 0.30 0.51 0.24 0.30 0.48 0.24 0.27 0.38 pH of conditioned sludge - - - - 11.52 2.51 - 11.83 2.45 pH of treated water 7.32 7.39 7.06 7.21 7.19 7.1 7.18 7.51 7.31

80
Table 7.6 : Results of beaker studies where the influence of the HDS and Modified HDS neutralization processes on Fe(II)(III)Ac water were compared Exp no. 28 31 29 32 30 33
Process HDS ModHDS HDS ModHDS HDS ModHDS
Water type: Fe(III) Fe(III) Fe(III) Fe(III) Fe(III) Fe(III) Fe(III)
Fe(II) Fe(II) Fe(II) Fe(II) Fe(II) Fe(II) Fe(II) Ac(H2SO4 10g/l as CaCO3) Ac Ac Ac Ac Ac Ac
CaCO3 added - - - - - - Volume recycled sludge (ml/l) 300 300 300 300 300 300 Sludge conditioning time 5 5 10 10 20 20 Results (average repetitions 7-16): Lime dosage (g/l Ca(OH)2) 8.67 8.79 8.71 8.89 8.76 9.05
Lime ratio: Lime/Ac (mol/mol) 1.00 1.00 1.00 0.98 0.97 1.00 Solids content (%) 14.32 14.66 13.35 13.64 14.97 14.36 Settling rate (m/h) 0.74 0.53 0.71 0.51 0.57 0.45
pH of conditioned sludge - - 11.64 1.56 12.01 1.71 pH of treated water 8.02 7.89 7.03 7.19 7.65 7.35
Table 7.7 : Results of beaker studies where the influence of the iron oxidation stages of the feed waters were compared when neutralized with the HDS process Exp no. 1 10 16 2 11 17 3 12 18
Process HDS HDS HDS HDS HDS HDS HDS HDS HDS Water type: Fe(III) Fe(III) Fe(III) Fe(III) Fe(III) Fe(III) Fe(III)
Fe(II) Fe(II) Fe(II) Fe(II) Fe(II) Fe(II) Fe(II) Ac (H2SO4 10g/l as CaCO3)
CaCO3 added
Volume recycled sludge (ml/l) 300 300 300 300 300 300 300 300 300
Sludge conditioning time 5 5 5 10 10 10 20 20 20
Results (average repetitions 7-
16):
Lime dosage (g/l Ca(OH)2) 1.57 1.06 1.33 1.6 1.31 1.42 1.61 1.38 1.58
Lime ratio: Lime/Ac (mol/mol) 1.01 0.80 0.89 1.03 0.98 0.95 1.04 1.04 1.05 Solids content (%) 0.99 3.34 0.95 0.84 3.27 1.04 1.04 2.89 1.31 Settling rate (m/h) 0.32 1.15 0.28 0.24 1.21 0.3 0.3 0.9 0.27
pH of conditioned sludge - - - 11.55 11.55 11.52 11.96 11.88 11.83 pH of treated water 6.98 7.22 7.39 7.19 6.85 7.19 7.05 7.46 7.51

81
Table 7.8 : Results of beaker studies where the influence of the oxidation stages of the feed waters were compared when neutralized with the Modified HDS process Exp no. 4 13 22 5 14 23 6 15 24
Process ModHD ModHDS ModHD ModHD ModHD ModHD ModHD ModHD ModHDWater type: Fe(III) Fe(III) Fe(III) Fe(III) Fe(III) Fe(III) Fe(III)
Fe(II) Fe(II) Fe(II) Fe(II) Fe(II) Fe(II) Fe(II) Ac (H2SO4 10g/l as CaCO3)
CaCO3 added) Volume recycled sludge (ml/l) 300 300 300 300 300 300 300 300 300 Sludge conditioning time 5 5 5 10 10 10 20 20 20 Results (average repetitions 7-16): Lime dosage (g/l Ca(OH)2) 1.44 1.16 1.34 1.55 1.17 1.34 1.59 1.38 1.52 Lime ratio: Lime/Ac (mol/mol) 0.93 0.87 0.89 1.00 0.95 0.89 1.02 1.04 1.01 Solids content (%) 1.79 3.08 1.44 1.27 2.42 2.21 1.49 1.60 1.57 Settling rate (m/h) 0.69 0.83 0.51 0.43 0.65 0.48 0.4 0.58 0.38 pH of conditioned sludge
pH of treated water
-
6.74
-
6.87
-
7.06
2.5
7.17
4.32
7.44
2.51
7.1
2.42
6.94
4.31
7.43
2.45
7.31 Table 7.9 : Results of beaker studies where the influence of limestone addition on the different parameters were compared when feed waters were neutralized with the HDS or Modified HDS processes Exp no. 17 19 20 21 23 25 26 27
Process HDS HDS HDS HDS ModHDS ModHDS ModHDS ModHDS Water type: Fe(III) Fe(III) Fe(III) Fe(III) Fe(III) Fe(III) Fe(III) Fe(III) Fe(III) Fe(II) Fe(II) Fe(II) Fe(II) Fe(II) Fe(II) Fe(II) Fe(II) Fe(II) Ac(H2SO4 10g/l as
CaCO3)
CaCO3 added (g/l) 0 0.2 0.5 2 0 0.2 0.5 2 CaCO3 added (as
Ca(OH)2)
0 0.148 0.37 1.48 0 0.148 0.37 1.48
Volume recycled sludge (ml/l) 300 300 300 300 300 300 300 300 Sludge conditioning time 10 10 10 10 10 10 10 10 Results (average repetitions 7-16): Lime dosage (g/l Ca(OH)2) 1.42 1.42 1.18 0.87 1.34 1.29 1.03 0.48 Total: lime + limestone added 1.42 1.568 1.55 2.35 1.34 1.438 1.4 1.96 Lime ratio: Lime/Ac (mol/mol) 0.95 0.94 0.79 0.58 0.88 0.86 0.69 0.32 Ratio: Lime+Limestone/Ac (mol/mol) 0.95 1.05 1.03 1.57 0.88 0.96 0.93 1.31 Solids content (%) 1.04 1.01 2.34 6.94 2.21 3.06 3.01 5.8 Settling rate (m/h) 0.3 0.22 0.46 0.77 0.48 0.71 0.8 0.82 pH of conditioned sludge 11.52 12.56 12.43 11.76 2.51 2.73 3.59 6.12
pH of treated water 7.19 7.04 7.05 7.07 7.1 7.14 7.35 7.26

82
SECTION II : LIME NEUTRALIZATION WITH HDS AND MODIFIED HDS PROCESSES DURING
CONTINUOUS OPERATION WITH LABORATORY-SCALE PLANTS
7.6 INTRODUCTION
Two 24 l/h laboratory scale pilot plants were operated continuously at the CSIR to confirm the findings
collected with the beaker studies.
The purpose of this investigation was to compare the Modified HDS process with the HDS process to
determine whether there could be lime savings, and changes in sludge densities and settling rates.
The High Density Sludge (HDS) and the Modified High Density Sludge (Mod HDS) processes were
compared in parallel during neutralizing experiments. The plants were run continuously to determine
whether findings from the beaker studies would be confirmed.
7.7 MATERIALS AND METHODS
7.7.1 Feedstock
Iron-rich acidic waters were prepared to simulate acid mine drainage (AMD) compositions. Table 10
gives the chemical compositions of the different feed waters.
Table 7.10 : Chemical compositions of feed waters used in continuous studies.
Parameter Water
A B C
FeSO4 (mg/l as Fe) 200 200
Fe2(SO4 )2 (mg/l as Fe) 200
H2SO4 (mg/l as SO4) 1500 1500 2500
Acidity (mg/l as CaCO3) 1500 1500 2500
The artificial AMD were neutralized with 10% suspension of industrial lime.

83
7.7.2 Equipment
Figure 7.5 shows the experimental units as captured during operation.
Figure 7.5 : HDS and Modified HDS laboratory-scale plants in operation.
The conditioning tanks, one for the HDS process and one for the Modified HDS process, had a
capacity of 4 litres. The conditioning tanks overflowed into aeration tanks with volumes of 10 litres.
The conditioning tanks as well as the aeration tanks were stirred (between 180 and 220 rpm) with
paddle stirrers to keep the suspended solids in solution. After a few days of operation, the stirrer in the
conditioning tank of the HDS process was replaced with a bigger paddle to enable sufficient mixing.
Compressed air and two diffusers in each aeration tank were used.
The aeration tanks overflowed into clarifiers of 20-liter capacity, with sidewalls tapered at 60° and top
diameter of 44 cm.
Watson-Marlow pumps with variable speed settings were used to control the feed rates.
Metrohm 691 pH meters, with automatic temperature compensation, connected to the pumps feeding
the lime solution, were used to control the pH at 7.5.

84
A Lightnin stirrer was used in each of the lime slurry tanks, one for each process, to keep the lime in
suspension.
7.7.3 Procedure
(a) Operation
Two laboratory scale pilot plants were run in parallel, one on the High Density Sludge (HDS) process
and the other on the Modified HDS process. Figures 7.6 and 7.7 shows the HDS and Modified HDS
process configurations. The plants were run continuously, 5 days per week, for up to 7 weeks in order
to achieve steady state.
The average of the results obtained during the last 4k litres of feed water that were neutralized by the
processes are discussed unless stated otherwise. In all instances, this covered more or less 2 weeks
of operation time. This period was chosen because the initial sludge build-up was completed and a
steady state developed. Between 4 and 5 weeks were necessary for sludge build-up. Because the
HDS and modified HDS processes ran in parallel, the conditions were the same throughout the
experiments and comparison between the processes can be done on an equal basis.

85
(b) The HDS process
The HDS process is best explained by way of a diagram (Figure 7.6).
Figure 7.6 : Diagram of HDS laboratory scale plant
The HDS process consists of three stages:
· Sludge conditioning stage
· Aeration stage
· Solid/liquid separation phase
The conditioning stage consists of a tank for the preparation of a lime solution and a sludge-
conditioning tank. The conditioning tank receives recycled settled sludge from the clarifier underflow
and the lime solution. The lime dosage into the conditioning tank is such that a pH of 7.5 is maintained
in the aeration stage.
The sludge from the conditioning tank overflows into the aeration tank. This tank serves as mixer to
pH 7.5
Feed water
Lime
pH control
Waste sludge
Recycle sludge Waste sludge
Clarifier pH >9
Conditioning
Aeration

86
keep the solids in suspension, to mix the conditioned sludge with the acid mine water entering the tank
and for aeration to enable ferrous iron oxidation to ferric iron.
The neutralized and oxidized slurry overflows to the clarifier where sludge is separated from the liquid.
The effluent overflows and the settled sludge is recycled to the conditioning tank.
(c) The modified HDS process
The Modified HDS process (Figure 7.7) consists of three stages:
· Mixing/conditioning stage
· Aeration/neutralization stage
· Solid/liquid separation phase
The mixing or conditioning stage consists of a sludge-conditioning tank that receives recycled settled
sludge from the clarifier underflow and the feed water. The sludge from the conditioning tank overflows
into the aeration tank.
The aeration stage consists of an aeration tank and a tank for the preparation of a lime solution. The
lime dosage into the aeration tank is controlled to maintain a pH of 7.5. The tank serves as mixer to
keep the solids in suspension. Sufficient aeration oxidizes ferrous iron to ferric iron.
The neutralized and oxidized slurry overflows to the clarifier where sludge is separated from the liquid.
The effluent overflows and the settled sludge is recycled to the conditioning/mixing tank.
(d) Maintenance
The following maintenance procedures were followed:
pH electrodes: The pH electrodes were thoroughly cleaned when the plants were stopped, topped up
with KCL solution and rested over the weekend. This procedure ensured quality pH control during the
experiments.

87
Figure 7.7 : Diagram of Modified HDS laboratory scale plant
· Pumps and stirrers: The plants were run 24 hours per day, 5 days per week. All moving parts,
except the recirculation pumps, were stopped during weekends. The lack of supervision over
weekends, heavy thunderstorms sometimes causing power failures, and the pH electrodes
maintenance, made this the better option.
· Lime feeding: Lime feeding pipes were thoroughly backwashed once a week. Lime blockages
occurred from time to time despite all known precautions taken. pH control results in the flow
through the lime dosing pumps being stopped if the pH rise above 7,5. The lime suspension then
settles in the tubes. Depending on the time lapse before the pH drop low enough to activate the
pumps again, blockages can occur.
pH 7.5
Lime
Feed water
pH control
Waste sludge
Effluent
Recycle sludge Waste sludge
Clarifier
pH <6
Aeratio

88
7.7.4 Experimental Programme
The following parameters were varied:
· Process configuration (HDS and Mod HDS)
· Water quality (Water A – Fe2+, 1500mg/l Ac; Water B – Fe3+, 1 500mg/l Ac; Water C – Fe2+,
2 500mg/l Ac)
· Sludge age: Sludge age varied between 3,5 and 12,7 days. The sludge concentration was a
function of the sludge production and sludge withdrawal. The sludge withdrawal was on
purpose through regular withdrawal or through sampling.
· Feed flow rates: Feed water was pumped into the reactor at fixed rates varying between 22
and 38 l/h. Initial feed rates were in the upper range (more than 30 l/h) to aid sludge build-up
and lowered to between 22 and 25 l/h during the last 2 weeks of each experiment.
· HRT (hydraulic retention times): Retention times varied between 23 and 41 minutes over the
whole range of the experiments, but between 34 and 38 minutes during the last 2 weeks
(steady state) of each experiment.
· Recirculation: The sludge were recycled from the bottom of the clarifiers to the conditioning
tanks at an initial rate of between 24 and 33 l/h, and decreased to between 5 and 10 l/h
during the last 2 weeks of each experiment.
· Sludge recycled to precipitated ratios: The ratio of the sludge solids recirculated to the
sludge solids precipitated were >30:1, except for the first 3 days of operation. Ratios during
the last 2 weeks of operation were above 70:1 due to the inability to decrease recirculation
rates any further.
Polyelectrolite addition: No polyelectrolyte was dosed during any of the experiments. During operation
at mines this is often done to enhance sludge settling during the separation phase.
7.7.5 Analytical
(a) Sampling
Samples were taken from the feed, effluents, aeration tanks and underflows and analyzed for iron
content, acidity or alkalinity, sulphate, pH and suspended solids. Settling rates of samples taken from
the aeration tanks were manually observed.
The settled sludge concentrations were calculated from the suspended solids in the aeration tank and

89
the settled volume after 24 hours.
7.8 RESULTS AND DISCUSSION
7.8.1 Starting of Experiments
Figures 7.8 and 7.9 and Table 7.11 show the change in key parameters (sludge solids content and
settling rates) over the start-up period until steady state conditions were achieved. Results for feed
water A (200mg/l Fe(II)) while treated with the HDS configuration are represented.
Figure 7.10 shows the sludge age for the corresponding period and was calculated as follows:
Sludge age (d) =sludge in reactor (g)/sludge in feed water after neutralization (g/d).
The sludge settling rates remained constant at between 0,5 and 1.0 m/h. The settled sludge
concentration increased from 1 to 15% over time. The increase in sludge solids concentration can be
ascribed to the formation of polymeric iron species. The colour changes as described by Knight and
Silva were observed during the experiments. The settled sludge concentration represents the sludge
solids content after 24 hours settling time.
0
5
10
15
20
25
0.00 0.50 1.00 1.50 2.00
Total Feed Flow (kl)
Figure 7.8 : The settled sludge concentration as a function of the total feed flow through the HDS plant (feedwater A)

90
Figure 7.9 shows the change in settling rates as the total flow through the system increased. The
trendline indicates an initial decrease in settling rates where after the rates increased to 1 m/h. Figure
10 shows the initial increase in sludge age as the total feed flow through the HDS system increased
0
0.5
1
1.5
0.00 0.50 1.00 1.50 2.00
Total flow (kl)
Figure 7.9 : Settling rates as a function of total feed flow through the HDS system (feed water A)
02468
10
0.00 1.00 2.00 3.00 4.00
Total feed flow (kl)
Figure 7.10 : Sludge age as a function of total feed flow through the HDS system (feed water A)
7.8.2 Sludge Age
The sludge age in the aeration tank increased as the total flow through the system increased. At
steady state the same amount of sludge were wasted as the build-up for that period. Average sludge
ages for the different process configurations and feed water is at steady state, were as follow:
Feed water A: HDS process 7.5 days and Mod HDS process 6 days
Feed water B: HDS process12.7 and Mod HDS process 3.5 days
7.8.3 Process Configuration
Table 11 compares the performance of the HDS and Mod HDS processes for feed water A (Fe(II)

91
200 mg/l) and B (Fe(III) 200 mg/l). The results are average readings of the last 4 kl of feed that was
treated. This represents the steady state conditions that were achieved.
Table 7.11 : Comparative parameter values during steady state for each of the process configurations
Feed water (Fe2+) Feed water (Fe3+) Parameter
HDS Mod HDS HDS Mod HDS
Settled Sludge Solids (%) 42.8 30.9 10.6 23.2
Settling Rate (m/h) 0.81 0.81 0.63 0.83
Lime Utilization (%) 76 78 87 96
(a) Lime utilization
Lime utilization is better for the Modified HDS process than for the HDS.
· Fe(II)-rich water (feed water A) 1.28 (78%) vs 1.32 (76%)
· Fe(III)-rich water (feed water B) 1.04 (96%) vs 1.15 (87%)
· Fe(II) and high SO4 (feed water C) 1.15 (87%) vs 1.22 (82%)
(b) Settling rates
· Fe(II)- and Fe(III)-rich water (feed water A and B): Average settling rates between 0.63 and 0.83
m/h were observed for both processes (HDS and Modified HDS) and water types (Fe(II) and
Fe(III)). Settling rates (up to 1.2 m/h) were, however, observed with the HDS as well as the
Modified HDS processes when Fe(II) rich water were treated. When Fe(III)-rich water were treated
with the Modified HDS process, settling rates of 0.96 m/h were recorded during the latter part of
the experiment.
· Fe(II) and high SO4 (feed water C): Average settling rates of 0.77 m/h were recorded with the
Modified HDS process and 0.55 m/h with the HDS process.

92
(c) Sludge solids concentration
Average sludge solid concentrations for feed water A and B at different sampling points are given in
Table 12. The settled sludge solids concentrations after 24 hours of settling were allowed are used for
discussion. 99% of the maximum settling was reached within 3 hours.
· Fe(II)-rich water (feed water A): Average sludge solids concentrations were higher for the HDS
process (42.8%) than for the Modified HDS process (30.9%)
· Fe(III)-rich water (feed water B): Results were the opposite of those for Fe(II) water. Average
sludge solids concentrations were 23.2% for the Modified HDS process and 10.6% for the HDS
process.
· Fe(II) and high SO4 (feed water C): Average settled sludge solids concentrations were 34.6% for
the HDS process and 7.5% for the modified HDS process.
Table 7.12 : Summary of suspended solids results obtained with Fe(II) water (Feed water A) and Fe(III) water (feed water B)
Sludge Solids Content (%)
Feed water A (FeII) Feed water B (FeIII) Sampling Point
HDS Modified HDS HDS Modified HDS
Sludge after settling 42.8 30.9 10.6 23.2
Aeration tank 9.1 6.1 2.1 4.1
Underflow 25.0 16.5 7.8 15.6
Effluent <0.01 <0.01 <0.01 <0.03
7.8.4 Gypsum Scaling
Blockages occurred while feeding water C (2500mg/l as SO4). Gypsum scale caused blockages that
made continuous operation impossible. It was cleaned out as often as possible. This experiment was
abandoned after 5 weeks since the sludge being lost during cleaning operations became so much that
no sludge build-up pattern could be established.

93
7.9 CONCLUSIONS
1. The HDS process is most suitable for the treatment of Fe(II)-rich water
2. The Modified HDS process is most suitable for Fe(III)-rich water
3. Water high in sulphates is less suitable for the HDS and the Modified HDS processes due to
gypsum scaling in the recycle pipelines
4. Results obtained from continuous operations confirm findings from beaker studies

94
CHAPTER 8 : CONTROL OF ACID GENERATION IN COAL DISCARD DUMPS USING LIMING
PLANT SLUDGE
8.1 BACKGROUND
Coal discard, fines and high density sludge (produced during acid water neutralization with lime (HDS-
sludge)) are generated during coal mining. Coal discard and fines are sometimes disposed together.
Coal discard is used as a wall for the waste dump while the fines are deposited in the centre. The
fines are generally of good quality with a future value, while discard is responsible for environmental
pollution due to its pyrite content. The pyrite present in the discard when exposed to atmosphere, is
oxidized producing sulphuric acid (Equation 1). The acidic water is collected and neutralized with lime
to produce HDS-sludge which is rich in gypsum and metal hydroxides. For the disposal of discard,
current practices dictate that discard dumps should be designed in such a way that the contact
between discard, water and air is minimised to ensure minimum acid formation. Surface runoff of (rain
water and process water) is maximised to minimise seepage. Air contact is minimised by compacting
the coal discard. Upon mine closure, rehabilitation of the discard dump by e.g. placing a clay capping
over the site is required to ensure minimum further acid formation. For the disposal of HDS-sludge (if
classified as a hazardous waste), legislation requires that it be discharged into lined ponds to eliminate
the possibility of acid water induced metal leaching to groundwater. However, sludge disposal in lined
landfills is costly.
4FeS2 + 15O2 +14H2O ⇒ 4Fe(OH)3 + 8H2SO4 (1)
The aim of this investigation was to investigate the benefits associated with the co-disposal of HDS-
sludge and coal discard. The following arguments indicate that there is little environmental benefit in
disposal of HDS-sludge in lined ponds (when the impact of HDS-sludge is compared with that of the
coal discard dump):
· The amount of HDS-sludge generated is insignificant compared to discard. For a coal mining
operation with a throughput of 20 000 t/d of raw coal, typically 6 000 t/d of discard is generated
compared to only 10 t/d or less of HDS-sludge (dry basis).
· The metals in HDS-sludge are in the oxidized form and cannot generate acid, as is the case with
discard during pyrite oxidation (Equation 1).
· HDS-lined ponds are usually adjacent to discard dumps.

95
Co-disposal of HDS-sludge with coal discard on surface or direct discharge into worked out open
cast or underground voids could be more cost effective. This approach would be in line with the
backfill approach applied sometimes (although not in line with current legislation) in the mining industry
where waste rock is returned to underground. Co-disposal would offer the following benefits: cost
reduction as costly sludge disposal ponds are not required and the creation of neutralization capacity,
as HDS-sludge contains 5% to 30% unused alkali, depending on the efficiency of the plant. Other
researchers also reported that less metals are leached out from metal-rich waste when in contact with
alkali-wastes. Hölström et al. (1999) found from their humidity cell tests that a high pH in tailings
prevent the leaching of heavy metals. This is due to the low solubility of metals at higher pH values.
Pritts et al. (1999) found during evaluation studies on the stabilization of hazardous wastes, with a
byproduct from Clean Coal Technology, a decrease in toxicity of the wastes. Toxicity Characteristic
Leaching Procedure (TCLP) tests were used. They ascribed it to cementitious reactions that occurred
in the wastes that contained lime, CaSO4/CaSO3 and fly ash. They mixed the byproduct and
hazardous wastes in the ratio of 1:10 and higher.
The purpose of this investigation was to:
· Demonstrate that co-disposal of HDS-sludge and coal discard offers an effective alternative to
disposal of HDS-sludge in lined landfills. It is hypothesised that the unused alkali in the HDS-sludge
will raise the pH of the coal discard to levels above 7 where the solubility of metals is low. This
depends on the coal quality which is highly variable and site specific.
· Compare the efficiency of HDS-sludge and activated sewage sludge co-disposal with coal discard,
and submersion of the coal discard for minimizing acid formation from coal discard.
· Determination of the potential toxicity of leachate from the untreated and treated coal discard.
8.2 MATERIAL AND METHODS
8.2.1 Materials
The HDS-sludge used in this study was obtained from the Brugspruit liming plant near Witbank and
consisted mainly of iron- and aluminium hydroxide, gypsum and water (Table 8.1). A representative
sample of HDS-sludge was fused with sodium peroxide, dissolved in dilute acid and analyzed with
ICP-AES spectroscopy.

96
Table 8.1 : Chemical composition of HDS-sludge.
Parameter Concentration (mg/kg)
Parameter Concentration (mg/kg)
Zinc 400 Sodium 3 000 Silica 7 000 Potassium 200 Manganese 1 000 Magnesium 3 000 Iron 40 000 Sulphur 4 000 Chromium 60 Hydroxide 58 719 Aluminium 9 000 Sulphate 96 000 Calcium 40 000 Water 144 444 Solids 406 379 Other metals Below detection limit
Coal discard was obtained from a colliery near Witbank. It was sieved and the less than 20 mm
fraction was used for column leaching studies. Activated sewage sludge from the Daspoort sewage
works in Pretoria was used.
8.2.2 Column Leaching Studies
Column leaching studies were carried out to determine the rate of acid generation from pyrite-rich coal
discard. The following procedure was followed:
· PVC columns (180 mm diameter and 1.2 m heigh) were filled with solid waste material (30 kg). The
columns were packed with various combinations of coal discard and HDS-sludge or activated
sewage (AS) sludge (Table 8.2). The different coal discard and HDS or AS sludge combinations
were thoroughly mixed before filling the columns.
· Tap water (10 - 12 litres) was added (day 1) and drained (day 3) in weekly cycles for a period of 22
weeks. During the rest of the period (day 4 to day 7), the content of the columns was exposed to
air. Two columns ( W9 and W11) were operated as a “submersed system” meaning that these
columns were not drained after the addition of water to a level above the packed height. The water
was topped up as samples were extracted from the bottom on a weekly basis. Sampling and
analyses of all columns were carried out weekly.
· A coal discard sample was taken at the beginning of the project for analyses of the nett
neutralization potential of the discard using the modified acid-base accounting procedure of
Lawrence (1990). The acid potential (AP) was based on the pyrite content of the coal (expressed
as %S x 31.25 = kg CaCO3 equivalent/ton). The neutralization potential (NP) (as kg CaCO3
equivalent/ton) was determined by digesting the sample in a standard HCl-solution for 24 h and
back titrating with a standard NaOH solution. The nett neutralization potential (NNP) is the
difference between NP and AP.

97
8.2.3 Beaker Tests for Evaluating the Stability of HDS
Beaker tests were carried out to determine the stability of the HDS-sludge as a function of pH. HDS-
sludge (50 g/l) samples were stirred at 80 rpms for a period of 24 hours in a range of HCl solutions (0
mg/l, 300 mg/l, 2200 and 101 850 mg/l (as CaCO3)). The leachate was analyzed for iron, aluminium,
manganese, zinc, cadmium, chromium, lead and nickel, acidity, sulphate and pH.
8.2.4 Waste Classification Studies
The EPA’s TCLP (Toxicity Characteristic Leaching Procedure) method (no 1311) was used for
characterising of the HDS-sludge and the coal discard (EPA, 1992). Prescribed solutions containing
acetic acid was used. The solid (waste) to extractant ratio was 1:20 by weight. A minimum sample of
100 g was agitated in a rotating apparatus for 20 h. In this method 100 ml acidic solution (e.g. acetic
acid) was contacted with 20 g of solids in a closed container for a 24 h period. The filtrate was
analyzed for iron, aluminium, manganese, zinc, cadmium, chromium, lead and nickel.
8.2.5 Analytical
Leachate samples from the column leaching studies were filtered through Whatman No 1 filter paper.
Sulphate, acidity and pH determinations were carried out manually according to procedures described
in Standard Methods (APHA, 1989). Metals (e.g. iron, aluminium and manganese) were analyzed
using atomic absorption spectroscopy and ICP spectroscopy. A standard spectrophotometric method
were used for Cr(VI) analyses.
8.3 RESULTS AND DISCUSSION
Table 8.2 shows the load of various parameters that is leached out from coal discard/HDS during
various treatment options. The various studies are divided into three groups for discussion purposes.
Group 1. Leachate from coal discard (control) - Column W6
Group 2. Comparison between coal discard (control) and HDS-sludge - Columns W6 and W7
respectively
Group 3. Comparison between coal discard (control) (W6) and various control/inhibition
options, namely HDS-sludge (W3), Activated sludge (W10), Submersed discard (W9),
Submersed activated sludge/discard (W11).

98
8.3.1 Control of Acid Generation from Coal Discard with HDS-Sludge
(a) Coal discard (control)
The initial nett neutralization potential (NNP) of the coal discard was 56 g (as CaCO3)/kg discard) with
a neutralization potential:acid potential (NP:AP) ratio of 2:1. Coal discard with a NP:AP ratio of 4 and
higher is considered to be alkaline discard (Price et al., 1997). This indicates that the specific coal
discard will be acid generating as evident by the low leachate pH values (Table 8.2, W6). Figure 8.1
shows the acid and iron load leached out from coal discard (control) due to the oxidation of pyrite
(equation 1). Iron analyses is shown for a period of 12 weeks and acidity for 22 weeks.
Figure 8.1 shows that acidity and iron leach out at constant rates over time, namely 1 120 mg acid (as
CaCO3)/(kg.week) and 326 mg Fe/(kg.week) respectively (calculated from the slopes of accumulated
acidity/iron versus time). The measured ratio of iron to acidity of 0.24 corresponds reasonably with
the expected ratio of 0.28 calculated from equation 1. Factors like the presence of pyrite compounds
other than FeS2 could explain the difference.
The acid potential (AP) of the coal discard used is 56 g acid (as CaCO3)/(kg discard). Under
laboratory conditions, where the leachate rate is high compared to field conditions, a minimum period
of 50 weeks (56 g acid (as CaCO3)/kg discard ÷ 1.12 g acid (as CaCO3)/(kg.week)) is estimated for
complete leaching of the oxidation products of pyrite. This indicates that only a small portion of the
pyrite content of the discard can be leached in a short period of time. The aim, therefore, in the
management of discard dumps, is to reduce the rate of pyrite oxidation to the minimum. Complete or
enhanced leaching of pyrite will result in unacceptably high neutralization and sludge disposal cost.
The other metals analyzed (Zn, Al and Mn) leached out at much lower rates than iron and do not leach
at a constant rate with time. The leachate rates of Zn, Al and Mn are at least an order of magnitude
less than that of the iron due to lower concentrations in the discard (Table 8.2, Column W6).

99
Table 8.2 : Effect of HDS-sludge and other treatment options (submersed and activated sludge) on the specific weekly load of environmental parameters in the leachate from coal discard
Parameters Column media specifications
Column no. W7 W6 W3 W10 W9 W11
Controls Comparison between HDS and other treatment options
Column description HDS-sludge
Discard Discard/ HDS-sludge
Discard/ AS Sludge
Discard submersed
Discard/ AS Sludge submersed
Experimental conditions
Discard N Y Y Y Y Y
HDS-sludge (dewatered) Y N Y N N N
Activated sludge (AS) N N N Y N Y
Ph 7 7 7 7 7 7
Water Tap Tap Tap Tap Tap Tap
Cycle (days) 7 7 7 7 7 7
Submersed N N N N Y Y
Drain Y Y Y Y N N
Mass HDS-sludge (kg) 30 0 10 0 0 0
Mass discard (kg) 0 30 20 20 30 20
Mass activated sludge (kg) 0 0 0 10 0 10
Volume in (l ) 12 12 12 12 12 12
Experimental results
Leachate rates at selected contact times
Acidity (mg acid (as CaCO3)/kg discard.week, for all except W7), (mg acid (as CaCO3)/kg HDS.week, for W7)
Week (initial) 36 1516 65 482 275 48
Week (4) 52 1277 131 139 175 52
Week (8) 37 1319 78 93 91 38
Week (12) 29 1245 41 72 48 38
Average (weeks 0, 4, 8 & 12)
38.5 1339 79 197 147 44
Average (weeks 0 - 22) 33 1120 56 130 127 44
Total iron (mg Fe/kg discard.week, for all except W7), (mg Fe/kg HDS.week, for W7)
Week (initial) 0.021 314 0.03 0.84 65 0.07
Week (4) 0.02 370 0.01 0.02 61 0.05
Week (8) 0.01 295 0.01 0.74 24 0.03
Week (12) 0.008 307 0.01 0.11 10 0.09
Average 0.015 321.5 0.02 0.43 40 0.06
Aluminium (mg Al/kg discard.week, for all except W7), (mg Al/kg HDS.week, for W7)
Week (initial) 1.0 18.1 1.4 0.26 4.5 0.08
Week (4) 0.5 5.0 0.4 0.04 1.3 0.01
Week (8) 0.4 4.2 0.7 0.34 0.45 0.05
Week (12) 0.5 3.5 0.5 0.08 0.15 0.03
Average 0.6 7.7 0.8 0.18 1.6 0.04
Manganese (mg Mn/kg discard.week, for all except W7), (mg Mn/kg HDS.week, for W7)

100
Parameters Column media specifications
Column no. W7 W6 W3 W10 W9 W11
Controls Comparison between HDS and other treatment options
Column description HDS-sludge
Discard Discard/ HDS-sludge
Discard/ AS Sludge
Discard submersed
Discard/ AS Sludge submersed
Week (initial) 4.1 15.2 41 0.09 3.0 0.50
Week (4) 2.3 2.7 16 0.02 2.5 0.00
Week (8) 0.02 1.9 7 0.01 1.3 0.00
Week (12) 0.01 1.0 3 0.01 1.0 0.00
Average 1.61 5.2 17 0.03 1.95 0.13
Zinc (mg Zn/kg discard.week, for all except W7), (mg Zn/kg HDS.week, for W7)
Week (initial) 0.039 7.8 0.23 0.08 1.0 0.01
Week (4) 0.01 2.7 0.05 0.00 0.8 0.01
Week (8) 0.01 3.0 0.04 0.00 0.6 0.01
Week (12) 0.015 0.6 0.06 0.00 0.1 0.01
Average 0.02 3.53 0.10 0.02 0.6 0.01
Ph
Week (initial) 6.6 2.6 6.0 6.7 2.6 6.3
Week (4) 6.7 2.5 6.5 7.3 2.8 6.9
Week (8) 7.1 2.4 6.9 8.1 2.9 7.2
Week (12) 7.0 2.2 7.1 8.0 2.6 7.1
Average 6.85 2.43 6.6 7.5 2.7 6.9
COD concentration (mg/l O2)
Week (initial) 2760.0 550.0
Week (4) 98.0 260.0
Week (8) 80.0 109.0
Week (12) 33.0 63.0

101
0
4000
8000
12000
16000
20000
24000
28000A
cc. A
c [m
g (a
s C
aCO
3)/k
g di
scar
d]
0
4000
8000
12000
16000
20000
24000
28000
Acc
Fe
[mg
/kg
dis
card
]
0 2 4 6 8 10 12 14 16 18 20 22 24Week
Acidity Fe (total)
Figure 8.1 : Leachate of acid and iron from coal discard (control) - W6.
(b) HDS-sludge
Table 8.3 shows the results obtained from the dissolution of HDS-sludge in a range of acidic solutions.
It shows that:
· The metals in HDS-sludge dissolves only in acidic medium and not at pH values above 6.
· Calcium and magnesium salts would dissolve over the whole pH range (0 to 6), as indicated by the
dissolution of sulphate to between 1 600 and 2 400 mg/l .
· HDS-sludge contains 50 g/kg alkali (as CaCO3)/kg sludge. This was determined experimentally and
is also confirmed by the observation that 2.4 g acid (as CaCO3) is needed to reduce the pH of 50 g
HDS-sludge to less than 7 (2.4 g/50 g = 48 g alkali (as CaCO3)/kg HDS-sludge).
(c) Comparison between coal discard (control) and HDS-sludge
Figure 8.2 and Table 8.2, Columns W6 and W7, compares the leachate rate of various parameters
from coal discard and HDS-sludge.

102
4000
8000
12000
16000
20000
24000
28000
Acc
. aci
dit
y [m
g C
aCO
3/kg
dis
card
]
0 2 4 6 8 10 12 14 16 18 20 22 24Week
Discard (control) - W6 HDS (control) - W7 Disc. + HDS - W3
Figure 8.2 : Comparison of the acid leached from coal discard and HDS-sludge.
Acid and metals are leached at a much slower rate from HDS-sludge, than from coal discard, as noted
below:
Acidity. From the slope of the graphs, it is calculated that 1120 mg acid (as CaCO3)/(kg discard.week)
and 39 mg acid (as CaCO3)/(kg sludge.week) is leached from coal discard and HDS-sludge
respectively (Figure 8.2). The almost zero acid leachate from HDS-sludge shows that it is stable with
regard to acid formation when contacted with water and air over time. This is due to the iron being in
the hydroxide form (Fe(OH)3) in the HDS-sludge and not in the sulphide form (FeS2), as is the case
with the coal discard.
Alkalinity. Small amounts of alkalinity is leached from the HDS-sludge. The sludge contains mainly
CaCO3 as alkali (50 g CaCO3 (as CaCO3)/kg sludge) and no free lime. The solubility of CaCO3 is very
low in neutral water.
Iron and Zinc. Insignificant amounts of total iron and zinc are leached from HDS- sludge. Although
HDS-sludge contained 40 000 mg total Fe/kg sludge, iron in the leachate decreased from a low 0.021
mg Fe/(kg sludge.week) during the initial week to 0.008 mg/(kg sludge.week) during week 12. This is

103
totally different from the constant high iron content in leachate from coal discard (321 mg Fe/(kg
discard.week)). Similarly, of the 400 mg Zn/kg sludge content, the initial and 12th weeks leached 0.039
and 0.015 mg Zn/(kg sludge.week) respectively. This is significantly less than the 7.8 and 0.6 mg
Zn/(kg discard.week) respectively for these two weeks in the case of coal discard.
Aluminium. In the case of aluminium (HDS-sludge contains 9000 mg Al/kg sludge) the leached
aluminium during the initial week and week 12 were 1.0 and 0.5 mg Al/(kg sludge.week) respectively.
This is less than that leached from coal discard (18.1 and 3.5 mg Al/(kg discard.week) in the initial and
12th weeks respectively).
Manganese. In the case of manganese (HDS-sludge contains 1000 mg Mn/kg sludge) the leached
manganese during the initial week and week 12 were 4.1 and 0.01 mg Mn/(kg sludge.week)
respectively. This is less than that leached from coal discard (15.2 and 1.0 mg Mn/(kg discard.week)
in the initial and 12th weeks respectively).
Table 8.3 : Dissolution of HDS-sludge (50 g) as a function of acid concentration (24 h contact period)
Parameter Concentration Acid dosage (ml/l 100 % HCl) 0 0.5 5 200 Acidity added (mg/l CaCO3) 0 300 2200 101850 Acidity determined (mg/l CaCO3) 250 300 2400 110000 pH 6.6 6.5 3.9 0.1 Sulphate (mg/l SO4) 1695 1768 2011 2421 Iron (mg/l Fe) 0.03 0.03 0.03 1340 Aluminium (mg/l Al) 0.1 0.1 34.1 350 Manganese (mg/l Mn) 0.03 0.03 17.9 96 Zinc (mg/l Zn) 0.03 0.03 3.7 14.0 Cadmium (mg/l Cd) 0.005 0.006 0.010 0.020 Chromium (mg/l Cr) 0.07 0.06 0.15 Lead (mg/l Pb) 0.24 0.29 0.54 1.33 Nickel (mg/l Ni) 0.12 0.13 2.22
8.3.2 Comparison between HDS and Other Treatment Options
(a) Acid generation
Figure 8.3 and Table 8.2 show the effect of various control methods on the leachate quality from coal
discard. All the methods investigated show that the nett acid generation (oxidation rate minus
neutralization rate) can be reduced effectively as indicated by the acid generation rates for the
corresponding treatment methods (Table 8.4).
This result proves that HDS-sludge, as well as activated sewage sludge, can be used effectively to

104
control acid generation caused by pyrite oxidation, and can be explained by the following mechanisms:
HDS-sludge. The pH of discard leachate amounts to between 2.2 and 2.6 (W6 - control), while when
mixed with HDS-sludge (W3), the pH is raised to between 6.0 (initial week) and 7.1 (week 12). The
effectiveness of HDS-sludge can be ascribed to the free alkali present in the sludge which neutralized
any acid produced as a result of FeS2 oxidation, or reduces the rate of pyrite oxidation due to the
increased pH. The HDS-sludge has a moisture content of 70 % and a free alkali-content of 50 g (as
CaCO3)/kg HDS-sludge. The discard contains 56 g (as CaCO3)/kg acid. Thus, by mixing discard and
HDS-sludge in the ratio 1:1, an excess alkali is available to neutralized the acid that might be generated
in the long term from the coal discard.
Table 8.4 : Acid generation rates for the various treatment options.
Option (Column no.) Rate in mg acid(as CaCO3)/ (kg discard.week)
Coal discard only (Control) (W6) 1120 Coal discard/Activated sludge (W10) 130 Discard submersed (W9) 127 Coal discard/HDS-sludge (W3) 56 Coal discard/Activated sludge submersed (W11) 44
5000
10000
15000
20000
25000
30000
Acc
. Ac
[mg
CaC
O3/
kg s
olid
]
0 2 4 6 8 10 12 14 16 18 20 22 24Week
Discard (control) - W6 Discard submersed - W9 AS sludge - W10
AS submersed - W11 HDS sludge - W3 HDS (control) - W7
Figure 8.3 : Effect of various control methods on the acid generated by coal discard.

105
Activated sludge (AS). Table 8.4 shows that activated sludge treatment is also effective, although not
as effective as HDS treatment (130 versus 56 mg acid(as CaCO3)/(kg discard.week)). The
effectiveness of activated sewage sludge can be ascribed to reducing conditions generated by organic
material.
Submersed discard. The effectiveness of submersion of discard (discard kept under water) can be
ascribed to the limitation of oxygen availability for pyrite oxidation.
Submersed and activated sludge. This method is the most effective due to the combined effect of
reducing conditions created by the activated sewage sludge and limited oxygen availability.
(b) Sulphate behaviour
Figure 8.4 shows the behaviour of sulphate when discard or HDS is combined with other solids and
contacted with water. It is noted that:
· Coal discard only. Accumulated sulphate increased with time mainly due to the oxidation of pyrite
(1318 mg (as SO4)/(kg discard.week)). The dissolution of gypsum that has accumulated on the
discard during the coal washing process does not contribute significantly to the sulphate load.
· HDS-sludge (control) and coal discard (2 parts) combined with HDS-sludge (1 part). Accumulated
sulphate increases with time due to dissolution of excess gypsum in the water which is under-
saturated with respect to gypsum (gypsum under-saturated water was used in this investigation).
The sulphate dissolution rate amounted to 918 mg (as SO4)/(kg sludge.week) in the case of HDS-
sludge only and to 1127 mg (as SO4)/(kg discard.week) in the case of coal discard combined with
HDS. Excess gypsum is present in HDS-sludge due to crystallisation of gypsum. Precipitated
gypsum dissolves quickly in water that is under-saturated with respect to gypsum until the saturation
level is reached. Should HDS-sludge be contacted with water that is saturated with gypsum (as the
case will be in the coal processing industry), no further gypsum dissolution is likely to occur.
· Coal discard (2 parts) combined with activated sludge (1 part) and submersed coal discard. Little
increase in sulphate (Figure 8.4) and acidity (Figure 8.3) was observed. This confirmed that:
Discard is not responsible for release of sulphate due to the presence of precipitated
gypsum.
Only limited pyrite oxidation occurred due to reducing conditions created by activated
sludge and elimination of oxygen in the case of submersion.
· Coal discard combined with activated sludge and when it is submersed. No increase in sulphate

106
concentration (as well as in the acidity) was observed, which indicated that the combination is
effective for inhibition of pyrite oxidation.
A disadvantage associated with the use of activated sludge for the control of pyrite oxidation is the
release of organic material. During the first week 2 760 mg COD/l leached out into the water when
coal discard is contacted with activated sludge. This amount decreased rapidly to 98 mg COD/l after
4 weeks. In the case of activated sludge combined with submersion, the COD of leachate amounted
to 550 mg COD/l during the initial week.
0
5000
10000
15000
20000
25000
30000
35000
Acc
. SO
4 [m
g S
O4/
kg s
olid
]
0 2 4 6 8 10 12 14 16 18 20 22 24Week
Discard (control) - W6 Discard submersed - W9 AS sludge - W10
AS submersed - W11 HDS sludge - W3 HDS (control) - W7
Figure 8.4 : Effect of various control methods on sulphate generated by coal discard.
8.3.3 Waste Classification of HDS-Sludge and Coal Discard
DWAF requires that wastes that need to be landfilled be characterised by using the EPA’s TCLP
(Toxicity Characteristic Leaching Procedure) method to determine the Estimated Environmental
Concentration (EEC) of toxic components. Landfill wastes is characterised into four Risk Hazard
Ratings (RHR) categories (1 - extreme hazard, 2 - high hazard, 3 - moderate hazard and 4 - low

107
hazardous), which is a function of chemical content, chemical load and disposal area (DWAF, 1998a).
The criteria for the landfill is determined by the RHR of the waste, e.g. RHR 1 to 4 can be disposed
into a H:H type landfill, RHR 3 to 4 in H:h type landfill and non-hazardous wastes to G:B+ and G:B- type
landfills (DWAF, 1998b).
Table 8.5 compares:
· The hazardous rating (RHR) of HDS-sludge with that of coal discard when disposed separately
(Columns B and C).
· The effect of area of the disposal facility on the hazardous rating (RHR) of HDS-sludge (Columns
B and D).
· The hazardous rating (RHR) of HDS-sludge with that of coal discard when co-disposed on the
current coal discard site (Columns C and D).
It is noted that:
· HDS-sludge from Brugspruit liming plant can be classified as a hazardous waste. This is due to the
fact that Zn, Mn, Co, Cd and Ni do not delist when measured against the set guidelines (Table 8.5,
Columns B2 versus A2). Disposal in a H:H type landfill is therefore required. Final classification
lies with DWAF.
· The hazardous rating (RHR) of HDS-sludge is improved when disposed on an increased area
(Columns B2 and D2). When HDS-sludge is disposed in a large area, only two elements are not
delisted (Mn and Cd) (Column D2), compared to seven elements when disposed in a small area
(Zn, Mn, Fe, Al, Co, Cd and Ni) (Column B2). This means that HDS-sludge almost delists when
disposed on the same site as the coal discard. Cadmium is a borderline case (e.g. EEC value of 5
that would have delisted at an EEC value of less than 3.1) and manganese is a more serious
problem in coal discard with an EEC value of 66710 (Column C1) opposed to 3613 (Column D1)
for the HDS-sludge (Table 8.5).
Table 8.5 : Comparison of HDS-sludge and coal discard waste classification.
Para- meter
Guideline HDS disposed in
lined pond Coal discard
HDS disposed on large area
Column No A B C D Size (Ha) 0.37 21.37 21.37 Load (t/month)
997 180000 997
ARL (ppb)
RHR EEC (ppb)
RHR EEC (ppb)
RHR EEC (ppb)
RHR
Column No A1 A2 B1 B2 C1 C2 D1 D2 Zn 700 2 20264 2 77829 2 347 D

108
Para- meter
Guideline HDS disposed in
lined pond Coal discard
HDS disposed on large area
Column No A B C D Size (Ha) 0.37 21.37 21.37 Load (t/month)
997 180000 997
Mn 300 2 210974 2 66710 2 3613 2 Fe 9000 3 25840 3 24460 3 442 D Cr(III) 4700 3 1978 D 3336 D 34 D Al(III) 10000 3 230279 3 11118 3 3943 D Co 6900 2 13190 2 3336 D 226 D Cu 100 2 96 D 667 2 2 D As 430 2 180 D 556 2 3 D Cd 31 1 294 1 556 1 5 1 Ni 1140 2 16487 2 3336 2 282 D ARL (Acceptable Risk limit) - Minimum requirement that need to be met by EEC values for
delisting EEC (Estimated Environmental Concentration)
- (Metal concentration in TCLP extract of HDS or coal discard (g/kg) x waste load (kg/month) ÷ size of site (ha)) x 0.66
RHR - Risk Hazard Rating D - Delist to a general waste
8.3.4 Practical Considerations
The following arguments, developed from this study, can be raised why permission should be
considered (by DWAF) for co-disposal of HDS-sludge with coal discard as a possible alternative to
disposal of HDS-sludge in lined ponds (depending on the outcome of similar and EIA studies as may
be required by DWAF):
· DS-sludge, when co-disposed with coal discard, will not contribute to increased toxicity of the
waste, in fact it will reduce the leachate of toxic metals from the coal discard as long as the pH
stays higher than 7. Excess alkali in the HDS-sludge will buffer the pH of the discard to levels
above 7, where the solubility of metals is low. Over dosages of HDS-sludge should be applied
when co-disposed with coal discard (recommended ratio for alkali:acid potential is 4:1) to prevent
acidic conditions due to pyrite oxidation. This will prevent additional metal leachate from the HDS-
sludge. Due to limited quantities of HDS-sludge compared to coal discard, co-disposal should be
limited to a small section of the coal discard dump in order to meet the above-mentioned alkali:acid
potential requirements. This will result in an excess of alkali, compared to the nett acid potential of
the discard, and will prevent free acid conditions in the long term due to pyrite oxidation.
If the above criteria are not met, acid conditions in the coal discard dump could cause metals in the
HDS-sludge to re-dissolve in the long term. This will contribute to the metal load in the leachate
from the coal discard dump. However, the nett effect on the metal load in the leachate will be
insignificant (Table 8.6). It is calculated from TCLP extracts that the metal contribution from HDS-

109
sludge, compared with that from coal discard, amounts to e.g. only 0.004 % for iron, and 0.5% for
manganese.
The co-disposal of HDS-sludge and coal discard, is an effective way for disposing HDS-sludge,
and could be integrated with the current approach where coal waste dumps need to be rehabilitated
after mine closure. The proposed co-disposal will prevent or reduce acid formation in coal discard
significantly for the period that it is exposed to atmosphere (water and air). When rehabilitation is
completed, such atmospheric contact would be eliminated almost completely, and the potential for
acid formation and HDS-sludge re-dissolution reduced even further.
Table 8.6 : Contribution of HDS-sludge to metal load in the leachate of coal discard during co-disposal (as measured in TCLP extracts)
Parameter Coal discard only
HDS-sludge
Metal load ratio (HDS-sludge: Discard) (%)
Concentration (mg/kg)
Load (kg/d)
Concentra-tion (mg/kg)
Load (kg/d)
Coal discard 20000000 HDS-sludge 10000 Zinc 7.8 156 11.3 0.113 0.072 Manganese 12 240 117 1.17 0.488 Iron 200 4000 14 0.14 0.004 Chromium 1 20 1.1 0.011 0.055 Aluminium 40 800 128 1.28 0.160 Cobalt 3.8 76 7.3 0.073 0.096 Nickel 4.6 92 9.2 0.092 0.100
· The quantity of HDS-sludge produced at a colliery, compared to coal discard, is insignificant. For
a mining operation of 20 000 t/d of raw coal, typically 6 000 t/d of coal discard is produced
compared to less than 10 t/d of HDS-sludge (when 100 % dry or 33 t/d when containing 70 %
water).
The alternative to co-disposal of HDS-sludge with coal discard in a specific section of the discard
dump is separate disposal. The justification for separate HDS-disposal in lined ponds, when it is
adjacent to the coal discard dump, should be reconsidered. This is supported by the low quantities of
HDS-sludge compared to coal discard and the almost zero leachate rate of metals from HDS-sludge,
provided that contact with acidic water is avoided.
8.4 CONCLUSIONS
The following conclusions are made from the investigation:

110
1. HDS-sludge from Brugspruit liming plant contains 50 g/kg alkali (as CaCO3) which can be used for
the neutralization of coal discard. Coal discard can have a nett neutralization potential of 56 g/kg
(as CaCO3).
2. The rate of pyrite oxidation and metal leachate production are reduced significantly when HDS-
sludge is co-disposed with coal discard. The acid generation rate of coal discard on its own was
1120 mg acid (as CaCO3)/(kg discard.week), as opposed to 39 mg acid (as CaCO3)/(kg
sludge.week) for coal discard combined with HDS-sludge.
3. Acid generation from coal discard can also be controlled with methods such as addition of
activated sludge (to create reducing conditions) or submersion (to eliminate oxygen introduction).
A disadvantage associated with activated sludge, however, is the leachate of organic material and
metals. Submersion is difficult to apply practically, and continuous wetting and drying conditions
can only aggravate the situation.
4. The hazardous rating (RHR) of HDS-sludge is improved when disposed on an increased area (e.g.
co-disposed with coal discard instead of separate disposal). HDS-sludge almost delists when
disposed on the same site as the coal discard. When HDS-sludge is disposed on only a section of
the discard dump, excess alkali, compared to the nett acid potential of the discard will prevent free
acid conditions due to pyrite oxidation, which will reduce the possibility of metal leachate in the long
term from both the HDS-sludge and the discard.

111
CHAPTER 9 : LIMESTONE HANDLING AND DOSING SYSTEM FOR
FULL-SCALE APPLICATION
9.1 INTRODUCTION
Coal discard, that contains pyrites, is produced as a waste during coal mining. When coal discard is
exposed to oxygen and water in the presence of iron oxidizing bacteria, acid leachate is produced
which contains high concentrations of acid, sulphate and metals due to oxidation of pyrites (Reaction
9.1).
2FeS2 + 71/2O2 + H2O ? Fe2(SO4)3 + H2SO4 (9.1)
Since 1996 extensive research and development work has been carried out at the Navigation Section
of Landau Colliery near Witbank in order to address the following problems associated with the
leachate from raw coal and coal discard: High cost of neutralization; High maintenance cost in the coal
processing plant and the lime neutralization plant due to acid corrosion and scaling of equipment; and
Desalinisation of effluent that is discharged into public streams.
Water is used in the coal processing plant to separate coal from waste, to grade the coal into different
particle size fractions, and for dust suppression. Water leaving the coal processing plant contains
slimes which are settled in a thickener. This slurry is pumped to the slimes dump and coarse coal
discard is transported on a belt conveyor to a discard dump. The slimes (fine coal) are disposed of in
the centre of the waste dump and the coarse discard disposed of around the perimeter to contain the
slimes. Decanted water is returned via the penstock to the coal processing plant. Some of this water
seeps through the discard dump and, together with rainwater, is collected in cut-off trenches at the
base of the dump. The seepage is stored in a toe dam. A portion of the toe dam water is combined
with the penstock water and other slightly polluted water prior to treatment in a primary liming plant.
In this operation, 20 000 ton per day (t/d) of raw coal is mined to produce 15 500 t/d of final product, 3
000 t/d of coal discard and 1 500 t/d of slimes (fine coal). The dump has an area of 72.5 ha (25.6 ha
under slimes and 46.9 ha under discard) and a height of 12 m. It is estimated that the dump contains
2.4 million tons of slimes and 4.3 million tons of discard, with the latter containing 2% pyrites (as S).
The discard is responsible for most of the pollution. A number of studies have been conducted at this
site since 1996 to characterize the nature and extent of pollution. The key findings are summarized
below:

112
· Acid leachate. Chemical leaching studies showed that 0.33 g acid (as CaCO3) is leached from each
kilogram of coal.
· Pyrites oxidation. The rate of biological oxidation of pyrites under laboratory conditions was
determined as 148 mg acid (as CaCO3)/(kg.d).
· Modelling of the water network showed that 24.1 t/d of sulphate enters the water network. Of this
7.3 t/d originates from the feed water, 5.8 t/d from the raw coal and 11 t/d from the coal discard.
An equal amount of sulphate leaves the system through gypsum precipitation (11 t/d through
neutralization of the toe seep water, 0.2 t/d in the primary neutralization plant, 4.5 t/d in the coal
processing plant and 3.2 t/d in the penstock) or with the seepage (5.1 t/d). A portion of the sulphate
that crystallizes out in the coal processing plant is in the form of scale on equipment such as
spirals, sieves and pipelines, as well as on magnetite used in the separation process.
· Magnetite behaviour. Electron microscope studies have shown the presence of needle-like
gypsum crystals surrounding the magnetite particles. These crystals interfere with the recovery of
magnetite at the magnetic separators.
· Relationship between the pH of the water and the alkali content in the ore. Acid water is produced
at mines having raw coal with a low alkali content. Other mines also produce high sulphate
concentrations due to pyrites oxidation, but the water is neutral as there is sufficient alkali present in
the raw coal to neutralize the acid produced from pyrites.
· Gypsum Over-Saturation Index (OSI – values shown in brackets). The OSI is the most important
parameter used as an indication of the likelihood of gypsum scaling. The water in the coal
processing plant (1.47), the thickener overflow (1.23) and the neutralization plant (1.07) are over-
saturated with respect to gypsum, with the return water from the penstock being the least over-
saturated (0.99). The latter can be attributed to the high rate of gypsum crystallization associated
with the contact of over-saturated feed with the high surface area afforded by the fine particles.
· The cost of neutralization could be reduced from R0.57/m3 (1 US$ = SA R8.50, August 2001) to
R0.16/m3 by replacing unslaked lime (acidity = 1000 mg/l, utilization efficiency = 60%, purity =
90%, price = R550/t) with powdered CaCO3 (acidity = 1000 mg/l, utilization efficiency = 90%, purity
= 75%, price = R110/t).
· Waste stream separation and treatment. A modelling exercise showed that the capital cost
associated with the neutralization and gypsum crystallization of 40 m3/h discard leachate with an
acidity of 11.5 g/l, could be reduced from R10.3 million to R3.0 million by treating streams with high
pollution loads separately from streams with low pollution loads. The total volume of the less
polluted streams is 3 Ml/d. Only slightly lower gypsum removal is achieved during separate
treatment, i.e. 8.9 t/d versus 9.5 t/d for of combined treatment.
· A modelling exercise showed that 30% of the over-saturated fraction in the primary neutralization
plant and 60% in the coal processing plant, crystallizes out as gypsum.

113
· A flow of 210 m3/h needs to be treated for the removal of sulphate to 350 mg/l in order to obtain an
OSI value of 0.98 (less than 1) in the coal processing plant. The capital cost of a biological
sulphate removal plant with this capacity is estimated at R11.6 million (R2.3 million/(Ml/d)) and the
running cost at R2.54/m3 (1.00 US $ = R8.50, August 2001).
As a result of these investigations and observations, an integrated process was proposed for the
treatment of coal discard leachate, consisting of the following stages (Figures 9.1 and 9.2):
· CaCO3 handling and dosing system
· CaCO3-neutralization stage which includes iron oxidation, precipitation and neutralization
· The treatment approach offers the following benefit: The cheapest alkali, a by-product from the
paper industry, is used for neutralization of the acid and for the removal of the bulk of the sulphate
concentration through gypsum crystallization.
The purpose of this chapter is to address the following:
· The performance of the full-scale calcium carbonate handling and dosing system.
· Pilot plant evaluation of calcium carbonate neutralization for the treatment of acid leachate.
9.2 MATERIALS AND METHODS
9.2.1 Feedstock
Powdered calcium carbonate, a by-product from the paper industry, was used for neutralization of acid
water. It contained 25% moisture and 10% impurities (dry mass) which was mainly silica. Coal
discard leachate or a synthetic solution of similar chemical composition was used as feed water for
the CaCO3 neutralization stage.
9.2.2 Equipment
The three stages of the integrated process were studied separately. The CaCO3 - handling and
dosing system (Figures 9.1 and 9.2) was evaluated on the first full-scale plant of its kind. It has a
capacity of 23 t/d CaCO3. The plant consists of the following:

114
A sloped concrete slab onto which the CaCO3 powder is dumped and stored. The CaCO3 powder is
slurried with a water jet and collected in a slurry tank through gravity flow.
· Ball valve in the slurry tank to maintain the water level at a specific height.
· CaCO3- recycle slurry pump that withdraws slurried CaCO3 of higher density from the slurry tank or
clear water through a water jet onto the CaCO3 dump to maintain a constant CaCO3 concentration.
The slurried CaCO3 is returned by gravity via the sloped concrete slab back to the slurry tank. The
CaCO3 concentration is controlled by the load cells underneath the slurry tank which activate/stop
the recycle pump at preset low/high values.
· Transfer pump, feeding slurried CaCO3 to the neutralization reactor.
Figure 9.1 Limestone handling and dosing system.

115
Figure 9.2. Process flow diagram for the treatment of coal discard leachate.
CaCO3 handling and dosing system:
CaCO3-dumpConcrete slab
Ground level
Slurry tank with stirrer on loadcells
CaCO3-slurry
CaCO3 treatment stage:
Air
TreatedCoal discard waterleachate
Fe2+ + 1/2O2 + 2H+ --> Fe3+ + H2O
Gypsum crystallizationpH 7.2
HRT = 4 h
Fe(OH)3 & Gypsum sludge

116
The CaCO3 neutralization stage consisted of a fluidized-bed reactor and a sludge separator
(Table 9.1). Compressed air was used for iron(II) oxidation.
Table 9.1 : Dimensions of CaCO3 neutralization pilot plant.
Parameter Value Fluidized-bed Solids separation Feed rate (l/h) 24 Recycle rate (l/h) 200 Diameter (m) Water height (m) Specific surface area (m2/m3) Up-flow velocity (m/h) Residence time (h)
0.20 4.99 20.2 6.37 6.53
0.53 0.35
- 0.91 3.22
9.2.3 Experimental
The performance of the various stages (CaCO3 neutralization, sulphate reduction and H2S-stripping)
was evaluated by determining the chemical composition of the feed and treated water during
continuous operation.
9.2.4 Analytical
Samples were collected regularly and filtered through Whatman No 1 filter paper. Sulphate, sulphide,
alkalinity, calcium, iron(II), mixed liquor suspended solids (MLSS), volatile suspended solids (VSS),
acidity and pH determinations were carried out manually according to procedures described in
Standard Methods (APHA, 1985). Calcium was analyzed using atomic absorption spectrophotometry.
Acidity was determined by titrating the solution to pH 8.3 using NaOH. The COD samples were pre-
treated with a few drops of H2SO4 and N2 to strip off H2S gas.
9.3 RESULTS AND DISCUSSION
9.3.1 CaCO3 Handling and Dosing System
Acidic water was neutralized effectively when powdered CaCO3 was used. The pH was raised from
2.9 to 6.5, acidity was reduced from 650 to 50 mg/l and iron(II) from 110 to less than 28 mg/l when
20% excess CaCO3 was dosed. Initially problems were experienced with blocked feed and recycle
pipelines as a result of grit and stone in the CaCO3. The recycle pipeline problem was solved by
installation of a sieve in the slurry tank opposite to the inlet of the recycle pipe. Grit and stones were

117
prevented from entering the feed line by installation of a grit separator. This unit consists of a pipe
(diameter = 450 mm, length = 1.2 m) positioned vertically in the reactor with its upper end above the
water level. The inlet of the feed pipe was moved from the bottom of the slurry tank to inside this pipe
at a level of 800 mm below water level. This arrangement ensured that the up-flow velocity in the unit
was high enough (20 m/h) to keep the fine CaCO3 particles in suspension but low enough to allow
settlement of all unwanted larger particles (coal, sand, grit and stones) before reaching the inlet of the
feed line.
9.3.2 CaCO3 Neutralization of Coal Discard Leachate
Limestone can be used in the integrated process for treatment of acid water. Table 9.2 shows the
results obtained when synthetic discard leachate was treated with limestone. The water was
neutralized effectively and sulphate was reduced from 8 342 to 1 969 mg/l (as SO4). It was possible
to achieve complete iron(II) oxidation by using only CaCO3 as the neutralization agent. This differs
from the standard approach where the pH is raised to 7.2 with lime where the rate of iron(II) oxidation
is fast. By using CaCO3, the pH of the water remains at 6 while iron(II) is oxidized.
Table 9.2 : Chemical composition of feed (synthetic discard leachate) and CaCO3 treated water Parameter Feed Treated pH 1.8 6.6 Acidity (mg/l CacO3) 7 300 100 Sulphate (mg/l SO4) 8 342 1 969 Ortho phosphate (mg/l P) 2.9 0.0 Chloride (mg/l Cl) 27 30 Iron(II) (mg/l Fe) 2 500 <56 Total iron (mg/l Fe) 2 500 <56
In this investigation it was determined that the rate of iron(II) oxidation is not only influenced by the
iron(II) , hydroxide and oxygen concentrations as suggested by Stumm and Lee (1961), but also by the
suspended solids concentration as suggested by Maree et al. (1998). In order to achieve complete
iron(II) oxidation sufficient reaction time was allowed for gypsum crystallization to reach its saturation
level (2 h). Aeration and sludge recirculated were applied to maintain a suspended solids
concentration at 50 g/l .

118
9.4 CONCLUSIONS
The following conclusions followed from the investigation:
· Powdered calcium carbonate in a dump can be slurried to a constant density and applied in the
treatment of acid water.
· Acid water, rich in iron(II), can be treated with calcium carbonate for neutralization, complete
removal of metals (iron(II), iron(III) and aluminium) and partial sulphate removal (to saturation level).

119
CHAPTER 10: CONCLUSIONS
The following findings were made during the investigation:
10.1. Biological Iron(II) Oxidation
Iron(II) should be oxidized to iron(III) before the neutralization of acid water with limestone, otherwise
the oxidation will occur downstream of the neutralization plant with the formation of acid. This study
aimed at investigating the kinetics of biological iron(II) oxidation in a plate reactor and to identify the
suitability of a plate reactor for biological iron(II) oxidation. The study showed that the highest
achievable rate was 120 g Fe2+/(l.d) (O2-flow= 70 ml/min; T = 20.5°C; surface area = 847 m2/m3). The
kinetics of the biological iron(II) oxidation in a plate reactor can be described as: d[Fe2+]/dt =
k.[Fe2+]0.5.[RSA]1.[O2]0.5
Biological iron(II) oxidation to achieve low iron(II) concentrations is needed as pre-treatment to enable
effective limestone neutralization. The effect of various parameters on biological iron(II) oxidation was
investigated, including oxygen transfer, iron(II) concentration, support medium surface area, type of
support medium, reactor configurations and flow regime. The study showed that the kinetics of
biological iron(II) oxidation follow the rate equation:
0.15.0f
5.0 AR)]II(Fe[kdt
)]II(Fe[d=−
where, Rf = reciprocating frequency (oxygenation), and
A = support medium surface area.
By treating acid water with a pH of 2 and an iron(II) concentration of 3000 mg/l an oxidation rate of
74 g Fe/(1 medium.d) and effluent iron(II) concentration of 300 mg/l was attained in a continuously
operated submersed packed-column reactor (at 24 °C). The medium used was silica sand (particle
size of 4.75 to 6.35 mm) at a cost of R100/t (1 USD = S.A. R6). At a loading rate of 20
g Fe/(l medium.d) the iron(II) is removed to less than 60 mg/l in the effluent.

120
10.2 Integrated Neutralization Process
A novel process is described for the neutralization of acid streams produced during coal mining and
processing. The leachate from a waste coal dump was neutralized with limestone for the removal of
iron, aluminium and sulphate. Specific aspects studied were the process configuration, the rates of
iron(II) oxidation, limestone neutralization and gypsum crystallisation, the chemical composition of the
effluents before and after treatment, the efficiency of limestone utilization and the sludge solids
content.
The study showed that the acid content was reduced from 12 000 to 300 mg/l (as CaCO3), sulphate
from 15 000 to 2 600 mg/l (as SO4), iron from 5 000 to 10 mg/l (as Fe), aluminium from 100 to 5 mg/l
(as Al) while the pH increased from 2,2 to 7,0. Reaction times of 2.0 and 4.5 h are required under
continuous and batch operations respectively for the removal of 4 g/l iron(II) (as Fe) . The iron(II)
oxidation rate equation is a function of the iron(II), hydroxide, oxygen and suspended solids
concentrations. The optimum suspended solids concentration for iron(II) oxidation in a fluidized-bed
reactor is 190 g/l. Upflow velocity has no influence on the rate of iron(II) oxidation in the range 5 to 45
m/h. Sludge with a high solids content of 55% is produced. This compares well with the typical 20%
solids content that can be achieved with the High Density Sludge process in the case of lime
neutralization. Neutralization cost of acid water can be reduced significantly with the integrated iron(II)
oxidation and limestone neutralization process as limestone instead of lime is used and sludge with a
high solids content is produced. The alkali cost to treat discard leachate with an acidity of 10 g/l (as
CaCO3) amounts to R5.15/m3, R2.79/m3, R1.37/m3 and R1.95/m3 for slaked lime, unslaked lime,
limestone when milled on-site and purchased limestone respectively. The expected capital cost for a 1
Ml/d integrated iron(II) oxidation and neutralization plant is R1.87 million when the alkali is purchased
and R1.87 million when limestone is milled on-site.
Design criteria were provided for full-scale application.
10.3 High Density Sludge (HDS) Process
Acid mine drainage (AMD) poses serious pollution problems if discharged untreated into public
streams. Up to date, the conventional and High Density Sludge (HDS) processes are used to
neutralize AMD. The conventional neutralization process produces sludge with low sludge solids
content. Although the HDS process produces sludge with high sludge solids content, one of the
disadvantages is the difficulty to control the process, especially where there is fluctuation in flow rates

121
and acid concentrations. It is thus priority to improve the existing HDS process. Less pH fluctuation
occurred during the operation of the Modified HDS process due to better pH control and fluctuation
could be contained between pH 7.47 and 7.59 for most of the time. Existing lime neutralization plants
can be adapted with minor changes to accommodate the modified HDS process.
This investigation compared the HDS and modified HDS process configurations with beaker studies
and on laboratory pilot plant scale. Results from the continuous laboratory pilot scale studies
confirmed findings from the laboratory beaker studies. The Modified HDS process gave better lime
utilization, higher sludge solids concentrations, and faster settling rates.
The more CaCO3 added during the beaker studies, the less lime was used; the higher the sludge solids
content; and the faster the settling rates.
Waters high in sulphates are less suitable for treatment with the HDS or Modified HDS processes due
to gypsum scaling.
10.4 Leachate Studies
Coal discard, fines and high density sludge (HDS-sludge) are generated during coal mining. Both,
discard and HDS-sludge can be classified as hazardous wastes which require special disposal criteria.
Discard dumps need to be designed in such a way that contact between discard, water and air is
minimised to ensure minimum acid formation. For the disposal of hazardous HDS-sludge, legislation
requires that it be discharged into lined ponds, which is costly, to prevent metal leachate from polluting
groundwater. The purpose of this investigation was to investigate the benefits associated with co-
disposal of HDS-sludge and coal discard. It is argued that there is little environmental benefit to
disposal of HDS-sludge in lined ponds compared to the co-disposal of HDS-sludge with coal discard.
Co-disposal of High Density sludge (HDS-sludge) with coal discard would offer the following benefits:
cost reduction as costly sludge disposal ponds are not required and neutralization capacity is created
as HDS-sludge usually contains unused alkali. Permission for such co-disposal, however, is
dependant on an Environmental Impact Assessment as required by DWAF. The purpose of this
investigation was to: demonstrate that co-disposal of HDS-sludge and coal discard offers an effective
alternative to disposal of HDS-sludge in lined landfills, compare the efficiency of HDS with other
methods for the control of pyrite oxidation in coal discard and to determine the potential toxicity of
leachate from the untreated and treated coal discard.

122
It was found that: (1) HDS-sludge from Brugspruit liming plant contains 50 g/kg alkali (as CaCO3) which
can be used for the neutralization of coal discard, (2) the rate of pyrite oxidation and metal leachate
are reduced significantly when HDS-sludge is co-disposed with coal discard, compared with that of
coal discard on its own and (3) acid generation from coal discard can also be controlled with methods
such as addition of activated sludge (to create reducing conditions) or submersion (to eliminate
oxygen ingress).
10.5 Full-scale Application
A CaCO3 handling and dosing has been developed and demonstrated at full-scale that: (i) powdered
calcium carbonate in a dump can be slurried to a constant density and applied for treatment of acid
water; (ii) Acid water, rich in iron(II) can be treated with calcium carbonate for neutralization, complete
removal of metals (iron(II), iron(III) and aluminium) and partial sulphate removal (to saturation level).

123
CHAPTER 11: RECOMMENDATIONS
11.1 RECOMMENDATIONS
It has been demonstrated in this investigation that limestone neutralization can be implemented on full-
scale and will achieve the following:
· Neutralization of strong or weak acidic solutions using limestone or powder calcium carbonate in
the most cost-effective way.
· Removal of metals such as iron(II), iron(III) and aluminium. Metals such as zinc and manganese
are not removed during limestone neutralization.
· Partial sulphate removal through gypsum crystallization to the saturation level of gypsum. Sulphate
can be removed to between 1 500 and 2 500 mg/l (as SO4) through gypsum crystallization,
depending on the sodium and magnesium concentrations in solution. This value is higher than the
200 to 500 mg/l that is required for discharge into public streams, or to be suitable for drinking
water.
It is recommended that further work be done in order to provide an integrated solution to treat water to
the level suitable for discharge into public streams and for drinking water. This would entail the
following :
· Evaluate the calcium carbonate/lime/gypsum crystallization process for partial sulphate removal to
less than 1 100 mg/l. In this process sulphate is reduced to less than 1 100 mg/l through gypsum
crystallization by raising the pH with lime to 12. Increased sulphate removal is achieved as
magnesium and sulphate associated with magnesium is removed. Due to the high calcium
concentration in solution at pH 12, sulphate is removed to lower levels due tot the solubility product
of calcium and sulphate ions.
· Evaluate the biological sulphate removal process for the reduction of sulphate to levels less than
500 mg/l using coal gas as energy source. It has been demonstrated on pilot-scale (400 m3/d) that
sulphate can be removed to less than 200 mg/l provided that sufficient energy source is dosed.
Ethanol was used as energy source. Ethanol, unfortunately has the following disadvantages:
- Costly. At a dosage of 0.8 g/l and a price of R3 750/ton the ethanol cost amount to R3/m3.
- An aerobic stage is required for removal of residual organic material as a portion of the ethanol
is converted to acetate and is not utilized for sulphate reduction.

124
· Develop a spreadsheet based model to identify the most cost-effective combination of processes
for a specific application. Sulphate for instance can be removed at the lowest cost with limestone
(14 c/kg SO4 for chemical cost, but only to a level of 2 500 mg/l), or at a higher cost with lime (41
c/kg SO4 for chemical cost, to a level of 1 100 mg/l) or to low levels with the biological process
(R1.50/kg SO4, to a level less than 500 mg/l). Such a model will determine the chemical
composition of the treated water, size and cost of the various capital items, total capital and
running cost. As input the model will require the flow rate of the various feed water streams and
their chemical compositions.
· Estimate the total volume and chemical composition of mining effluents (coal, gold and platinum)
that need to be treated.

125
CHAPTER 12: REFERENCES
APHA, (1985). Standard methods for the Examination of Water and Wastewater treatment. Twelfth Edition, American Public Health Association, New York.
Barnes, H.L. and Romberger, S.B., (1968). Chemical aspects of acid mine drainage. Journal WPCF, 40 (3), 371 - 384. Barron J.L., Luecking D.R. (1990). Growth and maintenance of Thiobacillus ferrooxidans cells, Appl Environ Microbiol 56 (9), 2801-2806 Boynton R S, (1966). Chemistry and Technology of Lime and Limestone, John Wiley, New York. Brock T.D., Madigan M.T. (1991) Biology of Microorganisms, 6th Edit, Prentice-Hall, Inc. COAL AGE, (1969). 75, (2), 112-114. Department of Water Affairs and Forestry (DWAF), (1998a). Minimum Requirements for the Handling, Classification and Disposal of Hazardous Waste, 2nd Edition, 1998a. Department of Water Affairs and Forestry (DWAF) (1998b). Minimum Requirements for Waste
Disposal by Landfill, 2nd Edition. Deul, M. and Mihok, E.A., (1967). Mine water research - Neutralization, US Bureau of Mines,
Report of Investigations 6987. Diz, H.R., Novak, J.T. and Rimstidt, J.D. (1999). Iron precipitation kinetics in synthetic acid mine drainage. Journal of the International Mine Water Association 18(1): 1-14. Du Plessis, P. and Maree, J.P. (1994). Neutralization of acid water in the chemical industry with limestone, Wat. Sci. Tech. 29 (8), 93-104. EPA, (1992). Toxicity Characteristic Leaching Potential method, Division 0, No 1311. Ford, C T, (1970). Selection of limestones as neutralising agents for coal-mine water, Third
Symposium on Coal Mine Drainage Research, Mellon Institute, Pittsburg, Pennsylvania, May, 27 - 51.
Glover, H.G., Hunt, J. and Kenyon, W.G., (1965). Process for the bacteriological oxidation of ferrous salts in acid solution, U S Patent 3,218,252, November. Hill, R D and Wilmoth, R C (1971). Limestone treatment of acid mine drainage, Society of Mining Engineers, AIME, Transactions 250, 162 - 166. Hoak, R.D., Lewis, C.J. and Hodge, W.W., (1945). Treatment of spent pickling liquors with limestone and lime, Industrial and engineering chemistry, 36, (6). Hölmström, H., Ljungberg, J. and Öhlander, B., (1999). Role of Carbonates in Mitigation of Metal
Release from Mining Waste. Evidence from Humidity Cells, Environmental Geology, 37 (4), p267 – 280.

126
Holuigue L., Herrera L., Philips O.M., Young M., Allende J.E. (1987). CO2 fixation by mineral-leaching bacteria: characteristics of the ribulose biphosphate carboxylase-oxygenase of Thiobacillus ferrooxidans, Biotechnl Appl Biochem 9, 497-505.
Jacobs, H L, (1947). Acid neutralization, Chemical Engineering Process, 43 (5). Kelly D.P., Jones C.A. (1978). Factors affecting metabolism and ferrous iron oxidation in suspensions
and batch culture of Thiobacillus ferrooxidans: relevance to ferric iron leach solution regeneration. In: Murr, L.E., Torma, A.E., Brierly, J.A. (Eds.). Metallurgical Applications of Bacterial Leaching and Related Microbiological Phenomena, Academic Press, NY, pp 19-43
Kostenbader, P.D. and Haines, G.F. (1970). High-density sludge treats acid. Coal Age. 90-97,
September 1970. Knight, R.J. and Sylva, R.N. (1974). Precipitation in Hydrolyzed Iron(III) solutions. Journal inorg.
Nucl. Chem., 36: 591-597. Lawrence, R.W., (1990) Prediction of the behaviour of mining and processing wastes in the
environment, Proc. of the Western Regional Symp. on Mining and Mineral Processing Wastes. Ed. Doyle, F.M. Ch. 14, p 115-121.
Maree, J P & du Plessis, P (1993). Neutralization of acid water with calcium carbonate. In:
Proceedings, International Specialised Conference on Pretreatment of Industrial Wastewaters. IAWQ. Athens, Greece, pp. 399-411.
Maree, J.P., du Plessis, P. (1993). Neutralization of acid mine water with calcium carbonate. Proc.
IAWQ Conf. on Pre-treatment of Industrial Wastewaters, Athens, 399-411. Maree, J P, (1994). Neutralization of acidic effluents with limestone, WRC Report No 355/1/94. Maree, J P & Clayton, J A (1992). United States Patent. 20 October 1992. Patent Number: 5156746. Maree, J.P., (1996). Underground neutralization of mine water with limestone, WRC Report No
609/1/96. Maree, J P, de Beer, M, Strydom, W F & Christie, A D M (1998b). Limestone neutralization of acidic
effluent, including metal and partial sulphate removal. In: Proceedings IMWA Symposium. Johannesburg, South Africa, pp. 449-460.
Maree, J. P. Dingemans, D. van Tonder, G. J. and Mtimkulu, S. (1998). Biological iron(II) oxidation
as pre-treatment to limestone neutralization of acid water, Proc. of the IAWQ 19 th Biennial International Conference, Vancouver, Canada, to be held from 21 - 26 June.
Maree, J P, Dingemans, D, van Tonder, G J & Mtimkulu, S (1998a). Biological iron(II) oxidation as
pre-treatment to limestone neutralization of acid water. Wat Sci Tech, 38(4-5), 331-337.

127
Maree J.P., Dingens, D., Van Tonder, G.J., Mtimkulu, S. (1998) Biological iron (II) oxidation as pre-
treatment to limestone neutralization of acid water, Proc. International Assoc on Water Quality (IAWQ), 19th Biennial International Conference, Vancouver, Canada, 21-26 June.
Maree, J P & du Plessis, P (1993). Neutralization of acid water with calcium carbonate. In:
Proceedings, International Specialised Conference on Pretreatment of Industrial Wastewaters. IAWQ. Athens, Greece, pp. 399-411.
Maree, J.P., de Beer, M. Strydom, W.F., and Christie, A.D.M. (1998). Limestone neutralization of
acidic effluent, including metal and partial sulphate removal, Proc. of the International Mine Water Association Symposium, Johannesburg, South Africa, 6 - 13 September, 449-460.
Maree, J P and du Plessis, P. (1994). Neutralization of acid mine water with calcium carbonate, Wat.
Sci. Tech. 29 (9), 285-296. Maree, J P, du Plessis, P and van der Walt, C J. (1992). Treatment of acidic effluents with limestone
instead of lime, Wat. Sci. Tech. 26 (1-2), 345-355. Maree, J P, Strobos, G, Greben, H, Günther, P and Christie A D M, (2001). Biological treatment of
mine water using ethanol as energy source, Conference on Environmentally Responsible Mining in South Africa, Muldersdrift, South Africa, 25 – 28 September.
Maree, J.P., Strydom, W.F. and de Beer, M. (1997). Integrated iron(II) oxidation and limestone
neutralization of acid mine water, Proceedings of the International Association on Water Quality (IAWQ), Specialised Conference on Chemical Process Industries and Environmental Management, Cape Town, South Africa, 6 - 10 September
Maree, J P, van Tonder, G J, Adlem, C, Millard, P, de Beer, M & Strydom, W F (1997). Pilot plant
studies on limestone neutralization and gypsum crystallisation of acidic colliery effluent. CSIR Report.
Maree, J P, Van Tonder, G J, Millard, P and Erasmus, C. (1996a). Pilot scale neutralization of
underground mine water. Wat. Sci. Tech. 34 (10), 141 - 149. Maree, J P, Van Tonder, G J, Millard, P and Erasmus, C. (1996b). Underground neutralization of mine water with limestone. Water Sewage and Effluent, 16 (3), 21 -23. Mihok, E A Deul, M Chamberlain, C E and Selmeczi, J G, (1968). Mine water research - The
limestone neutralization process, US Bureau of Mines, Report of Investigations 7191. Mihok, E A, (1970). Mine water research - Plant design and cost estimates for limestone treatment,
US Bureau of Mines, Report of Investigations 7368. Nemati, M., Webb, C. (1996) Effect of ferrous iron concentration on the catalytic activity of
immobilized cells of Thiobacillus ferrooxidans. Appl Microbiol Biotechnol 46, 250-255 Nemati, M & Webb, C (1997). Does immobilization of Thiobacillus ferrooxidans really decrease the
effect of temperature on its activity? Biotechnol Lett, 19 (1), 39-43. Nemati, M., Webb, C. (1998) Ferrous sulphate oxidation by combined biological and chemical
catalysis using Thiobacillus ferrooxidans immobilized in activated carbon coated biomass

128
support particles, Biotechnology Progress (submitted). Nemati, M., Webb, C. (1999) Combination biological chemical oxidation of ferrous sulphate using
immobilised Thiobacillus ferrooxidans. J Chem Technol Biotechnol, 74, 562-570 Osuchowski, R., (1992). Advanced treatment of acid mine water. Technology SA, April, 9 - 11. Price, W.A., Morin, K. and Hutt, N. (1997). Guidelines for the prediction of Acid Rock Drainage and
metal leaching for mines in British Columbia: Part II - Recommended procedures for static and kinetic testing, Proc. of the 4 th International Conf. on Acid Rock Drainage, Vancouver, BC, P 15 – 30.
Pritts, J. W., Neufeld, R. D., and Cobb, J. T., (1999). Stabilisation of heavy metal containing
hazardous wastes with by-products from advanced Clean Coal Technology Systems, Journal of the Air & Waste Management Association, 49, p1190 – 1200.
Pulles, W. (1994). Underground settling in South African gold mines, Chemical Technology,
July/August, 5-7. September, 587-597. Silverman M.P., Lungren, D.G. (1959) Studies on the chemoautotrophic iron bacterium Thiobacillus
ferrooxidans, an improved medium and harvesting procedure for securing high cell yields. J Bacteriol., 77, 642-649
Stumm, W & Lee, G F (1961). Oxygenation of ferrous iron. Industrial and Engineering Chemistry, 53(2), 143-146.
Stumm. W. and Morgan, J.J. (1970) Aquatic Chemistry, An Introduction Emphasizing Chemical
Equilibria in Natural Waters. John Wiley & Sons, Inc. Van Tonder, G J & Schutte, C F (1997). The effect of metal cations on the kinetics of limestone
neutralization of acid waters. Environ Technol, 18, 1019-1028. van Zyl, H.C, Maree, J.P., van Niekerk, A.M., van Tonder, G.J., and Naidoo, C. (2000). Collection,
treatment and re-use of mine water in the Olifants River Catchment, Proceedings of the 12 th Intenational Conference on Coal Research, Sandton Convention Centre, Sandton, South Africa.
Vogel, A.I. (1989) Vogel’s textbook of quantitative chemical analysis, 5th Edit, Longman, London Vogel, A.I. (1989). Textbook of quantitative chemical analysis. Fifth edition, John Wiley and Sons,
New York, p. 368. Volpicelli, G., Caprio, V. and Santoro, L., (1982). Development of a process for neutralising acid
waste waters by powdered limestone, Env. Techn. Letters, 6, 97 - 102. Wilmoth, R.C., (1974). Limestone and limestone-lime neutralization of acid mine drainage, National
Environmental Research Centre, EPA, Cincinnati, Report No. EPA-670/2-74-051.