neutral expensive, but beautiful - hdfcsec.com small finance bank - ic - hdfc... · au is a...
TRANSCRIPT

INITIATING COVERAGE 29 SEP 2017
AU Small Finance Bank NEUTRAL
HDFC securities Institutional Research is also available on Bloomberg HSLB <GO> & Thomson Reuters
Expensive, but beautifulAU Small Finance Bank (AU) was an NBFC till Mar-17. Its loan portfolio of Rs 108bn (Jun-17) is well-diversified across Vehicle Finance (VF), MSME and SME loans. AU’s lending is focussed on underserved segments in urban, semi-urban and rural India, and offers investors multi-year growth opportunities. While headline valuations appear stiff (5.6x FY20E ABV), underlying business opportunities and management strengths are strong.
Initiate coverage with NEUTRAL and a TP of Rs 530 (5.2x FY20E ABV, 31x FY20E EPS). Faster growth and fund raising at high valuations are typically book value accretive and rewarding for shareholders, as seen in lenders like Bajaj Finance, IndusInd Bank, Kotak, etc. However, with AU adequately capitalised for the next two to three years (Tier 1 ~18.9%), this upside may not materialise immediately.
Despite AU’s scorching 33% AUM CAGR during FY12-17, we believe it will deliver 31% CAGR over FY17-20E, given large underpenetrated credit segments that it has mastered. Asset quality is underscored by a conservative lending approach and robust processes, along with collateral backing.
Meanwhile, AU has incurred capex of Rs 3.3bn on technology and branch roll out for SFB conversion. In the near-term, C/I will rise by 19pp to 57.6% in FY18E, and gradually taper off. ROA will drop 140bps to 1.7% by FY20E, owing to CRR/SLR requirements and higher opex.
Key investment arguments Diversified book: AU’s loan book is diversified, with VF
contribution at 49%, and the balance coming in from MSME and SME segments. We expect AUM to grow at 31% CAGR over FY17-20E, supported by new product launches like Business Banking, Agri Allied, etc. Home loans (AU sold its HF sub in FY17) will be re-started by 1QFY19.
Huge growth potential: AU’s presence is largely in the underbanked segments, with a small ticket size in VF, MSME and SME. These underpenetrated segments, coupled with lower financial penetration in its main markets like Rajasthan, Gujarat etc., provide growth opportunities, along with attractive higher yields.
Liability franchise benefit is expected to be gradual, as AU has adopted a strategy of converting some asset branches into bank branches, and continuing with some asset centres. It is also opening pure liability branches in key locations in metros and urban areas to attract CASA and Retail deposits. We expect Retail deposits (including CASA) to inch up to 20% in the liabilities mix by FY20E.
Financial Summary Rs. Mn FY17 FY18E FY19E FY20E AUM 107,339 140,432 183,869 242,930 AUM Growth (%) 30.6 30.8 30.9 32.1 NII 9,342 11,695 14,895 19,208 PPOP 5,813 5,588 7,253 9,851 Adj. PAT 3,259 2,762 3,601 4,891 ROAE (%) 21.72 13.00 14.93 17.46 ROAA (%) 3.1 1.6 1.6 1.7 P/Adj. BV (x) 8.3 7.6 6.5 5.6 P/E (x) 49.5 58.4 44.8 33.0 Source: Company, HDFC sec Inst Research
INDUSTRY Banks
CMP (as on 29 Sep 2017) Rs 567
Target Price Rs 530 Nifty 9,789
Sensex 31,284
KEY STOCK DATA
Bloomberg AUBANK IN
No. of Shares (mn) 284
MCap (Rs bn) / ($ mn) 161/2,471
6m avg traded value (Rs mn) -
STOCK PERFORMANCE (%)
52 Week high / low Rs 726 / 496
3M 6M 12M
Absolute (%) - - -
Relative (%) - - -
SHAREHOLDING PATTERN (%)
Promoters 32.8
FIs & Local MFs 23.5
FPIs 37.6
Public & Others 6.1 Source : Company
Vishal Rampuria [email protected] +91-22-6171-7325
AU SMALL FINANCE BANK : INITIATING COVERAGE
Page | 2
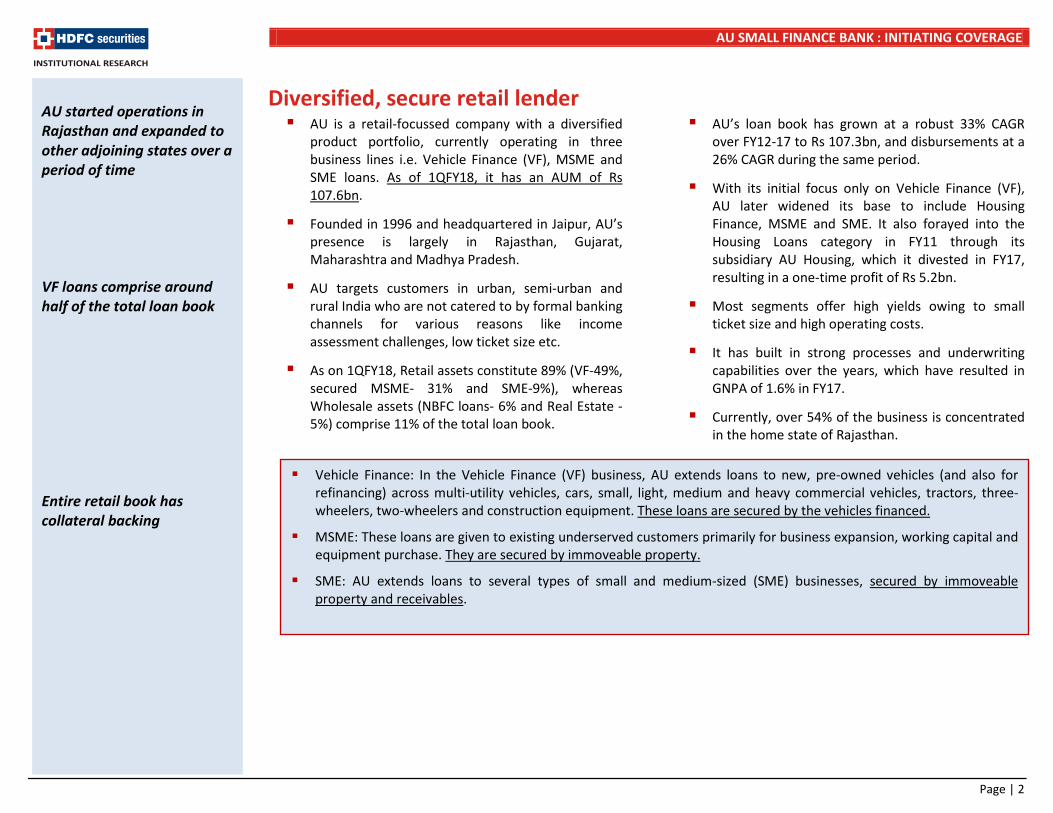
Diversified, secure retail lender AU is a retail-focussed company with a diversified
product portfolio, currently operating in three business lines i.e. Vehicle Finance (VF), MSME and SME loans. As of 1QFY18, it has an AUM of Rs 107.6bn.
Founded in 1996 and headquartered in Jaipur, AU’s presence is largely in Rajasthan, Gujarat, Maharashtra and Madhya Pradesh.
AU targets customers in urban, semi-urban and rural India who are not catered to by formal banking channels for various reasons like income assessment challenges, low ticket size etc.
As on 1QFY18, Retail assets constitute 89% (VF-49%, secured MSME- 31% and SME-9%), whereas Wholesale assets (NBFC loans- 6% and Real Estate -5%) comprise 11% of the total loan book.
AU’s loan book has grown at a robust 33% CAGR over FY12-17 to Rs 107.3bn, and disbursements at a 26% CAGR during the same period.
With its initial focus only on Vehicle Finance (VF), AU later widened its base to include Housing Finance, MSME and SME. It also forayed into the Housing Loans category in FY11 through its subsidiary AU Housing, which it divested in FY17, resulting in a one-time profit of Rs 5.2bn.
Most segments offer high yields owing to small ticket size and high operating costs.
It has built in strong processes and underwriting capabilities over the years, which have resulted in GNPA of 1.6% in FY17.
Currently, over 54% of the business is concentrated in the home state of Rajasthan.
Vehicle Finance: In the Vehicle Finance (VF) business, AU extends loans to new, pre-owned vehicles (and also for refinancing) across multi-utility vehicles, cars, small, light, medium and heavy commercial vehicles, tractors, three-wheelers, two-wheelers and construction equipment. These loans are secured by the vehicles financed.
MSME: These loans are given to existing underserved customers primarily for business expansion, working capital and equipment purchase. They are secured by immoveable property.
SME: AU extends loans to several types of small and medium-sized (SME) businesses, secured by immoveable property and receivables.
AU started operations in Rajasthan and expanded to other adjoining states over a period of time VF loans comprise around half of the total loan book Entire retail book has collateral backing

AU SMALL FINANCE BANK : INITIATING COVERAGE
Page | 3
Loan Book Growth (%) Disbursement Growth (%)
Source: Company, HDFC sec Inst Research Source: Company, HDFC sec Inst Research
State-Wise AUM: West Dominates Strong Presence In The Semi-Urban/Rural Markets
FY13 FY14 FY15 FY16 FY17 Rajasthan 50% 54% 59% 58% 54% Maharashtra 15% 15% 13% 13% 13% Gujarat 27% 20% 14% 12% 12% Madhya Pradesh 3% 5% 6% 8% 11% Delhi 0% 2% 3% 5% 5% Punjab 3% 3% 3% 3% 3% Chhattisgarh 1% 1% 1% 1% 1% Haryana 0% 0% 0% 0% 1% Himachal Pradesh 0% 0% 0% 0% 0% Goa 1% 0% 0% 0% 0%
Source: Company, HDFC sec Inst Research
Source: Company, HDFC sec Inst Research
25.5 37
.0 44.5
55.7
82.2
107.
3
140.
4
183.
9
242.
9
45
20 25
48
31 31
31
32
2.57.512.517.522.527.532.537.542.547.552.5
20.0
70.0
120.0
170.0
220.0
270.0
FY12
FY13
FY14
FY15
FY16
FY17
FY18
E
FY19
E
FY20
E
AUM (Bn) Growth (%) - RHS
20.8
24.4
26.9
33.8
56.2
67.3
88.6
111.
2
145.
2
17 10
26
66
2032
2630
2.5
12.5
22.5
32.5
42.5
52.5
62.5
72.5
0.0
20.0
40.0
60.0
80.0
100.0
120.0
140.0
160.0
FY12
FY13
FY14
FY15
FY16
FY17
FY18
E
FY19
E
FY20
E
Disbursement (Bn) Growth (%) (RHS) AUM has grown at a CAGR of 33% over the past 5 years Top four States contribute 90% to AUM
Metro13%
Urban25%
Semi-Urban32%
Rural29%
AU SMALL FINANCE BANK : INITIATING COVERAGE
Page | 4
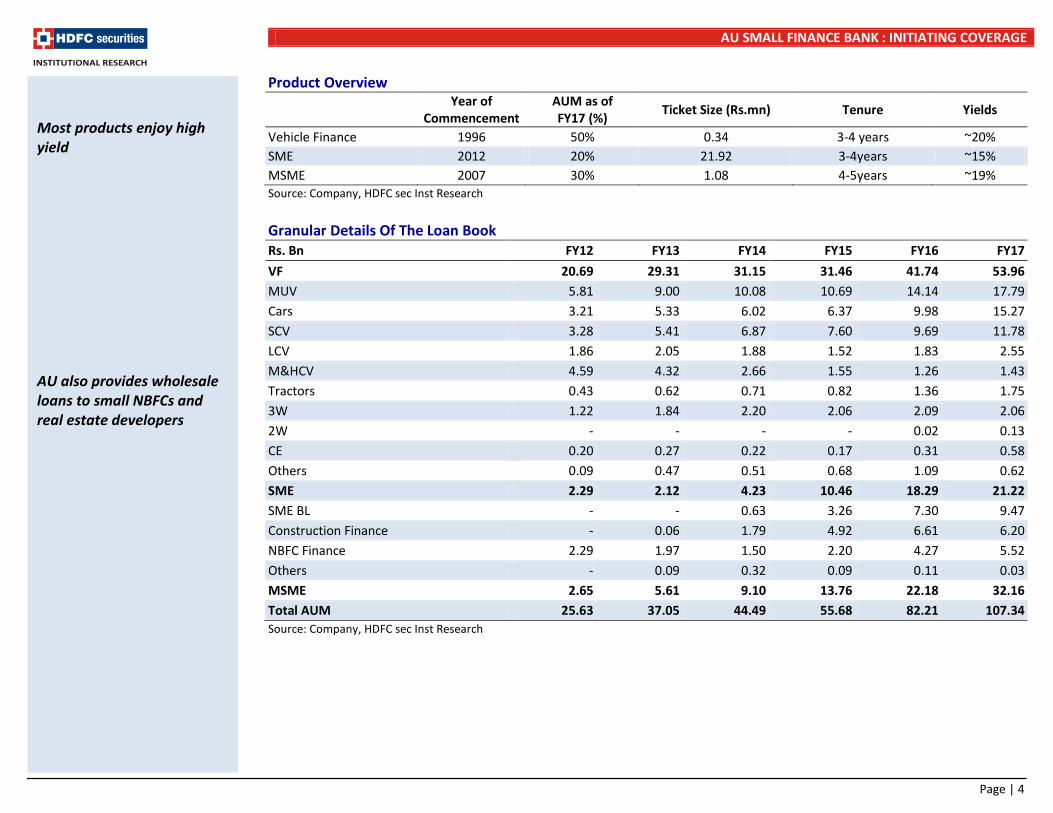
Product Overview
Year of Commencement
AUM as of FY17 (%) Ticket Size (Rs.mn) Tenure Yields
Vehicle Finance 1996 50% 0.34 3-4 years ~20% SME 2012 20% 21.92 3-4years ~15% MSME 2007 30% 1.08 4-5years ~19% Source: Company, HDFC sec Inst Research Granular Details Of The Loan Book Rs. Bn FY12 FY13 FY14 FY15 FY16 FY17 VF 20.69 29.31 31.15 31.46 41.74 53.96 MUV 5.81 9.00 10.08 10.69 14.14 17.79 Cars 3.21 5.33 6.02 6.37 9.98 15.27 SCV 3.28 5.41 6.87 7.60 9.69 11.78 LCV 1.86 2.05 1.88 1.52 1.83 2.55 M&HCV 4.59 4.32 2.66 1.55 1.26 1.43 Tractors 0.43 0.62 0.71 0.82 1.36 1.75 3W 1.22 1.84 2.20 2.06 2.09 2.06 2W - - - - 0.02 0.13 CE 0.20 0.27 0.22 0.17 0.31 0.58 Others 0.09 0.47 0.51 0.68 1.09 0.62 SME 2.29 2.12 4.23 10.46 18.29 21.22 SME BL - - 0.63 3.26 7.30 9.47 Construction Finance - 0.06 1.79 4.92 6.61 6.20 NBFC Finance 2.29 1.97 1.50 2.20 4.27 5.52 Others - 0.09 0.32 0.09 0.11 0.03 MSME 2.65 5.61 9.10 13.76 22.18 32.16 Total AUM 25.63 37.05 44.49 55.68 82.21 107.34 Source: Company, HDFC sec Inst Research
Most products enjoy high yield AU also provides wholesale loans to small NBFCs and real estate developers

AU SMALL FINANCE BANK : INITIATING COVERAGE
Page | 5
Performance Snapshot Loan Book Growth MSME And SME Portfolio Showing Strong Growth
Source: Company, HDFC sec Inst Research
Source: Company, HDFC sec Inst Research
Asset Mix Trend NIMs Have Improved
Source: Company, HDFC sec Inst Research Source: Company, HDFC sec Inst Research
Loan book has grown at a CAGR of 33% over the last 5 yrs Owing to a low base, MSME and SME book have shown a staggering CAGR of 65% and 56% respectively over the last 5 years
7.3
6.5 6.4
8.1
9.4
8.8
4.0
5.0
6.0
7.0
8.0
9.0
10.0
FY12
FY13
FY14
FY15
FY16
FY17
%
54
3 6
9 14
22
32
2 2 4
10
18 21
-
10
20
30
40
50
60
FY12
FY13
FY14
FY15
FY16
FY17
VF MSME SMERs bn
81% 79%70%
57% 51% 50%
10% 15%20%
25%27% 30%
9% 6% 10%19% 22% 20%
0%10%20%30%40%50%60%70%80%90%
100%
FY12
FY13
FY14
FY15
FY16
FY17
VF MSME SME
25.637.0
44.555.7
82.2
107.3
-
20.0
40.0
60.0
80.0
100.0
120.0
FY12
FY13
FY14
FY15
FY16
FY17
Rs bn
AU SMALL FINANCE BANK : INITIATING COVERAGE
Page | 6
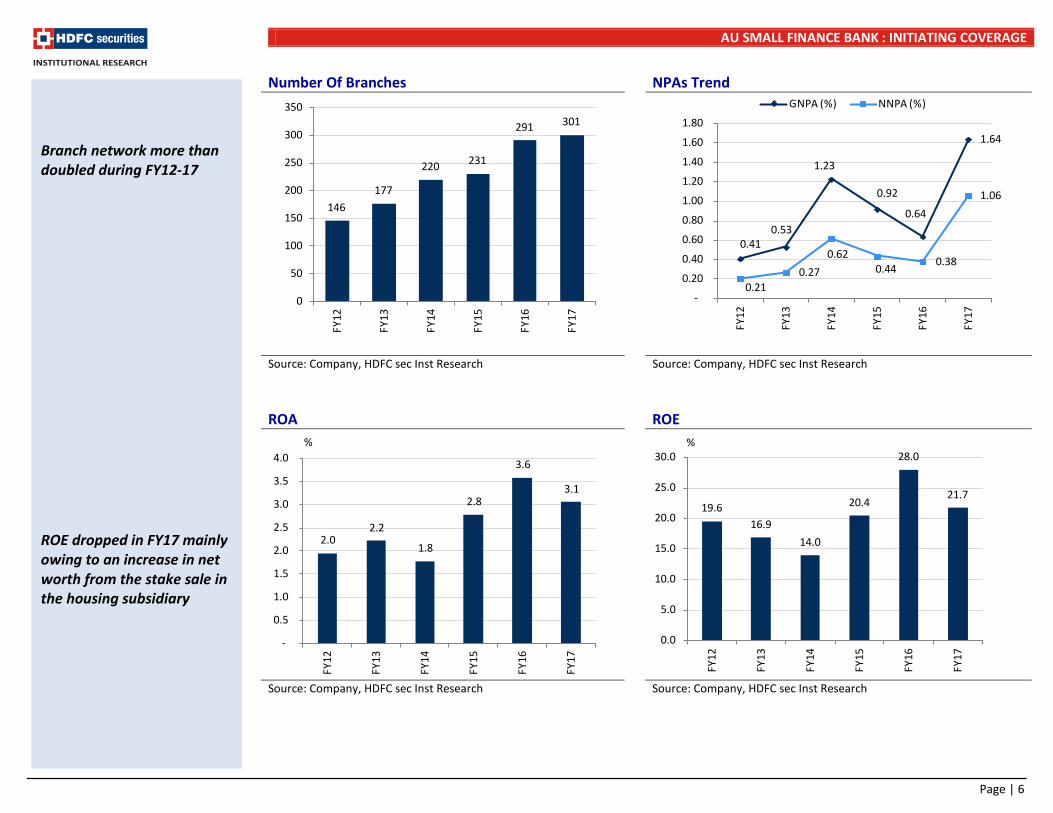
Number Of Branches NPAs Trend
Source: Company, HDFC sec Inst Research Source: Company, HDFC sec Inst Research
ROA ROE
Source: Company, HDFC sec Inst Research Source: Company, HDFC sec Inst Research
2.0 2.2
1.8
2.8
3.6
3.1
-
0.5
1.0
1.5
2.0
2.5
3.0
3.5
4.0
FY12
FY13
FY14
FY15
FY16
FY17
%
19.616.9
14.0
20.4
28.0
21.7
0.0
5.0
10.0
15.0
20.0
25.0
30.0
FY12
FY13
FY14
FY15
FY16
FY17
%
Branch network more than doubled during FY12-17 ROE dropped in FY17 mainly owing to an increase in net worth from the stake sale in the housing subsidiary
146177
220 231
291 301
0
50
100
150
200
250
300
350
FY12
FY13
FY14
FY15
FY16
FY17
0.41 0.53
1.23
0.92
0.64
1.64
0.21 0.27
0.62 0.44 0.38
1.06
-
0.20
0.40
0.60
0.80
1.00
1.20
1.40
1.60
1.80
FY12
FY13
FY14
FY15
FY16
FY17
GNPA (%) NNPA (%)
AU SMALL FINANCE BANK : INITIATING COVERAGE
Page | 7
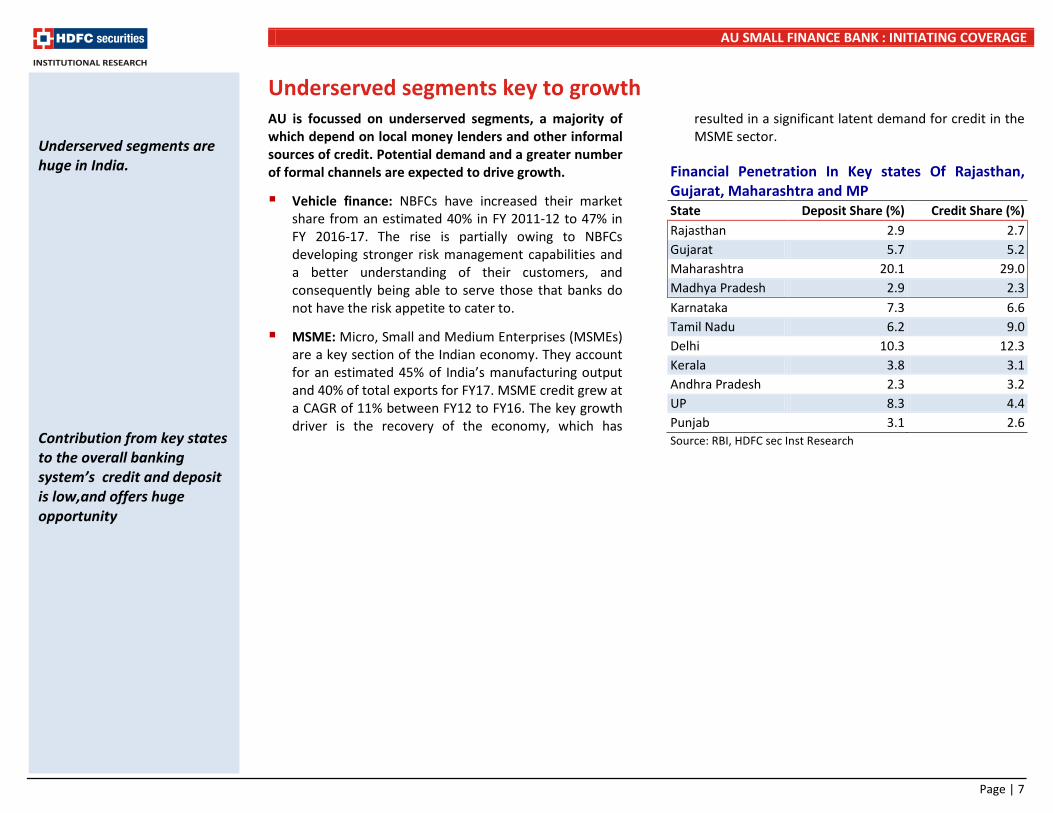
Underserved segments key to growth AU is focussed on underserved segments, a majority of which depend on local money lenders and other informal sources of credit. Potential demand and a greater number of formal channels are expected to drive growth.
Vehicle finance: NBFCs have increased their market share from an estimated 40% in FY 2011-12 to 47% in FY 2016-17. The rise is partially owing to NBFCs developing stronger risk management capabilities and a better understanding of their customers, and consequently being able to serve those that banks do not have the risk appetite to cater to.
MSME: Micro, Small and Medium Enterprises (MSMEs) are a key section of the Indian economy. They account for an estimated 45% of India’s manufacturing output and 40% of total exports for FY17. MSME credit grew at a CAGR of 11% between FY12 to FY16. The key growth driver is the recovery of the economy, which has
resulted in a significant latent demand for credit in the MSME sector.
Financial Penetration In Key states Of Rajasthan, Gujarat, Maharashtra and MP State Deposit Share (%) Credit Share (%) Rajasthan 2.9 2.7 Gujarat 5.7 5.2 Maharashtra 20.1 29.0 Madhya Pradesh 2.9 2.3 Karnataka 7.3 6.6 Tamil Nadu 6.2 9.0 Delhi 10.3 12.3 Kerala 3.8 3.1 Andhra Pradesh 2.3 3.2 UP 8.3 4.4 Punjab 3.1 2.6 Source: RBI, HDFC sec Inst Research
Underserved segments are huge in India. Contribution from key states to the overall banking system’s credit and deposit is low,and offers huge opportunity

AU SMALL FINANCE BANK : INITIATING COVERAGE
Page | 8
Growth rates to sustain, given presence in the underpenetrated segments We estimate 31% CAGR AUM growth over FY17-FY20E. A continued focus on underpenetrated segments and launch of new products (Business Banking, Agri Allied, Gold products etc) support our thesis of strong growth.
We believe the company has multiple levers for strong and sustainable growth, namely, (1) Strong presence in underpenetrated and financially underserved
segments, (2) Relatively low ticket size in the Vehicle Finance segment as compared to peers, and (3) Foray into relatively higher ticket size segments (Business Banking, etc).
The share of current products is expected to be 87% by FY20.
Loan Book To Grow At A CAGR Of 31% Loan Book Mix Will Evolve
Source: Company, HDFC sec Inst Research Source: Company, HDFC sec Inst Research
107.
3
140.
4 183.
9 242.
9
31 31 31 32
3
8
13
18
23
28
33
38
20.0
70.0
120.0
170.0
220.0
270.0 FY
17
FY18
E
FY19
E
FY20
E
AUM (Bn) Growth (%) - RHS
50% 48% 45% 41%
30% 30% 30% 31%
20% 17% 16%15%
0%10%20%30%40%50%60%70%80%90%
100%
FY17
FY18
E
FY19
E
FY20
E
VF MSME SME New
We expect growth to be 31% over the next 3 years Business banking like Overdraft, Business Loans, Agri Loans, Gold Loans etc have been launched, which will also drive growth

AU SMALL FINANCE BANK : INITIATING COVERAGE
Page | 9
Conversion into Small Finance Bank: The implications AU was one of the 10 applicants granted approval to
convert into a Small Finance Bank (SFB). This offered the company opportunities for growth, with access to CASA and retail deposits, along with the flexibility to offer diversified products over the long term.
List Of New Banks NBFC Turned Banks Launch Bandhan Aug-15 IDFC (Infra Finance) Oct-15 Disha Apr-16 Capital Local Apr-16 Equitas Sep-16 Suryoday Jan-17 Utkarsh Jan-17 Ujjivan Feb-17 Au Financiers Apr-17 Janalakshmi Expected in 2017 RGVN Expected in 2017 ESAF Microfinance Expected in 2017 Source: Companies, HDFC sec Inst Research
In Apr-17, AU commenced banking operations. The SFB category has been designed to improve the prospects of financial inclusion with higher priority sector targets.
Key regulatory and operational landscape
SLR/CRR norms applicable to commercial banks will also be applicable to SFBs.
SFBs have to preserve at least 75% of their loan book for the priority sector (PSL), as against 40% for universal banks. Within this, sub-targets have to be met for: Agriculture (18%), Micro enterprises (7.5%) and weaker sections (10%), as defined for universal banks. Currently, AU meets the overall 75% PSL requirement, and the launch of Agri and Gold loans is expected to help it meet its sub-segment targets too.
Inter-bank borrowing is capped at 3x of net worth. However, the current loan before conversion will be grandfathered.
At least 50% of the advances have to be lower than Rs 2.5mn.
The total CAR for SFBs stands at 15%, with Tier I at 7.5% and Tier II at 7.5%. As compared to this, the CAR requirement for universal banks is 11.5%, with Tier I at 10%.
AU is the only NBFC to receive SFB license from RBI SFB category is primarily aimed at financial inclusion

AU SMALL FINANCE BANK : INITIATING COVERAGE
Page | 10
Key Changes On Conversion To SFB
NBFC SFB
Operation Branches No condition 25% of the branches to
be in URC
Asset
CRR & SLR Not applicable
Applicable. Negative carry on SLR of 350bps and SLR 950bps at current rates
PSL requirement No requirement 75% PSL requirement.
BC model Can act as BC for banks
Not allowed to be a BC of a bank. However, can capitalize on its PSL strength through PSLC and IBFS
Liability
Bank Borrowing No cap 3x of the Networth
Bulk Deposits Difficult Scheduled bank status will help faster mobilization
Indirect PSL benefit
PSL benefit available for on-lending programme.
Not available
Source: Company, HDFC sec Inst Research
AU’s strategy for SFB
AU has received RBI approval to open 431 SFB branches during FY18. They have opened 284 bank branches, 119 asset centres and 251 ATMs spread across 11 states and a Union Territory, as on 30-June-2017. AU will open new branches in under-banked areas to meet regulatory requirements. With the Business Correspondent model allowed for the unbanked branches, it may opt for this route.
AU has adopted the strategy of rolling out both bank as well separate asset and liability branches. Of 284 branches, 119 are separate asset and liability branches, while the remaining are common bank branches. This has been crafted based on its assessment of existing branches and potential to generate liability franchise. Further, these liability- focussed branches would also help generate leads for assets.
Banking products: It plans to offer a wide range of business banking products like Cash Credit, Overdrafts, and also new loan products like Gold loans, Agri Allied loans, and 2W loans etc.
It plans to re-enter the housing segment in Tier 2 and 3 cities, and will benefit from the under-penetrated affordable housing market.
Introduced an alternate distribution channel called ‘Dost Banaye Dost’, a referral programme.
AU needs to carefully craft a strategy for garnering CASA and retail deposits, given high competition PSL requirement will be effective from FY19 and as such it can generate higher fee income in FY18 by selling PSL certificates.

AU SMALL FINANCE BANK : INITIATING COVERAGE
Page | 11
Current Product Portfolio As SFB Asset Products Liability Products Other Products And Services Retail Assets : VF, MSME, SME, Gold Loans and Agri loans CA Third party Insurance,MF
Wholesale Assets : NBFC, Real estate groups and Business Banking SA ATM and Debit cards
Housing Loans (Will re-start by 1QFY19) TD and RD Lockers
Net banking, TAB Banking and Mobile Banking
Source: Company, HDFC sec Inst Research Retail Assets Dominated By Vehicle Finance Wholesale Assets
Source: HDFC sec Inst Research As on 30th June , 2017
Source: HDFC sec Inst Research As on 30th June , 2017
More products to be rolled out over a period of time
VF55.5
MSME34.3
SME10.1
NBFC51.6
Real Estate group48.2
Business Banking
0.2
AU SMALL FINANCE BANK : INITIATING COVERAGE
Page | 12
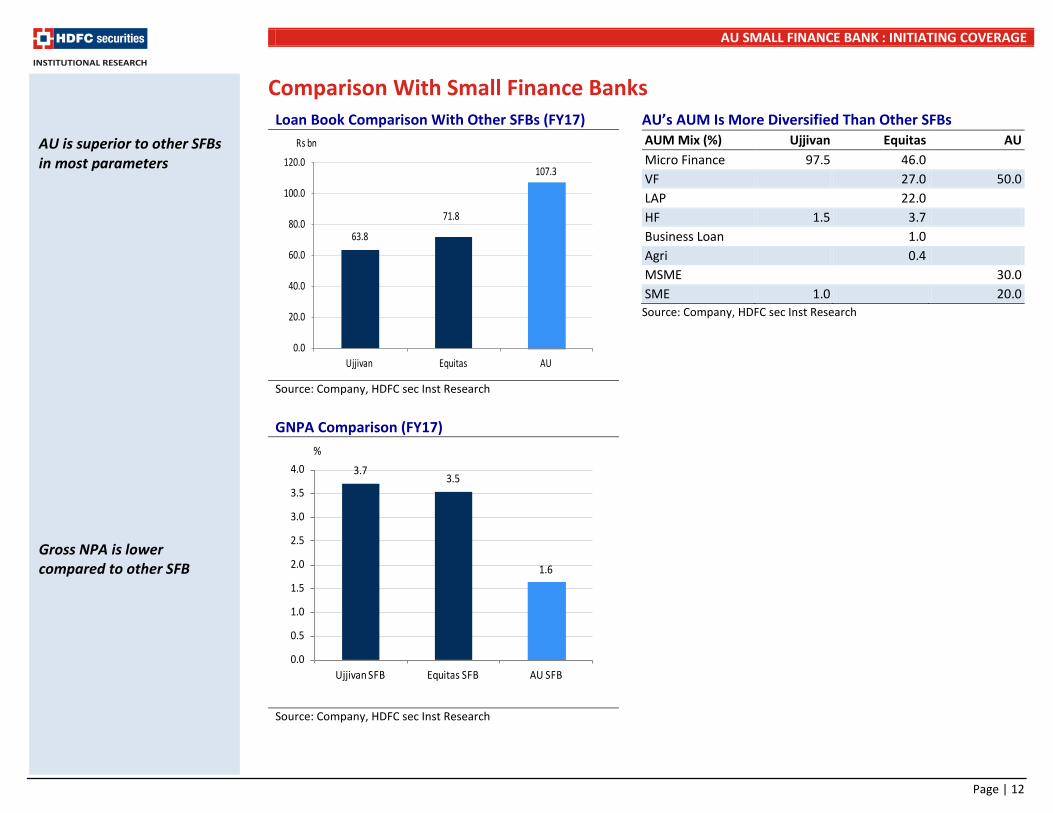
Comparison With Small Finance Banks Loan Book Comparison With Other SFBs (FY17) AU’s AUM Is More Diversified Than Other SFBs
AUM Mix (%) Ujjivan Equitas AU Micro Finance 97.5 46.0 VF 27.0 50.0 LAP 22.0 HF 1.5 3.7 Business Loan 1.0 Agri 0.4 MSME 30.0 SME 1.0 20.0
Source: Company, HDFC sec Inst Research
Source: Company, HDFC sec Inst Research
GNPA Comparison (FY17)
Source: Company, HDFC sec Inst Research
63.8
71.8
107.3
0.0
20.0
40.0
60.0
80.0
100.0
120.0
Ujjivan Equitas AU
Rs bn
AU is superior to other SFBs in most parameters Gross NPA is lower compared to other SFB
3.73.5
1.6
0.0
0.5
1.0
1.5
2.0
2.5
3.0
3.5
4.0
Ujjivan SFB Equitas SFB AU SFB
%
AU SMALL FINANCE BANK : INITIATING COVERAGE
Page | 13
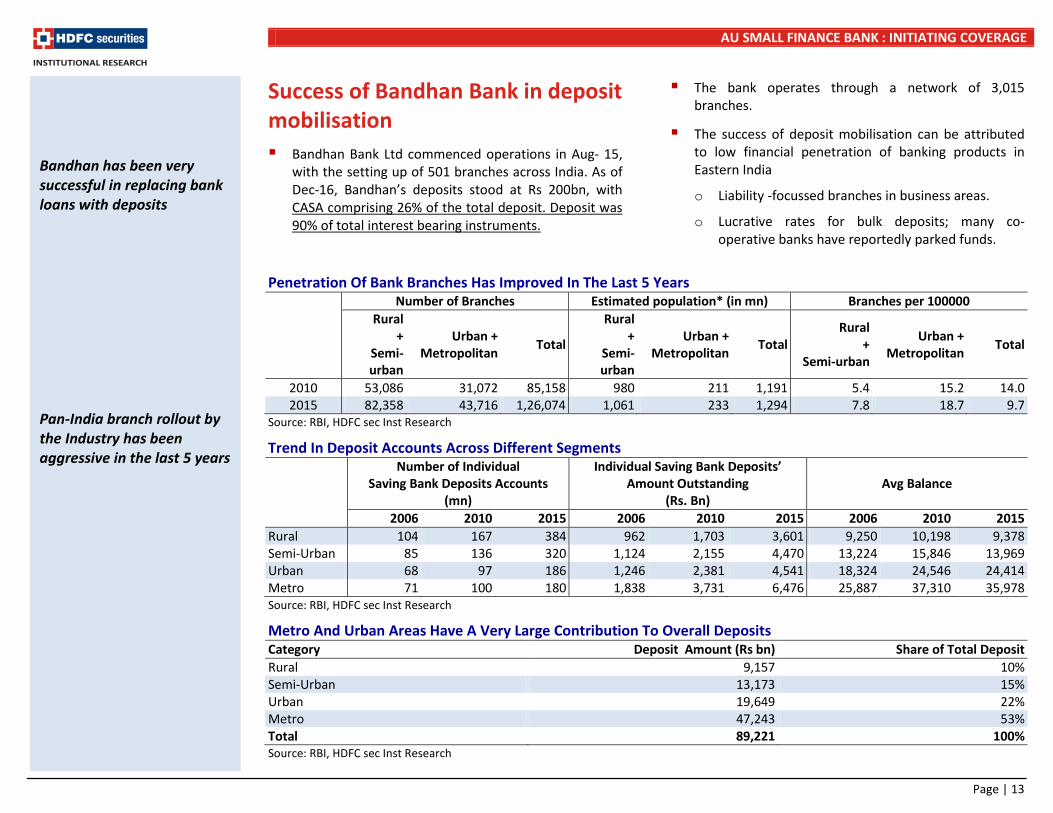
Success of Bandhan Bank in deposit mobilisation Bandhan Bank Ltd commenced operations in Aug- 15,
with the setting up of 501 branches across India. As of Dec-16, Bandhan’s deposits stood at Rs 200bn, with CASA comprising 26% of the total deposit. Deposit was 90% of total interest bearing instruments.
The bank operates through a network of 3,015 branches.
The success of deposit mobilisation can be attributed to low financial penetration of banking products in Eastern India
o Liability -focussed branches in business areas.
o Lucrative rates for bulk deposits; many co-operative banks have reportedly parked funds.
Penetration Of Bank Branches Has Improved In The Last 5 Years Number of Branches Estimated population* (in mn) Branches per 100000
Rural +
Semi-urban
Urban + Metropolitan Total
Rural +
Semi-urban
Urban + Metropolitan Total
Rural +
Semi-urban
Urban + Metropolitan Total
2010 53,086 31,072 85,158 980 211 1,191 5.4 15.2 14.0 2015 82,358 43,716 1,26,074 1,061 233 1,294 7.8 18.7 9.7
Source: RBI, HDFC sec Inst Research
Trend In Deposit Accounts Across Different Segments
Number of Individual Saving Bank Deposits Accounts
(mn)
Individual Saving Bank Deposits’ Amount Outstanding
(Rs. Bn) Avg Balance
2006 2010 2015 2006 2010 2015 2006 2010 2015 Rural 104 167 384 962 1,703 3,601 9,250 10,198 9,378 Semi-Urban 85 136 320 1,124 2,155 4,470 13,224 15,846 13,969 Urban 68 97 186 1,246 2,381 4,541 18,324 24,546 24,414 Metro 71 100 180 1,838 3,731 6,476 25,887 37,310 35,978 Source: RBI, HDFC sec Inst Research
Metro And Urban Areas Have A Very Large Contribution To Overall Deposits Category Deposit Amount (Rs bn) Share of Total Deposit Rural 9,157 10% Semi-Urban 13,173 15% Urban 19,649 22% Metro 47,243 53% Total 89,221 100% Source: RBI, HDFC sec Inst Research
Bandhan has been very successful in replacing bank loans with deposits Pan-India branch rollout by the Industry has been aggressive in the last 5 years

AU SMALL FINANCE BANK : INITIATING COVERAGE
Page | 14
Cost pressure on conversion; to be paid off in the medium term While the conversion to SFB offers the opportunity
to build a diversified, stable and low-cost liability profile, efforts towards building the franchise will inflate cost ratios.
The Cost-Income (C/I) ratio is expected to rise to ~57.6% in FY18E, as against 38.7% in FY17. In our estimates, we have factored in the launch of 434 bank branches. As per approval from RBI, AU will be allowed to run unconverted branches as asset-focussed branches. During 1QFY18, it has started 284 branches. Of these, 119 are separate asset and liability branches, while the balance are common bank branches. An additional 100+ branches would be launched by FY18 in the under-banked areas. We expect an average opex cost of Rs 5 to 6mn per branch.
Further, it has incurred capital expenditure of ~Rs 3.3bn, and is expected to incur Rs 400-500mn in FY18 towards IT and other Infrastructure costs.
Cost/Income Ratio To Peak In FY18E
Source: Company, HDFC sec Inst Research
0.0
0.5
1.0
1.5
2.0
2.5
3.0
3.5
0.0
10.0
20.0
30.0
40.0
50.0
60.0
70.0
FY12
FY13
FY14
FY15
FY16
FY17
FY18
E
FY19
E
FY20
E
Cost to Income Ratio - LHS Employee exp % AUMOther exp % AUM
Cost-to-Income ratio to peak in 3QFY18/4QFY18

AU SMALL FINANCE BANK : INITIATING COVERAGE
Page | 15
Liability franchise to deliver, but only in the long term We believe conversion to an SFB strengthens the
business model, allowing access to a lower cost and diversified liability mix to an already robust lending franchise.
We underscore a noticeable improvement in AU’s borrowing mix, with a decrease in the share of high cost bank borrowings to 13% in 1QFY18 from 18% in Q4FY17. The share of debentures has fallen to 46%, as against 50% over the same period. The period witnessed the conversion of AU into a bank.
Post conversion to a SFB in 1QFY18, AU enjoys lower funding cost. Bulk term deposits are now 10% of the borrowing mix, and with expected ‘Scheduled Bank Status’ over the next 2-3 months, the share of bulk term deposits is likely to increase sharply, with insurance companies, corporates and institutions subscribing to them.
AU plans to open ~434 branches by FY18, ~284 of which are already operational. With the current pricing of term deposits at a premium (~20/30 bps) to the incumbents, expect retail deposits, including CASA, to be 20% of the total liabilities by FY20.
Savings accounts are also priced (6% for <Rs 0.1mn) at a premium to peers. However, we believe the build-up in CASA will be gradual, with SA estimated to contribute 11% to total liabilities by FY20. As it plans to disburse all loans through its own account, this would also contribute to SA balances, with some float available on these disbursements.
Over the last six to seven months, wholesale and deposit rates have fallen sharply by 100-200bps. This will provide a further boost to the spreads.
Liability Mix: High-cost Bank Borrowings To Decline % 4QFY17 1QFY18 NCD 50 46 Refinance from FIs 21 16 CP 7 11 Bank/NBFC 18 13 Tier II Capital 5 4 Deposits - 10
Premium Deposit Pricing: To Provide Traction FD Rate AU Equitas Bandhan 1 to 2 yr 8.00% 7.25% 7.50% 2-3 yr 7.50% 7.25% 7.00% 4-5 yr 7.00% 7.00% 7.00%
Source: Company, HDFC sec Inst Research
Lower Blended Costs Of Borrowings To Fall
Source: Company, HDFC sec Inst Research
Share of bank borrowings has been sharply cut through issuance of debentures Drop in wholesale and deposit rates would further boost spreads
0.02.04.06.08.010.012.014.016.018.0
0.0
5.0
10.0
15.0
20.0
25.0
FY12
FY13
FY14
FY15
FY16
FY17
FY18
E
FY19
E
FY20
E
RTD+CASA % of Borrowing (%)
Avg cost of borrowing (%)- RHS
AU SMALL FINANCE BANK : INITIATING COVERAGE
Page | 16
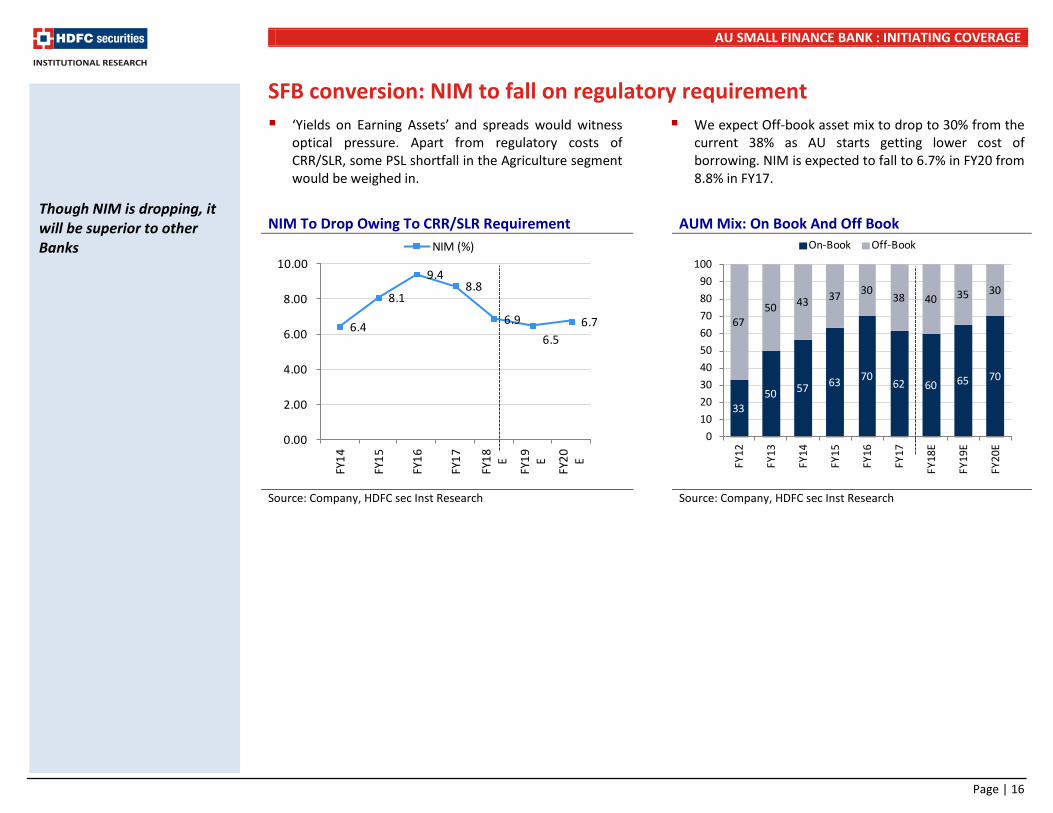
SFB conversion: NIM to fall on regulatory requirement ‘Yields on Earning Assets’ and spreads would witness
optical pressure. Apart from regulatory costs of CRR/SLR, some PSL shortfall in the Agriculture segment would be weighed in.
We expect Off-book asset mix to drop to 30% from the current 38% as AU starts getting lower cost of borrowing. NIM is expected to fall to 6.7% in FY20 from 8.8% in FY17.
NIM To Drop Owing To CRR/SLR Requirement AUM Mix: On Book And Off Book
Source: Company, HDFC sec Inst Research Source: Company, HDFC sec Inst Research
6.4
8.1
9.48.8
6.96.5
6.7
0.00
2.00
4.00
6.00
8.00
10.00
FY14
FY15
FY16
FY17
FY18 E
FY19 E
FY20 E
NIM (%)
Though NIM is dropping, it will be superior to other Banks
3350 57 63 70
62 60 65 70
6750 43 37 30
38 40 35 30
0102030405060708090
100
FY12
FY13
FY14
FY15
FY16
FY17
FY18
E
FY19
E
FY20
E
On-Book Off-Book

AU SMALL FINANCE BANK : INITIATING COVERAGE
Page | 17
Asset quality: To remain stable Despite lending to low and middle income groups,
AU enjoys strong asset quality. This is driven by strong underwriting processes, supported by its collection team. In the VF and MSME businesses, AU is focussed on disbursing loans primarily to business assets, resulting in lower risk.
In FY17, owing to seasoning and demonetisaton, GNPA increased to 1.6% as compared to 0.6% in FY16. Credit cost for the company was 0.8% in FY17.
As an SFB, the company’s NPA recognition norm changed from 120 to 90 days, which will lead to an increase in reported NPAs. We project GNPA to hover at 1.6% in FY18, and remain in this range as the company would move to more secured lending.
Credit costs are expected to hover at 1.1-1.2% range.
Credit Cost To Remain At Current Level
Source: Company, HDFC sec Inst Research #Recognition norms will move to 90days in FY18 from 120days
0.0
0.2
0.4
0.6
0.8
1.0
1.2
1.4
1.6
1.8
FY12
FY13
FY14
FY15
FY16
FY17
FY18
E
FY19
E
FY20
E
Credit cost (%) GNPA (%) NNPA (%)
Recognition norm will move from 120 days to 90 days as a bank.
AU SMALL FINANCE BANK : INITIATING COVERAGE
Page | 18
Key risk factors Transition entails execution risks: From an NBFC, AU
has now become a bank with a focus on both assets and liabilities. As a bank, it is planning to roll out 431 branches by FY18 (284 operational as on 1QFY18). This has led to a huge increase in operating costs related to IT, HR, risk management, compliance etc. Inability to scale up the business as a bank would entail an elevated level of the C/I ratio and low profitability.
CASA and retail fixed deposits: Lower-than-expected mobilisation of these may result in a higher cost of funds than our expectations. We have assumed the
share of CASA, including retail deposits to total liability to improve to 20% by FY20.
Performance of other products: The bank has launched new products like Agri. Allied, Two-wheelers, Business banking products, among others, and plans to launch more. Scaling up of new products remains a key monitorable.
Geographic concentration: As of FY17, 54% of the loan book stems from Rajasthan, and ~90% from only four states- Rajasthan, Maharashtra, Gujarat, and Madhya Pradesh, which poses the risk of concentration.
Bank to garner CASA and Retail deposits, and also provide fee income from selling third party products

AU SMALL FINANCE BANK : INITIATING COVERAGE
Page | 19
NII Growth Driven By AUM Growth Adj. PAT Trend
Source: Company, HDFC sec Inst Research
Source: Company, HDFC sec Inst Research
ROA And ROE To Drop Strongly Capitalised For Growth
Source: Company, HDFC sec Inst Research
Source: Company, HDFC sec Inst Research
4.2
6.7
9.311.7
14.9
19.2
0.0
5.0
10.0
15.0
20.0
25.0
FY15
FY16
FY17
FY18
E
FY19
E
FY20
E
Rs bn
0.37 0.69 0.73
1.39
2.47
3.26 2.76
3.60
4.89
-
1.0
2.0
3.0
4.0
5.0
6.0
FY12
FY13
FY14
FY15
FY16
FY17
FY18
E
FY19
E
FY20
E
Rs. Bn
3.6 3.1 1.6 1.61.7
28.0
21.7
13.0 14.9 17.5
0.0
5.0
10.0
15.0
20.0
25.0
30.0
35.0
FY16
FY17
FY18
E
FY19
E
FY20
E
ROAA (%) ROAE (%)
17.316.9
23.0
20.5
17.7
15.7
10.0
12.0
14.0
16.0
18.0
20.0
22.0
24.0
FY15
FY16
FY17
FY18
E
FY19
E
FY20
E
CAR (%)
PSL requirement applies from FY19 and as such it can generate higher fee income in FY18 from selling PSL certificates. ROAA to drop during transition
AU SMALL FINANCE BANK : INITIATING COVERAGE
Page | 20
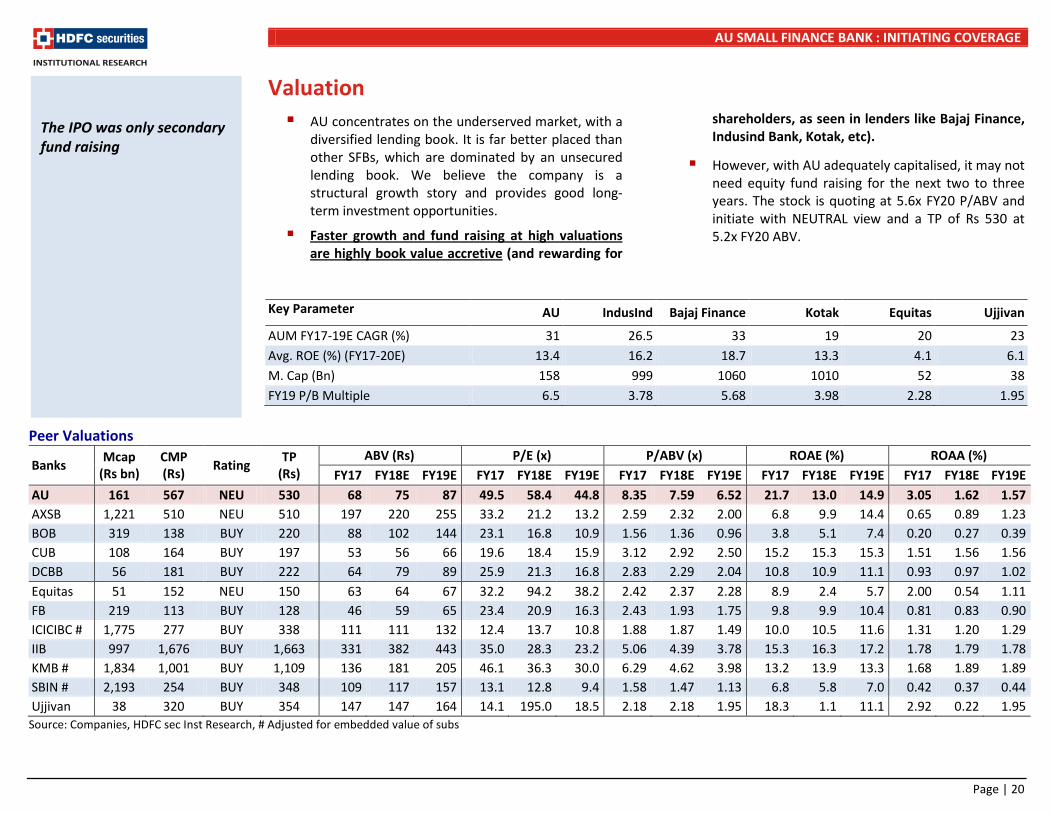
Valuation AU concentrates on the underserved market, with a
diversified lending book. It is far better placed than other SFBs, which are dominated by an unsecured lending book. We believe the company is a structural growth story and provides good long-term investment opportunities.
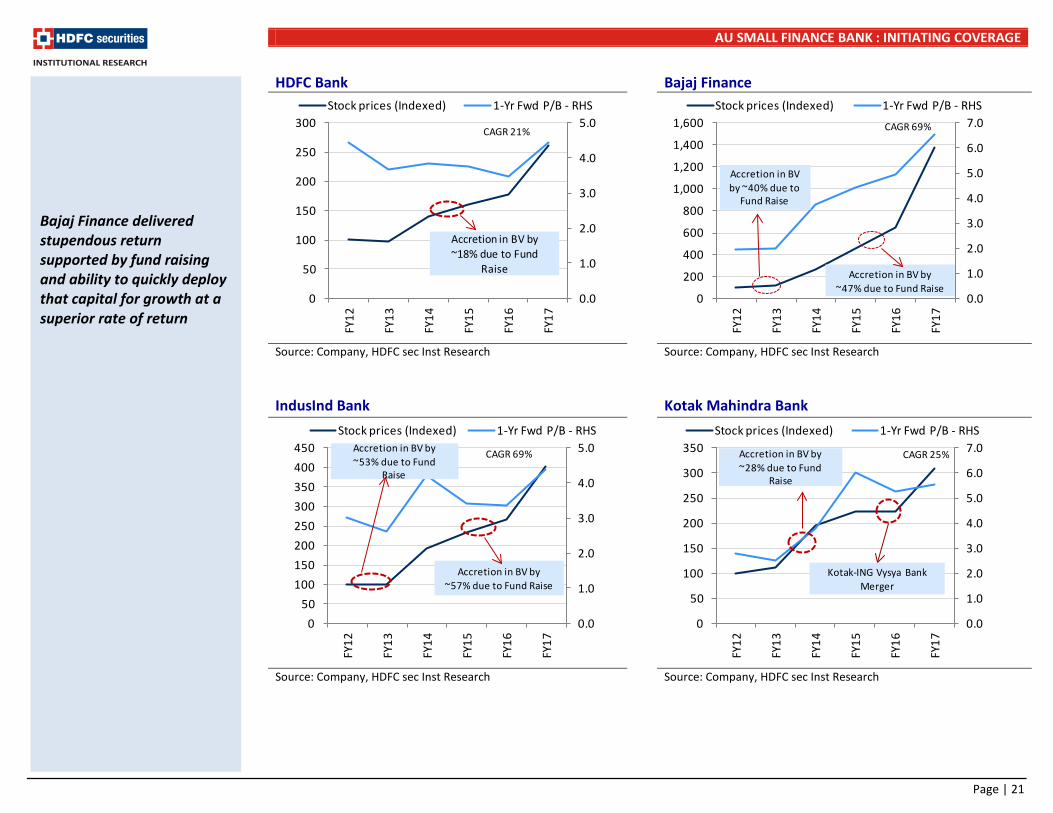
Faster growth and fund raising at high valuations are highly book value accretive (and rewarding for
shareholders, as seen in lenders like Bajaj Finance, Indusind Bank, Kotak, etc).
However, with AU adequately capitalised, it may not need equity fund raising for the next two to three years. The stock is quoting at 5.6x FY20 P/ABV and initiate with NEUTRAL view and a TP of Rs 530 at 5.2x FY20 ABV.
Key Parameter AU IndusInd Bajaj Finance Kotak Equitas Ujjivan
AUM FY17-19E CAGR (%) 31 26.5 33 19 20 23 Avg. ROE (%) (FY17-20E) 13.4 16.2 18.7 13.3 4.1 6.1 M. Cap (Bn) 158 999 1060 1010 52 38 FY19 P/B Multiple 6.5 3.78 5.68 3.98 2.28 1.95
Peer Valuations
Banks Mcap (Rs bn)
CMP (Rs) Rating TP
(Rs) ABV (Rs) P/E (x) P/ABV (x) ROAE (%) ROAA (%)
FY17 FY18E FY19E FY17 FY18E FY19E FY17 FY18E FY19E FY17 FY18E FY19E FY17 FY18E FY19E AU 161 567 NEU 530 68 75 87 49.5 58.4 44.8 8.35 7.59 6.52 21.7 13.0 14.9 3.05 1.62 1.57 AXSB 1,221 510 NEU 510 197 220 255 33.2 21.2 13.2 2.59 2.32 2.00 6.8 9.9 14.4 0.65 0.89 1.23 BOB 319 138 BUY 220 88 102 144 23.1 16.8 10.9 1.56 1.36 0.96 3.8 5.1 7.4 0.20 0.27 0.39 CUB 108 164 BUY 197 53 56 66 19.6 18.4 15.9 3.12 2.92 2.50 15.2 15.3 15.3 1.51 1.56 1.56 DCBB 56 181 BUY 222 64 79 89 25.9 21.3 16.8 2.83 2.29 2.04 10.8 10.9 11.1 0.93 0.97 1.02 Equitas 51 152 NEU 150 63 64 67 32.2 94.2 38.2 2.42 2.37 2.28 8.9 2.4 5.7 2.00 0.54 1.11 FB 219 113 BUY 128 46 59 65 23.4 20.9 16.3 2.43 1.93 1.75 9.8 9.9 10.4 0.81 0.83 0.90 ICICIBC # 1,775 277 BUY 338 111 111 132 12.4 13.7 10.8 1.88 1.87 1.49 10.0 10.5 11.6 1.31 1.20 1.29 IIB 997 1,676 BUY 1,663 331 382 443 35.0 28.3 23.2 5.06 4.39 3.78 15.3 16.3 17.2 1.78 1.79 1.78 KMB # 1,834 1,001 BUY 1,109 136 181 205 46.1 36.3 30.0 6.29 4.62 3.98 13.2 13.9 13.3 1.68 1.89 1.89 SBIN # 2,193 254 BUY 348 109 117 157 13.1 12.8 9.4 1.58 1.47 1.13 6.8 5.8 7.0 0.42 0.37 0.44 Ujjivan 38 320 BUY 354 147 147 164 14.1 195.0 18.5 2.18 2.18 1.95 18.3 1.1 11.1 2.92 0.22 1.95
Source: Companies, HDFC sec Inst Research, # Adjusted for embedded value of subs
The IPO was only secondary fund raising
AU SMALL FINANCE BANK : INITIATING COVERAGE
Page | 21
HDFC Bank Bajaj Finance
Source: Company, HDFC sec Inst Research
Source: Company, HDFC sec Inst Research
IndusInd Bank Kotak Mahindra Bank
Source: Company, HDFC sec Inst Research
Source: Company, HDFC sec Inst Research
0.0
1.0
2.0
3.0
4.0
5.0
0
50
100
150
200
250
300
FY12
FY13
FY14
FY15
FY16
FY17
Stock prices (Indexed) 1-Yr Fwd P/B - RHS
CAGR 21%
Accretion in BV by ~18% due to Fund
Raise
0.0
1.0
2.0
3.0
4.0
5.0
6.0
7.0
0
200
400
600
800
1,000
1,200
1,400
1,600
FY12
FY13
FY14
FY15
FY16
FY17
Stock prices (Indexed) 1-Yr Fwd P/B - RHS
CAGR 69%
Accretion in BV by ~40% due to
Fund Raise
Accretion in BV by ~47% due to Fund Raise
0.0
1.0
2.0
3.0
4.0
5.0
050
100150200250300350400450
FY12
FY13
FY14
FY15
FY16
FY17
Stock prices (Indexed) 1-Yr Fwd P/B - RHS
CAGR 69%Accretion in BV by ~53% due to Fund
Raise
Accretion in BV by ~57% due to Fund Raise
0.0
1.0
2.0
3.0
4.0
5.0
6.0
7.0
0
50
100
150
200
250
300
350
FY12
FY13
FY14
FY15
FY16
FY17
Stock prices (Indexed) 1-Yr Fwd P/B - RHS
CAGR 25%Accretion in BV by ~28% due to Fund
Raise
Kotak-ING Vysya Bank Merger
Bajaj Finance delivered stupendous return supported by fund raising and ability to quickly deploy that capital for growth at a superior rate of return

AU SMALL FINANCE BANK : INITIATING COVERAGE
Page | 22
Recent Performance Rs Mn 4QFY17 FY17 1QFY18 Loan Book 107,339 107,339 107,590 Interest Income 3,445 12,868 3,610 Interest Expense 1,181 4,838 1,775 NII 2,264 8,030 1,835 Other Income 361 1,006 579 Total Income 2,625 9,036 2,413 Total Opex 1,178 3,664 1,169 Employee Cost 709 1,928 711 Other opex 470 1,737 458 Cost to Income (In %) 45 41 48 PPP 1,446 5,381 1,245 Credit Cost 264 652 291 Gross NPA (90 days) 1.8% 1.3% 2.3% PBT 1,183 4,730 954 PAT 779 3,259 618 ROA 3.18% 3.40% 2.25% Source: Company, HDFC sec Inst Research
NII fell owing to the impact of SLR/CRR, as it converted to an SFB in 1QFY18 Cost-to-Income has increased sharply, and will increase further as more liability branches are rolled out Credit cost and GNPAs have been higher owing to a shift in the recognition norms from 120 days to 90 days

AU SMALL FINANCE BANK : INITIATING COVERAGE
Page | 23
Corporate overview Headquarted in Jaipur, AU Small Finance Bank was incorporated in 1996. It lends largely to the underserved segments catering to urban, semi-urban and rural sections, with individuals in the low and middle-income categories. Its products are Vehicle (50%), MSME (30%) and SME (20%) loans among others, with a total AUM of Rs 107bn as of FY17.
The company recieved the Small Finance Bank (SFB) license from RBI on 20- Dec-16 to commence banking operations, which it did in April-17 as a Small Finance Bank.
As on 1QFY18, it currently has 284 bank branches and 119 asset centres.
The company operates in high-yield segments.
In FY17, the company sold its investments in its subsidiary companies like AU Housing Finance Ltd, Index Money Ltd and associate companies like M Power Micro Finance Pvt. Ltd and AU Insurance Broking Services Pvt. Ltd. The net profit (net of tax) on sale of these investments was Rs.5.17bn.
The company was initially incorporated in the name of L.N. Finco Gems Pvt Ltd by Sanjay Agarwal, the Promoter and the Managing Director of the company. He has over 21 years of experience in finance, accounting, strategic planning and credit risk management.
Business presence is dominated in the home state of Rajasthan, contributing 54% to the overall loan book in FY17.
On the liabilities’ side, the borrowing mix is dominated by NCDs and Term loans, contributing 50% and 33% to the total borrowings respectively.
Adjusted ROA and ROE for FY17 was 3.1% and 21.7% respectively.
Experienced and credible top management
Sanjay Agarwal (Promoter and Managing Director): He holds a Bachelor’s degree in commerce from the Government College, Ajmer. He is a qualified Chartered Accountant with over 21 years of experience in finance, accounting, strategic planning and credit risk management.
Uttam Tibrewal (Whole-time Director): He holds a Bachelor’s degree in commerce from the University of Delhi. He has over 13 years of experience in the Non-Banking Finance Industry.
For the SFB rollout, it has recruited many people from the banking industry. Most of the key personnel have been with the company for the last 6 to 10 years.
The company got listed recently in July 2017. The IPO was only secondary offering by existing shareholders

AU SMALL FINANCE BANK : INITIATING COVERAGE
Page | 24
Board Details
Name Designation Date
of Joining
Profile
Mannil Venugopalan Chairman and Independent Director 2011 He holds a Bachelor’s degree in commerce from the University of Kerala. He has over 46 years of experience in the Finance and Banking Industry
Sanjay Agarwal Promoter and Managing Director 1996
He holds a Bachelor’s degree in commerce from the Government college, Ajmer. He is qualified as Chartered Accountant. He has over 21 years of experience in Finance, Accounting, strategic planning and credit risk management
Uttam Tibrewal Whole-Time Director 2013 He holds a Bachelor’s degree in commerce from the University of Delhi. He has over 13 years of experience in the Non-Banking Finance Industry.
Krishna Kant Rathi Independent Director 2008
He holds a Bachelor’s degree with honors in commerce from Rajasthan University. He has over 26 years of experience working with various large corporate in the fields of finance and accounting.
Jyoti Narang Independent Director 2015
She holds a Bachelor’s degree in arts (economics) from Lady Shriram college for Women, University of Delhi and a Masters degree in Business Administration from the University of Delhi. She has over 32 years of experience in senior leadership positions in the hospitality industry.
Deepak Jain Chief Financial Officer 2010
He is a Qualified Chartered Accountant and has been associated with the company since May 2010 as the Chief Financial Officer. He has over 18 years of experience in the fields of financial, treasury operations and audit functions.
Source: Company, HDFC sec Inst Research
Board is chaired by Non-Executive Chairman

AU SMALL FINANCE BANK : INITIATING COVERAGE
Page | 25
Shareholding Good Credit Ratings
Agency Ratings Brickwork BWR AA (Stable) India Ratings and Research IND A+ (Positive)/IND A1+ CRISIL CRISIL A+ (Stable) Care Ratings CARE A+ (Stable) ICRA ICRA A+ (Stable)
As of July 7, 2017 Source: Company, HDFC sec Inst Research
Promoters32.8
FI and Local MFs23.5
FPIs37.6
Public and others
6.1
Promoter holding is 32.8%
AU SMALL FINANCE BANK : INITIATING COVERAGE
Page | 26
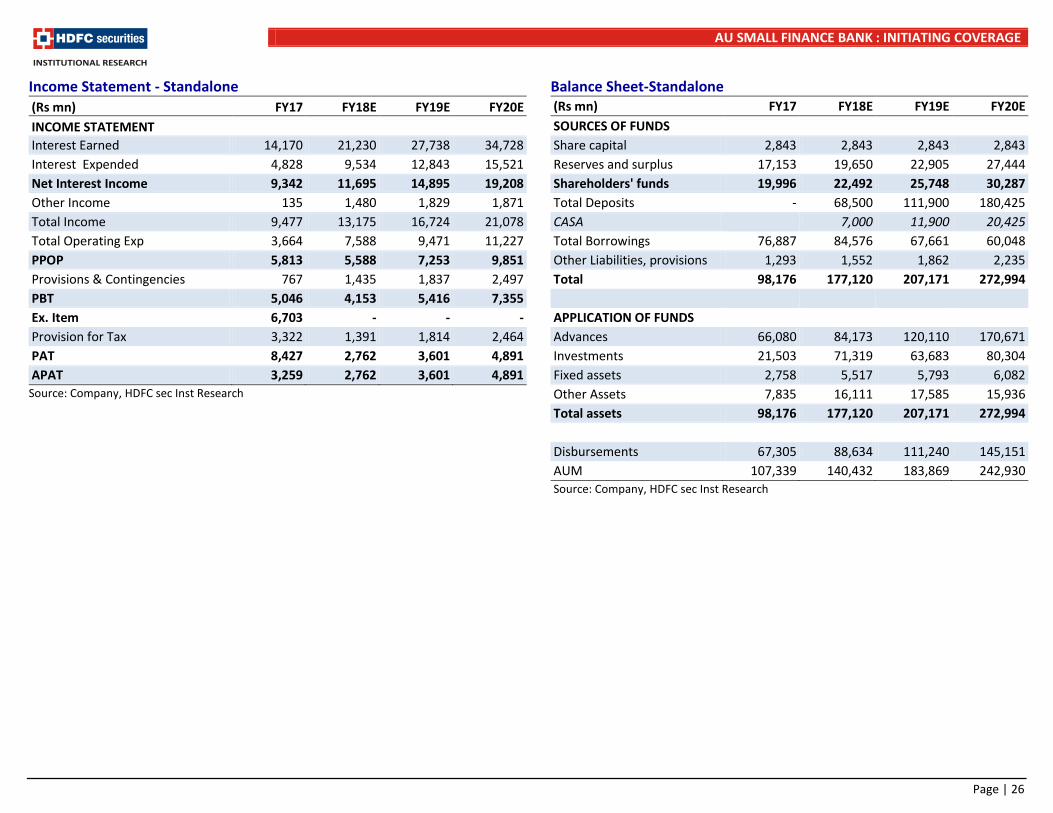
Income Statement - Standalone (Rs mn) FY17 FY18E FY19E FY20E INCOME STATEMENT Interest Earned 14,170 21,230 27,738 34,728 Interest Expended 4,828 9,534 12,843 15,521 Net Interest Income 9,342 11,695 14,895 19,208 Other Income 135 1,480 1,829 1,871 Total Income 9,477 13,175 16,724 21,078 Total Operating Exp 3,664 7,588 9,471 11,227 PPOP 5,813 5,588 7,253 9,851 Provisions & Contingencies 767 1,435 1,837 2,497 PBT 5,046 4,153 5,416 7,355 Ex. Item 6,703 - - - Provision for Tax 3,322 1,391 1,814 2,464 PAT 8,427 2,762 3,601 4,891 APAT 3,259 2,762 3,601 4,891
Source: Company, HDFC sec Inst Research
Balance Sheet-Standalone (Rs mn) FY17 FY18E FY19E FY20E SOURCES OF FUNDS Share capital 2,843 2,843 2,843 2,843 Reserves and surplus 17,153 19,650 22,905 27,444 Shareholders' funds 19,996 22,492 25,748 30,287 Total Deposits - 68,500 111,900 180,425 CASA 7,000 11,900 20,425 Total Borrowings 76,887 84,576 67,661 60,048 Other Liabilities, provisions 1,293 1,552 1,862 2,235 Total 98,176 177,120 207,171 272,994
APPLICATION OF FUNDS Advances 66,080 84,173 120,110 170,671 Investments 21,503 71,319 63,683 80,304 Fixed assets 2,758 5,517 5,793 6,082 Other Assets 7,835 16,111 17,585 15,936 Total assets 98,176 177,120 207,171 272,994 Disbursements 67,305 88,634 111,240 145,151 AUM 107,339 140,432 183,869 242,930
Source: Company, HDFC sec Inst Research

AU SMALL FINANCE BANK : INITIATING COVERAGE
Page | 27
Key Ratios
FY17 FY18E FY19E FY20E VALUATION RATIOS EPS 11.5 9.7 12.7 17.2 Earnings Growth (%) (79.6) (15.3) 30.4 35.8 BV 70.3 79.1 90.6 106.5 ABV (100% cover) 67.9 74.7 86.9 102.0 RoAA (%) 3.1 1.6 1.6 1.7 ROAE (%) 21.7 13.0 14.9 17.5 P/E (x) 49.5 58.4 44.8 33.0 P/ABV (x) 8.3 7.6 6.5 5.6 Dividend Yield (%) 0.14 0.18 0.19
PROFITABILITY Yield on Advances (%) 15.0 14.7 14.4 14.1 Cost of Funds (%) 7.5 8.3 7.9 7.7 Core Spread (%) 7.4 6.4 6.5 6.4 NIM (%) 8.8 6.9 6.5 6.7
OPERATING EFFICIENCY Cost-Income Ratio (%) 38.7 57.6 56.6 53.3 Cost/Avg. Asset Ratio (%) 3.9 6.1 5.8 5.3
BALANCE SHEET STRUCTURE RATIOS Loan Growth (%) 30.6 30.8 30.9 32.1 Deposits Growth (%) 63.4 61.2 Equity/Assets (%) 20.4 12.7 12.4 11.1 Equity/Loans (%) 30.3 26.7 21.4 17.7
Source : Company, HDFC sec Inst Research,
FY17 FY18E FY19E FY20E ASSET QUALITY Gross NPLs (Rsm) 1,072 2,188 3,060 4,073 Net NPLs (Rs man) 693 1,270 1,491 1,846 Gross NPLs on AUM (%) 1.3 1.6 1.7 1.7 Net NPLs (%) 1.06 0.90 0.81 0.76 Coverage Ratio (%) 35.3 42.0 51.3 54.7 Provision/Avg. AUM (%) 0.8 1.2 1.1 1.2
ROAA TREE Net Interest Income 8.8% 6.9% 6.5% 6.7% Non Interest Income 0.1% 0.9% 0.8% 0.7% Operating Cost 3.4% 4.5% 4.1% 3.9% Provisions 0.7% 0.8% 0.8% 0.9% Tax 1.7% 0.8% 0.8% 0.9% ROAA 3.1% 1.6% 1.6% 1.7% Leverage (x) 7.11 8.02 9.52 10.19 ROAE 21.7% 13.0% 14.9% 17.5%
Source : Company, HDFC sec Inst Research
AU SMALL FINANCE BANK : INITIATING COVERAGE
Page | 28
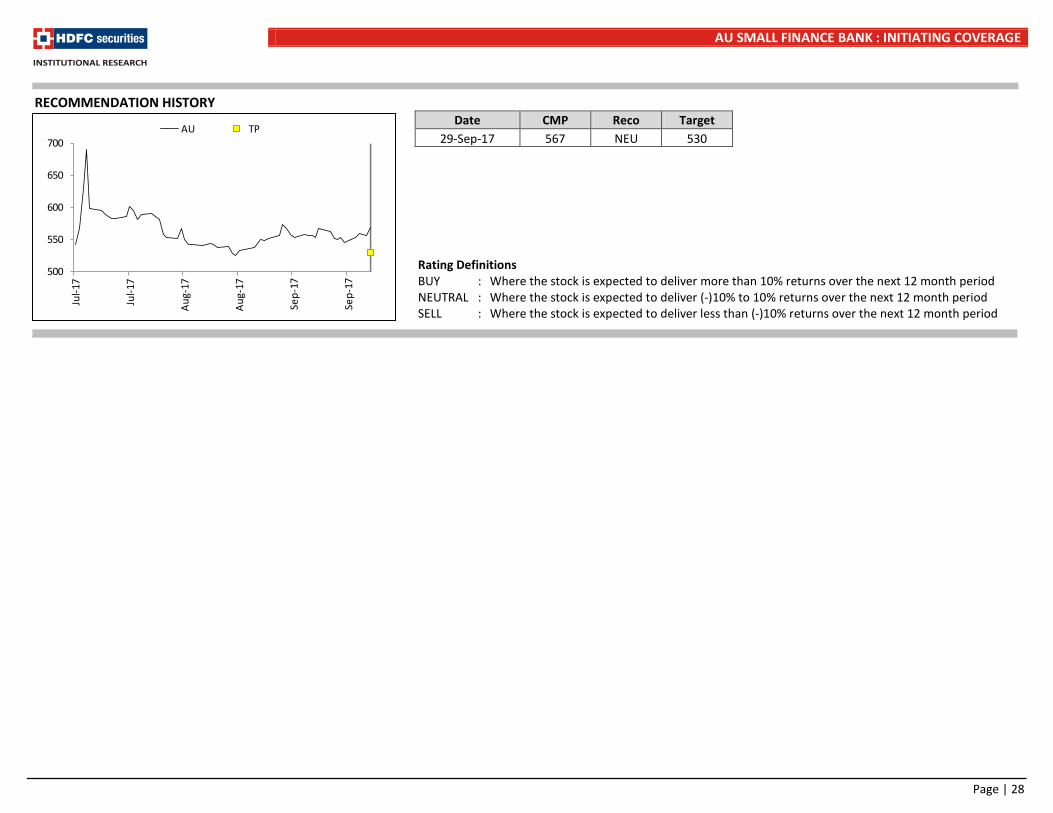
RECOMMENDATION HISTORY
Rating Definitions BUY : Where the stock is expected to deliver more than 10% returns over the next 12 month period NEUTRAL : Where the stock is expected to deliver (-)10% to 10% returns over the next 12 month period SELL : Where the stock is expected to deliver less than (-)10% returns over the next 12 month period
500
550
600
650
700
Jul-1
7
Jul-1
7
Aug-
17
Aug-
17
Sep-
17
Sep-
17
AU TPDate CMP Reco Target
29-Sep-17 567 NEU 530

AU SMALL FINANCE BANK : INITIATING COVERAGE
Page | 29
Disclosure: I, Vishal, Rampuria, CA, author and the name subscribed to this report, hereby certify that all of the views expressed in this research report accurately reflect our views about the subject issuer(s) or securities. HSL has no material adverse disciplinary history as on the date of publication of this report. We also certify that no part of our compensation was, is, or will be directly or indirectly related to the specific recommendation(s) or view(s) in this report. Research Analyst or his/her relative or HDFC Securities Ltd. does not have any financial interest in the subject company. Also Research Analyst or his relative or HDFC Securities Ltd. or its Associate may have beneficial ownership of 1% or more in the subject company at the end of the month immediately preceding the date of publication of the Research Report. Further Research Analyst or his relative or HDFC Securities Ltd. or its associate does not have any material conflict of interest. Any holding in stock –No HDFC Securities Limited (HSL) is a SEBI Registered Research Analyst having registration no. INH000002475. Disclaimer: This report has been prepared by HDFC Securities Ltd and is meant for sole use by the recipient and not for circulation. The information and opinions contained herein have been compiled or arrived at, based upon information obtained in good faith from sources believed to be reliable. Such information has not been independently verified and no guaranty, representation of warranty, express or implied, is made as to its accuracy, completeness or correctness. All such information and opinions are subject to change without notice. This document is for information purposes only. Descriptions of any company or companies or their securities mentioned herein are not intended to be complete and this document is not, and should not be construed as an offer or solicitation of an offer, to buy or sell any securities or other financial instruments. This report is not directed to, or intended for display, downloading, printing, reproducing or for distribution to or use by, any person or entity who is a citizen or resident or located in any locality, state, country or other jurisdiction where such distribution, publication, reproduction, availability or use would be contrary to law or regulation or what would subject HSL or its affiliates to any registration or licensing requirement within such jurisdiction. If this report is inadvertently send or has reached any individual in such country, especially, USA, the same may be ignored and brought to the attention of the sender. This document may not be reproduced, distributed or published for any purposes without prior written approval of HSL. Foreign currencies denominated securities, wherever mentioned, are subject to exchange rate fluctuations, which could have an adverse effect on their value or price, or the income derived from them. In addition, investors in securities such as ADRs, the values of which are influenced by foreign currencies effectively assume currency risk. It should not be considered to be taken as an offer to sell or a solicitation to buy any security. HSL may from time to time solicit from, or perform broking, or other services for, any company mentioned in this mail and/or its attachments. HSL and its affiliated company(ies), their directors and employees may; (a) from time to time, have a long or short position in, and buy or sell the securities of the company(ies) mentioned herein or (b) be engaged in any other transaction involving such securities and earn brokerage or other compensation or act as a market maker in the financial instruments of the company(ies) discussed herein or act as an advisor or lender/borrower to such company(ies) or may have any other potential conflict of interests with respect to any recommendation and other related information and opinions. HSL, its directors, analysts or employees do not take any responsibility, financial or otherwise, of the losses or the damages sustained due to the investments made or any action taken on basis of this report, including but not restricted to, fluctuation in the prices of shares and bonds, changes in the currency rates, diminution in the NAVs, reduction in the dividend or income, etc. HSL and other group companies, its directors, associates, employees may have various positions in any of the stocks, securities and financial instruments dealt in the report, or may make sell or purchase or other deals in these securities from time to time or may deal in other securities of the companies / organizations described in this report. HSL or its associates might have managed or co-managed public offering of securities for the subject company or might have been mandated by the subject company for any other assignment in the past twelve months. HSL or its associates might have received any compensation from the companies mentioned in the report during the period preceding twelve months from t date of this report for services in respect of managing or co-managing public offerings, corporate finance, investment banking or merchant banking, brokerage services or other advisory service in a merger or specific transaction in the normal course of business. HSL or its analysts did not receive any compensation or other benefits from the companies mentioned in the report or third party in connection with preparation of the research report. Accordingly, neither HSL nor Research Analysts have any material conflict of interest at the time of publication of this report. Compensation of our Research Analysts is not based on any specific merchant banking, investment banking or brokerage service transactions. HSL may have issued other reports that are inconsistent with and reach different conclusion from the information presented in this report. Research entity has not been engaged in market making activity for the subject company. Research analyst has not served as an officer, director or employee of the subject company. We have not received any compensation/benefits from the subject company or third party in connection with the Research Report. HDFC securities Limited, I Think Techno Campus, Building - B, "Alpha", Office Floor 8, Near Kanjurmarg Station, Opp. Crompton Greaves, Kanjurmarg (East), Mumbai 400 042 Phone: (022) 3075 3400 Fax: (022) 2496 5066 Compliance Officer: Binkle R. Oza Email: [email protected] Phone: (022) 3045 3600 HDFC Securities Limited, SEBI Reg. No.: NSE-INB/F/E 231109431, BSE-INB/F 011109437, AMFI Reg. No. ARN: 13549, PFRDA Reg. No. POP: 04102015, IRDA Corporate Agent License No.: HDF 2806925/HDF C000222657, SEBI Research Analyst Reg. No.: INH000002475, CIN - U67120MH2000PLC152193 Mutual Funds Investments are subject to market risk. Please read the offer and scheme related documents carefully before investing.

AU SMALL FINANCE BANK : INITIATING COVERAGE
Page | 30
HDFC securities Institutional Equities Unit No. 1602, 16th Floor, Tower A, Peninsula Business Park, Senapati Bapat Marg, Lower Parel, Mumbai - 400 013 Board : +91-22-6171 7330 www.hdfcsec.com