neuroinformatics challenges in mri data integration
DESCRIPTION
Neuroinformatics challenges in MRI data integration. Hugo Schnack Rudolf Magnus Institute of Neuroscience Department of Psychiatry University Medical Centre Utrecht www.smri.nl ([email protected]). Our recent acquisition: 7 Tesla scanner. Officially opened, December 4 th , 2007. - PowerPoint PPT PresentationTRANSCRIPT

Neuroinformatics challenges in MRI data integration
Hugo Schnack
Rudolf Magnus Institute of NeuroscienceDepartment of Psychiatry
University Medical Centre Utrechtwww.smri.nl ([email protected])
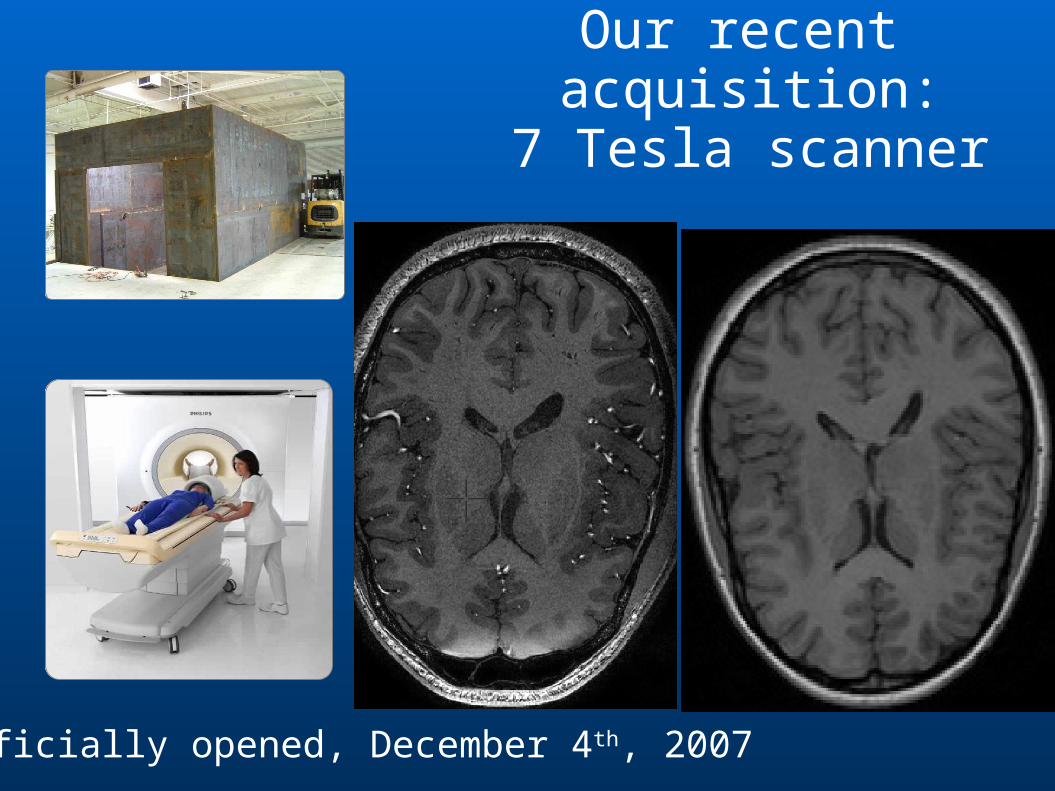
Our recent acquisition:7 Tesla scanner
Officially opened, December 4th, 2007

Our research
Investigation of morphological brain abnormalities in psychiatric disorders (schizophrenia)Q: Are brains of schizophrenia patients smaller?
Magnetic Resonance Imaging (MRI) scans of patients and healthy comparison subjects
Image processing and statistical analysesA: Yes, statistically they are.

Schizophrenia patients have less gray matter than healthy subjects
N=310 for this resultLarge variation in brain morphology

Heritability of brain changes in schizophrenia

Heritable brain changes in schizophrenia
P-C N-N P-C N-N
N=2x44 for this result(Discordant) twins are sparse

We Need More Twins!
International collaborations
EUTwinsS (European Twin Study Network on Schizophrenia)Germany, the UK, The Netherlands, Spain, Hungary and Switzerland
STAR (Schizophrenia Twin and Relatives) consortiumHeidelberg, Jena, London, Utrecht, Helsinki

Can we combine brain scans from different scanners (machines, manufacturers, acquisition protocols, field strength, in time, …)?
What do we mean by ‘Can’? (increase in power; closer to ‘the truth’ – can we know the truth?)
Is there a measure of goodness for (processed) MRI scan?
Multicenter MRI
Goal: combine MRI data from different scanners

Scanner
Truth
Derivatives:Segments, volumes, shapes, fiber tracts, …
Processing

Another
ScannerScannerNow
ScannerTwo years later
TruthNow
TruthTwo years later
Derivatives:Segments, volumes, shapes, fiber tracts, …
Derivatives:Segments, volumes, shapes, fiber tracts, …
Processing (+2 yr)

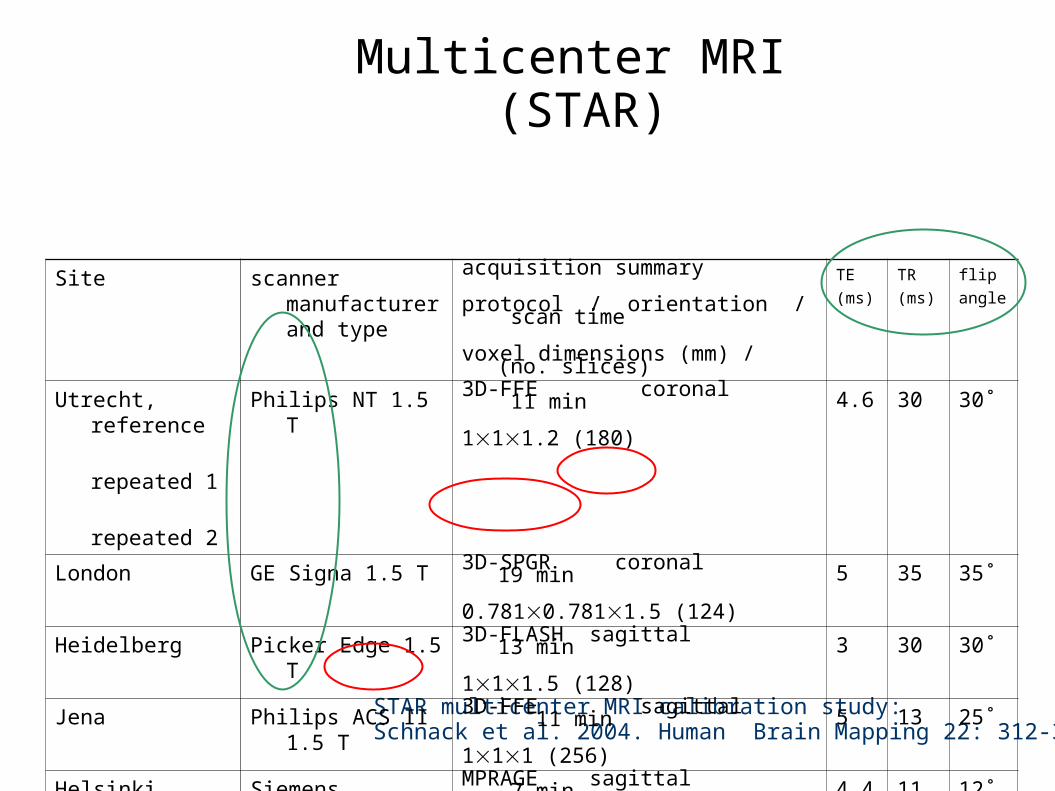
Multicenter MRI(STAR)
STAR multicenter MRI calibration study:Schnack et al. 2004. Human Brain Mapping 22: 312-320.
Site scanner manufacturer and type
acquisition summary
protocol / orientation / scan time
voxel dimensions (mm) / (no. slices)
TE
(ms)
TR
(ms)
flip
angle
Utrecht, reference
repeated 1
repeated 2
Philips NT 1.5 T 3D-FFE coronal 11 min
111.2 (180)4.6 30 30˚
London GE Signa 1.5 T 3D-SPGR coronal 19 min
0.7810.7811.5 (124)5 35 35˚
Heidelberg Picker Edge 1.5 T 3D-FLASH sagittal 13 min
111.5 (128)3 30 30˚
Jena Philips ACS II 1.5 T 3D-FFE sagittal 11 min
111 (256)5 13 25˚
Helsinki Siemens Magnetom Impact 1.0 T
MPRAGE sagittal 7 min
111.2 (128)4.4 11.4 12˚

Multicenter MRI
6 healthy subjects scanned in Utrecht (twice), Heidelberg, Jena, London
Processed with image processing pipeline in Utrecht
1. Measure reliability (fixed algorithms)
2. Calibrate algorithms (tunable parameters)
Goal: combine MRI data from different scanners
Calibration study
Multicenter MRI
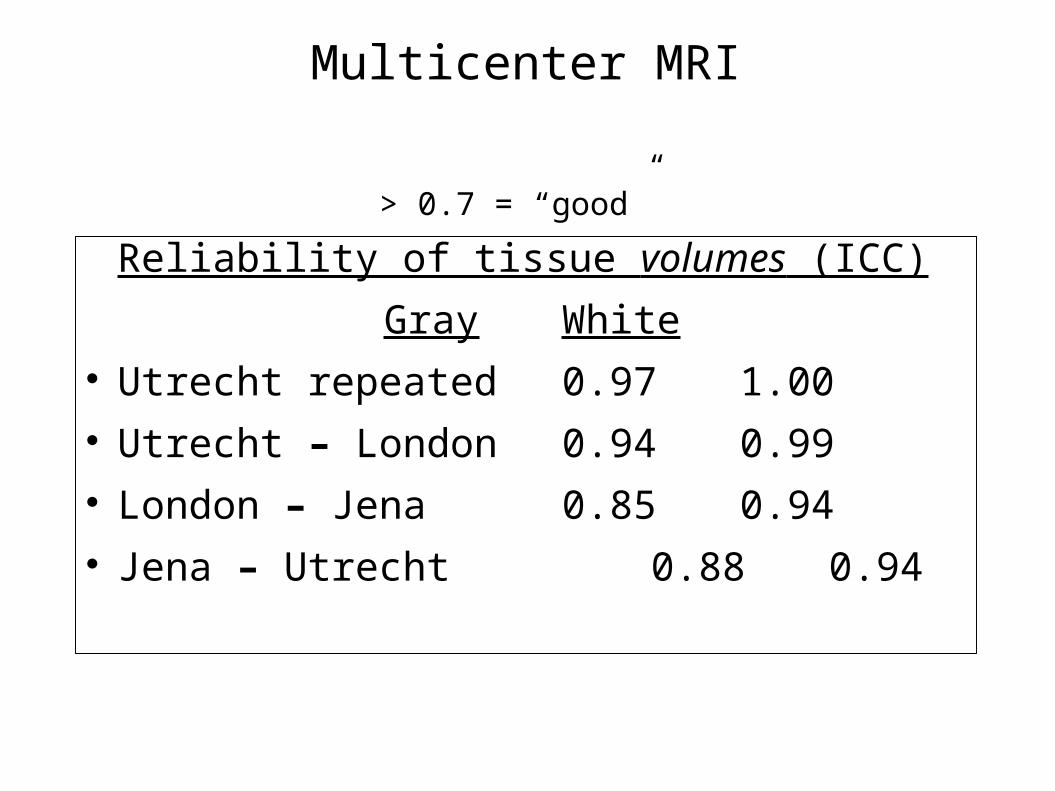
Reliability of tissue volumes (ICC)
Gray White Utrecht repeated 0.97 1.00 Utrecht – London 0.94 0.99 London – Jena 0.85 0.94 Jena – Utrecht 0.88 0.94
ICC = true variation / (true variation + error) > 0.7 = “good”
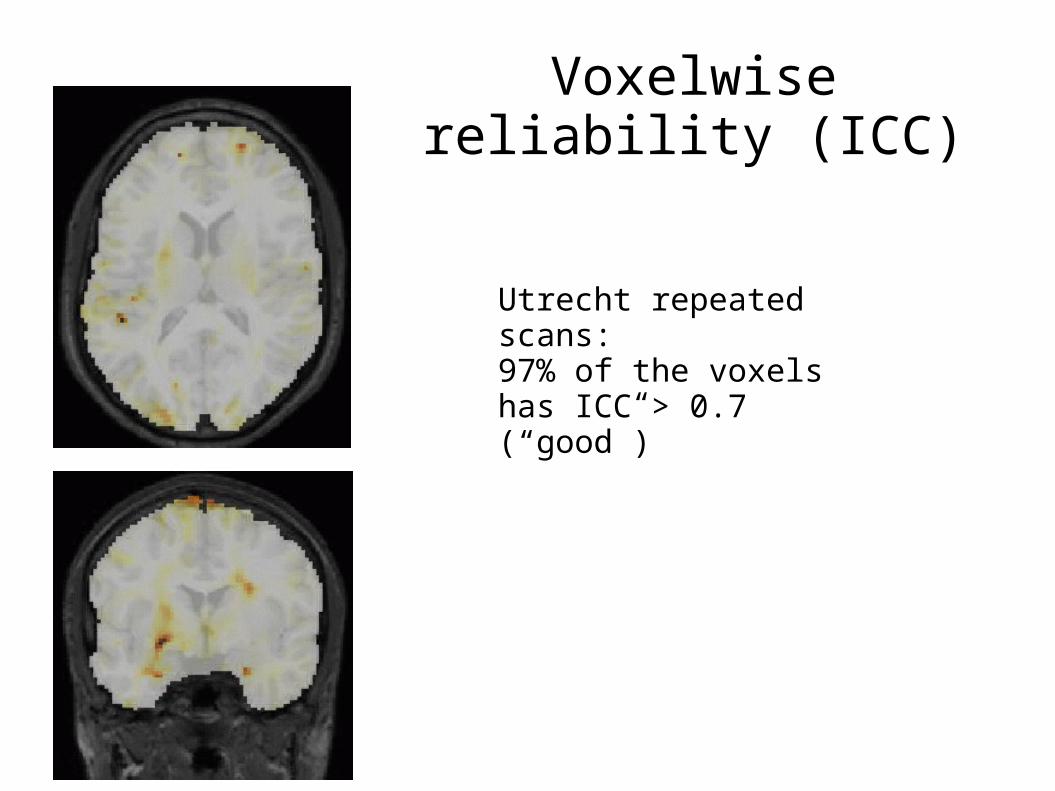
Voxelwise reliability (ICC)
Utrecht repeated scans:97% of the voxels has ICC > 0.7 (“good”)
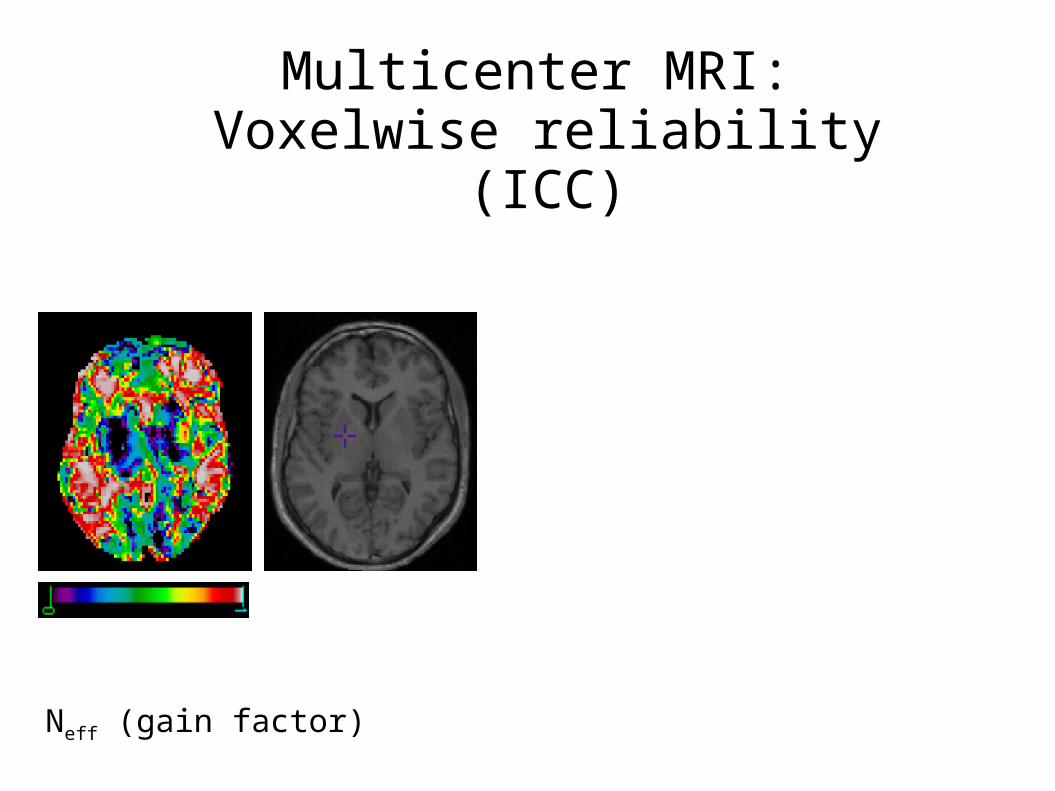
Multicenter MRI:Voxelwise reliability (ICC)
Neff (gain factor)

ChallengesComparability of MR images (scanners)Comparability of analysis tools (software)Comparability of their interactions
Creation of gold standards (“truths”)Create better simulated MR images
Other “calibration” mechanisms (insteadof sending out 6 people around Europe?)
How to present / summarize /visualize reliability? (generalizable?)
Other modalities…
Rudolf Magnus Institute of NeuroscienceDepartment of Psychiatry
University Medical Centre Utrechtwww.smri.nl ([email protected])
ContributorsHugo SchnackNeeltje van HarenRachel BrouwerHilleke Hulshoff Pol (head Neuroimaging Psychiatry)René Kahn (head Dept. Psychiatry)