neuroendocrine changes in the acute phase of traumatic ...©tur sigurjónsson.pdf · gcs, apacheii...
TRANSCRIPT

Neuroendocrine changes in the acute phase of
traumatic brain injury and subarachnoid hemorrhage
Pétur Sigurjónsson
Thesis for the degree of Master of Science
University of Iceland
Faculty of Medicine
Hormónabreytingar í bráðafasa sjúklinga með
höfuðáverka eða innanskúmsblæðingu
Pétur Sigurjónsson
Ritgerð til meistaragráðu í líf- og læknavísindum
Umsjónarkennari: Helga Ágústa Sigurjónsdóttir MD, Ph.D.
Meistaranámsnefnd: Sigurbergur Kárason, MD, Ph.D
Ingvar Hákon Ólafsson, MD
Læknadeild
Heilbrigðisvísindasvið Háskóla Íslands
Október 2015


Neuroendocrine changes in the acute phase of traumatic brain injury and subarachnoid hemorrhages
Pétur Sigurjónsson
Thesis for the degree of Master of Science
Supervisor: Helga Ágústa Sigurjónsdóttir MD, Ph.D.
Masters committee: Sigurbergur Kárason, MD, Ph.D
Ingvar Hákon Ólafsson, MD
Faculty of Medicine
School of Health Sciences
October 2015

Ritgerð þessi er til meistaragráðu í læknisfræði og er óheimilt að afrita ritgerðina á
nokkurn hátt nema með leyfi rétthafa.
© Pétur Sigurjónsson 2015
Prentun: Háskólaprent
Reykjavík, Ísland, 2015

3
Ágrip
Inngangur: Höfuðáverkar (HÁ) og innanskúmsblæðingar (ISB) valda dauða og varanlegri fötlun.
Rannsóknir benda til að HÁ og ISB hafi áhrif á starfsemi fremri heiladingulsins í bæði bráða- og
síðfasa TBI og SAH. Markmið rannsóknarinnar voru að meta eðli hormónabreytinga í bráðafasa
miðlungs og alvarlegra HÁ og allra ISB. Að meta tengsl hormónabreytinga og alvarleika áfalls sem og
lækkunar í blóðþrýstingi, súrefnismettun og blóðleysi.
Efni og aðferðir: Rannsóknin var framsýn og framkvæmd á einni stofnun. Hormónaöxlar fremri
heiladinguls voru metnir við innlögn (dag 0) með hormónamælingum og 6 dögum eftir áfall með
hormónamælingum og Synacthen prófi. Úr sjúkraskrám bæði HÁ og ISB sjúklinga (sjkl.) var skráð
GCS, APACHEII skor, lengd gjörgæslulegu, skráning á víkkun sjáaldurs, blóðþrýstingsfall og fall í
súrefnismettun og blóðleysi með hemoglóbín gildi < 80 g/dL. Hunt og Hess skor var skráð fyrir ISB hóp
og Injury Severity skor fyrir HÁ hóp. S100b var mælt í öllum sjkl. við innlögn. Í rannsókninni tóku þátt
21 HÁ sjkl., 6 með miðlungs alvarlegan HÁ og 15 með alvarlegan HÁ, og 19 ISB sjkl..
Niðurstöður: Sykursteraöxullinn: HÁ hópurinn hafði marktækt lægra kortisól en ISB hópurinn við
innlögn, undir viðmiðunargildum voru 23,8% borið saman við 0% í ISB hópnum. Dag 6 var einn sjkl. í
hvorum hóp sem hafði kortisól undir viðmiðunargildi, 6,7% af HÁ hópnum og 9,1% af ISB hópnum.
Kynhormónaöxullinn: Í karlmönnum á degi 0 var truflun hjá 52,9% í HÁ hópnum og 57,1% í ISB
hópnum. Á degi 6, 84,6% í HÁ hópnum og 90% í ISB hópnum. Það var meiri bæling á LH/FSH í HÁ
hópnum. Skjaldkirtlishormónaöxullinn: Einn TBI sjkl. (5,9%) hafði miðlægan skjaldvakabrest á degi 6.
Vaxtarhormónaöxullinn: Á degi 0 höfðu 52.4% í HÁ hópnum og 35.7% í ISB hópnum lágt IGF. Á degi
6 höfðu allir nema einn HÁ sjkl. (5.9%) eðl IGF-1 gildi en 25% í ISB hópnum enn lág IGF-1 gildi.
Þegar tengsl hormónatruflana og alvarleika áfalls voru skoðuð var almennt með auknum alvarleika
aukin truflun/bæling á kynhormóna- og skjaldkirtilshormónaöxlinum og aukin virkjun á
sykursteraöxlinum.
Ályktanir: Hormónatruflanir í bráðafasa HÁ og ISB eru algengar. HÁ sjkl. eru í hættu á að fá
sykursteraskort en að greina slíkan skort réttilega er erfitt en um leið mjög mikilvægt. Algengasta
truflun á heiladingulsöxli var í kynhormónaöxli. Aukin bæling á kynhormóna- og sykursteraöxlinum á
heiladingulstigi öxulsins sem og munur á bælingu vaxtarhormónaöxulsins milli HÁ og ISB sjkl. getur
bent til að það sé munur á meingerð hormónatruflana hjá HÁ og ISB sjkl. Hvort hormónabreytingar í
bráðafasa HÁ og ISB sé eðlileg aðlögun eða ekki er óljóst sem og klíniskt mikilvægi þessara truflana
annarra en í sykursteraöxlinum. Frekari rannsókna er því þörf. Meðhöndlandi læknar ættu að meta
sykursteraöxulinn þegar ábending er til staðar. Skimun fyrir öðrum hormónatruflunum gæti bent til
þarfar á eftirfylgd í síðfasa HÁ og ISB.

4

5
Abstract
Background and aims of the study: Traumatic brain injury (TBI) and subarachnoid hemorrhage (SAH)
can cause death and long-term morbidity. Studies indicate that both TBI and SAH may affect pituitary
function in both the acute and the chronic phase. The aims of this study were firstly to evaluate the
nature of neuroendocrine changes in the acute phase of moderate and severe TBI and all SAH. To
evaluate association between neuroendocrine disturbance and indicators of severity of insult as well
as hypotension, desaturation and anemia.
Methods: The study was a prospective single-center study. Anterior hypothalamic-pituitary (HP)
hormone axis were assessed on admission (day0) with baseline hormone levels and on day 6 post
insult with baseline hormone levels and a Synacthen test. From patient charts we recorded for all
patients GCS, APACHEII score, length of ICU stay, pupil dilatation, documented hypotension,
desaturation and hemoglobin value <80 g/dL. Hunt and Hess grade for SAH group and Injury severity
score for TBI group. S100b was measured in all patients on admission. We included 21 TBI patient, 6
moderate TBI and 15 severe TBI, and 19 SAH patients.
Results: HP-adrenal axis: The TBI group had significantly lower mean cortisol than the SAH group on
day 0, 23.8% of TBI patients had low cortisol and 0% of SAH patients. On day 6, one patient in each
group had low cortisol, 6.7% of TBI and 9.1% of SAH. HP-gonadal axis: In males on day 0, 52.9% of
TBI patients and 57.1% of SAH patients and on day 6, 84.6% of TBI patients and 90% of SAH patients
had suppressed HP-gonadal axis. There was a greater suppression of LH/FSH in the TBI group. HP-
thyroid axis: Only one TBI patient (5.9%) had secondary hypothyroidism on day 6. HP-somatotroph
axis: On day 0, 52.4% of TBI patients and 35.7% of SAH patients had low IGF-1. On day 6 all but one
TBI patient (5.9%) had normalized their IGF-1 but 25% of SAH patients still had low IGF-1.
In general when evaluating association there seemed to more suppression of the hypothalamic-
pituitary (HP) gonadal and thyroid axis with more severe insult and adequately more activation of the
hypothalamic-pituitary adrenal axis.
Conclusion: Neuroendocrine disturbance in the acute phase of TBI and SAH is common. TBI patients
are at risk for corticosteroid insufficiency (CI) but the diagnosis of CI is difficult but the at the same time
very important to diagnose. The HP-gonadal axis was the most commonly disturbed axis. Greater
suppression of the HP-gonadal and adrenal axis at the pituitary level in TBI patients as well as
difference in somatotroph disturbance may be explained by different causative mechanisms for
hormonal disturbance in TBI and SAH patients. The clinical significance of these disturbances, other
than the HP-adrenal axis, whether adaptive or maladaptive is uncertain. Further studies are needed
on the subject. Clinicians should evaluate the HP-axis on indication as treament with hydrocortisone
can be lifesaving. Routine evaluation of other hormonal axis during the acute phase of TBI or SAH
might indicate a need for further follow up in the chronic phase of TBI or SAH insult.

6

7
Acknowledgments
I wish to express my gratitude to the numerous people who have contributed to this thesis.
First of all I want to express my sincere thanks to my supervisor Helga Ágústa Sigurjónsdóttir for all
her guidance and support, motivation and patience. I also express my appreciation to the other
members of my masters committee, Sigurbergur Kárason and Ingvar H. Ólafsson. Many thanks to
Sigurbergur for his valuable feedback on the thesis and encouragement and support both with the
thesis and in clinical work. I would like to thank Ingvar for his feedback and support.
I want to thank my co-worker and friend Ásta Dögg Jónasdóttir for all her assistance and
encouragement, I doubt that I could have finished this thesis if it were not for Ásta.
I want to thank Guðmundur Sigþórsson for his help and guidance with the analytical methods. I
want to thank my dear friend Linda Rydén for all her help with downloading articles at times I did not
have access to certain journals.
I want to thank my former boss, the head of residency at the Karolinska University Hospital,
Kristina Hambraeus Jonzon for her encouragement and support. I would also like to thank my clinical
supervisor during my residency at the Karolinska University Hospital Max Bell for his guidance and
support.
I want to thank the doctors, nurses and other staff at the Department of anesthesia and intensive
care at Landspitali University Hospital. I also want to thank the staff of the Emergency department and
the Department of neurosurgery.
Finally I want to thank my parents, Sigurjón and Þóra Hrönn, for their encouragment and support.
Last but not least I want to thank my partner and best friend Bjössi for all his support.
The study was supported by the Landspitali University Hospital Scientific Fund.

8

9
Table of contents
Ágrip ......................................................................................................................................................... 3
Abstract..................................................................................................................................................... 5
Table of contents ...................................................................................................................................... 9
List of figures ..........................................................................................................................................11
List of tables ...........................................................................................................................................11
1 Introduction:......................................................................................................................................15
1.1 Traumatic brain injury: .............................................................................................................. 15
1.1.1 Classification of TBI severity: ............................................................................................ 15
1.1.2 Pathophysiology of TBI: .................................................................................................... 15
1.1.3 Predicting prognosis after TBI: .......................................................................................... 16
1.1.4 Biomarkers in TBI, S100b: ................................................................................................ 16
1.1.5 Treatment of TBI: .............................................................................................................. 17
1.1.6 Neuroprotective treatment of TBI: ..................................................................................... 18
1.2 Subarachnoid hemorrhage:...................................................................................................... 19
1.2.1 Classification of SAH: ........................................................................................................ 19
1.2.2 Epidemiology and risk factors for SAH: ............................................................................ 20
1.2.3 Pathophysiology of SAH: .................................................................................................. 21
1.2.4 Treatment of SAH: ............................................................................................................ 21
1.2.5 Neuroprotective treatment: ............................................................................................... 21
1.3 The piuitary gland: .................................................................................................................... 21
1.4 The endocrine response in critical illness: ............................................................................... 24
1.4.1 Diagnosing endocrine dysfunction in the critically ill patient: ............................................ 24
1.4.2 Hypothalamic-pituitary adrenal axis in critical illness: ....................................................... 24
1.4.3 Hypothalamic-pituitary thyroid axis in critical illness: ........................................................ 25
1.4.4 Hypothalamic-pituitary gonadal and lactotroph axis in critical illness: .............................. 25
1.4.5 Hypothalamic-pituitary-somatotroph axis in critical illness: ............................................... 25
1.4.6 Therapeutic implications: .................................................................................................. 25
1.5 Neuroendocrine disturbances following TBI and SAH: ............................................................ 26
1.5.1 Prevalence of hypopituitarism in the late phase following TBI and SAH: ......................... 26
1.5.2 Natural course of hypopituitarism following TBI and SAH: ............................................... 26
1.5.3 Predictive factors for hypopituitarism following TBI and SAH: .......................................... 26
1.5.4 Neuroendocrine disturbances in the acute phase of TBI and SAH: ................................. 27
1.5.5 Hypothalamic-pituitary adrenal axis in the acute phase of TBI and SAH: ........................ 36
1.5.6 Hypothalamic-pituitary gonadal and lactotroph axis in the acute phase of TBI and SAH: 36
1.5.7 Hypothalamic-pituitary thyroid axis in the acute phase of TBI and SAH: ......................... 36

10
1.5.8 Hypothalamic-pituitary somatotroph axis in the acute phase of TBI and SAH: ................ 37
1.5.9 Pathophysiology of neuroendocrine disturbances in the TBI settings: ............................. 37
1.5.10 Pathophysiology of neuroendocrine disturbances in the SAH settings: ......................... 37
2 Aims: ................................................................................................................................................39
3 Material and methods: ......................................................................................................................41
3.1 Subjects:................................................................................................................................... 41
3.2 Ethics: ....................................................................................................................................... 41
3.3 Anterior pituitary assessment: .................................................................................................. 41
3.4 Analytic methods: ..................................................................................................................... 42
3.5 Clinical and laboratory variables as indicators of severity and ischemic events: .................... 42
3.6 Statistics: .................................................................................................................................. 42
4 Results: ............................................................................................................................................47
4.1 Hypothalmic-pituitary adrenal axis: .......................................................................................... 52
4.2 Hypothalmic-pituitary gonadal axis: ......................................................................................... 52
4.2.1 Hypothalamic-pituitary gonadal axis in males: .................................................................. 52
4.2.2 Hypothalamic-pituitary gonadal axis in females: ............................................................... 53
4.3 Hypothalmic-pituitary lactotrophic axis: .................................................................................... 53
4.4 Hypothalmic-pituitary thyrotrophic axis: ................................................................................... 53
4.5 Hypothalmic-pituitary somatotrophic axis: ............................................................................... 54
4.6 Correlations between hormone values and indicators of severity: .......................................... 56
5 Discussion: .......................................................................................................................................59
5.1 Hypothalmic-pituitary adrenal axis: .......................................................................................... 59
5.2 Hypothalmic-pituitary gonadal and lactotroph axis: ................................................................. 61
5.3 Hypothalmic-pituitary thyroid axis: ........................................................................................... 62
5.4 Hypothalmic-pituitary somatotroph axis: .................................................................................. 63
5.5 Strengths of the study: ............................................................................................................. 63
5.6 Limitations of the study: ........................................................................................................... 64
6 Conclusion: .......................................................................................................................................65
References: ............................................................................................................................................67

11
List of figures
Figure 1. The Crash prognostic model (Source: http://www.trialscoordinatingcentre.lshtm.ac.uk) . 17
Figure 2. The pituitary gland and its anatomy (Source Organsofthebody,
http://www.organsofthebody.com/pituitary-gland/) ................................................................................ 23
Figure 3 The pituitary gland, anatomy, vasculature and connection to the hypothalamus (Source:
Medscape, http://www.medscape.com/viewarticle/518323_3) ............................................................. 23
Figure 4 Proportion of both TBI and SAH patients on admission with low, normal or high hormone
values TSH =thyroid stimulating hormone, fT4 = free thyroxine 4, LH = luteinizing hormone, FSH =
follicle stimulating hormone, ACTH = adrenocorticotroph hormone, IGF-1 = Insulin like growth factor 1
............................................................................................................................................................... 51
Figure 5 Proportion of both TBI and SAH patients on day 6 with low, normal or high hormone
values TSH =thyroid stimulating hormone, fT4 = free thyroxine 4, LH = luteinizing hormone, FSH =
follicle stimulating hormone, ACTH = adrenocorticotroph hormone, IGF-1 = Insulin like growth factor 1
............................................................................................................................................................... 51
Figure 6 Changes in Insulin like growth factor 1 (IGF-1) in the TBI group from admission to day 6,
each line represents one patient ........................................................................................................... 55
Figure 7 Changes in Insulin like growth factor 1 (IGF-1) in the SAH group from admission to day 6,
each line represents one patient. .......................................................................................................... 55
List of tables
Table 1. The Glasgow Coma Scale ....................................................................................................... 15
Table 2. Overview of candidates as neuroprotective agents ................................................................ 18
Table 3 The Hunt and Hess scale ......................................................................................................... 20
Table 4. The World Federation of Neurosurgeons Classification.......................................................... 20
Table 5. The Fisher CT grading score ................................................................................................... 20
Table 6. Hypothalamic, pituitary hormones and target organs/cells. .................................................... 22
Table 7. Summary of studies evaluating neuroendocrine changes in the acute phase of TBI. ............ 28
Table 8. Summary of studies evaluating neuroendocrine changes in the acute phase of SAH. .......... 33
Table 9. Analytic methods ..................................................................................................................... 44
Table 10. Demographics and mutual clinical variables for TBI and SAH groups .................................. 48
Table 11. Mean and median hormone values on admission and day 6, TBI group .............................. 49
Table 12 Mean and median hormone values on admission and day 6, SAH group ............................. 50
Table 13 Overview of significant correlation between variables, indicators of severity, and hormone
values in TBI patients ............................................................................................................................ 57

12
Table 14 Overview of significant correlation between variables, indicators of severity, and hormone
values in in SAH patients....................................................................................................................... 57
Table 15: Significant differences in hormone values grouping TBI wether dilatation of pupil or ischemic
event occurred or not ............................................................................................................................. 58
Table 16: Significant differences in hormone values grouping SAH patients wether dilatation of pupil or
ischemic event occurred or not ............................................................................................................. 58
List of abbreviations
ACTH Adrenocorticotropic hormone
ADH Antidiuretic hormone
APACHEII Acute Physiology and Chronic Health Evaluation II
ATLS Acute trauma life support
BBB Blood brain barrier
CRCI Critical illness related corticosteroid insufficiency
CI Corticosteroid insufficiency
E2 17 b-estradiol
eNOS Endothelial nitric oxide synthase
FSH Follicle stimulating hormone
fT4 Free thyroxine
GH Growth hormone
GCS Glasgow coma scale
HP Hypothalamic-pituitary
ICP Intracranial pressure
ICU Intensive care unit
IGF-1 Insulin like growth factor1
IH Inhibiting hormone
iNOS Inducible nitric oxide synthase
LH Luteinizing hormone
LUH Landspitali – National University Hospital of Iceland
mTBI Moderate traumatic brain injury
p-ACTH Plasma levels of adrenocorticotropic hormone
PRL Prolactin
QoL Quality of life
RH Releasing hormone
SAH Subarachnoid hemorrhage

13
Sjkl. Sjúklingur
sTBI Severe traumatic brain injury
T3 Triiodothyronine
T4 thyroxin
TBI Traumatic brain injury
TSH Thyroid stimulating hormone
WFNS World Federation of Neurosurgeons Classification

14

15
1 Introduction:
1.1 Traumatic brain injury:
Traumatic brain injury (TBI) is a leading cause for permanent disability and death among young
people. The reported incidence of hospitalized and fatal TBI in Europe is 235 per 100,000/year and
the mortality rate 15.4 per 100,000/year. Furthermore, of the yearly incidence mild TBI (see TBI
classification below) is 79%, moderate 12% and severe 9% (1). The annual incidence for hospitalized
head injury in Iceland decreased from 181 per 100.000/year in the year 2000 to 110 per 100.000/year
in the year 2009 (2). Even higher incidence has been reported in the USA or 538/100.000 (3).
The prevalence of neurological and functional impairments after moderate and severe TBI (see
classification below) has been reported to be 1-2% meaning that in the USA 3,2-5,3 million people are
living with sequel from moderate and severe TBI (4).
During the years 1990-2000, the average mortality from TBI in Iceland with roughly 300.000
inhabitants was 32/year (5).
1.1.1 Classification of TBI severity:
TBI has traditionally been classified into mild TBI, moderate TBI (mTBI) and severe TBI (sTBI) by an
injury severity score the Glasgow Coma Scale (GCS). Points are given for eye-opening (1-4), verbal
response (1-5) and motor response (1-6). Severity is defined as: mild injury score of >13, moderate 9
to 13 and severe injury 8 as shown in table 1 (6). There are numerous other scoring systems that
grade consciousness and disability after TBI but GCS is the most commonly used. TBI can even be
classified by mechanism of injury, direct or indirect, blunt or penetrating trauma and on radiologic
findings as the Marshall CT classification (7).
Table 1. The Glasgow Coma Scale
1 2 3 4 5 6
Eye response
Does not open eyes
Opens eyes in response to painful stimuli
Opens eyes in response to voice
Opens eyes spontaneously
N/A N/A
Verbal response
Makes no sounds
Incomprehensible sounds
Utters inappropriate words
Confused, disoriented
Oriented, converses normally
N/A
Motor response
Makes no movements
Extension to painful stimuli (decerebrate response)
Abn flexion to painful stimuli (decorticate response)
Flexion/ Withdrawal to painful stimuli
Localizes painful stimuli
Obeys commands
Points are given for eye-opening, verbal and motor response and the sum is the GCS score. N/A not applicable, Abn = abnormal.
1.1.2 Pathophysiology of TBI:
TBI occurs when a traumatic event injures the brain. It is a heterogeneous disorder but can be divided
into primary and secondary brain injury. Primary brain injury occurs at the time of the trauma caused
by external mechanical forces resulting in contusions, hematomas and white matter shearing and

16
swelling. Primary injury can be either an impact, a direct contact with an object causing trauma, or a
non-impact such as rapid acceleration and deceleration (8).
Secondary brain injury is the result of TBI causing early ionic and neurotransmitter disorder that
initiate a cascade of events that disrupt normal cellular function, including changes in glucose
metabolism, free radical production, mitochondrial dysfunction, inflammatory response and secondary
ischemia. Secondary injury can continue for days causing death of neurons, cerebral edema and
increased intracranial pressure (ICP) that can further exacerbate the brain injury. Its symptomatic
presentation varies with each individual, injury type, injury severity, age and gender, making it
challenging to diagnose, understand and treat. Research efforts to understand the common underlying
neurochemical and metabolic responses to TBI could provide further therapeutic options for early
intervention of TBI in patients of all ages (8,9).
1.1.3 Predicting prognosis after TBI:
Regarding prognostic factors and TBI, the endpoint is often neurological outcome after 6 months or
death. A good prognostic model can aid in resource allocation, estimation for need of further follow up,
researches and treatment, communication with patients´ family and study designs. Prognostic models
using baseline characteristics can predict death and 6 month outcome (10,11). An example is the
model presented by the MRC CRASH trial collaborators predicting 14 day mortality and 6 month
outcome as depicted in figure 1 (12).
1.1.4 Biomarkers in TBI, S100b:
There is a large interest in developing biomarkers both as diagnostic tools as well as prognostic
markers in brain injury. Brain biomarkers usually are proteins that can be repeatedly and safely
measured from biofluids. Among these is S100b which has been extensively studied. S100b is a
small, dimeric calcium-binding protein, located in the cytoplasm and nucleus of a wide range of cells
and involved in the regulation of a number of cellular processes, such as cell cycle progression and
differentiation. Among cells expressing S100b, glial and neural cells of the CNS are the most
abundant, thus it can be detected in serum following TBI (13). Raabe et al showed a significant
correlation between volume of contusion visible on CT scan and serum S100b concentration (14). In a
systematic review by Mercier et al on S100b and mTBI and sTBI there was a significant association
between serum concentrations of S-100b protein and unfavorable prognosis as defined by mortality,
Glasgow outcome score = 3, and brain stem death (15).

17
Figure 1. The Crash prognostic model (Source: http://www.trialscoordinatingcentre.lshtm.ac.uk)
1.1.5 Treatment of TBI:
Describing the treatment of TBI in details is out of the perspective of this thesis. For simplification it
could be said that the treatment of TBI aims at minimizing secondary injury as the primary injury is
often irreversible. It follows the concept of acute trauma life support (ATLS). It starts in the prehospital
settings and continues in the emergency department and the intensive care unit (ICU). It aims at
correcting the physiologic disorder previously described as well as treating other injuries and
complications.
Physiologic disturbance following the initial insult, causing brain injury, can exacerbate secondary
brain injury. These may include hypotension, hypoxia, hyper- and hypocapnia, hypo- and
hyperthermia, metabolic acidosis, seizures, coagulopathy, hyperglycemia, and raised ICP. Hypoxia

18
and hypotension combined may result in an increased mortality rate by 70%. It has been proposed
that the treatment of the patient with TBI should aim at preventing and correcting these physiologic
derangements (16–20) It has also been suggested that intracranial hypertension, ICP>20mmHg,
recorded initially or during neurological deterioration is a strong predictor of negative outcome (21).
Apart from supporting therapy, surgery is a well-established treatment. Mass lesions such as
hematomas or contusions that may cause increased ICP or shifting of intracranial structures can be
surgically removed. Refractory elevated ICP can even be treated with decompressive craniotomy
where part of the skull is removed. Indications for surgical therapy and timing of surgery are based
upon neurologic status and CT findings and the nature of the TBI and type of bleeding (22–26).
1.1.6 Neuroprotective treatment of TBI:
There is great interest in neuroprotective pharmacologic treatment aimed to ameliorate the secondary
injury cascade of events that disrupt normal cellular function and lead to cell death. There have been
numerous candidates as seen in table 2 and research is ongoing but no agent has reached its way to
clinical practice (9). Of these corticosteroids, progesterone, estrogen and insulin like growth factor 1
(IGF-1) are of special interest in this thesis.
Table 2. Overview of candidates as neuroprotective agents
Agents that have been tested in clinical trials or are being tested in ongoing clinical trials.
Anatibant, Ciclosporin, Deltibant, Pegorgotein, Progesterone, Traxoprodil, Dexanabinol, Magesium sulphate, Nimodipine, Rosuvastatin, Selfotel, Tirilazad, Amantadine, Citicoline, Darbepoetin-α, Estrogen, Glibenclamide, human choriconic gonadotropin, recombinant erythopoietin, Minocycline, N-acetyl-cysteine, Oxycyte perfluorcarbon emulsion, Propranol, Clonidin,
Experimental agents with positive in vivo or in vitro evidence
Nicotinamide, Ethyl pyruvate, N-acetyl cysteine, S-nitrosglutathione, Bortezomib, Glyceryltriacetate, Ketogenic diet, BIBN 99 (muscarinic antagonist), Lazaroid U-83836E, NNZ-2566 (glycine-proline-glutamate analogue, Ziconitide, mGlu antagonists, Stilbazulenyl nitrone, Insulin-like growth factor-1, Basic fibroblast growth factor, Nimesulide, Enoxaparin, Minocycline, Rifuzole, Erythropoetin, Pyridoxine, Bromocriptine, S100B, BAY 28-7271 (cannabinoid agonist) Nitric oxide synthase inhibitors, Edavoarone (NMDA-antagonist) AMPA antagonists.
Reproduced from McConeghy et al (27)
Corticosteroids attenuate vasogenic edema and swelling. A systematic review in 1997 suggested
an absolute risk reduction of 1-2% in corticosteroid treated TBI patients. The systematic review
consisted of trials which altogether included about 2000 patients. One of the conclusions were that a
large randomized controlled trial was needed (28). In the CRASH trial TBI patients were randomized
to either receive high dose methylprednisolone or placebo. The trial revealed that routinely giving
corticosteroids to TBI patients resulted in an increase in relative risk, compared to conventional
treatment, of death. With a relative risk of 1.18, 2 weeks after trauma, and 1,15, 6 months after trauma
(29,30). The CRASH trial included patients with mild TBI, mTBI and sTBI and supraphysilogic doses of

19
methylprednisolone were given as a routine. The question remains whether there is a subgroup of TBI
patients that might benefit from treatment with corticosteroids as neuroprotective treatment.
Progesterone´s neuroprotective effect is not completely understood but clearly is multimodal. It
limits cerebral edema and shows anti-inflammatory and anti-apoptotic and some anti-oxidant
properties which enable it to protect against the breakdown of cell membranes that leads to the death
of neurons and glia (31). A systematic review by Ma et al included three randomized controlled
studies, with a total of 315 sTBI patients, and reported a relative risk of death or severe disability in
patients treated with progesterone to be 0.77, compared to no treatment with progesterone. Further
studies are needed on progesterone and TBI (32).
Estradiol has showed neuroprotective potency in various animal models. It affects modulation of
synaptic transmission, regulation of apoptosis, control of oxidative stress and inflammation (9,33).
IGF-1 has neurotropic effects, influences synaptic plasticity, neurotransmitters, metabolic and
energy dynamics and vascular reactivity. TBI rat model have demonstrated that IGF-1 improves
cognitive and motor outcomes. Clinical exposure to this investigational agent is limited in TBI and
studies in human TBI were affected by pharmacokinetic disposition of IGF-1. Recent advances in drug
formulations for IGF-1 may provide opportunity for renewed clinical trials of this agent in patients with
TBI (9).
1.2 Subarachnoid hemorrhage:
SAH accounts for 5% of all strokes. It is a medical emergency and has a mortality of nearly 50% (34).
Survivors often suffer from neurocognitive squeal such as fatigue, mood disturbances, anxiety and
depression and 46% of survivors have cognitive impairment (35). Less than 20% of survivors have no
residual symptoms (36).
1.2.1 Classification of SAH:
As for TBI the GCS is used for assessing level of consciousness. There are three specialized scoring
systems for evaluating SAH, two clinical scoring systems Hunt and Hess and the World Federation of
Neurosurgeons Classification (WFNS) who are explained in tables 2 and 3. The Fisher CT score is
based on radiologic findings (37). For each of these scoring systems a higher number predicts a
worse outcome (38).

20
Table 3 The Hunt and Hess scale
Grade Signs and symptoms
1 Asymptomatic or minimal headache and slight neck stiffness
2 Moderate to severe headache, neck stiffness, no neurologic deficit
3 Drowsy, minimal neurologic deficit
4 Stuporous, moderate to severe hemiparesis, possibly early decerebrate
rigidity and vegetative disturbances
5 Deep coma, decerebrate rigidity, moribund
Table 4. The World Federation of Neurosurgeons Classification
Grade GCS Focal neurological deficit
1 15 Absent
2 13-14 Absent
3 13-14 Present
4 7-12 Present or absent
5 <7 Present or absent
GCS = Glasgow Coma Scale
Table 5. The Fisher CT grading score
Grade Appearance of blood on head CT scan
1 No blood detected
2 Diffuse deposition or thin layer of blood, < 1mm thick
3 Localized clots or blood layer >1 mm thick
4 Intracerebral or intraventricular clots with diffuse or no subarachnoid blood
1.2.2 Epidemiology and risk factors for SAH:
In a systematic review by de Rooji et al the total incidence of SAH was 9/100.000/year but there was a
substantial geographical variance with the lowest reported rates in in South and Central America,
4.2/100.000/year, and the highest rates in Japan, 22.7/100.000/year, and Finland 19.7/100.000/year.

21
Incidence for SAH increases with age and women had a relative risk of 1.24 times compared to men
(39). There is one Icelandic study with a reported incidence of 8/100.000/year (40).
Hypertension, cigarette smoking and family history are among the most consistently observed risk
factors for SAH (41).
1.2.3 Pathophysiology of SAH:
Saccular aneurysm cause 80-85% of SAH but other causes include trauma, arteriovenous
malformations, intracranial arterial dissections, bleeding diatheses and illicit drugs especially cocaine
and amphetamine.
With a rupture of an aneurysm there is a direct bleeding into the cerebrospinal fluid under arterial
pressure causing the blood to spread rapidly in the CSF and raising ICP. The bleeding can invade the
brain parenchyma. The bleeding usually lasts only a few seconds but re-bleeding is common.
The primary bleeding can result in secondary events which further contribute to brain injury.
Hydrocephalus caused by obstruction of CSF flow by blood or adhesions or decreased CSF
absorption at arachnoid granulations (42). Vasospasm, caused by spasmogenic substances from the
lysis of subarachnoid blood clots, can cause regional hypoperfusion and ischemia (43). Raised ICP is
caused by the hemorrhage, hydrocephalus, hyperemia and distal cerebral arteriolar vasodilation (44).
1.2.4 Treatment of SAH:
Describing the treatment of SAH in details is out the scope of this thesis. Treatment aims at preventing
re-bleeding by surgically clipping the aneurysm or with coiling with endovascular technique.
Furthermore treatment aims at minimizing and treating secondary events such as vasospasm, raised
ICP and hydrocephalus and treating complications and supportive treatment in the ICU (34).
1.2.5 Neuroprotective treatment:
17 b-estradiol (E2) and progesterone are potential therapeutic agents in SAH although clinical
evidence is lacking. E2 has been shown in animal models to attenuate vasospasm after SAH, promote
neuronal survival, inhibit neuronal apoptosis and decrease oxidative damage and inflammation. These
protective effects are mediated partly through E2 effects on endothelial nitric oxide by activating
endothelial nitric oxide synthase (eNOS), preventing increased inducible NOS (iNOS) and decreasing
endothelin-1 production (45,46).
Progesterone may reduce brain injury after SAH by inhibiting cell apoptosis and stabilizing the
blood brain barrier (BBB). Progesterone attenuates vasospasm after SAH by affecting endothelial
nitric oxide (47,48).
1.3 The piuitary gland:
The pituitary gland, or hypophysis, is an endocrine gland. Weighing only 600 mg. It lies in a bony
cavity called the sella turcica as shown in figure 2. It is a protrusion from the bottom of the
hypothalamus and is covered by dura. The pituitary is divided in three lobes, anterior (or
adenohypophysis), intermediate often considered part of the anterior pituitary and the posterior

22
pituitary (or neurohypophysis). Hormone release from the pituitary is controlled by the hypothalamus,
table 4 provides an overview of the different hypothalamic-pituitary (HP) hormone axis (49).
The blood supply to the pituitary is illustrated in figure 3. The long hypophyseal portal vessels that
lie in the infundibulum provide the anterior pituitary gland with 70-90% of its blood supply. They arise
from branches of the internal carotid artery and anterior Circle of Willis. The short hypophyseal portal
vessels that arise from the branches of the intracavernous internal carotid artery supply the anterior
pituitary gland with less than 30% of it blood supply, mostly the medial portion of the gland (50)
The posterior pituitary (or neurohypophysis) develops as an extension of the hypothalamus. Cell
bodies in the hypothalamus project axons down the pituitary stalk (or infundibulum) where they
secrete antidiuretic hormone (ADH) and oxytoxin.
The anterior pituitary (or adenohypophysis) is distinct from the posterior pituitary and does not have
the neuronal composition. Hypothalamic hormones are secreted to the anterior lobe through the
hypothalamic-hypohysial portal system. The anterior pituitary secretes cortico-, thyro-, gonado-,
somato- og lactotrophins and thus regulates several physiological processes. The intermediate lobe
secretes melanocyte stimulating hormone (49).
Table 6. Hypothalamic, pituitary hormones and target organs/cells.
Axis Hypothalamic hormone
Anterior pituitary hormone
Target cells/organs
Main effect
Corticotrophic (HP-adrenal)
Corticotropin RH (CRH)
Adrenocorticotropic hormone (ACTH)
Adrenal cortex Stimulates adrenal cortex secretion of corticosteroids,
Gonadotrophic (HP-gonadal)
Gonadotropin RH (GnRH)
Luteneizing hormone (LH) and Follicle stimulating hormone (FSH)
Ovaries and testes
FSH regulates oogenesis and spermatogenesis and LH causes ovulation and release of testosterone
Thyrotrophic (HP-thyroid)
Thyrotropin RH (TRH)
Thyroid stimulating hormone
Thyroid gland Stimulates secretion of thyroid hormones
Somatotrophic (HP-somatotrophic)
Growth hormone RH (GHRH) Growth hormone IH (somatostatin)
Growth hormone (somatotropin)
Bone, muscles, liver, adipose tissue and cells in general
Stimulation of growth and metabolism of carbohydrates and lipids, stimulates liver to produce IGF-1
Hypothalamic hormone either stimulates anterior pituitary with releasing hormone (RH) or inhibits the
anterior pituitary witt inhibiting hormone (IH). HP = Hypothalamic pituitary.

23
Figure 2. The pituitary gland and its anatomy (Source Organsofthebody, http://www.organsofthebody.com/pituitary-gland/)
Figure 3 The pituitary gland, anatomy, vasculature and connection to the hypothalamus (Source: Medscape, http://www.medscape.com/viewarticle/518323_3)

24
1.4 The endocrine response in critical illness:
Critical illness puts the patient to the ultimate severe physical stress. The immediate stress response
includes among other endocrine adaptation, presumably for providing the required energy for acute
survival postponing anabolism. Alterations within the different hypothalamic-pituitary axes cause
lipolysis, proteolysis and gluconeogenesis. This same response can then become maladaptive and
hamper recovery when the immediate threat is over and the patient suffers from prolonged critical
illness (51,52).
1.4.1 Diagnosing endocrine dysfunction in the critically ill patient:
Critically ill patients experience great physiological stress with effects on the inflammatory pathways,
tissue perfusion and resulting multi-organ dysfunction. These changes as well as treatment in the ICU
result in a dynamic endocrine response. Appropriate basal levels of hormones are different in the
critically ill due to changes in secretion, loss of negative feedback, altered target tissue receptor
function and impaired enzymatic clearance. Thus the critically ill patient differs fundamentally from the
usual endocrine outpatient and the evaluation of their endocrine systems. Commonly used endocrine
tests should be used with caution and dynamic tests are often unsuitable due to slow turnaround or
issues with safety (51).
1.4.2 Hypothalamic-pituitary adrenal axis in critical illness:
Cortisol plays a pivotal role in the stress response. Both high and low levels have been associated
with mortality (53). Cortisol shifts carbohydrate, fat and protein metabolism and delays anabolism and
thus likely contributes to the provision of extra energy to vital organs. Furthermore cortisol affects the
hemodynamic system by intravascular fluid retention and enhancing inotropic and vasopressor
responses to catecholamines and angiotensin II (52).
During critical illness there is a high cortisol level but plasma ACTH levels tend to be low. Cortisol
synthesis can be affected by critical illness per se via cytokines as well as treatment for example the
anesthetic agent etomidate and the fungicide ketoconazole (54,55). Cytokines furthermore cause
increased corticosteroid metabolism, decreased corticosteroid receptor and tissue resistance to
corticosteroids. Changes in free cortisol levels may be caused by changes in plasma concentration of
cortisol binding globulin, albumin and hepatic cortisol metabolism (56). Newer evidence suggests even
that high levels of cortisol during critical illness is caused by reduced cortisol plasma clearance rather
than increased production. That cortisol production is only moderately increased and only in patients
suffering from systemic inflammatory response syndrome (57).
Diagnosing corticosteroid insufficiency in critical illness has been the subject of much debate. In a
consensus statement from an international task force by the American College of Critical Care
Medicine critical illness-related corticosteroid insufficiency (CRCI) is said to be caused by adrenal
insufficiency together with tissue corticosteroid resistance and is characterized by an exaggerated and
protracted proinflammatory response. It should be suspected in hemodynamically instable patients
refractory to treatment. The diagnosis is best made by a random cortisol of < 276 nmol/L or an
increase <248 nmol/L with a Synacthen test (58).

25
1.4.3 Hypothalamic-pituitary thyroid axis in critical illness:
Critical illness affects the HP-thyroid axis by changes in metabolism. Thyroid hormone metabolism as
well as medication commonly used in the ICU settings affect thyroid hormone balance. As much as
70% of critically ill patients may have what is called the non-thyroidal illness syndrome or low T3
syndrome or euthyroid sick syndrome. The syndrome is characterized by low serum levels of
triiodothyronine (T3) and high levels of reverse T3, with normal or low levels of thyroxin (T4), free T4
(fT4) often in the normal range and normal or low levels of thyroid-stimulating hormone (TSH). These
changes probably result from changes in peripheral metabolism of thyroid hormones, TSH regulation
and binding of thyroid hormone to transport-protein and receptor binding and intracellular uptake (59).
Low T3 levels are partially related to fasting and that part of the response seems adaptive and
treatment is likely not indicated (52).
1.4.4 Hypothalamic-pituitary gonadal and lactotroph axis in critical illness:
Testosterone is the most important endogenous anabolic steroid and changes in the gonadal axis
could be important with regard to the catabolic state of critical illness in men. Testosterone levels
immediately decrease after acute insult e.g. surgery or myocardial infarction. Acute critical illness is
associated with mildly low testosterone levels, which become more severely reduced with chronic
critical illness. This may be because of direct inhibition on Leydig cells or effects of cytokines. A
plausible explanation, at least in the acute phase for decreased secretion of anabolic androgens, is
that the body is reducing energy consumption and conserving substrates for more vital functions and
thus it is an adaptive response. In the chronically critically ill patient this might though be maladaptive
(60,61).
Prolactin has a wide range of effect, stimulating lactation, suppressing gonadotropins and
presumed to have immune-enhancing properties. It is a known stress hormone. In the chronically ill
critical patient prolactin levels are lower than in the acute phase (61).
1.4.5 Hypothalamic-pituitary-somatotroph axis in critical illness:
Growth hormone (GH) has mitogenic and anabolic action via increased production of IGF-1 resulting
in nitrogen retention, protein anabolism and linear growth. GH does have in itself metabolic action,
causing lipolysis, enhanced amino acid transport into muscle and anti-insulin effects but those of IGF-
1 are more prominent. Initially with acute stress the mean concentration of GH is acutely increased
due to increase in interpulse GH levels but IGF-1 levels on the contrary are low indicating a GH
resistance. In prolonged critical illness the GH levels are only slightly elevated but there are decreased
pulsatile tops of GH concentration (62,63)
1.4.6 Therapeutic implications:
As described above there is a dynamic hormonal response during critical illness. Some probably
physiologically adaptive while other may be maladaptive. Manipulation may be in the form of
replacement with physiological doses of hormones or pharmacological with supraphysiological doses.

26
Further research is needed to establish the benefits and possible harm caused by endocrine
manipulation in critical illness (51).
1.5 Neuroendocrine disturbances following TBI and SAH:
Pituitary dysfunction following TBI was first reported in 1918 by Cyran in a patient with skull base
fracture (64). Hoff reported in 1961 three cases of hypopituitarism associated with intracranial
aneurysm (65). TBI and SAH can cause neuroendocrine changes both in the acute phase as well as
in the chronic phase of survivors.
1.5.1 Prevalence of hypopituitarism in the late phase following TBI and SAH:
Several studies on the prevalence of anterior pituitary dysfunction have been published the last
decade with Kelly et al being among the first to publish a systematic study on mTBI and sTBI patients
and reporting a total prevalence of 36,4% of anterior pituitary dysfunction (66). Later in a systematic
review of 19 studies with a total of 1050 subjects Schneider et al published a pooled prevalence of
anterior pituitary dysfunction, for all TBI, 27,5% (range 15-68%). The prevalence was highest for sTBI
35,3% and 10,9% and 16,8% for mTBI and mildTBI patients respectively. In the same systematic
review the prevalence of anterior pituitary dysfunction in SAH patients was 47% (range 37.5-55.9%)
based on 5 studies with a total of 122 patients (67).
1.5.2 Natural course of hypopituitarism following TBI and SAH:
Neuroendocrine changes in the acute phase have not been shown to predict hypopituitarism in the
chronic phase with endocrine abnormalities in the acute phase often resolving in some patients while
others developing hypopituitarism at later stages (68–70). Hypopituitarism has even been shown to
either resolve or develop between early chronic phase at 3 months and 6-12 months (71,72). Studies
show similar results for hypopituitarism following SAH where some patients experience a transient
anterior pituitary dysfunction resolving over time and other developing hormonal deficiencies with time
(73–75). Prevalence of long-term hypopituitarism following SAH varies though with Klose et al finding
no evidence of hypopituitarism following SAH in a cohort of 62 patients (76) while others have
reported a prevalence of 38-45% (73,77–79).
1.5.3 Predictive factors for hypopituitarism following TBI and SAH:
No good predictive factor has been identified for anterior pituitary dysfunction following TBI and SAH
making screening difficult.
Some studies show that sTBI with lower GCS increases risk for anterior pituitary dysfunction
(66,70,80,81). Other studies have not shown this increased risk with more severe TBI (69,73,82).
Klose et al found the risk to be increased in patients with high ICP, longer hospital stays and longer
intubation in a cross sectional study of 104 TBI patients (83). These results were not confirmed in a
prospective study by Klose et al (70). Ischemic insults that is hypotension or hypoxia have been
identified as predictive factors (66).

27
CT findings have been also studied as risk factors indicating that more severe injury is a risk factor
for developing anterior pituitary dysfunction (66,72) as well as basilar skull fracture (84,85).
Although no good predictive factor has been identified for anterior pituitary dysfunction following
TBI there is a very low probability of diagnosing hypopituitarism in patients with mild TBI, normal CT,
or normal intracranial pressure because of the negative predictive value of these factors (86).
Like for anterior pituitary dysfunction following SAH there is no good predictive factor known.
Severity judged clinically by Hunt and Hess or radiologic severity by Fisher CT score has not been
shown to be of value as predictive factor (73,77–79). One study has shown the occurrence of cerebral
vasospasm and hydrocephalus in the acute phase of SAH to be a risk factor (87).
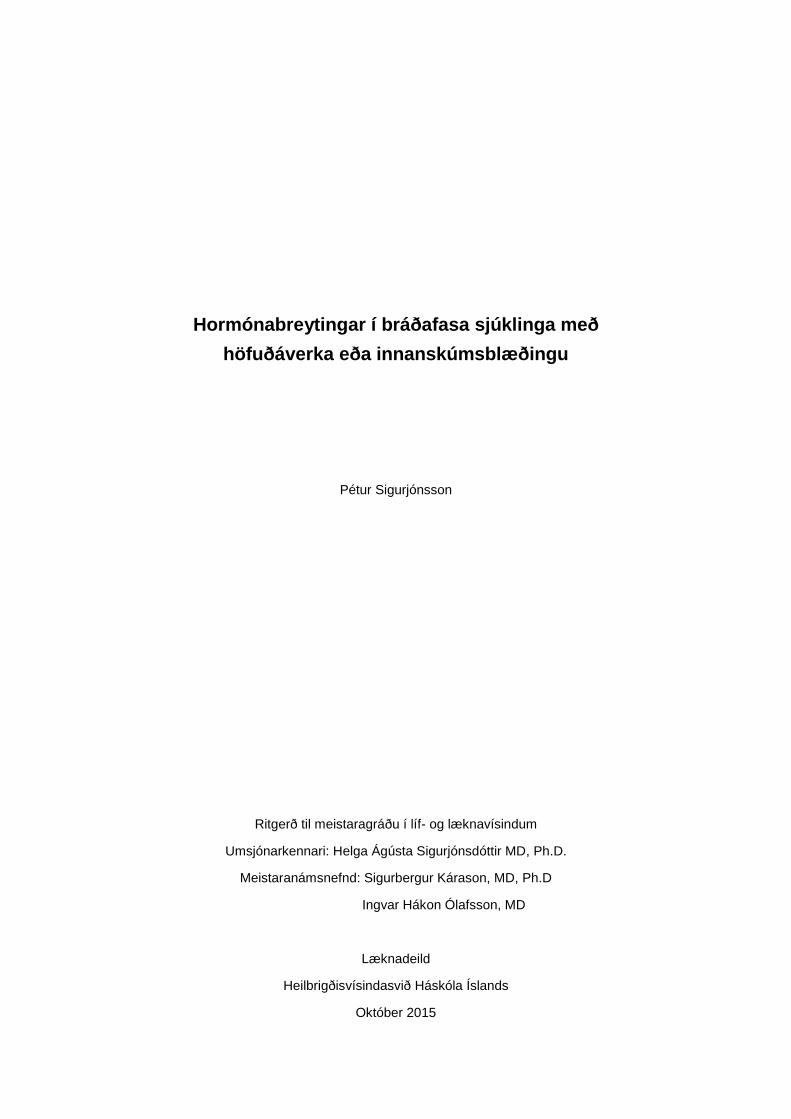
1.5.4 Neuroendocrine disturbances in the acute phase of TBI and SAH:
Several studies have assessed the neuroendocrine changes in the acute phase of TBI. Studies are
available although fewer on the same subject in the acute phase of SAH. The design, methodologies
and main results of these studies are summarized in tables 7 and 8.
As demonstrated in tables 7 and 8 previous studies show different results on the nature of
neuroendocrine changes in the acute phase of TBI and SAH. Also demonstrated is that previous
studies differ in patients selection, methodology and timing of assessment which can explain varying
results.
28
Table 7. Summary of studies evaluating neuroendocrine changes in the acute phase of TBI.
Neuroendocrine axis assessed % deficient unless stated otherwise
Study Type of patients
N Time of testing
ACTH GH Gonadal Thyroid PRL Tests and definition of deficiency
1) Cernak et al. 1999 (88)
mildTBI, sTBI (direct injury), TBI (blast trauma)
31 D0-D7 N/A N/A see comment
see comment
see comment Baseline hormone levels.
2) Agha et al. 2004 (89)
sTBI and mTBI
50 Median D12, (7-20)
16% 18% 79% (male) 90% (pre-menopausal female) 50% (post-menopausalfemale)
2% 14% Baseline hormone levels, glucagon stimulatation test for somatotrophic and corticotrophic axis
3) Dimopoulou et al. 2004 (90)
sTBI and mTBI
34 Median D18, (8-55)
24% 24% * see comment
24% 15% 59% Baseline hormone levels and stimulation test hCRH and GHRH for corticotrophin and somatotrophin. ACTH/cortisol deficiency if response <552 nmol/L. Complete GHdef if peak GH<3mcg/L, partial if 3-5mcg/L
4) Cohan et al. 2005 (91)
sTBI and mTBI
80 D0 - D9 53% N/A N/A N/A N/A Baseline hormone levels. ACTH/cortisol deficiency defined as two consecutive measurements of cortisol <414 nmol/L or one measurement of cortisol <138 nmol/L
5) Tanriverdi et al 2006 (69)
sTBI, mTBI and mildTBI
52 D0 9,8% 20,4% 41,6% Low T3 sx 51,9% TSH 5,8%
PRL 12% ACTH/cortisol deficiency defined as cortisol <193 nmol/L , GH deficiency if IGF-1 <84ng/mL
6) Klose et al. 2007 (70)
sTBI, mTBI and mildTBI
46 D0 – D12 median time not noted
4% N/A 67% 33% 39% Baseline hormone levels, Synacthen test, ACTH/cortisol deficiency defined as peak or 30 min cortisol < 500 nmol/l

29
Continuing table 7.
Neuroendocrine axis asessed % deficient unless stated otherwise
Study Type of patients
N Time of testing
ACTH GH Gonadal Thyroid PRL Tests and definition of deficiency
7) Kleindienst et al. 2009 (92)
sTBI, mTBI and mildTBI
57 D0, D3, 7 D0: 22% D3: 25% D7: 18%
D0: 41% D3: 40% D7: 27%
D0: 13% D3: 24% D7: 18%
D0: 17% D3: 24% D7: 8%
D0: 15% D3: 9% D7: 13%
Baseline hormone levels. ACTH/cortisol deficiency defined as baseline cortisol < 290nmol/L
8) Tandon et al 2009 (93)
sTBI 59 D0, D15 D0: Cortisol53% D15: Cortisol43%
Only measured GH D0: GH 17% D15: GH 26%
Only measured LH and FSH D0: LH 17%, FSH 8,5% D15: LH 7,4% FSH 13%
D0: T3 1,7% T4 5,1% TSH 1,7% TSH 15,3% D15: T4 1,9% T4 3,7% TSH 14,8%
D0: PRL 30,1% D15: PRL 37%
Baseline hormone levels. ACTH/cortisol deficiency defined as cortisol below reference range 138 -690 nmol/L
9) Chourdakis et al. 2011 (94)
sTBI 59 D0, D6, D12
N/A N/A N/A N/A N/A Baseline hormone levels, cortisol, thyroid and testosterone
10) Hannon et al. 2013 (95)
sTBI and mTBI
100 D1, D3, D5, D7, D10
78% N/A N/A N/A N/A ACTH/cortisol deficiency defined as baseline cortisol <300 nmol/L

30
Continuing table 7.
Neuroendocrine axis asessed % deficient unless stated otherwise
Study Type of patients
N Time of testing
ACTH GH Gonadal Thyroid PRL Tests and definition of deficiency
11) Olivecrona et al 2013 (96)
sTBI 45 D1, D4 D1 morning: 54,5% D1 evening: 52,3% D4 morning: 70,5% D4 evening: 59,1%
D1: IGF-1 30,2% D4: IGF-1 2,3%, IGF-1 7,0%
Male only D1: Test 82,1% LH 55,2% LH 6,9% FSH 10,3% FSH 6,9% D4: Test100% LH 58,6% LH 6,9% FSH 10,3% FSH 3,4%
D1: fT4 5,5% fT4 9,1% TSH 4,5% D4: fT4 27,3% TSH 15,9% TSH 9,1%
D1: PRL 48,3% (male) PRL66,7% female D4: PRL 72,4% (male) PRL 86,7% (female) Prl 3,4%
Baseline hormone levels. ACTH/cortisol deficiency defined as cortisol <276 nmol/L
sTBI = severe traumatic brain injury, mTBI = moderate traumatic brain injury, D = day, ACTH = adrenocorticotropic hormone, GH = growth hormone, IGF-1 = insulin like growth factor 1, PRL = prolactin, TSH = thyroid stimulating hormone, fT4 = free thyroxine 4, Low T3 sx = low t3 syndrome (euthyroid sickness), LH = luteneising hormone, FSH = follicule stimulating hormone, N/A = not applicable.

31
Comments on studies evaluating neuroendocrine changes in the acute phase of TBI presented in table 7:
1. Cernak et al investigated isolated head trauma from war, mild TBI with closed head injury, sTBI with cranial gunshot trauma and TBI from blast
injuries. Compared to healthy controls. In the mTBI group TSH was increased untill D3 and then normalized, TSH was decreased in the sTBI and
in the blast injury group initially decreased and then increased. T3 was increased in the mildTBI group but decreased in the other two groups. T4
was the same as the control group. In the mTBI group testosterone was decreased untill D2. Testosterone was profoundly decreased in the sTBI
group but not in the blast injury group. Cortisol was initially increased in all groups but was the decreased in the sTBI group (88).
2. Agha et al reported a negative correlation between GCS and prolactin and positive correlation between GCS and testosterone (89).
3. Dimopoulou et al reported that GCS on admission was positively correlated with baseline FSH, peak FSH, testosterone and TSH. 9% of the cohort
had partially impaired secretion of GH after stimulation, 15% had low IGF-1 but normal stimulation test (90).
4. Cohan et al. 81% of those diagnosed with adrenal insufficiency had received etomidate. Pat with ACTH/cortisol deficiency were younger, had
higher ISS, higher frequency of hypotension, hypoxia and anemia. High dose propofol and penthobarbital was associated with lower cortisol levels
(91).
5. Tanrivedi et al reported a positive correlation between testosterone and GCS, negative correlation between prolactin and GCS .Testosterone level
was significantly lower in sTBI group compared to other groups (69).
6. Klose et al reported that testosterone and LH was lower with increasing TBI severity and cortisol became higher with increasing TBI severity (70).
7. Kleindienst et al measured urinary excretion of free cortisol and cortisone in 13 patients of which 11had elevated levels and the authors conclude
that the normal circadian variation of cortisol is replaced by a more continuous secretion under severe stress. sTBI had more often low TSH and
reduced fT4 and low gonadotropins. Noteworthy is that mean initial GCS was 12 and improved to 14 (92).
8. Tandon et al studied 59 patients in the acute phase and later included 40 more patients and followed patients to day 90 and 180 post TBI. No
patient had low cortisol on follow up (93).
9. Chourdakis et al compared early enteral feeding vs delayed. Levels of TSH, fT3, fT4 and testosterone declined with time. The decrease of
hormonal values was less pronounced in the early enteral feeding group. Cortisol rose in the delayed enteral feeding group but a lesser hormonal
change was found in the early enteral feeding group (94).

32
10. Hannon et al showed that low cortisol was most often during D1 and D3. 62% of those with deficiency had recovered at day 10. Patients with
hypocortisolemia had longer ICU stay. Patients in the lowest quartile of mean cortisol and those with low cortisol on D10 had higher mortality (95).
11. Olivecrona et al reported that mean serum fT4 levels decreased but TSH increased from day 1 to day 4. Total testosterone day 1 correlated
negatively to GOS at 3 months. LH correlated negatively with Glasgow outcome scale at 3 months. There was a positive correlation between levels
of LH day 1 and ICPmax and positive correlation between FSH and Marshall CT score, negative correlation between day 4 TSH levels and
Marshall CT grade score. There was a negative correlation between prolactin on day 1 and CPPmin and ICPmax (96).

33
Table 8. Summary of studies evaluating neuroendocrine changes in the acute phase of SAH.
Neuroendocrine axis assessed % deficient unless stated otherwise
Study Type of patients
N Time of testing
ACTH GH Gonadal Thyroid PRL Tests and definition of deficiency
1) Bendel et al. 2008 (97)
SAH Hunt and Hess 1-5
30 D1, D7 D1: 7% D7: 14%
N/A N/A N/A N/A ACTH/cortisol deficiency defined as cortisol < 350 nmol/L and low serum ACTH
2) Tanriverdi et al 2007 (79)
SAH, Hunt and Hess 1-4
22 D0 22,7% 22,7% 31,8% 22,7% Low T3 sx
22,7% Baseline hormone levels. Somatotrop deficiency defined as IGF-1<84 ng/mL. ACTH/cortisol deficiency defined as cortisol <193 nmol/L
3) Klose et al 2009 (76)
SAH, Hunt and Hess 1-5
26 median D7, (2-13)
12% 15% 100% male 88% female
35% low T3 sx
31% Baseline hormone levels. ACTH/cortisol deficiency defined as baseline cortisol <276 nmol/L
4) Bendel et al 2010 (98)
SAH Hunt and Hess 1-5
D1-D7 N/A IGF-1 N/A N/A N/A Baseline hormone levels
5) Parenti et al 2011 (99)
SAH, Hunt and Hess
60 Within 72 hours from admission
7,1% 22,0% 33,3% 1,8% N/A Baseline hormone levels. ACTH/cortisol deficiency defined as cortisol < 172 nmol/L with normal/low ACTH. Somatotrop deficiency defined as IGF-1 < 84 ng/mL
6) Poll et al 2010 (100)
SAH Hunt and Hess 1-5
22 D0, D7 and median D17(14-21)
D0: 0% D7: 0% D17: 4,5%
N/A N/A N/A N/A ACTH/cortisol deficiency defined as baseline cortisol below refence range 171-536 nmol/L
7)Khursheed et al. 2013 (101)
SAH, WFNS grade 1-5
73 D0 N/A N/A 12% 0% 18% Baseline hormone levels

34
Continuing table 8.
Neuroendocrine axis assessed % deficient unless stated otherwise
Study Type of patients
N Time of testing
ACTH GH Gonadal Thyroid PRL Tests and definition of deficiency
8) Lanterna et al 2013 (102)
SAH, Hunt and Hess 1-3
26 D0-D15 42,3%
N/A N/A N/A N/A ACTH/cortisol deficiency defined as cortisol <276 nmol/L or a raise of <248 nmol/L after Synacthen test
9) Kronvall et al 2014 (103)
SAH, Hunt and Hess 1-4
51 D5-D10 8% 12% 30% 6% low fT4 with normal TSH
16% Baseline hormone levels. ACTH/cortisol deficiency defined as cortisol <250 nmol
D = day, ACTH = adrenocorticotropic hormone, GH = growth hormone, IGF-1 = insulin like growth factor 1, PRL = prolactin, TSH = thyroid stimulating hormone, fT4 = free thyroxine 4, Low T3 sx = low t3 syndrome (euthyroid sickness), LH = luteneising hormone, FSH = follicle stimulating hormone, N/A = not applicable.

35
Comments on studies evaluating neuroendocrine changes in the acute phase of SAH presented in table 8:
1. Bendel et al had 16 elective open clip surgery patients as controls in their study. They concluded that SAH causes an HPA axis response similar to that
of elective cranial aneurysm surgery. There was good correlation between serum free and total cortisol concentrations thus measurement of serum
free cortisol should not be necessary in SAH patients (97).
2. Tanriverdi et al reported a positive correlations between Fisher’s CT scale and cortisol levels and negative correlation between Fisher’s CT scale and
total testosterone levels (79).
3. Klose et al showed that hormonal alterations were associated with a lower GCS score and the development of hydrocephalus (76).
4. Bendel et al measured IGF-1 in the acute phase and did a follow up at three months. Than IGF-1 had normalized. Patients who scored less on quality
of life questionnaire (QoL) had lower IGF-1 in the acute phase (98).
5. Noteworthy to the study of Parenti el al is that the median GCS was 14 (13-15) and median Hunt and Hess 2 (1-3) so they investigated patients with
less severe SAH. No gonadotrop deficiency was reported in patients with perimesencphalic bleeding pattern which tend to have a more benign course
(99).
6. In the study of Poll et al cortisol was measured at 8:00, 12:00, 16:00 and 20:00. Clearly raised morning values and a consistent decline over the day or
a flat curve was considered a normal diurnal cycles, other were deemed abnormal. Normal profiles were associated with shorter length of ICU stay,
less complications and better outcome on GOS (100).
7. Khursheed et al even did a follow up 9-12 months post SAH. Prolactin levels and testosterone levels had mostly normalised but 2 patients had
developed secondary hypothyroidism. The author conclude that hypopituitarism in not an issue after SAH but they failed to evaluate both cortico- and
somatroph axis (101).
8. Lanterna el al reported that ACTH/cortisol deficiency was associated with poor outcome on Glascgow Outcome scale after 1 month. All patients
diagnosed with ACTH/cortisol deficiency had a normal Synacthen test (102).
9. Kronvall et al reported that the ruptured aneurysm was more commonly in the circle of Willis among patients with pituitary dysfunction. Patients with
pituitary dysfunction had worse Glasgow Outcome Scale (103).

36
1.5.5 Hypothalamic-pituitary adrenal axis in the acute phase of TBI and SAH:
Dysfunction of the HP-adrenal axis can as previously explained be a life-threatening situation with
hemodynamic instability and hyponatremia but can respond rapidly to treatment with glucocorticoids
and thus early diagnosis is of value (52,91). Serum cortisol has been found to increase immediately
after TBI and then gradually decline to normal levels (88,104).
As demonstrated in table 7 the incidence of ACTH/cortisol deficiency varies between 4-78%. This
variation can be explained by difference in methodology and definition of ACTH/cortisol deficiency.
Relying solely on Synacthen test in the acute phase can underestimate the incidence as the adrenal
glands will still respond to ACTH for up to 6 weeks after pituitary failure (105). Studies relying solely on
baseline cortisol levels have used different cut-off levels.
Contrasting results have been reported whether ACTH/cortisol deficiency in the acute phase of TBI
continues in to the chronic phase. Tanriverdi et al found an incidence of 9,8% in the acute phase
(within 24 hours of admission) in a mixed TBI cohort. At 12 months the prevalence of ACTH/cortisol
deficiency was 19,2% with only patient being deficient having new deficiency at 12 months (69). Klose
et al reported similar results with all patients diagnosed with ACTH/cortisol deficiency in the acute
phase recovering but others developing deficiency (70). Agha et al on the contrary showed in a cohort
of 50 TBI patients that in the acute phase 8 patients had ACTH/cortisol deficiency, 4 patients had
persistent deficiency at 6 months with 5 patients having developed deficiency and all patients with
deficiency at 6 months had persistent deficiency at 12 months (68).
As demonstrated in table 8 the incidence of ACTH/cortisol deficiency in the acute phase of SAH
varies between 0-42,3% and as stated above there are conflicting results on persistency of deficiency.
1.5.6 Hypothalamic-pituitary gonadal and lactotroph axis in the acute phase of TBI and SAH:
As demonstrated in table 7 and 8 suppression of the HP-gonadal axis is common in the acute phase
of both TBI and SAH patients. Suppression of the HP-gonadal axis has even been reported in non-
traumatic illness (106,107) and as previously discussed may be an adaptive response which though
could be maladaptive in the chronically critically ill patient (60,61) and even as reported that low
testosterone in male TBI patients when starting rehabilitation correlated with poorer rehabilitation (108)
1.5.7 Hypothalamic-pituitary thyroid axis in the acute phase of TBI and SAH:
As demonstrated in table 7 and 8 the incidence of thyroid deficiency is either reported as secondary
thyroid deficiency or low T3 syndrome and the incidence varies for TBI 1,7-51,9% and SAH 0-22,7%.
Furthermore the diagnosis of secondary in the acute settings is difficult as the pattern of thyroid
function tests are similar as those observed in low T3 syndrome. As the value of thyroid hormone
replacement is not proven the diagnosis of thyroid dysfunction may not be crucial in the early phase of
TBI or SAH (105).

37
1.5.8 Hypothalamic-pituitary somatotroph axis in the acute phase of TBI and SAH:
As demonstrated in tables 7 and 8 the incidence of somatotroph deficiency in the acute phase of TBI
is 18-41% and for SAH 12-22.7%. Only one of these studies that is Agha et al used a stimulation test
and found an incidence of 18% (89). The clinical relevance of HP-somatoroph disturbance is unclear.
Growth hormone replacement has been shown to improve mortality in burn patients (109) and even to
increase mortality in surgery patients (110). As discussed previously IGF-1 has shown positive effects,
in a TBI rat model, on cognitive and motor outcomes (27).
1.5.9 Pathophysiology of neuroendocrine disturbances in the TBI settings:
The pathophysiology of neuroendocrine dysfunction in the acute and chronic phase of TBI and SAH is
not well understood. There are several mechanism following TBI and SAH that can cause injury to the
hypothalamic-pituitary area including both primary and secondary injury. Skull fracture, mechanical
damage through axonal shearing, hemorrhage with following oedema and increased ICP are all
possible explanations as well as ischemic insults, hypoxia and hypotension, and vasospasm (66,111)
The anatomical position of the pituitary gland in the sella turcica make it vulnerable to mechanical
trauma. Rotational and shearing injuries of the brainstem and fractures of the skull base and sella
turcica may directly damage the pituitary, infundibulum or hypothalamus. This particularly affects the
long hypophyseal vessels that lie in the infundibulum and provide the anterior pituitary gland with 70-
90% of its blood supply (112). Autopsy series following TBI have shown injury to the hypothalamus,
pituitary gland or infundibulum in 26-86% who died acutely following TBI and necrosis in the anterior
pituitary was common (105,111,113–115). The fact that the somatotrophic and gonadotrophic axis are
the most commonly affected in the chronic phase of TBI (66,69–73,80) supports the idea that
hypopituitarism following TBI is partly vascular in origin as somatotroph cells are primarily located in
the lateral wings of the anterior pituitary and the gonadotroph cells are scattered throughout the pars
distalis and pars tuberalis of the anterior pituitary, areas vascularized by the long hypophyseal vessels
that are susceptible to trauma. The thyrotroph and corticotroph cells are found in areas that are
supplied by the less susceptible short hypophyseal vessels (112).
Neuroinflammation and the immune system might also play a role in hypopituitarism following TBI.
Tanriverdi et al showed that TBI patients with antipituitary antibodies were more likely to suffer from
hypopituitarism (116) and the same author has reported that APO-E3/E3 genotype decreases the risk
of pituitary insufficiency. APO-E is an apolipoprotein within the central nervous system and it is up-
regulated after injury. The authors speculate that individual variation in APO-E related mechanism
may influence the pathogenesis of hypopituitarism following TBI (117).
1.5.10 Pathophysiology of neuroendocrine disturbances in the SAH settings:
There is a case report of hemorrhages in the pituitary following SAH (118). Furthermore in a autopsy
study on the hypothalmus in SAH patients there was evidence of ishcemia and micro and macro
hemorrhages in 68% of cases. It has been suggested that direct damage to the perforating
hypothalamic arteries, which run from the subarachnoid space to the hypothalmus, may occur through

38
vasoconstriction causing ischemia and the forced transit of blood from the SAH through the perforating
arteries with rupture of blood into the cerebral parenchyma (105,119).
There is also evidence that SAH affects the pituitary not just via physical damage from
extravasated blood. The bleeding triggers a proinflammatory cascade which leads to complications of
SAH. Cytokines, vasoactive factors and neuropeptides lead to a dissociation between ACTH and
cortisol through altered sensitivity to ACTH (105,120).

39
2 Aims:
We conducted a prospective study with the aim to assess and describe the neuroendocrine changes
in the acute phase of severe and moderate TBI and SAH. Furthermore to assess any association
between the neuroendocrine changes and clinical and labarotory, S100b, variables indicating severity
of insult. Conditions in Iceland are particularly favourable for studying prevelance on a national level.
The population is small, numbering only 318.000 at the time of the study (Statistic Iceland,
www.statice.is) inhabitants and all severe (Glasgow coma score (GCS) <9) TBI and all SAH as well as
most moderate (GCS 9-12) TBI are transferred and treated at one hospital, LUH housing the only
Neurosurgery Department in the country.
We aimed to investigate:
The prevalence and nature of neuroendocrine disturbances during the acute phase mTBI and
sTBI.
The prevalence and nature of neuroendocrine disturbances during the acute phase SAH.
Associations between neuroendocrine changes, during the acute phase of, mTBI and sTBI,
and SAH, and clinical and labarotory variables.

40

41
3 Material and methods:
3.1 Subjects:
During the period March 2009 – March 2010 patients admitted to Landspitali – National University
Hospital of Iceland (LUH) with TBI or SAH were considered for inclusion in the study. Inclusion criteria
for TBI patients was age 18-70 years and moderate or severe TBI, judged by post resuscitation
Glasgow coma score, <9 or 9-12 respectively. All patients with SAH were considered for inclusion with
no age criteria or GCS score. LUH houses the only neurosurgery department in Iceland covering a
region of approximetely 318.000 inhabitants at the time of the study (Statistic Iceland, www.statice.is)
During the 12 months period, 21 TBI patients were prospectively included on admission or shortly
after, 6 moderate TBI and 15 severe TBI, 17 males and 4 females, median age 34 (47), mean age
34±13 years. TBI was caused by traffic accidents (car, bicycle and pedestrian) in 7 of the 21 patient,
fall in 6 of the 21 patient, assault in 4 of the 21 patient and construction working accidents in 4 of the
21 patient. Four TBI patients were lost to follow up on day 6; 1 patient with sTBI died, 1 mTBI patient
and two sTBI patients did not attend to follow up. One TBI patient missed testing at day 6 but was
tested on day 9 post trauma. Those results are presented with day 6.
Nineteen patients with SAH were included, 12 males and 7 females, median age 56 (55), mean
age 54±14 years (range 30-85 years). Fourteen SAH patients were included on admission but 5 at
later stages because of patient delay as they did not seek medical help until days after the beginning
of symptoms. Three patients with SAH were lost to follow up on day 6, all three had died during the
first days. Three SAH patients were tested on day 8,10 and 14 respectively as they missed being
tested on day 6. Those results are presented as results on day 6.
3.2 Ethics:
The study was conducted according to the guidelines of the Declaration of Helsinki and approved by
the Ethics Committee of LUH. All participants or their closest of kin gave their written consent after
receiving oral and written information about the study.
3.3 Anterior pituitary assessment:
Anterior pituitary function was assessed on admission, or as soon as informed consent had been
acquired, by analyzing serum levels of cortisol, growth hormone (GH), insulin like growth factor1 (IGF-
1), thyroid stimulating hormone (TSH), free thyroxine 4 (fT4), prolactin (PRL), luteinizing hormone
(LH), follicle stimulating hormone (FSH), total testosterone (in men) and oestradiol and progesterone
(in women) as well as plasma levels of adrenocorticotropic hormone (p-ACTH). On the 6th day after
the insult anterior pituitary function was assessed again by repeating the above mentioned hormone
levels measured in the morning as close to 8 am as possible and additionally a Synacthen test was
performed.
Synacthen test was performed by measuring serum levels of cortisol and p-ACTH at baseline
followed by injection of tetracosactrin (Synachten) 250 mcg iv measuring cortisol 30 and 60 min after
the injection.
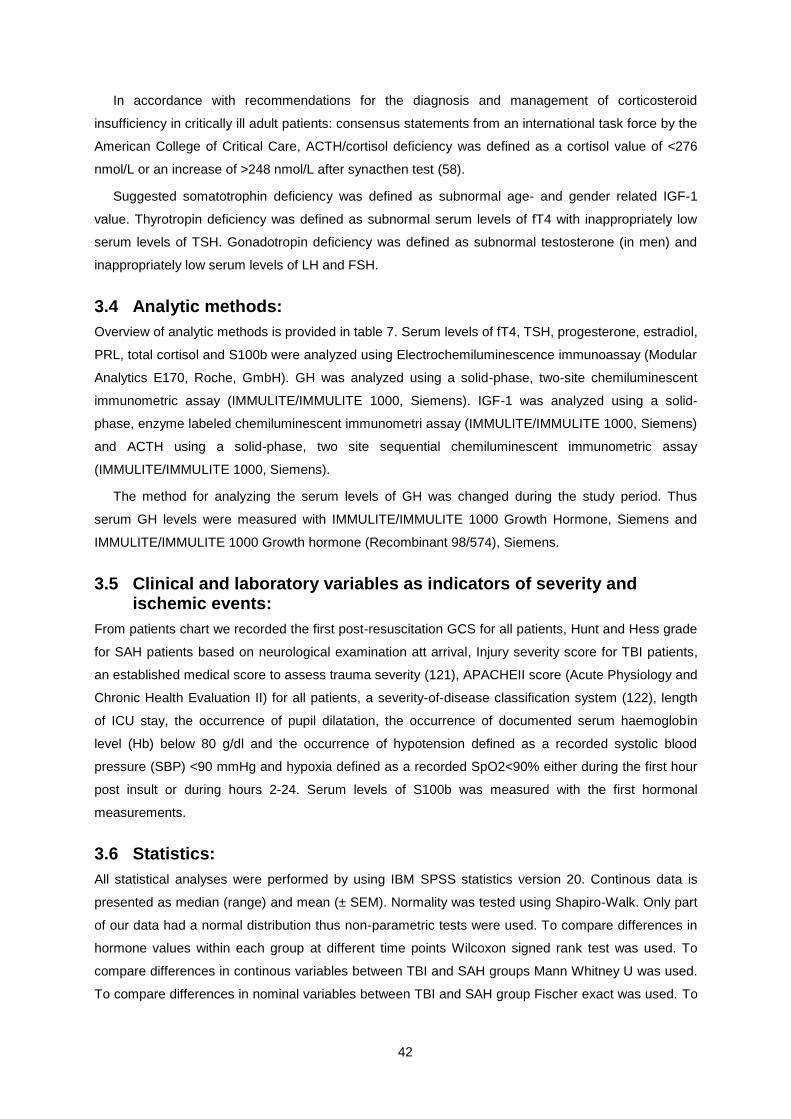
42
In accordance with recommendations for the diagnosis and management of corticosteroid
insufficiency in critically ill adult patients: consensus statements from an international task force by the
American College of Critical Care, ACTH/cortisol deficiency was defined as a cortisol value of <276
nmol/L or an increase of >248 nmol/L after synacthen test (58).
Suggested somatotrophin deficiency was defined as subnormal age- and gender related IGF-1
value. Thyrotropin deficiency was defined as subnormal serum levels of fT4 with inappropriately low
serum levels of TSH. Gonadotropin deficiency was defined as subnormal testosterone (in men) and
inappropriately low serum levels of LH and FSH.
3.4 Analytic methods:
Overview of analytic methods is provided in table 7. Serum levels of fT4, TSH, progesterone, estradiol,
PRL, total cortisol and S100b were analyzed using Electrochemiluminescence immunoassay (Modular
Analytics E170, Roche, GmbH). GH was analyzed using a solid-phase, two-site chemiluminescent
immunometric assay (IMMULITE/IMMULITE 1000, Siemens). IGF-1 was analyzed using a solid-
phase, enzyme labeled chemiluminescent immunometri assay (IMMULITE/IMMULITE 1000, Siemens)
and ACTH using a solid-phase, two site sequential chemiluminescent immunometric assay
(IMMULITE/IMMULITE 1000, Siemens).
The method for analyzing the serum levels of GH was changed during the study period. Thus
serum GH levels were measured with IMMULITE/IMMULITE 1000 Growth Hormone, Siemens and
IMMULITE/IMMULITE 1000 Growth hormone (Recombinant 98/574), Siemens.
3.5 Clinical and laboratory variables as indicators of severity and ischemic events:
From patients chart we recorded the first post-resuscitation GCS for all patients, Hunt and Hess grade
for SAH patients based on neurological examination att arrival, Injury severity score for TBI patients,
an established medical score to assess trauma severity (121), APACHEII score (Acute Physiology and
Chronic Health Evaluation II) for all patients, a severity-of-disease classification system (122), length
of ICU stay, the occurrence of pupil dilatation, the occurrence of documented serum haemoglobin
level (Hb) below 80 g/dl and the occurrence of hypotension defined as a recorded systolic blood
pressure (SBP) <90 mmHg and hypoxia defined as a recorded SpO2<90% either during the first hour
post insult or during hours 2-24. Serum levels of S100b was measured with the first hormonal
measurements.
3.6 Statistics:
All statistical analyses were performed by using IBM SPSS statistics version 20. Continous data is
presented as median (range) and mean (± SEM). Normality was tested using Shapiro-Walk. Only part
of our data had a normal distribution thus non-parametric tests were used. To compare differences in
hormone values within each group at different time points Wilcoxon signed rank test was used. To
compare differences in continous variables between TBI and SAH groups Mann Whitney U was used.
To compare differences in nominal variables between TBI and SAH group Fischer exact was used. To

43
compare difference in TBI and SAH that is number of individuals with low, normal and high hormones,
categorical variable with three categories, Kruskal Wallis H was used. Correlation analyses were done
using Spearmans rho for categorical and continous variables. Statistical significance was accepted at
p < 0.05.
44
Table 9. Analytic methods
Laboratory intra assay variability (CV%)
Specimen
Analyte Assay name Manufacturer Instrument Low control
Median control
High control
Reportable range Reference range Type Storage
TSH TSH Roche Elecsys 4.0 3.4 3.5 0.005-100.00 mIU/L
0.3-4.2 mIU/L Serum +2-8 °C
Free T4 fT4 Roche Elecsys 4.4 3.9 5.8 0.3-100 pmol/L 12-22 pmol/L Serum +2-8 °C
Cortisol Cortisol Roche Elecsys 7.0 3.5 3.3 0.5-1750 nmol/L 170-700 nmol/L Serum +2-8 °C
Progesterone Progesterone II Roche Modular E170
8.7 - 4.5 0.095-191 nmol/L male 0.7-4.3 nmol/L; female 0.6- 4.7 nmol/L (follicular phase), 5.3- 86 nmol/L (luteal phase), 0.3-2.5 nmol/L(post-menopausal)
Serum +2-8 °C
Estradiol Estradiol II Roche Modular E170
6.5 - 5.5 18.4-15781 pmol/L
male 28-156 pmol/L; female 46- 607 pmol/L (follicular phase), 161- 774 pmol/L (luteal phase), <18.4- 201 pmol/L(post-menopausal)
Serum +2-8 °C
Prolactin Prolactin II Roche Modular E170
3.1 - 2.5 1-10000 μIU/L male 4.5-21 μg/L ; female 5-30 μg/L
Serum +2-8° C
Testosterone Testosterone Roche Modular E170
6.4 - 4.6 0.069-52 nmol/L male 9.9-27.8 nmol/L ; female 0.22-29 nmol/L
Serum +2-8 °C

45
Cont. Table 7. Analytic methods
Laboratory intra assay variability (CV%)
Specimen
Analyte Assay name Manufacturer Instrument Low control
Median control
High control
Reportable range Reference range Type Storage
FSH FSH Roche Modular E170
2.8 - 2.5 0.1-200 mIU/L male 1.5-12 U/L; female 3.5-12.5 U/L (follicular phase), 2-8 U/L (luteal phase), 26-135 U/L(post- menopausal)
Serum +2-8 °C
LH LH Roche Modular E170
2.4 - 2.0 0.1-200 mIU/L male 1.7-9 U/L; female 2.4-12.6 U/L (follicular phase), 1-11 U/L (luteal phase), 7.7-58.5 U/L(post- menopausal)
Serum +2-8 °C
S100b S100b Roche Modular E170
0.26 - 3.33 0.005-39 g/L <0.105 g/L Serum +2-8°C
IGF-1 IGF-1 Siemens Immulite 1000
9.4 - 7.0 Up to 1600 ng/L Manufacturer´s age dependent reference range *
Serum -20 °C
ACTH ACTH Siemens Immulite 1000
9.9 - 7.0 Up to 1250 pg/ml < 46 ng/L EDTA-Plasma
-20 °C
GH Growth hormone (hGH)
Siemens Immulite 1000
3.4 4.2 3.0 Up to 96 mIU/L 0.1-11.5 mIU/L Serum -20 °C
GH Growth hormone (hGH)(Recombinant 98/574)
Siemens Immulite 1000
5.1 4.4 4.9 0.05-40 μg/L male < 3.0 μg/L ; female < 8 μg/L
Serum -20 °C
CV = Coefficient of variability, contr. = control, TSH = thyroid stimulating hormone, FT4 = free thyroxine, FSH = follicle stimulating hormone, LH = luteinizing hormone, IGF-1 = Insulin-like growth factor 1, ACTH = Adrenocorticotropic hormone, GH = growth hormone.*) Immulite product booklet, IGF-1, Immulite 1000 IGF-1 (PILKGF-10, 2006-12-29).

46

47
4 Results:
During the 12 months period 21 TBI patients were prospectively included in the study, 6 moderate TBI
and 15 severe TBI, 17 males and 4 females, mean age 34±13 years (range 18-65 years). TBI was
caused by traffic accidents (car, bicycle and pedestrian) in 7 of 21 patients, fall in 6 patients, assault in
4 patients and construction working accident in 4 of the patients. Mean GCS for TBI patients was
6.7±3.5 (range 3-12), mean Injury severity score was 24.3±16.8 (range 0-57), mean APACHEII score
was 13.2±7.4 (range 0-26), mean length of ICU stay 5.3±6.3 (range 0-26) and 9 of the 21 patients
were intoxicated by alcohol at the time of trauma. Demographics and the above clinical variables are
demonstrated in table 8.
Twenty-one TBI patient were included on admission or shortly after admission. Four TBI patients
were lost to follow up on day 6, one of these four patients a patient with severe TBI died, the
remaining three lost to follow, one with moderate TBI and two with severe TBI, judged by GCS, were
discharged from the hospital before day 6 and did not attend to the offered follow up. One TBI patient
missed testing at day 6 but was tested on day 9 post trauma. Those results are presented with day 6.
Nineteen patients with SAH were included, 12 males and 7 females, mean age 54±14 years (range
30-85 years). Mean GCS for SAH patients was 11.1±5.2 (range 3-15), mean Hunt and Hess score
was 3.0±1.3 (range 1-5), mean APACHEII 13.1±10.2 (range 0-35), mean length of ICU stay 5.0±10.2
(range 0-17). Fourteen SAH patients were included on admission and 5 SAH patients were included at
later stages because of patient delay as these patients did not seek medical help until days after the
beginning of symptoms. Three patients with SAH died before day 6 and were thus lost to follow up.
Three SAH patients were tested on day 8, 10 and 14 respectively as they missed being tested on day
6. Those results are presented as results for day 6.
Mean and median hormone values on admission and day 6 for the TBI and SAH group are
presented in tables 8 and 9 respectively. Proportion of both TBI and SAH patients on admission and
day 6 with low, normal or high hormone values are presented in figure 4 and 5.
Overview of TBI or SAH patients with documented the occurrence of pupil dilatation or documented
ischemic event that is the occurrence of documented serum haemoglobin level (Hb) below 80 g/dl, the
occurrence of hypotension defined as a recorded systolic blood pressure (SBP) <90 mmHg or hypoxia
defined as a recorded SpO2<90% during the first hour post insult or hours 2-24 post insult is
demonstrated in table 8.

48
Table 10. Demographics and mutual clinical variables for TBI and SAH groups
TBI SAH p-value
Age 34 (47)
34.43 ±2.75
56 (55)
54.16 ±3.23
p=0.000*
Gender 4 female; 17 male 7 female, 12 male p=0.293
GCS 7 (9)
6.71 ±0.75
14 (12)
11.11 ±1.19
p=0.003*
APACHEII 14 (26)
13.24 ±1.61
11 (35)
13.11 ±2.41
p=0.646
Length of ICU stay 3 (26)
5.33 ±1.38
5 (17)
5.00 ±1.04
p=0.707
S100b 0.33 (6.58)
0.83 ±0.33
0.13 (0.23)
0.12 ±0.16
p=0.004*
Dilatation of pupil 19.0% (4/21) 15.8% (4/19) p=1.0
Systolic BP <90 mmHg, 1st hour
19.0 % (4/21) 5.3% (1/19) p=0.349
Systolic BP<90 mmHg, hours 2-24
47.7% (10/21) 42.1% (8/19) p=1.0
SpO2 < 90%, 1st hour
4.8% (1/21) 5.3% (1/19) p=1.0
SpO2 < 90%, hours 2-24
9.5% (2/21) 15.8% (3/19) p=0.640
Hemoglobin <80g/dL 9.5% (2/21) 0% (0/19) p=0.490
TBI = traumatic brain injury, SAH = subarachnod hemorrhage, GCS = Glasgow coma scale,
APACHEII = Acute Physiology and Chronic Health Evaluation II, ns = non-significant. Data is
presented as median (range) and meanSEM.

49
Table 11. Mean and median hormone values on admission and day 6, TBI group
Reference range Day 0 N Day 6 N p-value
TSH 0.3-4.2 mIU/L
1.77±0.34
1.11 (5.85)
21 2.20 ±0.32
2.30 (4.77)
17 p=0.149
fT4 12-22 pmol/L
15.36±0.70 15.75 (13.00)
21 14.49±0.60
14.7 (11.50)
17 p=0.776
LH
(male)
male 1,7-9 U/L
5.28±1.41
4.05 (23.70)
16 2.96±0.65
2.1 (7.00)
13 p=0.289
FSH
(male)
male 1,5-12 U/L 4.66±0.82 3.50 (11.30)
17 2.04±0.61
1.70 (8.60)
13 p=0.003 *
Testosterone (male)
9.9-27.8 nmol/L 10.85±2.09
7.95 (26.19)
16 6.01±2.35
2.20 (30.30)
13 p=0.055
ACTH < 46 ng/L
72.85±22.06
23.0(369.0)
20 43.50±10.88 29.0 (148.0)
16 p=0.730
Cortisol 170-700 nmol
CIRCI<276nmol
633.76±75.74
723.0(1086.0)
21 650.80±71.9 585.0 (1086.0)
17 p=0.733
Prolactin male 4.5-21 ug/L ; female 5-30 ug/L
24.78±4.19
18.80 (78.0)
21 15.98±1.58
16.40 (23.60)
17 p=0.237
IGF-1 * age related 117.62±13.45 98.0 (258.0)
21 192.35±20.23
168.0 (302.0)
17 p=0.000*
Comparison done with Wilcoxon signed rank test thus values are paired and excluded if missing
value. Data is presented as meanSEM and median (range. TSH = thyroid stimulating hormone, fT4
= free thyroxine, LH = luteinizing hormone, FSH = follicle stimulating hormone, ACTH =
adrenocorticotroph hormone, IGF-1 = Insulin growth factor 1, ns = non significant
* IGF-1 age-dependent reference range (μg/l); 18 years(y) : 163-584, 19y: 141-483, 20y: 127-424, 21-
25y: 116- 358, 26-30y: 117-329, 31-35y: 115-307, 36-40y: 109-284, 41-45y: 101-267, 46-50y: 94-252,
51-55y: 87-238, 56- 60y: 81-225, 61-65y: 75-212, 66-70y: 69-200.

50
Table 12 Mean and median hormone values on admission and day 6, SAH group
Reference range
Day 0 N Day 6 N p-value
TSH
0.3-4.2 mIU/L 1.51 ±0.38
1.07 (5.57)
14 2.12±0.44
1.63 (5.61)
16 p=0.091
fT4
12-22 pmol/L 17.96±0.59
17.45 (8.00)
14 15.31±0.58
15.65(7.80)
16 p=0.041*
LH
male 1,7-9 U/L 4.88 ±0.91
5.10 (8.90)
9 4.19±0.85
3.95 (8.70)
10 p=0.735
FSH
male 1,5-12 U/L 6.52 ±1.38
6.2 (13.40)
9 4.67 ±1.24
3.50 (12.30)
10 p=0.034*
Testosterone (male)
9.9-27.8 nmol/L 9.64 ±2.70
6.80 (25.90)
9 3.70 ±1.20
2.30 (12.06)
10 p=0.128
ACTH
< 46 ng/L 173.5±86.5
48.0(1039.0)
14 29.67±5.88
27.0(55.0)
14 p=0.463
Cortisol
170-700 nmol
CIRCI<276nmol
1428.8±357.0
1056.0(5104.0)
14 623.5±66.09
661.0(690.0)
16 p=0.128
Prolactin male 4.5-21
ug/L ; female 5-30 ug/L
20.00 ±3.00
23.05 (31.30)
14 11.58 ±2.18
9.00 (36.5)
16 p=0.091
IGF-1 *age related 91.00±6.76
98.0 (99.0)
14 119.63±12.32
96.5(162.0)
16 p=0.333
Comparison done with Wilcoxon signed rank test thus values are paired and excluded if missing
value. Data is presented as mean±SEM and median (range). TSH =thyroid stimulating hormone, fT4 =
free thyroxine 4, LH = luteinizing hormone, FSH = follicle stimulating hormone, ACTH =
adrenocorticotroph hormone, IGF-1 = Insulin growth factor 1, ns = non significant
* IGF-1 age-dependent reference range (μg/L); 18 years(y) : 163-584, 19y: 141-483, 20y: 127-424, 21-
25y: 116- 358, 26-30y: 117-329, 31-35y: 115-307, 36-40y: 109-284, 41-45y: 101-267, 46-50y: 94-252,
51-55y: 87-238, 56- 60y: 81-225, 61-65y: 75-212, 66-70y: 69-200.

51
Figure 4 Proportion of both TBI and SAH patients on admission with low, normal or high hormone
values TSH =thyroid stimulating hormone, fT4 = free thyroxine 4, LH = luteinizing hormone, FSH =
follicle stimulating hormone, ACTH = adrenocorticotroph hormone, IGF-1 = Insulin like growth factor 1
Figure 5 Proportion of both TBI and SAH patients on day 6 with low, normal or high hormone values
TSH =thyroid stimulating hormone, fT4 = free thyroxine 4, LH = luteinizing hormone, FSH = follicle
stimulating hormone, ACTH = adrenocorticotroph hormone, IGF-1 = Insulin like growth factor 1

52
4.1 Hypothalmic-pituitary adrenal axis:
On admission TBI patients had significantly lower cortisol levels compared to SAH patients, 633.8
nmol/L±75.74 vs. 1332.6 nmol/L ±344.2, U =76, Z -2.392, p = 0.016. The mean ACTH in the TBI group
was lower although not significant. There was no significant difference on day 6.
One SAH patient had received corticosteroids before blood samples were drawn on admission.
Two TBI patients and 7 SAH patients received treatment with corticosteroids the first 6 days. These
patients are excluded in calculations although mentioned below.
On admission 5 of 21 (23.8%) TBI patients had cortisol levels below the proposed limit for critical
illness related corticosteroid insufficiency (CIRCI) [20] of cortisol<276 nmol/L and concomitant low
ACTH levels, one patient had plasma ACTH 11 ng/L and the other four levels below detectable value (
<10 ng/L). On day 6, 1 of 15 (6,67%) TBI patient had cortisol levels below cut-off at 276 nmol/L, the
patient had cortisol of 155 nmol/L and ACTH <10 ng/L. That patient had a normal response on the
synacthen test. Two patients had received treatment with corticosteroids. One of them had received
treatment with dexamethasone and had cortisol levels of 10 nmol/L and concomitant low levels of
ACTH <10 ng/L. That patient failed the synacthen test with a maximal response of 356 nmol/L. He was
treated with corticosteroids and retested on day 19 and then had a normal Synacthen test. The other
patient treated with cortisone had normal levels of cortisol and a normal response on the Synacthen
test. Two TBI with high cortisol levels were not tested with a Synacthen test on day 6. All other TBI
patients underwent a Synacthen test and showed a normal response.
Only 1 of 14 (7,1%) SAH patient had low cortisol levels on the first blood sample and that patient
had already received corticosteroids complicating interpretation thus no patient had low cortisol when
excluding those who had received corticosteroid treatment. On day 6, 1 of 11 (9,1%) had cortisol
levels below cut-off at 276 nmol/L, the patient had cortisol of 270 nmol/L and ACTH 48 ng/L and
showed a normal response on synacthen test.
As shown in figures 4 and 5 there was no significant difference in the proportion of patients with
low, normal or high cortisol in the TBI vs. the SAH group. There was no significant difference either
when proportions of patients with low or not low was compared between TBI and SAH groups.
In the TBI group there was a positive correlation between cortisol on day 0 and LH on day 0, rho
= 0.725, p = 0.001 and a positive correlation between ACTH on day 0 and LH on day 0, rho = 0.578, p
= 0.019. Correlation between FSH and cortisol was not significant (rho = 0.419, p= 0.094) and neither
between ACTH and FSH (rho = 0.470, p = 0.057). No such correlation was found in the SAH group.
4.2 Hypothalmic-pituitary gonadal axis:
4.2.1 Hypothalamic-pituitary gonadal axis in males:
Testosterone was the most commonly affected hormone in both TBI and SAH patients with median
levels lower than normal values in both groups on admission and day 6 as shown in tables 9 and 10.
Furthermore there was a significant decrease in FSH levels in both groups between admission and
day 6 and a trend to lower LH levels. FSH was significantly lower in the TBI group compared to the

53
SAH group on day 6, 2.04 U/L ±0.61 vs. 4.67 U/L ±1.24, U = 28.5, Z = -2.266, p = 0.021. Furthermore
there was a significant difference in the proportion of patients with abnormal LH and FSH that is
values outside the reference range, on day 6 between the two groups see figure 5.
On admission 9 of 17 (52.9%) male TBI patients had low testosterone levels below lower reference
value. Of these patients two had concomitant levels of LH and FSH below lower reference value and
two had low LH and FSH low but within normal range. On day 6, 11 of 13 (84.6%) male TBI patients
had low testosterone levels. Of the patients with low testosterone levels 4 (30.8%) had concomitant
low levels of both LH and FSH, 2 had low LH and FSH low but within normal range, 2 with low FSH
and LH low but within normal range.
On admission 4 of 7 (57.1%) male SAH patients had low testosterone levels but all had normal or
high levels of LH and FSH. On day 6, 9 of 10 (90.0%) male SAH patients had low testosterone levels
of which two had concomitant inappropriately low levels of LH and FSH (20%).
4.2.2 Hypothalamic-pituitary gonadal axis in females:
Gonadal hormone levels for females are not presented due to uncertainty of where in the menstrual
cycle the women were or whether they were pre- or postmenopausal as this made any interpretation
unreliable.
4.3 Hypothalmic-pituitary lactotrophic axis:
Prolactin showed similar trends in both TBI and SAH group with high levels on admission and a trend
to decreasing levels on day 6. Prolactin was significantly higher on day 6 in the TBI group compared to
the SAH group, 15.98 ±1.58 vs. 11.58 ±2.18, U = 74.00, Z = -2.234, p = 0.025.
On admission 7 of the 21 (33.3%) TBI patients had abnormally high prolactin levels. On day 6, 5 of
17 (29.4%) TBI patients had abnormally high and 1 of 17 patients (5.9%) abnormally low prolactin
levels.
On admission 4 of 14 (28.6%) SAH patients had abnormally high prolactin levels and 1 of 4
patients (7.1%) had abnormally low levels. On day 6, 2 of 19 (10.5%) SAH patients had abnormally
high prolactin levels and 1 of 19 (5.3%) SAH patients had abnormally low levels.
There was no significant correlation between prolactin levels and LH, FSH or testosterone levels.
4.4 Hypothalmic-pituitary thyrotrophic axis:
Mean and median TSH and fT4 remained within reference range in both TBI and SAH group on
admission and day 6. In the SAH group fT4 levels on day 6 compared to admission had significantly
decreased from 17.96 ±0.59 to 15.31 ±0.58, p = 0.04. There was no significant change in fT4 levels in
the TBI group. There was no significant change in TSH in neither the TBI nor the SAH group. Serum
levels of fT4 were significantly higher in the SAH group compared to TBI group on admission 17.96
±0.59 vs. 15.36 ±0.70 respectively, U = 74.50, Z = -2.442, p = 0.13.
In the TBI group 3 of the 21 patients (14.3%) had abnormal thyroid tests on admission and 2 of 17
(11.8%) on day 6. One patient in the TBI group had values compatible with primary hypothyroidism on

54
admission with high levels of TSH and low levels of fT4. That patient did not have known
hypothyroidism earlier and on day 6 the fT4 levels were within reference range but TSH levels still
high. Another patient had low levels of fT4 with normal TSH levels on admission but normal levels on
day 6. The third patient had high levels of TSH with low levels of fT4 on admission and on day 6 low
levels of fT4 with low levels of TSH compatible with secondary hypothyroidism. That patient had
severe TBI and later died.
In the SAH group 2 of the 14 patients (14,3%) had abnormal thyroid tests on admission and 2 of 16
(12,5%) on day 6. One patient had high TSH levels with normal fT4 levels on admission but normal
values on day 6. One patient had low fT4 value with normal TSH on admission but on day 6 normal
fT4 levels with high TSH value. The third patient had normal values on admission but on day 6 low
value of TSH with normal fT4 value.
4.5 Hypothalmic-pituitary somatotrophic axis:
Because of age related reference range and the demographic differences in the TBI and SAH group
comparison of mean IGF-1 is not feasible. There was however a difference in changes in IGF-1
between groups. There was a significant increase in IGF-1 levels on day 6 in the TBI group compared
to admission as levels increased from 117.62 ±13.45 to 192.35 ±20.23, p >0.01. There was no
significant change between admission and day 6 in the SAH group and the median level decreased
98.5 (range 99.0) to 96.6 (range 162.0). There was a significant difference in the proportion of patient
with IGF-1 values out of normal range on day 6 between the two groups with lower proportion of low
IFG-1 and higher proportion with high IGF-1 in the TBI group as shown in figure 2.
On admission 11 of 21 (52.4%) TBI patients had abnormally low IGF-1 levels. On day 6 only 1/17
(5.9%) TBI patient had low levels of IGF-1, the same patient had low levels on admission. Three
patients with normal levels on admission had abnormally high levels of IGF-1 on day 6.
On admission 5 of 14 (35,7%) SAH patients had abnormally low IGF-1 levels. On day 6, 4 of 16
(25.0%) SAH patients had low levels of IGF-1, three of the patients with low levels on admission still
had low levels of IGF-1 and one patient included after admission had low levels of IGF-1 on day 6.
Two patients with low levels on admission had normalized their IGF-1 levels.
GH was even measured. The analytic method was changed during the study period and since
single GH measurements are of little value those results are not presented.

55
Figure 6 Changes in Insulin like growth factor 1 (IGF-1) in the TBI group from admission to day 6, each line represents one patient
Figure 7 Changes in Insulin like growth factor 1 (IGF-1) in the SAH group from admission to day 6, each line represents one patient.
IGF
-1 (μ
g/L
)
IGF
-1 (μ
g/L
)

56
4.6 Correlations between hormone values and indicators of severity:
Overview of significant correlation between variables used as indicators of severity and hormone
values, on admission and day 6, is provided in tables 10 and 11.
Overview of significant differences in hormone values of TBI or SAH patients with documented the
occurrence of pupil dilatation, documented ischemic event that is the occurrence of documented
serum haemoglobin level (Hb) below 80 g/dl, the occurrence of hypotension defined as a recorded
systolic blood pressure (SBP) <90 mmHg or hypoxia defined as a recorded SpO2<90% during the first
hour post insult or hours 2-24 post insult is presented in tables 12 and 13.

57
Table 13 Overview of significant correlation between variables, indicators of severity, and hormone values in TBI patients
Clinical variable Hormone Spearman’s rho p value
GCS TSH day 6 0.547 0.023
GCS fT4 day 0 -0.557 0.009
GCS FSH day 0 -0.594 0.012
GCS testosterone day 0 -0.57 0.021
ISS fT4 day 0 -0.484 0.026
ISS cortisol day 6 0.561 0.030
S100b cortisol day0 0.538 0.012
GCS = Glasgow coma scale, ISS = Injury severity score, TSH = thyroid stimulating hormone, fT4 =
free thyroxin 4.
Table 14 Overview of significant correlation between variables, indicators of severity, and hormone values in in SAH patients
Clinical variable Hormone Spearman’s rho p value
GCS fT4 day6 0.522 0.038
Hunt and Hess fT4 day 6 -0.628 0.009
APACHEII fT4 day 6 -0.540 0.038
Length of ICU stay fT4 day 0 -0.546 0.044
Length of ICU stay testosterone day 6 -0.797 0.010
GCS = Glasgow coma scale, APACHEII = Acute Physiology and Chronic Health Evaluation II, fT4 =
free thyroxin 4

58
Table 15: Significant differences in hormone values grouping TBI whether dilatation of pupil or ischemic event occurred or not
Event Yes to event No to event p value
Dilatation of pupil TSH day 6, mUl/L
0.50 ± 0.31
0.34 (1.05)
TSH day 6, mUl/L
2.56 ± 0.30
2.58 (4.58)
0.012
Systolic BP < 90 mmHg, 1
st hour
ACTH day 0, ng/L
149.75 ± 46.22
166.0 (221)
ACTH day 0, ng/L
53.63 ± 23.26
13 (369)
0.029
Hormone values and S100b presented as mean ± SEM and median (range). TSH = thyroid stimulating hormone, ACTH = adrenocorticotrophic hormone, Hb = hemoglobin.
Table 16: Significant differences in hormone values grouping SAH patients whether dilatation of pupil or ischemic event occurred or not
Event Yes to event No to event p value
Dilatation of pupil Testosterone day 0, nmol/L
18.27 ± 5.17
15.8 (17.4)
Testosterone day 0, nmol/L
5.33 ± 1.00
5.45 (6.65)
0.024
Systolic BP < 90 mmHg, hours 2-24
Testosterone day 0, nmol/L
17.65 ± 5.63
15.8 (19.25)
Testosterone day 0, nmol/L
5.63 ± 1.24
5.45 (8.50)
0.048
Systolic BP < 90 mmHg, hours 2-24
ACTH day 0, ng/L
235.8 ± 163.8
89.0 (1040)
ACTH day 0, ng/L
118.9 ± 87.2
42.0 ( 630)
0.03
Saturation < 90%, hours 2-24
PRL day 6, ug/L
21.13 ± 8.37
14.2 (26.4)
PRL day 6, ug/L
9.37 ± 1.57
8.0 (20.8)
0.022
Hormone values presented as mean ± SEM and median (range). TSH = thyroid stimulating hormone, ACTH = adrenocorticotrophic hormone, Hb = hemoglobin.

59
5 Discussion:
In this prospective study we described and compared neuroendocrine changes in the acute phase of
moderate and severe TBI and SAH on admission and 6 days post insult. We investigated association
between hormone values and possible predictive factors.
In summary we found neuroendocrine disturbances to be common in both the acute phase of TBI
and SAH. The HP-adrenal axis was affected in 23.8% of TBI group on day 0 and 6.7% on day 6. The
HP-adrenal axis was affected in only one SAH patient, 9.1%, and that was on day 6. The HP-gonadal
axis was the most commonly affected HP-axis. On day 6 the HP-gonadal axis was affected in 84.6%
of male TBI patients and 90% of male SAH patients. The HP-thyroid axis was the least affected HP-
axis and only one TBI patient, 5.9%, had TSH and fT4 levels compatible with secondary
hypothyroidism and none in the SAH group. The HP-somatotroph axis was affected in 52.4% of the
TBI patients on day 0 but had mostly resolved on day 6 compared to 35.7% of the SAH group on day
0 and 25.0% on day 6. In general when evaluating association there seemed to be more suppression
of the thyroid axis with more severe insult and adequately more activation of the hypothalamic-pituitary
adrenal axis. The association between severity and the hypothalamic-pituitary-gonadal was conflicting
with more severe insult having less suppression on admission but on day 6 there was a strong
negative correlation between testosterone and length of ICU stay in the SAH group. We did not
identify any good predictive factor for neuroendocrine disturbance in the acute phase of TBI and SAH.
5.1 Hypothalmic-pituitary adrenal axis:
Diagnosing a true clinically relevant cortisol deficiency in the acute settings of any critical care patient
is challenging but at the same time, the most important hormone deficiency to diagnose and treat with
a stress dose of glucocorticoids. The American College of Critical Care recommendations from 2008
on the diagnosis and management of critical illness related corticosteroid insufficiency (CRCI) sets the
cut-off value for serum cortisol level at less than 276 nmol/L or an increase of less than 248 nmol/L
after Synacthen test. CRCI should be suspected in hypotensive patients who have responded poorly
to fluids and vasopressor agents (58). Relying solely on Synacthen test is not recommended since in
the case of pituitary failure the adrenals may still respond up to 6 weeks after pituitary failure (105).
The adrenal may even respond to the high dose of Synacthen and show a response despite the
adrenals being resistant to endogenous ACTH. Furthermore the cut-off value for the diagnosis of
CICR is still much debated and even which supplemental doses of hydrocortisone should be used
(123).
We found on admission that 23.8% of the TBI group (n=21) had cortisol levels suggestive of CRCI
but on day 6, only one TBI patient (6.7% of the TBI group) had low serum cortisol. The mean cortisol
level was significantly lower in the TBI group compared to the SAH group, 634 nmol/L ±75.7 vs. 1333
nmol/L ±344, (p = 0.016). Only one SAH patient (9.1% of the SAH group) had marginally low serum
cortisol on day 6, 270 nmol/L and a normal Synacthen test.
Previous studies have shown different incidence of corticotroph dysfunction that certainly is partly
explained by different methodology and definitions. There are studies showing both higher and lower

60
incidence (70,91,93,95,96). Our results for the TBI group are in line with the study of Kleindienst et al
on TBI, which used similar definitions as in our study setting the cut-off value for cortisol at 290 nmol/L
(92). Tanriverdi et al used even more stringent baseline cortisol value and found lower incidence.
Olivecrona et al reported a higher incidence at day 1 and day 4 (96) and it is possible that the
difference lies in that in our study the measurements are done at time points earlier, on day 0, and
then later, on day 6 post insult. The low incidence Klose et al found, might be due to the use of
Synacthen test for diagnosis (70). We only used the Synacthen test on day 6.
Published studies on the HP-adrenal axis in the acute phase of TBI are inconsistent. There is
conflicting data on the association between cortisol levels and clinical outcome. Hannon et al found
patients with hypocortisolemia to have longer ICU stay and patients in the lowest quartile of mean
cortisol levels and those with low serum cortisol on day 10 post insult had higher mortality (95).
Olivecrona et al on the other hand, reported a higher mortality at 3 months for patients with higher
cortisol levels in the acute phase (96)
Cortisol deficiency and abnormality in diurnal cycle of cortisol in SAH patients are associated with
worse outcome (100,102). Perhaps the association between cortisol and worse outcome is explained
by the fact that patients with lower levels of cortisol have possibly had a more severe insult.
As mentioned above we found a significant difference in cortisol values between the TBI and the
SAH group on day 0. Whether that difference is because of TBI patients inadequately responding thus
having what sometimes is called relative adrenal insufficiency or SAH producing a stronger
sympathetic response is unknown. The difference could even lie in different treatment of these groups.
The TBI group had significantly lower GCS and thus are more likely to be sedated. High dose propofol
and thiopentothal has been shown to be associated with lower cortisol levels (91). One patient in the
TBI group was treated with dexamethasone and was therefore excluded for day 6 follow-up, and had
low cortisol levels and failed the Synacthen test. He was treated with hydrocortisone and re-tested on
day 19 post insult and then had normal levels of cortisol and a normal Synacthen test. He was
excluded from our calculations, except on day 0. Diagnosing that patient with CRCI would be
questionable as dexamethasone suppresses cortisol production at least 6-8 hours and up to 48 hours
(124).
In our study we found a positive correlation in the TBI group between serum cortisol on day 0 and
S100b and serum cortisol on day 6 and Injury severity score (ISS). Documented hypotension in the 1st
hour in TBI patients and hours 2-24 in the SAH group were associated with higher ACTH levels. This
seems like an adequate response with higher cortisol levels in more severely injured patients. Failure
to increase cortisol secretion could result in increased mortality as demonstrated by Hannon et al (95).
Interestingly in the TBI group LH correlated with cortisol on admission (rho = 0.725, p = 0.001) and
ACTH on admission (rho = 0.578, p = 0.019). The same trend in correlation although not significant
was between FSH and cortisol (rho = 0.419, p= 0.094) and ACTH and FSH (rho = 0.470, p = 0.057).
This might reflect a disturbance in the hypothalamic-pituitary area causing disturbances
simultaneously in the HP-adrenal and HP-gonadal axis.
Treatment with corticoids in the acute phase of brain injury should be differentiated into
replacement therapy for corticosteroid insufficiency for the truly deficient patient and pharmacological

61
treatment as a part of neuroprotective treatment. The CRASH trial showed an increase in mortality
with corticosteroid treatment but in that trial TBI patients received supra-physological doses of
methylprednisolone (125). The CRASH trial constitutes 80% of the patients used in a Cochrane review
which showed an increase in mortality with corticosteroid treatment in the acute phase of TBI (126). A
Cochrane review on corticosteroid treatment in the acute phase of SAH was inconclusive (127)
It is clear from the discussions above that previous studies show conflicting results. This research
field is complicated by diverse factors one being confounding factors with intensive care treatment as
evident from Cohan et al research showing that high dose propofol and pentobarbital was associated
with lower cortisol levels (Cohan et al., 2005). Furthermore based on our results it is clear that there is
less activation of the HP-adrenal axis in TBI compared to SAH patients and relatively common for TBI
patients to have cortisol values suggestive of CRCI. Diagnosing and treating true HP-adrenal
deficiency is life saving and there is much need for further studies in this field.
5.2 Hypothalmic-pituitary gonadal and lactotroph axis:
As explained in the result chapter females were excluded from our evaluation of the HP-gonadal axis
due to uncertainty of where in the menstrual cycle the women were and whether they were pre- or
postmenopausal. Thus the discussions below is based on our results on male patients, on day 0, n=17
in the TBI group, n=9 in the SAH group, on day 6 n = 13 in the TBI group and n = 10 in the SAH group.
The HP- gonadal axis was the most commonly affected axis. On day 6, 84.6% of male TBI patients
and 90.0% of male SAH patients had low testosterone values. That is in line with previous studies
consistently showing strong suppression of the HP-gonadal axis in the acute phase of both TBI and
SAH as well as critical illness in general. This is considered an adaptive response where the body is
reducing energy consumption and conserving substrates for more vital functions (51,105). But
nevertheless, this might indicate a lasting insufficiency in the HP-gonadal axis in some patients and
therefore indicates the importance of further follow up of the pituitary hormones later on.
We found a stronger suppression at the pituitary level in the TBI group compared to the SAH
group. At day 6 FSH levels were significantly lower in the TBI group vs. the SAH group, 2.04 U/L ±0.61
vs. 4.67 U/L ±1.24, p=0.021 and a trend to lower LH on day 6 2.96 ± 0.65 vs. 4.19 ± 0.85, p=0.203.
Furthermore there was a significant difference between the TBI group and SAH group in the
proportion of patients with LH and FSH outside reference range, high or low, on day 6 (p<0.05).
Stronger suppression at the pituitary level in the TBI group compared to the SAH may indicate
difference in the mechanism of neuroendocrine disturbances in these two groups. This might be
explained with the primary injury in traumatic brain injury with direct mechanical damage such as
axonal shearing affecting the hypothalamic-pituitary area directly and immediately or early after the
trauma whereas other proposed mechanism like ischemia caused by oedema and increased ICP
takes more time to develop.
Interestingly we found a negative correlation between GCS and FSH, and GCS and testosterone,
on day 0, rho=-0.594, p=0.012 and rho -0.57, p=0.021 respectively, meaning that more severe TBI
assessed by the GCS had higher levels of FSH and testosterone. Furthermore in the SAH group
patients who dilated a pupil had higher testosterone compared to those who did not dilate a pupil,

62
testosterone day 0 18.27 ± 5.17 nmol/L vs. 5.33 ± 1.00 nmol/L, p=0.024. Patients with a documented
hypotension at hours 2-24 had higher testosterone levels compared to those who did not have a
documented hypotension, 17.65 ± 5.63 nmol/L vs. 5.63 ± 1.24 nmol/L, p=0.048. This is difficult to
explain and in contrary to previous studies on TBI patients (69)(92). Olivecrona et al did though find
that low levels of testosterone, LH and FSH on day 1 was associated with increased survival 3 months
post insult and low level of LH day 1 was associated with better outcome on GOS 3 months post
insult. The authors hypothesize that more severe brain injury may hamper the physiological
suppression of the HP-gonadal axis (96). There could be other confounding factors involved.
We found at strong negative correlation between testosterone levels on day 6, in the SAH group
and length of ICU stay, rho=-0.797, p=0.010, and that is in line with previous studies showing more
suppression with increased severity.
As expected, prolactin levels were generally high on day 0, also in line with previous studies.
(89)(90)(69,79)(70,76)(93,96,92)(101) Tanriverdi et al found a negative correlation between serum
prolactin and GCS (69). We did not find this correlation. Neither did we find a correlation between
prolactin levels and testosterone, LH nor FSH levels.
We did not present results on the HP-gonadal axis in females nor did we measure estradiol or
progesterone in males. Estradiol and progesterone have both been shown to be potential agents in
neuroprotective therapy (27). Bearing that in mind it would be interesting to see whether endogenous
levels of estradiol and progesterone correlate with outcome. Furthermore low testosterone levels in
the beginning of rehabilitation have been correlated to less favorable outcome (108). The question is
whether low serum testosterone identifies patients with the least rehabilitation potential or whether low
testosterone levels per se halter rehabilitation.
5.3 Hypothalmic-pituitary thyroid axis:
Our results are in line with previous studies with only a small portion of patients in both the TBI and
SAH groups with fT4 and TSH serum levels below reference range (89,93,96,99). Other studies have
reported higher prevalence of HP-thyroid disturbances have mainly reported low T3 syndrome which
was not evaluated in our study (69,76,79).
We did find a significant decrease in fT4 level in the SAH group from day 0-6, 17.96 ±0.59 pmol/L
to 15.31 ±0.58 pmol/L, p = 0.04 which is in line with previous studies which have shown a reduction in
both fT4 and TSH levels with time in TBI and acute illness (96)(128). Small sample size could be one
reason for us not detecting a significant change in fT4 level in the TBI group and TSH in both groups.
In the TBI group we found a positive correlation between TSH levels on day 6 and GCS,
rho=0.547, p=0.023, and a negative correlation between fT4 levels on day 0 and ISS, rho=-0.484,
p=0.026. In the SAH group we found a positive correlation between fT4 levels on day 6 and GCS,
rho=0.522, p=0.038, a negative correlation between fT4 levels on day 6 and Hunt and Hess, rho=-
0.628, p=0.009, APAHCEII and length of ICU stay, rho=-0.540, p=0.038. This is in line with previous
studies suggesting an association between the suppression of the HP-thyroid axis in more severe
illness and possibly an adaptive response (92)(128)(96)(52). Surprisingly, we found a negative

63
correlation between fT4 levels on day 0 and GCS, rho=-0.557, p=0.009 which is conflicting with the
above and difficult to explain. The small size of our group can of course be a contributing factor.
5.4 Hypothalmic-pituitary somatotroph axis:
Single measurements of growth hormone are of little value and added little to our results and were not
presented.
On admission there was not a significant difference in the proportion of patients with IGF-1 levels
outside age related reference range in the TBI and the SAH group with 52.4% of the TBI group having
IGF-1 levels below age related normal values and 35.7% of the SAH group. On day 6 almost all TBI
patients had normalized serum IGF-1 and even had higher than normal values whereas there was no
significant change in IGF-1 in the SAH group with 25.0% still having low values on day 6. Our results
for the TBI group are in accordance with previous studies from Olivecrona et al and Tanriverdi et al
(96)(69). However, Kleindienst et al did not see as much restoration of IGF-1 levels on day 7 in a
group of TBI patients. Regarding the SAH group previous studies have shown similar prevalence of
low IGF-1 (79,99). Bendel et al measured serum IGF-1 on days 1-7 post SAH and on day 1, 77% had
low IGF-1, and on day 7, 76% had low IGF-1 levels. They even reported association between lower
IGF-1 level and poorer outcome measured with a quality of life questionnaire, HRQoL (98). The
difference in changes in IGF-1 levels between TBI and SAH group could be the result of the TBI group
being significantly younger and thus restoring their IGF-1 values more rapidly or there might be some
difference in the insult per se causing low IGF-1 levels. Causes for low IGF-1 levels include GH
insufficiency, decreased liver production or a decrease in IGF-1 caused by stress following critical
illness (98).
IGF-1 has neurotropic effects, affects neuronal apoptosis and neuromodulation. As previously
mentioned low levels of IGF-1 are associated with poorer QoL so levels of IGF-1 can play a role in the
neurological recovery following TBI and SAH. Furthermore IGF-1 treatment has shown promising
effect on cognitive and motor outcome in a TBI rat model (27). Thus IGF-1 and possibly GH might be
potential therapeutic agents in the recovery after TBI and SAH. Still conflicting results have been
reported on growth hormone treatment as it has been shown to improve mortality in burn patients
(Knox, Demling, Wilmore, Sarraf, & Santos, 1995) and even to increase mortality in surgery patients
(Takala et al., 1999). Further studies on both the behavior and role of IGF-1 in both TBI and SAH are
needed.
5.5 Strengths of the study:
The strength of our study is that there is only one neurosurgical department in Iceland and all severe
TBI, most if not all moderate TBI patients needing admittance to hospital and all SAH patients are
admitted to the department. Our study, a single-center prospective study is thus a complete study on a
national level that by our knowledge is novel. As we cannot exclude at this time that some patients
with severe TBI and SAH have been missed to inclusion in the study we find the incidence at least not
over-interpreted. The incidence found in the study could therefore be suggestive for incidence of
hormonal disturbance in the acute phase of TBI and SAH in a western country with similar life style.

64
5.6 Limitations of the study:
An important limitation of the study is the size of the population. Iceland had at the time of the study
318.000 inhabitants and the study period was one year, explaining the small study population. Another
limitation is the timing of the first blood samples. Some patients were brought to the hospital within an
hour post insult and blood samples were collected shortly after while others were injured far away from
the hospital causing a delay of several hours for the first blood samples to be drawn. Correlations in
our study between GCS and hormone disturbances were conflicting. GCS score predicts outcome
more accurately when combine with patient age and pupillary response and is better at predicting
outcome when either high or low (129). GCS may not be have been the best inclusion criteria as we
experienced that some patients with very low GCS recovered quickly and were discharged and did not
attend to follow up and others with higher GCS had a clinical course indicating more severe injury than
the GCS score indicated.
Further, the study design did not include interference of the treatment post insult, this might affect
the results, as patients received different treatment post insult as symptomatic treatment both on the
ICU and follow up ward was given as usual. Interfering with that treatment could not only be wrong but
even hazardous.
65
6 Conclusion:
We conclude that neuroendocrine disturbances are common in both the acute phase of TBI and SAH.
Patients with TBI are of greater risk for critical illness induced decrease in activity of the HP-adrenal
axis in the acute phase compared to patients with SAH. Diagnosing true HP-adrenal deficiency is
difficult, even today, but at the same time it is the most important hormone deficiency to identify and
treat. Furthermore there is ongoing discussion about which doses of hydrocortisone to use (52).
Disturbance of the HP-gonadal axis affects the majority of male TBI and SAH patients in the acute
phase. The suppression of the axis is more at the pituitary level in TBI patients compared to SAH
patients and that may be explained by different causative mechanisms. Low testosterone on day 6 in
SAH patients is strongly correlated to longer ICU stay indicating higher risk of suppressed HP-gonadal
axis with more severely ill SAH.
The increased levels of prolactin in both TBI and SAH on admittance may indicate a risk of pituitary
disturbance and therefore a need for follow up of the pituitary hormonal axis after the insult.
Even though the HP-thyroid axis is more suppressed in more severely ill TBI and SAH patients,
overt disturbance in the HP-thyroid axis was uncommon in both TBI and SAH. Nevertheless,
evaluation of this axis after TBI and SAH cannot be omitted
The HP-somatotroph axis is disturbed in the early acute phase of TBI and SAH. That disturbance
resolves in TBI patients after the first week from the insult but remains suppressed in SAH patients.
Again, the causative mechanism for the hormonal disturbance of the somatotroph axis may differ
between TBI and SAH.
Our results regarding the use of following variables as predictive factor for neuroendocrine
disturbance in the acute phase of TBI and SAH was inconclusive, GCS, Hunt an Hess, APACHEII,
length of ICU stay, S100b, dilatation of pupil or the occurrence of ischemic events. In general when
there seemed to be more suppression of the hypothalamic-pituitary (HP) gonadal and thyroid axis with
more severe insult and adequately more activation of the hypothalamic-pituitary adrenal axis.
The clinical significance of disturbances in other than the HP-adrenal axis, whether adaptive or
maladaptive is uncertain. Different causative mechanisms may explain hormonal disturbances in TBI
and SAH. Clinicians should evaluate the HP-adrenal axis on indication in the acute phase of TBI and
SAH as treatment with hydrocortisone may be life-saving. Routine evaluation of other hormonal axis
during the acute phase of TBI or SAH might indicate a need for further follow up in the chronic phase
of TBI or SAH insult.

66
67
References:
1. Tagliaferri F, Compagnone C, Korsic M, Servadei F, Kraus J. A systematic review of brain injury epidemiology in Europe. Acta Neurochir (Wien) [Internet]. 2006 Mar [cited 2012 Mar 6];148(3):255–68; discussion 268. Available from: http://www.ncbi.nlm.nih.gov/pubmed/16311842
2. Gisladottir EH, Karason S, Sigvaldason K, Ulfarsson E, Mogensen B. [Visits to an emergency department due to head injuries]. Læknablađiđ [Internet]. 2014 Jun [cited 2015 May 13];100(6):331–5. Available from: http://www.ncbi.nlm.nih.gov/pubmed/25125431
3. Rutland-Brown W, Langlois JA, Thomas KE, Xi YL. Incidence of traumatic brain injury in the United States, 2003. J Head Trauma Rehabil [Internet]. [cited 2014 Apr 3];21(6):544–8. Available from: http://www.ncbi.nlm.nih.gov/pubmed/17122685
4. Zaloshnja E, Miller T, Langlois J a, Selassie AW. Prevalence of long-term disability from traumatic brain injury in the civilian population of the United States, 2005. J Head Trauma Rehabil [Internet]. 2008;23(6):394–400. Available from: http://www.ncbi.nlm.nih.gov/pubmed/19033832
5. Halldórsson J. Faraldsfræði höfuðáverka/heilaáverka á Íslandi. Læknadagar 2008 2007: Reykjavík. 2008.
6. Teasdale G, Jennett B. Assessment of coma and impaired consciousness. A practical scale. Lancet [Internet]. 1974 Jul 13 [cited 2012 Apr 27];2(7872):81–4. Available from: http://www.ncbi.nlm.nih.gov/pubmed/4136544
7. Opara JA, Małecka E, Szczygiel J. Clinimetric measurement in traumatic brain injuries. J Med Life [Internet]. 2014 Jun 15 [cited 2015 Apr 30];7(2):124–7. Available from: http://www.pubmedcentral.nih.gov/articlerender.fcgi?artid=4197513&tool=pmcentrez&rendertype=abstract
8. Prins M, Greco T, Alexander D, Giza CC. The pathophysiology of traumatic brain injury at a glance. Dis Model Mech [Internet]. 2013 Nov [cited 2014 Apr 1];6(6):1307–15. Available from: http://www.pubmedcentral.nih.gov/articlerender.fcgi?artid=3820255&tool=pmcentrez&rendertype=abstract
9. McConeghy KW, Hatton J, Hughes L, Cook AM. A review of neuroprotection pharmacology and therapies in patients with acute traumatic brain injury. CNS Drugs [Internet]. 2012 Jul 1 [cited 2014 Apr 9];26(7):613–36. Available from: http://www.ncbi.nlm.nih.gov/pubmed/22668124
10. Steyerberg EW, Mushkudiani N, Perel P, Butcher I, Lu J, McHugh GS, et al. Predicting outcome after traumatic brain injury: development and international validation of prognostic scores based on admission characteristics. PLoS Med [Internet]. 2008 Aug 5 [cited 2012 Mar 28];5(8):e165; discussion e165. Available from: http://www.pubmedcentral.nih.gov/articlerender.fcgi?artid=2494563&tool=pmcentrez&rendertype=abstract
11. Menon DK, Zahed C. Prediction of outcome in severe traumatic brain injury. Curr Opin Crit Care [Internet]. 2009 Oct [cited 2014 Apr 9];15(5):437–41. Available from: http://www.ncbi.nlm.nih.gov/pubmed/19713837
12. Perel P, Arango M, Clayton T, Edwards P, Komolafe E, Poccock S, et al. Predicting outcome after traumatic brain injury: practical prognostic models based on large cohort of international

68
patients. BMJ [Internet]. 2008 Feb 23 [cited 2012 Mar 11];336(7641):425–9. Available from: http://www.pubmedcentral.nih.gov/articlerender.fcgi?artid=2249681&tool=pmcentrez&rendertype=abstract
13. Yokobori S, Hosein K, Burks S, Sharma I, Gajavelli S, Bullock R. Biomarkers for the clinical differential diagnosis in traumatic brain injury--a systematic review. CNS Neurosci Ther [Internet]. 2013 Aug [cited 2015 May 2];19(8):556–65. Available from: http://www.ncbi.nlm.nih.gov/pubmed/23710877
14. Raabe A, Grolms C, Keller M, Döhnert J, Sorge O, Seifert V. Correlation of computed tomography findings and serum brain damage markers following severe head injury. Acta Neurochir (Wien) [Internet]. 1998 Jan [cited 2015 May 2];140(8):787–91; discussion 791–2. Available from: http://www.ncbi.nlm.nih.gov/pubmed/9810445
15. Mercier E, Boutin A, Lauzier F, Fergusson DA, Simard J-F, Zarychanski R, et al. Predictive value of S-100β protein for prognosis in patients with moderate and severe traumatic brain injury: systematic review and meta-analysis. BMJ [Internet]. 2013 Jan [cited 2015 May 2];346:f1757. Available from: http://www.ncbi.nlm.nih.gov/pubmed/23558282
16. Butcher I, Maas AIR, Lu J, Marmarou A, Murray GD, Mushkudiani NA, et al. Prognostic value of admission blood pressure in traumatic brain injury: results from the IMPACT study. J Neurotrauma [Internet]. 2007 Feb [cited 2014 Apr 8];24(2):294–302. Available from: http://www.ncbi.nlm.nih.gov/pubmed/17375994
17. Chi JH, Knudson MM, Vassar MJ, McCarthy MC, Shapiro MB, Mallet S, et al. Prehospital hypoxia affects outcome in patients with traumatic brain injury: a prospective multicenter study. J Trauma [Internet]. 2006 Nov [cited 2014 Apr 8];61(5):1134–41. Available from: http://www.ncbi.nlm.nih.gov/pubmed/17099519
18. Jeremitsky E, Omert L, Dunham CM, Protetch J, Rodriguez A. Harbingers of poor outcome the day after severe brain injury: hypothermia, hypoxia, and hypoperfusion. J Trauma [Internet]. 2003 Feb [cited 2014 Apr 8];54(2):312–9. Available from: http://www.ncbi.nlm.nih.gov/pubmed/12579057
19. McHugh GS, Engel DC, Butcher I, Steyerberg EW, Lu J, Mushkudiani N, et al. Prognostic value of secondary insults in traumatic brain injury: results from the IMPACT study. J Neurotrauma [Internet]. 2007 Feb [cited 2014 Apr 8];24(2):287–93. Available from: http://www.ncbi.nlm.nih.gov/pubmed/17375993
20. Murray GD, Butcher I, McHugh GS, Lu J, Mushkudiani NA, Maas AIR, et al. Multivariable prognostic analysis in traumatic brain injury: results from the IMPACT study. J Neurotrauma [Internet]. 2007 Feb [cited 2014 Apr 8];24(2):329–37. Available from: http://www.ncbi.nlm.nih.gov/pubmed/17375997
21. Juul N, Morris GF, Marshall SB, Marshall LF. Intracranial hypertension and cerebral perfusion pressure: influence on neurological deterioration and outcome in severe head injury. The Executive Committee of the International Selfotel Trial. J Neurosurg [Internet]. 2000 Jan [cited 2014 Apr 7];92(1):1–6. Available from: http://www.ncbi.nlm.nih.gov/pubmed/10616075
22. Bullock MR, Chesnut R, Ghajar J, Gordon D, Hartl R, Newell DW, et al. Surgical management of depressed cranial fractures. Neurosurgery [Internet]. 2006 Mar [cited 2015 Jun 3];58(3 Suppl):S56–60; discussion Si – iv. Available from: http://www.ncbi.nlm.nih.gov/pubmed/16540744
23. Bullock MR, Chesnut R, Ghajar J, Gordon D, Hartl R, Newell DW, et al. Surgical management of posterior fossa mass lesions. Neurosurgery [Internet]. 2006 Mar [cited 2015 Jun 3];58(3 Suppl):S47–55; discussion Si – iv. Available from: http://www.ncbi.nlm.nih.gov/pubmed/16540745

69
24. Bullock MR, Chesnut R, Ghajar J, Gordon D, Hartl R, Newell DW, et al. Surgical management of traumatic parenchymal lesions. Neurosurgery [Internet]. 2006 Mar [cited 2015 May 1];58(3 Suppl):S25–46; discussion Si – iv. Available from: http://www.ncbi.nlm.nih.gov/pubmed/16540746
25. Bullock MR, Chesnut R, Ghajar J, Gordon D, Hartl R, Newell DW, et al. Surgical management of acute epidural hematomas. Neurosurgery [Internet]. 2006 Mar [cited 2015 May 26];58(3 Suppl):S7–15; discussion Si – iv. Available from: http://www.ncbi.nlm.nih.gov/pubmed/16710967
26. Bullock MR, Chesnut R, Ghajar J, Gordon D, Hartl R, Newell DW, et al. Surgical management of acute subdural hematomas. Neurosurgery [Internet]. 2006 Mar [cited 2015 Jun 3];58(3 Suppl):S16–24; discussion Si – iv. Available from: http://www.ncbi.nlm.nih.gov/pubmed/16710968
27. McConeghy KW, Hatton J, Hughes L, Cook AM. A review of neuroprotection pharmacology and therapies in patients with acute traumatic brain injury. CNS Drugs [Internet]. 2012 Jul 1;26(7):613–36. Available from: http://www.ncbi.nlm.nih.gov/pubmed/22668124
28. Alderson P, Roberts I. Corticosteroids in acute traumatic brain injury: systematic review of randomised controlled trials. BMJ [Internet]. 1997 Jun 28 [cited 2014 Apr 8];314(7098):1855–9. Available from: http://www.pubmedcentral.nih.gov/articlerender.fcgi?artid=2126994&tool=pmcentrez&rendertype=abstract
29. Roberts I, Yates D, Sandercock P, Farrell B, Wasserberg J, Lomas G, et al. Effect of intravenous corticosteroids on death within 14 days in 10008 adults with clinically significant head injury (MRC CRASH trial): randomised placebo-controlled trial. Lancet [Internet]. 2004;364(9442):1321–8. Available from: http://www.ncbi.nlm.nih.gov/pubmed/15474134
30. Edwards P, Arango M, Balica L, Cottingham R, El-Sayed H, Farrell B, et al. Final results of MRC CRASH, a randomised placebo-controlled trial of intravenous corticosteroid in adults with head injury-outcomes at 6 months. Lancet [Internet]. 2005 [cited 2012 Mar 21];365(9475):1957–9. Available from: http://www.ncbi.nlm.nih.gov/pubmed/15936423
31. Stein DG. Progesterone exerts neuroprotective effects after brain injury. Brain Res Rev [Internet]. 2008 Mar [cited 2014 Apr 11];57(2):386–97. Available from: http://www.pubmedcentral.nih.gov/articlerender.fcgi?artid=2699575&tool=pmcentrez&rendertype=abstract
32. Ma J, Huang S, Qin S, You C. Progesterone for acute traumatic brain injury. Cochrane database Syst Rev [Internet]. 2012 Jan [cited 2014 Apr 11];10:CD008409. Available from: http://www.ncbi.nlm.nih.gov/pubmed/23076947
33. Arevalo MA, Santos-Galindo M, Lagunas N, Azcoitia I, Garcia-Segura LM. Selective estrogen receptor modulators as brain therapeutic agents. J Mol Endocrinol [Internet]. 2011 Feb [cited 2014 Apr 13];46(1):R1–9. Available from: http://www.ncbi.nlm.nih.gov/pubmed/21071476
34. Van Gijn J, Kerr RS, Rinkel GJE. Subarachnoid haemorrhage. Lancet [Internet]. 2007 Jan 27;369(9558):306–18. Available from: http://www.ncbi.nlm.nih.gov/pubmed/17258671
35. Suarez JI, Tarr RW, Selman WR. Aneurysmal subarachnoid hemorrhage. N Engl J Med [Internet]. 2006 Jan 26;354(4):387–96. Available from: http://www.ncbi.nlm.nih.gov/pubmed/16436770
36. Molyneux AJ, Kerr RSC, Yu L-M, Clarke M, Sneade M, Yarnold J a, et al. International subarachnoid aneurysm trial (ISAT) of neurosurgical clipping versus endovascular coiling in 2143 patients with ruptured intracranial aneurysms: a randomised comparison of effects on

70
survival, dependency, seizures, rebleeding, subgroups, and. Lancet [Internet]. 366(9488):809–17. Available from: http://www.ncbi.nlm.nih.gov/pubmed/16139655
37. Fisher CM, Kistler JP, Davis JM. Relation of cerebral vasospasm to subarachnoid hemorrhage visualized by computerized tomographic scanning. Neurosurgery [Internet]. 1980 Jan [cited 2014 Apr 23];6(1):1–9. Available from: http://www.ncbi.nlm.nih.gov/pubmed/7354892
38. Rosen DS, Macdonald RL. Subarachnoid hemorrhage grading scales: a systematic review. Neurocrit Care [Internet]. 2005 Jan [cited 2014 Apr 20];2(2):110–8. Available from: http://www.ncbi.nlm.nih.gov/pubmed/16159052
39. De Rooij NK, Linn FHH, van der Plas J a, Algra A, Rinkel GJE. Incidence of subarachnoid haemorrhage: a systematic review with emphasis on region, age, gender and time trends. J Neurol Neurosurg Psychiatry [Internet]. 2007 Dec [cited 2014 Apr 12];78(12):1365–72. Available from: http://www.pubmedcentral.nih.gov/articlerender.fcgi?artid=2095631&tool=pmcentrez&rendertype=abstract
40. Gudmundsson G. Primary Subarachnoid Hemorrhage in Iceland. Stroke [Internet]. 1973 Sep 1 [cited 2014 Apr 22];4(5):764–7. Available from: http://stroke.ahajournals.org/cgi/doi/10.1161/01.STR.4.5.764
41. Vlak MHM, Rinkel GJE, Greebe P, Greving JP, Algra A. Lifetime risks for aneurysmal subarachnoid haemorrhage: multivariable risk stratification. J Neurol Neurosurg Psychiatry [Internet]. 2013 Jun [cited 2014 May 1];84(6):619–23. Available from: http://www.ncbi.nlm.nih.gov/pubmed/23355806
42. Douglas MR, Daniel M, Lagord C, Akinwunmi J, Jackowski A, Cooper C, et al. High CSF transforming growth factor beta levels after subarachnoid haemorrhage: association with chronic communicating hydrocephalus. J Neurol Neurosurg Psychiatry [Internet]. 2009 May [cited 2014 Apr 23];80(5):545–50. Available from: http://www.ncbi.nlm.nih.gov/pubmed/19066194
43. Sobey CG, Faraci FM. Subarachnoid haemorrhage: what happens to the cerebral arteries? Clin Exp Pharmacol Physiol [Internet]. 1998 Nov [cited 2014 Apr 23];25(11):867–76. Available from: http://www.ncbi.nlm.nih.gov/pubmed/9807657
44. Heinsoo M, Eelmäe J, Kuklane M, Tomberg T, Tikk A, Asser T. The possible role of CSF hydrodynamic parameters following in management of SAH patients. Acta Neurochir Suppl [Internet]. 1998 Jan [cited 2014 Apr 23];71:13–5. Available from: http://www.ncbi.nlm.nih.gov/pubmed/9779130
45. Ding D, Starke RM, Dumont AS, Owens GK, Hasan DM, Chalouhi N, et al. Therapeutic Implications of Estrogen for Cerebral Vasospasm and Delayed Cerebral Ischemia Induced by Aneurysmal Subarachnoid Hemorrhage. Biomed Res Int [Internet]. 2014 Jan [cited 2014 Apr 21];2014:727428. Available from: http://www.pubmedcentral.nih.gov/articlerender.fcgi?artid=3958795&tool=pmcentrez&rendertype=abstract
46. Lin C-L, Dumont AS, Su Y-F, Tsai Y-J, Huang J-H, Chang K-P, et al. Attenuation of cerebral vasospasm and secondary injury by 17beta-estradiol following experimental subarachnoid hemorrhage. J Neurosurg [Internet]. 2009 Mar [cited 2014 Sep 17];110(3):457–61. Available from: http://www.ncbi.nlm.nih.gov/pubmed/18950269
47. Chang C-M, Su Y-F, Chang C-Z, Chung C-L, Tsai Y-J, Loh J-K, et al. Progesterone attenuates experimental subarachnoid hemorrhage-induced vasospasm by upregulation of endothelial nitric oxide synthase via Akt signaling pathway. Biomed Res Int [Internet]. 2014 Jan [cited 2014 Sep 17];2014:207616. Available from:
71
http://www.pubmedcentral.nih.gov/articlerender.fcgi?artid=4052693&tool=pmcentrez&rendertype=abstract
48. Yan F, Hu Q, Chen J, Wu C, Gu C, Chen G. Progesterone attenuates early brain injury after subarachnoid hemorrhage in rats. Neurosci Lett [Internet]. 2013 May 24 [cited 2014 Sep 17];543:163–7. Available from: http://www.ncbi.nlm.nih.gov/pubmed/23499999
49. Amar AP, Weiss MH. Pituitary anatomy and physiology. Neurosurg Clin N Am [Internet]. 2003 Jan [cited 2014 Apr 29];14(1):11–23, v. Available from: http://www.ncbi.nlm.nih.gov/pubmed/12690976
50. Gorczyca W, Hardy J. Arterial supply of the human anterior pituitary gland. Neurosurgery [Internet]. 1987 Mar [cited 2015 May 1];20(3):369–78. Available from: http://www.ncbi.nlm.nih.gov/pubmed/3574612
51. Hassan-Smith Z, Cooper MS. Overview of the endocrine response to critical illness: how to measure it and when to treat. Best Pract Res Clin Endocrinol Metab [Internet]. 2011 Oct [cited 2014 Mar 5];25(5):705–17. Available from: http://www.ncbi.nlm.nih.gov/pubmed/21925072
52. Boonen E, Van den Berghe G. Endocrine responses to critical illness: novel insights and therapeutic implications. J Clin Endocrinol Metab [Internet]. 2014 Mar 11 [cited 2014 Mar 29];jc20134115. Available from: http://www.ncbi.nlm.nih.gov/pubmed/24517153
53. Finlay WE, McKee JI. Serum cortisol levels in severely stressed patients. Lancet [Internet]. 1982 Jun 19 [cited 2015 Apr 27];1(8286):1414–5. Available from: http://www.ncbi.nlm.nih.gov/pubmed/6123706
54. Tucker WS, Snell BB, Island DP, Gregg CR. Reversible adrenal insufficiency induced by ketoconazole. JAMA [Internet]. 1985 Apr 26 [cited 2015 Apr 27];253(16):2413–4. Available from: http://www.ncbi.nlm.nih.gov/pubmed/3981770
55. Wagner RL, White PF, Kan PB, Rosenthal MH, Feldman D. Inhibition of adrenal steroidogenesis by the anesthetic etomidate. N Engl J Med [Internet]. 1984 May 31 [cited 2015 Apr 27];310(22):1415–21. Available from: http://www.ncbi.nlm.nih.gov/pubmed/6325910
56. Cooper MS, Stewart PM. Corticosteroid insufficiency in acutely ill patients. N Engl J Med [Internet]. 2003 Feb 20 [cited 2015 Apr 27];348(8):727–34. Available from: http://www.ncbi.nlm.nih.gov/pubmed/12594318
57. Boonen E, Vervenne H, Meersseman P, Andrew R, Mortier L, Declercq PE, et al. Reduced cortisol metabolism during critical illness. N Engl J Med [Internet]. 2013 Apr 18 [cited 2015 Feb 4];368(16):1477–88. Available from: http://www.ncbi.nlm.nih.gov/pubmed/23506003
58. Marik PE, Pastores SM, Annane D, Meduri GU, Sprung CL, Arlt W, et al. Recommendations for the diagnosis and management of corticosteroid insufficiency in critically ill adult patients: consensus statements from an international task force by the American College of Critical Care Medicine. Crit Care Med [Internet]. 2008 Jun [cited 2015 Mar 9];36(6):1937–49. Available from: http://www.ncbi.nlm.nih.gov/pubmed/18496365
59. Economidou F, Douka E, Tzanela M, Nanas S, Kotanidou A. Thyroid function during critical illness. Hormones (Athens) [Internet]. 2011;10(2):117–24. Available from: http://www.ncbi.nlm.nih.gov/pubmed/21724536
60. Mechanick JI, Nierman DM. Gonadal steroids in critical illness. Crit Care Clin [Internet]. 2006 Jan [cited 2014 May 1];22(1):87–103, vii. Available from: http://www.ncbi.nlm.nih.gov/pubmed/16399021
72
61. Vanhorebeek I, Van den Berghe G. The neuroendocrine response to critical illness is a dynamic process. Crit Care Clin [Internet]. 2006 Jan [cited 2014 May 1];22(1):1–15, v. Available from: http://www.ncbi.nlm.nih.gov/pubmed/16399016
62. Nylen ES, Muller B. Endocrine changes in critical illness. J Intensive Care Med [Internet]. 2004 [cited 2014 May 1];19(2):67–82. Available from: http://www.ncbi.nlm.nih.gov/pubmed/15070518
63. Baxter RC, Hawker FH, To C, Stewart PM, Holman SR. Thirty-day monitoring of insulin-like growth factors and their binding proteins in intensive care unit patients. Growth Horm IGF Res [Internet]. 1998 Dec [cited 2015 Mar 6];8(6):455–63. Available from: http://www.ncbi.nlm.nih.gov/pubmed/10985757
64. Cyran E. Hypophysenschädigung durch Schädelbasisfraktur. Dtsch Medizinische Wochenschrift. 1918;44:1261.
65. Hoff W V, Hornabrook RW, Marks V. Hypopituitarism associated with intracranial aneurysms. Br Med J [Internet]. 1961 Nov 4 [cited 2015 Apr 28];2(5261):1190–4. Available from: http://www.pubmedcentral.nih.gov/articlerender.fcgi?artid=1970219&tool=pmcentrez&rendertype=abstract
66. Kelly DF, Gonzalo IT, Cohan P, Berman N, Swerdloff R, Wang C. Hypopituitarism following traumatic brain injury and aneurysmal subarachnoid hemorrhage: a preliminary report. J Neurosurg [Internet]. 2000 Nov;93(5):743–52. Available from: http://www.ncbi.nlm.nih.gov/pubmed/11059653
67. Schneider HJ, Kreitschmann-Andermahr I, Ghigo E, Stalla GK, Agha A. Hypothalamopituitary dysfunction following traumatic brain injury and aneurysmal subarachnoid hemorrhage: a systematic review. JAMA [Internet]. 2007 Sep 26 [cited 2012 May 23];298(12):1429–38. Available from: http://www.ncbi.nlm.nih.gov/pubmed/17895459
68. Agha A, Phillips J, O’Kelly P, Tormey W, Thompson CJ. The natural history of post-traumatic hypopituitarism: implications for assessment and treatment. Am J Med [Internet]. 2005 Dec [cited 2012 Jun 20];118(12):1416. Available from: http://www.ncbi.nlm.nih.gov/pubmed/16378796
69. Tanriverdi F, Senyurek H, Unluhizarci K, Selcuklu A, Casanueva FF, Kelestimur F. High risk of hypopituitarism after traumatic brain injury: a prospective investigation of anterior pituitary function in the acute phase and 12 months after trauma. J Clin Endocrinol Metab [Internet]. 2006 Jun [cited 2012 Jun 20];91(6):2105–11. Available from: http://www.ncbi.nlm.nih.gov/pubmed/16522687
70. Klose M, Juul A, Struck J, Morgenthaler NG, Kosteljanetz M, Feldt-Rasmussen U. Acute and long-term pituitary insufficiency in traumatic brain injury: a prospective single-centre study. Clin Endocrinol (Oxf) [Internet]. 2007 Oct [cited 2012 Apr 18];67(4):598–606. Available from: http://www.ncbi.nlm.nih.gov/pubmed/17880406
71. Schneider HJ, Schneider M, Saller B, Petersenn S, Uhr M, Husemann B, et al. Prevalence of anterior pituitary insufficiency 3 and 12 months after traumatic brain injury. Eur J Endocrinol [Internet]. 2006 Feb [cited 2012 Jun 20];154(2):259–65. Available from: http://www.ncbi.nlm.nih.gov/pubmed/16452539
72. Bavisetty S, Dusick JR, Wang C, Levin H, Ph D. Chronic Hypopituitarism after Traumatic Brain Injury: Risk Assessment and Relationship to Outcome. 2008;62(5):1080–94.
73. Aimaretti G, Ambrosio MR, Di Somma C, Gasperi M, Cannavò S, Scaroni C, et al. Residual pituitary function after brain injury-induced hypopituitarism: a prospective 12-month study. J Clin Endocrinol Metab [Internet]. 2005 Nov [cited 2012 Mar 9];90(11):6085–92. Available from: http://www.ncbi.nlm.nih.gov/pubmed/16144947

73
74. Karaca Z, Tanriverdi F, Dagli a T, Selcuklu A, Casanueva FF, Unluhizarci K, et al. Three years prospective investigation of pituitary functions following subarachnoid haemorrhage. Pituitary [Internet]. 2012 Feb 8 [cited 2012 Jun 20]; Available from: http://www.ncbi.nlm.nih.gov/pubmed/22315089
75. Lammert A, Bode H, Hammes H-P, Birck R, Fatar M, Zohsel K, et al. Aneurysmal subarachnoid hemorrhage (aSAH) results in low prevalence of neuro-endocrine dysfunction and NOT deficiency. Pituitary [Internet]. 2012 Dec [cited 2014 May 1];15(4):505–12. Available from: http://www.ncbi.nlm.nih.gov/pubmed/22038031
76. Klose M, Brennum J, Poulsgaard L, Kosteljanetz M, Wagner A, Feldt-Rasmussen U. Hypopituitarism is uncommon after aneurysmal subarachnoid haemorrhage. Clin Endocrinol (Oxf) [Internet]. 2010 Jul [cited 2012 Jun 20];73(1):95–101. Available from: http://www.ncbi.nlm.nih.gov/pubmed/20105184
77. Kreitschmann-Andermahr I, Hoff C, Saller B, Niggemeier S, Pruemper S, Hütter BO, et al. Prevalence of pituitary deficiency in patients after aneurysmal subarachnoid hemorrhage. J Clin Endocrinol Metab [Internet]. 2004 Oct [cited 2012 Jun 20];89(10):4986–92. Available from: http://www.ncbi.nlm.nih.gov/pubmed/15472195
78. Dimopoulou I, Kouyialis AT, Tzanella M, Armaganidis A, Thalassinos N, Sakas DE, et al. High incidence of neuroendocrine dysfunction in long-term survivors of aneurysmal subarachnoid hemorrhage. Stroke [Internet]. 2004 Dec [cited 2012 Apr 2];35(12):2884–9. Available from: http://www.ncbi.nlm.nih.gov/pubmed/15499033
79. Tanriverdi F, Dagli AT, Karaca Z, Unluhizarci K, Selcuklu A, Casanueva FF, et al. High risk of pituitary dysfunction due to aneurysmal subarachnoid haemorrhage: a prospective investigation of anterior pituitary function in the acute phase and 12 months after the event. Clin Endocrinol (Oxf) [Internet]. 2007 Dec [cited 2012 Jun 20];67(6):931–7. Available from: http://www.ncbi.nlm.nih.gov/pubmed/17666088
80. Bondanelli M, Marinis LDE, Ambrosio MR, Monesi M, Valle D, Zatelli MC, et al. Occurence of pituitary dysfunction following traumatic brain injury. 2004;21(6):685–96.
81. Schneider H. Structured assessment of hypopituitarism after traumatic brain injury and aneurysmal subarachnoid hemorrhage in 1242 patients: the German interdisciplinary. J Neurotrauma [Internet]. 2011 [cited 2014 Mar 5];1–18. Available from: http://online.liebertpub.com/doi/abs/10.1089/neu.2011.1887
82. Agha A, Sherlock M, Phillips J, Tormey W, Thompson CJ. The natural history of post-traumatic neurohypophysial dysfunction. Eur J Endocrinol [Internet]. 2005 Mar [cited 2012 Apr 2];152(3):371–7. Available from: http://www.ncbi.nlm.nih.gov/pubmed/15757853
83. Klose M, Juul A, Poulsgaard L, Kosteljanetz M, Brennum J, Feldt-Rasmussen U. Prevalence and predictive factors of post-traumatic hypopituitarism. Clin Endocrinol (Oxf) [Internet]. 2007 Aug [cited 2011 Oct 20];67(2):193–201. Available from: http://www.ncbi.nlm.nih.gov/pubmed/17524035
84. Schneider M, Schneider HJ, Yassouridis A, Saller B, von Rosen F, Stalla GK. Predictors of anterior pituitary insufficiency after traumatic brain injury. Clin Endocrinol (Oxf) [Internet]. 2008 Feb [cited 2012 Jun 20];68(2):206–12. Available from: http://www.ncbi.nlm.nih.gov/pubmed/17803694
85. Krahulik D, Zapletalova J, Frysak Z, Vaverka M. Dysfunction of hypothalamic-hypophysial axis after traumatic brain injury in adults. J Neurosurg [Internet]. 2010 Sep [cited 2012 Jun 20];113(3):581–4. Available from: http://www.ncbi.nlm.nih.gov/pubmed/19929195

74
86. Klose M, Feldt-Rasmussen U. Does the type and severity of brain injury predict hypothalamo-pituitary dysfunction? Does post-traumatic hypopituitarism predict worse outcome? Pituitary [Internet]. 2008 Jan [cited 2012 Jun 20];11(3):255–61. Available from: http://www.ncbi.nlm.nih.gov/pubmed/18404391
87. Jovanovic V, Pekic S, Stojanovic M, Tasic G, Djurovic B, Soldatovic I, et al. Neuroendocrine dysfunction in patients recovering from subarachnoid hemorrhage. Hormones (Athens) [Internet]. 2010;9(3):235–44. Available from: http://www.ncbi.nlm.nih.gov/pubmed/20688621
88. Cernak I, Savic VJ, Lazarov A, Joksimovic M, Markovic S. Neuroendocrine responses following graded traumatic brain injury in male adults. Brain Inj [Internet]. 1999 Dec [cited 2015 Apr 28];13(12):1005–15. Available from: http://www.ncbi.nlm.nih.gov/pubmed/10628505
89. Agha A, Rogers B, Mylotte D, Taleb F, Tormey W, Phillips J, et al. Neuroendocrine dysfunction in the acute phase of traumatic brain injury. Clin Endocrinol (Oxf) [Internet]. 2004 May [cited 2012 Mar 9];60(5):584–91. Available from: http://www.ncbi.nlm.nih.gov/pubmed/15104561
90. Dimopoulou I, Tsagarakis S, Theodorakopoulou M, Douka E, Zervou M, Kouyialis AT, et al. Endocrine abnormalities in critical care patients with moderate-to-severe head trauma: incidence, pattern and predisposing factors. Intensive Care Med [Internet]. 2004 Jun [cited 2012 Jun 20];30(6):1051–7. Available from: http://www.ncbi.nlm.nih.gov/pubmed/15069597
91. Cohan P, Wang C, McArthur DL, Cook SW, Dusick JR, Armin B, et al. Acute secondary adrenal insufficiency after traumatic brain injury: A prospective study*. Crit Care Med [Internet]. 2005 Oct [cited 2015 Mar 6];33(10):2358–66. Available from: http://content.wkhealth.com/linkback/openurl?sid=WKPTLP:landingpage&an=00003246-200510000-00030
92. Kleindienst A, Brabant G, Bock C, Maser-gluth C, Buchfelder M. Neuroendocrine Function following Traumatic Brain Injury and Subsequent Intensive Care Treatment : A Prospective Longitudinal Evaluation. 2009;1446(September):1435–46.
93. Tandon A, Suri A, Kasliwal MK, Mahapatra AK, Mehta VS, Garg A, et al. Assessment of endocrine abnormalities in severe traumatic brain injury: a prospective study. Acta Neurochir (Wien) [Internet]. 2009 Nov [cited 2012 Jun 20];151(11):1411–7. Available from: http://www.ncbi.nlm.nih.gov/pubmed/19597761
94. Chourdakis M, Kraus MM, Tzellos T, Sardeli C, Peftoulidou M, Vassilakos D, et al. Effect of Early Compared With Delayed Enteral Nutrition on Endocrine Function in Patients With Traumatic Brain Injury: An Open-Labeled Randomized Trial. JPEN J Parenter Enteral Nutr [Internet]. 2011 Sep 30 [cited 2011 Oct 20]; Available from: http://www.ncbi.nlm.nih.gov/pubmed/21965459
95. Hannon MJ, Crowley RK, Behan L a, O’Sullivan EP, O’Brien MMC, Sherlock M, et al. Acute glucocorticoid deficiency and diabetes insipidus are common after acute traumatic brain injury and predict mortality. J Clin Endocrinol Metab [Internet]. 2013 Aug [cited 2015 Mar 29];98(8):3229–37. Available from: http://www.ncbi.nlm.nih.gov/pubmed/23690314
96. Olivecrona Z, Dahlqvist P, Koskinen L-OD. Acute neuro-endocrine profile and prediction of outcome after severe brain injury. Scand J Trauma Resusc Emerg Med [Internet]. Scandinavian Journal of Trauma, Resuscitation and Emergency Medicine; 2013 Jan [cited 2014 May 1];21(1):33. Available from: http://www.pubmedcentral.nih.gov/articlerender.fcgi?artid=3637196&tool=pmcentrez&rendertype=abstract
97. Bendel S, Koivisto T, Ruokonen E, Rinne J, Romppanen J, Vauhkonen I, et al. Pituitary-adrenal function in patients with acute subarachnoid haemorrhage: a prospective cohort study. Crit Care [Internet]. 2008 Jan [cited 2015 Feb 28];12(5):R126. Available from:

75
http://www.pubmedcentral.nih.gov/articlerender.fcgi?artid=2592763&tool=pmcentrez&rendertype=abstract
98. Bendel S, Koivisto T, Ryynänen O, Ruokonen E, Romppanen J, Kiviniemi V. Insulin like growth factor-I in acute subarachnoid hemorrhage : a prospective cohort study. 2010;
99. Parenti G, Cecchi PC, Ragghianti B, Schwarz A, Ammannati F, Mennonna P, et al. Evaluation of the anterior pituitary function in the acute phase after spontaneous subarachnoid hemorrhage. 2011;361–5.
100. Poll E, Bostro A, Bu U, Reinges MH, Hans F, Gilsbach JM, et al. Cortisol Dynamics in the Acute Phase of Aneurysmal Subarachnoid Hemorrhage : 2010;195(January):189–95.
101. Khursheed N, Ramzan A, Shoaib Y, Bashir I, Wani A, Shafiq A. Is hypothyroidism and hypogonadism an issue after aneurysmal subarachnoid hemorrhage-an institutional experience? Int J Endocrinol Metab [Internet]. 2013 Jan [cited 2015 Mar 29];11(3):179–83. Available from: http://www.pubmedcentral.nih.gov/articlerender.fcgi?artid=3860112&tool=pmcentrez&rendertype=abstract
102. Lanterna L a, Spreafico V, Gritti P, Prodam F, Signorelli A, Biroli F, et al. Hypocortisolism in noncomatose patients during the acute phase of subarachnoid hemorrhage. J Stroke Cerebrovasc Dis [Internet]. Elsevier Ltd; 2013 Oct [cited 2015 Mar 29];22(7):e189–96. Available from: http://www.ncbi.nlm.nih.gov/pubmed/23253535
103. Kronvall E. Pituitary Dysfunction After Aneurysmal Subarachnoid Hemorrhage Is Associated with Impaired Early Outcome. 2014;529–37.
104. Della Corte F, Mancini A, Valle D, Gallizzi F, Carducci P, Mignani V, et al. Provocative hypothalamopituitary axis tests in severe head injury: correlations with severity and prognosis. Crit Care Med [Internet]. 1998 Aug [cited 2015 Apr 28];26(8):1419–26. Available from: http://www.ncbi.nlm.nih.gov/pubmed/9710103
105. Hannon MJ, Sherlock M, Thompson CJ. Pituitary dysfunction following traumatic brain injury or subarachnoid haemorrhage - in “Endocrine Management in the Intensive Care Unit”. Best Pract Res Clin Endocrinol Metab [Internet]. Elsevier Ltd; 2011 Oct [cited 2012 Apr 11];25(5):783–98. Available from: http://www.ncbi.nlm.nih.gov/pubmed/21925078
106. Spratt DI, Bigos ST, Beitins I, Cox P, Longcope C, Orav J. Both hyper- and hypogonadotropic hypogonadism occur transiently in acute illness: bio- and immunoactive gonadotropins. J Clin Endocrinol Metab [Internet]. 1992 Dec [cited 2015 Apr 29];75(6):1562–70. Available from: http://www.ncbi.nlm.nih.gov/pubmed/1464665
107. Levitan D, Moser SA, Goldstein DA, Kletzky OA, Lobo RA, Massry SG. Disturbances in the hypothalamic-pituitary-gonadal axis in male patients with acute renal failure. Am J Nephrol [Internet]. 1984 Jan [cited 2015 Apr 29];4(2):99–106. Available from: http://www.ncbi.nlm.nih.gov/pubmed/6426305
108. Carlson NE, Brenner LA, Wierman ME, Harrison-Felix C, Morey C, Gallagher S, et al. Hypogonadism on admission to acute rehabilitation is correlated with lower functional status at admission and discharge. Brain Inj [Internet]. 2009 Apr [cited 2015 Apr 29];23(4):336–44. Available from: http://www.ncbi.nlm.nih.gov/pubmed/19330595
109. Knox J, Demling R, Wilmore D, Sarraf P, Santos A. Increased survival after major thermal injury: the effect of growth hormone therapy in adults. J Trauma [Internet]. 1995 Sep [cited 2015 Apr 30];39(3):526–30; discussion 530–2. Available from: http://www.ncbi.nlm.nih.gov/pubmed/7473919

76
110. Takala J, Ruokonen E, Webster NR, Nielsen MS, Zandstra DF, Vundelinckx G, et al. Increased mortality associated with growth hormone treatment in critically ill adults. N Engl J Med [Internet]. 1999 Sep 9 [cited 2015 Feb 26];341(11):785–92. Available from: http://www.ncbi.nlm.nih.gov/pubmed/10477776
111. Benvenga S. Hypopituitarism Secondary to Head Trauma. J Clin Endocrinol Metab [Internet]. 2000 Apr 1 [cited 2012 Jun 20];85(4):1353–61. Available from: http://jcem.endojournals.org/cgi/doi/10.1210/jc.85.4.1353
112. Dusick JR, Wang C, Cohan P, Swerdloff R, Kelly DF. Pathophysiology of hypopituitarism in the setting of brain injury. Pituitary [Internet]. 2012 Mar [cited 2012 Jun 20];15(1):2–9. Available from: http://www.ncbi.nlm.nih.gov/pubmed/18481181
113. Kornblum RN, Fisher RS. Pituitary lesions in craniocerebral injuries. Arch Pathol [Internet]. 1969 Sep [cited 2015 Apr 29];88(3):242–8. Available from: http://www.ncbi.nlm.nih.gov/pubmed/5800923
114. Crompton MR. Hypothalamic lesions following closed head injury. Brain [Internet]. 1971 Jan [cited 2015 Apr 29];94(1):165–72. Available from: http://www.ncbi.nlm.nih.gov/pubmed/5552160
115. Pierucci G, Gherson G, Tavani M. [Pituitary changes especially necrotic--following cranio-cerebral injuries]. Pathologica [Internet]. Jan [cited 2015 Apr 29];63(917):71–88. Available from: http://www.ncbi.nlm.nih.gov/pubmed/5142407
116. Tanriverdi F, De Bellis A, Bizzarro A, Sinisi AA, Bellastella G, Pane E, et al. Antipituitary antibodies after traumatic brain injury: is head trauma-induced pituitary dysfunction associated with autoimmunity? Eur J Endocrinol [Internet]. 2008 Jul [cited 2011 Oct 20];159(1):7–13. Available from: http://www.ncbi.nlm.nih.gov/pubmed/18463108
117. Tanriverdi F, Taheri S, Ulutabanca H, Caglayan AO, Ozkul Y, Dundar M, et al. Apolipoprotein E3/E3 genotype decreases the risk of pituitary dysfunction after traumatic brain injury due to various causes: preliminary data. J Neurotrauma [Internet]. 2008 Sep [cited 2011 Oct 20];25(9):1071–7. Available from: http://www.ncbi.nlm.nih.gov/pubmed/18707245
118. Hannon MJ, Thompson CJ. Hypopituitarism is uncommon after aneurysmal subarachnoid haemorrhage. Clin Endocrinol (Oxf) [Internet]. 2010 Jul [cited 2012 Jun 20];73(1):16–7. Available from: http://www.ncbi.nlm.nih.gov/pubmed/20346002
119. Crompton MR. Hypothalamic lesions following the rupture of cerebral berry aneurysms. Brain [Internet]. 1963 Jun [cited 2015 Apr 29];86:301–14. Available from: http://www.ncbi.nlm.nih.gov/pubmed/14023946
120. Bornstein SR, Engeland WC, Ehrhart-Bornstein M, Herman JP. Dissociation of ACTH and glucocorticoids. Trends Endocrinol Metab [Internet]. 2008 Jul [cited 2015 Apr 29];19(5):175–80. Available from: http://www.ncbi.nlm.nih.gov/pubmed/18394919
121. Baker SP, O’Neill B, Haddon W, Long WB. The injury severity score: a method for describing patients with multiple injuries and evaluating emergency care. J Trauma [Internet]. 1974 Mar [cited 2015 Apr 16];14(3):187–96. Available from: http://www.ncbi.nlm.nih.gov/pubmed/4814394
122. Knaus WA, Draper EA, Wagner DP, Zimmerman JE. APACHE II: a severity of disease classification system. Crit Care Med [Internet]. 1985 Oct [cited 2015 Feb 19];13(10):818–29. Available from: http://www.ncbi.nlm.nih.gov/pubmed/3928249
123. Peeters B, Boonen E, Langouche L, Van den Berghe G. The HPA axis response to critical illness: New study results with diagnostic and therapeutic implications. Mol Cell Endocrinol

77
[Internet]. 2015 Jun 15 [cited 2015 May 6];408:235–40. Available from: http://www.ncbi.nlm.nih.gov/pubmed/25462585
124. Brophy T, Chalk JB, Ridgeway K, Tyrer JH, Eadie MJ. Cortisol production during high dose dexamethasone therapy in neurological and neurosurgical patients. J Neurol Neurosurg Psychiatry [Internet]. 1984 Oct [cited 2015 May 7];47(10):1081–6. Available from: http://www.pubmedcentral.nih.gov/articlerender.fcgi?artid=1028037&tool=pmcentrez&rendertype=abstract
125. Roberts I, Yates D, Sandercock P, Farrell B, Wasserberg J, Lomas G, et al. Effect of intravenous corticosteroids on death within 14 days in 10008 adults with clinically significant head injury (MRC CRASH trial): randomised placebo-controlled trial. Lancet [Internet]. 2004;364(9442):1321–8. Available from: http://www.ncbi.nlm.nih.gov/pubmed/15474134
126. Alderson P, Roberts I. Corticosteroids for acute traumatic brain injury. Cochrane Database Syst Rev. 2005;(1):CD000196.
127. Feigin VL, Anderson N, Rinkel GJE, Algra A, van Gijn J, Bennett DA. Corticosteroids for aneurysmal subarachnoid haemorrhage and primary intracerebral haemorrhage. Cochrane database Syst Rev [Internet]. 2005 Jan [cited 2015 May 3];(3):CD004583. Available from: http://www.ncbi.nlm.nih.gov/pubmed/16034939
128. Woolf PD, Lee LA, Hamill RW, McDonald J V. Thyroid test abnormalities in traumatic brain injury: correlation with neurologic impairment and sympathetic nervous system activation. Am J Med [Internet]. 1988 Feb [cited 2015 May 7];84(2):201–8. Available from: http://www.ncbi.nlm.nih.gov/pubmed/3407649
129. McNett M. A review of the predictive ability of Glasgow Coma Scale scores in head-injured patients. J Neurosci Nurs [Internet]. 2007 Apr [cited 2015 May 13];39(2):68–75. Available from: http://www.ncbi.nlm.nih.gov/pubmed/17477220