networks and graphs: circuits, paths, and graph structures€¦ · networks and graphs: circuits,...
TRANSCRIPT
Student: Class: Date:
Networks and Graphs: Circuits, Paths, and Graph Structures VII.A Student Activity Sheet 1: Euler Circuits and Paths
Charles A. Dana Center at The University of Texas at Austin
Advanced Mathematical Decision Making (2010) Activity Sheet 1, 8 pages
1
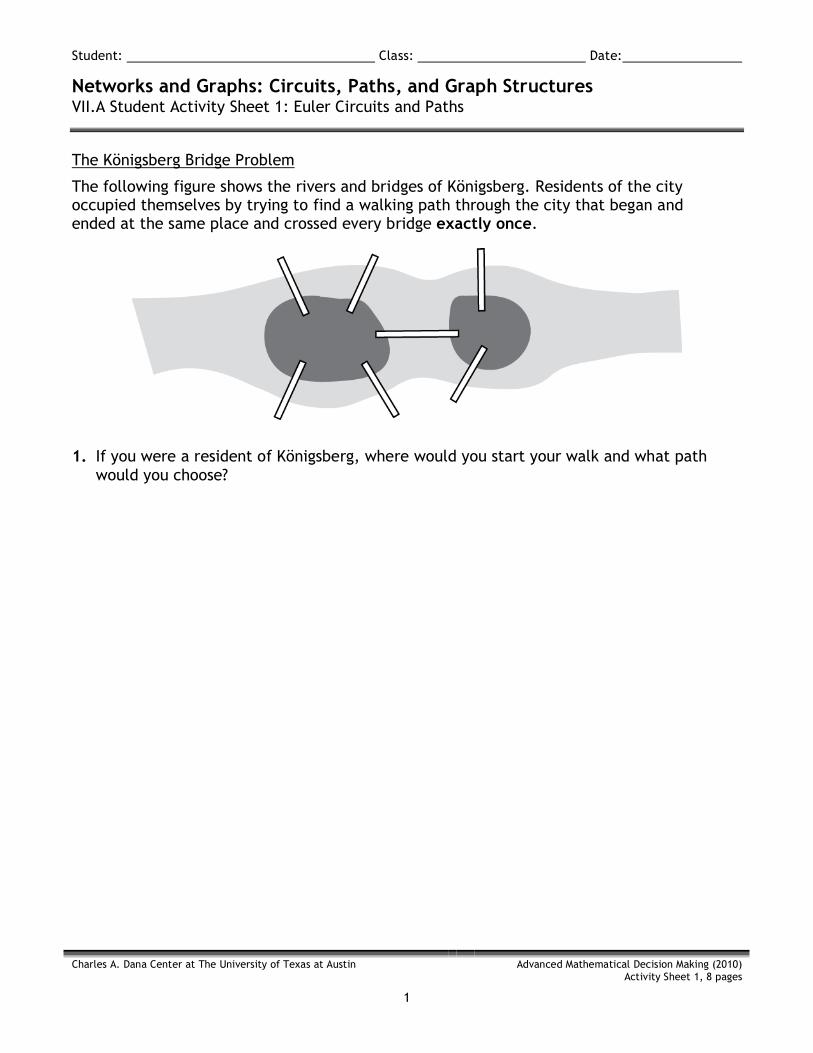
The Königsberg Bridge Problem
The following figure shows the rivers and bridges of Königsberg. Residents of the city occupied themselves by trying to find a walking path through the city that began and ended at the same place and crossed every bridge exactly once.
1. If you were a resident of Königsberg, where would you start your walk and what path would you choose?
Student: Class: Date:
Networks and Graphs: Circuits, Paths, and Graph Structures VII.A Student Activity Sheet 1: Euler Circuits and Paths
Charles A. Dana Center at The University of Texas at Austin
Advanced Mathematical Decision Making (2010) Activity Sheet 1, 8 pages
2
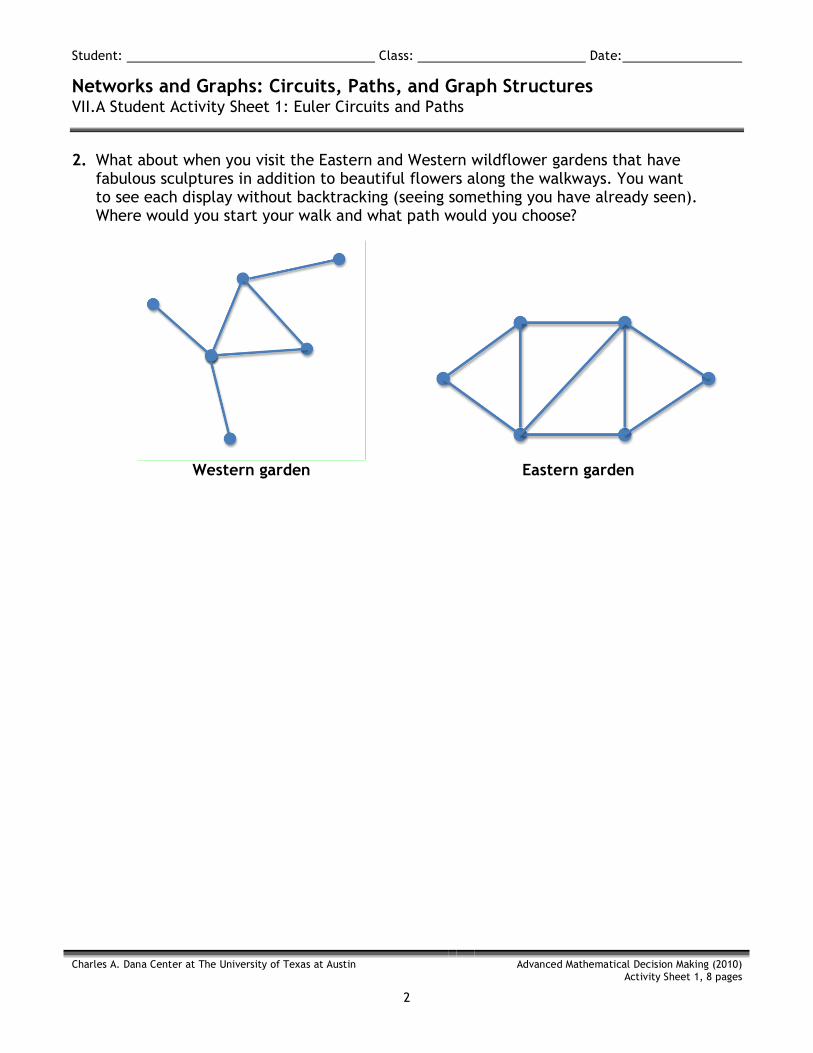
2. What about when you visit the Eastern and Western wildflower gardens that have fabulous sculptures in addition to beautiful flowers along the walkways. You want to see each display without backtracking (seeing something you have already seen). Where would you start your walk and what path would you choose?
Western garden
Eastern garden
Student: Class: Date:
Networks and Graphs: Circuits, Paths, and Graph Structures VII.A Student Activity Sheet 1: Euler Circuits and Paths
Charles A. Dana Center at The University of Texas at Austin
Advanced Mathematical Decision Making (2010) Activity Sheet 1, 8 pages
3
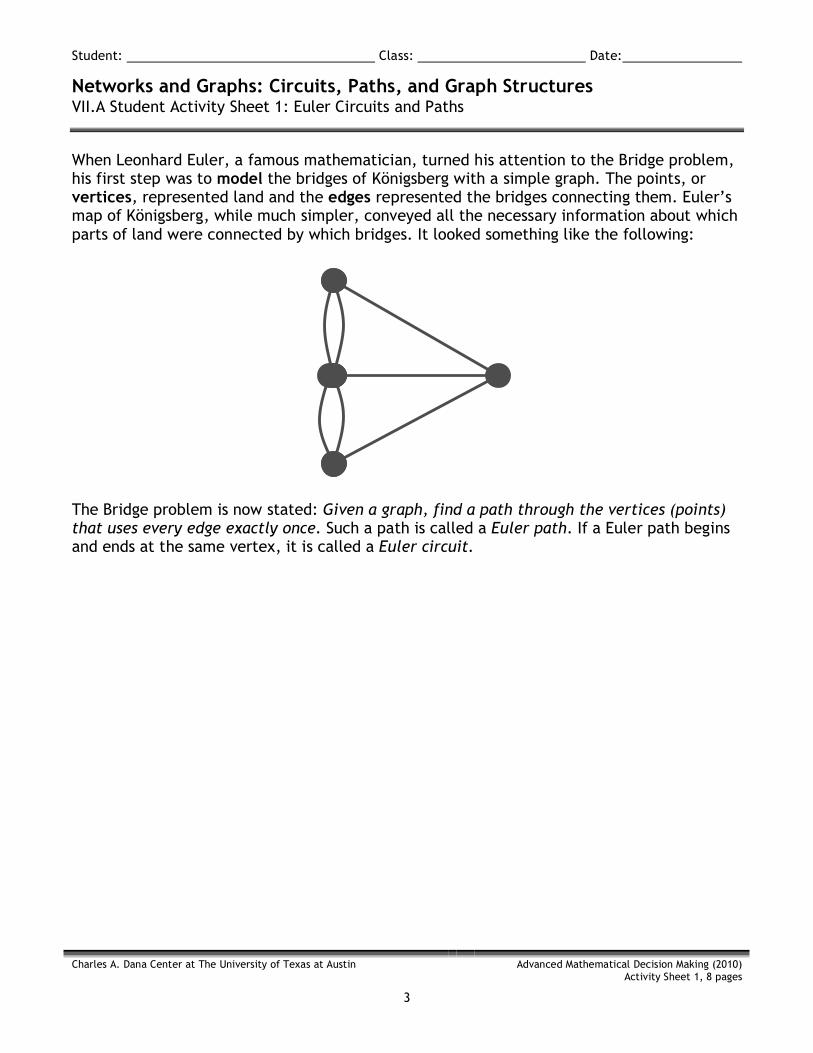
When Leonhard Euler, a famous mathematician, turned his attention to the Bridge problem, his first step was to model the bridges of Königsberg with a simple graph. The points, or vertices, represented land and the edges represented the bridges connecting them. Euler’s map of Königsberg, while much simpler, conveyed all the necessary information about which parts of land were connected by which bridges. It looked something like the following:
The Bridge problem is now stated: Given a graph, find a path through the vertices (points) that uses every edge exactly once. Such a path is called a Euler path. If a Euler path begins and ends at the same vertex, it is called a Euler circuit.
Student: Class: Date:
Networks and Graphs: Circuits, Paths, and Graph Structures VII.A Student Activity Sheet 1: Euler Circuits and Paths
Charles A. Dana Center at The University of Texas at Austin
Advanced Mathematical Decision Making (2010) Activity Sheet 1, 8 pages
4
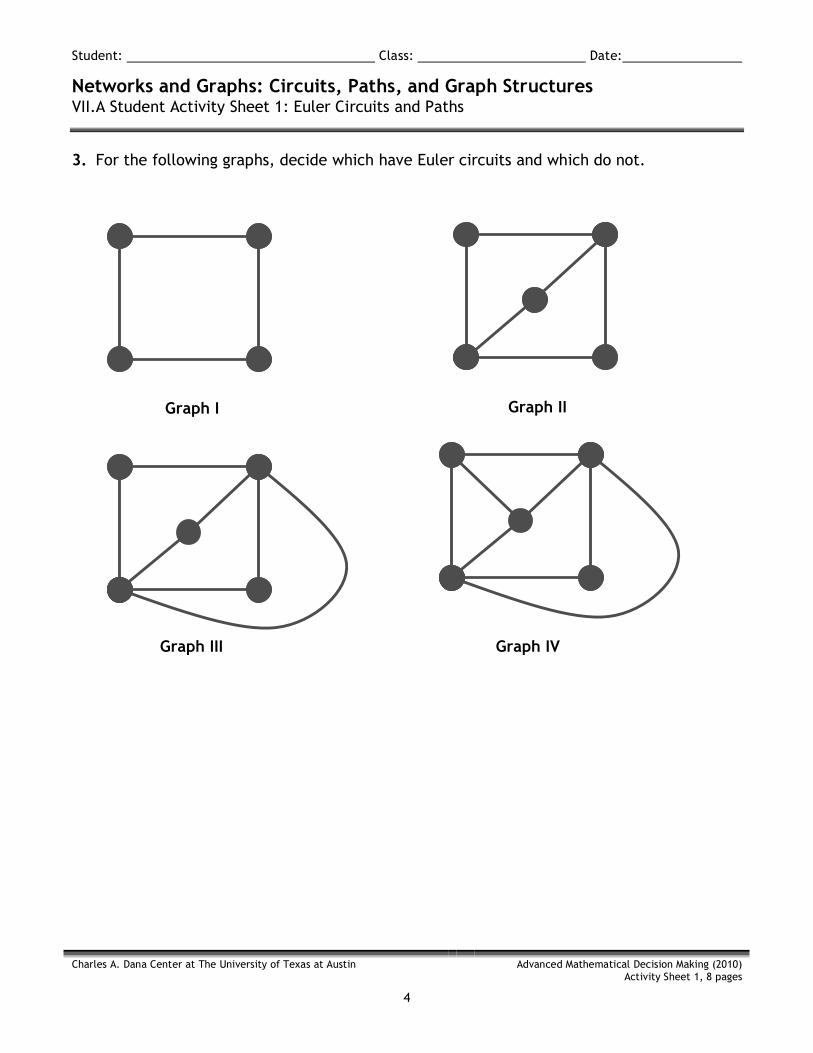
3. For the following graphs, decide which have Euler circuits and which do not.
Graph I Graph II
Graph III Graph IV
Student: Class: Date:
Networks and Graphs: Circuits, Paths, and Graph Structures VII.A Student Activity Sheet 1: Euler Circuits and Paths
Charles A. Dana Center at The University of Texas at Austin
Advanced Mathematical Decision Making (2010) Activity Sheet 1, 8 pages
5
4. The degree of a vertex is the number of edges that meet at the vertex. Determine the degree of each vertex in Graphs I–IV.
5. For the graphs from Question 3 that have Euler circuits, how many vertices have an odd degree?
6. For the graphs from Question 3 that have Euler circuits, how many vertices have an even degree?
7. Form a conjecture about how you might quickly decide whether a graph has a Euler circuit, and explain why your conjecture seems reasonable.
Student: Class: Date:
Networks and Graphs: Circuits, Paths, and Graph Structures VII.A Student Activity Sheet 1: Euler Circuits and Paths
Charles A. Dana Center at The University of Texas at Austin
Advanced Mathematical Decision Making (2010) Activity Sheet 1, 8 pages
6
8. What does your conjecture tell you about the Königsberg Bridge problem and the garden scenario?
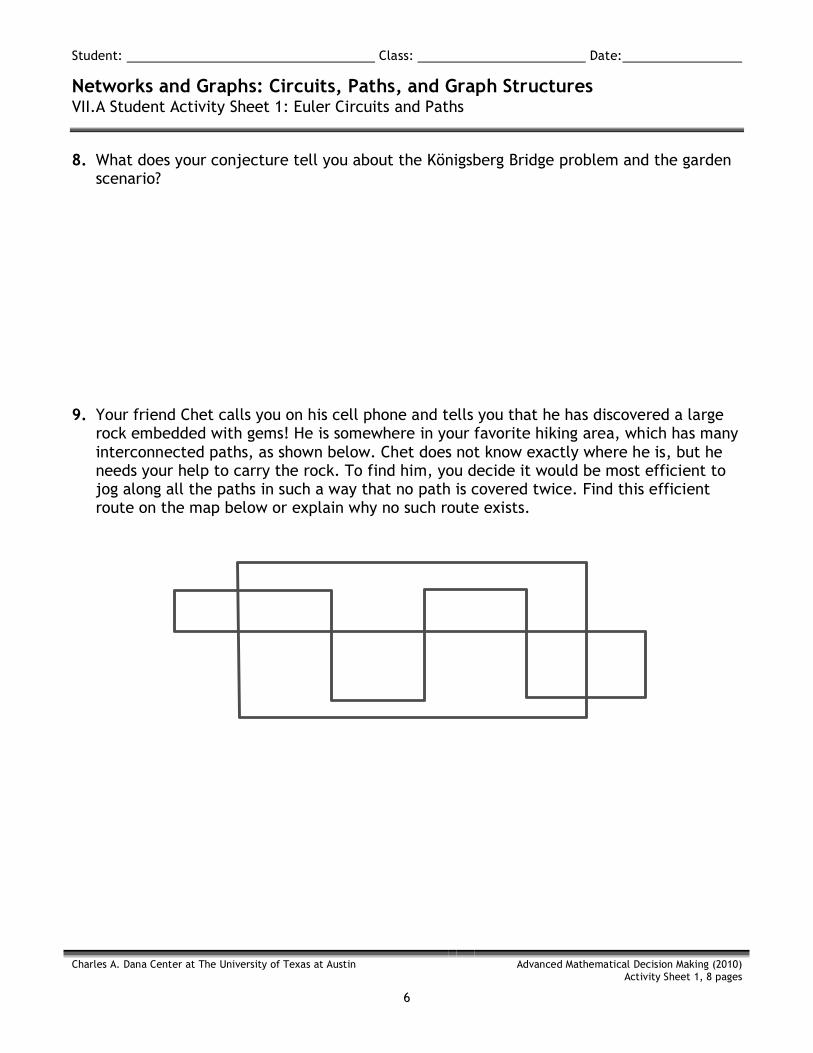
9. Your friend Chet calls you on his cell phone and tells you that he has discovered a large rock embedded with gems! He is somewhere in your favorite hiking area, which has many interconnected paths, as shown below. Chet does not know exactly where he is, but he needs your help to carry the rock. To find him, you decide it would be most efficient to jog along all the paths in such a way that no path is covered twice. Find this efficient route on the map below or explain why no such route exists.
Student: Class: Date:
Networks and Graphs: Circuits, Paths, and Graph Structures VII.A Student Activity Sheet 1: Euler Circuits and Paths
Charles A. Dana Center at The University of Texas at Austin
Advanced Mathematical Decision Making (2010) Activity Sheet 1, 8 pages
7
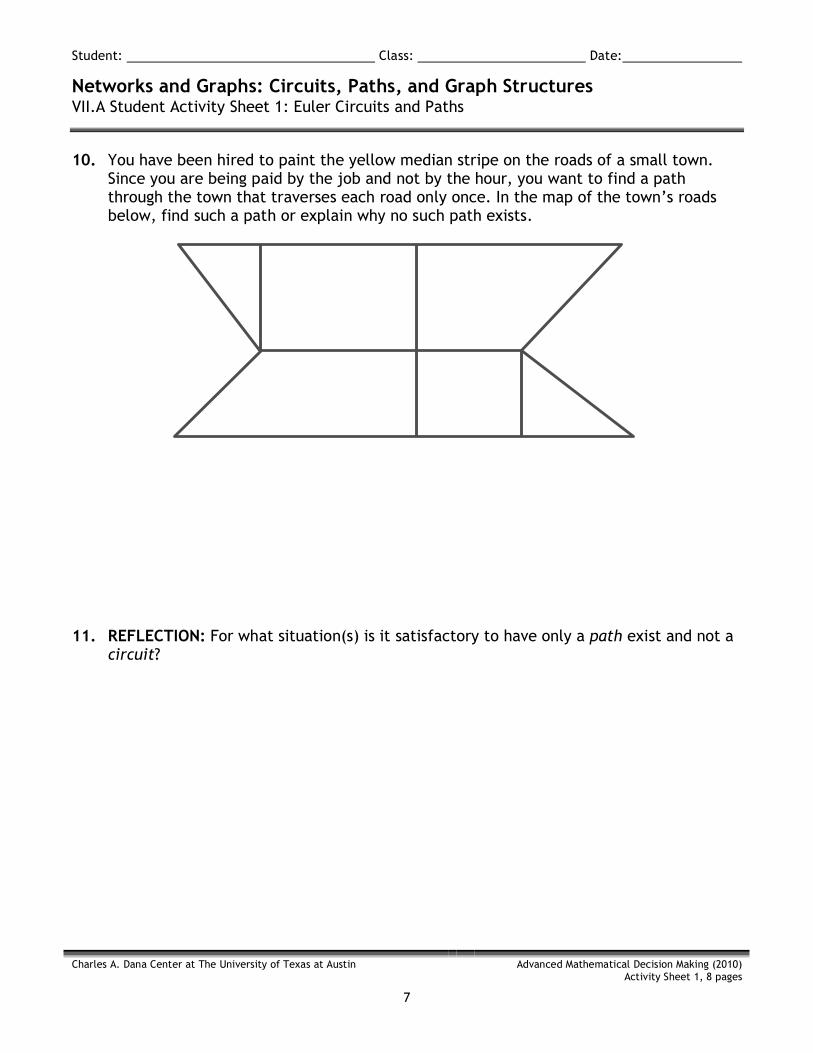
10. You have been hired to paint the yellow median stripe on the roads of a small town. Since you are being paid by the job and not by the hour, you want to find a path through the town that traverses each road only once. In the map of the town’s roads below, find such a path or explain why no such path exists.
11. REFLECTION: For what situation(s) is it satisfactory to have only a path exist and not a circuit?
Student: Class: Date:
Networks and Graphs: Circuits, Paths, and Graph Structures VII.A Student Activity Sheet 1: Euler Circuits and Paths
Charles A. Dana Center at The University of Texas at Austin
Advanced Mathematical Decision Making (2010) Activity Sheet 1, 8 pages
8
12. EXTENSION: Determine some other real-world problems whose solutions may involve finding Euler circuits or paths in graphs. There are a variety of road-traversing problems: delivering mail, garbage/recyclable collecting in a city, sweeping/cleaning streets, and so on.
For each situation, describe what real-world complications exist that might make the problem more difficult. For example, when delivering mail, most streets have houses on either side of the street and the postal worker may decide to go up one side of the street and down the other. If the city has alleyways, perhaps the garbage collectors just need to travel down the alleys.
Be prepared to make a short presentation of your findings to the class.
Student: Class: Date:
Networks and Graphs: Circuits, Paths, and Graph Structures VII.A Student Activity Sheet 2: Dominoes
Charles A. Dana Center at The University of Texas at Austin
Advanced Mathematical Decision Making (2010) Activity Sheet 2, 2 pages
9
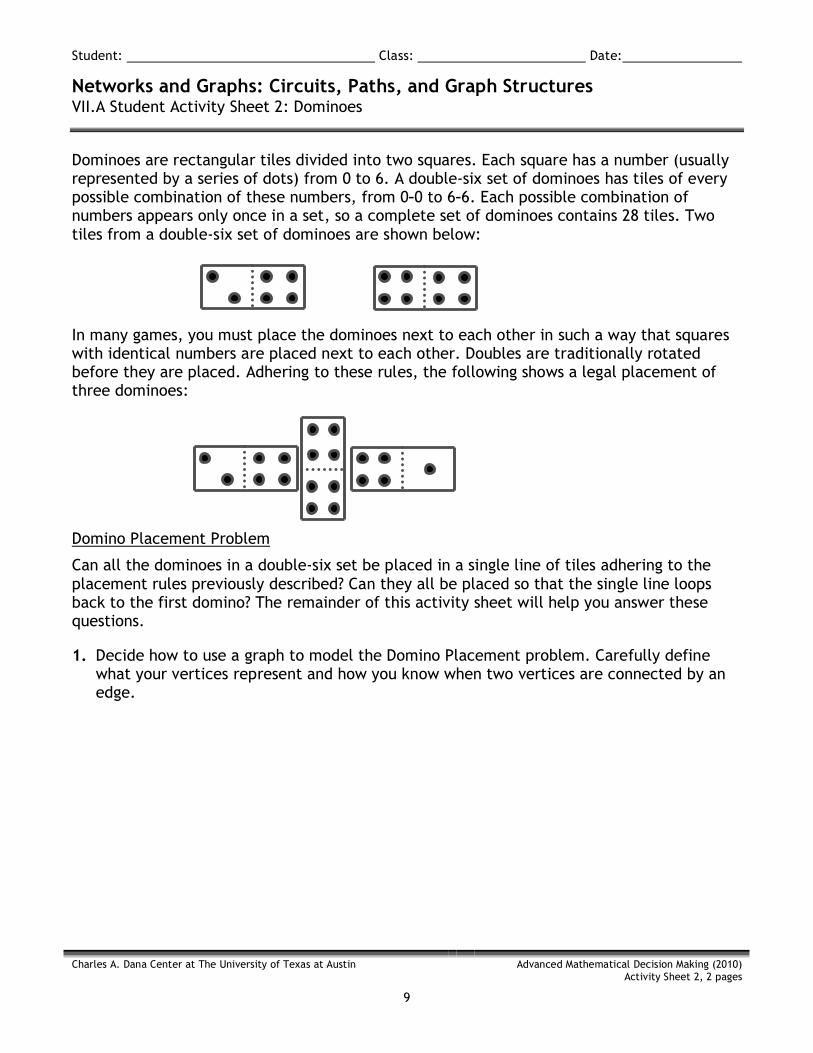
Dominoes are rectangular tiles divided into two squares. Each square has a number (usually represented by a series of dots) from 0 to 6. A double-six set of dominoes has tiles of every possible combination of these numbers, from 0–0 to 6–6. Each possible combination of numbers appears only once in a set, so a complete set of dominoes contains 28 tiles. Two tiles from a double-six set of dominoes are shown below:
In many games, you must place the dominoes next to each other in such a way that squares with identical numbers are placed next to each other. Doubles are traditionally rotated before they are placed. Adhering to these rules, the following shows a legal placement of three dominoes: Domino Placement Problem
Can all the dominoes in a double-six set be placed in a single line of tiles adhering to the placement rules previously described? Can they all be placed so that the single line loops back to the first domino? The remainder of this activity sheet will help you answer these questions.
1. Decide how to use a graph to model the Domino Placement problem. Carefully define what your vertices represent and how you know when two vertices are connected by an edge.
Student: Class: Date:
Networks and Graphs: Circuits, Paths, and Graph Structures VII.A Student Activity Sheet 2: Dominoes
Charles A. Dana Center at The University of Texas at Austin
Advanced Mathematical Decision Making (2010) Activity Sheet 2, 2 pages
10
2. Based on your model, restate the Domino Placement problem.
3. What type of previously solved problem in this unit is this problem related to?
4. Solve the Domino Placement problem.
Student: Class: Date:
Networks and Graphs: Circuits, Paths, and Graph Structures VII.A Student Activity Sheet 3: Weighted Graphs
Charles A. Dana Center at The University of Texas at Austin
Advanced Mathematical Decision Making (2010) Activity Sheet 3, 4 pages
11
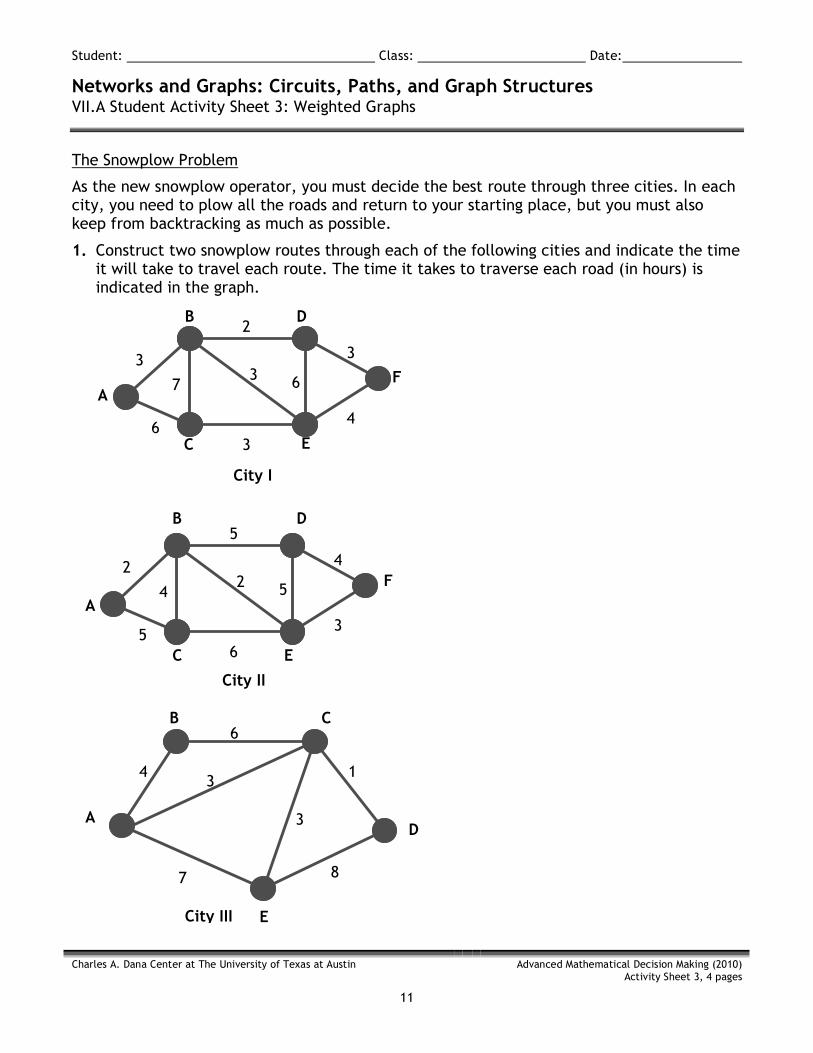
The Snowplow Problem
As the new snowplow operator, you must decide the best route through three cities. In each city, you need to plow all the roads and return to your starting place, but you must also keep from backtracking as much as possible.
1. Construct two snowplow routes through each of the following cities and indicate the time it will take to travel each route. The time it takes to traverse each road (in hours) is indicated in the graph.
City III
City II
City I
3
7
6 3
4
3
2
3 6 A
B D
F
E C
A
B
C
D
E
F
4 1
6
3
3
7 8
A
B C
D
E
2
4
5 6
3
4
5
2 5
Student: Class: Date:
Networks and Graphs: Circuits, Paths, and Graph Structures VII.A Student Activity Sheet 3: Weighted Graphs
Charles A. Dana Center at The University of Texas at Austin
Advanced Mathematical Decision Making (2010) Activity Sheet 3, 4 pages
12
2. REFLECTION: How would you solve the Snowplow problem for a graph that has no vertices of an odd degree?
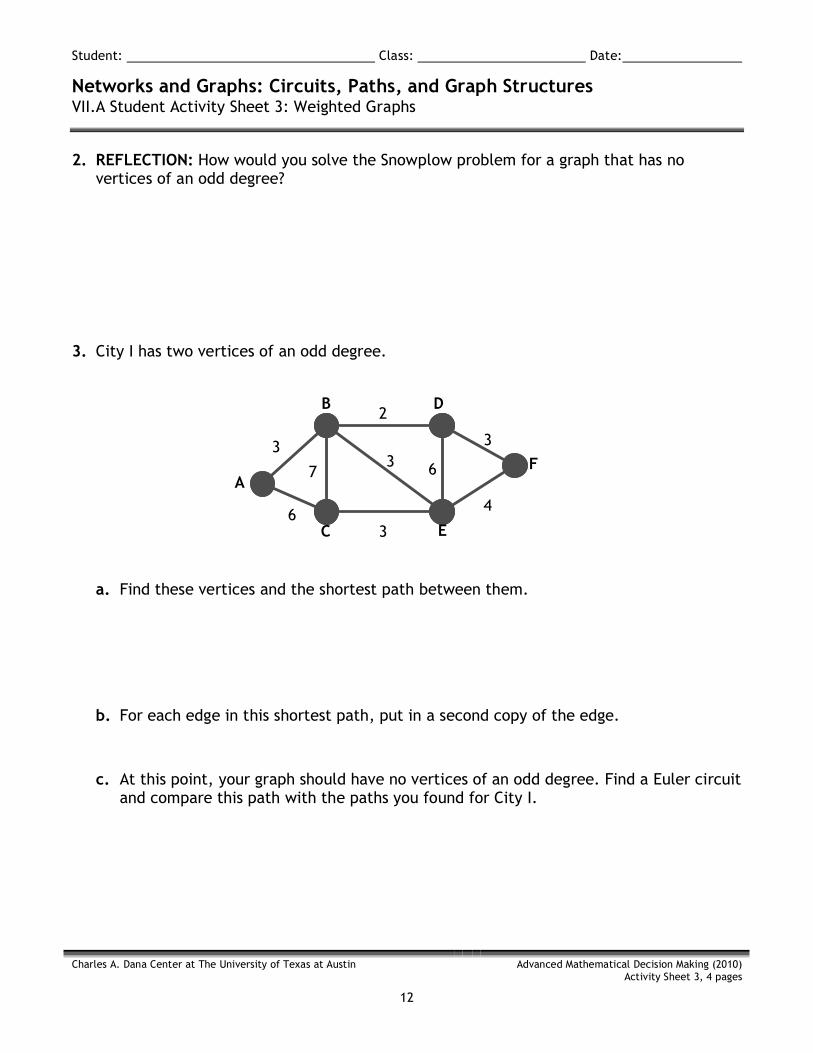
3. City I has two vertices of an odd degree.
a. Find these vertices and the shortest path between them.
b. For each edge in this shortest path, put in a second copy of the edge.
c. At this point, your graph should have no vertices of an odd degree. Find a Euler circuit and compare this path with the paths you found for City I.
3
7
6 3
4
3
2
3 6 A
B D
F
E C
Student: Class: Date:
Networks and Graphs: Circuits, Paths, and Graph Structures VII.A Student Activity Sheet 3: Weighted Graphs
Charles A. Dana Center at The University of Texas at Austin
Advanced Mathematical Decision Making (2010) Activity Sheet 3, 4 pages
13
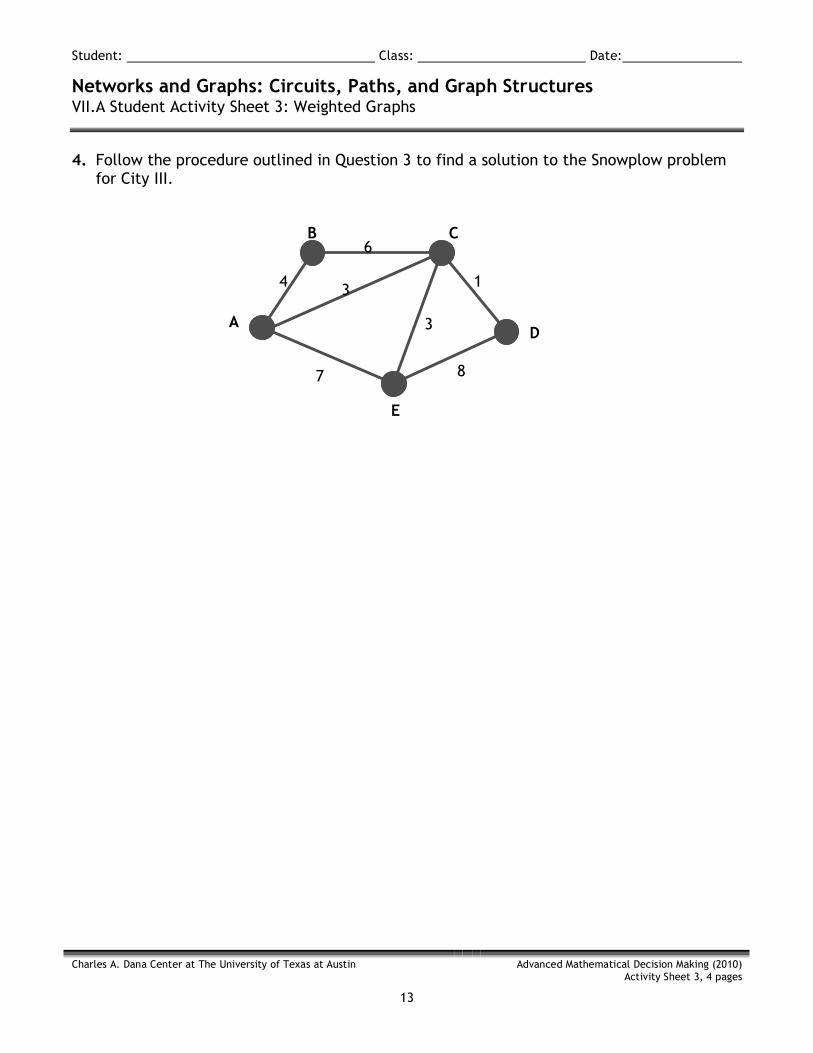
4. Follow the procedure outlined in Question 3 to find a solution to the Snowplow problem for City III.
4 1
6
3
3
7 8
A
B C
D
E

Student: Class: Date:
Networks and Graphs: Circuits, Paths, and Graph Structures VII.A Student Activity Sheet 3: Weighted Graphs
Charles A. Dana Center at The University of Texas at Austin
Advanced Mathematical Decision Making (2010) Activity Sheet 3, 4 pages
14
5. EXTENSION: Prior to the beginning of school, a huge task occurs at almost every school in the nation—cleaning the floors! Whether it be waxing, steam cleaning, or mopping, it is critical that the floors be ready for the first day of school. Your task is to design the plan for this cleaning project.
• Draw a graph of the hallways in your school or portion of your school (at least six edges).
• Assign weights to each edge according to the width and length of the corresponding hallway and how long it will take to complete that edge or hallway.
Design a path through your school or portion of your school and determine the total number of hours required to complete the cleaning of the floors. Be prepared to share your design with the class.
Student: Class: Date:
Networks and Graphs: Circuits, Paths, and Graph Structures VII.A Student Activity Sheet 4: Hamiltonian Circuits and Paths
Charles A. Dana Center at The University of Texas at Austin
Advanced Mathematical Decision Making (2010) Activity Sheet 4, 4 pages
15
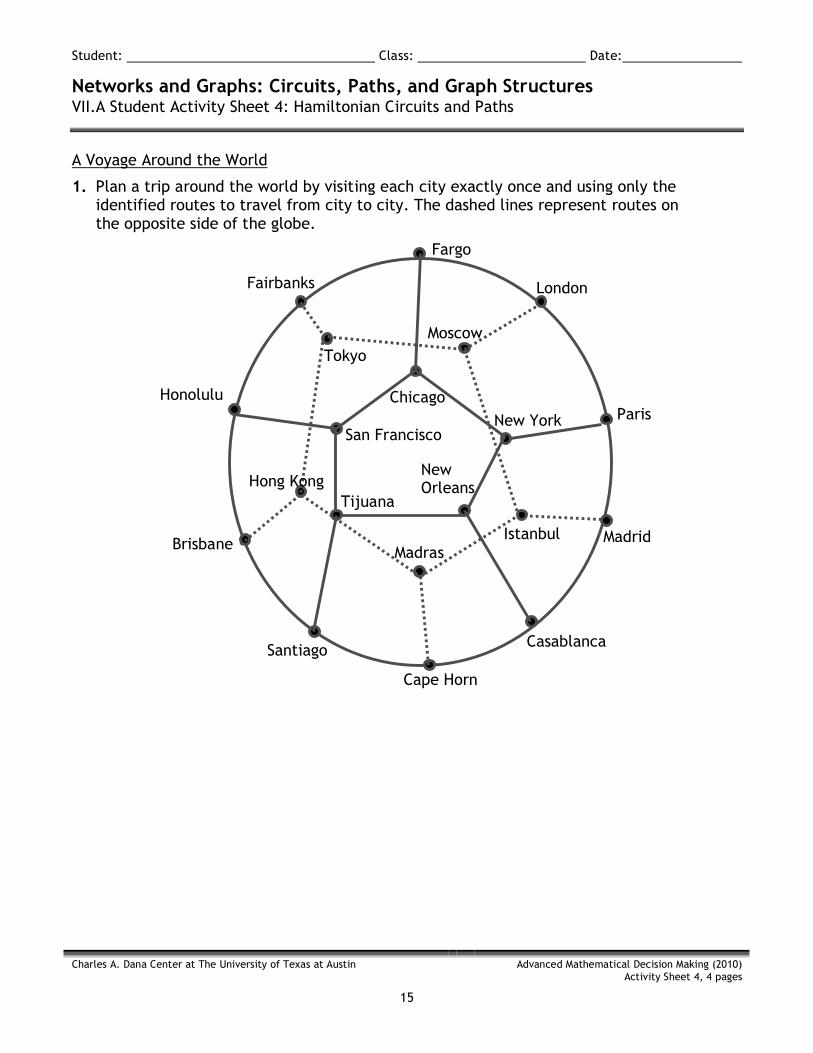
A Voyage Around the World
1. Plan a trip around the world by visiting each city exactly once and using only the identified routes to travel from city to city. The dashed lines represent routes on the opposite side of the globe.
Fargo
Paris San Francisco
Chicago New York
Cape Horn
Santiago
Tijuana
Madrid
Casablanca
New Orleans
Honolulu
Tokyo
Hong Kong
Madras Istanbul
Fairbanks London
Moscow
Brisbane
Student: Class: Date:
Networks and Graphs: Circuits, Paths, and Graph Structures VII.A Student Activity Sheet 4: Hamiltonian Circuits and Paths
Charles A. Dana Center at The University of Texas at Austin
Advanced Mathematical Decision Making (2010) Activity Sheet 4, 4 pages
16
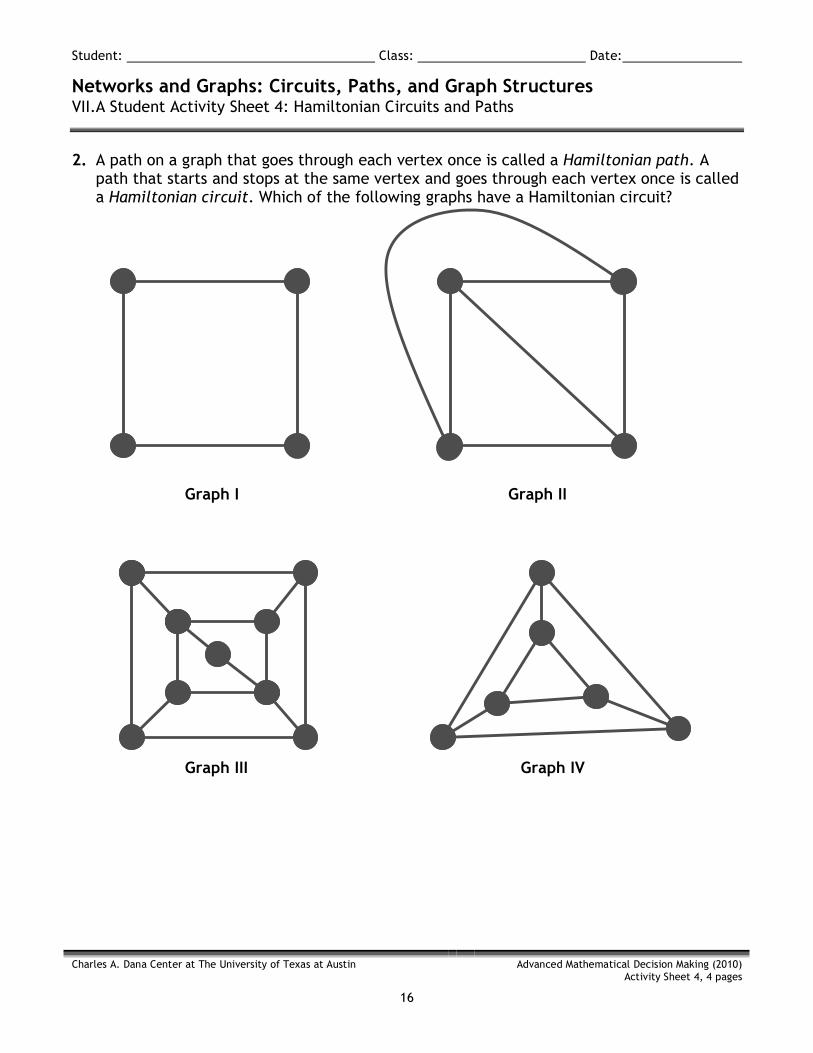
2. A path on a graph that goes through each vertex once is called a Hamiltonian path. A path that starts and stops at the same vertex and goes through each vertex once is called a Hamiltonian circuit. Which of the following graphs have a Hamiltonian circuit?
Graph I
Graph IV Graph III
Graph II

Student: Class: Date:
Networks and Graphs: Circuits, Paths, and Graph Structures VII.A Student Activity Sheet 4: Hamiltonian Circuits and Paths
Charles A. Dana Center at The University of Texas at Austin
Advanced Mathematical Decision Making (2010) Activity Sheet 4, 4 pages
17
3. Form a conjecture about when you think a graph might have a Hamiltonian circuit.
4. Share your conjecture with others and try to find examples of graphs that disprove your conjecture. These are called counterexamples.
Student: Class: Date:
Networks and Graphs: Circuits, Paths, and Graph Structures VII.A Student Activity Sheet 4: Hamiltonian Circuits and Paths
Charles A. Dana Center at The University of Texas at Austin
Advanced Mathematical Decision Making (2010) Activity Sheet 4, 4 pages
18
5. REFLECTION: Compare and contrast a Euler circuit and a Hamiltonian circuit.
6. EXTENSION: Describe a situation (other than travel) that requires a Hamiltonian circuit exist, but not a Euler circuit. Include either a diagram and graph or similar diagrams that show the connection of the graph to the real situation. Provide any details necessary to connect to the real-world application of this learning.
Student: Class: Date:
Networks and Graphs: Circuits, Path, and Graph Structures VII.A Student Activity Sheet 5: Knight’s Tour
Charles A. Dana Center at The University of Texas at Austin
Advanced Mathematical Decision Making (2010) Activity Sheet 5, 2 pages
19
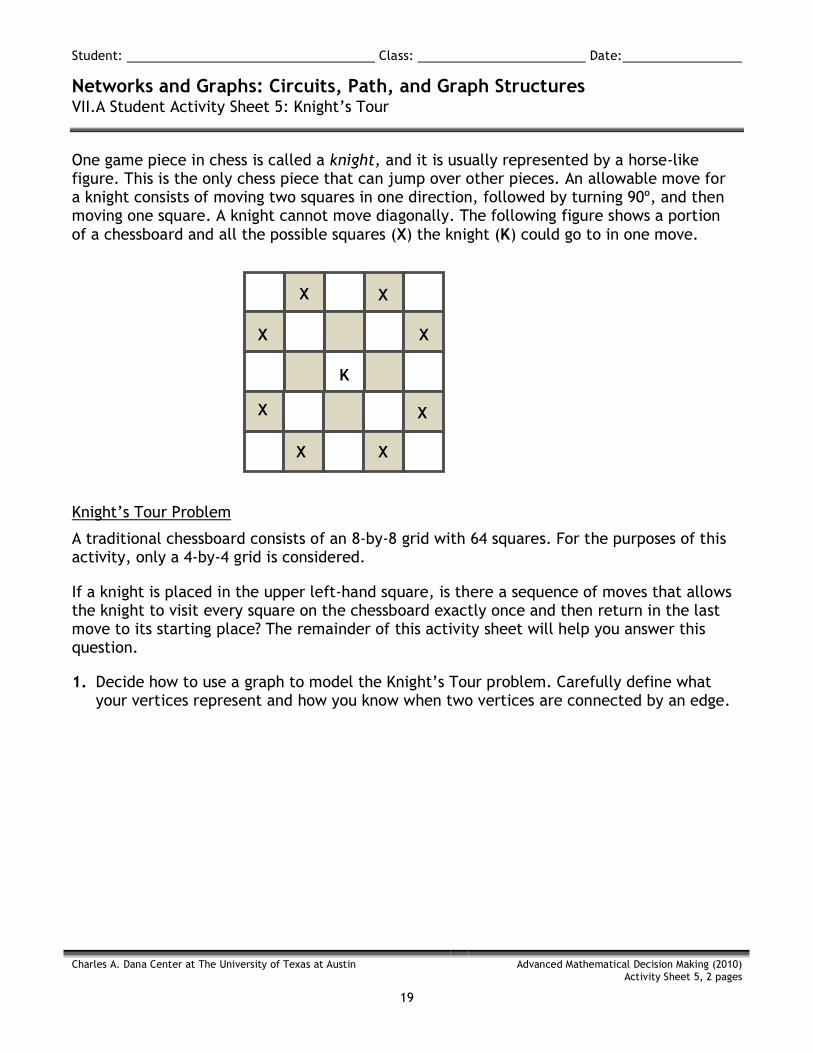
One game piece in chess is called a knight, and it is usually represented by a horse-like figure. This is the only chess piece that can jump over other pieces. An allowable move for a knight consists of moving two squares in one direction, followed by turning 90º, and then moving one square. A knight cannot move diagonally. The following figure shows a portion of a chessboard and all the possible squares (X) the knight (K) could go to in one move. Knight’s Tour Problem
A traditional chessboard consists of an 8-by-8 grid with 64 squares. For the purposes of this activity, only a 4-by-4 grid is considered.
If a knight is placed in the upper left-hand square, is there a sequence of moves that allows the knight to visit every square on the chessboard exactly once and then return in the last move to its starting place? The remainder of this activity sheet will help you answer this question.
1. Decide how to use a graph to model the Knight’s Tour problem. Carefully define what your vertices represent and how you know when two vertices are connected by an edge.
K
X X
X X
X X
X X
Student: Class: Date:
Networks and Graphs: Circuits, Path, and Graph Structures VII.A Student Activity Sheet 5: Knight’s Tour
Charles A. Dana Center at The University of Texas at Austin
Advanced Mathematical Decision Making (2010) Activity Sheet 5, 2 pages
20
2. Based on your model, restate the Knight’s Tour problem. 3. What type of previously encountered problem in this unit is this problem related to?
4. Solve the Knight’s Tour problem on a variety of smaller chessboards: 4 by 4, 5 by 5, or 3 by 6.
Student: Class: Date:
Networks and Graphs: Spanning Trees VII.B Student Activity Sheet 6: High-speed Internet
Charles A. Dana Center at The University of Texas at Austin
Advanced Mathematical Decision Making (2010) Activity Sheet 6, 4 pages
21
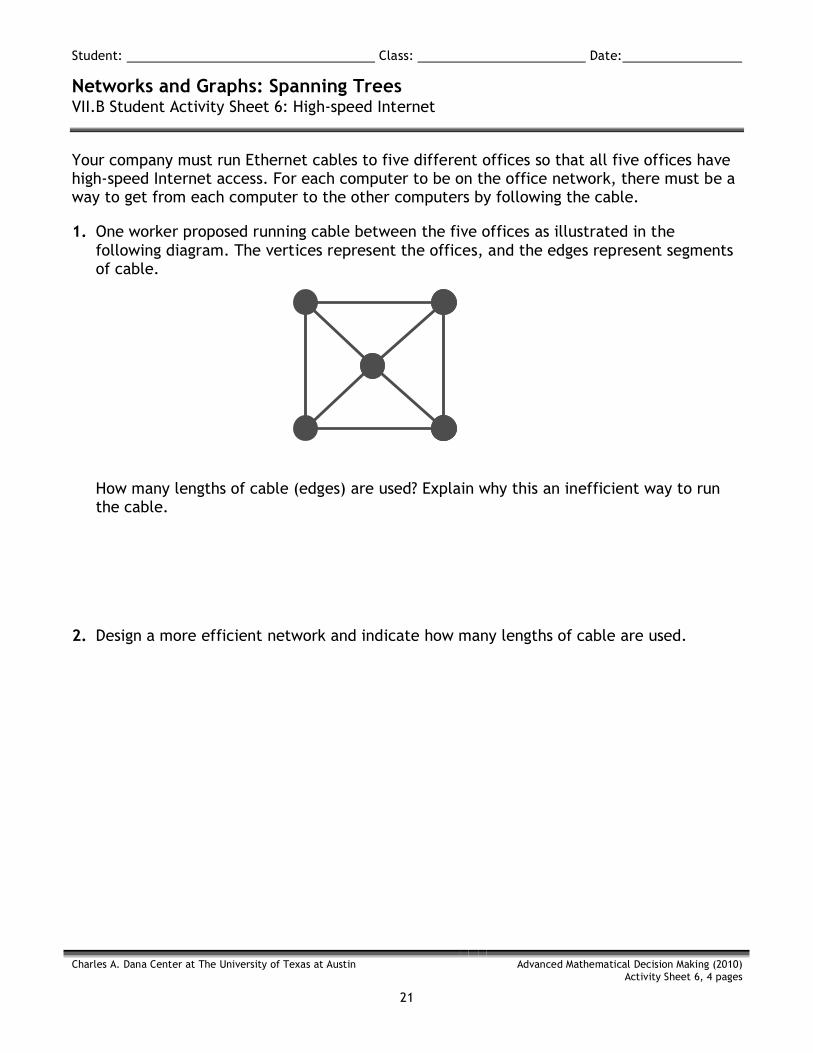
Your company must run Ethernet cables to five different offices so that all five offices have high-speed Internet access. For each computer to be on the office network, there must be a way to get from each computer to the other computers by following the cable.
1. One worker proposed running cable between the five offices as illustrated in the following diagram. The vertices represent the offices, and the edges represent segments of cable.
How many lengths of cable (edges) are used? Explain why this an inefficient way to run the cable.
2. Design a more efficient network and indicate how many lengths of cable are used.
Student: Class: Date:
Networks and Graphs: Spanning Trees VII.B Student Activity Sheet 6: High-speed Internet
Charles A. Dana Center at The University of Texas at Austin
Advanced Mathematical Decision Making (2010) Activity Sheet 6, 4 pages
22
3. Compare your efficient network with others in the class.
a. Did everyone use the same number of cable lengths?
b. Did everyone’s network have the same shape?
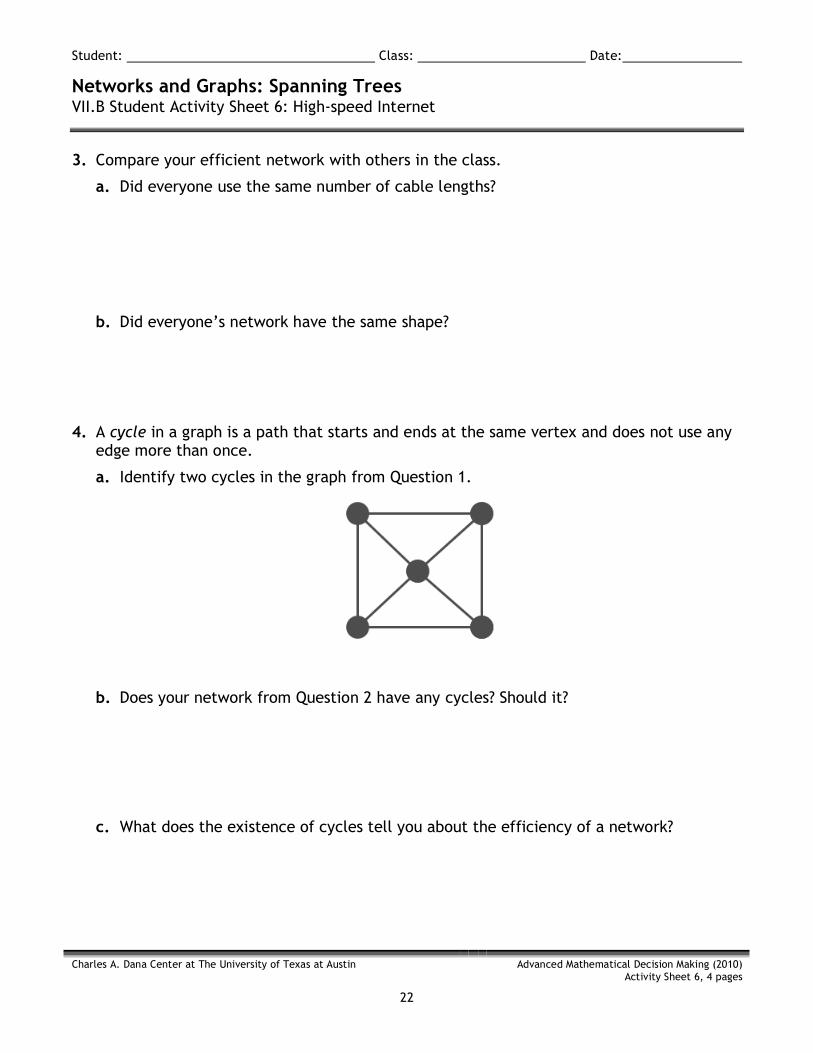
4. A cycle in a graph is a path that starts and ends at the same vertex and does not use any
edge more than once.
a. Identify two cycles in the graph from Question 1.
b. Does your network from Question 2 have any cycles? Should it?
c. What does the existence of cycles tell you about the efficiency of a network?
Student: Class: Date:
Networks and Graphs: Spanning Trees VII.B Student Activity Sheet 6: High-speed Internet
Charles A. Dana Center at The University of Texas at Austin
Advanced Mathematical Decision Making (2010) Activity Sheet 6, 4 pages
23
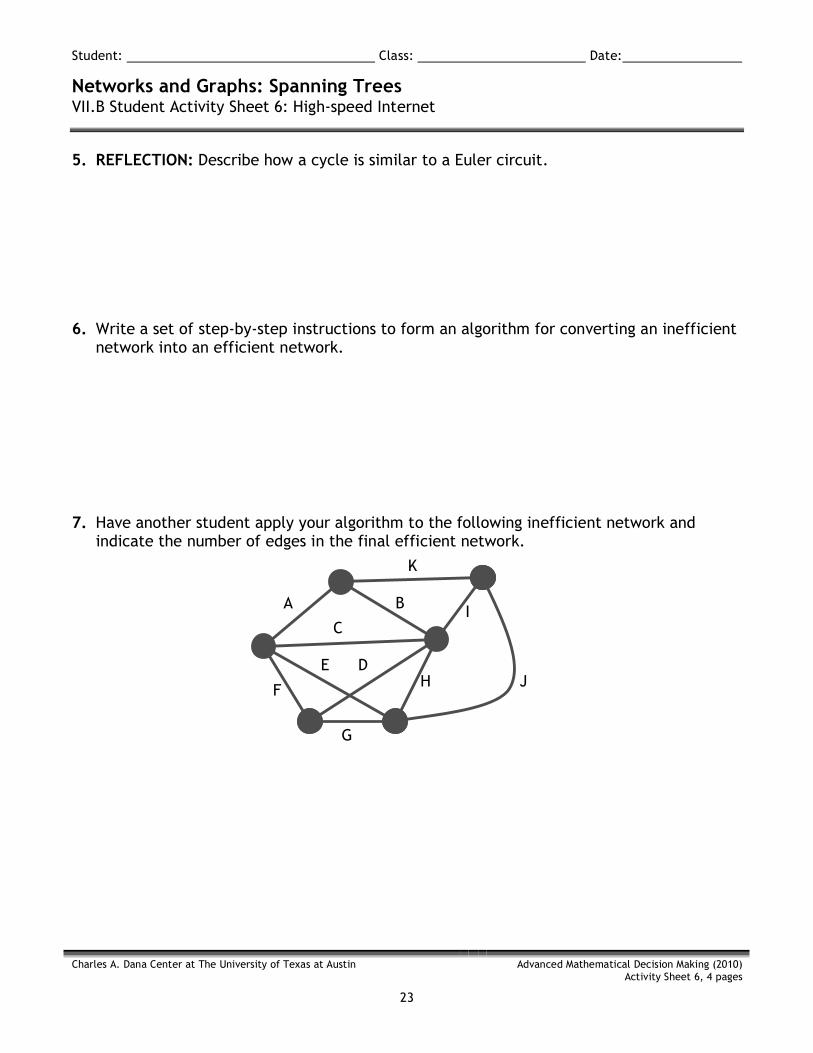
5. REFLECTION: Describe how a cycle is similar to a Euler circuit.
6. Write a set of step-by-step instructions to form an algorithm for converting an inefficient
network into an efficient network.
7. Have another student apply your algorithm to the following inefficient network and
indicate the number of edges in the final efficient network.
A B
C
D E
F
G
H
I
J
K
Student: Class: Date:
Networks and Graphs: Spanning Trees VII.B Student Activity Sheet 6: High-speed Internet
Charles A. Dana Center at The University of Texas at Austin
Advanced Mathematical Decision Making (2010) Activity Sheet 6, 4 pages
24
8. EXTENSION: Research other situations that might be modeled with graphs in such a way that cycles become important. Draw an efficient network for the situation (not a cable connection, of course!). Prepare a short presentation for the class.
Use the following questions as needed:
• Do all graphs have cycles? • Are the cycles unique?
Student: Class: Date:
Networks and Graphs: Spanning Trees VII.B Student Activity Sheet 7: Minimal Spanning Trees
Charles A. Dana Center at The University of Texas at Austin
Advanced Mathematical Decision Making (2010) Activity Sheet 7, 4 pages
25
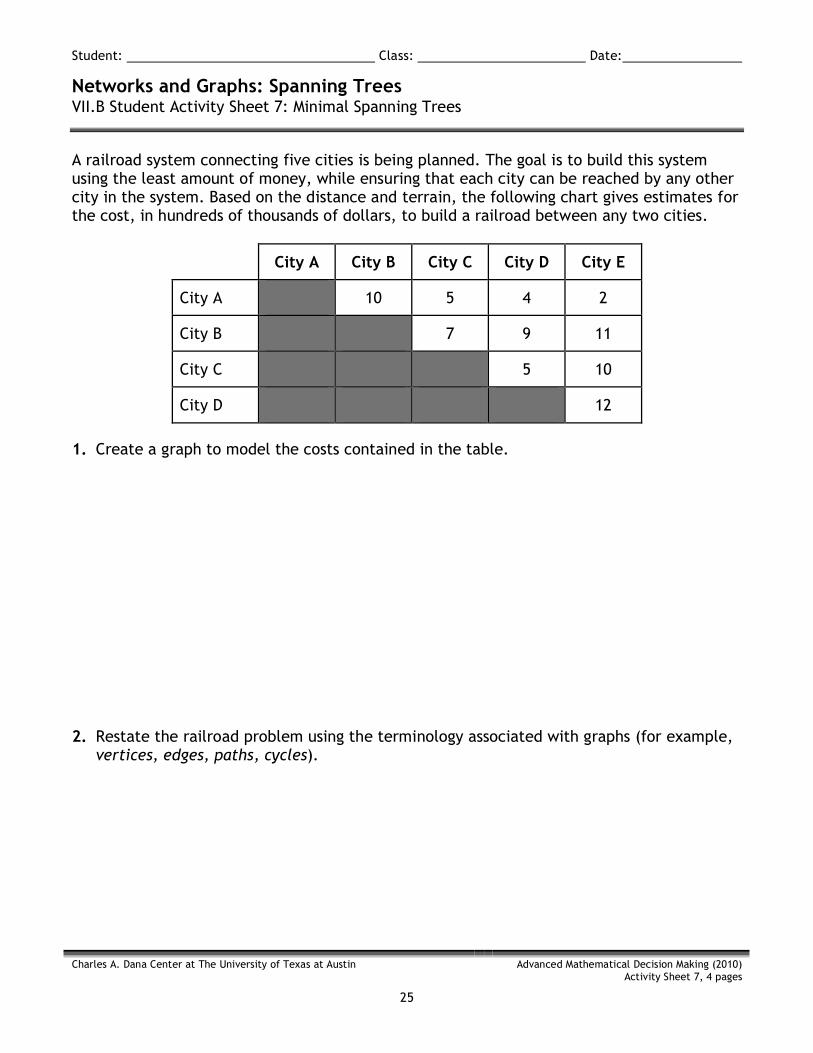
A railroad system connecting five cities is being planned. The goal is to build this system using the least amount of money, while ensuring that each city can be reached by any other city in the system. Based on the distance and terrain, the following chart gives estimates for the cost, in hundreds of thousands of dollars, to build a railroad between any two cities.
City A City B City C City D City E
City A 10 5 4 2
City B 7 9 11
City C 5 10
City D 12
1. Create a graph to model the costs contained in the table.
2. Restate the railroad problem using the terminology associated with graphs (for example,
vertices, edges, paths, cycles).
Student: Class: Date:
Networks and Graphs: Spanning Trees VII.B Student Activity Sheet 7: Minimal Spanning Trees
Charles A. Dana Center at The University of Texas at Austin
Advanced Mathematical Decision Making (2010) Activity Sheet 7, 4 pages
26
3. Construct two different graphs that represent possible railroad networks, and calculate the total cost to build each rail system.
4. What rail system leads to the lowest construction cost?

Student: Class: Date:
Networks and Graphs: Spanning Trees VII.B Student Activity Sheet 7: Minimal Spanning Trees
Charles A. Dana Center at The University of Texas at Austin
Advanced Mathematical Decision Making (2010) Activity Sheet 7, 4 pages
27
5. How did you arrive at the most efficient rail system? State your answer in a step-by-step algorithm that someone else could follow.
6. The numbers in the following graphs depict the cost associated with building a railroad
between cities represented by vertices. For each graph, test your algorithm. Does it yield the most efficient network? If not, try modifying your algorithm.
Network I Network II
2 7
9
5
4
4 6
8 5 8
10 7
9
5
8
4 6
8 5 6
Student: Class: Date:
Networks and Graphs: Spanning Trees VII.B Student Activity Sheet 7: Minimal Spanning Trees
Charles A. Dana Center at The University of Texas at Austin
Advanced Mathematical Decision Making (2010) Activity Sheet 7, 4 pages
28
7. REFLECTION: Given any weighted graph (like the ones from this activity), does an efficient network of minimal cost always exist? Why or why not?
8. EXTENSION: What other real-world problems might be solved by creating and analyzing graphs with weighted edges? Conduct research to respond to this question, and prepare a short presentation for the class.
Student: Class: Date:
Networks and Graphs: Spanning Trees VII.B Student Activity Sheet 8: Kruskal’s Algorithm
Charles A. Dana Center at The University of Texas at Austin
Advanced Mathematical Decision Making (2010) Activity Sheet 8, 4 pages
29
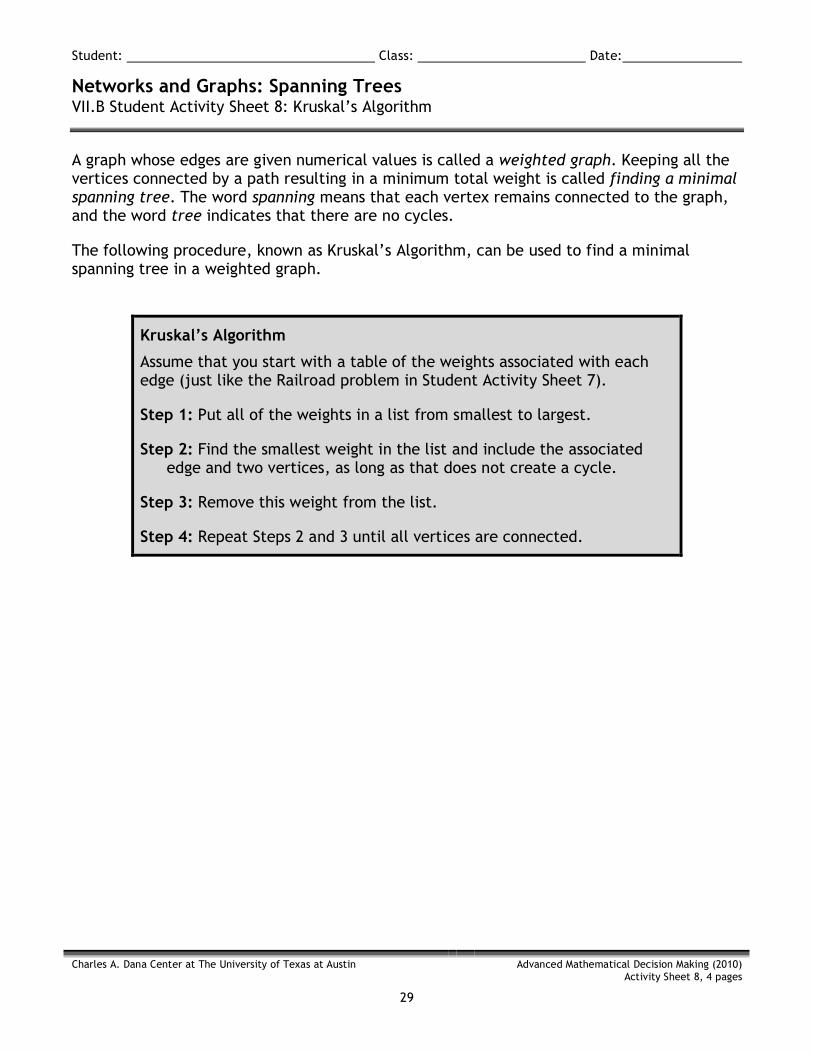
A graph whose edges are given numerical values is called a weighted graph. Keeping all the vertices connected by a path resulting in a minimum total weight is called finding a minimal spanning tree. The word spanning means that each vertex remains connected to the graph, and the word tree indicates that there are no cycles.
The following procedure, known as Kruskal’s Algorithm, can be used to find a minimal spanning tree in a weighted graph.
Kruskal’s Algorithm
Assume that you start with a table of the weights associated with each edge (just like the Railroad problem in Student Activity Sheet 7).
Step 1: Put all of the weights in a list from smallest to largest.
Step 2: Find the smallest weight in the list and include the associated edge and two vertices, as long as that does not create a cycle.
Step 3: Remove this weight from the list.
Step 4: Repeat Steps 2 and 3 until all vertices are connected.
Student: Class: Date:
Networks and Graphs: Spanning Trees VII.B Student Activity Sheet 8: Kruskal’s Algorithm
Charles A. Dana Center at The University of Texas at Austin
Advanced Mathematical Decision Making (2010) Activity Sheet 8, 4 pages
30
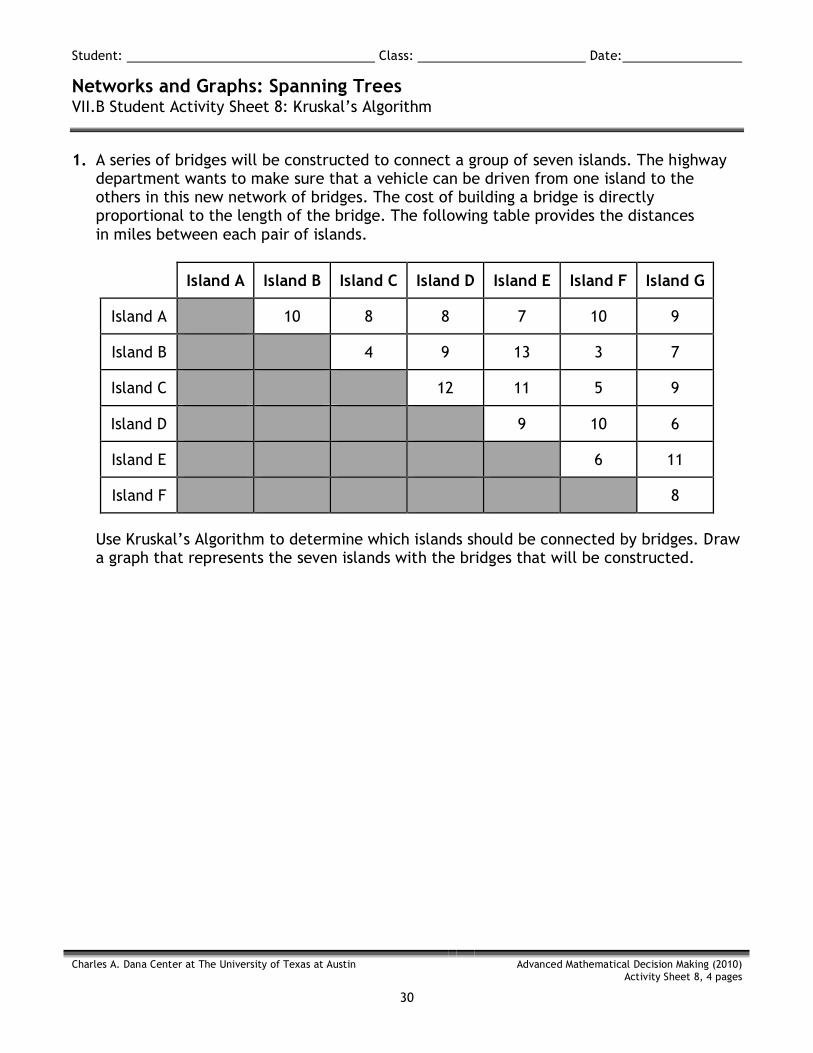
1. A series of bridges will be constructed to connect a group of seven islands. The highway department wants to make sure that a vehicle can be driven from one island to the others in this new network of bridges. The cost of building a bridge is directly proportional to the length of the bridge. The following table provides the distances in miles between each pair of islands.
Island A Island B Island C Island D Island E Island F Island G
Island A 10 8 8 7 10 9
Island B 4 9 13 3 7
Island C 12 11 5 9
Island D 9 10 6
Island E 6 11
Island F 8
Use Kruskal’s Algorithm to determine which islands should be connected by bridges. Draw a graph that represents the seven islands with the bridges that will be constructed.
Student: Class: Date:
Networks and Graphs: Spanning Trees VII.B Student Activity Sheet 8: Kruskal’s Algorithm
Charles A. Dana Center at The University of Texas at Austin
Advanced Mathematical Decision Making (2010) Activity Sheet 8, 4 pages
31
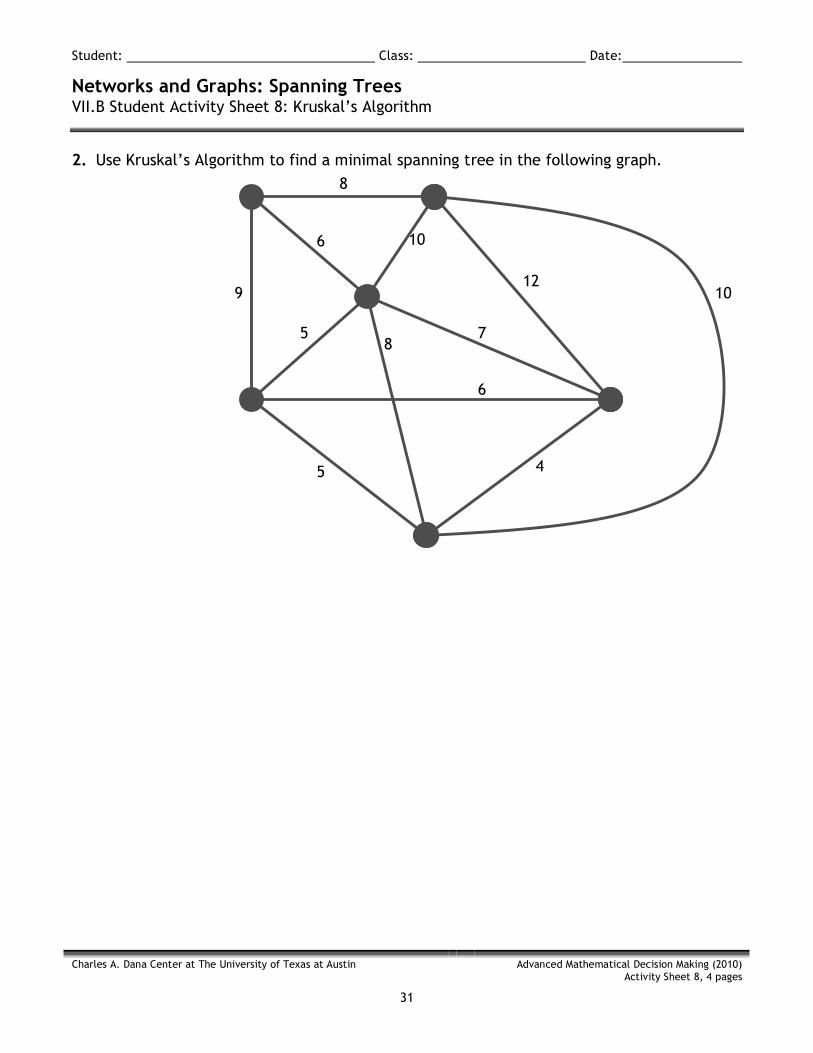
2. Use Kruskal’s Algorithm to find a minimal spanning tree in the following graph.
9
8
6 10
10 12
7 8
5
6
5 4
Student: Class: Date:
Networks and Graphs: Spanning Trees VII.B Student Activity Sheet 8: Kruskal’s Algorithm
Charles A. Dana Center at The University of Texas at Austin
Advanced Mathematical Decision Making (2010) Activity Sheet 8, 4 pages
32
3. REFLECTION: Do all graphs have spanning trees? Are spanning trees unique?
4. EXTENSION: Other algorithms exist for arriving at a minimal spanning tree. Conduct research to find one and share it with your class through a brief presentation. Compare and contrast your findings with Kruskal’s Algorithm as appropriate.
Student: Class: Date:
Networks and Graphs: Graph Coloring VII.C Student Activity Sheet 9: Map Coloring
Charles A. Dana Center at The University of Texas at Austin
Advanced Mathematical Decision Making (2010) Activity Sheet 9, 3 pages
33
Map Coloring Problem
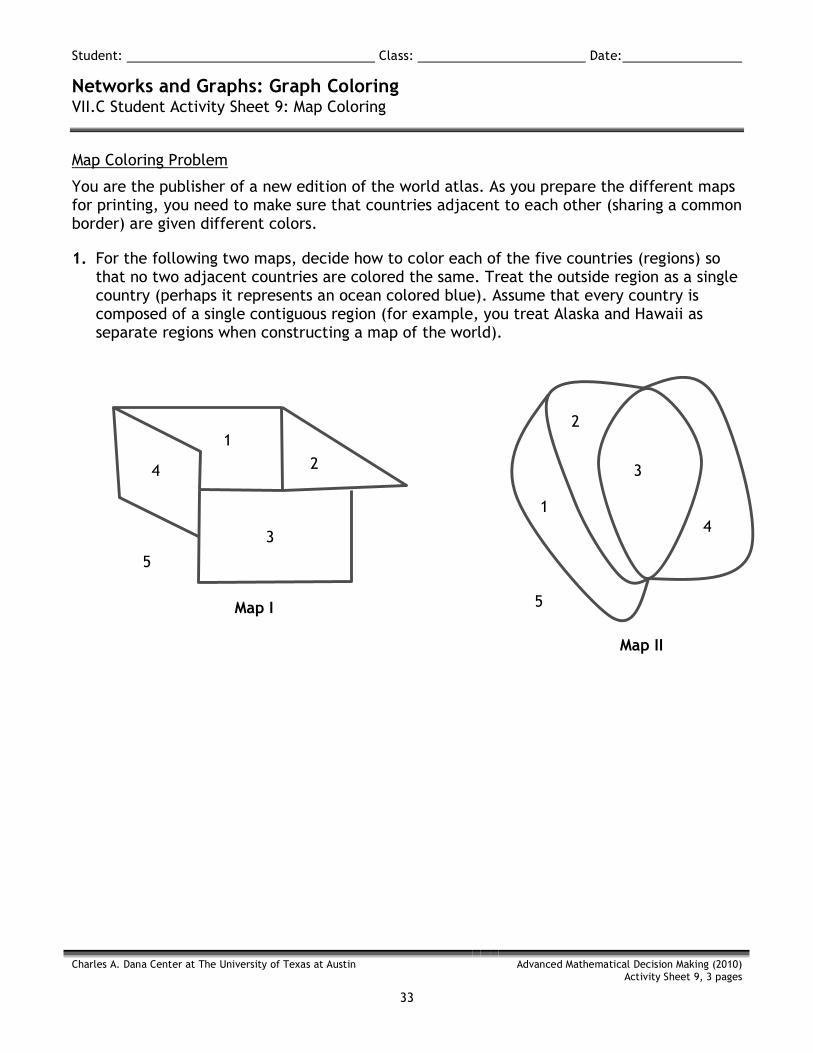
You are the publisher of a new edition of the world atlas. As you prepare the different maps for printing, you need to make sure that countries adjacent to each other (sharing a common border) are given different colors.
1. For the following two maps, decide how to color each of the five countries (regions) so that no two adjacent countries are colored the same. Treat the outside region as a single country (perhaps it represents an ocean colored blue). Assume that every country is composed of a single contiguous region (for example, you treat Alaska and Hawaii as separate regions when constructing a map of the world).
Map I
Map II
1 2
3
4
5
1
2
3
4
5
Student: Class: Date:
Networks and Graphs: Graph Coloring VII.C Student Activity Sheet 9: Map Coloring
Charles A. Dana Center at The University of Texas at Austin
Advanced Mathematical Decision Making (2010) Activity Sheet 9, 3 pages
34
2. How many colors did you use to color each map?
3. REFLECTION: Did you use fewer colors than anyone else? If not, describe how you can adjust your map to use fewer colors. If yes, how are you confident that the fewest colors have been used that can be?
4. If you want to color each map using the least number of colors (still keeping adjacent regions separate colors), how many colors are needed for each map?
Student: Class: Date:
Networks and Graphs: Graph Coloring VII.C Student Activity Sheet 9: Map Coloring
Charles A. Dana Center at The University of Texas at Austin
Advanced Mathematical Decision Making (2010) Activity Sheet 9, 3 pages
35
5. Create a map that requires the use of three colors.
6. Create a map with at least four different regions that could be colored with two colors.
7. EXTENSION: Create a map that needs five colors. What is the largest number of colors required to color any map, that keeps adjacent regions separate? Justify your response.
Student: Class: Date:
Networks and Graphs: Graph Coloring VII.C Student Activity Sheet 10: Coloring Maps and Scheduling
Charles A. Dana Center at The University of Texas at Austin
Advanced Mathematical Decision Making (2010) Activity Sheet 10, 8 pages
36
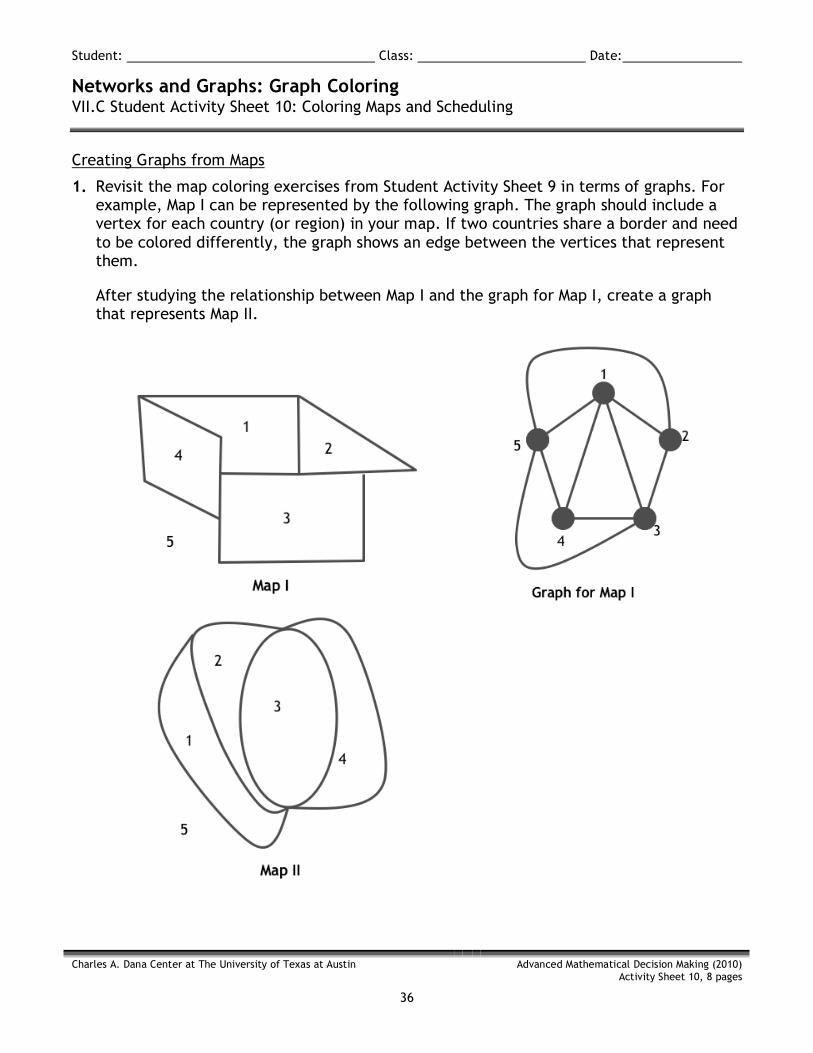
Creating Graphs from Maps
1. Revisit the map coloring exercises from Student Activity Sheet 9 in terms of graphs. For example, Map I can be represented by the following graph. The graph should include a vertex for each country (or region) in your map. If two countries share a border and need to be colored differently, the graph shows an edge between the vertices that represent them.
After studying the relationship between Map I and the graph for Map I, create a graph that represents Map II.
Student: Class: Date:
Networks and Graphs: Graph Coloring VII.C Student Activity Sheet 10: Coloring Maps and Scheduling
Charles A. Dana Center at The University of Texas at Austin
Advanced Mathematical Decision Making (2010) Activity Sheet 10, 8 pages
37
2. Restate the Map Coloring problem from Student Activity Sheet 9 in terms of a Graph Coloring problem.
You are the publisher of a new edition of the world atlas. As you prepare the different maps for printing, you need to make sure that countries adjacent to each other (sharing a common border) are given different colors.
3. Create a graph that requires three colors.
4. Create a graph that could be colored with two colors.
Student: Class: Date:
Networks and Graphs: Graph Coloring VII.C Student Activity Sheet 10: Coloring Maps and Scheduling
Charles A. Dana Center at The University of Texas at Austin
Advanced Mathematical Decision Making (2010) Activity Sheet 10, 8 pages
38
5. What types of graphs can always be colored with two colors?
6. EXTENSION: Create a graph that needs five colors, and then draw the associated map.

Student: Class: Date:
Networks and Graphs: Graph Coloring VII.C Student Activity Sheet 10: Coloring Maps and Scheduling
Charles A. Dana Center at The University of Texas at Austin
Advanced Mathematical Decision Making (2010) Activity Sheet 10, 8 pages
39
7. REFLECTION: When might a graph not correspond to a map?
8. The chromatic number of a graph is the minimum number of colors needed to color each vertex in such a way that any two vertices sharing an edge are a different color. Provide examples of graphs that have chromatic numbers of 3 and 4.

Student: Class: Date:
Networks and Graphs: Graph Coloring VII.C Student Activity Sheet 10: Coloring Maps and Scheduling
Charles A. Dana Center at The University of Texas at Austin
Advanced Mathematical Decision Making (2010) Activity Sheet 10, 8 pages
40
9. Give an example of a graph with 20 vertices that has a chromatic number of 2. Does your graph have any cycles? (Recall: A cycle is a path through the graph that starts and ends at the same vertex and does not reuse any edges.)

Student: Class: Date:
Networks and Graphs: Graph Coloring VII.C Student Activity Sheet 10: Coloring Maps and Scheduling
Charles A. Dana Center at The University of Texas at Austin
Advanced Mathematical Decision Making (2010) Activity Sheet 10, 8 pages
41
Scheduling Problem
Mrs. Jacobs, the new principal at Riverdale High School, wants to make a good impression by offering a lot of new exciting classes for her students. The principal plans to use her knowledge of graph theory to determine when each class will be offered.
Since she is trying to make her students happy, Mrs. Jacobs does not want to offer two different classes at the same time if there are students wanting to take both. She decides to construct a graph in the following way: Each class is represented by a vertex and if there is a student interested in two classes, those two vertices are connected by an edge.
10. Suppose there are five classes (A, B, C, D, and E) and only five students wishing to take the following classes:
• Jason wants to take Classes A and E. • Emory want to take Classes B, C, and E. • Felicity wants to take Classes A and D. • Geoff wants to take Classes B and C. • Hilary wants to take Classes D and E.
Construct the graph for the principal.
Student: Class: Date:
Networks and Graphs: Graph Coloring VII.C Student Activity Sheet 10: Coloring Maps and Scheduling
Charles A. Dana Center at The University of Texas at Austin
Advanced Mathematical Decision Making (2010) Activity Sheet 10, 8 pages
42
11. Find the chromatic number of the graph, and color the graph using the least number of colors.
12. How can the graph coloring solution help the principal with her scheduling problem?
Student: Class: Date:
Networks and Graphs: Graph Coloring VII.C Student Activity Sheet 10: Coloring Maps and Scheduling
Charles A. Dana Center at The University of Texas at Austin
Advanced Mathematical Decision Making (2010) Activity Sheet 10, 8 pages
43
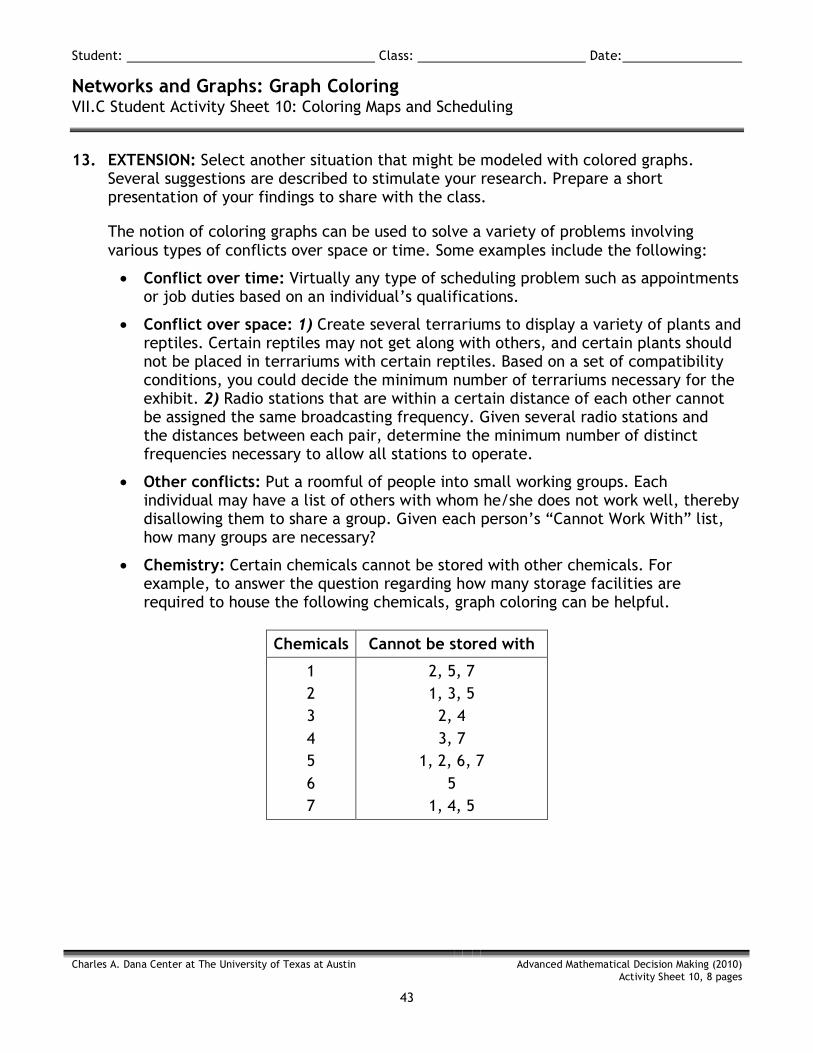
13. EXTENSION: Select another situation that might be modeled with colored graphs. Several suggestions are described to stimulate your research. Prepare a short presentation of your findings to share with the class.
The notion of coloring graphs can be used to solve a variety of problems involving various types of conflicts over space or time. Some examples include the following:
• Conflict over time: Virtually any type of scheduling problem such as appointments or job duties based on an individual’s qualifications.
• Conflict over space: 1) Create several terrariums to display a variety of plants and reptiles. Certain reptiles may not get along with others, and certain plants should not be placed in terrariums with certain reptiles. Based on a set of compatibility conditions, you could decide the minimum number of terrariums necessary for the exhibit. 2) Radio stations that are within a certain distance of each other cannot be assigned the same broadcasting frequency. Given several radio stations and the distances between each pair, determine the minimum number of distinct frequencies necessary to allow all stations to operate.
• Other conflicts: Put a roomful of people into small working groups. Each individual may have a list of others with whom he/she does not work well, thereby disallowing them to share a group. Given each person’s “Cannot Work With” list, how many groups are necessary?
• Chemistry: Certain chemicals cannot be stored with other chemicals. For example, to answer the question regarding how many storage facilities are required to house the following chemicals, graph coloring can be helpful.
Chemicals Cannot be stored with
1 2 3 4 5 6 7
2, 5, 7 1, 3, 5 2, 4 3, 7
1, 2, 6, 7 5
1, 4, 5
Student: Class: Date:
Networks and Graphs: Program Evaluation and Review Technique (PERT) Charts VII.D Student Activity Sheet 11: Activity Graphs
Charles A. Dana Center at The University of Texas at Austin
Advanced Mathematical Decision Making (2010) Activity Sheet 11, 7 pages
44
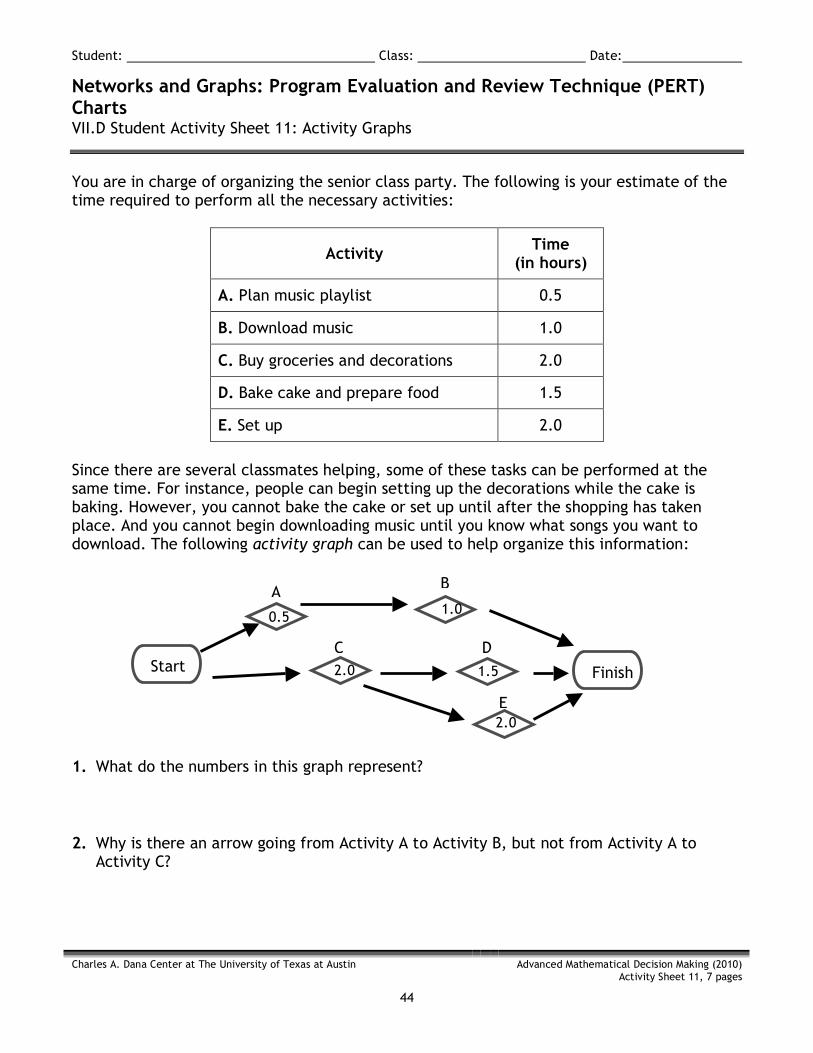
You are in charge of organizing the senior class party. The following is your estimate of the time required to perform all the necessary activities:
Activity Time (in hours)
A. Plan music playlist 0.5
B. Download music 1.0
C. Buy groceries and decorations 2.0
D. Bake cake and prepare food 1.5
E. Set up 2.0
Since there are several classmates helping, some of these tasks can be performed at the same time. For instance, people can begin setting up the decorations while the cake is baking. However, you cannot bake the cake or set up until after the shopping has taken place. And you cannot begin downloading music until you know what songs you want to download. The following activity graph can be used to help organize this information:
1. What do the numbers in this graph represent?
2. Why is there an arrow going from Activity A to Activity B, but not from Activity A to
Activity C?
Start Finish
B
C D
E
A
0.5 1.0
2.0 1.5
2.0
Student: Class: Date:
Networks and Graphs: Program Evaluation and Review Technique (PERT) Charts VII.D Student Activity Sheet 11: Activity Graphs
Charles A. Dana Center at The University of Texas at Austin
Advanced Mathematical Decision Making (2010) Activity Sheet 11, 7 pages
45
3. Beginning at Start, there are several paths through the graph (following the arrows) that end at Finish. For each path, calculate the total time required to perform all the activities along the path.
4. What is the minimum amount of time required to perform all five activities?
5. Which path corresponds to this minimum time? Which activities are along this path?
6. Which activities could take a little longer to complete without affecting the total
completion time?
Student: Class: Date:
Networks and Graphs: Program Evaluation and Review Technique (PERT) Charts VII.D Student Activity Sheet 11: Activity Graphs
Charles A. Dana Center at The University of Texas at Austin
Advanced Mathematical Decision Making (2010) Activity Sheet 11, 7 pages
46
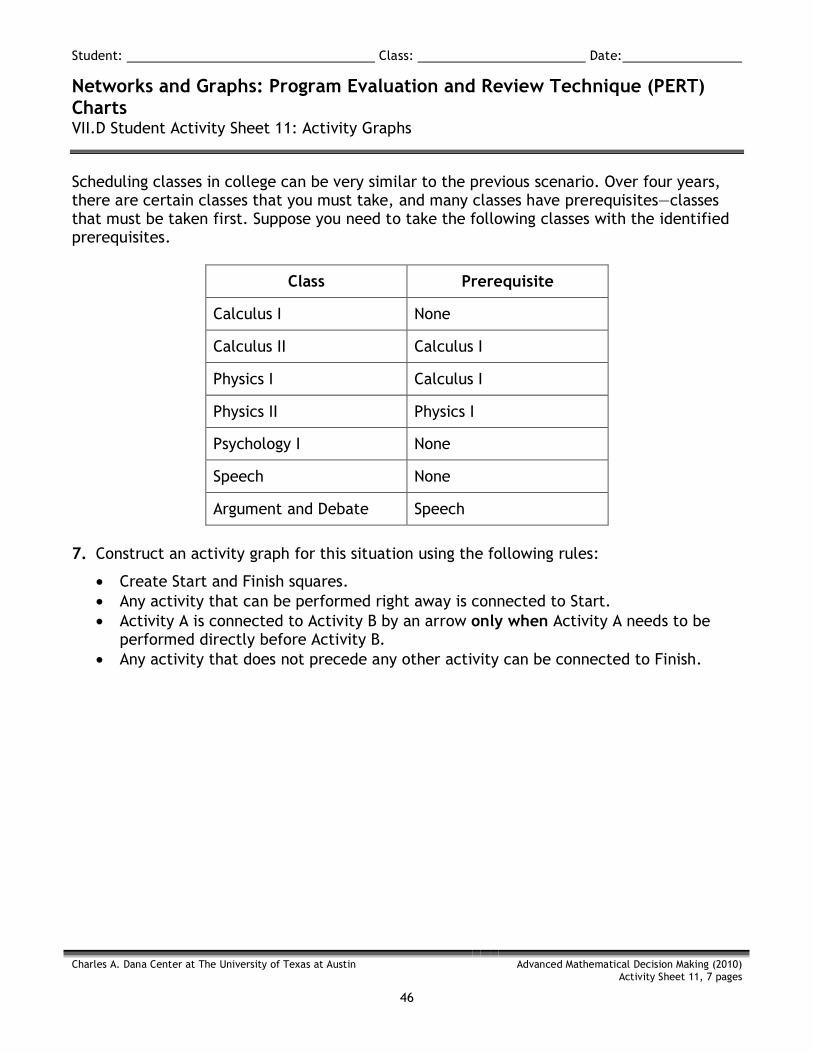
Scheduling classes in college can be very similar to the previous scenario. Over four years, there are certain classes that you must take, and many classes have prerequisites—classes that must be taken first. Suppose you need to take the following classes with the identified prerequisites.
Class Prerequisite
Calculus I None
Calculus II Calculus I
Physics I Calculus I
Physics II Physics I
Psychology I None
Speech None
Argument and Debate Speech
7. Construct an activity graph for this situation using the following rules:
• Create Start and Finish squares. • Any activity that can be performed right away is connected to Start. • Activity A is connected to Activity B by an arrow only when Activity A needs to be
performed directly before Activity B. • Any activity that does not precede any other activity can be connected to Finish.
Student: Class: Date:
Networks and Graphs: Program Evaluation and Review Technique (PERT) Charts VII.D Student Activity Sheet 11: Activity Graphs
Charles A. Dana Center at The University of Texas at Austin
Advanced Mathematical Decision Making (2010) Activity Sheet 11, 7 pages
47
8. Identify the longest path from Start to Finish. How long is this path?
9. If each class is a semester long, how many semesters are needed to take all these
classes?
10. If you want to finish these classes as soon as possible, which classes should you not
delay taking?
11. How long could you wait to take Psychology I without delaying your overall program of
classes?
12. How long could you wait to take Speech without delaying your overall program of
classes?
Student: Class: Date:
Networks and Graphs: Program Evaluation and Review Technique (PERT) Charts VII.D Student Activity Sheet 11: Activity Graphs
Charles A. Dana Center at The University of Texas at Austin
Advanced Mathematical Decision Making (2010) Activity Sheet 11, 7 pages
48
13. Given any activity graph like the previous ones, explain how you would determine the minimum time required to perform all activities.
14. Activities that cannot be delayed without increasing the minimum time for completion
are called critical activities. Given any activity graph like the previous ones, explain how you would determine which activities are critical activities.
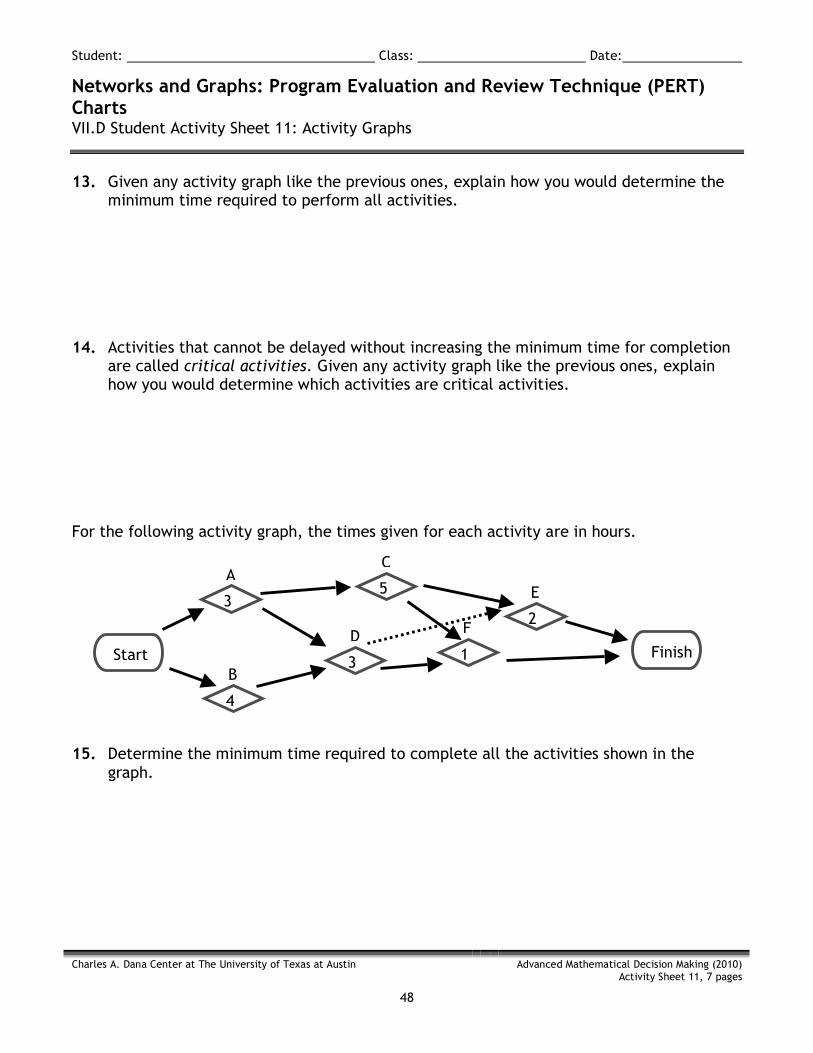
For the following activity graph, the times given for each activity are in hours.
15. Determine the minimum time required to complete all the activities shown in the graph.
Start Finish
A
3
B
4
C
5 E
2 D
3
F
1
Student: Class: Date:
Networks and Graphs: Program Evaluation and Review Technique (PERT) Charts VII.D Student Activity Sheet 11: Activity Graphs
Charles A. Dana Center at The University of Texas at Austin
Advanced Mathematical Decision Making (2010) Activity Sheet 11, 7 pages
49
16. Which activities are critical activities?
17. How long could Activity F be delayed without affecting the overall completion time?
18. How long could Activity D be delayed without affecting the overall completion time?
19. What if Activities F and D were both delayed?
Student: Class: Date:
Networks and Graphs: Program Evaluation and Review Technique (PERT) Charts VII.D Student Activity Sheet 11: Activity Graphs
Charles A. Dana Center at The University of Texas at Austin
Advanced Mathematical Decision Making (2010) Activity Sheet 11, 7 pages
50
20. REFLECTION: Can you find a formula that determines how long an individual activity could be delayed without affecting the total completion time for all the activities?
Sometimes the time to complete an activity is given by two numbers: the estimate for a minimum completion time and the estimate for a maximum completion time. How would having two possible completion times affect your analysis?
21. EXTENSION: Design a chart to represent the planning and design of a particular event at your school, (for example, Project Graduation, prom, fundraiser, community project). Prepare a short presentation including appropriate visuals to share with the class.
Student: Class: Date:
Networks and Graphs: Program Evaluation and Review Technique (PERT) Charts VII.D Student Activity Sheet 12: Building a Robot
Charles A. Dana Center at The University of Texas at Austin
Advanced Mathematical Decision Making (2010) Activity Sheet 12, 5 pages
51
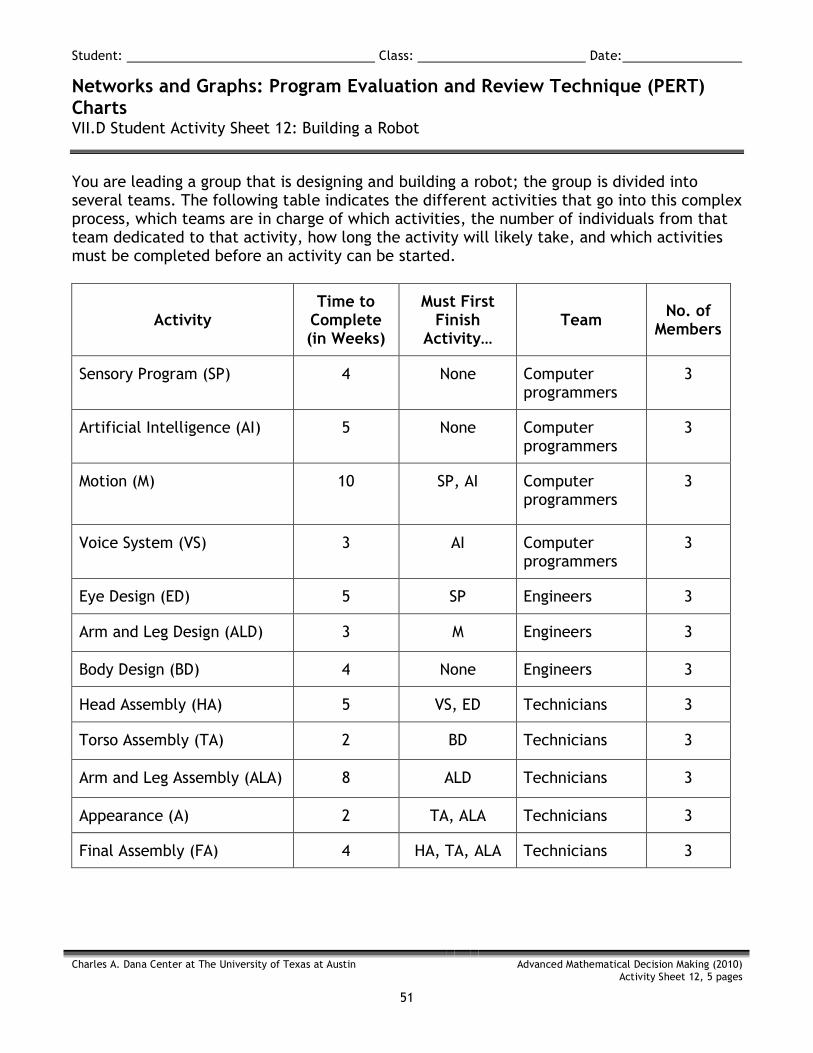
You are leading a group that is designing and building a robot; the group is divided into several teams. The following table indicates the different activities that go into this complex process, which teams are in charge of which activities, the number of individuals from that team dedicated to that activity, how long the activity will likely take, and which activities must be completed before an activity can be started.
Activity Time to
Complete (in Weeks)
Must First Finish
Activity… Team No. of
Members
Sensory Program (SP) 4 None Computer programmers
3
Artificial Intelligence (AI) 5 None Computer programmers
3
Motion (M) 10
SP, AI Computer programmers
3
Voice System (VS) 3 AI Computer programmers
3
Eye Design (ED) 5 SP Engineers 3
Arm and Leg Design (ALD) 3 M Engineers 3
Body Design (BD) 4 None Engineers 3
Head Assembly (HA) 5 VS, ED Technicians 3
Torso Assembly (TA) 2 BD Technicians 3
Arm and Leg Assembly (ALA) 8 ALD Technicians 3
Appearance (A) 2 TA, ALA Technicians 3
Final Assembly (FA) 4 HA, TA, ALA Technicians 3

Student: Class: Date:
Networks and Graphs: Program Evaluation and Review Technique (PERT) Charts VII.D Student Activity Sheet 12: Building a Robot
Charles A. Dana Center at The University of Texas at Austin
Advanced Mathematical Decision Making (2010) Activity Sheet 12, 5 pages
52
1. Using the information in the first three columns of the table, build an activity graph. Include Start and Finish boxes.
2. Assuming the times given for each activity are accurate, what is the minimum time
required to design and build the robot?
Student: Class: Date:
Networks and Graphs: Program Evaluation and Review Technique (PERT) Charts VII.D Student Activity Sheet 12: Building a Robot
Charles A. Dana Center at The University of Texas at Austin
Advanced Mathematical Decision Making (2010) Activity Sheet 12, 5 pages
53
3. At what point in the timeline does each activity (for the completion of the entire robot) begin and end?
4. Which of the 12 activities are critical activities?
Student: Class: Date:
Networks and Graphs: Program Evaluation and Review Technique (PERT) Charts VII.D Student Activity Sheet 12: Building a Robot
Charles A. Dana Center at The University of Texas at Austin
Advanced Mathematical Decision Making (2010) Activity Sheet 12, 5 pages
54
5. EXTENSION: Since any delay in the completion time for critical activities results in a longer total completion time, these activities may need extra people assigned to them. Suppose you can reassign team members to an activity according to the following guidelines:
• No one can work on an activity outside of his/her team. For example, a computer programmer must be assigned to Activity 1, 2, 3, or 4 and cannot be assigned to any of the other activities.
• Every activity must have at least one person assigned to it at all times. • An activity that receives extra help can be completed 1 week earlier for each
additional person assigned to it. • An activity cannot be completed in less than 1 week, even if more people are
assigned to it. • An activity takes 1 week longer to complete for each person removed from the
original group.
a. If you could reassign one person, how would you do it? How does the reassignment affect the total completion time?
b. If you could reassign two people, how would you do it? How do the reassignments affect the total completion time?
Student: Class: Date:
Networks and Graphs: Program Evaluation and Review Technique (PERT) Charts VII.D Student Activity Sheet 12: Building a Robot
Charles A. Dana Center at The University of Texas at Austin
Advanced Mathematical Decision Making (2010) Activity Sheet 12, 5 pages
55
c. If you could reassign any number of people, how would you do it? How do the reassignments affect the total completion time?
6. REFLECTION: Could the total completion time be further improved by allowing people to work on activities outside of their official team designation? Justify your response with appropriate reasoning.