network formation and disruption - an experiment...3 brangewitz, djawadi, endres, hoyer: network...
TRANSCRIPT


Network Formation and Disruption - An Experiment
Are efficient networks too complex?
Sonja Brangewitz, Behnud Mir Djawadi, Angelika Endres and Britta Hoyer
Paderborn University, Faculty of Business Administration and Economics
Warburger Str. 100, 33098 Paderborn, Germany
[ sbrangew | bdjawadi | aendres | bhoyer ] @mail.upb.de
April 12, 2017
Abstract
We experimentally study the emergence of networks under a known external threat. To be morespecific, we deal with the question if subjects in the role of a strategic Designer are able to form safeand efficient networks while facing a strategic Adversary who is going to attack their networks. Thisinvestigation relates theoretical predictions by Dziubinski and Goyal (2013) to actual observed behaviour.Varying the costs for protecting nodes, we designed and tested two treatments with different predictionsfor the equilibrium network. Furthermore, the influence of the subjects’ farsightedness on their decision-making process was elicited and analysed. We find that while subjects are able to build safe networksin both treatments, equilibrium networks are only built in one of the two treatments. In the othertreatment, predominantly safe networks are built but they are not efficient. Additionally, we find thatfarsightedness –as measured in our experiment– has no influence on whether subjects are able to buildsafe or efficient networks.
Keywords: Networks Experiment Network Design Network Defence Network Disruption
1

2Brangewitz, Djawadi, Endres, Hoyer:
Network Formation and Disruption - An Experiment
1 Introduction
Networks are ubiquitous in all fields of society and economy: Companies depend crucially on transportationand distribution networks whereas social relations and companies depend on communication or informationnetworks. Being a member of such an interconnected system often proves to be beneficial. For example,companies profit from networks in the form of supply chains due to the possibility to create and maintaincompetitive advantages (Pelliccia, 2015). Among others a network’s benefit depends on the network structureand the associated costs. The more players in the network, the more each player can potentially benefit fromthe connections. However, before benefiting from it, one first has to invest in building and maintaining linkswithin the network, which demands time and effort (Morbitzer et al, 2012). Next to its structure, the benefitof a network is also influenced by its reliability. Thus, if the network is easily destroyable, it might not beworth to invest in being part of the network. To guarantee the reliability of the network, the network itselfmust withstand attacks on its components. For example, attacks can happen as faults of the structure ofthe network itself, disturbances via individuals within the network, or external strategic or random attacks.Random attacks are often found in epidemiology (Cerdeiro et al, 2015) or in climatology in the form ofnatural disasters such as floods and earthquakes. Strategic attacks can target information, communicationor financial networks (Haller, 2016), for example, and can be conducted in the form of intelligent humanattacks such as terrorist attempts (Arce et al, 2012).
Attacks can be targeted at the nodes of the network or at its links and, thus, can have severe consequenceson the functioning of the network: Especially in complex network structures there exist inevitably specificnodes or links which are essential for the network to work. Attacks on these targets are often sufficient todisconnect the whole network (Kovenock and Roberson, 2015). An example for critical nodes in networksare servers which are threatened by viruses and cyber-attacks (Goyal et al, 2016). Critical link targets aretrade-paths between countries (Pelliccia, 2015), the wires of power grids or the pipes of oil systems, forexample. In all cases, an attack might affect the connectivity of the whole network.
In economics, network disruption has so far mainly been analysed in the context of its effect on networkformation. Thus, the main question is how the threat of an attack will influence the initial formation ofthe network. This work deals with this question by building on the theoretical work on strategic networkformation, which, in economics, has been founded by the seminal papers of Bala and Goyal (2000) andJackson and Wolinsky (1996). The streams of models based on these basic network formation modelsanalyse the influence of the threat of disruption on network formation and can be split into research aboutattacks on the links of the network (see, e.g., Bravard et al 2017, Hoyer and De Jaegher 2016 or Haller 2016)and research about attacks on the nodes of the network (see, e.g., Dziubinski and Goyal 2013, Dziubinski andGoyal 2017, Goyal and Vigier 2014, Cerdeiro et al 2015, Pelliccia 2015, or Kovenock and Roberson 2015).Additionally, Hoyer and De Jaegher (2012) analyse both link and node disruption in a decentralized modelof network formation, where the nodes themselves decide on links, and compare the results.
While this theoretical literature on network formation and the influence of disruption on the formationprocess is growing, there are only relatively few papers that address pure network formation models exper-imentally. Experiments on pure network formation building on the model by Bala and Goyal (2000) areCallander and Plott (2005), Falk and Kosfeld (2012), and Goeree et al (2009), for example. Using the modelof Jackson and Wolinsky (1996) as a basis, the laboratory experiment by Kirchsteiger et al (2016), sets itsfocus on analysing the impact of farsightedness on the ability to reach theoretically predicted stable networks.The experimental research on network formation models mostly confirms the theoretical findings identifyingthe star, the wheel or the empty network as stable and efficient networks. The only two papers we are awareof that investigate the influence of network disruption in an experiment are Hoyer and Rosenkranz (2015)and Goyal et al (2016). Hoyer and Rosenkranz (2015) test the link disruption introduced in the decentralizedmodel of Hoyer and De Jaegher (2012) in the laboratory. They find that in the treatment with a disruptor,subjects reach the circle network that is the highest paying equilibrium network less often than it would beexpected. Goyal et al (2016) conduct a field experiment in which the participants had to choose which otherparticipant to build a link to. They find that under decentralized network formation and network defencefacing the threat of contagion from node attacks, the participants form a dense network characterized bycentre-protected stars. While using different methods (laboratory vs. field experiment), both of these paperstest a model of decentralized network formation under the threat of disruption.
In opposition to this, we use the model by Dziubinski and Goyal (2013) as a theoretical foundation for thisexperiment, which is a centralized model of network formation under the threat of node attacks. To the bestof our knowledge, there is no other experiment that follows this approach. The theoretical model has clearpredictions of the equilibrium network depending on the cost ranges of link formation and node protection.

3Brangewitz, Djawadi, Endres, Hoyer:
Network Formation and Disruption - An Experiment
For rather low costs of link formation and rather high costs of node protection, the equilibrium network isa densely connected network with no protected nodes, whereas for rather low costs of node protection, theequilibrium network is a centre-protected star. While the theory has very clear predictions, what it cannotdeliver is showing whether network designers are actually able to reach these networks by building the mostefficient networks for different cost levels. Besides this, it gives no indication about the influence of the initialstarting network on the network formation process.
We therefore experimentally study the emergence of networks under a known external threat. To bemore specific, we deal with the question if subjects are able to form safe and efficient networks while facinga strategic Adversary. This investigation relates theoretical predictions proposed by Dziubinski and Goyal(2013) to actual observed behaviour. Our main objective is to analyse what kind of networks emerge underan external threat and to investigate if subjects are able to build safe and efficient networks. Additionally,subjects face different starting networks, so we can analyse whether the equilibrium networks may be reachedfrom any starting network. Besides investigating the network formation behaviour, we also analyse whetherthe subjects are able to cause a network disruption by finding and attacking weak spots in the network.Furthermore, the influence of the subjects’ farsightedness on their decision-making process is investigated.We find that while in both treatments subjects manage to build predominantly safe networks, efficientnetworks are built in only one of the two treatments. Furthermore, we find that there is no influence of thestarting network on their ability to design safe and efficient networks. Farsightedness –as measured in ourexperiment– has no influence on subjects’ decisions to build safe and efficient networks. However, experienceseems to be important, as those students who had experience in any form with network theory before theexperiment performed significantly better than their unexperienced counterparts.
The paper is structured as follows: First we describe the experimental set-up including a short review ofthe underlying theoretical model. Afterwards, we describe the research hypotheses in Section 2. Then wepresent and discuss the experimental results in Section 3. Finally, Section 4 provides the conclusion.
2 Experiment
2.1 Experimental Design
The theoretical foundation for this experimental analysis is the model of Dziubinski and Goyal (2013).They investigate network formation and disruption by means of node attacks. Their model comprises asequential-move game in which a Designer first designs a network by building links and allocating perfectdefence resources to the nodes knowing about the threat of an attack. Subsequently, an Adversary who hasperfect knowledge about the Designer’s decisions chooses a number of nodes to attack, whereas his attackbudget is exogenously specified. The final network after the attack is called the residual network. The modelprovides insights into preferable network structures given costly links and defence units and a threateningattack: Dziubinski and Goyal (2013) find that for low costs of defence relative to linking, the protectionin the network is centralized, the network is sparse, and linking is heterogeneous. For the case of highprotection costs relative to linking, the network is dense and linking is homogeneous. In Appendix A webriefly present a formal summary of this model in an already slightly adapted version to our experimentaldesign. In our experimental design we consider networks with n = 8 nodes and up to two possible attackska = 2 by the Adversary. Due to this relatively high number of nodes, the Designer has many possibilitiesto design the network. Moreover, it impedes the task insofar that the defence and attack strategies haveto be more thoroughly thought through, which reduces the chance of building equilibrium networks out ofrandom link settings.
The network experiment consists of two phases in which two players –the Designer and the Adversary–act sequentially. We randomly match all subjects in groups of two persons for the whole experiment. InPhase I, the Designer is shown four initial starting networks. The Designer designs his networks by settinglinks and by protecting nodes at cost c` > 0 and cd > 0. He builds his networks knowing that the Adversarysees all his formation and protection decisions after Phase I and is allowed to target up to two nodes of eachof his networks afterwards. In order to maximize his payoff, the Designer designs the networks to ensureconnectivity even after the attacks. Every connected network has the value of vD > 0 Taler for the Designer,from which the costs for links and defence are deducted. Any network that is no longer connected after anattack is worth zero to the Designer (and costs of link formation and protection are ignored). Furthermore,a network is also worth zero to the Designer if he uses all his budget of vD Taler for the network formationprocess. Within the experiment, the respective changes in the architecture as well as the potential payoff
4Brangewitz, Djawadi, Endres, Hoyer:
Network Formation and Disruption - An Experiment
Phase I (15 minutes):
Each subject in the role of theDesigner
• is presented four initial networks,
• may choose links to establish,
• may select nodes to protect,
• is informed about the (potential) pay-off of the networks.
-
Phase II (5 minutes):
Each subject in the role of theAdversary
• is presented networks designed by arandomly chosen other subject,
• may select nodes to attack.
Residual Networks and Payoffs:
Each subject sees the residual networks and final payoffs resulting from thedecisions in the role of the Designer and of the Adversary.
-
Figure 1: Experimental Design
of the residual network (if it resists the attack of the Adversary) are instantly displayed. For building thenetworks in Phase I, the Designer has a time restriction of 15 minutes.1
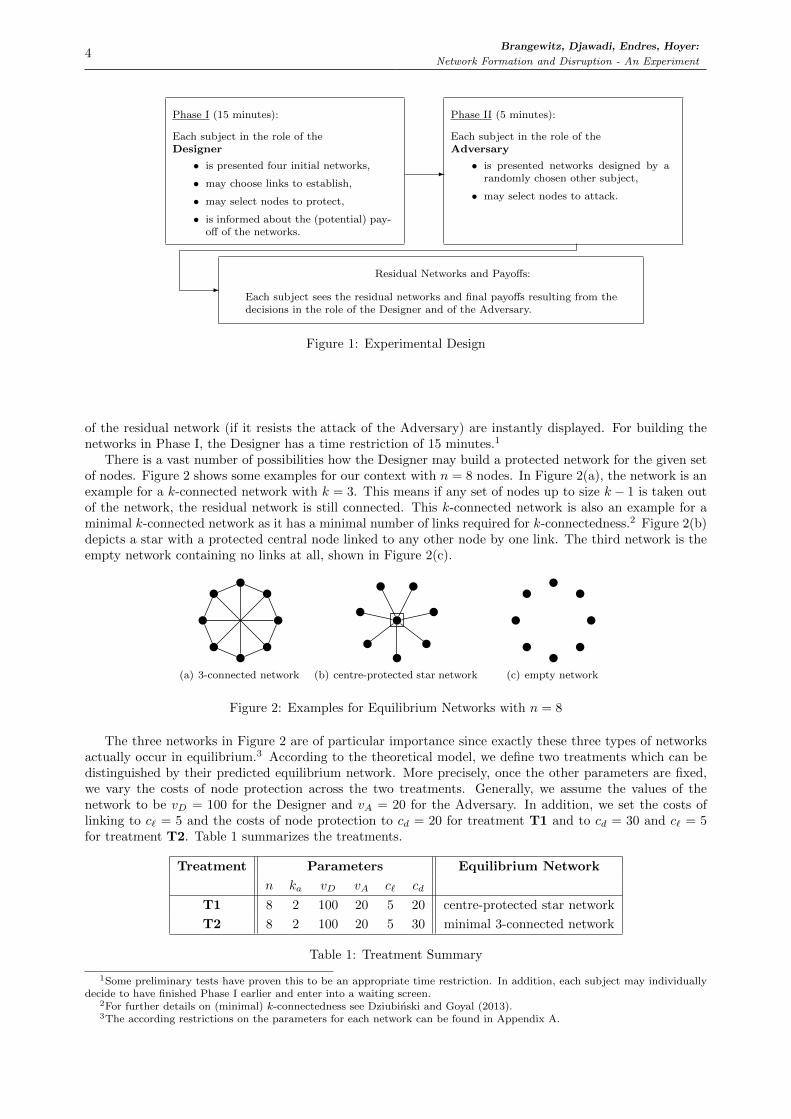
There is a vast number of possibilities how the Designer may build a protected network for the given setof nodes. Figure 2 shows some examples for our context with n = 8 nodes. In Figure 2(a), the network is anexample for a k-connected network with k = 3. This means if any set of nodes up to size k − 1 is taken outof the network, the residual network is still connected. This k-connected network is also an example for aminimal k-connected network as it has a minimal number of links required for k-connectedness.2 Figure 2(b)depicts a star with a protected central node linked to any other node by one link. The third network is theempty network containing no links at all, shown in Figure 2(c).
(a) 3-connected network (b) centre-protected star network (c) empty network
Figure 2: Examples for Equilibrium Networks with n = 8
The three networks in Figure 2 are of particular importance since exactly these three types of networksactually occur in equilibrium.3 According to the theoretical model, we define two treatments which can bedistinguished by their predicted equilibrium network. More precisely, once the other parameters are fixed,we vary the costs of node protection across the two treatments. Generally, we assume the values of thenetwork to be vD = 100 for the Designer and vA = 20 for the Adversary. In addition, we set the costs oflinking to c` = 5 and the costs of node protection to cd = 20 for treatment T1 and to cd = 30 and c` = 5for treatment T2. Table 1 summarizes the treatments.
Treatment Parameters Equilibrium Network
n ka vD vA c` cd
T1 8 2 100 20 5 20 centre-protected star network
T2 8 2 100 20 5 30 minimal 3-connected network
Table 1: Treatment Summary
1Some preliminary tests have proven this to be an appropriate time restriction. In addition, each subject may individuallydecide to have finished Phase I earlier and enter into a waiting screen.
2For further details on (minimal) k-connectedness see Dziubinski and Goyal (2013).3The according restrictions on the parameters for each network can be found in Appendix A.

5Brangewitz, Djawadi, Endres, Hoyer:
Network Formation and Disruption - An Experiment
For the experiment, we choose to use four initial starting networks, which differ in the placement of thenodes as well as in the initially established links. This allows us to investigate whether the Designer developsan efficient network by following a strategy or has a lucky guess. The position of the starting networks onthe screen is arranged randomly per pair of players to avoid any biases through the visual sequence of thenetworks. Thus, the initial networks are presented to the Designers simultaneously and in random order.Similarly, in Phase II, the Adversary also sees the four designed networks in the same random order and isasked to attack all four of them. This allows us to analyse whether the Adversary is able to strategicallyattack the networks or if he just randomly picks his targets among the nodes. The initial networks are shownschematically in Figure 3.
(a) (b) (c) (d)
Figure 3: Initial Starting Networks
The initial networks in Phase I consist of the empty network as shown in Figure 3(a) and three othernetworks as depicted in Figure 3(b) to Figure 3(d). We include the empty network to allow the subjectsto freely build links and protect nodes. In each of the other three networks in Figure 3(b) to Figure 3(d),three links are already given and cannot be modified by the subject. However, the costs for the initial linksstill need to be paid by the Designer. These already included links keep the subjects from simply copyingthe links they decided on in the empty network to the other presented networks and therefore it requiresadditional strategic thinking from the subjects. The nodes in Figure 3(a) and Figure 3(b) are displayed ina symmetric array, while in Figure 3(c) and Figure 3(d) there is no particular visible pattern. All networksare shown at the same time on one single screen, which makes it possible for the participants to go backto an already designed network to improve its design and use the experience gained by forming the othernetworks. Figure 4 shows examples for the equilibrium networks for treatment T1 and Figure 5 those fortreatment T2.
(a) (b) (c) (d)
Figure 4: Examples for Equilibrium Networks for Treatment T1
(a) (b) (c) (d)
Figure 5: Examples for Equilibrium Networks for Treatment T2
We provide monetary incentives for the experiment for which the value of the residual network after

6Brangewitz, Djawadi, Endres, Hoyer:
Network Formation and Disruption - An Experiment
the attacks is payoff-relevant.4 The only modification we make is that once a Designer has spent more forlinks and node protection than the value of the network, a warning is displayed and the payoff is set tozero. The participants know that they only get paid for two of the eight networks they worked on: The firstnetwork the subjects get paid for is one of the four networks they designed. Therefore, their payoff dependson the connectivity of the network after Phase II, since the potential payoff for a connected network is 100Taler less the costs for linking and protection, and 0 Taler for a disconnected one. The second network theyget paid for is one of the four networks they attacked. They earn 20 Taler if the network they attacked isdisconnected after Phase II. Their payoff is irrespective of the fact whether the network was already designedin a disconnected manner or whether the network got separated following their attack. For a network whichis still connected after the attack, they earn 0 Taler. The complete instructions for the main experiment canbe found in Appendix D.1.
Furthermore, the participants’ cognitive abilities may matter in the process of finding an equilibriumnetwork. Therefore, we conducted an additional experiment within the questionnaire after the main networkformation experiment was finished. This extra experiment addresses the participants’ cognitive abilities byusing an adaptation of the “11-20 Money Request Game (MRG)” by Arad and Rubinstein (2012). This gametests the subjects’ depth of reasoning and gives us a measure for their farsightedness. A detailed descriptionof the game can be found in Appendix C and the additional instructions for the subjects in Appendix D.2.
2.2 Research Hypotheses
The following three hypotheses affect the Designer’s network formation behaviour and deal with the equi-librium predictions of the network experiment: Due to the fact that the Designers know about the threatof the subsequent attack, it is generally assumed that they adjust their network formation behaviour toaccount for this threat. Moreover, since they are even aware of the number of attacks, it is also assumedthat the participants are able to form networks which can withstand all of the Adversary’s attacks withoutbeing disconnected. Summarizing, we expect that the Designers build networks which are safe concerningthe Adversaries’ attacks. This assumption about the Designers’ ability to form safe networks shapes ourfirst hypothesis.
Hypothesis 1 Independently of the treatment, a significant share of Designers builds safe networks for eachinitial network.
According to the theory, the designed networks are expected to be the predicted equilibrium networks.Since the equilibrium networks are also safe networks, it is implied that a significant share of the designed safenetworks are equilibrium networks. This means for treatment T1 that a significant share of safe networksconsists of a centre-protected star network and for treatment T2 that a significant share of safe networksconsists of the minimal 3-connected network without defence. Both equilibrium networks are efficient, whichmeans that the payoff for the residual network is maximized given the costs of links and node defence. Thisdefinition enables us to differentiate between safe networks and safe networks built with minimal costs –thusnetworks that are safe and efficient. Consequentially, our second hypothesis directly distinguishes betweenthe emergence of safe, and safe and efficient equilibrium networks.
Hypothesis 2 Among the safe networks per starting network,
a) In treatment T1, a centre-protected star network is designed significantly more often than others.
b) In treatment T2, a minimal 3-connected network without defence is designed significantly more oftenthan others.
The next hypothesis aims at the Designer’s personal characteristics and augments the theoretical pre-dictions: Farsightedness might influence the Designer’s behaviour. Since forming efficient networks –whichcannot be destroyed by the Adversary’s two attacks and which at the same time are cost minimal– requiresthinking several steps ahead, we conjecture that the Designer’s degree of farsightedness plays a role in findingthe equilibrium networks. So, Designers are expected to consider the vulnerabilities of their formed networksand take the Adversary’s behaviour into account, too. Accordingly, we conjecture that a more farsightedDesigner is more effective in building efficient networks. Thus, a participant’s degree of farsightedness isexpected to positively influence the frequency of equilibrium networks among his designed networks.
Hypothesis 3 Designers who are more farsighted build the equilibrium networks significantly more oftenthan Designers who are less farsighted.
4See Appendix A for the formal definition of the payoff function.

7Brangewitz, Djawadi, Endres, Hoyer:
Network Formation and Disruption - An Experiment
2.3 Experimental Procedure
Our experiment was conducted in the Business and Economic Research Laboratory (henceforth BaER-Lab)at Paderborn University in February 2017, where it is possible to control potentially confounding factorsand observe the network structures without measurement problems (Falk and Kosfeld, 2012). We use thesoftware z-Tree (Fischbacher, 2007) and invite the participating subjects through the online recruitmentsystem Orsee (Greiner, 2015) from a pool of approx. 2,800 voluntary students of Paderborn University fromdifferent fields of studies who are enrolled as prospective participants in economic experiments. Subjectsare only allowed to participate in one session. Upon arrival each subject is seated randomly at a computerworkplace in a cubicle, each detached from one another. All subjects are told not to communicate duringthe session.
The experiment consists of two parts: The first one is the main network formation experiment, as ex-plained in the previous sections; the second is a follow-up questionnaire to gain additional information on thesubjects, in particular on their farsightedness and their risk behaviour. From the MRG, as briefly describedpreviously we deduct steps of reasoning of the participants and use these as a measure of farsightedness.The risk behaviour is measured by two risk assessment questions, which are based on the SOEP (GermanSocio-Economic Panel Study), and allow us to categorize subjects by their level of risk aversion. Detaileddescriptions of the MRG and the risk assessment questions can be found in Appendix C.
All subjects within a treatment receive the same instructions before the experiment and are informedabout the structure of the experiment and the payoffs associated with designing and attacking the networks.5
The subjects have 15 minutes to read the five pages of instructions on their own. Afterwards, the main pointsof the instructions are repeated verbally by the experimentor. Before starting the experiment, all participantsare asked to complete a control questionnaire consisting of five questions about the details of the experimentto ensure their understanding. At the end of the network formation experiment, one of the participatingsubjects is randomly chosen to roll a dice to determine the network position relevant for the final monetarypayment for all subjects. Note that the networks are displayed in random order per group of subjects. Thismeans that typically the initial networks relevant for the final monetary payments vary among groups. Weset the exchange rate to 1 Euro for 5 Taler and the show-up fee to 5 Euro.6 Each session took about 65minutes, including time to read the instructions and receiving the payoff. In total, there were 96 subjectsin the experiment. These participants generated an average payment of 13.28 Euro (including 5 Euro as ashow-up fee). In the first treatment, 48 subjects attended with an average payment of 13.90 Euro; in thesecond treatment, 48 subjects took part generating an average payment of 12.67 Euro.
3 Results
In this section we present the main findings. Table 2 shows a summary of our data across both treatments,concerning the age, gender and semester of studies. The majority of subjects (86%) did not have previousexperience with network theory. As our experiment was conducted in German, we did not ask for nationalitybecause our subject pool consisted of mainly German students. In addition to the general summary statistics,in Table 2 we also include data on the level of reasoning of the subjects as elicited in the MRG and on themean overall risk aversion as elicited in the questionnaire (see Appendix C for further information). For themean level or reasoning, we have between 0 and 11 steps, where 11 is very farsighted and 0 is not farsightedat all. For risk aversion, we have 11 categories between 0 and 10, where 10 is very risk averse and 0 is veryrisk loving.
The descriptives in Table 3 concern the networks that our subjects designed in the experiment. It showsa summary of the networks designed in the two treatments given the different starting networks. Here (a)to (d) refers to the different initial starting networks as depicted in Figures 2(a) to 2(d). In Table 3 wesummarized which networks were designed, differentiating by their resistance against attacks and by theirarchitecture. Regarding resistance against attacks, we consider as safe networks those networks that couldnot be disconnected by deleting up to two nodes. Correspondingly, unsafe networks are those that could bedisconnected by such an attack. For the distinction by network architecture, the CPS and Minimal 3 refer tothe centre-protected star and the minimal 3-connected network without defence. These two networks are the
5In the instructions we used the words design and separate a network, to avoid any influence of the more suggestive termsof attacking a network.
6We chose this rather high show-up fee, as there was a chance that students did not earn anything in the experiment. Thisapplied if they did not built a safe network that was then destroyed by their partner and did not destroy their partner’s networkthemselves.

8Brangewitz, Djawadi, Endres, Hoyer:
Network Formation and Disruption - An Experiment
Variable Treatment T1 Treatment T2 Total Sample
Male 46% 27% 36%
Mean Age 23.77 24.56 24.17
Mean Semester 5.04 5.38 5.21
Experience Networks 17% 10% 14%
Mean Farsightedness 2.83 3.23 3.03
Mean Risk Aversion 5.31 5.58 5.44
Table 2: Summary Statistics
equilibrium networks for treatment T1 and T2, respectively. In addition, we also consider those networkswhich were already built disconnected in Phase I by the Designer and denote them as Designed disconnected.The remaining networks are then summarized as Other networks. Please note that per treatment per startingnetwork we have 48 observations.
Number of: Treatment T1 Treatment T2
Starting Network
(a) (b) (c) (d) (a) (b) (c) (d)
Total Networks 48 48 48 48 48 48 48 48
Networks by Resistance against Attacks:
Safe Networks 34 30 31 33 28 28 28 27
Unsafe Networks 14 18 17 15 20 20 20 21
Networks by Architecture:
CPS 30 27 30 31 21 17 24 21
Minimal 3 1 0 0 0 5 4 3 3
Designed Disconnected 8 9 10 8 5 4 7 4
Other Networks 9 12 8 9 17 23 14 20
Table 3: Overview of Built Networks
In order to determine whether the share of Designers who built safe networks is significant independentof starting network, as proposed in Hypothesis 1, we first conduct a χ2-test to analyse whether the amountof safe networks built depends on the starting network. For treatment T1 we find a χ2-statistic of 0.9375; fortreatment T2 we find a χ2-statistic of 0.0641 and neither is significant at p < 0.05. Therefore, we concludethat there is no difference between starting networks in the ability of Designers to build safe networks. Wethen conduct a Wilcoxon signed rank test to analyse whether a significant share of Designers manages tobuild a safe network, independent of starting network. Here we find a z-value of 2.670, which is significantat p < 0.01. Result 1 follows from this. Support for Result 1 is also provided by Table 3, which presentsthe amount of safe networks, and row one of Table 4. In addition, we also see evidence for Result 1 inthe distribution of the observed payoffs per starting network and treatment, which can be found in inAppendix B.1.
Result 1 A significant share of Designers manages to build a safe network, independent of starting network.
Looking more into detail who managed to design safe networks, a χ2-test shows, not surprisingly, that the13 subjects who had experience with network analysis did significantly better than the remaining subjectsin terms of building safe and efficient networks, for p < 0.1 and p < 0.01 respectively.7 Interestingly, theability to design safe networks, while not depending on a starting network as such, still does not meanthat a subject who once managed to build a safe network could achieve this in all four of his networks.Out of the 49 subjects who were able to build at least one safe network, only 51% managed to build all
7A first observed gender effect in the ability to build safe networks is rescinded, when also taking experience with networkanalysis into account.

9Brangewitz, Djawadi, Endres, Hoyer:
Network Formation and Disruption - An Experiment
four networks as safe. Thus, it seems that some additional strategic thinking by the subjects is required totransfer the knowledge of how to build a safe network to all possible starting networks. In addition to thesubjects’ experience with networks, we also look at the influence of their risk aversion on the ability to designsafe or safe and efficient networks. We measured risk aversion by means of asking students to self-assesstheir risk attitude in two questions at the end of the experiment.8 Using a Jonckheere-Terpstra test wefind no statistically significant relationship between the degree of risk aversion and the underlying observedbehaviour of forming safe (z-value = 0.5665, p > 0.1) or safe and efficient networks (z-value = 0.4335,p > 0.1).
Number of Subjects who successfully designed (out of 4): Wilcoxon test
0 1 2 3 4
Safe Networks 25 6 9 9 47 z = 2.670∗∗∗
CPS Networks 24 2 4 4 24 z = −5.088∗∗∗
Min3 Networks 42 2 1 1 2 z = 4.366∗∗∗
∗∗∗ p < 0.01, ∗∗ p < 0.05, ∗ p < 0.1.
Table 4: Safe and Efficient Networks per Subject
Looking at the safe networks per treatment, it can directly be deducted from Table 3 that the CPS isbuilt more often than the minimal 3-connected network for both treatments. Interestingly, the few timesthat subjects managed to design the minimal 3-connected network was in treatment T2, where it wasalso efficient to do so (see also Table 5). In order to test whether in treatment T1 the CPS is designedmore frequently than other safe networks and whether in treatment T2 the minimal 3-connected network isdesigned more frequently than other safe networks, we conduct a Wilcoxon signed rank test for each of thetwo treatments. For treatment T1 we find that among the safe networks the CPS is designed significantlymore often than others with a z-value of −5.088 for a p < 0.01. For treatment T2 we find that among thesafe networks the minimal 3-connected network is not designed more often than other safe networks. Herethe test actually indicates that other safe networks are designed significantly more often than the minimal3-connected network, with a z-value of 4.366 for p < 0.01. Results 2a and 2b follow from this. Support forResults 2a and 2b is also provided in rows 2 and 3 of Table 4, respectively.
Result 2a The centre-protected star network is designed significantly more often than others in treatmentT1.
Result 2b The minimal 3-connected network is not designed significantly more often than others in treat-ment T2.
Since the CPS seems to be the more intuitive solution for most subjects, we also tested whether it wasdesigned more often in treatment T1, where it was also efficient, than in treatment T2, where it was safe butnot efficient. Here we use a χ2-test and find that the CPS is designed significantly more often in treatmentT1 than in treatment T2. We also find that the minimal 3-connected network was designed significantlymore often in treatment T2 than in treatment T1. Thus, while it seems to have been difficult for the subjectsto design a minimal 3-connected network, they succeeded to do so significantly more often in the treatmentwhere it was also the efficient solution. Support for this can be found in Table 5. Additionally, we alsoanalysed whether our results are robust to taking in account networks that are almost minimal 3-connectednetworks.9 Qualitatively the results are in line with the results presented here. Details can be found inAppendix B.2.
Finally, we also analyse the impact of Designers’ farsightedness on their ability to build equilibriumnetworks. Here we use the MRG, as introduced by Arad and Rubinstein (2012), giving us a measure forthe farsightedness of our subjects. Subjects could request an integer amount between 11 and 20 Euro. Iftheir requested amount was exactly one less than the amount their partner requested, they could get anadditional 20 Euro.10 The distribution of answers in our MRG is remarkably similar to the one found in
8The questions and instructions can be found in Appendix C.9These are networks where subjects seem to have wanted to design a minimal 3-connected network, but did not quite manage
to do so. The exact definition of these networks can be found in Appendix B.2.10After the experiment, in each session a group number was chosen for whom the MRG was actually paid out.

10Brangewitz, Djawadi, Endres, Hoyer:
Network Formation and Disruption - An Experiment
Treatment CPS Not CPS Min3 Not Min3
T1 118 74 1 191
T2 83 109 15 177
χ2 12.7885∗∗∗ 12.7826∗∗∗
∗∗∗ p < 0.01, ∗∗ p < 0.05, ∗ p < 0.1.
Table 5: CPS and Minimal 3-connected Networks per Treatment
Arad and Rubinstein (2012). Most students can be categorized as having level 1-, 2- or 3-reasoning, thusrequesting 19, 18 or 17 Euro.11 After the MRG, we also asked subjects to write down why they chose acertain amount of money, and by means of their answers we corrected the level k-reasoning deducted fromthe MRG.12 We do not find an ascending trend with the Jonckheere-Terpstra test which would support ourhypothesis that subjects who exhibit more farsightedness are more likely to form efficient networks. For thisfarsightedness measure we find, however, that there is simply no relation between farsightedness and thenumber of efficient networks designed with p = 0.8663 for the ascending trend test and p = 0.1337 for thedescending trend test.13 This insignificant relationship cannot be explained by risk preferences, as we findno correlation between the measures of farsightedness and risk aversion in our sample (Kendells Tau valueof −0.0680, p-value of 0.3779).
Result 3 The level of Designers’ farsightedness does not concur with their ability to build equilibrium net-works.
Additionally, we also look at the subjects’ ability to destroy networks when being in the role of theAdversary. Each subject in Phase II of the experiment got to attack up to two nodes in the networks hispartner constructed in Phase I. As a lot of the networks had been built in such a way that no successful attackwas possible (see Table 3), only few subjects had the possibility to actually attack a network successfully.Out of the 384 networks designed in the experiment only 105 networks were destroyable; out of these, 73were actually destroyed by the Adversary. The remaining 32 networks could have been destroyed by anattack on two nodes, but the Adversaries were not successful in finding and attacking the weak spots of thenetwork. We use this as a control to test whether those subjects who were able to destroy a network, if theyhad the chance to do so, were also more successful in designing efficient networks. However, we do not findthat this is the case. Using a χ2-test, we find that there is no significant relation between the ability to buildsafe and/or efficient networks and the ability to successfully destroy a network if one has the chance to doso. It has to be taken into account, though, that overall there were not a lot of subjects who actually hadthe chance to destroy networks, therefore this may not be a very accurate measure.
4 Conclusion
In this paper we report results from an experiment in which subjects play a network formation game knowingthat the network will be attacked afterwards. The game is modelled on the theoretical results by Dziubinskiand Goyal (2013). We find that while subjects are overall able to build networks that are safe against thesubsequent attack, independent of their starting network, they only manage to build efficient networks intreatment T1, where the efficient network is the centre-protected star. In treatment T2, where the efficientnetwork is a minimal 3-connected network, the large majority of subjects failed to design this network.However, we show that those subjects who do manage to design a minimal 3-connected network do so intreatment T2, where it is also the efficient network.
Interestingly, in contrast to previous, often decentralised network formation experiments, we do not findthat more symmetric networks are built more often (see, for example, Falk and Kosfeld 2012). On the
11Interestingly, among our 48 groups, there were 8 groups in which one person requested exactly 1 Euro less than the otherperson. In these groups the lower requesting partner requested 18 Euro in most cases, 17 Euro in one case and 16 Euro in onecase.
12Thus, for example, people requesting 13 Euro, who report that they did this because the 13th is their birthday, are put tolevel 0-reasoning instead of the level 7-reasoning they are coded as in the pure MRG.
13Looking at the values of the pure MRG, we find that there is actually a negative relationship between level k-reasoning andthe ability to build safe and efficient networks. This can be seen from the results of the Jonckheere-Terpstra test, which has ap-value of 0.9791 when testing for an ascending trend between subjects’ farsightedness and the number of equilibrium networksthey designed. Instead, we find a significant descending trend for the variables, with p < 0.05.

11Brangewitz, Djawadi, Endres, Hoyer:
Network Formation and Disruption - An Experiment
contrary, we find that network Designers tend to build the (centre-protected) star network significantly moreoften than the more symmetric minimal 3-connected network. It seems that while in decentralized models ofnetwork formation the asymmetric payoffs to the centre and the spokes of the star prevent this network frombeing built, in a centralized model the (centre-protected) star is the most intuitive solution. The minimal3-connected network, on the other hand, seems to be too complicated for the majority of subjects to bebuilt. This is surprising, as it can be designed as a very symmetric network.
We find that farsightedness, as measured by the MRG, does not predict well which subjects build ef-ficient and safe networks. While we find that students with any kind of experience with network theorydo significantly better than their inexperienced counterparts, we neither find significant differences in otherpersonality characteristics such as gender nor do we find that the degree of risk aversion is related withbuilding efficient and safe networks.
Overall, it seems to be the case that subjects are in principal able to understand the network formationgame and manage to build safe networks. However, for some cost structures building efficient networks isalready too complex in an environment where a network consists of only eight nodes and payoffs are calculatedon-the-fly for the subjects while designing the network. Additionally, subjects have ample time to try outdifferent designs and can also go back to change their previously made designs, but still in treatment T2,most of them fail to reach a minimal 3-connected network. Also, only approximately half of those subjectswho build at least one safe network manage to build safe networks for all four starting networks. Thus,there seems to be an additional complexity involved in transferring the way to build a safe network fromone starting network to another. However, these complexities can be overcome by using more experiencedsubjects, as can be seen from our finding that subjects with any sort of former introduction to networktheory did significantly better.
One possible extension of the current analysis is motivated by Landwehr (2015), who studies networkformation behaviour in case of imperfect node as well as link defence. By that, he extends the model ofDziubinski and Goyal (2013), who only considered perfect defence as protection against node attacks. Herethe predicted equilibrium networks change and, due to the increased complexity of the model, the set ofnetworks gets less symmetric. It would be interesting to test in an experiment if subjects are still able tobuild these new equilibrium networks, even with this increased complexity. To test this, a new experiment isneeded, as networks consisting of 8 nodes would probably be already too much of a challenge for the subjectsand the parameters for equilibrium networks also need to be adjusted.
Acknowledgements
This work was partially supported by the German Research Foundation (DFG) within the CollaborativeResearch Centre “On-The-Fly Computing” (SFB 901).
References
Arad A, Rubinstein A (2012) The 11-20 money request game: A level-k reasoning study. American EconomicReview 102(7):3561–73
Arce D, Kovenock D, Roberson B (2012) Weakest-link attacker-defender games with multiple attack tech-nologies. Naval Research Logistics 59(6):457–469
Bala V, Goyal S (2000) A noncooperative model of network formation. Econometrica 68(5):1181–1229
Bravard C, Charroin L, Touati C (2017) Optimal design and defense of networks under link attacks. Journalof Mathematical Economics 68:62–79
Callander S, Plott C (2005) Principles of network development and evolution: An experimental study.Journal of Public Economics 89(8):1469–1495
Cerdeiro D, Dziubinski M, Goyal S (2015) Contagion risk and network design, nota di Lavoro 56.2015, Milan,Italy: Fondazione Eni Enrico Mattei
Dohmen T, Falk A, Huffman D, Sunde U (2010) Are risk aversion and impatience related to cognitive ability?American Economic Review 100(3):1238–60

12Brangewitz, Djawadi, Endres, Hoyer:
Network Formation and Disruption - An Experiment
Dohmen T, Falk A, Huffman D, Sunde U, Schupp J, Wagner G (2011) Individual risk attitudes: Mea-surement, determinants, and behavioral consequences. Journal of the European Economic Association9(3):522–550
Dziubinski M, Goyal S (2013) Network design and defence. Games and Economic Behavior 79:30–43
Dziubinski M, Goyal S (2017) How do you defend a network? Theoretical Economics 12(1):331–376
Falk A, Kosfeld M (2012) It’s all about connections: Evidence on network formation. Review of NetworkEconomics 11(3):Article 2
Fischbacher U (2007) z-tree: Zurich toolbox for ready-made economic experiments. Experimental Economics10(2):171–178
Goeree JK, Riedl A, Ule A (2009) In search of stars: Network formation among heterogeneous agents. Gamesand Economic Behavior 67(2):445–466
Goyal S, Vigier A (2014) Attack, defence, and contagion in networks. Review of Economic Studies 81(4):1518–1542
Goyal S, Jabbari S, Kearns M, Khanna S, Morgenstern J (2016) Strategic network formation with attackand immunization. In: Cai Y, Vetta A (eds) Web and Internet Economics. WINE 2016. Lecture Notes inComputer Science, Springer Berlin Heidelberg, vol 10123
Greiner B (2015) Subject pool recruitment procedures: organizing experiments with ORSEE. Journal of theEconomic Science Association 1(1):114–125
Haller H (2016) Network vulnerability: A designer-disruptor game. Working Paper Series Virginia PolytechInstitute and State University, Department of Economics e07-50
Harrison GW, Rutstrom EE (2008) Risk aversion in the laboratory. In: Risk Aversion in Experiments,Emerald Group Publishing Limited, pp 41–196
Hoyer B, De Jaegher K (2012) Cooperation and the common enemy effect. Discussion Paper Series/TjallingC Koopmans Research Institute 12(24)
Hoyer B, De Jaegher K (2016) Strategic network disruption and defense. Journal of Public Economic Theory18(5):802–830
Hoyer B, Rosenkranz S (2015) Farsightedness and risk in network formation - an experiment, mimeo
Jackson MO, Wolinsky A (1996) A strategic model of social and economic networks. Journal of EconomicTheory 71(1):44–74
Kirchsteiger G, Mantovani M, Mauleon A, Vannetelbosch V (2016) Limited farsightedness in network for-mation. Journal of Economic Behavior & Organization 128:97–120
Kovenock DJ, Roberson B (2015) The Optimal Defense of Network Connectivity. CESifo Working PaperSeries 5653, CESifo Group Munich
Landwehr J (2015) On the emergence of networks. PhD thesis, University Bielefeld
Morbitzer D, Buskens V, Rauhut H, Rosenkranz S (2012) Limited farsightedness in network formationexperiment, mimeo
Pelliccia M (2015) Decentralised defence of a (directed) network structure, Working Paper, Birkbeck College,University of London, UK
TNS Infratest Sozialforschung (2014) SOEP 2014. Erhebungsinstrumente 2014 (Welle 31) des Sozio-okonomischen Panels: Personenfragebogen, Altstichproben. DIW/SOEP: SOEP Survey Papers 235: SeriesA

13Brangewitz, Djawadi, Endres, Hoyer:
Network Formation and Disruption - An Experiment
Appendix
A Theory
The sequential game has two players: a Designer and an Adversary. The Designer makes his decision duringthe first phase and then the Adversary decides.
In the first phase, the Designer chooses a strategy to build and protect a network for a fixed set of nnodes (n ≥ 3). In other words, the Designer decides which nodes he links at a constant and exogenouslygiven cost c`, with c` > 0 and which nodes he protects at an exogenously given cost cd, with cd > 0. Aprotected node cannot be removed from the network by an attack of the Adversary. We denote the strategywhich the Designer has chosen by the pair (g, δ), which consists of the network g described by a set of linksand the set of protected nodes by δ.14
In the second phase, the Adversary sees the designed and protected networks and decides which nodesto attack. If the Adversary decides to attack a node that is not protected, this node and all its links areremoved from the network. If the node is protected, the Adversary’s attack has no impact on the network.Let ka > 0 denote the maximal number of attacks the Adversary is allowed to choose. Attacks are assumedto be costless. Let the (sub)set of nodes that the Adversary chooses to attack be denoted by X. The finalnetwork after the attack is called the residual network. It is connected if every pair of nodes either directlyhas a link between them, or if they are indirectly linked via other nodes. A network which is not connectedis disconnected.
The payoffs are as follows
πD(g, δ,X) =
{vD − |δ| · cd − |g| · c` if the residual network is connected,
0 if the residual network is not connected.
πA(g, δ,X) =
{0 if the residual network is connected,
vA if the residual network is not connected.
with vD, vA > 0. The parameters vD and vA indicate the value of the residual network.15 Intuitively, aslong as the costs for links and protection are not too high, it is the Designer’s goal to design a network atminimum costs that cannot be attacked by the Adversary, while the goal of the Adversary is to destroy theDesigner’s network.
Proposition 1 (see Dziubinski and Goyal, 2013) Assume ka ≤ n− 2.
In equilibrium the Designer builds a protected network (g, δ) such that
– for c` < vD/⌈n(ka+1)
2
⌉and cd > c`
(⌈n(ka−1)
2
⌉+ 1)
it is a minimal (ka + 1)-connected network,
– for c` (n− 1) + cd < vD and cd < c`
(⌈n(ka−1)
2
⌉+ 1)
it is a centre-protected star network,
– otherwise g is the empty network and no node is protected, δ = ∅.
In equilibrium, the Adversary chooses -if possible- a set such that the network is no longer connectedand, if it is not possible to disconnected the network, any set of nodes yields the same payoff.
Important underlying assumptions in this model are the perfect information about the network, itsstructure and its characteristics such as the cost structure and the player’s objectives and payoffs. Moreover,the defence of nodes is perfect. Thus, unprotected nodes are removed with certainty after an attack and aprotected node remains in the network even after being targeted. Regarding the attack, it is assumed thatthe Adversary’s budget is exogenously given. In addition, the Adversary’s budget is perfectly known by theDesigner and the Adversary attacks the network optimally given that he observes the designed network.
14Formally, given a finite set of nodes N = {1, ..., n} with n ≥ 3, a network g is a set of links, i.e., g ⊆ {{i, j}|i, j ∈ N, i 6= j}and a set of protected nodes is a (sub)set of nodes, i.e., δ ⊆ N .
15For scaling purposes in the experimental design we model the utility functions here such that the values vD and vA are notnecessarily identical. Note that in the model of Dziubinski and Goyal (2013), these values were supposed to be identical andfor the formal analysis set to be equal to 1. Formally, the values of the residual network are a mapping associating to everypossible residual network a value for the Designer and for the Adversary. For notational simplification, we omit this dependenceon the residual network here.
14Brangewitz, Djawadi, Endres, Hoyer:
Network Formation and Disruption - An Experiment
B Experimental Results
B.1 Observed Payoffs
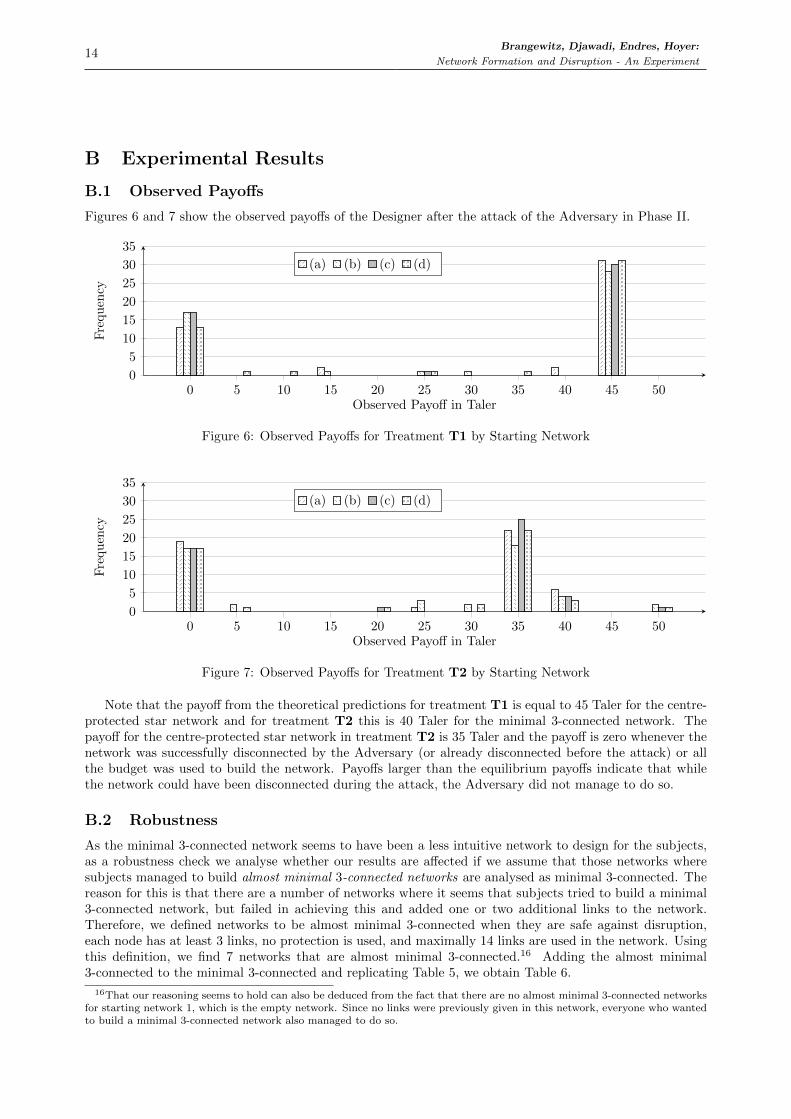
Figures 6 and 7 show the observed payoffs of the Designer after the attack of the Adversary in Phase II.
0 5 10 15 20 25 30 35 40 45 500
5
10
15
20
25
30
35
Observed Payoff in Taler
Fre
qu
ency
(a) (b) (c) (d)
Figure 6: Observed Payoffs for Treatment T1 by Starting Network
0 5 10 15 20 25 30 35 40 45 500
5
10
15
20
25
30
35
Observed Payoff in Taler
Fre
qu
ency
(a) (b) (c) (d)
Figure 7: Observed Payoffs for Treatment T2 by Starting Network
Note that the payoff from the theoretical predictions for treatment T1 is equal to 45 Taler for the centre-protected star network and for treatment T2 this is 40 Taler for the minimal 3-connected network. Thepayoff for the centre-protected star network in treatment T2 is 35 Taler and the payoff is zero whenever thenetwork was successfully disconnected by the Adversary (or already disconnected before the attack) or allthe budget was used to build the network. Payoffs larger than the equilibrium payoffs indicate that whilethe network could have been disconnected during the attack, the Adversary did not manage to do so.
B.2 Robustness
As the minimal 3-connected network seems to have been a less intuitive network to design for the subjects,as a robustness check we analyse whether our results are affected if we assume that those networks wheresubjects managed to build almost minimal 3-connected networks are analysed as minimal 3-connected. Thereason for this is that there are a number of networks where it seems that subjects tried to build a minimal3-connected network, but failed in achieving this and added one or two additional links to the network.Therefore, we defined networks to be almost minimal 3-connected when they are safe against disruption,each node has at least 3 links, no protection is used, and maximally 14 links are used in the network. Usingthis definition, we find 7 networks that are almost minimal 3-connected.16 Adding the almost minimal3-connected to the minimal 3-connected and replicating Table 5, we obtain Table 6.
16That our reasoning seems to hold can also be deduced from the fact that there are no almost minimal 3-connected networksfor starting network 1, which is the empty network. Since no links were previously given in this network, everyone who wantedto build a minimal 3-connected network also managed to do so.

15Brangewitz, Djawadi, Endres, Hoyer:
Network Formation and Disruption - An Experiment
Treatment CPS Not CPS (Almost) Min3 Not (almost) Min3
T1 118 74 2 190
T2 83 109 21 171
χ2 12.7885∗∗∗ 16.6957∗∗∗
∗∗∗ p < 0.01, ∗∗ p < 0.05, ∗ p < 0.1.
Table 6: CPS and (almost) Minimal 3-connected Networks per Treatment
It can be seen from Table 6 that those subjects that build almost minimal 3-connected networks do so intreatment T2, where the minimal 3-connected network was also the efficient solution. Henceforth, we brieflypresent this model in an already slightly adapted version to our experimental design. For a comprehensivedescription and analysis of the underlying theoretical model we refer to Dziubinski and Goyal (2013).
C Questionnaires to Elicit Further Information
Money Request Game (see Arad and Rubinstein, 2012). The Money Request Game (henceforthMRG) is rested on level-k models, which assume that persons can be clustered into different groups regardingtheir depth of reasoning. For example, a level-0 type person would act non-strategically and thinks no stepahead of his own behaviour. In our version of the MRG, the participants are matched in groups of twoand have to choose an amount between 11 and 20 Euro, which they get paid at the end. They have theopportunity to additionally gain 20 Euro if their chosen amount is exactly 1 Euro less than the partner’srequested amount, which is supposed to encourage to think about the partner’s strategy. This enables us tocategorize participants by different levels of reasoning, corresponding to the number they state in the game.After the participants stated their amount, they are asked to explain their numeric decision. At the end,one of the groups gets randomly chosen to be paid their stated amounts from the game. You may find theEnglish translation of the instructions you may find in Appendix D.2.
Questionnaire Including Risk Assessment. The final part of the experiment is a personal question-naire. The questionnaire aims at gaining insights about the subjects’ personal characteristics as well as theirstrategic behaviour: Thus, their network formation and network disruption strategies are asked. By meansof this information, we are able to better understand their decision-making process and see if the subjectsformed their networks randomly or according to a specific strategy. Moreover, it is asked if they have hadany experience with network theory. This would be likely to improve their understanding and their resultsin the network formation and attacking process.
Generally, it is uncontroversial that the participants’ risk attitude influences their decisions within anexperiment (Dohmen et al, 2010, Harrison and Rutstrom, 2008). Thus, we include two questions into thequestionnaire in which the participants have to self-assess their risk behaviour in certain situations. The riskassessment questions are based on the SOEP (German Socio-Economic Panel Study), which is a large paneldataset with the aim to represent the German population introduced by a professional surveying company.Since the SOEP is very extensive and includes a large spread of issues, we chose just questions 4 and 125from the panel in the year 2014, which both aim specifically at the participants’ risk attitudes (TNS InfratestSozialforschung 2014). The first question is an all-around measure of the participants willingness to takerisks in general. Hence, this first question asks participants if they are rather risk averse or not. Since averagewillingness to take risks varies across contexts, the second question deals with risk in specific contexts: It isasked about their risk behaviour in financial issues, at driving, in sports and leisure, on the job, regardingtheir personal health status, and regarding trusting unknown persons. For both questions, participants canchoose values on a scale from 0 to 10, whereas 0 means “not willing to take risk at all”, and 10 means “verywilling to take risk”. We choose these questions because they suit our purpose to collect information aboutthe participants’ risk attitudes in a simple way. Moreover, the second, more detailed question serves to ruleout potential inconsistencies in self-estimation and is a direct measurement of the participants’ risk attitudesand the inexpensiveness to collect the information (Dohmen et al, 2011). Besides, Dohmen et al (2011)confirm these questions to be a fit measurement of subjects’ risk self-assessment by conducting a mixture ofexperiment and survey and use the survey to validate the participants’ risk attitudes measured in the earlierconducted experiment.

16Brangewitz, Djawadi, Endres, Hoyer:
Network Formation and Disruption - An Experiment
D Instructions (English Version)
The version of the instructions presented in this section is a translation of the original instructions writtenin German. Variations between the two treatments are indicated in square brackets. The instructions forthe MRG are close to the ones of Arad and Rubinstein (2012).
D.1 Experiment Instructions
General information
• During the experiment all payments are stated in the fictitious currency “Taler”.
• After the experiment we would like to ask you to fill out a questionnaire. For this you will receive ashort instruction as soon as the experiment has ended.
• In addition to the instructions you also receive a separate explanation of the computer screen.
Structure of the experiment
• This experiment consists of two phases: Phase I and Phase II.
• The experiment is about networks. Examples for networks are electricity networks, transport systems,communication systems and oil pipelines.
• A network is displayed in this experiment by points and links between these points.
• A network is said to be connected
– if all existing points form one network; this means that each point has a link to at least one ofthe other points and that in a connected network there are no points without any links and thereare no separate sub-networks.
• A network is disconnected
– if there is at least one point in the network that is not connected by a link to the other points.This implies that the network is disconnected if the existing network is separated into severalsub-networks or single points are isolated.
• The next figure (schematically) shows examples for connected and disconnected networks:
Example connectednetwork
Example discon-nected network (withtwo sub networks)
Example discon-nected network withone sub-network andthree isolated points
Course of the experiment
Phase I (design networks)
• For Phase I (design networks) you have 15 minutes (900 seconds).
• Initially, you see four networks in which in some there are already existing links.
• Every network shall be considered separately and independent of the other networks.
• The network currently chosen to work on is marked by a green frame on the computer screen (seeseparate explanation of the computer screen).

17Brangewitz, Djawadi, Endres, Hoyer:
Network Formation and Disruption - An Experiment
Your task is to design in total four networks for the four initial starting networks.
Note that in Phase II (remove points) of the experiment a different participant may remove twopoints from each of your networks.
Your payment per network is dependent on the connectedness of the network after Phase II.
• You have two possibilities when designing your networks: You may establish links or protect points.You cannot protect links.
• Establishing links and protecting points is costly:
– Establishing a link between two points costs 5 Taler.
– Protecting a point costs 20 Taler [for treatment T2 protecting points costs 30 Taler].
At most you can spend 100 Taler per network. This means that you cannot establish infinitely manylinks and/or protect all points.
• The additional links may be established between two points for which there is no initial link. Initiallinks cannot be deleted and the costs for these links are deduced from your budget.
• All points may be protected. Protected points are marked by a square around the point.
• You cannot add additional points. All existing points need to be included in the network, otherwisethe network counts as disconnected.
• After the design is finished, you are asked to click on “Continue” to proceed with the experiment.
Phase II (remove points)
• For Phase II (remove points) you have 5 minutes (300 seconds).
• You see four networks of another participant. You see them as they have been designed by theother participant in Phase I.
• Every network shall be considered separately and independent of the other networks.
Your task is to remove up to two points from each of the four networks .
• If you decide to remove a protected point, this has no impact on the network. Neither theprotection nor the point itself will be removed.
• If you decide to remove an unprotected point, this point and all its adjacent links will beremoved. The network is reduced by this point, but may not necessarily be disconnected.As long as all remaining points are connected with at least one link, the network remainsconnected with a smaller number of points.
Your payment per network is dependent on the connectedness the network of the other partic-ipant after Phase II.
• Links can only be removed indirectly together with unprotected points. Links cannot be removedseparately from the network.
• The decision to remove protected and/or unprotected points has no costs.
→ →
Connected networkafter Phase I
Unprotected pointfor removal selected
Disconnected net-work after Phase II

18Brangewitz, Djawadi, Endres, Hoyer:
Network Formation and Disruption - An Experiment
Payments
• Your payment consists of two parts: You receive a payment for one of the networks that you designedin Phase I and for one of the networks from which you removed points in Phase II.
• The payment-relevant network is determined after the experiment by means of one randomly chosenparticipant rolling a dice.
• For the payment only the remaining networks after Phase II are going to be considered.
• The payment of the networks depends on the related task.
– For the networks you designed (Phase I), you receive a potential payment for connected networks.This means that if after Phase II a network is
– disconnected, your potential payment for this network is 0 Taler. You are charged no costsfor the links and protection of points.
– connected, your potential payment for this network is 100 Taler less the costs for the estab-lished links, the initial links and the protected points.
– For networks in which you removed points (Phase II), you receive a potential payment for dis-connected networks. This means that if after Phase II one of the networks in which you removedpoints is
– disconnected, your potential payment for this network is 20 Taler.
– connected, your potential payment for this network is 0 Taler.
• The currency Taler will be converted with an exchange rate of 2.00 Euro per 10 Taler. The paymentis paid in cash together with a show-up fee of 5.00 Euro.
Examples for the payment
Example 1
after Phase I after Phase II
Number of links: 7Number of protected points: 1Costs: 35 Taler + 20 Taler = 55 Taler
Number of removed points: 2Status of the network: connected
Payment for the network designer:100 Taler – 55 Taler = 45 Taler
Payment for the point-remover: 0 Taler
Example 2
after Phase I after Phase II
Number of links: 9Number of protected points: 0Costs: 45 Taler
Number of removed points: 1Status of the network: connected
Payment for the network designer:100 Taler – 45 Taler = 55 Taler
Payment for the point-remover: 0 Taler
Example 3
after Phase I after Phase II
Number of links: 5Number of protected points: 0Costs: 25 Taler
Number of removed points: 0Status of the network: disconnected
Payment for the network designer: 0 TalerPayment for the point-remover: 20 Taler
[Please note, for T2 the costs for protection are 30 Taler, and the calculations change accordingly.]

19Brangewitz, Djawadi, Endres, Hoyer:
Network Formation and Disruption - An Experiment
Please note:
• During the entire experiment, any and all forms of communication is not permitted.
• All mobile phones must be switched off during the entire duration of the experiment.
• The decisions you make within this experiment are anonymous: i.e., none of the other participantsgets to know the identity of a person who has made a specific decision.
• Please remain seated until the end of the experiment. You will be called forward for your payment byyour seat number.
Good luck and thank you very much for your participation in this experiment!

20Brangewitz, Djawadi, Endres, Hoyer:
Network Formation and Disruption - An Experiment
D.2 Instructions Money Request Game
The experiment is over now. We proceed with the questionnaire.
Instructions questionnaire part 1:
• In part 1 of the questionnaire, we would like to know how you decide when you have the possibility torequest an amount of money.
• More precisely, you are in the following situation:
“You and another participant play a game, in which you request an amount of money. Theamount of money needs to be an integer between 11 and 20 Euro. You may only selectnumbers in steps of 1. You and the other participant will receive the amount requested. Oneof you will receive an additional 20 Euro if he asks for exactly one Euro less than the otherparticipant. What amount of money do you request?”
• Thus, you may chose a number and enter this number in the display box.
• Afterwards, you will be asked to explain your decision.
Additional profit opportunity in part 1 of the questionnaire:
• In the first part of the questionnaire you have another chance to win a payment.
• For this, one group of two participants in this room will be drawn randomly.
• The group will be selected by chance: A random participant will draw one of the group numbers.
• The number which was drawn will be passed through the room silently, in order for all participants tosee the number.
• You will be informed on the computer screen about your group and whether you have won.
• The selected group receives the additional payment, one of them potentially the additional 20 Euroand the payment for the main experiment after the completion of the final part of the questionnaire.
Upon the completion of the first part of the questionnaire by all participants, part 2 will follow. The answersin part 2 are irrelevant for the payment.
All questions will be evaluated anonymously and communication is not allowed during the complete experi-ment.
Thank you very much for the participation in this experiment!

č