netarch - lab n 1fourmaux/ares/arest1v62_en.pdf3/14 lab n 1 v6.2 master informatique netarch network...
TRANSCRIPT

Master Informatique NetArch Network Architecture
NetArch - Lab n̊ 1
Introduction to the networking testbed
This first handout is meant to familiarize you with the testbed environment that we use for the course’s laboratory exercises.Throughout the semester, we will be generating and then analyzing real network traffic traces. Today’s lab starts with a tutorialintroduction to the format that we will use for describing traffic traces by hand (Part 1) and an introduction to the wiresharktool for automated analysis of traces (Part 2). Then you learn about the networking testbed on which we will generate ourtraces (Part 3). It finishes with a practical exercise (Part 4) in which you generate traffic on the testbed and analyze it withwireshark, before you clean up the environment at the end of the lab (Part 5). At the end of this handout, you have a referencepage that provides the structure of common link-, network-, and transport-layer frames/packets/datagrams, and that will aidyou in conducting your analysis.
1 Introduction to trace analysis (without computer assistance)
To study the traffic exchanged in a network, administrators commonly use hardware or software capture tools called sniffers. Asoftware sniffer comprises a specialized multi-protocol capture and analysis program, such as tcpdump or wireshark, runningon general-purpose equipment, such as a PC with a network interface card.
1.1 Network traffic traces
Traces are typically captured at the link layer and consist of a sequence of (potentially truncated) frames. Sniffer softwarereceives each frame from the card as a binary dump. The basic way to display the frame is byte by byte, in a three columnformat:
¶ · ¸
0000 00 50 7f 05 7d 40 00 10 a4 86 2d 0b 08 00 45 00 .P..}@.. ..-...E.0010 02 19 17 98 40 00 40 06 6c 14 0a 21 b6 b2 c0 37 ....@.@. l..!...70020 34 28 84 b3 00 50 b6 94 b0 b8 24 67 89 e9 80 18 4(...P.. ..$g....0030 16 d0 60 e4 00 00 01 01 08 0a 00 6f a7 32 00 00 ..‘..... ...o.2..0040 00 00 47 45 54 20 2f 20 48 54 54 50 2f 31 2e 31 ..GET / HTTP/1.10050 .. .. .. .. .. ..
¶ the first column consists of 4 hexadecimal digits indicating the rank of the first byte of the current line in the frame;
· each line of the second column displays 16 bytes of the frame, each byte being expressed by two hexadecimal characters,corresponding to a decimal value between 0 and 255;
¸ each line of the third column displays the 16 ASCII characters that correspond to the 16 bytes of that line (this canhelp in interpreting the contents of the frame if the bytes represent printable ASCII characters, which are in the range0x20-0x7E (decimal 32-126); if they are out of this range then a period ‘.’ is shown.
Important points, prior to analyzing our first frame:
• The sniffer typically captures Ethernet frames. But network adapter cards may limit the information they provide to thekernel. The frames shown here include neither the preamble nor the CRC.
• In order to communicate effectively, both in the classroom and in your professional life, you will need to observe thestandard conventions on how to write various values, notably:
– Ethernet addresses: colon hexadecimal notation (e.g., 00:50:04:ef:6b:18)
– EtherType: hexadecimal notation (e.g., 0x0806)
– IP addresses: dotted decimal notation (e.g., 10.1.1.3)
– protocol number and port number: decimal (e.g., 17)
– ...
1/14 Lab n̊ 1 v6.2

Master Informatique NetArch Network Architecture
1.2 Analyzing a frame by hand
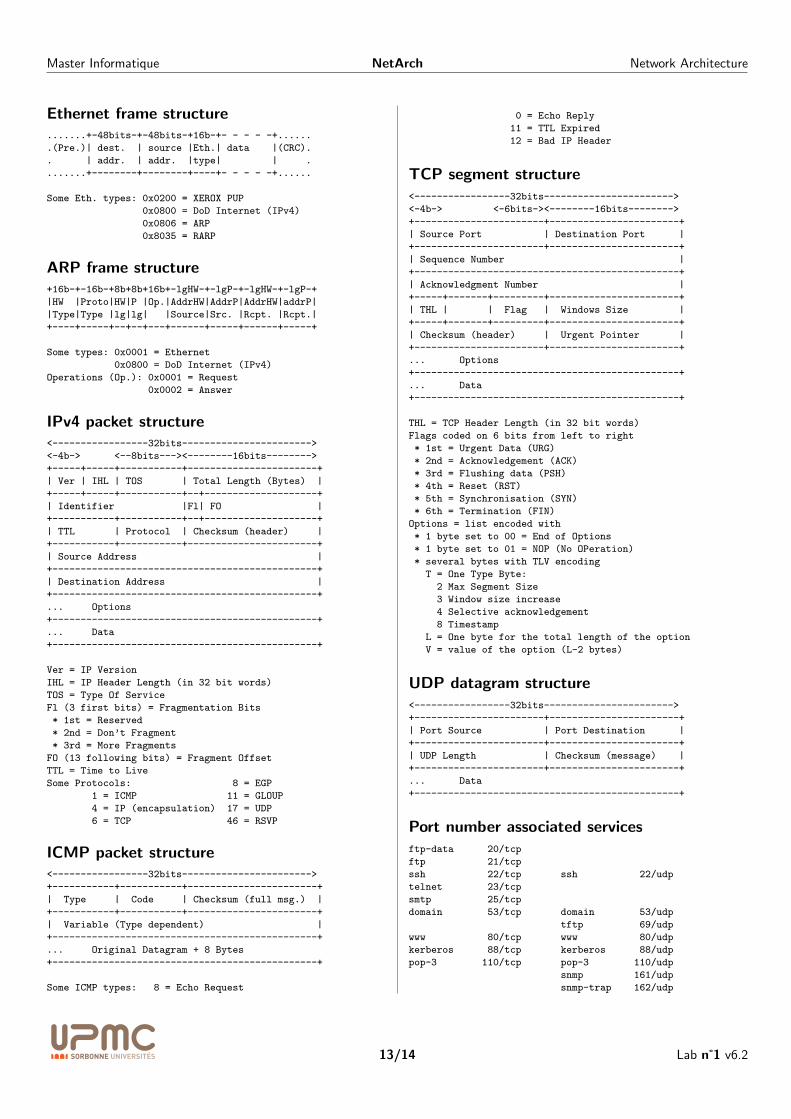
To fully understand how a sniffer analyzes a frame, we analyze by hand the beginning of a frame captured on an Ethernetnetwork. Though tedious, this exercise is necessary if you are to acquire a good understanding of encapsulation mechanismsand develop a critical eye that will help you detect potential errors of interpretation by automated tools. The reference sheeton page 13 will help you decrypt the structures encountered at each protocol layer.
0000 00 50 7f 05 7d 40 00 10 a4 86 2d 0b 08 00 45 00 .P..}@.. ..-...E.
0010 02 19 17 98 40 00 40 06 6c 14 0a 21 b6 b2 c0 37 ....@.@. l..!...7
0020 34 28 84 b3 00 50 b6 94 b0 b8 24 67 89 e9 80 18 4(...P.. ..$g....
0030 16 d0 60 e4 00 00 01 01 08 0a 00 6f a7 32 00 00 ..‘..... ...o.2..
0040 00 00 47 45 54 20 2f 20 48 54 54 50 2f 31 2e 31 ..GET / HTTP/1.1
0050 0d 0a 48 6f 73 74 3a 20 77 77 77 2e 78 69 72 63 ..Host: www.xirc
0060 6f 6d 2e 63 6f 6d 0d 0a 55 73 65 72 2d 41 67 65 om.com.. User-Age
0070 6e 74 3a 20 4d 6f 7a 69 6c 6c 61 2f 35 2e 30 20 nt: Mozi lla/5.0
0080 28 58 31 31 3b 20 55 3b 20 4c 69 6e 75 78 20 69 (X11; U; Linux i
0090 36 38 36 3b 20 65 6e 2d 55 53 3b 20 72 76 3a 31 686; en- US; rv:1
00a0 2e 30 2e 30 29 20 47 65 63 6b 6f 2f 32 30 30 32 .0.0) Ge cko/2002
00b0 30 36 32 33 20 44 65 62 69 61 6e 2f 31 2e 30 2e 0623 Deb ian/1.0.
00c0 .. ..
1. Reveal the frame’s composition by sketching on the printout the boundaries of each of its constituent structures.
2. What information can you observe concerning the link layer?
2/14 Lab n̊ 1 v6.2

Master Informatique NetArch Network Architecture
3. Sketch on the printout the boundaries of each of the packet fields. What is the size of this packet and what can youdeduce from this? Does the packet include options and what is the impact on the structure of the packet? What are thesource and destination addresses of the packet?
4. Sketch on the printout the details of the data carried by the packet. Which transport protocol is used? Which portnumbers? What do they indicate?
5. The reference page at the end of this document does not describe the application layer. Nonetheless, can you deduceanything about this layer in the trace?
2 Frame analysis with wireshark
The wireshark1 program conducts both frame capture and protocol analysis. It is capable of capturing frames directly fromthe LAN to which your computer is connected, through the network interface card. In this lab, however, we will use it purely toanalyze a trace that was previously captured and stored as a file.
Figure 1: The main window of wireshark
Note: To work on these exercises from outside the university, you can copy the trace file during the lab or obtain the tracefile from:
http://www-rp.lip6.fr/~fourmaux/Traces/labV6.html
2.1 Introduction to wireshark
Start by logging into a PC in the computer lab using a GNU/Linux account (either with your own account, or your lab partnerdoes so with their account). Sniffer software requires administrator’s rights (“root access”) in order to capture network traffic,which might contain private information. However, in order to maintain a stable and secure shared environment for hundreds ofpeople, the ARI2 does not grant students root access on these machines. Later on, we will see how to capture packets on other,less sensitive, machines. For now, you will use only the protocol analysis capabilities of wireshark on prerecorded traces. Forthe program to work properly, you must explicitly run it in user mode rather than in administrator mode.
1wireshark is free software. It is available for many hardware platforms and operating systems, beyond the i686 system with GNU/Linux that youare currently using. You can download it at http://www.wireshark.org.
2The ARI, or Atelier de Ressources Informatiques, manages the student computing resources of the UPMC Faculty of Engineering.
3/14 Lab n̊ 1 v6.2
Master Informatique NetArch Network Architecture
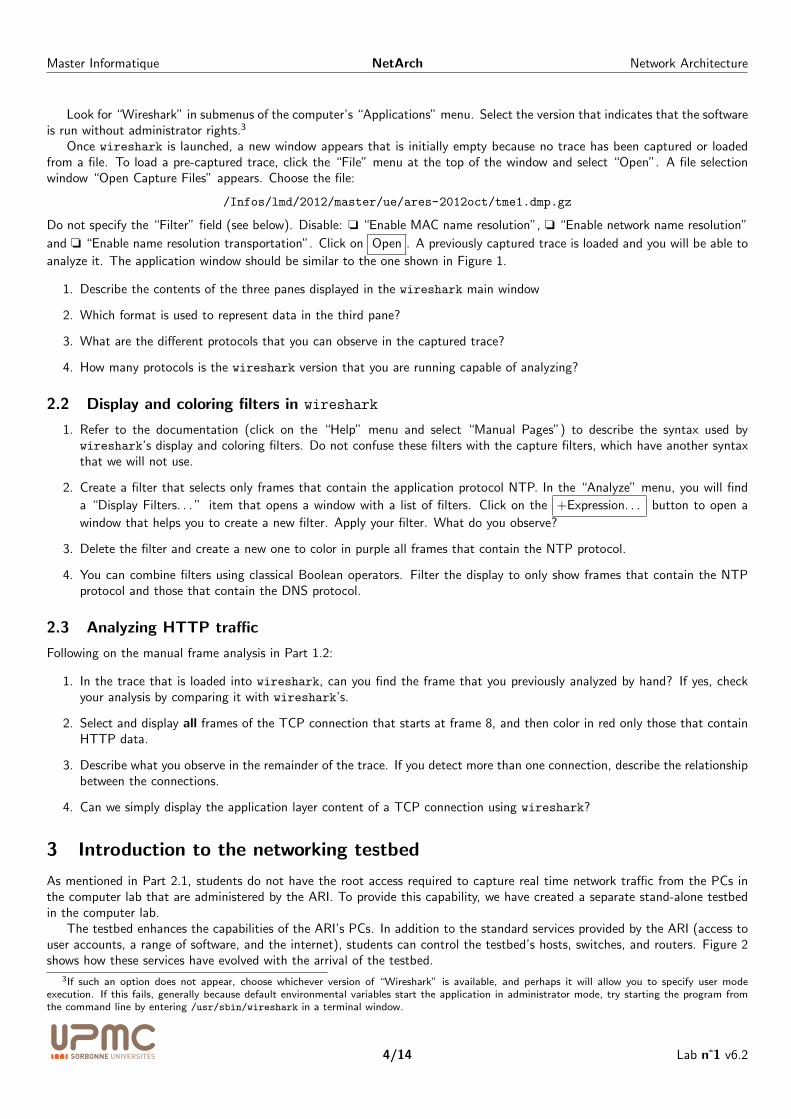
Look for “Wireshark” in submenus of the computer’s “Applications” menu. Select the version that indicates that the softwareis run without administrator rights.3
Once wireshark is launched, a new window appears that is initially empty because no trace has been captured or loadedfrom a file. To load a pre-captured trace, click the “File” menu at the top of the window and select “Open”. A file selectionwindow “Open Capture Files” appears. Choose the file:
/Infos/lmd/2012/master/ue/ares-2012oct/tme1.dmp.gz
Do not specify the “Filter” field (see below). Disable: o “Enable MAC name resolution”, o “Enable network name resolution”
and o “Enable name resolution transportation”. Click on Open . A previously captured trace is loaded and you will be able to
analyze it. The application window should be similar to the one shown in Figure 1.
1. Describe the contents of the three panes displayed in the wireshark main window
2. Which format is used to represent data in the third pane?
3. What are the different protocols that you can observe in the captured trace?
4. How many protocols is the wireshark version that you are running capable of analyzing?
2.2 Display and coloring filters in wireshark
1. Refer to the documentation (click on the “Help” menu and select “Manual Pages”) to describe the syntax used bywireshark’s display and coloring filters. Do not confuse these filters with the capture filters, which have another syntaxthat we will not use.
2. Create a filter that selects only frames that contain the application protocol NTP. In the “Analyze” menu, you will find
a “Display Filters. . . ” item that opens a window with a list of filters. Click on the +Expression. . . button to open a
window that helps you to create a new filter. Apply your filter. What do you observe?
3. Delete the filter and create a new one to color in purple all frames that contain the NTP protocol.
4. You can combine filters using classical Boolean operators. Filter the display to only show frames that contain the NTPprotocol and those that contain the DNS protocol.
2.3 Analyzing HTTP traffic
Following on the manual frame analysis in Part 1.2:
1. In the trace that is loaded into wireshark, can you find the frame that you previously analyzed by hand? If yes, checkyour analysis by comparing it with wireshark’s.
2. Select and display all frames of the TCP connection that starts at frame 8, and then color in red only those that containHTTP data.
3. Describe what you observe in the remainder of the trace. If you detect more than one connection, describe the relationshipbetween the connections.
4. Can we simply display the application layer content of a TCP connection using wireshark?
3 Introduction to the networking testbed
As mentioned in Part 2.1, students do not have the root access required to capture real time network traffic from the PCs inthe computer lab that are administered by the ARI. To provide this capability, we have created a separate stand-alone testbedin the computer lab.
The testbed enhances the capabilities of the ARI’s PCs. In addition to the standard services provided by the ARI (access touser accounts, a range of software, and the internet), students can control the testbed’s hosts, switches, and routers. Figure 2shows how these services have evolved with the arrival of the testbed.
3If such an option does not appear, choose whichever version of “Wireshark” is available, and perhaps it will allow you to specify user modeexecution. If this fails, generally because default environmental variables start the application in administrator mode, try starting the program fromthe command line by entering /usr/sbin/wireshark in a terminal window.
4/14 Lab n̊ 1 v6.2

Master Informatique NetArch Network Architecture
(2003-2009)
SwitchX 16
(2009-…)
X 16
PC server
console ctrl
PC probe
Router
PC client
PC ARI PC ARI
power ctrlInternet
via ARI
Internet
via ARI
Figure 2: Enhancement of the computer lab resources
3.1 Hardware components of the networking testbed
The testbed consists of two 42U 19-inch racks containing the following equipment:
• CISCO Catalyst 2950-12 switches, 12 ports100BaseT:
– control and management (port and VLAN)
– port mirroring (for frame capture)
• CISCO 2801 routers, 2 ports 10/100BaseT, IOS 12.4with two level of service:
– IP Base: IPv4, RIP, OSPF, IGMP, Netflows, QoS,RSVP, DiffServ, DHCP, NAT, SNMP, RMON,NTP, L2TP, AAA...
– Advanced IP Services: IOS IP Base + IPv6,BGP, Mobile IP, VoIP, SIP, H323, Firewall, IPSEC,VPN, AES...
• 1U rackable PC, mono-proc. Intel XEON QuadCore(X3220, 2.4GHz), 4Go RAM DDR2 667MHz, HD 250Go7K2Tm, 4 NIC Ethernet 1000BaseT, running virtual ma-chines (VM) with:
– Debian GNU/Linux including classical Unix net-working environment (Telnet, SSH, FTP, TFTP,SCP, SFTP, HTTP, SMTP, POP, IMAP, Webmail,SNMP, DNS...)
3.2 Student guide to the networking testbed
Each pair of students accesses the testbed via an ARI-administered PC in the computer lab. This is a classic PC with two networkinterface cards (NICs). One card allows the usual access to the internet via the ARI’s network, while the other provides directaccess to the networking testbed. Indeed, the only way to access the testbed is via the PCs in the lab (room 31-208), whichimplies that students must either be physically present in the room, or logged in remotely via SSH (ssh -X ari-31-208-N).There is no routing or relaying between the ARI’s network and the testbed, which ensures that the testbed remains isolated anddoes not raise security concerns.
ARI-administered PCs ari-31-208-01 through ari-31-208-08 are connected to rack 1 and ari-31-208-09 throughari-31-208-16 are connected to rack 2.
5/14 Lab n̊ 1 v6.2

Master Informatique NetArch Network Architecture
We use N to designate the last number of the host name of an ARI-administered PC. PC N has direct reserved access tothree machines on the testbed:
• the switch N
• the router N
• the racked host N, on which there are three virtual machines (VMs):
– the “client” VM N1
– the “monitor” VM N2
– the “server” VM N3
Figure 3 shows the setup of the experimentation environment, with the three virtual machines.
PC N
PC ARI N
Admin.
network eth0eth1
Experimentation
networks of
host N
VM N1
VM N2
VM N3
eth0
eth0
eth0 eth1 eth3
eth1 eth2
eth1 eth1
Figure 3: Configuration of the three VMs of the platform
Your tutor will provide you, when needed, with the logins and passwords for accessing the testbed equipment.
3.3 Available topologies
The testbed allows students to deploy a variety of virtual network topologies. (We use virtual topologies because these are easilyconfigured and reset without physical access to the racks, which are closed to the students.) Figure 4 shows the underlyingphysical links on which the packets transit.
3.3.1 Topology 1 (no router – first weeks’ labs)
This first virtual topology consists of two hosts exchanging traffic over a LAN. As shown in Figure 5, the hosts are VM N1,on which you will run a client program, and VM N3, on which you will start a server. The client-server traffic will go over theexperimental network VLAN N1. On VM N2, you will run a sniffer to capture this traffic. You will control the experiment fromthe ARI PC, accessing the virtual machines via the administrative network VLAN 200.
3.3.2 Topology 2 (one router – later labs)
This second virtual topology also consists of the two hosts, VMs N1 and N3, but in this case each one is on a separate LAN,VLAN N1 and VLAN N2 respectively, which are connected by a router. See Figure 6. In addition to controlling the hosts viathe administrative network VLAN 200, you will also be able to configure the router. This configuration allows you to study thebehavior of routed traffic, sniffing, as before, from VM N2.
6/14 Lab n̊ 1 v6.2

Master Informatique NetArch Network Architecture
Internet
via ARI
VM N3
VM N1
PC ARI N
Router N
Switch N
Admin. switch
VM N2
Figure 4: Physical topology associated with an ARI host
Internet
via ARI
VM N3
VM N1
PC ARI N
Admin. network 10.0/16
(VLAN 200)
Single LAN
10.N/16
(VLAN N1)
7.N3
7.N2
7.N1ari-31-208-N
0.N
Switch N
2.N
N1.1
N1.3
N1.253
VM N2
Figure 5: Virtual Topology 1 (one LAN)
Internet
via ARI
VM N3
VM N2
VM N1Admin. network 10.0/16
(VLAN 200)
VLAN N110.N.N1/24
7.N3
7.N2
7.N1
ari-31-208-N
0.N
Switch N
2.N
1
3VLAN N2
10.N.N2./24
3.N
254
254
PC ARI N
Router N
Figure 6: Virtual Topology 2 (two LANs and one router)
7/14 Lab n̊ 1 v6.2

Master Informatique NetArch Network Architecture
3.3.3 Topology 3 (multiple routers – last, and other courses’ labs)
The testbed is capable of providing more advanced configurations, involving multi-hop routing (multiple routers running RIP,OSPF, and/or BGP routing protocols). You will explore these in some of the other courses offered by the Networks Mastersprogram.
3.3.4 IPv4 addressing conventions relative to host N
Mainly two kind of VLAN are used in the networking testbed:
• The management VLAN (VLAN 200) and its management IPv4 addresses for:
– the ARI host N interface eth1 (access to the testbed via the management network): 10.0.0.N
– the switches: 10.0.2.N
– the routers: 10.0.3.N
– the “client” VMs N1 (eth0): 10.0.7.N1
– the “monitor” VMs N2 (eth0): 10.0.7.N2
– the “server” VMs N3 (eth0): 10.0.7.N3
• The experimentation VLANs Nv (with 0 < v) and their experimentation IPv4 addresses for:
– the “client” VMs N1 of VLANs Nv (eth1): 10.N.v.N1
– the “server” VMs N3 of VLANs Nv (eth1): 10.N.v.N3
– the routers of VLANs Nv: 10.N.v.254
3.4 Generating and capturing traffic
The ARI host is connected to the the administrative network of the networking testbed through its eth1 interface as shown inFigure 3. You can check the configuration of the interface with the /sbin/ifconfig Unix command. If the eth1 interface isunknown, then reboot your ARI host.
3.4.1 Remote control of the three virtual machines
For whichever topology you create, you will be controlling the virtual machines remotely via SSH from ARI PC N. Your login onall VMs is etudiant, or root if needed, and your tutor will provide you the password. To open each session, open a terminalwindow on host N and type the following at the command line:
• for the “client” VM (windows 1): ssh -X [email protected]
• for the “monitor” VM (windows 2): ssh -X [email protected]
• for the “server” VM (windows 3): ssh -X [email protected]
The “-X” option, which redirects the X11 graphical environment from the virtual machine to your local host, can be skippedif a purely textual environment is sufficient for your purposes. (For these exercises, though, we will make use of the graphicalenvironment.)
The virtual machines each have two (virtual) network interfaces, eth0, connected to the administrative network, and eth1,connected to the experimental network, as shown in Figure 3. You can check the configuration of each interface on each VMwith the /sbin/ifconfig Unix command. Run this command in each of the terminal windows, and you should see informationsimilar to that shown in Figure 7.
8/14 Lab n̊ 1 v6.2

Master Informatique NetArch Network Architecture
Figure 7: SSH sessions from host ari-31-208-01
3.4.2 Running wireshark and starting a capture
The standard case that we study is that of a client running on one VM, the wireshark sniffer software running on a secondVM, and a server on a third VM. The sniffer’s VM is connected via its eth1 interface to a LAN on which the client-servertraffic is transiting, and it is able to capture all traffic on that LAN by putting the interface into “promiscuous” mode. Undermost operating systems, a network interface card only picks up traffic that is explicitly addressed to its MAC address or to thebroadcast MAC address. This reduces processing overhead for the host and it also provides a measure of privacy for others’data that circulate on the LAN. For a networked application such as wireshark to put an interface into promiscuous mode, itmust have root access. This is provided by login as root user in the “monitor” VM. Caution: When you run commandswith administrator privileges, there are fewer limits that prevent you from damaging the operating system that youare using. Take extra care to backup your work, and be sure to leave the virtual machines as you have found themfor the next students.
Figure 8: Starting wireshark with administrator privileges
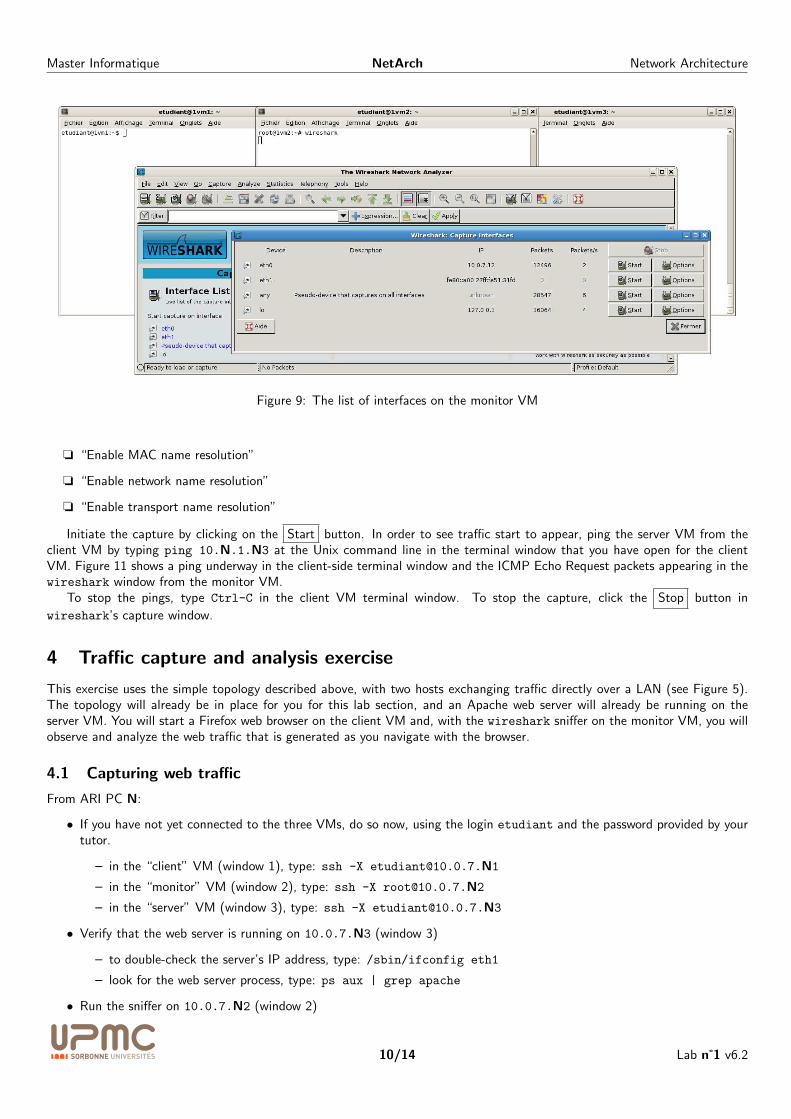
You will know that you have started wireshark on the monitor VM because a wireshark window will appear on your PC,thanks to X11 redirection. Initially, you should see a new windows as shown in Figure 8. Select the “Capture” menu and clickon “Interfaces ...”. As shown in Figure 9, a window presenting the different interfaces of the monitor VM will appear. Click on
the Options button for interface eth1. (Note: this interface only supports IPv6, and so you will see an IPv6 address for this
interface rather than an IPv4 address.)A new window appears, as seen in Figure 10. Do not specify any filters in the “Capture Filter”. Deselect:
9/14 Lab n̊ 1 v6.2
Master Informatique NetArch Network Architecture
Figure 9: The list of interfaces on the monitor VM
o “Enable MAC name resolution”
o “Enable network name resolution”
o “Enable transport name resolution”
Initiate the capture by clicking on the Start button. In order to see traffic start to appear, ping the server VM from theclient VM by typing ping 10.N.1.N3 at the Unix command line in the terminal window that you have open for the clientVM. Figure 11 shows a ping underway in the client-side terminal window and the ICMP Echo Request packets appearing in thewireshark window from the monitor VM.
To stop the pings, type Ctrl-C in the client VM terminal window. To stop the capture, click the Stop button in
wireshark’s capture window.
4 Traffic capture and analysis exercise
This exercise uses the simple topology described above, with two hosts exchanging traffic directly over a LAN (see Figure 5).The topology will already be in place for you for this lab section, and an Apache web server will already be running on theserver VM. You will start a Firefox web browser on the client VM and, with the wireshark sniffer on the monitor VM, you willobserve and analyze the web traffic that is generated as you navigate with the browser.
4.1 Capturing web traffic
From ARI PC N:
• If you have not yet connected to the three VMs, do so now, using the login etudiant and the password provided by yourtutor.
– in the “client” VM (window 1), type: ssh -X [email protected]
– in the “monitor” VM (window 2), type: ssh -X [email protected]
– in the “server” VM (window 3), type: ssh -X [email protected]
• Verify that the web server is running on 10.0.7.N3 (window 3)
– to double-check the server’s IP address, type: /sbin/ifconfig eth1
– look for the web server process, type: ps aux | grep apache
• Run the sniffer on 10.0.7.N2 (window 2)
10/14 Lab n̊ 1 v6.2

Master Informatique NetArch Network Architecture
Figure 10: Capture options for interface eth1
Figure 11: Capturing ping traffic (ICMP packets)
11/14 Lab n̊ 1 v6.2

Master Informatique NetArch Network Architecture
– run the sniffer, type: wireshark
– initiate the capture on interface eth1, as previously described
• Start a web browser on 10.0.7.N1 (window 1)
– run the client, type: firefox (on a Debian system, it might be named iceweasel instead)
– direct the browser to the URL http://10.N.1.N3
• The captured trace shown in the wireshark window should be similar to that seen in Figure 12, with a browser windowon the left, wireshark in the middle, and information about the web server appearing in the terminal window on theright. Remember to terminate the capture.
Figure 12: Capturing web traffic
4.2 Analyzing the captured web traffic
Keep Firefox and wireshark open and, with the trace that the sniffer is displaying:
1. Select all frames containing HTTP data.
2. Describe what you observe. If there are multiple connections, explain their relationship.
3. On the client side, use the browser to observe the HTML source code of the page that it is displaying. On the serverside, try to find this page in the file system of the VM. Then, from the monitor’s perspective, verify in the trace that thiscontent has in fact crossed the network.
5 Before leaving the room
• Before closing your connections to the virtual machines, be sure to restore them to the state in which you found them,removing any modifications you might have made.
12/14 Lab n̊ 1 v6.2
Master Informatique NetArch Network Architecture
Ethernet frame structure.......+-48bits-+-48bits-+16b-+- - - - -+......
.(Pre.)| dest. | source |Eth.| data |(CRC).
. | addr. | addr. |type| | .
.......+--------+--------+----+- - - - -+......
Some Eth. types: 0x0200 = XEROX PUP
0x0800 = DoD Internet (IPv4)
0x0806 = ARP
0x8035 = RARP
ARP frame structure+16b-+-16b-+8b+8b+16b+-lgHW-+-lgP-+-lgHW-+-lgP-+
|HW |Proto|HW|P |Op.|AddrHW|AddrP|AddrHW|addrP|
|Type|Type |lg|lg| |Source|Src. |Rcpt. |Rcpt.|
+----+-----+--+--+---+------+-----+------+-----+
Some types: 0x0001 = Ethernet
0x0800 = DoD Internet (IPv4)
Operations (Op.): 0x0001 = Request
0x0002 = Answer
IPv4 packet structure<-----------------32bits----------------------->
<-4b-> <--8bits---><--------16bits-------->
+-----+-----+-----------+-----------------------+
| Ver | IHL | TOS | Total Length (Bytes) |
+-----+-----+-----------+--+--------------------+
| Identifier |Fl| FO |
+-----------+-----------+--+--------------------+
| TTL | Protocol | Checksum (header) |
+-----------+-----------+-----------------------+
| Source Address |
+-----------------------------------------------+
| Destination Address |
+-----------------------------------------------+
... Options
+-----------------------------------------------+
... Data
+-----------------------------------------------+
Ver = IP Version
IHL = IP Header Length (in 32 bit words)
TOS = Type Of Service
Fl (3 first bits) = Fragmentation Bits
* 1st = Reserved
* 2nd = Don’t Fragment
* 3rd = More Fragments
FO (13 following bits) = Fragment Offset
TTL = Time to Live
Some Protocols: 8 = EGP
1 = ICMP 11 = GLOUP
4 = IP (encapsulation) 17 = UDP
6 = TCP 46 = RSVP
ICMP packet structure<-----------------32bits----------------------->
+-----------+-----------+-----------------------+
| Type | Code | Checksum (full msg.) |
+-----------+-----------+-----------------------+
| Variable (Type dependent) |
+-----------------------------------------------+
... Original Datagram + 8 Bytes
+-----------------------------------------------+
Some ICMP types: 8 = Echo Request
0 = Echo Reply
11 = TTL Expired
12 = Bad IP Header
TCP segment structure<-----------------32bits----------------------->
<-4b-> <-6bits-><--------16bits-------->
+-----------------------+-----------------------+
| Source Port | Destination Port |
+-----------------------+-----------------------+
| Sequence Number |
+-----------------------------------------------+
| Acknowledgment Number |
+-----+-------+---------+-----------------------+
| THL | | Flag | Windows Size |
+-----+-------+---------+-----------------------+
| Checksum (header) | Urgent Pointer |
+-----------------------+-----------------------+
... Options
+-----------------------------------------------+
... Data
+-----------------------------------------------+
THL = TCP Header Length (in 32 bit words)
Flags coded on 6 bits from left to right
* 1st = Urgent Data (URG)
* 2nd = Acknowledgement (ACK)
* 3rd = Flushing data (PSH)
* 4th = Reset (RST)
* 5th = Synchronisation (SYN)
* 6th = Termination (FIN)
Options = list encoded with
* 1 byte set to 00 = End of Options
* 1 byte set to 01 = NOP (No OPeration)
* several bytes with TLV encoding
T = One Type Byte:
2 Max Segment Size
3 Window size increase
4 Selective acknowledgement
8 Timestamp
L = One byte for the total length of the option
V = value of the option (L-2 bytes)
UDP datagram structure<-----------------32bits----------------------->
+-----------------------+-----------------------+
| Port Source | Port Destination |
+-----------------------+-----------------------+
| UDP Length | Checksum (message) |
+-----------------------+-----------------------+
... Data
+-----------------------------------------------+
Port number associated servicesftp-data 20/tcp
ftp 21/tcp
ssh 22/tcp ssh 22/udp
telnet 23/tcp
smtp 25/tcp
domain 53/tcp domain 53/udp
tftp 69/udp
www 80/tcp www 80/udp
kerberos 88/tcp kerberos 88/udp
pop-3 110/tcp pop-3 110/udp
snmp 161/udp
snmp-trap 162/udp
13/14 Lab n̊ 1 v6.2

Master Informatique NetArch Network Architecture
14/14 Lab n̊ 1 v6.2