net 4 india ltdnet4 is india’s leading data centre, cloud hosting and network services provider....
TRANSCRIPT
Stakeholders’ Education | Corporate Governance Research | Corporate Governance Score | Proxy Advisory
STAKEHOLDERS EMPOWERMENT SERVICES
1 | P A G E
SECTOR: IT-SOFTWARE REPORTING DATE: 1ST JUNE, 2016
NET 4 INDIA LTD. www.net4india.com
Net 4 India Ltd 1st June, 2016 TABLE 1 - MARKET DATA (STANDALONE) (As on 27th May, 2016)
NSE Code - NET4 NSE Market Price (₹) 1.70 NSE Market Cap. (₹Cr.) 4.87
Sector - IT - Software Face Value (₹) 10.00 Equity (₹Cr.) 20.06
52-week High/Low (₹) 3.40/1.60 Net worth (₹Cr.) -113.18
Business Group - Indian Private TTM P/E N.A. Traded Volume (Shares) 100
Year of Incorporation - 1985 TTM P/BV N.A. Traded Volume (lacs) 0.00
Source - Capitaline
Corporate Office: COMPANY BACKGROUND
AB-11, Community Centre, Net4 is India’s leading Data Centre, Cloud Hosting and Network Services Provider. It is a
NSE & BSE listed business enterprise. Net4 focuses on providing services to businesses
(small, medium and large) and its offerings include Data Centre & Cloud Solutions
Enterprise Internet Services, VoIP Solutions, Enterprise Messaging & Hosting Solutions
and Domain name registration. The company was incorporated in the year 1985.
The company’s client base includes the likes of CNBC TV18, Essar, Godrej, Hutch, ITC, L&T,
Lufthansa, NIIT, ONGC, Proctor & Gamble, Reliance, Sahara, SBI, Siemens, and TCS.
1st & 2nd Floor, Safdarjung Enclave,
New Delhi – 110 029, New Delhi
Company Website:
www.net4india.com
TABLE 3 - FINANCIALS
(₹Cr.) 2015 2014 2013 % Change CAGR for 2
years 2015 vs 2014 2014 vs 2013
Net Worth -113.18 -59.84 140.14 N.A. -142.70% N.A.
Current Assets 35.56 88.15 249.93 -59.66% -64.73% -62.28%
Non-Current Assets 60.69 71.12 98.50 -14.67% -27.80% -21.51%
Total Assets 96.24 159.26 348.43 -39.57% -54.29% -47.44%
Investments 17.55 75.08 102.85 -76.62% -27.00% -58.69%
Finance Cost 4.23 17.70 12.64 -76.10% 40.03% -42.15%
Long Term Liabilities 38.05 30.46 34.93 24.92% -12.80% 4.37%
Current Liabilities 171.37 188.65 173.36 -9.16% 8.82% -0.58%
Turnover 33.57 99.36 315.93 -66.21% -68.55% -67.40%
Profit After Tax (PAT, Cr.) -53.33 -199.99 15.66 N.A. -1377% N.A.
EPS (₹) -27.00 -100.00 8.00 N.A. -1350% N.A.
Source - Money Control/Annual Report
Discussion as per Company:
In Annual Report for FY 2013-14 the Company has mentioned that total Income recorded as on 31st March, 2014 was `
11,006.97 lacs as compared to ` 32,243.95 lacs recorded during the previous fiscal year. Profit After Tax Due to general
slowdown of the economy, profits of the company have turned down to the loss of ` 19,998.64 lacs as compared to the profit
of ` 1,566.29. Earnings per share (EPS) of the company declined to ` (99.70) from ` 07.81 for the financial year 2013-2014.
TABLE 2 - PRICE PERFORMANCE
27th May, 2016 29th May, 2015 30th May, 2014
% Change CAGR for
2 years 2016 vs 2015 2015 vs 2014
Price (₹) 1.70 3.05 6.50 -44.26% -53.08% -48.86%
Trading Volume (Shares)
(yearly avg.) 2,429 14,783 5,176 -83.57% 185.61% -
NSE Market Cap. (in₹ Cr.) 3.41 6.12 13.04 -44.28% -53.07% -48.86%
Source - Money Control
Stakeholders’ Education | Corporate Governance Research | Corporate Governance Score | Proxy Advisory
STAKEHOLDERS EMPOWERMENT SERVICES
2 | P A G E
SECTOR: IT-SOFTWARE REPORTING DATE: 1ST JUNE, 2016
NET 4 INDIA LTD. www.net4india.com
AUDIT QUALIFICATIONS
The Auditors have given Qualified opinion in FY 2014-15 on Company’s accounts:
1. During the financial year 2013-14 the Company had defaulted in repayment of principle and interest thereon of term
loan from State Bank of India. Working capital loans taken from state bank of India. State bank of India of Travancore
and loan against FDR from Canara bank. All the loans had been classified as non-performing assists (NPA) by these
banks. The status of these loans & Credit facilities have remained the same during the current financial year.
2. Income tax demand of ₹ 132.78 Lacs (Approx.) From AY 2004-05 to AY 2011-2012 not deposited and appeals have
been filed or in the process of filling.
3. Service tax Amounting to ₹ 8.33 Crores (net) (Approx.) up to 31st March 2015 not deposited.
4. Provided fund and ESI amounting to ₹ 59.13 lacs (Approx.) up to 31st March 2015 not deposited.
5. TDS Amounting to ₹ 68.59 Lacs(Approx.) as on 31st March 2015 not deposited.
6. VAT liability for certain branches still to be deposited.
7. Fixed Deposit amounting ₹ 13.17 Crore (Approx.) were due for repayment as 31st March 2015 not deposited.
The company has written off bad debts amounting to ₹ 13.78 Crores (Approx.) The company has no security for these debt. On
the bases that no security has been obtained and no cash has been received on these debts, the company has written off bad
debts thereby reducing the profit for the year (if any) and net assets at 31st March by that amount.
Other Matter:
As per statutory records produced before Auditors and explanations given to them, Auditors comment as follows:
(x) There were no Independent Directors in the company leading to non-compliance of the provisions of the listing
Agreement as well as the Companies Act 2013.
(xi) There was no Woman Director in the Board of Directors of the company, leading to noncompliance of the applicable
provision.
(xii) There was no Audit Committee for the year.
(xiii) There was no Nomination and Remuneration Committee for the year.
(xiv) There was no Risk Management Committee for the year.
(xv) There was no Shareholder's & Investor Grievance Committee for the year.
(xvi) There was no Internal Auditor for the year.
(xvii) Non-Compliance of provisions relating to public deposit i.e. as per the requirements of Company (Acceptance of
Deposit) Rules, 1975 a company has to deposit or invest at least 15% of its deposits maturing during the financial year latest
by 30th April 2014. This requirement has not been complied by the company.
(xviii) The company has not provided service tax liability under reverse charge mechanism for the year.
(xix) The company has litigations filed against it under various counts like under section 138 of Negotiable Instrument Act,
Arbitration, petition filed by ex-employee for recovery of dues, winding up petition, etc. The number of cases is large
although the exact number of cases was not made available to us. As per available information & explanation provided by
the management, the quantum of amount on these cases cannot be ascertained.
(xx) The company had received winding up order from the Court on the basis of a petition filed by 2 companies due to non-
repayment of loans. However, the company has obtained stay order from the court on the basis of repayment schedule
submitted before it. The Court has stayed this order subject to payment of ₹ 25 Lacs in 4 weeks out of which ₹ 10 Lacs was
paid immediately and for the balance, the company has time till 1st June, 2015.
(xxi) The company has written off bad debts amounting to ₹ 13.78 Crore (Approx).
Auditors Opinion is not qualified in respect of this matter.
Stakeholders’ Education | Corporate Governance Research | Corporate Governance Score | Proxy Advisory
STAKEHOLDERS EMPOWERMENT SERVICES
3 | P A G E
SECTOR: IT-SOFTWARE REPORTING DATE: 1ST JUNE, 2016
NET 4 INDIA LTD. www.net4india.com
Management has responded to the above qualifications as below:
Directors Reply on Auditors Remarks on financial statement for FY 2014-15
a.) During the financial year 2013-14 the Company had defaulted in repayment of principle and interest thereon of Term
Loan from State Bank of India. Working Capital Loans taken from State Bank of India. State Bank of Travancore and Loan
against FOR from Canara Bank. All the loans had been classified as Non-Performing Assets (NPA) by these banks. The status
of these loans & credit facilities has remained the same during the current financial year.
The Management believes that it was a wrong Calculation from the Banks end and the date at which the account was NPA
was incorrect. The SBI had not Extended facility as per accorded in the Sanctioned Letter Potentially Leading to alleged
Defaults. The same is the case with SBT and further SBT has not Quantified and cleared the Position as to Security Deposit
amounting to ₹ 3. 75 Cr. held by them for the Company against its Loan. With ref to Canara Bank, the management believes
that this loan has been settled with the 100% security Deposit held with Canara Bank.
b.) Income Tax demand of ₹ 132.78Lacs (Approx.) from AY 2004-05 to AY 2011-12 not deposited and appeals have been filed
or in the process of filing.
The company believes the demand is unjust and inaccurate and has accordingly filed appeals in the matter
c.) Service Tax Amounting to ₹ 8.33 Crores (net) (Approx.) up to 31st March 2015 not deposited.
Company believes that there is pending an accurate Calculation of CENVAT Credit and this will reduce the pending amount
significantly. Further to this the Company has been paying more than its accruing liability on a consistent basis over the last
2 years and working to extinguish the liability at the earliest. The company has paid service tax amounting to ₹
6,48,52,0701- in the last 2 years.
d.) Provident Fund and ESI amounting to ₹ 59.13 Lacs (Approx.) up to 31st March, 2015 not deposited.
The Company has now paid of the complete liability of the Financial year 2014-15
e.) TOS amounting to ₹ 68.59 Lacs(Approx.) as on 31st March 2015 not deposited. The Company has deposited TDS
amounting to ₹ 46 lakh approx. f) VAT liability for certain branches still to be deposited.
The Company has deposited VAT amounting to ₹ 2,14,131- and believes that any other demands are unjustified and
incorrect.
g.) Fixed Deposit amounting to ₹ 13.77 crore (approx.) were due for repayment as on 31st March, 2015. The Company has
filed a Fixed deposit Scheme in CLB for Repayment to FD holders, and the company is following the instructions of
Company Law Board from time to time. Pursuant to the instruction of the CLB and even including payments made
otherwise, the company has cleared approximately ₹ 3.80 Cr. of its Fixed Deposit Liability, as above. The company has
written off bad debts amounting to ₹ 13. 78Crores (Approx.) The company has no security for these debts. On the basis that
no security has been obtained and no cash has been received on these debts, the company has written off bad debts thereby
reducing the profit for the year (if any) and net assets at 31st March by that amount.
"As enumerated above, the losses the company suffered were mainly caused due caused due to acute recession/down turn
in the market and liquidity environment starting 2012-2013. The difficulties were further complicated by slow recovery of
the dues from the customers. A large number of customers also refused to pay on account of some or the other product
and service deficiency or non-conformity with the order. Some of these were due to the service and implementation
deficiencies caused by the acute shortage of manpower and the company has had to consequently book these and other
non-recoverable amounts as bad debts."
Other Matters:
As per statutory records produced before Auditors and explanations given to them, Auditors comment as follows:
(i) There were no Independent Directors in the company leading to non-compliance of the provisions of the listing
Agreement as well as the Companies Act 2013.
The Company had already published the advertisement twice in the newspapers in the recent past, concerning inviting
candidature for the appointment of Independent director. However, we have not yet received the appropriate candidature
for the same. Also, the Company is lacking in receipt of director's candidatures, in quantum, for being appointed on the
Stakeholders’ Education | Corporate Governance Research | Corporate Governance Score | Proxy Advisory
STAKEHOLDERS EMPOWERMENT SERVICES
4 | P A G E
SECTOR: IT-SOFTWARE REPORTING DATE: 1ST JUNE, 2016
NET 4 INDIA LTD. www.net4india.com
Board of the Company. The reason behind the lack in receipt of director's candidature would probably be the concerning
financial position of the Company and other ongoing numerous issues/cases therein. The company is going through an
extremely tough financial position since more than two years and has suffered heavy losses. In the backdrop of the above,
the director's, independent or otherwise, might not find their position comfortable; and thus, the company is not receiving
the candidature for the position as such. We, however, submit that the Company is consistently trying to appoint suitable
candidature on the Board of the Company at the earliest and have already taken step in compliance thereof by publishing
the advertisements as specified above and are continually stepping ahead for recruiting the suitable candidature. We are
endeavoring hard for the appointment of the suitable candidature and as soon as we find the suitable candidature, we'll
make the appointment with no delays.
(ii) There was no Woman Director in the Board of Directors of the company, leading to non-compliance of the applicable
provision.
The Company has appointed a woman Director on 30th October,2015.
(iii) There was no Audit Committee for the year.
Due to the Sudden Resignation of all the Independent Directors, the company could not Constitute an audit Committee
(iv) There was no Nomination and Remuneration Committee for the year.
Due to the Sudden Resignation of all the Independent Directors, the company could not Constitute the said Committee
(v) There was no Risk Management Committee for the year.
Due to the Sudden Resignation of all the Independent Directors, the company could not Constitute the said Committee
(vi) There was no Shareholder's & Investor Grievance Committee for the year.
Due to the Sudden Resignation of all the Independent Directors, the company could not Constitute the said Committee.
(vii) There was no Internal Auditor for the year.
Due to the resignation of the Internal auditor the position was vacated however the company shall appoint the same with
no delays.
h.) Non-Compliance of provisions relating to public deposit i.e.as per the requirements of Company (Acceptance of Deposit)
Rules, 1975 a company has to deposit or invest at least 15% of its deposits maturing during the financial year latest by 30th
April 2014. This requirement has not been complied by the company.
Due to the tough financial position the company has filed the repayment scheme to CLB for Repayment to FD holders, and
the company is following the instructions of Company Law Board from time to time. Pursuant to the instruction of the CLB
and even including payments made otherwise, the company has cleared approximately ₹ 3.80 Cr. of its Fixed Deposit
Liability.
(viii) The company has litigations filed against it under various counts like under section 138 of Negotiable Instrument Act,
Arbitration, petition filed by ex-employee for recovery of dues, winding up petition, etc. The number of cases is large
although the exact number of cases was not made available to us. As per available information & explanation provided by
the management, the quantum of amount on these cases cannot be ascertained.
The Company is making all its efforts to make the Settlement with the genuine Debt holders.
(ix) The company had received winding up order from the Court on the basis of a petition filed by 2 companies due to non-
repayment of loans. However, the company has obtained stay order from the court on the basis of repayment schedule
submitted before it. The Court has stayed this order subject to payment of ` 25 Lacs in 4 weeks out of which ` 10 Lacs
was paid immediately and for the balance, the company has time till 17th June, 2015. This observation is incorrect, as,
although the company had received the winding up order dated 23.04.2015 it was not a part of the period under review. Be
that as it may, the Company had appealed the decision and received a stay order dated 18.05.2015 and has paid ` 45 lacs in
compliance of the order of the Hon'ble high Court which is ` 9 lacs more than the actual liability. The matter is under
consideration by the Court.
Stakeholders’ Education | Corporate Governance Research | Corporate Governance Score | Proxy Advisory
STAKEHOLDERS EMPOWERMENT SERVICES
5 | P A G E
SECTOR: IT-SOFTWARE REPORTING DATE: 1ST JUNE, 2016
NET 4 INDIA LTD. www.net4india.com
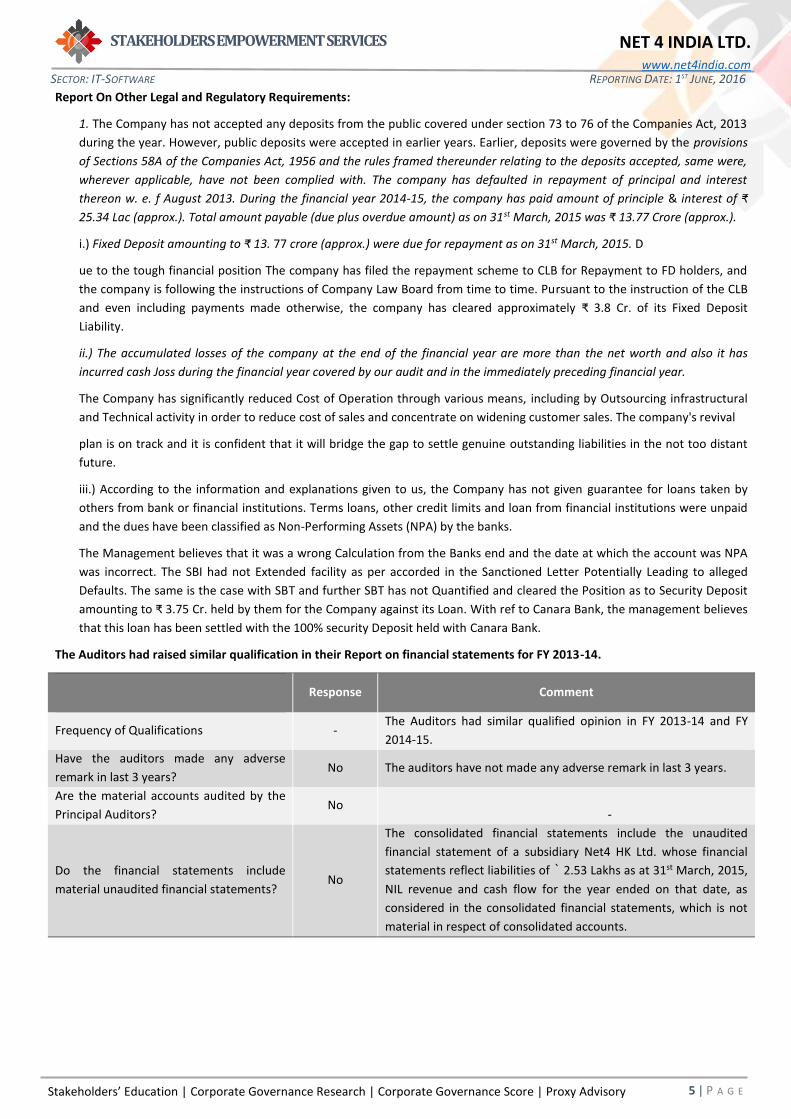
Report On Other Legal and Regulatory Requirements:
1. The Company has not accepted any deposits from the public covered under section 73 to 76 of the Companies Act, 2013
during the year. However, public deposits were accepted in earlier years. Earlier, deposits were governed by the provisions
of Sections 58A of the Companies Act, 1956 and the rules framed thereunder relating to the deposits accepted, same were,
wherever applicable, have not been complied with. The company has defaulted in repayment of principal and interest
thereon w. e. f August 2013. During the financial year 2014-15, the company has paid amount of principle & interest of ₹
25.34 Lac (approx.). Total amount payable (due plus overdue amount) as on 31st March, 2015 was ₹ 13.77 Crore (approx.).
i.) Fixed Deposit amounting to ₹ 13. 77 crore (approx.) were due for repayment as on 31st March, 2015. D
ue to the tough financial position The company has filed the repayment scheme to CLB for Repayment to FD holders, and
the company is following the instructions of Company Law Board from time to time. Pursuant to the instruction of the CLB
and even including payments made otherwise, the company has cleared approximately ₹ 3.8 Cr. of its Fixed Deposit
Liability.
ii.) The accumulated losses of the company at the end of the financial year are more than the net worth and also it has
incurred cash Joss during the financial year covered by our audit and in the immediately preceding financial year.
The Company has significantly reduced Cost of Operation through various means, including by Outsourcing infrastructural
and Technical activity in order to reduce cost of sales and concentrate on widening customer sales. The company's revival
plan is on track and it is confident that it will bridge the gap to settle genuine outstanding liabilities in the not too distant
future.
iii.) According to the information and explanations given to us, the Company has not given guarantee for loans taken by
others from bank or financial institutions. Terms loans, other credit limits and loan from financial institutions were unpaid
and the dues have been classified as Non-Performing Assets (NPA) by the banks.
The Management believes that it was a wrong Calculation from the Banks end and the date at which the account was NPA
was incorrect. The SBI had not Extended facility as per accorded in the Sanctioned Letter Potentially Leading to alleged
Defaults. The same is the case with SBT and further SBT has not Quantified and cleared the Position as to Security Deposit
amounting to ₹ 3.75 Cr. held by them for the Company against its Loan. With ref to Canara Bank, the management believes
that this loan has been settled with the 100% security Deposit held with Canara Bank.
The Auditors had raised similar qualification in their Report on financial statements for FY 2013-14.
Response Comment
Frequency of Qualifications - The Auditors had similar qualified opinion in FY 2013-14 and FY
2014-15.
Have the auditors made any adverse
remark in last 3 years? No The auditors have not made any adverse remark in last 3 years.
Are the material accounts audited by the
Principal Auditors? No
-
Do the financial statements include
material unaudited financial statements? No
The consolidated financial statements include the unaudited
financial statement of a subsidiary Net4 HK Ltd. whose financial
statements reflect liabilities of ` 2.53 Lakhs as at 31st March, 2015,
NIL revenue and cash flow for the year ended on that date, as
considered in the consolidated financial statements, which is not
material in respect of consolidated accounts.

Stakeholders’ Education | Corporate Governance Research | Corporate Governance Score | Proxy Advisory
STAKEHOLDERS EMPOWERMENT SERVICES
6 | P A G E
SECTOR: IT-SOFTWARE REPORTING DATE: 1ST JUNE, 2016
NET 4 INDIA LTD. www.net4india.com
TABLE 4: BOARD PROFILE (As on 31st March, 2015)
Regulatory Norms Company
% of Independent Directors on the Board 50% None
% of Promoter Directors on the Board - 67%
Number of Women Directors on the Board At least 1 None
Classification of Chairman of the Board - Executive Promoter Director
Is the post of Chairman and MD/CEO held by the same
person? - Yes
Average attendance of Directors in the Board meetings
(%) - 77.78%
Source - Money Control/Annual Report
Composition of Board: As per Regulation 17(i)(b) of the Listing Regulations, 2015, the Company should have at least 50%
Independent Directors as the Chairman of the Board is an Executive Promoter Director. The Company does not have any
Independent Directors on the Board. The Company is non-compliant with the above said regulation.
Board Diversity: The Company has 3 male directors. The Company does not have a single woman Director on the Board. The
Company is non-compliant with Listing Regulations, 2015 regarding the requirement of at least one-woman director.
Holding of position of MD/ CEO & Chairman by same person: The Company has appointed Mr. Jasjit Singh Sawhney as the
Chairman and Managing Director of the Company. Appointment of a single person as the Chairman and Managing Director of
the Company is not a good governance practice as this may lead to concentration of power in a single person.
TABLE 5 - FINANCIAL RATIOS
Ratios 2015 2014 2013 % Change
2015 vs 2014 2014 vs 2013
Turn
ove
r
Rat
ios
Inventory Turnover 68.51 40.06 5.97 71.00% 571.61%
Debtors Turnover 2.06 10.76 2.83 -80.82% 280.47%
Fixed asset Turnover 0.55 1.40 3.21 -60.41% -56.44%
Current Asset Turnover 0.94 1.13 1.26 -16.25% -10.83%
Ret
urn
Rat
ios Operating Profit Margin -180.55% -214.48% 7.34% N.A. -3,022.01%
Net Profit Margin -158.86% -201.28% 4.96% N.A. -4,160.65%
Return on Assets (ROA) -55.41% -125.57% 4.49% N.A. -2,893.99%
Return on Equity (ROE) N.A. N.A. 11.17% N.A. N.A.
Return on Capital Employed (ROCE) N.A. N.A. 25.37% N.A. N.A.
Liq
uid
ity
Rat
ios
Current Ratio 0.21 0.47 1.44 -55.59% -67.59%
Quick Ratio 0.20 0.45 1.14 -54.94% -60.03%
Cash Ratio 0.11 0.41 0.49 -72.91% -17.66%
Working Capital Turnover ratio N.A. N.A. 4.13 N.A. N.A.
Solv
ency
Rat
ios Debt to equity ratio N.A. N.A. 0.86 N.A. N.A.
Interest Coverage Ratio N.A. N.A. 2.83 N.A. N.A.
Trad
ing
Rat
ios
Market Cap / Sales 0.16 0.05 0.02 195.98% 217.96%
Market Cap/ Net Worth N.A. N.A. 0.04 N.A. N.A.
Market Cap/PAT N.A. N.A. 0.34 N.A. N.A.
Market Cap/EBITDA N.A. N.A. 12.77 N.A. N.A.
Trading Volume (shares) (avg. of 1 year) 2,740 15,055 6,197 -81.80% 142.94%
Trading Volume (shares) (high in 1 year) 26,302 417,235 95,460 -93.70% 337.08%
Trading Volume (shares) (low in 1 year) 1 4 1 -75.00% 300.00%
Ratio - High/low trading volume 26,302.00 1,04,308.75 95,460.00 -74.78% 9.27%
Ratio - High/average trading volume 9.60 27.71 15.40 -65.36% 79.91%
Source - Money Control

Stakeholders’ Education | Corporate Governance Research | Corporate Governance Score | Proxy Advisory
STAKEHOLDERS EMPOWERMENT SERVICES
7 | P A G E
SECTOR: IT-SOFTWARE REPORTING DATE: 1ST JUNE, 2016
NET 4 INDIA LTD. www.net4india.com
TABLE 6 (A): OWNERSHIP & MANAGEMENT RISKS
Dec' 2015 Dec' 2014 Dec' 2013 Comments
Shar
eho
ldin
g
Promoter shareholding 18.98% 19.89% 51.61% No new equity shares were issued during the
period. The promoter shareholding decreased
from 51.61% as on Dec’2013 to 18.98% as on
Dec’2015.The shareholding of public institution
increased from 5.03% to 21.52% and that of
public others increased from 43.36% to 59.5%
during the same period. The promoters have
pledged 0.14% of their shareholding.
Public - Institutional
shareholding 21.52% 5.03% 5.03%
Public - Others
shareholding 59.50% 75.09% 43.36%
Non Promoter Non Public
Shareholding 0.00% 0.00% 0.00%
TABLE 6 (B): OWNERSHIP & MANAGEMENT RISKS
Market Activity of Promoters Reduction of promoters holding in last three years due to invocation of shares
pledge by promoters.
Preferential issue to promoters No preferential issue of shares was made to the promoters in last three years.
Preferential issue to others No preferential issue of shares was made to other shareholders during last three
years.
GDRs issued by the Company The Company did not issue and GDRs during last three years.
Issue of ESOPs/Issue of shares other than
Preferential allotment
The Company had neither issued any shares to the employees under its ESOP
Scheme.
Source - Annual Report

Stakeholders’ Education | Corporate Governance Research | Corporate Governance Score | Proxy Advisory
STAKEHOLDERS EMPOWERMENT SERVICES
8 | P A G E
SECTOR: IT-SOFTWARE REPORTING DATE: 1ST JUNE, 2016
NET 4 INDIA LTD. www.net4india.com
Glossary
Equity: The equity shares capital of the Company
Net Worth: The amount by which the Assets exceeds the liabilities excluding shareholders’ funds of the Company
Turnover: The revenue earned from the operations of the Company
EPS: Earning Per Share is net profit earned by the Company per share
𝐸𝑃𝑆 =Profit After Tax
Number of outstanding shares
P/E ratio: It is the ratio of the Company’s share price to earnings per share of the Company
𝑃/𝐸 𝑟𝑎𝑡𝑖𝑜 =Price of each share
Earnings per share
Current Assets: Cash and other assets that are expected to be converted to cash in one year
Fixed Assets: assets which are purchased for long-term use and are not likely to be converted quickly into cash, such as land,
buildings, and equipment
Total Assets: Current Assets + Fixed Assets
Investments: An investment is an asset or item that is purchased with the hope that it will generate income or appreciate in the
future.
Finance Cost: The Financing Cost (FC), also known as the Cost of Finances (COF), is the cost and interest and other charges
incurred during the year in relation to borrowed money.
Long Term Liabilities: Long-term liabilities are liabilities with a maturity period of over one year.
Current Liabilities: A company's debts or obligations that are due within one year.
Inventory Turnover ratio: Inventory Turnover is a ratio showing how many times a company's inventory is sold and replaced over
a period.
𝐼𝑛𝑣𝑒𝑛𝑡𝑜𝑟𝑦 𝑇𝑢𝑟𝑛𝑜𝑣𝑒𝑟 𝑟𝑎𝑡𝑖𝑜 =Sales Turnover
Inventory
Debtors Turnover: Accounts receivable turnover is an efficiency ratio or activity ratio that measures how many times a business
can turn its accounts receivable into cash during a period
𝐷𝑒𝑏𝑡𝑜𝑟𝑠 𝑇𝑢𝑟𝑛𝑜𝑣𝑒𝑟 𝑟𝑎𝑡𝑖𝑜 =Sales Turnover
Accounts recievables
Fixed Asset Turnover: The fixed-asset turnover ratio is a financial ratio of net sales to fixed assets
𝐹𝑖𝑥𝑒𝑑 𝐴𝑠𝑠𝑒𝑡 𝑇𝑢𝑟𝑛𝑜𝑣𝑒𝑟 𝑟𝑎𝑡𝑖𝑜 =Sales Turnover
Fixed Assets
Current Asset Turnover: The current-asset turnover ratio is a financial ratio of net sales to fixed assets
𝐶𝑢𝑟𝑟𝑒𝑛𝑡 𝐴𝑠𝑠𝑒𝑡 𝑇𝑢𝑟𝑛𝑜𝑣𝑒𝑟 𝑟𝑎𝑡𝑖𝑜 =Sales Turnover
Current Assets
Stakeholders’ Education | Corporate Governance Research | Corporate Governance Score | Proxy Advisory
STAKEHOLDERS EMPOWERMENT SERVICES
9 | P A G E
SECTOR: IT-SOFTWARE REPORTING DATE: 1ST JUNE, 2016
NET 4 INDIA LTD. www.net4india.com
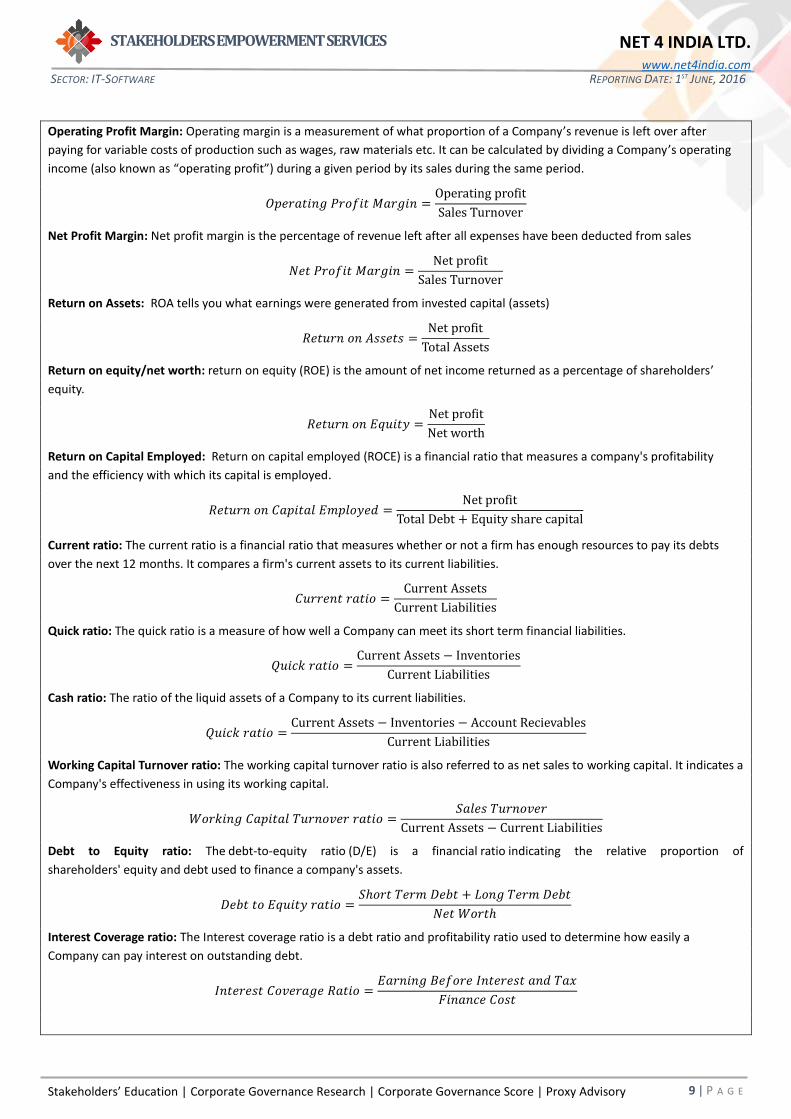
Operating Profit Margin: Operating margin is a measurement of what proportion of a Company’s revenue is left over after
paying for variable costs of production such as wages, raw materials etc. It can be calculated by dividing a Company’s operating
income (also known as “operating profit”) during a given period by its sales during the same period.
𝑂𝑝𝑒𝑟𝑎𝑡𝑖𝑛𝑔 𝑃𝑟𝑜𝑓𝑖𝑡 𝑀𝑎𝑟𝑔𝑖𝑛 =Operating profit
Sales Turnover
Net Profit Margin: Net profit margin is the percentage of revenue left after all expenses have been deducted from sales
𝑁𝑒𝑡 𝑃𝑟𝑜𝑓𝑖𝑡 𝑀𝑎𝑟𝑔𝑖𝑛 =Net profit
Sales Turnover
Return on Assets: ROA tells you what earnings were generated from invested capital (assets)
𝑅𝑒𝑡𝑢𝑟𝑛 𝑜𝑛 𝐴𝑠𝑠𝑒𝑡𝑠 =Net profit
Total Assets
Return on equity/net worth: return on equity (ROE) is the amount of net income returned as a percentage of shareholders’
equity.
𝑅𝑒𝑡𝑢𝑟𝑛 𝑜𝑛 𝐸𝑞𝑢𝑖𝑡𝑦 =Net profit
Net worth
Return on Capital Employed: Return on capital employed (ROCE) is a financial ratio that measures a company's profitability
and the efficiency with which its capital is employed.
𝑅𝑒𝑡𝑢𝑟𝑛 𝑜𝑛 𝐶𝑎𝑝𝑖𝑡𝑎𝑙 𝐸𝑚𝑝𝑙𝑜𝑦𝑒𝑑 =Net profit
Total Debt + Equity share capital
Current ratio: The current ratio is a financial ratio that measures whether or not a firm has enough resources to pay its debts
over the next 12 months. It compares a firm's current assets to its current liabilities.
𝐶𝑢𝑟𝑟𝑒𝑛𝑡 𝑟𝑎𝑡𝑖𝑜 =Current Assets
Current Liabilities
Quick ratio: The quick ratio is a measure of how well a Company can meet its short term financial liabilities.
𝑄𝑢𝑖𝑐𝑘 𝑟𝑎𝑡𝑖𝑜 =Current Assets − Inventories
Current Liabilities
Cash ratio: The ratio of the liquid assets of a Company to its current liabilities.
𝑄𝑢𝑖𝑐𝑘 𝑟𝑎𝑡𝑖𝑜 =Current Assets − Inventories − Account Recievables
Current Liabilities
Working Capital Turnover ratio: The working capital turnover ratio is also referred to as net sales to working capital. It indicates a
Company's effectiveness in using its working capital.
𝑊𝑜𝑟𝑘𝑖𝑛𝑔 𝐶𝑎𝑝𝑖𝑡𝑎𝑙 𝑇𝑢𝑟𝑛𝑜𝑣𝑒𝑟 𝑟𝑎𝑡𝑖𝑜 =𝑆𝑎𝑙𝑒𝑠 𝑇𝑢𝑟𝑛𝑜𝑣𝑒𝑟
Current Assets − Current Liabilities
Debt to Equity ratio: The debt-to-equity ratio (D/E) is a financial ratio indicating the relative proportion of
shareholders' equity and debt used to finance a company's assets.
𝐷𝑒𝑏𝑡 𝑡𝑜 𝐸𝑞𝑢𝑖𝑡𝑦 𝑟𝑎𝑡𝑖𝑜 =𝑆ℎ𝑜𝑟𝑡 𝑇𝑒𝑟𝑚 𝐷𝑒𝑏𝑡 + 𝐿𝑜𝑛𝑔 𝑇𝑒𝑟𝑚 𝐷𝑒𝑏𝑡
𝑁𝑒𝑡 𝑊𝑜𝑟𝑡ℎ
Interest Coverage ratio: The Interest coverage ratio is a debt ratio and profitability ratio used to determine how easily a
Company can pay interest on outstanding debt.
𝐼𝑛𝑡𝑒𝑟𝑒𝑠𝑡 𝐶𝑜𝑣𝑒𝑟𝑎𝑔𝑒 𝑅𝑎𝑡𝑖𝑜 =𝐸𝑎𝑟𝑛𝑖𝑛𝑔 𝐵𝑒𝑓𝑜𝑟𝑒 𝐼𝑛𝑡𝑒𝑟𝑒𝑠𝑡 𝑎𝑛𝑑 𝑇𝑎𝑥
𝐹𝑖𝑛𝑎𝑛𝑐𝑒 𝐶𝑜𝑠𝑡
Stakeholders’ Education | Corporate Governance Research | Corporate Governance Score | Proxy Advisory
STAKEHOLDERS EMPOWERMENT SERVICES
10 |
P A G E
SECTOR: IT-SOFTWARE REPORTING DATE: 1ST JUNE, 2016
NET 4 INDIA LTD. www.net4india.com
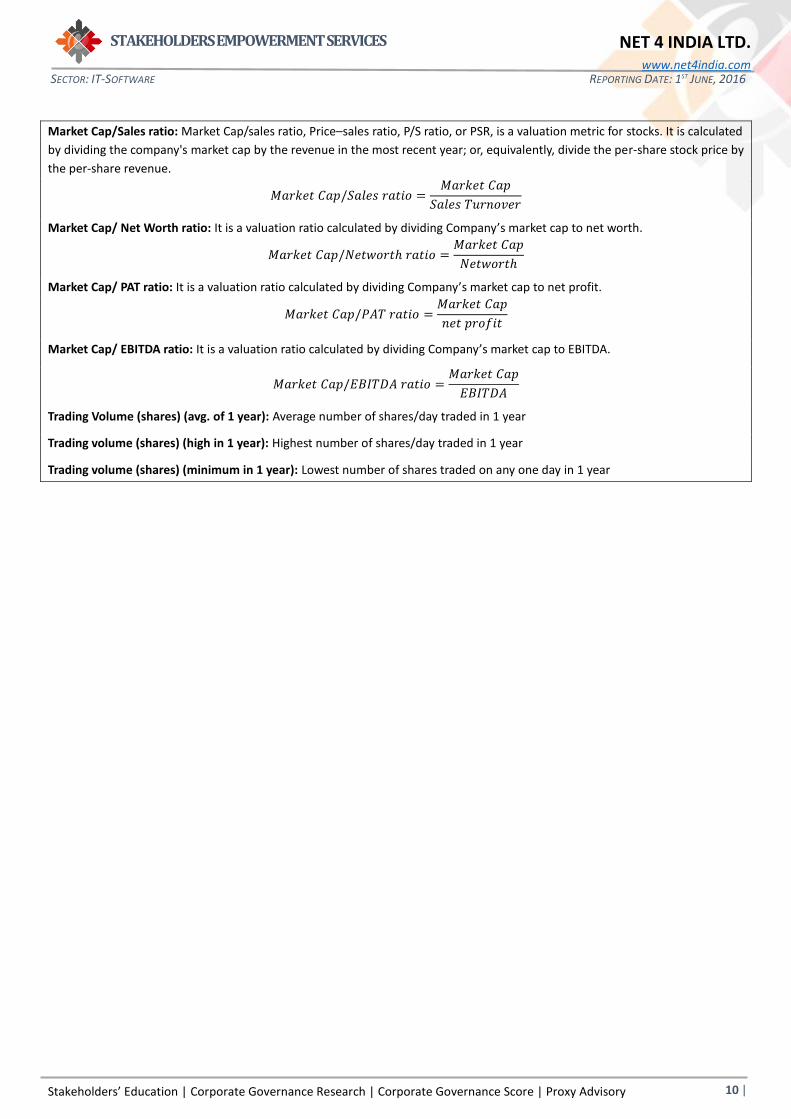
Market Cap/Sales ratio: Market Cap/sales ratio, Price–sales ratio, P/S ratio, or PSR, is a valuation metric for stocks. It is calculated
by dividing the company's market cap by the revenue in the most recent year; or, equivalently, divide the per-share stock price by
the per-share revenue.
𝑀𝑎𝑟𝑘𝑒𝑡 𝐶𝑎𝑝/𝑆𝑎𝑙𝑒𝑠 𝑟𝑎𝑡𝑖𝑜 =𝑀𝑎𝑟𝑘𝑒𝑡 𝐶𝑎𝑝
𝑆𝑎𝑙𝑒𝑠 𝑇𝑢𝑟𝑛𝑜𝑣𝑒𝑟
Market Cap/ Net Worth ratio: It is a valuation ratio calculated by dividing Company’s market cap to net worth.
𝑀𝑎𝑟𝑘𝑒𝑡 𝐶𝑎𝑝/𝑁𝑒𝑡𝑤𝑜𝑟𝑡ℎ 𝑟𝑎𝑡𝑖𝑜 =𝑀𝑎𝑟𝑘𝑒𝑡 𝐶𝑎𝑝
𝑁𝑒𝑡𝑤𝑜𝑟𝑡ℎ
Market Cap/ PAT ratio: It is a valuation ratio calculated by dividing Company’s market cap to net profit.
𝑀𝑎𝑟𝑘𝑒𝑡 𝐶𝑎𝑝/𝑃𝐴𝑇 𝑟𝑎𝑡𝑖𝑜 =𝑀𝑎𝑟𝑘𝑒𝑡 𝐶𝑎𝑝
𝑛𝑒𝑡 𝑝𝑟𝑜𝑓𝑖𝑡
Market Cap/ EBITDA ratio: It is a valuation ratio calculated by dividing Company’s market cap to EBITDA.
𝑀𝑎𝑟𝑘𝑒𝑡 𝐶𝑎𝑝/𝐸𝐵𝐼𝑇𝐷𝐴 𝑟𝑎𝑡𝑖𝑜 =𝑀𝑎𝑟𝑘𝑒𝑡 𝐶𝑎𝑝
𝐸𝐵𝐼𝑇𝐷𝐴
Trading Volume (shares) (avg. of 1 year): Average number of shares/day traded in 1 year
Trading volume (shares) (high in 1 year): Highest number of shares/day traded in 1 year
Trading volume (shares) (minimum in 1 year): Lowest number of shares traded on any one day in 1 year

Stakeholders’ Education | Corporate Governance Research | Corporate Governance Score | Proxy Advisory
STAKEHOLDERS EMPOWERMENT SERVICES
11 |
P A G E
SECTOR: IT-SOFTWARE REPORTING DATE: 1ST JUNE, 2016
NET 4 INDIA LTD. www.net4india.com
DISCLAIMER
Sources Company Information
Only publicly available data has been used while making the factsheet. Our
data sources include: BSE, NSE, SEBI, Capitaline, Moneycontrol, Businessweek,
Reuters, Annual Reports, IPO Documents and Company Website.
Analyst Certification
The analysts involved in development of this factsheet certify that no part of
any of the research analyst’s compensation was, is, or will be directly or
indirectly related to the contents of this factsheet.
Disclaimer
While SES has made every effort and has exercised due skill, care and diligence in compiling this factsheet based on publicly available information, it neither guarantees its accuracy, completeness or usefulness, nor assumes any liability whatsoever for any consequence from its use. This factsheet does not have any approval, express or implied, from any authority, nor is it required to have such approval. The users are strongly advised to exercise due diligence while using this factsheet.
This factsheet in no manner constitutes an offer, solicitation or advice to buy or sell securities, nor solicits votes or proxies on behalf of any party. SES, which is a not-for-profit Initiative or its staff, has no financial interest in the companies covered in this factsheet except what is disclosed on its website. The factsheet is released in India and SES has ensured that it is in accordance with Indian laws. Person resident outside India shall ensure that laws in their country are not violated while using this factsheet; SES shall not be responsible for any such violation.
All disputes subject to jurisdiction of High Court of Bombay, Mumbai.
SEBI Reg. No. INH000000016
This factsheet or any portion hereof may not
be reprinted, sold, reproduced or
redistributed without the written consent of
Stakeholders Empowerment Services
Contact Information
Stakeholders Empowerment Services
A 202, Muktangan,
Upper Govind Nagar,
Malad East,
Mumbai – 400 097
Tel +91 22 4022 0322
www.sesgovernance.com.
Research Analyst: Sumit Tank