nest investments (holdings) limited interim … condensed... · nest investments (holdings) limited...
TRANSCRIPT

NEST INVESTMENTS (HOLDINGS) LIMITED
INTERIM CONDENSED
CONSOLIDATED FINANCIAL STATEMENTS
30 JUNE 2014

NEST INVESTMENTS (HOLDINGS) LIMITED
Nest Investments (Holdings) Ltd- Interim Report 2014
INTERIM CONDENSED CONSOLIDATED FINANCIAL STATEMENTS
FOR THE SIX MONTHS ENDED 30 JUNE 2014
INTERIM CONSOLIDATED STATEMENT OF COMPREHENSIVE INCOME ......................................... 4
INTERIM CONSOLIDATED INSURANCE REVENUE ACCOUNT ......................................................... 5
INTERIM CONSOLIDATED STATEMENT OF FINANCIAL POSITION .................................................. 6
INTERIM CONSOLIDATED STATEMENT OF CHANGES IN EQUITY ................................................... 7
INTERIM CONSOLIDATED STATEMENT OF CASH FLOWS .............................................................. 8
1. Corporate Information ........................................................................................................ 9
2. Accounting Policies ............................................................................................................. 9
2.1. Basis of preparation ....................................................................................................... 9
2.2. Basis of consolidation .................................................................................................. 10
3. Significant judgments and estimates ................................................................................. 10
4. Correction of prior year error ............................................................................................ 13
5. Profitability by line of business ......................................................................................... 13
6. Life and non-life insurance business .................................................................................. 14
7. Net Earned Premiums ....................................................................................................... 16
8. Net Benefits and Claims .................................................................................................... 17
9. Other Operating and Administrative Expenses .................................................................. 18
10. Net Interest Income- Banking Operations ....................................................................... 18
11. Net Fee and Commission Income- Banking Operations ................................................... 18
12. Net Income and Gains from Investments ........................................................................ 19
13. Income tax expense ....................................................................................................... 19
14. Property and Equipment ................................................................................................ 20
15. Investment Properties.................................................................................................... 21
16. Investment in Associates ................................................................................................ 23
17. Financial Assets .............................................................................................................. 25
18. Accounts Receivable ...................................................................................................... 26

NEST INVESTMENTS (HOLDINGS) LIMITED
Nest Investments (Holdings) Ltd- Interim Report 2014
19. Other Assets .................................................................................................................. 26
20. Bank and Cash Balances ................................................................................................. 27
21. Share Capital and Reserves ............................................................................................ 27
22. Banking Customer Deposits ............................................................................................ 28
23. Insurance Contract Liabilities ......................................................................................... 29
24. Creditors, accruals and other liabilities ........................................................................... 33
25. Group Companies .......................................................................................................... 34
26. Related Party Transactions ............................................................................................. 35

NEST INVESTMENTS (HOLDINGS) LIMITED
Nest Investments (Holdings) Ltd- Interim Report 2014 4
INTERIM CONSOLIDATED STATEMENT OF COMPREHENSIVE INCOME FOR THE PERIOD ENDED 30 JUNE 2014
Six month period ended
30 June
2014 2013
Notes US$ '000 US$ '000
Transfer from consolidated insurance revenue account 11,390 15,017
Interest income - banking operations 10 14,017 10,822
Interest expense - banking operations 10 (502) (316)
Fee and commission income - banking operations 11 7,525 14,432
Fee and commission expense - banking operations 11 (59) (552)
Net Income and gains from investments 12 11,852 8,133
Other income 10,292 9,233
Credit loss expense - banking operations (778) (1,072)
Administrative expenses 9 (24,572) (18,595)
Net finance income/ (expense) 4,390 (2,698)
Profit from operations 22,164 19,388
Share of profit of associate's 16 4,015 584
Profit for the year before tax 37,569 34,989
Income tax expenses 13 (4,452) (5,363)
Net profit for the year 33,117 29,626
Other comprehensive income
To be reclassified to profit or loss in subsequent periods:
Available for sale investments fair value gain,net of tax 6,027 10,134
Exchange difference (10,671) (18,635)
Net other comprehensive income to be reclassified to profit or loss in subsequent periods (4,644) (8,501)
Not to be reclassified to profit or loss in subsequent periods:
Revaluation of property, net of tax − −
Net other comprehensive income not to be reclassified to profit or loss in subsequent periods − −
Other comprehensive income (4,644) (8,501)
Total comprehensive income for the year 28,473 21,125
Total Comprehensive income for the year attributable to:
Equity holders of the parent 25,812 19,658
Non controlling interest 2,661 1,468
28,473 21,125

NEST INVESTMENTS (HOLDINGS) LIMITED
Nest Investments (Holdings) Ltd- Interim Report 2014 5
INTERIM CONSOLIDATED INSURANCE REVENUE ACCOUNT FOR THE PERIOD ENDED 30 JUNE 2014
Six month period ended
30 June
2014 2013
Notes US$ '000 US$ '000
Gross written premium 435,464 380,496
Outward reinsurance premium (152,801) (140,335)
Retained premium 282,663 240,161
Change in unearned premiums (86,357) (66,705)
Net earned premium 7 196,306 173,456
Gross claims paid 8(a) (154,671) (146,695)
Claims recovered from reinsurers 8(b) 58,066 64,147
Change in provision for outstanding claims - gross (36,146) (36,445)
Change in provision for outstanding claims - reinsurance (5,894) 3,921
Change in IBNR 7,030 7,381
Claims and related expenses 8(d) (131,614) (107,692)
Commissions and taxes paid (78,376) (68,326)
Commissions and taxes received from reinsurers 30,051 27,073
Interest on premium reserve 70 32
Interest on premium reserve - reinsurance (34) (10)
Change in deferred acquisition cost – gross 21,008 16,527
Change in deferred acquisition cost – reinsurance (6,737) (5,249)
Change in unexpired risk reserves 11 −
Acquisition costs, commissions and taxes (34,008) (29,953)
Gross underwriting profit 30,684 35,811
Operating expenses (20,826) (18,582)
Transfer to consolidated statement of comprehensive income 6 11,390 15,017

NEST INVESTMENTS (HOLDINGS) LIMITED
Nest Investments (Holdings) Ltd- Interim Report 2014 6
INTERIM CONSOLIDATED STATEMENT OF FINANCIAL POSITION AS AT 30 JUNE 2014
Unaudited Audited
30 June 31 December
2014 2013
Notes US$ '000 US$ '000
Assets
Goodwill 26,817 26,817
Intangible assets 6,973 7,227
Property and equipment 14 216,320 200,680
Properties Held For Trading 9,090 9,229
Investment properties 15 1,793,552 1,794,315
Investment in associates 16 410,938 408,005
Loans and advances to banking customers 17(a) 321,450 334,183
Other financial assets 17(b) 114,324 110,786
Reinsurance assets 23 364,122 351,093
Insurance receivables 33,857 38,126
Gross deferred acquisition cost 68,154 47,748
Other assets 19 165,377 109,148
Accounts receivable 18 359,103 242,883
Due from banks - banking operations 46,392 53,899
Cash and cash equivalents 20 681,112 611,713
Total assets 4,617,579 4,345,853
Equity
Share capital 21(a) 17 17
Reserves 21(b) 1,634,681 1,609,675
Contribution from Shareholder 104,190 112,175
Equity attributable to equity holders of the parent 1,738,888 1,721,867
Non-controlling interest 684,574 700,499
Total equity 2,423,462 2,422,366
Liabilities
Bank loans 301,881 266,070
Banking customer deposits 22 282,851 262,898
Due to banks 2,588 2,376
Insurance contract liabilities 23 971,367 853,712
Reinsurance balances payable 66,874 61,189
Trade creditors and other liabilities 24 541,978 460,182
Bank overdraft 2,951 445
Income received in advance 2,227 1,951
Reinsurers' share of deferred acquisition costs 21,400 14,664
Total Liabilities 2,194,118 1,923,487
Total equity and liabilities 4,617,579 4,345,853
17 October 2014
Ghazi Abu Nahl Mehran Eftekhar, FCA
Chairman and CEO Director

NEST INVESTMENTS (HOLDINGS) LIMITED
Nest Investments (Holdings) Ltd- Interim Report 2014 7
INTERIM CONSOLIDATED STATEMENT OF CHANGES IN EQUITY FOR THE PERIOD ENDED 30 JUNE 2014
Equity attributable to equity holders of the parent
Share capital
Contribu-tion from
Share-holder
Statutory reserve
Optional reserve
General banking
risks reserve
Property revaluation
reserve
Investment revaluation
reserve
Exchange difference
reserve
Retained earnings
Total Non-
controlling interest
Total equity
US$ '000 US$ '000 US$ '000 US$ '000 US$ '000 US$ '000 US$ '000 US$ '000 US$ '000 US$ '000 US$ '000 US$ '000
At 1 January 2013 17 28,968 34,064 2,765 3,749 93,672 110,255 (26,854) 1,227,750 1,474,385 745,932 2,220,318
Prior year adjustments − − 1,976 31 − (2,034) − − (968) (995) − (995)
Revised opening balance 1 January 2013 17 28,968 36,040 2,796 3,749 91,638 110,255 (26,854) 1,226,782 1,473,390 745,932 2,219,323
Profit for the year − − − − − − − − 21,147 21,147 8,479 29,626
Other comprehensive income − − − − − − 11,215 (12,705) − (1,489) (7,012) (8,501)
Total comprehensive income 17 28,968 36,040 2,796 3,749 91,638 121,470 (39,558) 1,247,929 1,493,048 747,400 2,240,448
Funds contributed by shareholder − 1,118 − − − − − − − 1,118 − 1,118
Dividends − − − − − − − − (10,913) (10,913) (7,211) (18,124)
Transfer to statutory and optional reserve − − 827 299 − − − − (1,126) − − −
General banking risks reserve − − − − 1,137 − − − (1,233) (96) 96 −
Acquisition of share in subsidiary − − − − − − − − (170) (170) (267) (437)
At 30 June 2013 17 30,086 36,866 3,095 4,886 91,638 121,470 (39,558) 1,234,488 1,482,988 740,017 2,223,006
At 1 January 2014 17 112,175 38,960 3,207 2,119 90,919 (1,647) (31,439) 1,507,555 1,721,867 700,499 2,422,366
Prior year adjustments (Note 4) − − − − − − (2,452) 2,452 − − − −
Revised opening balance 1 January 2013 17 112,175 38,960 3,207 2,119 90,919 (4,099) (28,987) 1,507,555 1,721,867 700,499 2,422,366 Profit for the year − − − − − − − − 24,546 24,546 8,571 33,117 Other comprehensive income / (loss) − − − − − − 5,878 (4,612) − 1,266 (5,910) (4,644)
Total comprehensive income 17 112,175 38,960 3,207 2,119 90,919 1,779 (33,599) 1,532,101 1,747,679 703,159 2,450,838
Repayment of funds contributed by shareholder − (7,985) − − − − − − − (7,985) − (7,985)
Dividends − − − − − − − − − − (20,456) (20,456)
Transfer to statutory and optional reserve − − 1,212 2,057 − − − − (3,270) − − −
General banking risks reserve − − − − 551 − − − (1,357) (805) 805 − Increase in subsidiary's share capital − − − − − − − − − − 1,065 1,065
At 30 June 2014 17 104,190 40,173 5,264 2,670 90,919 1,779 (33,599) 1,527,475 1,738,888 684,574 2,423,462
NEST INVESTMENTS (HOLDINGS) LIMITED
Nest Investments (Holdings) Ltd- Interim Report 2014 8
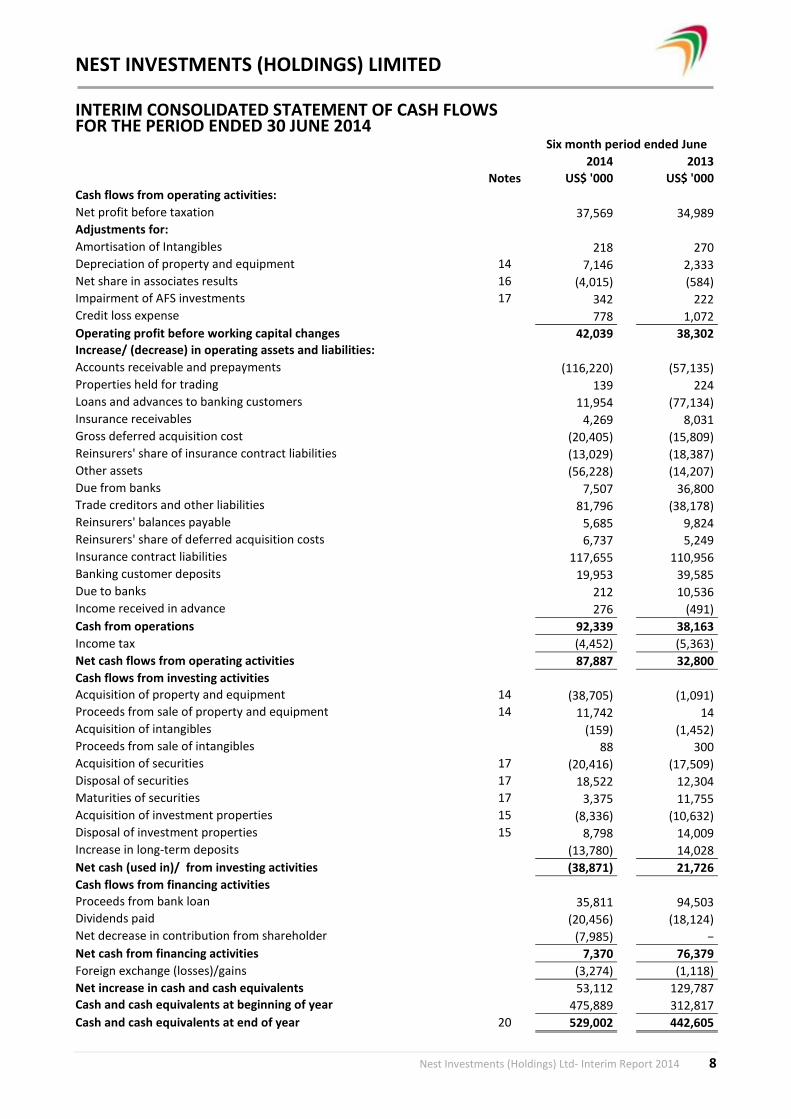
INTERIM CONSOLIDATED STATEMENT OF CASH FLOWS FOR THE PERIOD ENDED 30 JUNE 2014
Six month period ended June
2014 2013
Notes US$ '000 US$ '000
Cash flows from operating activities: Net profit before taxation 37,569 34,989 Adjustments for: Amortisation of Intangibles 218 270 Depreciation of property and equipment 14 7,146 2,333 Net share in associates results 16 (4,015) (584) Impairment of AFS investments 17 342 222 Credit loss expense 778 1,072
Operating profit before working capital changes 42,039 38,302 Increase/ (decrease) in operating assets and liabilities: Accounts receivable and prepayments (116,220) (57,135) Properties held for trading 139 224 Loans and advances to banking customers 11,954 (77,134) Insurance receivables 4,269 8,031 Gross deferred acquisition cost (20,405) (15,809) Reinsurers' share of insurance contract liabilities (13,029) (18,387) Other assets (56,228) (14,207) Due from banks 7,507 36,800 Trade creditors and other liabilities 81,796 (38,178) Reinsurers' balances payable 5,685 9,824 Reinsurers' share of deferred acquisition costs 6,737 5,249 Insurance contract liabilities 117,655 110,956 Banking customer deposits 19,953 39,585 Due to banks 212 10,536 Income received in advance 276 (491)
Cash from operations 92,339 38,163
Income tax (4,452) (5,363)
Net cash flows from operating activities 87,887 32,800
Cash flows from investing activities Acquisition of property and equipment 14 (38,705) (1,091) Proceeds from sale of property and equipment 14 11,742 14 Acquisition of intangibles (159) (1,452) Proceeds from sale of intangibles 88 300 Acquisition of securities 17 (20,416) (17,509) Disposal of securities 17 18,522 12,304 Maturities of securities 17 3,375 11,755 Acquisition of investment properties 15 (8,336) (10,632) Disposal of investment properties 15 8,798 14,009 Increase in long-term deposits (13,780) 14,028
Net cash (used in)/ from investing activities (38,871) 21,726
Cash flows from financing activities Proceeds from bank loan 35,811 94,503 Dividends paid (20,456) (18,124) Net decrease in contribution from shareholder (7,985) −
Net cash from financing activities 7,370 76,379
Foreign exchange (losses)/gains (3,274) (1,118)
Net increase in cash and cash equivalents 53,112 129,787 Cash and cash equivalents at beginning of year 475,889 312,817
Cash and cash equivalents at end of year 20 529,002 442,605

NEST INVESTMENTS (HOLDINGS) LIMITED NOTES TO THE INTERIM CONDENSED CONSOLIDATED FINANCIAL STATEMENTS 30 JUNE 2014
Nest Investments (Holdings) Ltd- Interim Report 2014 9
1. Corporate Information The interim condensed consolidated financial statements of Nest Investments (Holdings) Limited (the
‘Company’) and its subsidiaries (together referred to as the ‘Group’) for the period ended 30 June 2014
were authorised for issue by the Directors on 17 October 2014.
The Company was incorporated in Jersey, Channel Islands, on 21 October, 1985 as a limited liability
company. The ultimate shareholder of the Group is Mr. Ghazi Abu Nahl.
The principal activities of the Group are the provisions of investment holding, insurance & reinsurance
services, real estate investment, banking services and licensed operations.
2. Accounting Policies The significant accounting policies adopted in the preparation of these interim condensed
consolidated financial statements are consistent with those followed in the preparation of the Group’s
annual consolidated financial statements for the year ended 31 December 2013. These policies have
been consistently applied to all periods presented in these consolidated financial statements unless
otherwise stated.
In addition, the Group has adopted the following new standards, amendments and interpretations,
which did not have a material impact on the interim condensed consolidated financial statements:
• IAS 27 Separate Financial Statements (Revised)
• IAS 28 Investments in Associates and Joint Ventures (Revised)
• IFRS 10 Consolidated Financial Statements
• IFRS 11 Joint Arrangements
• IFRS 12 Disclosures of Involvement with Other Entities
• Transition Guidance (Amendments to IFRS 10, IFRS 11 and IFRS 12)
• Investment Entities (Amendments to IFRS 10, IFRS 12 and IAS 27)
• IAS 32 Financial Instruments: Presentation (Amended) - Offsetting Financial Assets and Financial
Liabilities
• Recoverable Amount Disclosures for Non-Financial Assets (Amendments to IAS 36)
• Novation of Derivatives and Continuation of Hedge Accounting (Amendments to IAS 39)
2.1. Basis of preparation
The interim condensed consolidated financial statements have been prepared on a historical cost basis
except for investment properties, own use properties and those available for sale financial assets that
have been measured at fair value.
Statement of Compliance
The interim condensed consolidated financial statements for the six month period ended 30 June 2014
have been prepared in accordance with International Financial Reporting Standard applicable to the
interim financial reporting, as adopted by the European Union (EU).

NEST INVESTMENTS (HOLDINGS) LIMITED NOTES TO THE INTERIM CONDENSED CONSOLIDATED FINANCIAL STATEMENTS 30 JUNE 2014
Nest Investments (Holdings) Ltd- Interim Report 2014 10
The interim condensed consolidated financial statements do not include all the information and
disclosures required for the annual financial statements and should be read in conjunction with the
audited Consolidated Financial Statements for the year ended 31 December 2013.
Presentation Currency of Financial Statements
The consolidated financial statements are presented in United States Dollars (US$) and all amounts are
rounded to the nearest thousands, except where otherwise indicated.
2.2. Basis of consolidation
The interim condensed consolidated financial statements comprise of the financial statements of the
Group as at 30 June 2014. Subsidiaries are fully consolidated from the date of acquisition, being the
date on which the Group obtains control, and continue to be consolidated until the date when such
control ceases. The financial statements of the subsidiaries are prepared for the same reporting year
as the parent company, using consistent accounting policies.
All intra-group balances, transactions, income and expenses and profits and losses resulting from intra-
group transactions and dividends, are eliminated in full.
Losses within a subsidiary are attributed to any non-controlling interest, even if this results in a deficit
balance.
An investor might have control over an investee even when it has less than a majority of the voting
rights of that investee (sometimes referred to as de facto control). In assessing whether de facto
control exists, factors such as the size of the investor’s holding of voting rights relative to other vote
holders and any arrangements between shareholders s are required to be considered.
A change in the ownership interest of a subsidiary, without a loss of control, is accounted for as an
equity transaction. If the Group loses control over a subsidiary it:
- Derecognises the assets (including goodwill) and liabilities of the subsidiary
- Derecognises the carrying amount of any non-controlling interest
- Derecognises the cumulative translation differences recorded in equity
- Recognises the fair value of the consideration received
- Recognises the fair value of any investment retained
- Recognises any surplus or deficit in profit or loss
- Reclassifies the parent’s share of components previously recognised in other
comprehensive income
- Income to profit or loss or retained earnings, as appropriate.
3. Significant judgments and estimates
The preparation of the financial statements in accordance with IFRSs requires management to make
estimates and assumptions that affect the reported amounts of assets and liabilities and disclosure of
contingent assets and liabilities at the reporting date. Actual results may vary from these current
estimates. These estimates are reviewed periodically, and, as adjustments become necessary, they are
reported in the profit or loss in the periods in which they become known.

NEST INVESTMENTS (HOLDINGS) LIMITED NOTES TO THE INTERIM CONDENSED CONSOLIDATED FINANCIAL STATEMENTS 30 JUNE 2014
Nest Investments (Holdings) Ltd- Interim Report 2014 11
The main assumptions and estimates concerning the future on the reporting date that poses a
significant risk of causing a material adjustment to the carrying amounts of assets and liabilities within
the next year relates to:
Going concern The Company’s management has assessed the ability of the Company to continue as a going concern
and is satisfied that the Company has the financial resources to continue its business in the
foreseeable future. Additionally, management is not aware of the existence of material uncertainties,
which are related to events or circumstances that may give rise to serious doubts as to whether the
Company can continue as a going concern. Consequently, the financial statements are prepared under
a going concern.
Insurance business contracts For the insurance business contracts, estimates are made for the expected ultimate cost of claims
reported and for the expected ultimate cost of claims incurred but not yet reported (IBNR) at the
reporting date. The estimation of the liabilities is based on past experience and market trends.
Fair value of financial instruments
Where the fair values of financial assets and financial liabilities recorded on the statement of financial
position cannot be derived from active markets, they are determined using a variety of valuation
techniques that include the use of mathematical models. The inputs to these models are derived from
observable market data where possible, but if this is not available, judgement is required to establish
fair values. The judgements include considerations of liquidity and model inputs such as volatility and
discount rates, prepayment rates and default rate.
Income taxes The Group operates and is therefore subject to taxation in a number of countries in the Middle East,
Africa and Europe. Estimates are required in determining the provision for taxes at the reporting date,
and therefore the tax determination is uncertain. Where the final tax is different from the amounts
that were initially recorded, such differences will impact the income tax expense, the tax liabilities and
deferred tax liabilities of the period in which the final tax is agreed with the tax authorities.
Allocation of overheads The majority of the direct insurance subsidiaries allocate their overheads using the ratio 90% to
operating expenses included in the Consolidated Insurance Revenue Account and 10% to
administrative expenses included in the Consolidated Statement of Comprehensive Income.
Impairment losses on loans and advances (Banking operations)
The Group reviews its individually significant loans and advances at each statement-of-financial-
position date to assess whether an impairment loss should be recorded in the statement of
comprehensive income. In particular, management’s judgement is required in the estimation of the
amount and timing of future cash flows when determining the impairment loss. These estimates are
based on assumptions about a number of factors and actual results may differ, resulting in future
changes to the allowance.
Loans and advances that have been assessed individually (and found not to be impaired) are assessed
together with all individually insignificant loans and advances in groups of assets with similar risk
characteristics. This is to determine whether provision should be made due to incurred loss events for
which there is objective evidence, but the effects of which are not yet evident. The collective
NEST INVESTMENTS (HOLDINGS) LIMITED NOTES TO THE INTERIM CONDENSED CONSOLIDATED FINANCIAL STATEMENTS 30 JUNE 2014
Nest Investments (Holdings) Ltd- Interim Report 2014 12
assessment takes account of data from the loan portfolio, and judgements on the effect of
concentrations of risks and economic data.
Goodwill impairment testing
The Group determines whether goodwill is impaired at least on an annual basis. This requires an
estimation of the recoverable amount of the cash-generating unit to which goodwill is allocated. The
Group tests goodwill for impairment at the level of the legal entity to which it relates.
Impairment of available-for-sale financial assets
Available-for-sale investments in equity securities are impaired when there has been a significant or
prolonged decline in their fair value below cost. In such a case, the total loss previously recognised in
equity is recognised in the statement of other comprehensive income. The determination of what is
significant or prolonged requires judgement by management. The factors which are evaluated include
the expected volatility in share prices. In addition, impairment may be appropriate when there is
evidence that significant adverse changes have taken place in the technological, market, economic or
legal environment in which the investee operates.
Revaluation of property, plant and equipment and investment properties
The Group carries its investment properties at fair value, with changes in fair value being recognised in
the profit or loss. In addition, it measures land and buildings at revalue amounts with changes in fair
value being recognised in other comprehensive income.
For the investment property in Algeria, the residual method of valuation is used.
The application of the residual method of valuation is based on the principle that the price to be paid
for a property that is suitable for development is equal to the difference between (i) the completed
value of the permitted development and (ii) the total cost of carrying out that development.
Other properties were valued by reference to market-based evidence, using comparable prices
adjusted for specific market factors such as nature, location and condition of the property.
Consolidation of entities in which the Group holds less than majority of voting rights
The Group considers that it controls Trust International Insurance Co. Plc. (Palestine) and Trust House
Insurance Co. even though it owns less than 50% of the voting rights. This is because the Group has the
power to exercise control over the company by virtue of an agreement with its shareholder who
controls directly such % to bring the total over the 50% level.
NEST INVESTMENTS (HOLDINGS) LIMITED NOTES TO THE INTERIM CONDENSED CONSOLIDATED FINANCIAL STATEMENTS 30 JUNE 2014
Nest Investments (Holdings) Ltd- Interim Report 2014 13
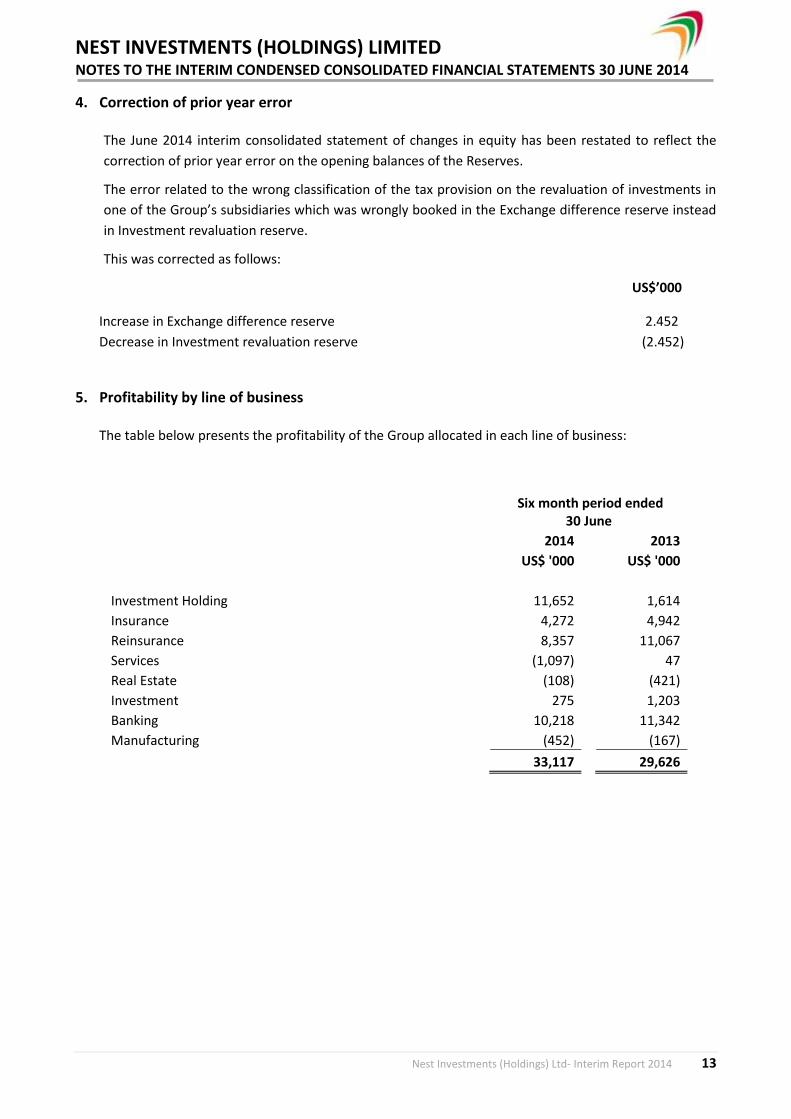
4. Correction of prior year error The June 2014 interim consolidated statement of changes in equity has been restated to reflect the
correction of prior year error on the opening balances of the Reserves.
The error related to the wrong classification of the tax provision on the revaluation of investments in
one of the Group’s subsidiaries which was wrongly booked in the Exchange difference reserve instead
in Investment revaluation reserve.
This was corrected as follows:
US$’000
Increase in Exchange difference reserve 2.452
Decrease in Investment revaluation reserve (2.452)
5. Profitability by line of business The table below presents the profitability of the Group allocated in each line of business:
Six month period ended 30 June
2014
2013
US$ '000
US$ '000
Investment Holding 11,652
1,614
Insurance 4,272
4,942
Reinsurance 8,357
11,067
Services (1,097)
47
Real Estate (108)
(421)
Investment 275
1,203
Banking 10,218
11,342
Manufacturing (452)
(167)
33,117
29,626

NEST INVESTMENTS (HOLDINGS) LIMITED NOTES TO THE INTERIM CONDENSED CONSOLIDATED FINANCIAL STATEMENTS 30 JUNE 2014
Nest Investments (Holdings) Ltd- Interim Report 2014 14
6. Life and non-life insurance business An analysis of the consolidated insurance revenue account by line of business is presented below:
2014 June Motor Life Marine Fire Enginee-
ring Medical Travel Other Decennial
Liability
Natural catastro
-phy
Workmen Compensa-
tion & Third Party
Liability Faculta-
tive Treaty Energy
Total Line of
Business
US$ '000 US$ '000
US$ '000 US$ '000 US$ '000 US$ '000 US$ '000 US$ '000 US$ '000 US$ '000 US$ '000 US$ '000 US$ '000 US$ '000 US$ '000
Gross written premium 32,198 3,109 5,262 16,851 22,859 21,749 49 3,760 483 285 6,506 152,522 161,732 8,100 435,464
Outward reinsurance premium (3,546) (2,094) (4,182) (12,706)
(22,059) (5,962) (38) (2,404) (308) (178) (2,119) (52,305) (36,892) (8,009) (152,801)
Retained premium 28,652 1,015 1,080 4,145 800 15,787 11 1,356 175 107 4,387 100,217 124,839 91 282,663
Change in unearned premiums (1,486) (198) (115) 115 (1,309) (5,885) (2) (62) (88) (26) (785) (31,622) (44,895) − (86,357)
Net earned premium 27,167 817 965 4,259 (509) 9,902 9 1,294 87 81 3,602 68,595 79,945 91 196,306
Gross claims paid (18,899) (264) (861) (6,939) (1,992) (9,088) (2) (1,053) − − (1,424) (51,293) (62,731) (126) (154,671)
Claims recovered from reinsurers 2,964 277 805 5,991 1,905 1,810 − 358 − − 206 24,183 19,442 126 58,066
Change in provision for outstanding claims - gross (1,903) 33 (390) 1,685 20 (508) − 138 (2) − (297) (29,383) (5,539) − (36,146)
Change in provision for outstanding claims - reinsurance 627 (33) 208 (1,912) (115) 122 − (22) − − (172) 497 (5,094) − (5,894)
Net IBNR (Pure) (607) − 10 33 11 (148) − 68 − − 208 4,197 3,589 − 7,362
Net IBNER (264) − (21) 23 (4) − − − − (67) 2 − − − (331)
Change in IBNR (871) − (11) 56 6 (148) − 68 − (67) 210 4,197 3,589 − 7,030
Claims and related expenses (18,083) 13 (249) (1,118) (176) (7,812) (2) (510) (2) (67) (1,477) (51,799) (50,333) − (131,614)
Commissions and taxes paid (5,468) (148) (625) (3,131) (2,103) (1,450) (6) (668) (57) (14) (667) (24,792) (39,167) (80) (78,376) Commissions and taxes received from reinsurers
3 29 974 3,416 2,724 111 21 453 51 17 269 11,661 10,185 137 30,051
Interest on premium reserve − − − − − − − − − − − (17) 87 − 70
Interest on premium reserve - reinsurance − − (7) (23) (4) − − − − − − − − − (34)
Change in deferred acquisition cost – gross 145 − (9) 138 (4) (197) − 16 − − 111 6,310 14,498 − 21,008
Change in deferred acquisition cost – reinsurance − − − − − − − − − − − (2,878) (3,858) − (6,737)
Change in unexpired risk reserves (23) − (4) (6) − (36) − 79 − − − − − − 11
Acquisition costs, commissions and taxes (5,343) (119) 329 395 613 (1,572) 16 (120) (6) 2 (288) (9,716) (18,255) 57 (34,008)
Gross underwriting profit 3,742 711 1,046 3,536 (72) 519 23 664 79 16 1,836 7,080 11,356 149 30,684
Operating expenses (3,917) (289) (448) (1,482) (1,279) (1,939) (6) (278) (317) (14) (432) (5,403) (4,557) (466) (20,826)
Technical Income 964 − 9 119 25 52 2 9 − − 78 290 (24) 11 1,533
Net underwriting profit/ (loss) 789 422 606 2,173 (1,327) (1,369) 19 395 (238) 2 1,482 1,967 6,775 (307) 11,390
NEST INVESTMENTS (HOLDINGS) LIMITED NOTES TO THE INTERIM CONDENSED CONSOLIDATED FINANCIAL STATEMENTS 30 JUNE 2014
Nest Investments (Holdings) Ltd- Interim Report 2014 15
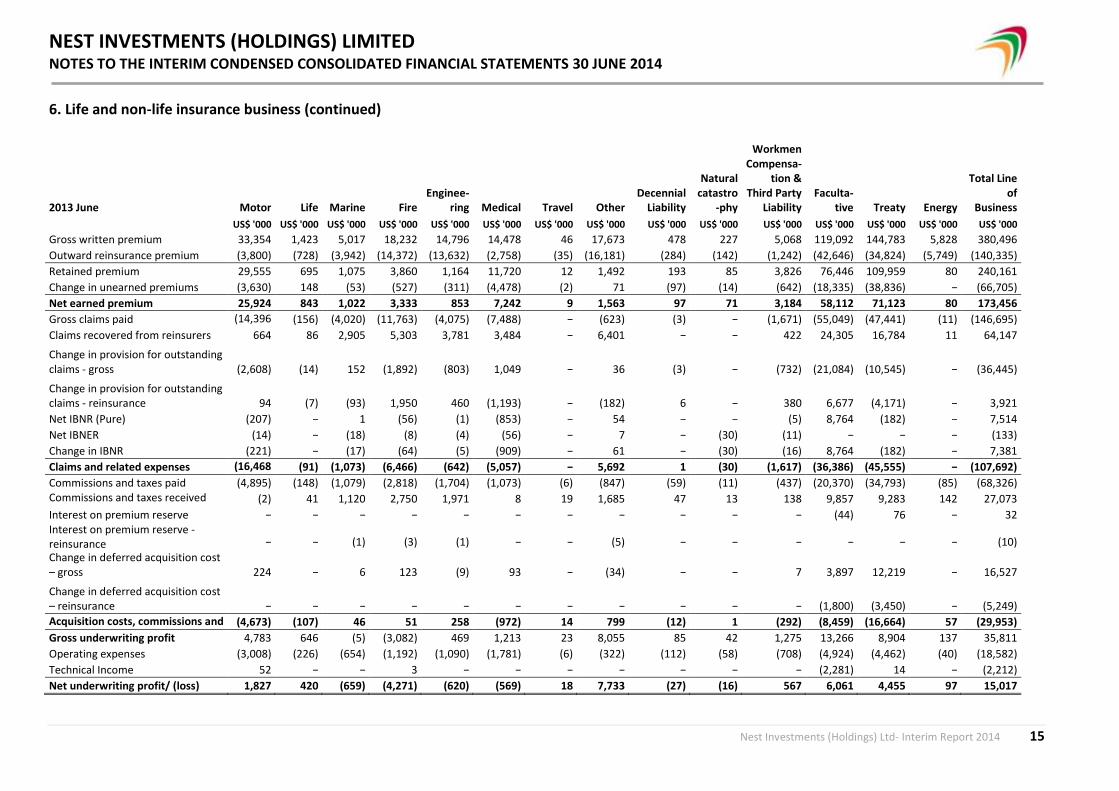
6. Life and non-life insurance business (continued)
2013 June Motor Life Marine Fire Enginee-
ring Medical Travel Other Decennial
Liability
Natural catastro
-phy
Workmen Compensa-
tion & Third Party
Liability Faculta-
tive Treaty Energy
Total Line of
Business
US$ '000 US$ '000 US$ '000 US$ '000 US$ '000 US$ '000 US$ '000 US$ '000 US$ '000 US$ '000 US$ '000 US$ '000 US$ '000 US$ '000 US$ '000
Gross written premium 33,354 1,423 5,017 18,232 14,796 14,478 46 17,673 478 227 5,068 119,092 144,783 5,828 380,496
Outward reinsurance premium (3,800) (728) (3,942) (14,372) (13,632) (2,758) (35) (16,181) (284) (142) (1,242) (42,646) (34,824) (5,749) (140,335)
Retained premium 29,555 695 1,075 3,860 1,164 11,720 12 1,492 193 85 3,826 76,446 109,959 80 240,161
Change in unearned premiums (3,630) 148 (53) (527) (311) (4,478) (2) 71 (97) (14) (642) (18,335) (38,836) − (66,705)
Net earned premium 25,924 843 1,022 3,333 853 7,242 9 1,563 97 71 3,184 58,112 71,123 80 173,456
Gross claims paid (14,396)
(156) (4,020) (11,763) (4,075) (7,488) − (623) (3) − (1,671) (55,049) (47,441) (11) (146,695)
Claims recovered from reinsurers 664 86 2,905 5,303 3,781 3,484 − 6,401 − − 422 24,305 16,784 11 64,147
Change in provision for outstanding claims - gross (2,608) (14) 152 (1,892) (803) 1,049 − 36 (3) − (732) (21,084) (10,545) − (36,445)
Change in provision for outstanding claims - reinsurance 94 (7) (93) 1,950 460 (1,193) − (182) 6 − 380 6,677 (4,171) − 3,921
Net IBNR (Pure) (207) − 1 (56) (1) (853) − 54 − − (5) 8,764 (182) − 7,514
Net IBNER (14) − (18) (8) (4) (56) − 7 − (30) (11) − − − (133)
Change in IBNR (221) − (17) (64) (5) (909) − 61 − (30) (16) 8,764 (182) − 7,381
Claims and related expenses (16,468)
(91) (1,073) (6,466) (642) (5,057) − 5,692 1 (30) (1,617) (36,386) (45,555) − (107,692)
Commissions and taxes paid (4,895) (148) (1,079) (2,818) (1,704) (1,073) (6) (847) (59) (11) (437) (20,370) (34,793) (85) (68,326) Commissions and taxes received from reinsurers
(2) 41 1,120 2,750 1,971 8 19 1,685 47 13 138 9,857 9,283 142 27,073
Interest on premium reserve − − − − − − − − − − − (44) 76 − 32 Interest on premium reserve - reinsurance − − (1) (3) (1) − − (5) − − − − − − (10)
Change in deferred acquisition cost – gross 224 − 6 123 (9) 93 − (34) − − 7 3,897 12,219 − 16,527
Change in deferred acquisition cost – reinsurance − − − − − − − − − − − (1,800) (3,450) − (5,249)
Acquisition costs, commissions and taxes
(4,673) (107) 46 51 258 (972) 14 799 (12) 1 (292) (8,459) (16,664) 57 (29,953)
Gross underwriting profit 4,783 646 (5) (3,082) 469 1,213 23 8,055 85 42 1,275 13,266 8,904 137 35,811
Operating expenses (3,008) (226) (654) (1,192) (1,090) (1,781) (6) (322) (112) (58) (708) (4,924) (4,462) (40) (18,582)
Technical Income 52 − − 3 − − − − − − − (2,281) 14 − (2,212)
Net underwriting profit/ (loss) 1,827 420 (659) (4,271) (620) (569) 18 7,733 (27) (16) 567 6,061 4,455 97 15,017

NEST INVESTMENTS (HOLDINGS) LIMITED NOTES TO THE INTERIM CONDENSED CONSOLIDATED FINANCIAL STATEMENTS 30 JUNE 2014
Nest Investments (Holdings) Ltd- Interim Report 2014 16
7. Net Earned Premiums
Gross premiums on insurance contracts Six month period ended
30 June
2014 2013
US$ '000 US$ '000
Life Insurance 3,109 1,423
Non-Life Insurance 432,355 379,073
Gross written premium 435,464 380,496
Change in unearned premiums provision (112,922) (84,947)
Total gross premiums 322,542 295,549
Premiums ceded to reinsurers on insurance contracts
2014 2013
US$ '000 US$ '000
Life Insurance (2,094) (728)
Non-Life Insurance (150,707) (139,606)
Outward reinsurance premium (152,801) (140,335)
Change in unearned premiums provision 26,565 18,242
Total premiums ceded to reinsurers (126,236) (122,093)
Total net premiums 196,306 173,456

NEST INVESTMENTS (HOLDINGS) LIMITED NOTES TO THE INTERIM CONDENSED CONSOLIDATED FINANCIAL STATEMENTS 30 JUNE 2014
Nest Investments (Holdings) Ltd- Interim Report 2014 17
8. Net Benefits and Claims
(a) Gross benefits and claims paid Six month period ended
30 June
2014 2013
US$ '000 US$ '000
Life insurance (264) (156)
Non - life insurance (154,407) (146,539)
Total gross benefits and claims paid (154,671) (146,695)
(b) Gross ceded to reinsurers
2014 2013
US$ '000 US$ '000
Life insurance 277 86
Non - life insurance 57,789 64,061
Total claims ceded to reinsurers 58,066 64,147
(c) Gross change in contract liabilities
2014 2013
US$ '000 US$ '000
Life insurance 33 (14)
Non - life insurance (36,179) (36,430)
Change in provision for outstanding claims - gross (36,146) (36,445)
IBNR 10,106 13,311
Total gross change in contract liabilities (26,040) (23,134)
(d) Change in contract liabilities ceded to reinsurers
2014 2013
US$ '000 US$ '000
Life insurance (33) (7)
Non - life insurance (5,860) 3,928
Change in provision for outstanding claims - reinsurance (5,894) 3,921
IBNR (3,076) (5,930)
Total change in contract liabilities ceded to reinsurers (8,970) (2,009)
Net benefits and claims (131,614) (107,692)

NEST INVESTMENTS (HOLDINGS) LIMITED NOTES TO THE INTERIM CONDENSED CONSOLIDATED FINANCIAL STATEMENTS 30 JUNE 2014
Nest Investments (Holdings) Ltd- Interim Report 2014 18
9. Other Operating and Administrative Expenses
Apportionment of overheads Six month period ended 30 June
2014 2013
Operating Administra
-tive Total Operating Administra
-tive Total
US$ '000 US$ '000 US$ '000 US$ '000 US$ '000 US$ '000
Staff Cost 13,160 10,188 23,349 11,083 8,473 19,556
Occupancy Cost 812 3,118 3,930 1,271 3,232 4,502
Marketing Cost 619 333 952 544 342 886
General Business Expenses 5,193 6,029 11,222 4,266 5,696 9,962
Administrative Cost 773 1,006 1,779 1,199 539 1,737
Financial expenses 270 3,898 4,168 219 314 533
Total expenses 20,826 24,572 45,398 18,582 18,595 37,177
10. Net Interest Income- Banking Operations
Six month period ended
30 June
2014 2013
US$ '000 US$ '000
Loans and advances to customers 13,929 10,646
Due from banks and central banks 88 176
Interest income - banking operations 14,017 10,822
Customer deposits (399) (278)
Due to banks (103) (38)
Net interest income - banking operations 13,515 10,506
11. Net Fee and Commission Income- Banking Operations
Six month period ended
30 June
2014 2013
US$ '000 US$ '000
Fee and commission income - trade finance 7,525 14,432
Fee and commission expense - banking operations (59) (552)
Net fee and commission income 9,624 13,880

NEST INVESTMENTS (HOLDINGS) LIMITED NOTES TO THE INTERIM CONDENSED CONSOLIDATED FINANCIAL STATEMENTS 30 JUNE 2014
Nest Investments (Holdings) Ltd- Interim Report 2014 19
12. Net Income and Gains from Investments
Six month period ended
30 June
2014 2013
US$ '000 US$ '000
Dividend income 8,704 5,437
Other investment income 936 525
Interest income on bonds 363 356
Profit on sale of investments 321 2
Impairment charge on available for sale investment (342) −
Rental income 1,870 1,813
Net Income and Gains from Investments 11,852 8,133
13. Income tax expense Tax rates differ in each country the Group operates in; hence the subsidiaries are subject to tax on different tax rates. The group tax charge for the period relates to the results of group companies operating in the following jurisdictions:
Country
Tax Rates
Six month period ended 30 June
2014 2013
US$ '000 US$ '000
Cyprus 13% 45 26
UK 15% 257 51
Lebanon 15% 230 130
Palestine 15% 381 452
Yemen 35% 117 64
Iraq 25% 147 -
Algeria 25% 3,275 4,640
4,452 5,363
NEST INVESTMENTS (HOLDINGS) LIMITED NOTES TO THE INTERIM CONDENSED CONSOLIDATED FINANCIAL STATEMENTS 30 JUNE 2014
Nest Investments (Holdings) Ltd- Interim Report 2014 20
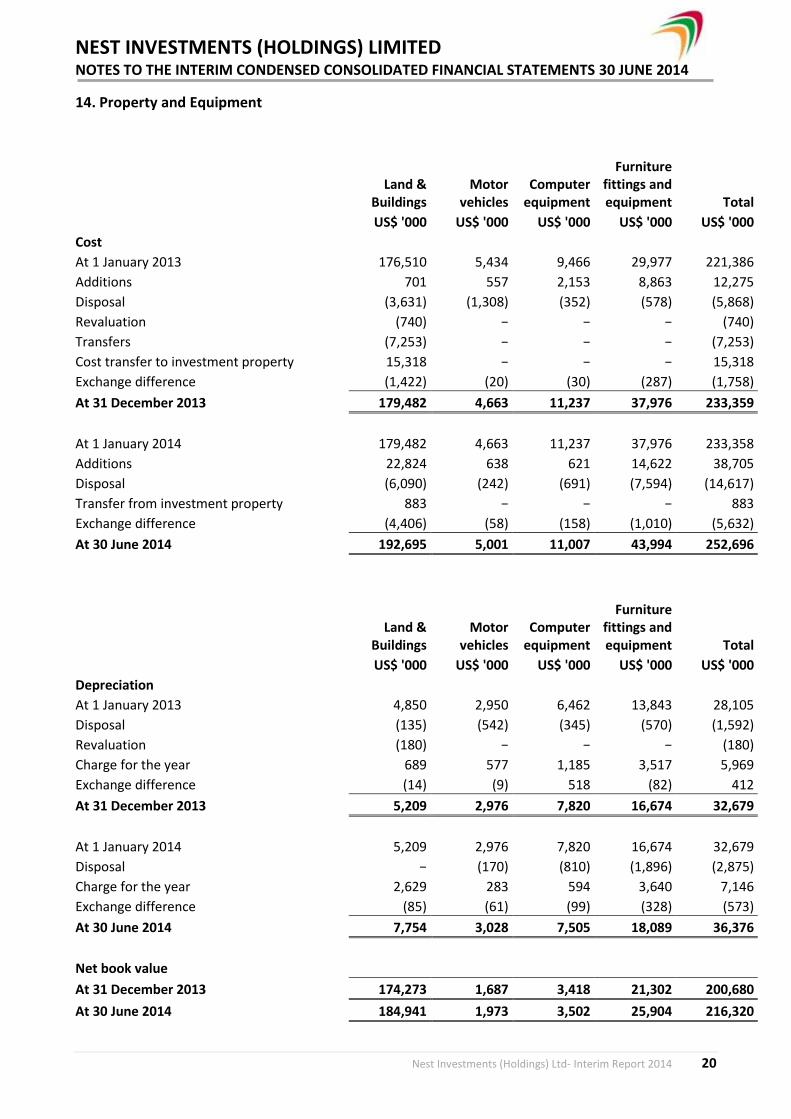
14. Property and Equipment
Land &
Buildings Motor
vehicles Computer
equipment
Furniture fittings and equipment Total
US$ '000 US$ '000 US$ '000 US$ '000 US$ '000
Cost
At 1 January 2013 176,510 5,434 9,466 29,977 221,386
Additions 701 557 2,153 8,863 12,275
Disposal (3,631) (1,308) (352) (578) (5,868)
Revaluation (740) − − − (740)
Transfers (7,253) − − − (7,253)
Cost transfer to investment property 15,318 − − − 15,318
Exchange difference (1,422) (20) (30) (287) (1,758)
At 31 December 2013 179,482 4,663 11,237 37,976 233,359
At 1 January 2014 179,482 4,663 11,237 37,976 233,358
Additions 22,824 638 621 14,622 38,705
Disposal (6,090) (242) (691) (7,594) (14,617)
Transfer from investment property 883 − − − 883
Exchange difference (4,406) (58) (158) (1,010) (5,632)
At 30 June 2014 192,695 5,001 11,007 43,994 252,696
Land &
Buildings Motor
vehicles Computer
equipment
Furniture fittings and equipment Total
US$ '000 US$ '000 US$ '000 US$ '000 US$ '000
Depreciation
At 1 January 2013 4,850 2,950 6,462 13,843 28,105
Disposal (135) (542) (345) (570) (1,592)
Revaluation (180) − − − (180)
Charge for the year 689 577 1,185 3,517 5,969
Exchange difference (14) (9) 518 (82) 412
At 31 December 2013 5,209 2,976 7,820 16,674 32,679
At 1 January 2014 5,209 2,976 7,820 16,674 32,679
Disposal − (170) (810) (1,896) (2,875)
Charge for the year 2,629 283 594 3,640 7,146
Exchange difference (85) (61) (99) (328) (573)
At 30 June 2014 7,754 3,028 7,505 18,089 36,376
Net book value
At 31 December 2013 174,273 1,687 3,418 21,302 200,680
At 30 June 2014 184,941 1,973 3,502 25,904 216,320
NEST INVESTMENTS (HOLDINGS) LIMITED NOTES TO THE INTERIM CONDENSED CONSOLIDATED FINANCIAL STATEMENTS 30 JUNE 2014
Nest Investments (Holdings) Ltd- Interim Report 2014 21
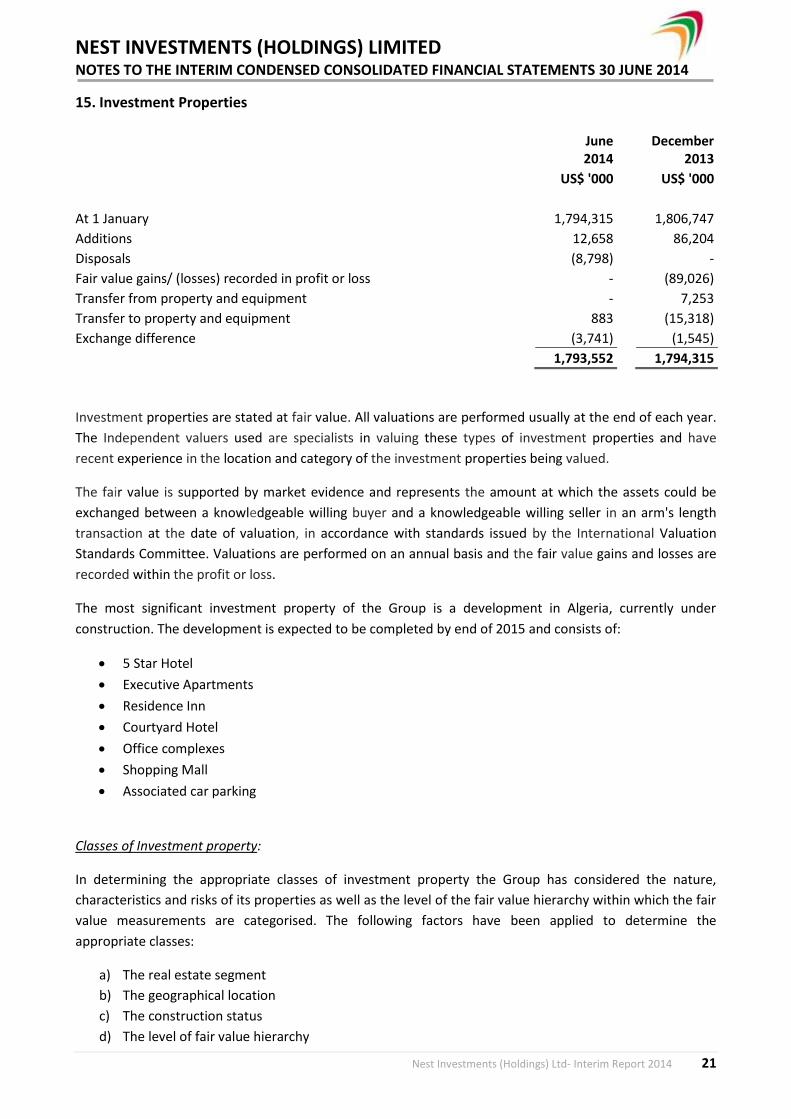
15. Investment Properties
June 2014
December 2013
US$ '000 US$ '000
At 1 January 1,794,315 1,806,747
Additions 12,658 86,204
Disposals (8,798) -
Fair value gains/ (losses) recorded in profit or loss - (89,026)
Transfer from property and equipment - 7,253
Transfer to property and equipment 883 (15,318)
Exchange difference (3,741) (1,545)
1,793,552 1,794,315
Investment properties are stated at fair value. All valuations are performed usually at the end of each year.
The Independent valuers used are specialists in valuing these types of investment properties and have
recent experience in the location and category of the investment properties being valued.
The fair value is supported by market evidence and represents the amount at which the assets could be
exchanged between a knowledgeable willing buyer and a knowledgeable willing seller in an arm's length
transaction at the date of valuation, in accordance with standards issued by the International Valuation
Standards Committee. Valuations are performed on an annual basis and the fair value gains and losses are
recorded within the profit or loss.
The most significant investment property of the Group is a development in Algeria, currently under
construction. The development is expected to be completed by end of 2015 and consists of:
5 Star Hotel
Executive Apartments
Residence Inn
Courtyard Hotel
Office complexes
Shopping Mall
Associated car parking
Classes of Investment property:
In determining the appropriate classes of investment property the Group has considered the nature,
characteristics and risks of its properties as well as the level of the fair value hierarchy within which the fair
value measurements are categorised. The following factors have been applied to determine the
appropriate classes:
a) The real estate segment
b) The geographical location
c) The construction status
d) The level of fair value hierarchy

NEST INVESTMENTS (HOLDINGS) LIMITED NOTES TO THE INTERIM CONDENSED CONSOLIDATED FINANCIAL STATEMENTS 30 JUNE 2014
Nest Investments (Holdings) Ltd- Interim Report 2014 22
Fair value measurement, valuation techniques, changes in valuation techniques, inputs and other key
information:
No valuations were performed for the six month period ended 30 June 2014.
Below are the descriptions and definitions relating to valuation techniques, unobservable inputs and other
assumptions made in determining the fair values:
Market comparable method (or market comparable approach):
The market approach uses prices and other relevant information generated by market transactions
involving identical or comparable (i.e. similar) assets, liabilities or a group of assets and liabilities, such as a
business.
Income approach:
The income approach converts future amounts (eg cash flows or income and expenses) to a single current
(i.e. discounted) amount. When the income approach is used, the fair value measurement reflects current
market expectations about those future amounts.
Discount rate:
Rate used to discount the net cash flows generated from rental and operating activities during the period of
analysis.
IRR:
This is the internal rate of return (IRR) i.e. the yield generated by the project’s cash flows.

NEST INVESTMENTS (HOLDINGS) LIMITED NOTES TO THE INTERIM CONDENSED CONSOLIDATED FINANCIAL STATEMENTS 30 JUNE 2014
Nest Investments (Holdings) Ltd- Interim Report 2014 23
16. Investment in Associates
The Group has investments in the following associates:
Country of incorporation/
Registration
Business Activity
Holding %
Qatar General Insurance and Reinsurance Company S.A.Q.
Qatar Insurance,
Reinsurance 16%
Jordanian Expatriates Investment Holding Jordan Investment
Holding 40%
Trust Insurance Co. Libya Libya Insurance 39%
Trust Syria Insurance Company (S.A.S.C) Syria Insurance 32%
Oman Reinsurance Company SAOC Oman Insurance 25%
Rigata Investments Ltd Cyprus Real Estate
Holding 30% (up to 1st January 2014)
The reporting date and reporting year of the associates is the same as the Group’s and all use uniform
accounting policies. The insurance entities are required to maintain a minimum solvency margin based on
local directives. Such restrictions can affect the ability of these associates to transfer funds in the form of
cash dividends, and therefore, there can be no assurance that these restrictions will not become a
limitation in the future.
The results for the six month period ended 30 June 2014 of the associates Trust Syria and Trust Libya were
not yet published as at the date of issue of these financial statements. The Group does not consider that
these investments in associated companies are impaired.
Rigata Investments Ltd was acquired in full by the Group on 1st January 2014 and was reclassified in
Investments in subsidiaries.
The Group’s share in the associates is presented below:

NEST INVESTMENTS (HOLDINGS) LIMITED NOTES TO THE INTERIM CONDENSED CONSOLIDATED FINANCIAL STATEMENTS 30 JUNE 2014
Nest Investments (Holdings) Ltd- Interim Report 2014 24
June 2014
Qatar
General
Jordanian
Expatriates
Trust Libya Trust Syria Oman Re Rigata
Investments
Total
US$ ‘000 US$ ‘000 US$ ‘000 US$ ‘000 US$ ‘000 US$ ‘000 US$ ‘000
As at 1st January 375,082 10,721 3,710 2,026 14,527 1,940 408,005
Additions 205 − − − 653 2,383 3,240
Reclassification to Investments in
subsidiaries
− − − − − (4,323) (4,323)
Share of profit/(loss) for the year 4,285 302 − − (572) − 4,015
As at 30 June 379,572 11,023 3,710 2,026 14,607 − 410,938
December 2013
Qatar
General
Jordanian
Expatriates
Trust Libya Trust Syria Oman Re Rigata
Investments
Total
US$ ‘000 US$ ‘000 US$ ‘000 US$ ‘000 US$ ‘000 US$ ‘000 US$ ‘000
As at 1st January − − 3,135 6,552 12,559 1,940 24,186
Additions 809 − − − 2,841 − 3,650
Reclassification from AFS investments 204,678 10,172 − − − − 214,850
Share of profit/(loss) for the year 169,595 549 575 (53) (873) − 169,793
Impairment − − − (4,378) − − (4,378)
Exchange difference − − − (95) − − (95)
As at 31st December 375,082 10,721 3,710 2,026 14,527 1,940 408,005

NEST INVESTMENTS (HOLDINGS) LIMITED NOTES TO THE INTERIM CONDENSED CONSOLIDATED FINANCIAL STATEMENTS 30 JUNE 2014
Nest Investments (Holdings) Ltd- Interim Report 2014 25
17. Financial Assets
a. Loans and advances to banking customers
June December
2014 2013
US$ ‘000 US$ ‘000
Loans and advances to customers, gross 344,789 357,494
Provisions for impairment on loans and advances to customers (23,338) (23,311)
321,450 334,183
b. Summary of other financial assets
June December
2014 2013
US$ ‘000 US$ ‘000
Held to maturity financial assets 14,009 9,198
Available for sale financial assets 100,315 101,588
Total other financial assets 114,324 110,786
c. Movement in other financial assets
Held to Maturity financial
assets Loans and
receivables
Available for sale
financial assets Total
US$ ‘000 US$ ‘000 US$ ‘000 US$ ‘000
At 1 January 2013 13,742 3,652 300,899 318,293
Additions 10,239 − 23,953 34,192
Disposal − (3,629) (13,708) (17,337)
Amortisation − − 10 10
Maturities (14,640) − − (14,640)
Fair value gain − − 7,483 7,483
Movement in impairment allowance − − (2,572) (2,572)
Write off − − (214,850) (214,850)
Exchange difference (143) (23) 373 207
At 31 December 2013 9,198 − 101,588 110,786
At 1 January 2014 9,198 − 101,588 110,787
Additions 8,546 − 11,870 20,416
Disposal − − (18,523) (18,522)
Amortisation − − 298 298
Maturities (3,375) − − (3,375)
Fair value gain − − 6,027 6,027
Movement in impairment allowance − − (342) (342)
Exchange difference (360) − (603) (964)
At 30 June 2014 14,009 − 100,315 114,324

NEST INVESTMENTS (HOLDINGS) LIMITED NOTES TO THE INTERIM CONDENSED CONSOLIDATED FINANCIAL STATEMENTS 30 JUNE 2014
Nest Investments (Holdings) Ltd- Interim Report 2014 26
18. Accounts Receivable
June December
2014 2013
US$ ‘000 US$ ‘000
Trade accounts and premiums receivable 160,174 132,702
Less: provision for doubtful debts (15,414) (10,640)
Inward Pipeline Premium Provision 190,043 94,778
Inward Treaty Premium and Loss Deposit 24,300 26,043
359,103 242,883
Accounts receivable are repayable on demand and do not carry any interest.
Movement in provision of doubtful debts:
June December
2014 2013
US$ ‘000 US$ ‘000
At 1 January 10,640 9,696
Charge for the year 960 756
Write off 3,886 233
Exchange difference (71) (44)
15,414 10,640
19. Other Assets
June December
2014 2013 US$ ‘000 US$ ‘000
Other debtors and prepayments 160,090 103,791
Current income tax receivable 2,740 2,541
Deferred tax asset 2,547 2,816
Total 165,377 109,148
Other debtors are repayable on demand and non-interest bearing.

NEST INVESTMENTS (HOLDINGS) LIMITED NOTES TO THE INTERIM CONDENSED CONSOLIDATED FINANCIAL STATEMENTS 30 JUNE 2014
Nest Investments (Holdings) Ltd- Interim Report 2014 27
20. Bank and Cash Balances
June December
2014 2013
US$ ‘000 US$ ‘000
Cash in hand 14,586 4,347
Cash at bank 633,093 589,124
Statutory deposits 33,432 18,243
Bank and cash balances 681,112 611,713
Bank overdraft (2,951) (445)
Deposits with an original maturity for more than three months (149,159) (135,379)
Cash and cash equivalent as per statement of cash flows 529,002 475,889
21. Share Capital and Reserves
a) Share Capital
June 2014 December 2013
Number of
Shares ‘000 US$ ‘000 Number of
Shares ‘000 US$ ‘000
Authorised
Ordinary shares of STG£1 each 10 17 10 17
Issued and fully paid
Ordinary shares of STG£1 each 10 17 10 17
10 17 10 17
b) Reserves June December
2014 2013
Note US$ ‘000 US$ ‘000
Retained earnings 1,527,475 1,507,555
Statutory reserve 1 40,173 38,960
Available for sale reserves 2 1,779 (1,647)
Property revaluation reserve 3 90,919 90,919
Exchange difference reserve (33,599) (31,439)
Optional reserve 4 5,264 3,207
General banking risks reserve 2,670 2,119
1,634,681 1,609,675

NEST INVESTMENTS (HOLDINGS) LIMITED NOTES TO THE INTERIM CONDENSED CONSOLIDATED FINANCIAL STATEMENTS 30 JUNE 2014
Nest Investments (Holdings) Ltd- Interim Report 2014 28
Notes:
1. Statutory reserves are required by local regulatory authorities in Lebanon, Palestine, Yemen, Iraq and
Algeria of Group companies. Generally, 10% of the net profit for the year of the relevant entity is
transferred to the statutory reserve. This continues until the reserve reaches the 25% of the capital. The
statutory reserve is not available for distribution to shareholders.
2. The available for sale reserve arises on the revaluation of available-for-sale investments. Where a
revalued financial asset is sold, the portion of the reserve that relates to that financial asset
(investment) is recognised in the profit or loss. Where a financial asset which was previously revalued is
impaired, then the portion of the accumulated revaluation reserve that relates to the respective
financial asset is recycled in the profit or loss.
3. The property revaluation reserve arises on the revaluation of land and buildings. When revalued land
and buildings are sold, the portion of the property revaluation reserve that relates to that asset is
transferred directly to the retained earnings.
4. The optional reserve represents accumulation of profit transferred at a percentage on annual profits.
This reserve may be used for such purposes as deemed appropriate by the Board of Directors and is
available for distribution to shareholders.
5. The general banking risk reserve represents a statutory reserve for the Banking operations of the Group
which is calculated as a percentage of the neither past due nor impaired loans.
Further information on the movement of the above reserves is disclosed in the consolidated statement
of comprehensive income and changes in equity.
22. Banking Customer Deposits
June December 2014 2013 US$ ‘000 US$ ‘000 By Category: Demand 182,995 71,643 Savings 4,404 8,969 Time or notice 95,451 182,286 282,851 262,898
The majority of banking customer deposits are current accounts or accounts with maturity of less than 3
months which usually do not earn any interest and are pledged against trade finance facilities. The
remainder of deposits bear an average interest of 2,1% per annum.

NEST INVESTMENTS (HOLDINGS) LIMITED NOTES TO THE INTERIM CONDENSED CONSOLIDATED FINANCIAL STATEMENTS 30 JUNE 2014
Nest Investments (Holdings) Ltd- Interim Report 2014 29
23. Insurance Contract Liabilities
2014 June 2013 December
Insurance contract
liabilities Reinsurance of liabilities Net
Insurance contract
liabilities Reinsurance of liabilities Net
US$ ‘000 US$ ‘000 US$ ‘000 US$ ‘000 US$ ‘000 US$ ‘000
Provision for reported claims by policyholders (OCR) 473,206 192,545 280,661 455,865 200,429 255,436
Provision for claims IBNR 96,007 21,600 74,407 106,457 24,673 81,784
Provision for claims IBNER 2,293 − 2,293 2,000 − 2,000
Outstanding claims provision 571,506 214,145 357,361 564,322 225,102 339,220
Provision for unearned premiums 399,760 149,977 249,784 289,144 125,855 163,289
Provision for unexpired risk reserve 101 − 101 247 137 110
Total Life and non-life insurance contract liabilities 971,367 364,122 607,245 853,712 351,093 502,619
2014 June 2013 December
Insurance contract
liabilities Reinsurance of liabilities Net
Insurance contract
liabilities Reinsurance of liabilities Net
US$ ‘000 US$ ‘000 US$ ‘000 US$ ‘000 US$ ‘000 US$ ‘000
Life insurance contracts 3,084 1,728 1,356 1,974 824 1,150
Non-life insurance contracts 968,283 362,394 605,889 851,738 350,269 501,469
Total insurance contract liabilities 971,367 364,122 607,245 853,712 351,093 502,619

NEST INVESTMENTS (HOLDINGS) LIMITED NOTES TO THE INTERIM CONDENSED CONSOLIDATED FINANCIAL STATEMENTS 30 JUNE 2014
Nest Investments (Holdings) Ltd- Interim Report 2014 30
Insurance Contract Liabilities – Gross Insurance Contract Liabilities – Reinsurers’ share Insurance Contract Liabilities – Net
2014 June
Provision for
reported claims by policyho-
lders (OCR)
Provision for claims
IBNR
Provision for claims
IBNER
Outsta-nding
claims provision
Provision for
unearned premiums
Provision for
unexpired risk
reserve
Provision for
reported claims by policyho-
lders (OCR)
Provision for claims
IBNR
Outsta-nding
claims provision
Provision for
unearned premiums
Provision for
unexpired risk
reserve
Provision for
reported claims by policyho-
lders (OCR)
Provision for claims
IBNR
Provision for claims
IBNER
Outsta-nding
claims provision
Provision for
unearned premiums
Provision for
unexpired risk
reserve
US$ ‘000 US$ ‘000 US$ ‘000 US$ ‘000 US$ ‘000 US$ ‘000 US$ ‘000 US$ ‘000 US$ ‘000 US$ ‘000 US$ ‘000 US$ ‘000 US$ ‘000 US$ ‘000 US$ ‘000 US$ ‘000 US$ ‘000
Motor 38,224 3,643 1,279 43,146 26,101 23 11,774 3 11,777 3,815 − 26,450 3,640 1,279 31,368 22,286 23
Life 210 6 − 216 2,868 − 146 2 148 1,579 − 64 4 − 68 1,288 −
Marine 2,175 87 56 2,318 4,285 15 1,668 6 1,674 3,891 − 508 81 56 644 394 15
Fire 6,020 284 114 6,419 14,235 6 4,501 86 4,587 12,032 − 1,519 198 114 1,832 2,203 6
Engineering 11,025 44 43 11,111 25,998 8 10,545 21 10,566 24,108 − 480 23 43 545 1,890 8
Medical 3,542 1,318 144 5,005 14,550 36 1,234 29 1,264 4,086 − 2,308 1,289 144 3,741 10,463 36
Travel − 6 − 6 30 − − 6 6 24 − − − − − 6 −
Other 2,666 175 12 2,852 3,358 13 2,370 11 2,381 2,177 − 295 164 12 471 1,182 13
Decennial liability 10 − 1 11 2,281 − 6 − 6 1,308 − 4 − 1 5 973 −
Natural catastrophe − − 540 540 184 − − − − 126 − − − 540 540 58 −
Workmen compensation & third party liability 6,074 596 104 6,774 4,446 − 1,389 7 1,395 1,672 − 4,685 589 104 5,378 2,774 −
Energy − 664 − 664 6,787 − − 664 664 6,787 − − − − − − −
Total Line of Business 473,206 96,007 2,293 571,506 399,760 101 192,545 21,600 214,145 149,977 − 280,661 74,407 2,293 357,361 249,784 101

NEST INVESTMENTS (HOLDINGS) LIMITED NOTES TO THE INTERIM CONDENSED CONSOLIDATED FINANCIAL STATEMENTS 30 JUNE 2014
Nest Investments (Holdings) Ltd- Interim Report 2014 31
Insurance Contract Liabilities – Gross Insurance Contract Liabilities – Reinsurers’ share Insurance Contract Liabilities – Net
2013 December
Provision for
reported claims by policyho-
lders (OCR)
Provision for claims
IBNR
Provision for claims
IBNER
Outsta-nding
claims provision
Provision for
unearned premiums
Provision for
unexpired risk
reserve
Provision for
reported claims by policyho-
lders (OCR)
Provision for claims
IBNR
Outsta-nding
claims provision
Provision for
unearned premiums
Provision for
unexpired risk
reserve
Provision for
reported claims by policyho-
lders (OCR)
Provision for claims
IBNR
Provision for claims
IBNER
Outsta-nding
claims provision
Provision for
unearned premiums
Provision for
unexpired risk
reserve
US$ ‘000 US$ ‘000 US$ ‘000 US$ ‘000 US$ ‘000 US$ ‘000 US$ ‘000 US$ ‘000 US$ ‘000 US$ ‘000 US$ ‘000 US$ ‘000 US$ ‘000 US$ ‘000 US$ ‘000 US$ ‘000 US$ ‘000
Motor 36,598 3,047 1,027 40,673 25,358 − 11,151 3 11,154 4,414 − 25,448 3,044 1,027 29,519 20,945 −
Life 243 6 − 249 1,725 − 179 2 181 643 − 64 4 − 68 1,082 −
Marine 1,804 104 36 1,945 3,738 11 1,471 12 1,482 3,454 − 334 93 36 462 285 11
Fire 7,751 304 140 8,196 15,503 − 6,441 68 6,509 13,167 − 1,310 237 140 1,687 2,337 −
Engineering 11,066 91 39 11,196 24,890 8 10,673 57 10,729 24,293 − 393 34 39 466 597 8
Medical 3,022 1,167 149 4,338 5,957 − 1,103 27 1,129 1,422 − 1,920 1,140 149 3,209 4,534 −
Travel − 6 − 6 28 − − 6 6 24 − − − − − 5 −
Other 2,793 237 12 3,043 3,130 228 2,385 7 2,392 2,024 137 408 230 12 650 1,105 91
Decennial liability 9 − − 9 2,042 − 6 − 6 1,126 − 2 − − 3 915 −
Natural catastrophe − − 490 490 105 − − − − 72 − − − 490 490 33 −
Workmen compensation & third party liability 5,787 811 106 6,705 2,050 − 1,570 14 1,584 55 − 4,218 798 106 5,121 1,995 −
Total Line of Business 455,865 106,457 2,000 564,322 289,144 247 200,429 24,673 225,102 125,855 137 255,436 81,784 2,000 339,220 163,289 110

NEST INVESTMENTS (HOLDINGS) LIMITED NOTES TO THE INTERIM CONDENSED CONSOLIDATED FINANCIAL STATEMENTS 30 JUNE 2014
Nest Investments (Holdings) Ltd- Interim Report 2014 32
Outstanding Claims Provision
2014 June 2013 December
Insurance contract
liabilities Reinsurance of liabilities Net
Insurance contract
liabilities Reinsurance of liabilities Net
US$ ‘000 US$ ‘000 US$ ‘000 US$ ‘000 US$ ‘000 US$ ‘000
At 1 January 436,948 198,366 238,582 410,506 213,137 197,369
Provision for the year (128,785) (63,879) (64,906) (228,583) (134,288) (94,295)
Claims paid during the year 164,931 57,985 106,946 274,359 121,666 152,693
Exchange difference 112 73 39 (417) (87) (330)
473,206 192,545 280,661 455,865 200,429 255,436
Provision for Unearned Premiums
2014 June 2013 December
Insurance contract
liabilities Reinsurance of liabilities Net
Insurance contract
liabilities Reinsurance of liabilities Net
US$ ‘000 US$ ‘000 US$ ‘000 US$ ‘000 US$ ‘000 US$ ‘000
At 1 January 287,018 123,670 163,349 271,792 117,768 154,024
Premiums written in year 450,590 154,801 295,789 625,557 258,984 366,572
Premiums earned during the year (337,667) (128,236) (209,432) (607,540) (250,494) (357,046)
Exchange difference (180) (258) 78 (664) (403) (262)
399,760 149,977 249,784 289,144 125,855 163,289

NEST INVESTMENTS (HOLDINGS) LIMITED NOTES TO THE INTERIM CONDENSED CONSOLIDATED FINANCIAL STATEMENTS 30 JUNE 2014
Nest Investments (Holdings) Ltd- Interim Report 2014 33
24. Creditors, accruals and other liabilities
June December
2014 2013
US$ ‘000 US$ ‘000
Trade payables 46,885 44,627
Outward pipeline premium provision 58,808 39,159
Outward treaty premium and loss deposit 12,140 14,312
Other creditors and accrued expenses 291,838 226,886
Current income tax payable 132,307 135,199
Trade creditors and other liabilities 541,978 460,182
The trade payables are repayable on demand and do not carry any interest.

NEST INVESTMENTS (HOLDINGS) LIMITED NOTES TO THE INTERIM CONDENSED CONSOLIDATED FINANCIAL STATEMENTS 30 JUNE 2014
Nest Investments (Holdings) Ltd- Interim Report 2014 34
25. Group Companies
The interim condensed consolidated financial statements include the financial statements of Nest
Investments (Holdings) Limited and the subsidiaries listed in the following table:
Notes Country of Incorporation/
Registration Business Activity
Holding 2014
%
Nest Investments Holdings (Cyprus) Ltd Cyprus Services 100,00%
Rigata Investments Ltd Cyprus Real Estate Holding 100,00%
Nest Investment Property Ltd United Kingdom Investment Properties Holding 100,00%
Foundation for Insurance & Finance Education Cyprus Education 100,00%
Trust International Insurance & Reinsurance Company B.S.C. (c) – Trust Re Bahrain Reinsurance 99,10%
Trust Underwriting Ltd United Kingdom Corporate member of Lloyds 100,00%
Texas International Underwriters Inc. United States of America Insurance 100,00%
Aegean Properties Ltd Guernsey Investment Holding 88,33%
Ventura Del Mar S.A. Spain Real estate 88,33%
Ventura Del Mar S.A. Ltd United Kingdom Property ownership 100,00%
Ribera De Marbella S.L. Spain Service company 100,00%
Afro Asian Assistance B.S.C. Bahrain Travel assistance 100,00%
Trust International Insurance Company (Cyprus) Ltd Cyprus Insurance 100,00%
Market Insurance Services (Cyprus) Ltd Cyprus Insurance consultancy and related
services 100,00%
Market Insurance & Reinsurance Services Ltd United Kingdom Insurance consultancy and related
services 100,00%
Euroarab Management Ltd Cyprus Insurance consultancy and related
services 100,00%
Market Insurance Brokers Holdings Ltd Cyprus Investment Holding 96,14%
Market Insurance Brokers Ltd United Kingdom Reinsurance Broker 100,00%
World Trade Centers Holdings (Cyprus) Ltd Cyprus Services 100,00%
World Trade Center (Cyprus) Ltd Cyprus Development and marketing of the
WTC name in Cyprus 100,00%
Word Trade Center Beirut Ltd Lebanon Development and marketing of the
WTC name in Lebanon 100,00%
World Trade Centers Saudi Co Ltd Saudi Arabia Sale and leasing of properties 100,00%
World Trade Center Algeria Ltd Algeria Sale and leasing of properties 100,00%
Signature Holding (Cyprus) Ltd Cyprus Provision of Training services 100,00%
Tradecard Holding (Cyprus) Ltd Cyprus Provision of hosted technology,
online services and a global network of trade experts through
Tradecard Platform.
100,00%
Trust Holdings Ltd Cyprus Investment Holding 100,00%
Compass Insurance S.A.L. Lebanon Insurance 90,00%
Trust Algeria Investment Company Algeria Holding Investment 66,95%
Trust Algeria Assurances Reassurances Algeria Ins. & Reins. 77,45%
Trust Real Estate Algeria Real Estate 57,00%
Trust Industry Algeria Manufacturing 64,00%
Eurl Briqueterie Sbtm Algeria Manufacturing 64,00%
Eurl Sprh Hadjout Briqueterie Algeria Manufacturing 64,00%
Trust Bank Algeria Algeria Banking 40,63%
Trust Yemen Insurance & Reinsurance Co. (Y.S.C) Yemen Insurance 75,00%
Trust International Insurance Co. Plc. (Palestine) (i) Palestine Insurance 44,62%
Trust House Insurance Co. (ii) Iraq Insurance 49,00%
Note:
(i) The Group does not own more than 50% of the equity shares of Trust International Insurance Co. Plc.
Palestine and consequently does not control more than 50% of the voting power of those shares. However,

NEST INVESTMENTS (HOLDINGS) LIMITED NOTES TO THE INTERIM CONDENSED CONSOLIDATED FINANCIAL STATEMENTS 30 JUNE 2014
Nest Investments (Holdings) Ltd- Interim Report 2014 35
it has the power to exercise control over the company via its shareholder who controls directly such % to
bring the total over the 50% level. The remaining shareholding % is held by non-related parties.
(ii) Although the Group does not own more than 50% of the equity shares of Trust House Insurance Co., it
has the power to exercise control over the company via other shareholdings and therefore it is
consolidated as a subsidiary. The remaining shareholding % is held by non- related parties.
26. Related Party Transactions
The amounts due from/ to related companies represent balances from associate companies, companies
related to the ultimate holding company and from other entities in which the group has an interest as
well as reconciling items between the group companies.
a) Balances with related parties included in the consolidated statement of financial position:
June
2014 December
2013 US$ '000 US$ '000
Payable to Jordanian Expatriates Financial Brokerage 46 8 (Receivable)/ payable (from)/ to Qatar General Insurance and Reinsurance Company
(2,359) 3,165
(2,313) 3,173
b) Key Management Personnel Compensation
June
2014 December
2013 US$ '000 US$ '000
Salaries 152 554
Other short-term employment benefits 18 180
170 734
The key management personnel comprises of the Board of Directors.