nepal: state of the environment 2001 -...
TRANSCRIPT


55Forest Depletion
Nepal: State of the Environment 2001
3.1.1 IntroductionThe forests of Nepal are the second largest natural resource after water. However, during the lastfour decades, the forest area has decreased considerably due to uncontrolled use of forests and theirproducts. Compared to 6.4 million hectares of forest in 1964, the current forest area is 4.27 millionhectares: 29% of the country’s total area (DFRS 1999a). Between 1978 and 1994, the rate ofdeforestation in the country was 1.7% per year. Thus, forest depletion has emerged as one of themost serious environmental issues for Nepal. Forest depletion has brought about many otherenvironmental impacts such as landslides, soil erosion, floods, soil degradation, out-migration ofpeople, and so on. Thus, conservation of the forest resource is fundamental to the protection ofother resources such as water, soil, flora and fauna, and human activities such as agriculture, animalhusbandry, and logging which are directly and indirectly dependent on it.
Diminishing forest area can be attributed primarily to the rapid growth of population. The numberof people dependent on agriculture is rising; and as a result agricultural land has increased, mostly byencroaching upon forest areas. One of the major challenges faced by the country is how to conserveforest resources. Some programmes, such as community forestry programmes, have carried outexemplary work on conserving forest resources. But, on the other hand, there are also activitiesresponsible for the dwindling of forest resources in the country. It is important in this context tounderstand the status of forest resources in terms of use and misuse, measures undertaken toconserve the forests, and programmes laid down for the future by the national government.However, the forest data available are characterised by being both scanty and scattered.
3.1.2 PressureThe forest, according to the Department of Forest Research and Survey (DFRS 1999b), refers to allland having trees with more than 10% crown cover and not used primarily for purposes other thanforestry. This also includes temporarily cut forest area. Forest depletion refers to the diminishing offorests in terms of quantity and quality. Quantity refers to the gross area covered by the forestwhereas quality signifies the density of trees in the forest area.
(a) Population GrowthThe population is growing at a rapid rate; the growth rate has remained at over two per cent perannum since 1961. Population growth appears to be the single most important factor behinddiminishing forest resources in the country.
(b) Types of energy usedFigure 3.1 shows that the energy consumption of Nepalese people is excessively dependent on fuelwood.In 1998, fuelwood derived from the forest constituted the largest proportion of the total fuelconsumption (78%). Along with the increase in population, the consumption of fuelwood, as shown inFigure 3.2, has also increased. The fact is that, in the absence of alternative energy sources, most rural
78%
4%6%2%9%1%
Fuelwood Agri.Waste Animal DungCoal Petroleum Elecricity
Figure 3.1: Consumption of energy by type(Total energy used:7,340,000 toe in 1997/98)
Source: WECS (1999)
5007009001100130015001700190021002300
1981 1985 1987 1989 1991 1993 1995 1997
Popu
latio
n (’0
00)
3000
3500
4000
4500
5000
5500
6000
Fuel
woo
d (’0
00 to
nnes
)
Total population Fuelwood
Figure 3.2: Population growth and fuelwood consumption
Source: CBS (1998), MoF (1999)

56 SoE Report Nepal
Nepal: State of the Environment 2001
Figure 3.3: Livestock and grazing area
14,000
15,000
16,000
17,000
18,000
19,000
1985 1990 1995 1998
Lives
tock
’000
hea
ds
1,000
1,500
2,000
2,500
3,000
Gra
zing
are
a ’0
00 h
a
Livestock Grazing area
Source: MoA (1999)
62%
26%10% 2%
Roughage Grain by productGrass and pasture Forest feed
Figure 3.4: Feed consumed by livestock
Terai25%
Hill42%Mountain
33%
Source MoA (1999); Raut (1997/98)
Figure 3.5: Forest feed used by livestock by eco-region
Source MoA (1999); Raut (1997/98)
people have to depend on forest fuelwood for cooking. Note also that the rural people constitute about85% of the total population. The forest area easily reachable by local people constitutes about 51.5% ofthe total forest area, and is mostly located on slopes below 45° (DFRS 1999b).
The pattern of energy consumption has alsochanged. Between 1980 and 1998, total energyconsumption increased; the percentage share offuelwood declined after 1985 (Table 3.1).Between the same years, the use of traditionalenergy sources like cow dung and agriculturalresidues, excluding fuelwood, declined from 22to 9%, while the consumption of commercialenergy, such as coal, petroleum products andelectricity, increased from 4 to 12%.
(c) Livestock and grazing areaMuch forest area is used as grazing land forlivestock, the numbers of which are alsoincreasing tremendously. This has led tofurther degradation of the forest area. Figure3.3 shows that the number of livestock (cattle,pigs, goats, and sheep) increased by about20% between 1985-1998, while the grazingarea remained constant. Figure 3.4 indicatesthat about 10% of the livestock feed comesfrom the forest (Raut 1997/98).
The pressure on the forest varies withgeographical region. From 1978-1994, the rateof estimated annual deforestation variedgreatly between the Hills (2.3%) and the Terai (1.3%) (DFRS 1999a). In the former, the higher rateof deforestation might have been due to the greater dependency (42%) on fodder supply forlivestock as depicted in Figure 3.5. Other reasons for forest degradation include landslides,agricultural land expansion, fuelwood demand, and infrastructural development.
(d) Human migrationIn the Terai, migration is a major factor in forest encroachment. This region has been a majordestination for hill migrants for the last four decades. In 1952, the region had nearly 35% of the
Table 3.1: Trend of energy consumption
Year Total
energy used
(‘000 toe+)
Fuelwood as % of total energy used
Traditional energy as %
of total energy used*
1980 4591 74 22 1985 5149 85 10 1990 5688 85 10 1995 6604 82 10 1998 7340 79 9 Source: WECS (1995, 1998) * Excludes fuelwood + toe = tonnes of oil equivalent
57Forest Depletion
Nepal: State of the Environment 2001
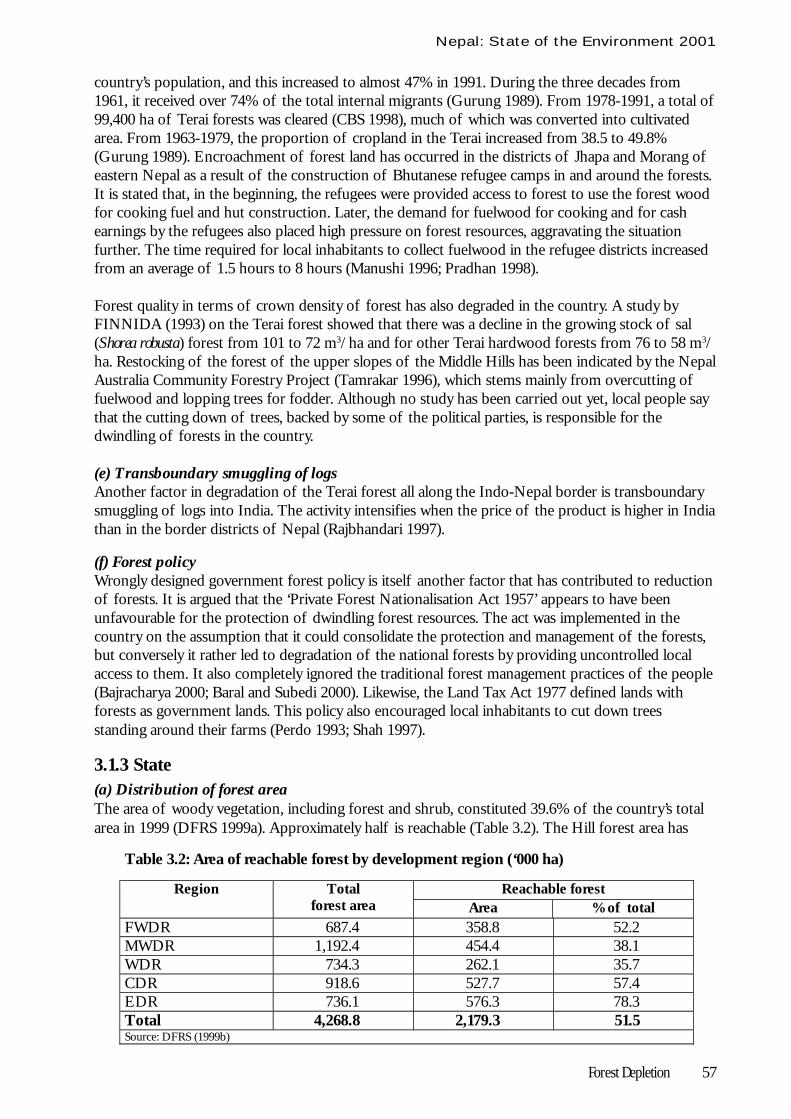
country’s population, and this increased to almost 47% in 1991. During the three decades from1961, it received over 74% of the total internal migrants (Gurung 1989). From 1978-1991, a total of99,400 ha of Terai forests was cleared (CBS 1998), much of which was converted into cultivatedarea. From 1963-1979, the proportion of cropland in the Terai increased from 38.5 to 49.8%(Gurung 1989). Encroachment of forest land has occurred in the districts of Jhapa and Morang ofeastern Nepal as a result of the construction of Bhutanese refugee camps in and around the forests.It is stated that, in the beginning, the refugees were provided access to forest to use the forest woodfor cooking fuel and hut construction. Later, the demand for fuelwood for cooking and for cashearnings by the refugees also placed high pressure on forest resources, aggravating the situationfurther. The time required for local inhabitants to collect fuelwood in the refugee districts increasedfrom an average of 1.5 hours to 8 hours (Manushi 1996; Pradhan 1998).
Forest quality in terms of crown density of forest has also degraded in the country. A study byFINNIDA (1993) on the Terai forest showed that there was a decline in the growing stock of sal(Shorea robusta) forest from 101 to 72 m3/ha and for other Terai hardwood forests from 76 to 58 m3/ha. Restocking of the forest of the upper slopes of the Middle Hills has been indicated by the NepalAustralia Community Forestry Project (Tamrakar 1996), which stems mainly from overcutting offuelwood and lopping trees for fodder. Although no study has been carried out yet, local people saythat the cutting down of trees, backed by some of the political parties, is responsible for thedwindling of forests in the country.
(e) Transboundary smuggling of logsAnother factor in degradation of the Terai forest all along the Indo-Nepal border is transboundarysmuggling of logs into India. The activity intensifies when the price of the product is higher in Indiathan in the border districts of Nepal (Rajbhandari 1997).
(f) Forest policyWrongly designed government forest policy is itself another factor that has contributed to reductionof forests. It is argued that the ‘Private Forest Nationalisation Act 1957’ appears to have beenunfavourable for the protection of dwindling forest resources. The act was implemented in thecountry on the assumption that it could consolidate the protection and management of the forests,but conversely it rather led to degradation of the national forests by providing uncontrolled localaccess to them. It also completely ignored the traditional forest management practices of the people(Bajracharya 2000; Baral and Subedi 2000). Likewise, the Land Tax Act 1977 defined lands withforests as government lands. This policy also encouraged local inhabitants to cut down treesstanding around their farms (Perdo 1993; Shah 1997).
3.1.3 State(a) Distribution of forest areaThe area of woody vegetation, including forest and shrub, constituted 39.6% of the country’s totalarea in 1999 (DFRS 1999a). Approximately half is reachable (Table 3.2). The Hill forest area has
Table 3.2: Area of reachable forest by development region (‘000 ha)
Reachable forest Region Total forest area Area % of total
FWDR 687.4 358.8 52.2 MWDR 1,192.4 454.4 38.1 WDR 734.3 262.1 35.7 CDR 918.6 527.7 57.4 EDR 736.1 576.3 78.3 Total 4,268.8 2,179.3 51.5 Source: DFRS (1999b)

58 SoE Report Nepal
Nepal: State of the Environment 2001
Table 3.3: Per capita forest distribution by physiographic zone Physiographic regions Area
(‘000 ha) Population (‘000) ‘91
Forest area per 100 ha
Per capita forest area
Mountain 3,507.8 1,442.3 3.37 0.08 Hill 7,203.2 8,413.4 33.80 0.29 Terai 4,007.1 8,635.3 29.86 0.14 Total/Average 14,718.1 18,491.0 29.00 0.23 Source: DFRS (1999a); CBS (1998)
Table 3.4: Percentile change in area of woody vegetation Woody Vegetation
LRMP 1978-79
Master Plan 1985-86
NFI 1994
Forest 38.0 37.4 29.0 Shrub 4.7 4.8 10.6 Total 42.7 42.2 39.6 Source: LRMP (1986); DFRS (1999a)
Table 3.5: Forest and shrub cover by development region
LRMP 1978/791 (‘000 ha)
NFI (1994)2 (‘000 ha)
Change % Region
Forest Shrub Forest Shrub Forest Shrub FWDR 989.5 60.4 687.4 263.9 31 337 MWDR 1,649.7 77.3 1,192.4 442.0 28 472 WDR 924.0 137.3 734.3 256.9 21 87 CDR 1,104.9 222.8 918.6 233.8 17 6 EDR 948.7 192.1 736.1 362.6 22 84 Total 5,616.8 689.9 4,268.8 1,559.2 24 126 Source: 1MFSC (1988); 2DFRS (1999a)
both the largest area (381,000 ha) and the largest share of forest and shrubland. In terms of relativeshare of forest coverage, the Siwaliks in the Terai region have the largest density of forest cover(843,000 ha), and this area accounted for 70.4% of the total forest cover of the Terai. The forest inthe Terai region is more productive and relatively more accessible than that in other areas. Thus, theTerai forests fulfill the major demands for timber and fuelwood for all towns and cities in Nepal.These forests need to be managed intensively, preferably based on local people’s participation, forwood, ecosystem and genetic resource conservation, soil conservation, and watershed management(Kanel 2000).
Table 3.3 shows that the forests, in terms of criteria for both population and area, are better in theHills than in the other two regions. Maps 3.1 and 3.2 show forest area use and community forestshare in the total forest area in the country.
The shrub area in relation to the forest area hasincreased since 1978, as shown in Table 3.4. Thismeans that forest quality has decreased. Theannual reduction rate in forest area between1978/79 and 1994 was 1.7%; the annual reductionrate in forest and shrub combined was 0.5%(DFRS 1999a). The forest area decreased in allregions from east to west, in different ratios from1978-94 (Table 3.5). During these years, theaverage ratio of the decrease in forests was 24%,while shrub increased at an average of 126% (DFRS 1999a). The far-west of Nepal has the lowestforest coverage and the highest rate of loss (31%). Three other development regions lie below theaverage value of loss: the west, the centre, and the east (DFRS 1999a).
The total stem volume and area of accessible forest in Nepal are about 387.5 million m3 and 2179.3thousand hectares respectively. The mean volume of the forest is estimated to be 178 m3/ha. The

59Forest Depletion
Nepal: State of the Environment 2001

61Forest Depletion
Nepal: State of the Environment 2001
63Forest Depletion
Nepal: State of the Environment 2001
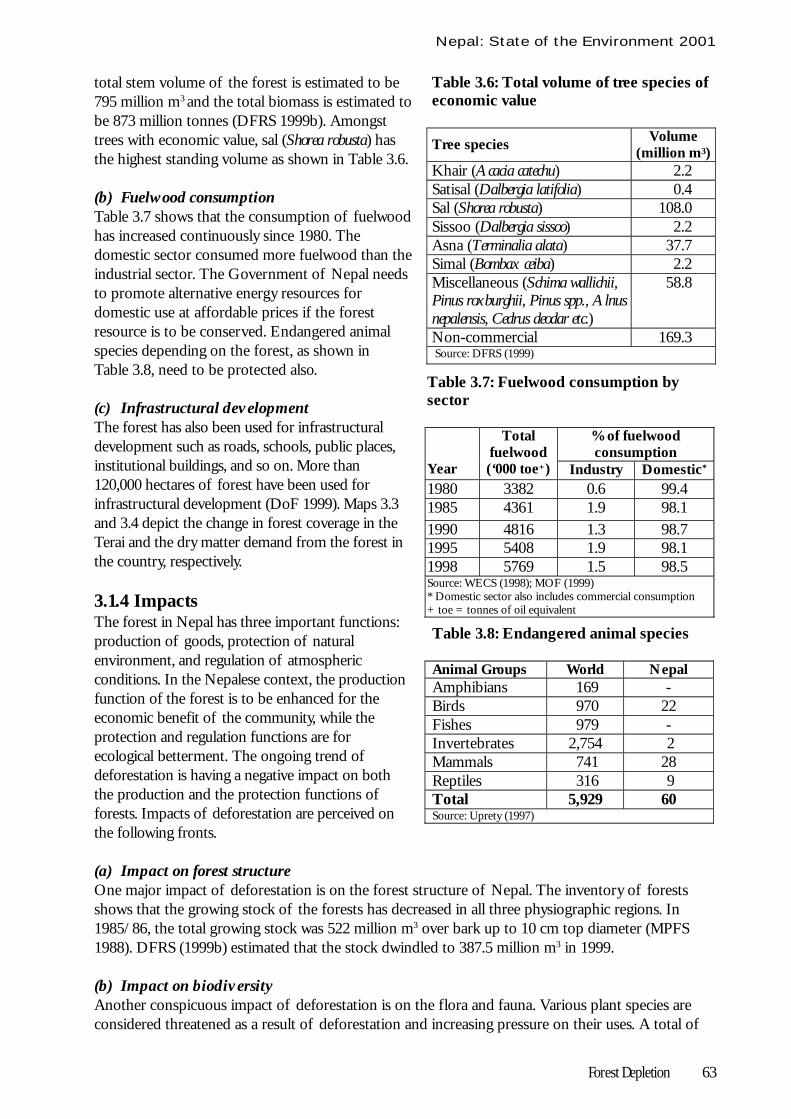
total stem volume of the forest is estimated to be795 million m3 and the total biomass is estimated tobe 873 million tonnes (DFRS 1999b). Amongsttrees with economic value, sal (Shorea robusta) hasthe highest standing volume as shown in Table 3.6.
(b) Fuelwood consumptionTable 3.7 shows that the consumption of fuelwoodhas increased continuously since 1980. Thedomestic sector consumed more fuelwood than theindustrial sector. The Government of Nepal needsto promote alternative energy resources fordomestic use at affordable prices if the forestresource is to be conserved. Endangered animalspecies depending on the forest, as shown inTable 3.8, need to be protected also.
(c) Infrastructural developmentThe forest has also been used for infrastructuraldevelopment such as roads, schools, public places,institutional buildings, and so on. More than120,000 hectares of forest have been used forinfrastructural development (DoF 1999). Maps 3.3and 3.4 depict the change in forest coverage in theTerai and the dry matter demand from the forest inthe country, respectively.
3.1.4 ImpactsThe forest in Nepal has three important functions:production of goods, protection of naturalenvironment, and regulation of atmosphericconditions. In the Nepalese context, the productionfunction of the forest is to be enhanced for theeconomic benefit of the community, while theprotection and regulation functions are forecological betterment. The ongoing trend ofdeforestation is having a negative impact on boththe production and the protection functions offorests. Impacts of deforestation are perceived onthe following fronts.
(a) Impact on forest structureOne major impact of deforestation is on the forest structure of Nepal. The inventory of forestsshows that the growing stock of the forests has decreased in all three physiographic regions. In1985/86, the total growing stock was 522 million m3 over bark up to 10 cm top diameter (MPFS1988). DFRS (1999b) estimated that the stock dwindled to 387.5 million m3 in 1999.
(b) Impact on biodiversityAnother conspicuous impact of deforestation is on the flora and fauna. Various plant species areconsidered threatened as a result of deforestation and increasing pressure on their uses. A total of
Table 3.6: Total volume of tree species of economic value Tree species Volume
(million m3) Khair (Acacia catechu) 2.2 Satisal (Dalbergia latifolia) 0.4 Sal (Shorea robusta) 108.0 Sissoo (Dalbergia sissoo) 2.2 Asna (Terminalia alata) 37.7 Simal (Bombax ceiba) 2.2 Miscellaneous (Schima wallichii, Pinus roxburghii, Pinus spp., Alnus nepalensis, Cedrus deodar etc.)
58.8
Non-commercial 169.3 Source: DFRS (1999)
Table 3.7: Fuelwood consumption by sector
% of fuelwood consumption
Year
Total fuelwood (‘000 toe+) Industry Domestic*
1980 3382 0.6 99.4 1985 4361 1.9 98.1 1990 4816 1.3 98.7 1995 5408 1.9 98.1 1998 5769 1.5 98.5 Source: WECS (1998); MOF (1999) * Domestic sector also includes commercial consumption + toe = tonnes of oil equivalent Table 3.8: Endangered animal species Animal Groups World Nepal Amphibians 169 - Birds 970 22 Fishes 979 - Invertebrates 2,754 2 Mammals 741 28 Reptiles 316 9 Total 5,929 60 Source: Uprety (1997)


65Forest Depletion
Nepal: State of the Environment 2001

67Forest Depletion
Nepal: State of the Environment 2001


72 SoE Report Nepal
Nepal: State of the Environment 2001
megawatts, the Ninth Plan (1997-2002) has ascheme to install 90,000 biogas plants. Inaddition, the plan will launch an ImprovedCooking Stove (ICS) programme in 45districts, aimed at installing about 150,000stoves. The non-government sector will alsoinstall an additional 100,000 improved stoves.
The Ninth Plan has a scheme to install solarenergy photovoltaic systems in 38,000households in remote areas that cannot be linked with the central grid system and where micro-hydro electricity is not feasible. About 300 solar dryers will be installed during the Plan period inorder to help provide energy and increase the income of rural communities.
(c) Nepal’s signature on international conventions and treatiesNepal has signed various international conventions and treaties related to the conservation offorests and biodiversity, as shown in Table 3.12.
Table 3.11: Potential versus installed biogas units, households by physiographic region
HH by physiographic region
Potential & Installed Biogas
Mtn. Hill Terai
Total HH
Potential Biogas 11,636 593,831 891,925 1,497,392 Installed Biogas 318 16,028 15,773 32,119 Source: CBS (1998) HH = Households
Table 3.12: International conventions and treaties related to the conservation of forests and biodiversity
Conventions Date Nepal’s Signature Main objective Major obligation
Plant Protection Agreement for South East Asia and the Pacific Region
27 Feb 1956
12 Aug 1965
Prevent introduction and spread of destructive plant diseases and pests
Regulate trade of plants, and plant products
Convention on the International Trade in Endangered Species of Wild Fauna and Flora (CITES)
3 Mar 1973
18 Aug 1975
Protect and regulate the trade in wild fauna and flora and their products
Protect all species threatened legally and regulate trade
Convention on Wetlands of International Importance especially Waterfowl Habitat (Ramsar Convention)
2 Feb 1971
17 Dec 1987
Prevent the loss of wetlands
Conservation and sustainable use of migratory stocks of wildfowl
International Tropical Timber Agreement (ITTA)
18 Nov 1983
3 Jul 1990
Ensure conservation and sustainable use of timber and enhance international timber trade
Implement activities for forest management and decisions on timber trade
Agreement on the Network of Aquaculture Centres in Asia and the Pacific
8 Jan 1988
4 Jan 1990
Aquaculture development for increasing rural income
Expand network of aquaculture centres
Convention on Biological Diversity
5 Jun 1992
15 Jun 1992
Ensure conservation and sustainable use of biological resources
Prepare and implement national strategies for the conservation of biodiversity
UN Convention to Combat Desertification
17 Jun 1994
12 Oct 1995
Combat desertification Prepare national action Plan and implement programmes for poverty alleviation

73Forest Depletion
Nepal: State of the Environment 2001
3.1.6 ConclusionIn order for the forestry sector to achieve significant growth and continue to contribute to Nepal’snational economy, forest resources need to be used and managed in an integrated as well as anintensive manner. There is also a need to ensure that ecological constraints are addressed regularlyand in a sustainable way. The main objective of forest resource management should be to developand implement an integrated programme of resource management, including watershedmanagement and biodiversity conservation.
There is a need to generate large-scale employment in the forestry sector through involving peoplein forest management, protection, plantation, harvesting and transportation, and wood-processingindustries. Concomitantly, supplementary incomes can be generated for rural farm families throughcommunity, leasehold, and private forestry. In this context, it should be realised that generation ofincome and employment are more important than government revenue alone and governmentagencies, NGOs, and private firms should work constructively for the benefit of society. The newand more responsible roles of the Nepalese forestry sector will guide it in new directions during thetwenty-first century.
This objective calls for pragmatic and practical policies and legislations in forest development. Thereis no doubt that the existing policies and legislation are not adequate. Some of the issues that havebeen observed and discussed here should be addressed. The changes needed in policy issues arestated below under recommendations.
(a) GapsSome of the data gaps identified in the forestry sector include the following.• The total forest area that has been encroached upon by different sectors.• Considerable numbers of trees are outside the public forest. Villagers use many of them for
fodder, fuelwood, and timber. Their existence, therefore diminishes pressure on the forest.However, there is a data gap on the area covered by such trees.
• There is no detailed information on endangered plant species. Surveys should be conducted tocollect information on such plant species.
(b) Recommendations• All the forests of the Siwalik Hills need to be declared protected forests for conservation of the
ecosystem.• Extensive plantation of trees should be undertaken wherever there are vacant public lands such
as village wastelands, in and around farms, rural and urban parks, temple and school premises,and along roads and rivers. NGOs should be involved extensively in such activities. For this, therelevant government agencies should be activated.
• Plant resources should be surveyed and catalogued so that the conservation of endangered andvulnerable plant species can be carried out.
• The private sector should be encouraged to participate in the use and management of forests asfar as possible.
• The provision of a leasehold forestry programme for groups of people living below the povertyline needs to be reassessed so that no conflict between the programme and the User GroupCommunity Forestry Programme exists.
• Public awareness about the importance of forests and the consequences of deforestation is veryimportant. Public awareness about forest conservation needs to be raised through public media,posters, drama, school education programmes, and so on. The local elite, political leaders, socialactivists, and NGOs should be involved in public awareness programmes about forestconservation.

74
Nepal: State of the Environment 2001
SoE Report Nepal
• Forest research should focus on basic issues of forest conservation at local level so that morerealistic measures and policy programmes can be devised.
3.1.7 Proposed ProjectsA cost analysis of some proposed projects related to forest conservation is given below.
Project 1: Data Gaps in Private Forestry
Executive and promoting organisation: Ministry of Forests
Implementing organisation: Local NGOs or other private agencies working in relatedfields.
Duration: 1 year
Location: District Offices
Cost: The total estimated cost is US$ 26,000
Rationale: Public or community forestry alone cannot meet thegrowing demand for forest products. Private forestry canplay a vital role in changing the life of the people bysupplying raw materials to industry and fuelwood fordomestic consumption. However, no studies have beenmade to date to provide information about the state ofprivate forestry. Thus, the purpose of this study is to fill thedata gap. The study will provide information about thestatus of private forests, present policy, and its obstacles, aswell as future development potential for poverty alleviationand development of the country.
Methodology: The study will be carried out in four phases. The duration ofthe study will be around 6 to 8 months.
75Forest Depletion
Nepal: State of the Environment 2001
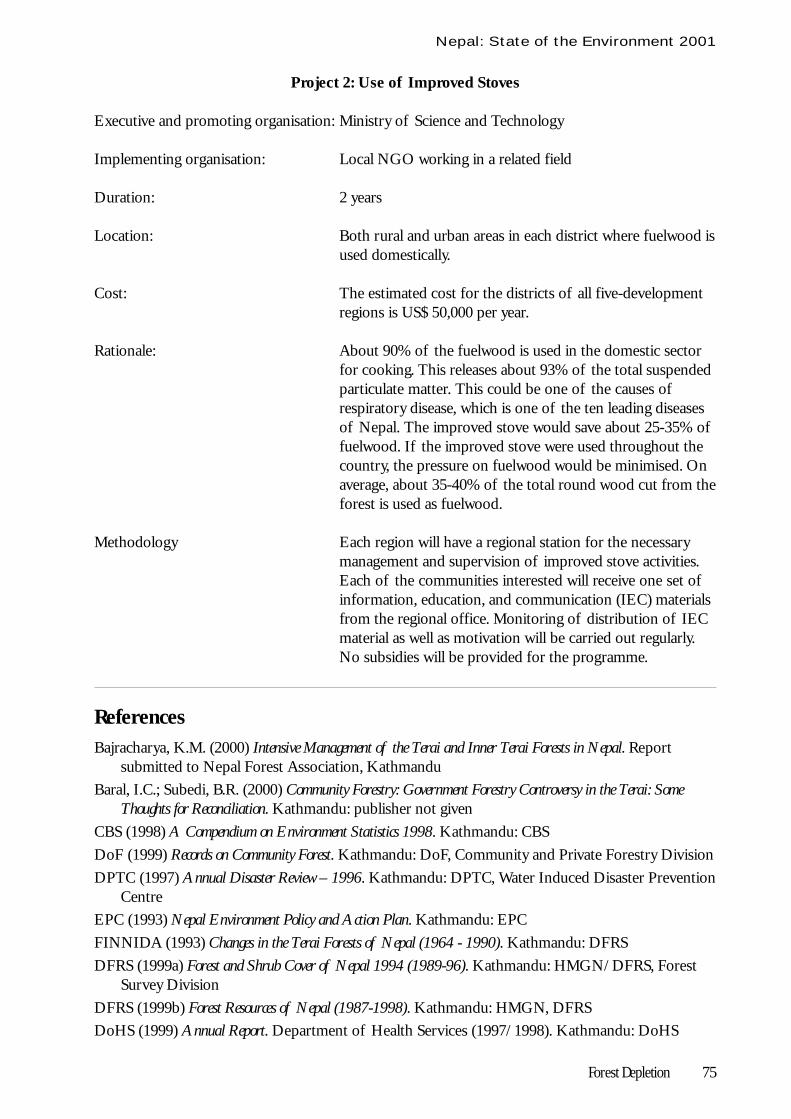
Project 2: Use of Improved Stoves
Executive and promoting organisation: Ministry of Science and Technology
Implementing organisation: Local NGO working in a related field
Duration: 2 years
Location: Both rural and urban areas in each district where fuelwood isused domestically.
Cost: The estimated cost for the districts of all five-developmentregions is US$ 50,000 per year.
Rationale: About 90% of the fuelwood is used in the domestic sectorfor cooking. This releases about 93% of the total suspendedparticulate matter. This could be one of the causes ofrespiratory disease, which is one of the ten leading diseasesof Nepal. The improved stove would save about 25-35% offuelwood. If the improved stove were used throughout thecountry, the pressure on fuelwood would be minimised. Onaverage, about 35-40% of the total round wood cut from theforest is used as fuelwood.
Methodology Each region will have a regional station for the necessarymanagement and supervision of improved stove activities.Each of the communities interested will receive one set ofinformation, education, and communication (IEC) materialsfrom the regional office. Monitoring of distribution of IECmaterial as well as motivation will be carried out regularly.No subsidies will be provided for the programme.
ReferencesBajracharya, K.M. (2000) Intensive Management of the Terai and Inner Terai Forests in Nepal. Report
submitted to Nepal Forest Association, KathmanduBaral, I.C.; Subedi, B.R. (2000) Community Forestry: Government Forestry Controversy in the Terai: Some
Thoughts for Reconciliation. Kathmandu: publisher not givenCBS (1998) A Compendium on Environment Statistics 1998. Kathmandu: CBSDoF (1999) Records on Community Forest. Kathmandu: DoF, Community and Private Forestry DivisionDPTC (1997) Annual Disaster Review – 1996. Kathmandu: DPTC, Water Induced Disaster Prevention
CentreEPC (1993) Nepal Environment Policy and Action Plan. Kathmandu: EPCFINNIDA (1993) Changes in the Terai Forests of Nepal (1964 - 1990). Kathmandu: DFRSDFRS (1999a) Forest and Shrub Cover of Nepal 1994 (1989-96). Kathmandu: HMGN/DFRS, Forest
Survey DivisionDFRS (1999b) Forest Resources of Nepal (1987-1998). Kathmandu: HMGN, DFRSDoHS (1999) Annual Report. Department of Health Services (1997/1998). Kathmandu: DoHS

76 SoE Report Nepal
Nepal: State of the Environment 2001
Gurung, H. (1989) Regional Patterns of Migration in Nepal. Papers of the East-West PopulationInstitute, No.113. Hawaii: E-W Institute
HMG (1997) The Community and Private Forestry Program in Nepal. Internal Report, DoF, Communityand Private Forestry Division
Kanel, K.R. (2000) Concept Paper to Manage the Forests of the Terai and the Churia Hills (Nepali text,Second Draft). Report submitted to Nepal Forest Association, Kathmandu
LRMP (1986) Land System Report. Kathmandu: HMGN/LRMPManushi (1996) Socio-Economic and Environmental Impact of the Presence of Bhutanese Refugees on the Local
Community in Eastern Nepal. Kathmandu: UNCHRMFSC (1988) Main Report: Master Plan for the Forestry Sector. Kathmandu: HMGN, MFSCMFSC (1996) Forestry Sector Policy (Draft). Kathmandu: HMGN, MFSCMoA (1999) Statistical Information on Nepalese Agriculture, 1998/99. Kathmandu: HMGN/MoA,
Agricultural Statistics DivisionMoHA (1999) Loss of Lives due to Flood and Landslides (unpublished). In the Records of the MoHA,
KathmanduMoF (1999) Economic Survey (FY 1998/99). Kathmandu: HMGN/MoFMoPE (1997) Combating Desertification. Kathmandu: HMGN/MoPEMoPE (1997) The Environment Protection Act 1996 and the Environment Protection Regulation 1977.
Kathmandu: HMGN/MoPEMPFS (1988) ‘Master Plan for Forestry Sector Nepal’. In Soil Conservation and Watershed Management
Plan. Kathmandu: HMGN/MFSCNDP (1999) ‘Nepal District Profile’. In Sharma, H.B.; Gautam, R.P. (eds) National Research Associates
Nepal (NRAN). Kathmandu: NRANPC (1974) Draft Report on Land Use and Erosion Control. Report of the Task Force. Kathmandu: NPCNPC/HMGN (1997) The Survey of the Government’s Ninth Plan (1997 - 2002). Kathmandu: NPCPerdo, R.D. (1993) ‘Back to the Future: Nepal’s New Forestry Legislation.’ In Journal of Forestry, JunePradhan, H.B. (2000) A Study on the Change in Forest Resources of the Koshi Hills in the Eastern Hill
Districts. Kathmandu: Nepal-UK Community Forestry ProjectPradhan, P. (1998) Development of a GIS Database System for Refugee Programs in Eastern Nepal: Status of
Environmental Conditions and Impacts Assessment. Bangkok: UNEP/GRIDRajbhandari, M.D. (1997) A Draft Programme Document on Forest Resource Information System. Report
submitted to FINNIDA, KathmanduRaut, Y. (1997/98) A Handbook of Animal Husbandry (Part I: Pasture Production). Kathmandu: MoA,
Department of Livestock ServicesSEAMCAP (2000) State of Environment Dataset Report: Strengthening Environment Assessment and
Monitoring Capabilities in Nepal (unpublished report). Kathmandu: UNEP EAP.AP/MoPE/ICIMOD
Shah, S.B. (1997) Analysis of Forestry Sector Policy and Legislation. Draft Report submitted to DoF,Kathmandu
Shrestha, T.B.; Joshi, R.M. (1996) Rare, Endemic and Endangered Plants of Nepal. Kathmandu: WWF -Nepal Programme
Tamrakar, R.M. (1996) A Comparative Study of Land Use Changes in the Upper Catchment Area ofSindhupalchok District between 1978 – 1992. Unpublished Consultancy Report to the NepalAustralia Community Forestry Project, Kathmandu
Uprety, B.K. (1997) Natural Biodiversity: Institutional Strengthening and Collection of Environmental Statisticsin Selected DMCs. Kathmandu: CBS

77Forest Depletion
Nepal: State of the Environment 2001
WECS (1996) Energy Synopsis Report, Nepal 1994/95. Kathmandu: MoWR, WECSWECS (1995) The Energy Resource Base of Nepal. WECS Report, No. 2/1/010595/5/11, No. 480.
Kathmandu: WECSWECS (1998) WECS Bulletin, 9(1)WECS (1999) WECS Bulletin, 10 (1 and 2)Zimsky, M. (1999) National Biodiversity Action Plan (Draft). Kathmandu: HMG, MFSC