nepal public expenditure tracking study on primary · pdf filenepal public expenditure...
TRANSCRIPT

Government of Nepal National Planning Commission
Singh Durbar
Kathmandu
NEPAL
April 2012
Nepal Public Expenditure Tracking Study
on
Primary Education

Published by:
Government of Nepal
National Planning Commission Singha Durbar Kathmandu, Nepal Tel: +977-1-4211629 Website: www.npc.gov.np

Nepal Public Expenditure Tracking Study
on
Primary Education
Government of Nepal
National Planning Commission
Singh Durbar
Kathmandu
NEPAL
April 2012

Published by:
Government of Nepal
National Planning Commission
Singha Durbar
Kathmandu, Nepal
Tel: +977-1-4211629
Website: www.npc.gov.np

I
FOREWORD
The Government of Nepal is committed to improving the situation of education in Nepal. Accordingly, the investment in the education sector has been significantly increasing over the decades, aiming at wider literacy level, better quality, physical facilities and a child friendly environment at schools and at the community level. Among others, the efforts have been mainstreamed to contribute to the impact level indicators, mainly the net enrolment rate, retention rate, drop-out rate, learning achievement and a child friendly environment. To improve results, the government has been allocating ample financial resources in various programs that are directly related to the targets/indicators.
The Nepal Public Expenditure Tracking Survey (PETS) report was prepared under the guidance and supervision of National Planning Commission – to track the expenditure made in primary education. The Report was completed in two months by collecting and compiling information from the national level, which was also validated from the information gathered from some districts and schools.
We would like to appreciate the guidance of Dr. Shiba Kumar Rai, Hon'ble Member and Member-Secretary of National Planning Commission to produce this Report. Similarly, we are happy to extend our thanks to Mr. Pushpa Lal Shakya, Joint-Secretary of National Planning Commission Secretariat (NPCS) and National Program Director (NPD) of Strengthening Planning and Monitoring Capacity of NPC (SPMC NPC) Project; Mr. Atma Ram Pandey, Joint-Secretary of NPCS; Mr. Rabi Shanker Sainju, Program Director of NPCS and National Project Coordinator of SPMC NPC Project; Mr. Sanjaya Khanal, Program Director, National Planning Commission Secretariat; and Mr. Hari Lamsal, Under-secretary, Ministry of Education and Mr. Krishna Dhungana, Department of Education for for their valuable suggestions and insights to the study report. Similarly, Mr. Kul Bahadur GC and Ms. Munaka Neupane, Planning Officers of NPCS deserve special thanks for accompanying and providing valuable inputs during field visits.
Special thanks go to Mr. Babu Ram Shrestha, Team Leader and Ms. Merina Ranjit, Research Associate for accomplishing the study. District Education Officers of Lalitpur, Dolakha, Kapitvastu and Salyan deserve sincere thanks for their cooperation in the process of conducting this study. Thanks are due to Head Teachers, Teachers, and Resource Persons of all the schools visited for their inputs in the course of the survey, without which this study would not have been possible.
We highly appreciate the technical support provided by UNDP to complete this study. Last but not least, we are thankful to Mr. Gyanendra Kumar Shrestha, National Project Manager for guiding the process to its final conclusion, and Dr. Hari Pradhan, then National Project Manager for his initial support.; Ms. Sujeeta Bajracharya, M&E Specialist for her technical inputs to the study; and the team including Mr. Saras Rana of SPMC NPC Project for their overall support in completing this study.
(Deependra Bahadur Kshetry) Vice-Chairperson National Planning Commission

II
ACRONYMS _______________________________________________________ ASIP Annual School Improvement Plan
CDO Chief District Officer
DDC District Development Committee
DEO District Education Office
DOE Department of Education
DTCO District Treasury Comptroller Office
DTO District Technical Office
ECD Early Childhood Development
EFA Education for All
FCGO Financial Comptroller General Office
GDP Gross Domestic Product
GPI Gender Parity Index
MDG Millennium Development Goal
MLD Ministry of Local Development
MOE Ministry of Education
MOF Ministry of Finance
NER Net Enrollment Rate
NPA National Plan of Action
NPC National Planning Commission
PCF Per Child Fund
PETS Public Expenditure Tracking Survey
PPCs Pre-Primary Classes
PRSP Poverty Reduction Strategy Paper.
SESP Secondary Education Support Program
SMC School Management Committee
SSRP School Sector Reform Plan
TYIP Three Year Interim Plan
VDC Village Development Committee

III
TABLE OF CONTENTS
Page
Acknowledgements ...................................................................................................................... i Executive Summary .................................................................................................................... ii Acronyms .................................................................................................................................... v Table of Contents ....................................................................................................................... vi List of Tables ............................................................................................................................ vii List of Figures ........................................................................................................................... iiii Chapter 1. INTRODUCTION ............................................................................................. 1-3
1.1 Introduction to the study.......................................................................................... 1 1.2 Policies and Strategies ............................................................................................. 1 1.3 Problems .................................................................................................................. 2 1.4 Objectives of the Study ........................................................................................... 3 1.5 Methodology ........................................................................................................... 3 1.6 Limitation of the Study............................................................................................ 4
Chapter 2. TOTAL EXPENDITURE TREND ON EDUCATION ... ................................ 5-8
2.1 Size and Growth Trend of the Government Budget ................................................ 5 2.2 Budgetary Spending Trend on Education visa –a`-visa Other Sectors ................... 5 2.3 Education Share in Total Government Spending vis-a`-vis Other sectors .............. 6 2.4 Government Expenditure Trend on Education vis-à-vis GDP ................................ 7 2.5 Household Expenditure on Education ..................................................................... 7
Chapter 3. TOTAL EXPENDITURE ON PRIMARY EDUCATION . ........................... 9-14
3.1 Primary Education: Definition ................................................................................ 9 3.2 Programs under Primary Education ........................................................................ 9 3.3 Expenditure Trend on Primary Education by Program ......................................... 10 3.4 Program-wise Financing Source for Primary Education ....................................... 12 3.5 Expenditure against Allocation Budget ................................................................. 13 3.6 Identification of Problem for Effective Public Spending ...................................... 14
Chapter 4. RESOURCE TRANSFER MECHANISM ................................................... 15-18
4.1 Flow of Authority to Spend Budget from MOF to MOE ...................................... 15 4.2 Fund Flow Mechanism .......................................................................................... 15 4.3 Budget Release Procedure ..................................................................................... 16 4.4 Gaps and Short Coming in Fund Flow Delivery ................................................... 18
Chapter 5. FINDINGS ...................................................................................................... 19-25
5.1 Findings from Desk Review at National Level ..................................................... 19 5.2 Findings from Field Study ..................................................................................... 19
Chapter 6. CONCLUSION AND RECOMMENDATIONS .......................................... 26-28
REFERENCE .......................................................................................................................... 29 APPENDIX-1: PROGRAM WISE BUDGET IN PRIMARY EDUCATION ......................... 30 APPENDIX-2: PROGRAM WISE EXPENDITURE IN PRIMARY EDUCATION .............. 31 APPENDIX-3: SAMPLED DISTRICT EDUCATION OFFICE FINANACIAL DATA ....... 32 APPENDIX-4: SAMPLED SCHOOL’S FINANACIAL DATA ............................................. 39 APPENDIX-5: QUESTIONNAIRE SAMPLE ........................................................................ 52

IV
List of Tables
Table 1.1: Status and targets of selected EFA performance indicators
Table 2.1: Ratio of government expenditure and revenue to GDP
Table 2.2: Annual growth of government expenditure (recurrent and capital) by sector and sub-sector (%)
Table 2.3: Total government expenditure by sector
Table 2.4: Government expenditure on education as a percent of GDP
Table 2.5: Household consumption and its distribution by expenditure category (%)
Table 3.1: List of program related to primary education
Table 3.2: Government expenditure on education as a percent of GDP
Table 3.3: Program-wise expenditure on primary education (2005/06-2009/10)
Table 3.4: Five year total expenditure on primary education (2005/06-2009/10)
Table 3.5: Five year total expenditure against budgeted amount (2005/06-2009/10)
Table 4.1: Stages in budget planning and execution cycles for chapter
Table 4.2: DEO fund transfer process to school
Table 5.1: Total expenditure on primary education at district level
Table 5.2: Status of fund utilization (%) made in the sample districts
Table 5.3: Internal efficiency of different grades at sampled schools
List of Figures
Figure 2.1: Education share in total government expenditure in compare to other sector
Figure 3.1: Share of primary education in total education expenditure

V
EXECUTIVE SUMMARY The objective of this study was to conduct a public expenditure review on the education sector, especially primary education to show the level of integration of education related expenditures into the national budget in order to provide a future trend analysis for budget allocation and execution. During this process, the study also had to identify the different steps in the transfer of public funds, the leakages and the eventual deviation in the use of funds along with their impact on planned objectives. The study covered public expenditures for the education sector, especially at the primary level on an annual basis for a selected period - for the last five year period (2005/06-2009/10). For this period, education expenditures incurred by the Ministry of Education were reviewed including donor projects. The study collected data at several levels, from the central government's financial data and other data to DEO and frontline providers (schools and teachers to track where funds are being absorbed and perhaps where they are going astray). Trends and issues were analyzed in line with five major standards of PEP themes that include (a) policy on programming and budgeting, (b) public expenditure trends, (c) public expenditure composition and alignment, (d) effectiveness and efficiency of public spending, (e) poverty targeting of expenditure, and (f) public expenditure management.
Findings of the Study National Level
1. Despite poor macro-economic performance and low economic growth, expenditure on education continued to rise during the study period. Spending on education equaled 18 percent in total expenditure and about 4 percent of GDP in 2009/10. Per capita expenditure on education also increased significantly during this period.
2. Larger proportion of total education expenditure seems to have gone to primary education programs and activities. The percentage share of primary education in the total education expenditure accounted for 63 percent in 2009/10. In relation to GDP, the percentage share of expenditure on primary education is found to be increasing, except in 2006/07.
3. A number of bilateral and multilateral agencies are involved in supporting the primary education. As a percent of the total government expenditure, external assistance accounted for 31 percent during the review period.
4. Fund utilization is found to be quite high. However, it does not tell us whether that money is fully utilized efficiently and effectively. When analyzed in terms of internal efficiency, it demonstrated high wastage of resources.
5. A tendency to spend almost the entire allocated budget at the last moment has been found in the education sector also by issuing authority letter to spend to DEO. The study team in one of its study areas found that the Lalitpur DEO received the authority letter to spend on physical facility improvement on Asadh 28 – just 2-3 days before the closing date of the fiscal year 2009/10.

VI
District Level
1. About 90 percent of the district level education expenditure in the sampled districts was for primary education and related activities comprising education for all, and the school sector reform program.
2. Fund utilization was found to be quite high in almost all the sample districts similar to the national level. However, audit reports have pointed out most of the spending made by DEOs as un-audited (irregular). Among four districts, Beruju was the highest for Lalitpur with NRs. 380 million.
3. Supervision of schools by resource persons and school inspectors was found to be very weak. Formal written reporting by the resource person is hardly done. Most of the reporting is done verbally during their regular meetings.
4. DEO provides Teachers Professional Development (TPD) training to enhance the quality of the teachers, but the teachers, particularly the permanent ones were found out to be least interested in the training.
5. Resource Center decides on the payment rate for the auditors. DEO provides only NRs. 1000/- as a token amount to encourage auditing at the primary school level.
School Level
1. Government funds remain the major source of all the schools in the sample districts receiving lump-sum amount. It is understood that the resource persons help the schools in allocating the lump-sum amount through programs.
2. Category-wise expenditure of each sampled school showed the major share going to salary payment, and less to other important activities like scholarship, curriculum and physical facility improvement program and nutrition programs.
3. Most of the time, schools receive more scholarship funds and curriculum funds than the actual number of students registered during the academic session. There is no such system to return such excess amounts to the government and hence schools have the luxury to distribute scholarships to all students, and also to fulfill their self-interest.
6. It is learnt, that the construction of physical facility improvement of schools is done not through a bidding process but through mutual consent. Irregularities of expenditure were pointed out in the school audits, but the study team did not have access to the reports.
7. Teachers get their salary on a trimester basis and not on a monthly basis. Given the situation, it would not be surprising to find why the quality of teaching in the schools did not improve in-spite of huge investment in teachers training by the government.
8. School Management Committee (SMC), are supposed to work for the overall school management, but they were found to be creating hurdles in many cases, such as in the recruitment of teachers in time and in some cases even hindering the regular salary payment of the teachers.
9. Teachers were also found victimized by unfair evaluations which have affected their motivation and also their promotion, leading to deterioration in the quality of teaching.

VII
Recommendations
1. Efforts should be made to gather disaggregated primary education expenditure from those which are being implemented under various education programs, and also from other ministries other than MOE, so as to give an overall picture on primary education as a whole.
2. Presently most of the primary education programs are merged either with the education for all program or with SSRP, and hence needs to be disaggregated for analyzing the activity-wise expenditure trend in the light of the respective plans and programs of the education goal.
3. Process of submitting the annual plan and program from DEOs should be quickened so that they can be approved in time.
4. Salary payment of the teachers should be made on a monthly basis rather than on a trimester basis. This will at least help prevent unnecessary financial burden to teachers as well as schools.
5. Teachers should not be victimized by unfair evaluation which has affected their motivation and also their promotion. Proper evaluation of teachers should be done to encourage them to improve their teaching skills in the class rooms, which is necessary for quality improvement of the education system.
6. Supervision and monitoring systems of the schools should be improved and strengthened with the provision of attractive incentive allowances so that the RP and school inspector in their jurisdiction visit the schools more frequently, and see whether the fund provided for any of the programs related to accessibility, equity and quality improvement program are being properly done, and report it back to the DEOs for action.
7. The school audit in its report should be reviewed by DEO and necessary actions must be taken when any irregularities are seen in the school funds.
8. The funds provided by the government for financial audit of NRs. 1000 only per school is not sufficient, in turn schools have to arrange the additional sum to conduct financial audits.

PUBLIC EXPENDITURE TRACKING STUDY ON PRIMARY EDUCATION IN NEPAL
1

PUBLIC EXPENDITURE TRACKING STUDY ON PRIMARY EDUCATION IN NEPAL
2
Chapter 1
INTRODUCTION
1.1 Introduction to the Study
The objective of the study was to conduct a public expenditure review on the education sector, especially primary education to show the level of integration of education related expenditures into the national budget, and provide future trend analysis for budget allocation and execution. The study covered public expenditures for the education sector, especially at the primary level on an annual basis for a selected period - the last five year period (2005/06-2009/10). For this period, education expenditures incurred by the Ministry of Education were reviewed including donor projects. The study collected data at several levels, from the central government's financial data and other data to DEO and frontline providers (schools and teachers to track where funds are being absorbed and perhaps where they are going astray). Trends and issues were analyzed in line with five major standards of PEP themes that include (a) policy on programming and budgeting, (b) public expenditure trends, (c) public expenditure composition and alignment, (d) effectiveness and efficiency of public spending, (e) poverty targeting of expenditure, and (f) public expenditure management.
1.2 Policies and Strategies
The government’s education sector program aligns closely with the national development agenda. It recognizes providing access to quality basic education to all children with a long-term strategy, and has highlighted the importance of education in combating poverty in the Poverty Reduction Strategy Paper (PRSP). In order to pursue this strategy, the Government of Nepal has adopted the ‘achievement of universal primary education’ by the year 2015 as one of the Millennium Development Goals (MDG). This commitment has been recognized by a number of development partners who have joined the Government in the formulation and implementation of on-going plans and programs such as the National Plan of Action (NPA), Education for All (EFA) and the Secondary Education Support Program (SESP). EFA, NPA (2001–2015) is the overarching plan of the Government for the development of the education sector. It is designed to support, and assist in realizing, the Government’s poverty reduction objectives, through the development of the necessary human resources and related social and physical infra-structure as a long-term strategy. The Plan outlines a framework according to the six major goals set by Dakar Framework of Action for the year 2015. Following the restoration of popular democracy in 2006, Nepal promulgated a new Interim Constitution early in 2007. The Interim Constitution of Nepal has stipulated school education as a fundamental right for all and has put an emphasis on ensuring access to quality basic education for all citizens. The Three Year Interim Plan (TYIP) has focused on free and quality primary education irrespective of caste, gender, ethnic groups and geographical differences. In line with the thrusts of the constitution of Nepal and the TYIP, the School Sector Reform Plan (SSRP) 2009-2015 has been developed with focused interventions for underserved groups and communities. The focused inventions, among others include increasing children’s access to school, improving the quality of education and increasing management efficiency through decentralized educational management. In pursuit of these goals, government has implemented a number of programs to achieve primary education for all, targeting for example a ninety per cent survival rate up to grade 5, and literacy GPI of 1.0 by 2015. Various incentives such as scholarships for girls, disadvantaged children and children with disabilities, free midday meals and distribution of free textbooks have been implemented to improve access to and quality of primary education. Likewise, per-capita

PUBLIC EXPENDITURE TRACKING STUDY ON PRIMARY EDUCATION IN NEPAL
3
financing and formula based funding to schools has been implemented to improve the learning environment including physical infrastructure development, and expansion and strengthening of early childhood development. The government has also implemented policies to mainstream religious educational institutions such as Gumba, Gurukul and Madarsha education. Government policy has also focused on increasing the recruitment of teachers from underrepresented sections such as women, Dalit and Adivasi Janajati groups and people with disability. Additionally, a policy provision of recruiting at least one female teacher in each primary school has been made and implemented. Moreover, to make educational management more inclusive, policies on positive discrimination and reservation are also in place. Furthermore, the responsibilities for school management have also been transferred to locally elected SMCs so as to enhance the role of local communities and parents in school management. All these factors led to considerable improvement of the expansion in the number of primary schools along with a rise in the net enrollment rate (NER). Evidence also shows that accessibility to primary schools has improved and at the same time the gender gap is gradually narrowing down.
Table: 1.1 Status and targets of selected EFA performance indicators
SN Indicators Achievement Target
2003 2004 2005 2006 2007 2008 2009 2015
1 Gross Enrolment Rate of Early Childhood/Pre School
19.9 39.4 47 41.4 60 63 66 99
2 Percentage of New entrants at Grade 1 with ECD
13.7 10.9 NA 40 33 36 50 80
3 Gross Intake Rate at Grade 1 117.1 125.9 148.1 148 14.5 14.8 14.4 123 4 Net Intake Rate at Grade 1 76.1 - NA 86 82 83 86 100 5 GER (Primary) 126.7 130.7 145.4 138.8 - - - 105 6 NER (Primary) 83.5 84.2 86.8 87.4 89 93 94 100 7 Repetition Rate - - 18.4 16 - - - 10
7.1 Repetition Rate Grade 1 34 NA 30.4 29.8 29 28 27 10 Source: ASIP 2010
1.3 Problems
The problems of access, quality, equity, education management and relevance and the issue of educational programs to economic aspirations and the development agenda still confront educational development at all levels in the country. The MDG report (2006) highlights the fact that the goal of universal primary education appears to be out of reach by 2015. More than 218,000 primary-school-aged children (6.3 per cent) are still out of school (DOE 2009). Many schools, especially those in less well-off areas, do not have adequate basic facilities, and are poorly equipped. Many students, especially those in less well-off areas, do not have good access to primary schools with a complete cycle of grades. The lack of student textbooks is a big concern throughout the country. Teachers are not skilled enough or trained to deliver quality service. In essence, a learning space (class rooms) meeting basic minimum quality standards, learning facilitators (such as a teacher) possessing basic minimum qualifications, and learning facilitating materials and equipment meeting minimum quality standards are not well addressed that has affected the aspects of access, quality and equity. Of course, budget allocation made in the sector is inadequate, but the most important factor affecting aspects of access, quality and equity has been the ineffectiveness in the implementation of the given budget. It is understood that funds allocated at the national level for education and distributed to schools – either to schools directly or to schools through the district and /or local levels do not reach the school level timely. The goal of this study is to generate new updated knowledge on how resources flow through the administrative and budgetary system, what the magnitude of resources are, and how those resources combined with other inputs at the facility level can be used to generate education outcome. The results of the survey will contribute to the

PUBLIC EXPENDITURE TRACKING STUDY ON PRIMARY EDUCATION IN NEPAL
4
government understanding of resources flows, as well as to the relationship between resources and outcomes in the education sector.
1.4 Objectives of the Study
The overall objective of the study is to conduct PETS on the primary education sector that shows the level of integration of education related expenditures into the national budget, and provide future trend analysis for budget allocation and education.
Supplementary objectives of the Study are:
• to identify the different steps in the transfer process of public funds at the central and decentralized local levels against the policies; and to evaluate operations, leakages and eventual deviations in the use of public funds, and their impact on the realization of planned objectives;
• to analyze the degree of respect of procedures, management of public expenditure, existing support documentation including accounting records; and to provide an opinion on the reporting and feedback mechanisms; and
• to appraise the use rate of public funds and derive the main causes with a view to formulating means for improving the usage rate.
1.5 Methodology
Following methods were used in preparing the report. This includes primary source of Data Collection, and Secondary Data Sources. The primary source were -
• Interviews with centrally-located officials of National Planning Commission (NPC), Ministry of Education (MOE), Department of Education (DOE), Financial Comptroller General Office (FCGO).
• Findings from discussions and observations in the four districts. For this, a survey questionnaire was developed and gathered information from officials of DEO, Head teacher, teachers, students, guardians/parents and School Management Committee.

PUBLIC EXPENDITURE TRACKING STUDY ON PRIMARY EDUCATION IN NEPAL
5
Secondary data sources - This included the desk review of published reports such as Three Year Interim Plan (2007/08-2009/10), NPC Annual Program, Volume I and II, MOF Red Book, MOF Estimates of Income and Expenditure, Nepal MDG Progress Report 2010, Nepal MDG Needs Assessment 2010, Joint Evaluation of Nepal´s Education for All 2004-2009 Sector Program, Evaluation Report 1/2009, annual DoE Status Reports, the list is revealed in the Appendix.
1.6 Limitation of the Study
• District level findings of the study were based on only 10 schools, four District Education Offices (DEOs), and some stakeholders; therefore, it is not nationally representative. It however, gives us some indications to understand how public expenditure in primary education is being used, and what factors lead to the effectiveness of the expenditure.
• Primary financial data from DEO and schools of all the five years i.e. 2063/64 to 2067/68 were not consistent. There are some data gaps in some of the DEOs and schools, like missing data for some fiscal years, where the team has filled the gap by taking an average.
• The study is for expenditure tracking survey so the team has not conducted any evaluation of interventions in the primary education sector.
PUBLIC EXPENDITURE TRACKING STUDY ON PRIMARY EDUCATION IN NEPAL
6
Chapter 2
TOTAL EXPENDITURE TREND ON EDUCATION
2.1 Size and Growth Trend of the Government Budget
The macro economic performance has a significant contribution to determine the expenditure on education and outcome. Higher economic growth rate broadens the revenue space of the government that leads to scale up the education budget also. Unfortunately, economic growth in Nepal shows an erratic trend. The Gross Domestic Product (GDP) which grew by 6.1 percent in 2007-08, declined to 4.4 percent in 2008-09. The economic growth is estimated to remain at 3.5 percent in 2010-11 in comparison to 4.6 in 2009-10.
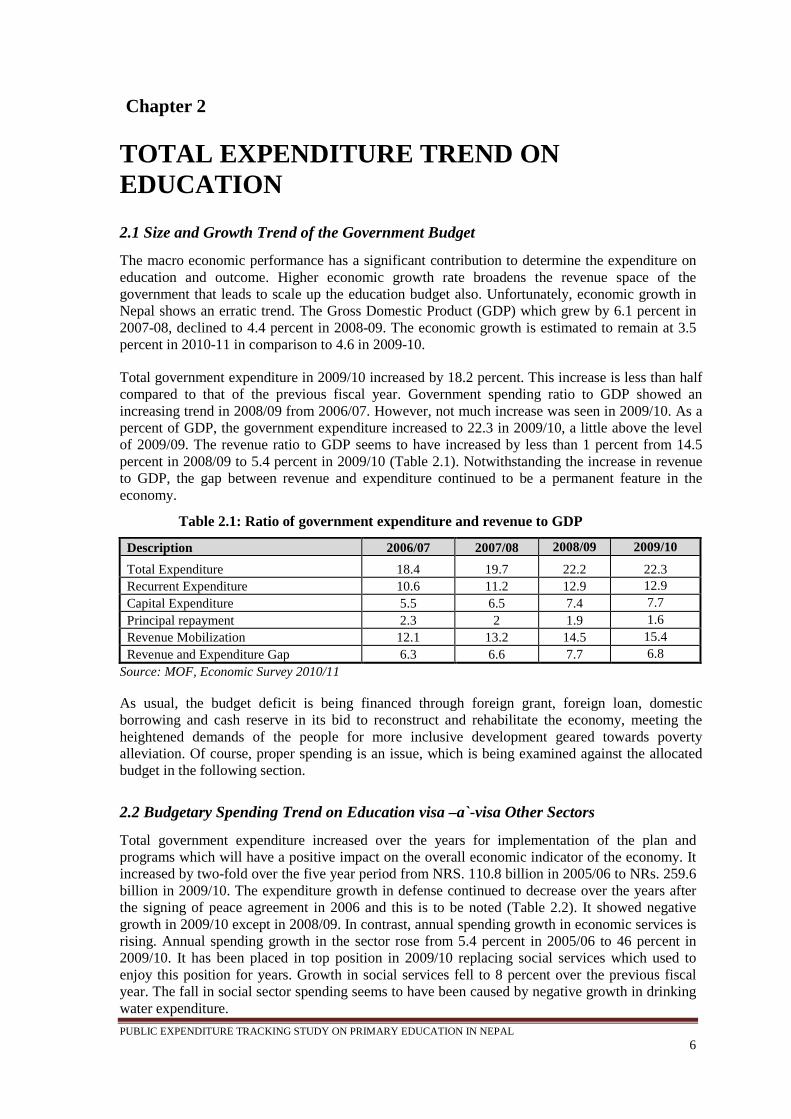
Total government expenditure in 2009/10 increased by 18.2 percent. This increase is less than half compared to that of the previous fiscal year. Government spending ratio to GDP showed an increasing trend in 2008/09 from 2006/07. However, not much increase was seen in 2009/10. As a percent of GDP, the government expenditure increased to 22.3 in 2009/10, a little above the level of 2009/09. The revenue ratio to GDP seems to have increased by less than 1 percent from 14.5 percent in 2008/09 to 5.4 percent in 2009/10 (Table 2.1). Notwithstanding the increase in revenue to GDP, the gap between revenue and expenditure continued to be a permanent feature in the economy.
Table 2.1: Ratio of government expenditure and revenue to GDP
Description 2006/07 2007/08 2008/09 2009/10
Total Expenditure 18.4 19.7 22.2 22.3 Recurrent Expenditure 10.6 11.2 12.9 12.9 Capital Expenditure 5.5 6.5 7.4 7.7 Principal repayment 2.3 2 1.9 1.6 Revenue Mobilization 12.1 13.2 14.5 15.4 Revenue and Expenditure Gap 6.3 6.6 7.7 6.8
Source: MOF, Economic Survey 2010/11 As usual, the budget deficit is being financed through foreign grant, foreign loan, domestic borrowing and cash reserve in its bid to reconstruct and rehabilitate the economy, meeting the heightened demands of the people for more inclusive development geared towards poverty alleviation. Of course, proper spending is an issue, which is being examined against the allocated budget in the following section.
2.2 Budgetary Spending Trend on Education visa –a`-visa Other Sectors
Total government expenditure increased over the years for implementation of the plan and programs which will have a positive impact on the overall economic indicator of the economy. It increased by two-fold over the five year period from NRS. 110.8 billion in 2005/06 to NRs. 259.6 billion in 2009/10. The expenditure growth in defense continued to decrease over the years after the signing of peace agreement in 2006 and this is to be noted (Table 2.2). It showed negative growth in 2009/10 except in 2008/09. In contrast, annual spending growth in economic services is rising. Annual spending growth in the sector rose from 5.4 percent in 2005/06 to 46 percent in 2009/10. It has been placed in top position in 2009/10 replacing social services which used to enjoy this position for years. Growth in social services fell to 8 percent over the previous fiscal year. The fall in social sector spending seems to have been caused by negative growth in drinking water expenditure.

PUBLIC EXPENDITURE TRACKING STUDY ON PRIMARY EDUCATION IN NEPAL
7
Notwithstanding the fall in social sector expenditure, the annual growth trend of expenditure on education is not discouraging. It has been found on the rise and has remained linear over the years. Total government expenditure on education has recorded an increase over the years from NRs. 19.2 billion in 2005/06 to NRs. 46.3 billion in 2009/10 - more than doubled from 12 percent to 31 percent during this period. Table 2.2: Annual growth of government expenditure (recurrent and capital) by sector and
sub-sector (%) Heading 2005/06 2006/07 2007/08 2008/09 2009/10 General Administration 32.9 49.2 (40) 29.32 3.00 Police 10.3 17.3 33 14.51 22.24 Defense 2.9 -1.6 2 29.54 (15.30) Social Services 14.1 26.7 35 60.27 8.20 a) Education 12.3 11.6 26 31.20 31.38 b) Health 23.9 27.7 32 30.22 34.35 c) Drinking Water 37.5 54.6 16 51.33 (9.50) d)Local Development 7.3 53.8 2 107.77 22.73 Economic Services 5.4 17.9 45 16.08 46.04 Loan Payment 3.4 12.2 (6) 18.57 5.28 Miscellaneous -3.5 34.9 (84) 63.79 (34.90) Total Expenditure 8.1 20.5 21 36.14 18.20
Source: MOF (Red Books) and Economic Survey, GoN
2.3 Education Share in Total Government Spending vis-a`-vis Other Sectors
The Three Year Interim Plan (2007/08 – 2009/10) has emphasized social development, in which one of the key sectors was education - to develop human resources and raise the living standard of the people. Prior to this the 20/20 initiative adopted by the government as per the World Summit for social development in 1995 also requires the government to use 20 percent of its budget for basic social services, which among others includes education too. Increasing trend in social sector expenditure has been noticed over the years (Figure 2.1). The sector used to occupy first place in total government expenditure till 2008/09, it slipped down to second position after economic services in 2009/10. Social sector spending accounted for 38 percent of the total government expenditure in 2009/10 with increase in expenditure for education, health, drinking water and local development. Among these sectors, education receives the largest share currently (2009/10) spending at around 18 percent of the total government expenditure. Table 2.3 below present’s sector and sub-sector wise expenditure trend in total government expenditure.
Table 2.3: Total government expenditure by sector
Heading 2005/06 2006/07 2007/08 2008/09 2009/10 General Administration 9.4 5.3 2.6 2.5 2.2 Police 7.4 7.0 7.7 6.5 6.7 Defense 10.2 8.2 6.9 6.6 4.7 Social Services 32 31.5 35.3 41.6 38.1 a) Education 17.4 16.0 16.7 16.1 17.9 b) Health 5.2 5.8 6.4 6.1 6.9 c) Drinking Water 2.1 3.0 2.9 3.2 2.5 d) Local Development 5.6 6.7 5.6 8.6 8.9 Economic Services 20.1 20.1 24.0 20.5 25.3 Loan Payment 18.4 17.2 14.1 12.3 10.9 Miscellaneous 5.4 51.5 6.8 8.2 4.5
Source: FCGO, and Central Bureau of Statistics

PUBLIC EXPENDITURE TRACKING STUDY ON PRIMARY EDUCATION IN NEPAL
8
Figure 2.1
2.4 Government Expenditure Trend on Education vis-à-vis GDP
The public expenditure pattern in the last one and half decades show Nepal giving increasing priority to the education sector, especially to basic and primary education (MDG Needs Assessment for Nepal: 2005). It is commensurate with the rise in the percentage share in GDP also. Education expenditure as a percent of GDP is now about 4 percent compared to 3 percent in 2005/06 (Table 2.4). Per capita expenditure on education also increased significantly during the period under review. It increased by more than double during this period from NRs 742 in 2005/06 to NRs 1,654 in 2009/10.
Table 2.4: Government expenditure on education as a percent of GDP
Year Population (in million)
GDP at current price (in million
NRs.)
Educational Expenditure (in million
NRs.)
Educational Expenditure as % of GDP
Per capita expenditure on education
(NRs.) 2005/06 25.9 654,084 19,211 2.94 742.12 2006/07 26.4 727,827 21,388 2.94 809.31 2007/08 27.0 815,658 26,914 3.30 998.05 2008/09 27.5 988,053 35,313 3.57 1,283.91 2009/10 28.0 1,171,905 46,394 3.96 1,654.34
2.5 Household Expenditure on Education
Despite the rise in per capita expenditure on education, it has not benefited the low income group. The Nepal Living Standard Survey 2010/11 (CBS, 2011) found that households spent an average of 61.5 percent of their budget on food with the poorest wealth quintile spending 71.6 percent and the richest wealth quintile spending 45.8 percent (Table 2.5). This indicates that rises in food prices affect the poor most severely. Furthermore, rises in food prices force the poor to spend less in education in comparison to other sectors.

PUBLIC EXPENDITURE TRACKING STUDY ON PRIMARY EDUCATION IN NEPAL
9
Table 2.5: Household consumption and its distribution by expenditure category (%)
Consumption Quintile
Consumption (NRs. million)
Food Housing/
Rent Education
Other non-food items
Poorest 81,714 71.6 7.2 3.4 17.8 Second 108,152 70.2 7.4 3.9 18.6 Third 131,337 66.6 8.2 4.6 20.6 Fourth 161,503 61.3 10.6 5.7 22.4 Richest 304,616 45.8 18.1 7.6 28.5 Nepal 170,735 61.5 11.0 5.3 22.2
Source: Central Bureau of Statistics, Nepal Living Standards Survey 2003/04 Although the demand for education in Nepal seems to be growing after the declaration of free education as per the Interim Constitution, it is still found to be relatively low. This is partly because many poor parents cannot afford the cost of learning materials, stationery, school uniform and transportation for their children in addition to the cost of meeting their essential needs of food and shelter. The opportunity cost of educating children may be too high to bear, and poor parents may prefer that their children work to supplement family incomes and do household chores instead of going to school. Schooling, therefore, even when it is free becomes unaffordable for some poor families with competing economic interests (Annual Strategic Implementation Plan, 2007-08). This clearly explains the fact why a large number of children are still out of school despite the government’s declared ‘free education’ policy.

PUBLIC EXPENDITURE TRACKING STUDY ON PRIMARY EDUCATION IN NEPAL
10
Chapter 3
TOTAL EXPENDITURE ON PRIMARY EDUCATION
3.1 Primary Education: Definition
The school system in Nepal consists of primary, lower secondary, secondary and higher secondary education. Primary schools offer five years of education in Nepal starting from grade one. Lower secondary schools also offer classes at the primary level, and so are grouped with the secondary schools. In addition, Early Childhood Development (ECD) and pre-primary classes (PPCs) are offered as preparation for grade one. The prescribed age groups for these levels are 3-4 years for ECD/PPC, and 5-9 years for the primary education program. Primary education has been recognized as one of the basic components of the education system. MOE is supposed to be the lead agency to enable access of primary education for ensuring educational rights to children, free of cost. In support of it, the government has implemented various programs, which among others include programs for out-of-school children also.
3.2 Programs under Primary Education
There are many agencies involved in the implementation of the primary education related activities apart from the Ministry of education (MOE). For example, the community owned primary education project, being implemented through the Ministry of local development, ethnic caste upliftment, education activities carried out under block grant given by the center to the local activities are some of the examples. Within the education sector, there are many such examples in which the primary education components are integrated into single programs, which need to be separated. Likewise, lower secondary and secondary education has components of primary education, but how much budget is allocated and expended for this component is unknown. Janak Teaching Material Centre is another example, which is responsible for publishing and distributing the school textbooks, which among others include textbooks for primary education, but how much is allocated and spent on primary textbooks alone is unknown. To date, the amount spent in the activities mentioned under reference remains outside primary education, and hence this expenditure requires tracking down. A detailed list of such programs have been included and discussed separately in the Analysis of Basic Social services in Nepal 2010 published from NPC. Reviewing the above mentioned document and the annual plan and programs published by National Planning Commission, the following programs have been identified as falling under the primary education related activities for this study. In discussion with the officials at the Ministry of Education, the study team got the impression that it would be very difficult to capture the expenditure of other ministries made in education which is categorized as indirectly related. Within the MOE also, it would be difficult to disaggregate the expenditure figure from other programs like lower and secondary education. Hence the study team focused only on those programs that clearly reflect spending in primary education in the red book under the MOE heading. For this analysis only the programs categorized as directly related in the Table 3.1 program were considered.
Table 3.1: List of program related to primary education

PUBLIC EXPENDITURE TRACKING STUDY ON PRIMARY EDUCATION IN NEPAL
11
S.N Primary Education Related 1 Education for All - Primary Education Directly 2 Education for All - Primary Education Directly 3 School Sector Reform Program – SSR Directly 4 Non Formal Education Centre Directly 5 Special Education Council Directly 6 School Handover and Incentive Program Directly 7 Physical Facilities Improvement Project Directly 8 Education for All - Child Development Program Directly 9 Education for All Program Directly 10 Teachers Training Project Directly 11 Integrated School Education Structure Directly 12 Community School Capacity Improvement Program Directly 13 Conflict Affected Family Education Program Directly 14 Non-formal Ed. & National Literacy Campaign Directly 15 Food for Ed. - Primary School Nutrition Program Directly 16 Population Education Indirectly 17 District Education Office Indirectly 18 Teacher Pension Facility Indirectly 19 Fellowship For Exploited, Dalit And Children Of Martyrs
Including Fund for Girls Education Indirectly
20 Curriculum Development Centre Indirectly 21 School Teacher's Record Office Indirectly 22 National Educational Manpower Development Centre Indirectly 23 School Sector Reform Program –SSR Indirectly 24 Monitoring and Evaluation Program Indirectly
3.3 Expenditure Trend on Primary Education by Program
The Government policy has been to spend a larger proportion of education expenditure in primary education, but the evidence shows that the trend has been fluctuating over the years. In 2005/06, the percentage share of primary education in total education expenditure was 60 percent, which rose to 63 percent in 2009/10 (Figure 3.1). However, it remained below 60 percent in between these two periods (2005/6 and 2009/10) with 58 percent in 2006/07, 57 percent in 2007/08 and only 44 percent in 2008/09. In relation to GDP, the percentage share of expenditure on primary education is found to be increasing, except in 2006/07 (Table 3.2).
Table 3.2: Government expenditure on education as a percent of GDP
Year GDP at current price (in million
NRs.)
Primary education expenditure (in million NRs.)
Primary education
expenditure as % of GDP
Per capita expenditure on
education (NRs.)
2005/06 654,084 11440 1.75 742.12 2006/07 727,827 12,362 1.70 809.31 2007/08 815,658 15,424 1.90 998.05 2008/09 988,053 21,547 2.17 1,283.91 2009/10 1,171,905 29161 2.49 1,654.34

PUBLIC EXPENDITURE TRACKING STUDY ON PRIMARY EDUCATION IN NEPAL
12
Figure 3.1
In spite of this fluctuating trend in the share of the primary education to total education expenditure, the growth trend of expenditure on primary education shows to be increasing year by year. Table 3.3 below shows total expenditure on primary education in the five year period (2005/06-2009/10) grew by more than two-fold from NRs 11,440 million in 2005/06 to NRs. 29,161 million in 2009/10. This increase has been noticed largely in the primary education program, education for all, non-formal education and literacy programs and in the special education council. Also, the implementation of school sector reform program (SSRP) beginning from 2009 led to a significant rise in primary education during this period. This is to be noted that the SSRP includes basic education (consisting of grade 1-8) and secondary education (consisting of grade 9-12), but how much of the fund has been utilized for the primary level (grade 1-5) alone could not be known as they were not given in the red book.
Early childhood development program (ECDP) demands more resources to increase the number of ECD centers to improve the internal efficiency of primary and secondary education in addition to ensuring access for the most vulnerable and marginalized children. In conformity with this, increasing expenditure on ECD is seen throughout the review period except in 2008/09. Why a reduced expenditure on ECD is seen in 2008/09 is unknown, but it might have affected the expansion of ECD program during this period. Likewise, no expenditure in 2009/10 seems to have been made on physical facilities improvement program and on teacher training projects, despite their role in improving the quality of education. The primary school nutrition program has its own role to increase the enrollment rate and to decrease the dropout rate through the distribution of lunch and edible oil to the targeted deprived community, and this program has been running for several years. In recognition of its importance, the government had launched this program in the Karnali zone separately in 2006/07, and the expenditure was made accordingly in the corresponding period, but no expenditure was reported after 2006/07. It is now understood that this program is being implemented under basic education, but no disaggregated figure is available in this respect. Hence, the study team had no access to expenditure information on day meal programs that made it difficult to assess how it has been effective to raise the participation of the students in school enrollment particularly from the vulnerable children's' section including girls, Dalits, and so on. It has been reported that the physical facility improvement program, the child development program and the teacher training program has also been merged under SSR program, in 2009/10, but the study team had no access to expenditure information.

PUBLIC EXPENDITURE TRACKING STUDY ON PRIMARY EDUCATION IN NEPAL
13
Table 3.3: Program-wise expenditure on primary education - 2005/06-2009/10 (NRs. in Million)
S.N Programs 2005/06 2006/07 2007/08 2008/09 2009/10 1 Education for All - Primary Education 6944.2 7,619 9,410 12,060 16244.1 2 School Sector Reform Program – SSR 0 0 0 0 10416.1 3 Non Formal Education Center 4.4 5 5 6 6.5 4 Special Education Council 30.2 33 39 46 53.3 5 School Handover and Incentive Program 87.7 73 55 8 0.0 6 Physical Facilities Improvement Project 470.8 1 1 48 0.0 7 Education for All - Child Development Program 4.3 8 9 4 26.9 8 Education for All Program 2872 3,477 5,059 7,550 1013.8 9 Teachers Training Project 267.8 289 238 262 0.0 10 Integrated School Education Structure 0 3 26 27 48.3 11 Community School Capacity Improvement
Program 0 0 2 105 111.4 12 Conflict Affected Family Education Program 0 0 0 50 60.0 13 NFE & National Literacy Campaign 118.2 111 135 983 796.3 14 Food for Education - Primary School Nutrition
Program 640.7 725 445 397 384.4 15 Food For Education, Karnali Zone 0 16 0 0 0
Total 11440 12,362 15,424 21,547 29161.1 Source: Red Book, various years. The detailed budget and expenditure of the primary education program by year and by source is mentioned in Appendix 1 and 2.
3.4 Program-wise Financing Source for Primary Education
A number of bilateral and multilateral agencies are involved in supporting the primary education related programs and activities. Their involvement is seen in 11 out of 15 projects and programs. The external development partners are found to be financing largely the school sector reform program, primary education for all programs, teacher training projects, the community capacity enhancement program and primary school nutrition programs. In the five year period, a total of Rs 27,800 million seems to have been spent under the external assistance constituting 31 percent of the total expenditure on primary education related activities. The major share of the external assistance is seen in the community capacity improvement program, the child development program followed by integrated education structure, primary education nutrition programs, school sector reform programs, education for all programs, teacher training, physical facility improvement and lastly in school transfers and incentive programs. Table 3.4 below shows the source-wise allocation by sector and sub-sector. According to this Table, the government share in education is higher than the donors’ contribution through the period under review.

PUBLIC EXPENDITURE TRACKING STUDY ON PRIMARY EDUCATION IN NEPAL
14
Table 3.4 Five year total expenditure on primary education - 2005/06-2009/10 (NRs. in Million)
S.N Programs GoN Donor Total Aid
Dependency 1 Education for All - Primary Education (center) 52084 194 52278 0.4 2 School Sector Reform Program - SSR 1981 8435 10416 81.0 3 Non Formal Education Center 26 0 26 0.0 4 Special Education Council 200 0 200 0.0 5 School Handover and Incentive Program 56 168 224 75.1 6 Physical Facilities Improvement Project 130 392 521 75.1 7 Education for All - Child Development Program 0 53 53 99.8 8 Education for All Program 4614 15358 19972 76.9 9 Teachers Training Project 318 739 1057 69.9 10 Integrated School Education Structure 13 92 105 87.6 11 Community School Capacity Improvement Program 2 217 219 98.9 12 Conflict Affected Family Education Program 110 0 110 0.0 13 Non-formal Ed. & National Literacy Campaign 2100 44 2144 2.1 14 Food for Ed. - Primary School Nutrition Program 484 2109 2593 81.3 15 Food for education, Karnali Zone 16 0 16 0.0
Total 62134 27800 89934 30.9
3.5 Expenditure against Allocation Budget
In general, the budgeted amount signals the intention or commitment of the government, whereas actual spending measures the capacity for utilization. Review of the public spending analysis shows that 96 percent of the total budget has been spent in the sector during the five year period (2005/06-2009/10). It varies from project to project, and the expenditure exceeded the allocated budget in some of the project activities. Expenditure made on primary education, special education council, physical facilities improvement projects are some of the examples. Expenditure utilization against the allocated budget seems to be fairly good and close to cent percent utilization in the case of non-formal education centers and education for all programs. Likewise fund utilization rate in SSRP also does not seem to be that bad, which stands at 81 percent against the allocated budget. However, there are many other projects which have performed badly in terms of fund utilization against the allocated budget. The fund utilization rate has been reported to be as low as 21 percent in community school capacity improvement programs and 35 percent in integrated school education structure programs. Also the ECD program and school transfer incentive could not fully utilize the budgeted amount as required. The percentage share of the utilized amount made in these two programs against the allocated budgeted amount was only 54 percent and 67 percent respectively. Table 3.5 below shows the utilization rate in terms of expenditure against budgeted amount.

PUBLIC EXPENDITURE TRACKING STUDY ON PRIMARY EDUCATION IN NEPAL
15
Table 3.5 Five year total expenditure against budgeted amount - 2005/06-2009/10 (NRs. in Million)
S.N Program Budget Expenditure Utilization
(%) 1 Education for All - Primary Education 50234.4 52277.7 104 2 School Sector Reform Program - SSR 12872.5 10416.1 81 3 Non Formal Education Center 26.5 26.1 98 4 Special Education Council 189.0 200.2 106 5 School Handover and Incentive Program 333.5 224.1 67 6 Physical Facilities Improvement Project 510.1 521.2 102 7 Education for All - Child Development Program 98.0 52.8 54 8 Education for All Program 20586.7 19972.0 97 9 Teachers Training Project 1403.2 1057.1 75 10 Integrated School Education Structure 301.6 105.0 35 11 Community School Capacity Improvement Program 1019.2 218.9 21 12 Conflict Affected Family Education Program 100.0 110.0 110 13 NFE & National Literacy Campaign 2494.8 2143.8 86 14 Food for Ed. - Primary School Nutrition Program 3695.2 2592.8 70 15 Food for education, Karnali Zone 33.7 16.4 49 Total 93898.3 89934.0 96
The detailed utilization of the program by year and by source is in Appendix 2. Low utilization of the budget might cause delay in service delivery in terms of addressing the issues of equity and gender disparity.
3.6 Identification of Problem for Effective Public Spending
Fund utilization exceeding 90 percent or over spending made against the total budget does not tell us how efficiently and effectively they are used in realizing the targeted output in a given year. Firstly, most of the important projects such as scholarship programs, physical facilities improvement programs, child development programs and teachers training are all included under the SSR program, but the component-wise expenditure information are not recorded in the Red Book; neither does the DOE have any compiled expenditure information in this regard. Secondly, the SSR program includes not only primary education related activities, but it also includes lower and secondary education and higher education as well, and neither had been disaggregated in the Red Book nor in the DOE. Thirdly, there are many such programs in which primary education related activities are integrated, but could not be disaggregated when needed. Examples to such projects and programs are teacher pension facilities, teacher's record offices, curriculum development centers, and conflict affected family education programs and so on. Fourthly, there has been a practice to issue a letter of authority at the last hour of the fiscal year just to show that hundred percent expenditures are being made in a particular program, no matter, whether that money is utilized or not, giving more room for doubts on using of funds. How the fund misuse takes place and to what magnitude and at what level has also been delineated in a news headline “Schools Shown Fake Students” carried over by Kantipur daily publication on December 15, 2011.

PUBLIC EXPENDITURE TRACKING STUDY ON PRIMARY EDUCATION IN NEPAL
16
Chapter 4
RESOURCE TRANSFER MECHANISM
4.1 Flow of Authority to Spend Budget from MOF to MOE
The fund flows are linked with the budget formulation process beginning with the fixation of the budget ceiling at the national level. It is done by a Resource Committee chaired by the Vice-Chairperson of National Planning Commission. The fixation of the budget ceiling involves the following steps: The Resource Committee of the NPC assesses and decides the total budget amount for the next fiscal year (July-July) on the basis of the revenue estimates, foreign support (loan and grant) forecast and possible borrowing amount on the basis of national plans and national commitments to the international conventions, and then prepares the budget preparation guidelines. Then on the basis of this the NPC and MOF send these guidelines, to all line ministries including the MOE down to the District Development Committees (DDC). The MOF provides the budget ceiling for the recurrent budget. Both ceilings are to be given by Magh (December-January) to the sectoral ministries including MOE.
Upon receipt of the budget ceiling and policy-guidelines, the MOE forwards the ceiling to its Department of Education (DEO) and from there to the District Education Offices (DEO). Upon receiving the instructions and guidelines the DOE, prepares the annual plans and programs. The DEO starts reviewing the submitted annual plans and programs in the light of the current status of the on-going projects and the commitment made at the national and international level in case of new projects. DOE then forwards it to the MOE for submission to the NPC. The MOE further reviews the submitted budget proposal in detail by programs and funding sources. In case of foreign aid supported projects, the MOE verifies it with project agreements done with external development partners. Plans go back and forth from MOE to DOE and from DOE several times unless it comes to the right budget size. Once the MOE is satisfied, it forwards the consolidated annual program and budget to the NPC by March for consideration.
Intensive discussion takes place at the NPC in joint deliberations with the MOE upon the receipt of the annual program and budget. The NPC and the MOF scrutinize whether the submitted capital budgets are consistent with the policy guidelines and objectives of the planned document, the NPC then forwards it to the MOF with its endorsement.
Onward budget discussions take place at the MOF for finalizing the budget proposal. At this level, the MOF discusses with the MOE on each item of the regular budget. The budget thus takes a shape and is submitted for approval by the Cabinet. The total timeframe for budget formulation, submission and intensive deliberation takes four to six months from December to June.
After a Cabinet approval, the Finance Minister submits the annual estimate of the coming fiscal year’s revenue and expenditures to the Legislature Parliament, usually at the end of June or the first week of July. On the first day of the new fiscal year (July 16), an advance bill is passed by the Parliament to meet the expenditures of the State. After intensive and lengthy deliberations, the budget is finally passed by the Parliament and thus it receives a legal status.
4.2 Fund Flow Mechanism
4.2.1 Flow of Authority to Spend Budget from MOF to MOE
Upon the approval of the budget by the Parliament, the Secretary of the MOF issues an authority letter to the secretaries of the concerned ministries with the budget statement indicating the heads,

PUBLIC EXPENDITURE TRACKING STUDY ON PRIMARY EDUCATION IN NEPAL
17
sub-heads and budget line items and in the case of development projects the source from which the budget is to be met.
4.2.2 Flow of Authority to Spend Budget from MOE to DOE
Within 15 days from the receipt of such authority, the secretary of the concerned ministries issue authority to the department chief who in turn issues authority to the office chiefs indicating the particulars above. In the case of agencies under the MOE, the same procedure of issuing authority to spend is followed.
4.2.3 Flow of Authority to Spend Budget from DOE to DEO
The secretary of the MOE, after the receipt of authority from the secretary of the MOF, issues an authority letter to the subordinate department/s. But on what date, DOE issues the authority to DEO cannot be ascertained. Sometimes it might take more than a month depending on how fast the NPC gives an approval to the annual work plan. The department chief then authorizes the office chiefs under him/her along with the budget statement
4.2.4 Flow of Authority from DEO to Schools
There is no any established norm or system, which requires DOE to issue authority letters to schools. In fact, it is not mandatory.
4.3 Budget Release Procedure
The budget release system is not automatic. The FCGO and DTCO play an important role in the budget release process. Hence, the MOE will have to go through certain procedures to satisfy the DTO for budget release. The process to be followed by DEO for fund release is discussed below.
DEO receives the budget statement, annual work plan and authority to spend. DEO requests the DTCO for the release of its budget in a prescribed format by the FCGO. Prior to release of funds, FCGO, examines whether the following documents are attached:
a. Authority letter from the Ministry
b. Release order from FCGO to DTCO
c. Project/programs duly approved by the NPC and reflected in the budget
DTCO will release the budget, if everything is in order. It releases budget to DEO on a trimester basis in the case of grant in aid budget and on the basis of fund replenishment method.
After receiving the budget release from DTCO, the DEOs were found to have released budgets to the concerned schools every trimester. In the case of primary education budget, the existing process of budget release was changed with effect from fiscal year 2002/03, Instead of the DTCO directly releasing budget to DEO, the budget is now released to DDC and from there to the DEO and ultimately to the schools.

PUBLIC EXPENDITURE TRACKING STUDY ON PRIMARY EDUCATION IN NEPAL
18
Table 4.1: Stages in budget planning and execution cycles for chapter
Month Activities Nov./Dec. Budget allocation ceiling determination by NPC for different sectors, approved by
Resource Committee and sent to line ministries January NPC send the budget ceiling along with policy guideline to sectoral Ministries
including March Upon receipt of the budget ceiling, MOE submits to NPC and MOF for review and
budget negotiation April – May Intensive discussion takes place at NPS with back and forth for budget negotiation,
and sends it to MOF with endorsement June
MOF discusses with all the line ministries including MOE and scrutinizes on each item of the budget and is submitted for cabinet approval.
June end or 1st week of July
Finance Minister submits the annual estimates of income and expenditure to the Legislature Parliament.
July 16 (New Fiscal Year)
On the first day of new fiscal year, an advance bill is passed by the Parliament. After discussion and lengthy deliberation the budget is finally passed by the parliament.
July Upon approval of the budget, the secretary of MOF issues spending authority letter to MOE, requesting to issue similar authority letter to their subordinate office and DOE within 15 days.
August On receipt of the budget statement, annual work plan and spending authority letter, DEO, request the DTCO for the release of the budget in a prescribed by FCGO.
August FCGO verifies all the documents and if found it in place, FCGO the DTCO releases the budget on a trimester basis.
According to the DEO chief accountant, the fund is transferred to schools within a week after the fund release by DTCO to DEO. The major factor for the delay of the fund is due to the delay in program approval by the DOE to DTCO. The schedule of when DEO receives funds from DTCO, what kind of request form needs to be filled by schools and when it should be submitted to resource center, when resource person submits request form to DEO, and when DEO transfer fund to school account are presented below. The flow chart given below shows that DOE releases the funds to DTCO on a yearly basis. DTCO releases the fund to DEO on a trimester basis after the fund receipt. Upon the receipt of the fund from DTCO, DEO then release the budget to schools after the school supervision department approves it.
Table 4.2 DEO fund transfer calendar to school
Timeline DEO receive fund from
DTCO
Request Form submitted to
Resource Center
Resource Person submits request
form to DEO
DEO fund transfer to school account
First Trimester Early Sharwan Mid Bhadra By Bhadra First week of Ashoj Second Trimester Mangsir - Poush Magh first week Mid Magh By Magh Third Trimester Chaitra - Baishak Mid Jestha Mid Jestha By Jestha

PUBLIC EXPENDITURE TRACKING STUDY ON PRIMARY EDUCATION IN NEPAL
19
4.4 Gaps and Short Coming in Fund Flow Delivery
The above process required for fund release from issuing an authority letter from MOF to MOE and from MOE to DEO, and from DEO to schools is a long and cumbersome process. In fact, actual fund release which takes place in practice at the field level does not match the stipulate time mentioned by the MOF to the MOE in issuing the letter of authority. DOE cannot send the authority letter in the given 15 days' time to DEO, unless it is accompanied by an annual program approved by the NPC.
The delay in submitting the annual plan and program itself takes place at the DEO level, which is required to be submitted to DOE for screening prior to sending it to the MOE and from the MOE to the NPC for approval. DOE sends the annual plan and program on piece-mil basis to the NPC for approval, finding it difficult to get the accumulated annual program in time from DEO. Hence, it has become a day to day business for the NPC giving approval for annual programs which follow with issuing the letter of authority to spend even at the last hour of the closing fiscal year.
Department of Education
District Treasury Control Office
District Education Office
Schools
Yearly Released
Trimester Released after the fund release approval from DOE
Trimester Released after the fund release approval by School Supervision Department and DEO

PUBLIC EXPENDITURE TRACKING STUDY ON PRIMARY EDUCATION IN NEPAL
20
Chapter 5
FINDINGS
5.1 Findings from Desk Review at the National Level
1. Despite poor macro-economic performance and low economic growth, expenditure on education continued to rise during the study period. Spending on education equaled 18 percent of total expenditure and about 4 percent of GDP in 2009/10. Per capita expenditure on education also increased significantly during this period.
2. Larger proportion of the total education expenditure seems to have gone to primary education programs and activities. The percentage share of primary education in total education expenditure accounted for 63 percent in 2009/10. In relation to GDP, the percentage share of expenditure on primary education is found to be increasing, except in 2006/07.
3. A number of bilateral and multilateral agencies are involved in supporting the primary education program. As a percent of the total government expenditure, external assistance equaled 31 percent during the review period.
4. Fund utilization is found to be quite high. It, however, does not tell us whether that money is fully utilized efficiently and effectively. When analyzed in terms of internal efficiency, it demonstrated high wastage of resources.
5. A tendency to spend almost the entire allocated budget at the last moment has been found in the education sector, also by issuing authority letter to spend to DEO. The study team in one of its study areas found that the Lalitpur DEO received the authority letter to spend on physical facility improvements on Asadh 28 – just 2-3 days before the closing date of the fiscal year 2009/10.
5.2 Findings from the Field Study
The study team visited four districts – Lalitpur in the Kathmandu valley representing the central region, Dolakha in the north representing the Himalaya region, Kapilvastu in the west representing the tarai region, and Salyan in the mid-west representing the hilly region. The study team visited all the DEO offices and three primary schools of each of the three sample districts and one school of the Lalitpur district. In addition, independent opinions were also sought to track down expenditure right from the DEO level to the service provider level where the miss-use of funds is very much in question, affecting the very purpose of accessibility, equity and quality education.
5.2.1 District Education Office
5.2.1.1 Numbers of Primary School in Sample Districts In an average more than 65% of the total government schools in the district were primary schools expect for the Lalitpur district, where it was only 45%. Almost 80% of primary schools in the districts were government schools showing very few private primary schools. In the Salyan district there are no privately operated primary schools. In general the numbers of private schools ( all primary, lower secondary and secondary) in urban areas like Lalitpur numbers almost 50% more than government schools where as in semi-urban and rural areas, the number of private schools were very few, being less than 50.

PUBLIC EXPENDITURE TRACKING STUDY ON PRIMARY EDUCATION IN NEPAL
21
It was noticed that in terms of number of primary schools, the result seems to be sufficient in most of the districts. It was highlighted that accessibility to school is affected due to geographical terrains. Though there might be many schools, there are chances that some settlements may not have easy access to schools. Like in Salyan, it was noticed that there were 315 schools, but according to District Education Officer despite that, there are also some parts of the district where students need to walk an hour to reach school. So, school mapping is considered a vital process and location of schools should be placed strategically and merged where necessary, so that there is a good distribution of students as well as an effective use of resources. 5.2.1.2 Expenditure on Primary Education in Sample Districts The study team faced difficulties in gathering the time series expenditure data on primary education as none of the sampled districts except Dolakha have the data readily available. Given the time limit for the survey and DEO’s own preoccupation in its day to day business, the study team collected information quickly on whatever was available at the time. In spite of this limitation, the study team could collect information for the three year period in the case of Salyan and in Lalitpur for a two year period from 2008/09 to 2010/11. In the case of Kapilvastu, the study team could not collect information for 2007/08, and 2008/09. Nonetheless, the data collected for the last two years (2009/10 and 2010/11) shows that the government investment on primary education in Salyan remained the largest one among the four sample districts. In 2009/10, government spending in primary education by district varied from Rs 196 million in Salyan to Rs 188 million in Dolakha, Rs 134 million in Lalitpur to Rs 31 million in the case of Kapilvastu – the lowest among the four districts (Table 5.1).
Table 5.1: Total expenditure on primary education at district level (NRs. Million)
5.2.1.3 Program-wise Expenditure by District Lalitpur:
Program-wise expenditure by district showed Lalitpur had a list of 5 project activities being implemented in 2008/09, among which education for all (primary education), infrastructure improvement, informal education and national literacy campaign were undertaken. Of the total expenditure, education for all (primary education) alone accounted for 79 percent followed by infrastructure improvement with 11 percent in 2008/09. However, none of the project activities were seen in 2009/10. In its place, social sector reform programs surfaced from 2009/10 onwards. Within social reform programs, infrastructure improvement and development, PCF-non salary and improvement of education quality remained the most prominent throughout these years. Of the total expenditure, in 2010/11, infrastructure improvement alone accounted for 40 percent, PCF-non salary 22 percent and improvement of education quality 13 percent. Early child development and education also figured important during this period (2008/09-2010/11), though its share in total expenditure was found to be quite small. Details are presented in Appendix 3a.1 & 3a.2.
Dolakha:
S.N Sample districts Expenditure
2063/64 2064/65 2065/66 2066/67 2067/68 1 Lalitpur NA NA 50.7 73.6 133.6 2 Dolakha NA NA 4.9 121.0 187.0 3 Kapilvastu 18.0 NA NA 110.0 235.0 4 Salyan NA NA 59.8 145.0 196.0
PUBLIC EXPENDITURE TRACKING STUDY ON PRIMARY EDUCATION IN NEPAL
22
In Dolakha, the study team could gather a time series expenditure data from DEC for the five year period from 2005/06 to 2009/10. From 2005/06 to 2007/08, government expenditure on education in Dolakha was focused on education for all programs only. In 2008/09, a larger proportion of government expenditure on education shifted to school sector reform programs equaling 89 percent and education for all at 11 percent. In 2009/10, hundred percent of the total expenditure was made to school sector reform programs. Details are presented in Appendix 3b.1 & 3b.2. Kapilvastu:
Government investment on education in Kapilvastu was found for 2006/07, 2009/10 and for 2010/11 only. In 2006/07, government expenditure were noticed in education for all, informal education and national literacy campaigns, and in school handovers and incentive programs only with a larger share (81 percent) being devoted to education for all programs. No data were available for 2007/08 and 2008/09. Information available for 2009/10 showed a major share of the total expenditure was seen in infrastructure improvement programs (64 percent). The share, however declined to 29 percent in 2010/11, superseded by informal education and national literacy programs with 38 percent followed by school sector reform programs with 15 percent. In 2010/11, education for child development and community school capacity improvement program also surfaced as the important one; however resources devoted to these programs shared very little. Details are presented in Appendix 3c.1 & 3c.2.
Salyan:
As Salyan DEO did not have the expenditure record for 2006/07 and 2008/09, the study team collected data for the three year period from 2008/09 to 2010/11 only. Of the total four projects implemented in 2008/09, education for all (primary education accounted for about 75 percent of the total expenditure). From 2009/10 onwards, school sector reform programs figured more important in terms of percentage share in total expenditure in primary education instead of education for all programs. In 2009/10, school sector reform programs constituted 84 percent reaching to 96 percent in 2010/11. Within school sector reform programs, infrastructure improvement and development shared 29 percent and 31 percent respectively in the corresponding period. Unfortunately the share of primary school nutrition programs in total expenditure has been found decreasing during these periods. Details are presented in Appendix Table 3d.1 & 3d.2. 5.2.1.4 Fund Utilization on Primary Education at DEO Level Fund utilization seems to be quite high in almost all the sample districts. As of 2010/11, fund utilization rate against the allocated budget ranged from 125 percent in Dolakha to 100 percent in Lalitpur, 98 percent in Salyan and 93 percent in Kapilvastu. Fuller utilization, however, does not mean the allocated resources have been used effectively and efficiently. In some of cases, even those amounts which were transferred to schools were shown as an expenditure in DEOs financial statements, no matter whether that fund was being actually used or not. Expenditure made on physical facility improvement programs is an example of this. This is to be noted that DEO releases the budget for this program on a six-monthly basis and releases the budget based on the progress report from schools. But DEO cannot hold the budget for a long time and will have to transfer this budget to the school’s accounts prior to closing of the fiscal year; otherwise the budget will be freeze. Once the budget is transferred to schools accounts it would not be frozen, and can be carried over to next year for utilization. The study team verified this record with the Lalitpur DEO which received the authority letter to spend for physical facility improvement programs on 20th of Ashad – just 5 days before the closing of the fiscal year, and transferred the amount immediately to schools accounts to escape the freezing. Audit reports have pointed out this spending as un-audited (irregular). Among four districts, the highest Beruju was for Lalitpur with NRs. 380 million. Hence budget utilization needs to be examined in terms of outputs.

PUBLIC EXPENDITURE TRACKING STUDY ON PRIMARY EDUCATION IN NEPAL
23
5.2.1.5 Summary of primary education expenditure at the DEO level The larger part of the expenditure were on education for all and school sector reform programs, with its major focus on infrastructure improvement, and very little attention was given to school nutrition programs, ECD programs and capacity improvement programs.
Table 5.2 Status of fund utilization (%) made in the sample districts The detailed tables with DEO financial data on primary education and related activities are given in Appendix 3.
5.2.2 Findings of School Visits in Sample Districts
5.2.2.1 Physical Facilities of the Schools
In total 10 schools in the sample districts were surveyed, three in Dolakha, Kapilvastu, Salyan and one in the Lalitpur district. Overall, most of the surveyed schools have basic facilities like classrooms, desk & benches, black board. Class room seems to be sufficient for the number of students except for Shree Primary School, Kapilvastu, where classes were held under a makeshift shade due to insufficient classrooms. Two class rooms were under construction for the school through Village Development Committee funds. No major seepage or damage was noticed in the schools except for Shree Shiddi Primary School, Salyan. The old class room of the school had a major crack due to seduction of land. Most of the schools have the facility of male and female toilets, but there was no access to water in most of the school toilets. Proper drinking water facilities were also lacking in most of the schools. There were no electricity facilities in schools and their classrooms, except for Shree Mahindra Primary School. No proper library was step up in schools. The so called library of the schools was a book rack inside the staff room with very few books, mostly donated by the visitors or NGOs. DEO does not allocate regular funds for maintenance of the facilities. The schools which receive external funds from NGOs have well maintained facilities. Like schools in Dolakha were supported by an NGO named CMC- Nepal. Those schools have child friendly class rooms. Similarly, Shree Mahendra Primary School even has laptops in their class. Those laptops have very interactive teaching material as per the curriculum. It was donated by CERID (Center for Education Research and Development). 5.2.2.2 Allocation of Teachers in the Schools
In an average, each school has 4 teachers, the minimum being 3 teachers and the maximum being 8 teachers in Shree Primary School, Kapilvastu.
Most of teachers in the schools were temporary teachers like private teachers, relief teachers, per child fund (PCF teachers). In a school at Salyan we also encountered volunteer teachers, who were serving school without any salary. The allocations of teachers in schools were very few which have affected the quality of education in primary schools. Most of the schools did not have enough teachers, so they were obligated to take “multiple classes”- where students from different
S.N Sample districts
% Utilization 2063/64 2064/65 2065/66 2066/67 2067/68
1 Lalitpur NA NA 92% 94% 100% 2 Dolakha 93% 92% 100% 94% 125% 3 Kapilvastu 98% NA NA 37% 85% 4 Salyan NA NA 84% 94% 98%

PUBLIC EXPENDITURE TRACKING STUDY ON PRIMARY EDUCATION IN NEPAL
24
classes are kept together and the lectures are given simultaneously. As for the teachers, it is discouraging for teachers to work in such a way. This has also affected their efficiency and motivation for teaching. Most of the teachers showed their dissatisfaction at a trimester salary payment scheme. Some schools take their own initiatives to give monthly salaries to teachers like Shree Khadga Devi Primary School, Salyan and Shree Mahendra Primary School, Kapilvastu distributes monthly salaries whenever there is some surplus amount available in their account. 5.2.2.3 Source of Finance of the Schools
Schools in the sample districts receive resources from various sources. Among these, the government funds are the major source of funds for schools. The budget heading that the schools receive funding from the government are; (a) scholarship,1 (b) salary of teachers, (c) administrative budget,2 (d) curriculum fund, (e) PCF non-salary, (f) PCF salary,3 and (g) physical facility development fund.
Funds from local government are received based on the request application submitted by schools up on initiation by SMC. It was noticed that in schools where SMC is active and lead by local leaders, they are more likely to get funds from local government. In most of the cases, these funds are provided for physical facilities development. Apart from government source, schools receive funds from NGOs too. The funds from NGOs, however, depend on the activeness of SMCs and the location of schools. In case of Dolakha, the NGO named CMC- Nepal was highly active in the district. This NGO was working in the region with approval from respective government bodies like DDC, DEO and even DOE. Whereas, some NGO funds in other district were directly provided to schools, without consent from government authorities. It was noticed that such funds have chances of being misused.
Appendix Table 4a.1 & 4a.2 provides an overall position of the income of the sampled districts by source and by purpose. It was identified that government source covers 80-90% of the total school income. Very few schools have their school own source of income. Salary payment of the teachers and the staff constitute the major income source of the schools followed by physical facility improvements and bank balances. Income from bank balance is found to be higher than other incomes received for scholarship, curriculum of the schools and so on.
In most of the cases, schools receive administrative budgets also, which is used to pay salaries for school helpers/ peons. Hence, schools did not have other sources to get administrative work
1 Girl Scholarship (NRs 400), Dalit Scholarship (NRs 400), Marginalized Scholarship (NRs 400), Disables Scholarship (NRs 500) 2 Administrative Budget: NRs 42000 per primary school 3 Per Child Fund Salary is provided at schools where teacher allocation is insufficient as per the number of students. So this salary is
for the appointment of temporary teachers.
Box 1: Shree Mahendra Primary School, Kapilvastu Shree Mahendra Primary School, Kapilvastu has its own source of income. That school had an agriculture land which was donated by one of the local philanthropists. The land has been rented out, which provides an annual amount of 10,000 NRs as income. Through this they have hired private source teachers. This has ultimately helped improve the management and teaching practice in schools. In most of the schools it was noticed that the education quality was compromised due to insufficient teachers, the head master was busy in following up administrative duties etc., where as in the case of this school it seemed very well managed. This school has also seek the help of NGO grants and thus bought children interactive laptops. Even the teachers seem to have a desk top and teachers were proactive to teach computers to the children. It was noticed that school’s own source of income is vital for sustainable and quality management.

PUBLIC EXPENDITURE TRACKING STUDY ON PRIMARY EDUCATION IN NEPAL
25
carried out. Teams consider this a major reason for poor quality of the schools. Such arrangements were known by resource persons and decisions are usually made through SMC. In case of fees, all the schools do not collects fees. Even for the schools that collect fees, it is very nominal - NRs. 5 to 20, depending on the decision made by the Resource Center. Except for Shree Mahendra Primary School, Kapilvastu none of the schools have their own source of income. (Box1) 5.2.2.4 Expenditure of the Sampled Schools by Program and Activities
Appendix Table 4b.1 & 4b.2 shows the combined expenditure of the surveyed schools. Of the total expenditure, the major share seems to have gone to salary payment of the teachers, followed by school improvement programs. Expenditure on scholarships, curriculum and physical facility improvement programs have also been reported, but it remained below the administrative expenditure.
All school has conducted their financial audits and it was not as effective as it should be. The audit did not provide the factual condition of the school.
As mentioned in earlier chapters, 90 percent of the primary education related activities is administered by the schools themselves. There was a grey area while tracking the budget flow to the schools, as most of the schools financial statements do not show a program wise budget. The study team was informed that the schools used to receive a lump-sum amount without the breakdown of any programs. They usually liaison a Resource Person and identify the programs for the received budget. It is therefore not known whether the schools received the exact amount that these schools were supposed to receive. This has the possibility of creating miscommunication and miss-use of funds and the budget.
5.2.2.5 Efficiency and Effectiveness of Resources at School Level
From the program-wise expenditure analysis, it is known to what extent the resources have been used effectively. But when measured in terms internal efficiency, the output of the 10 sampled schools seems to be not discouraging (Table 5.3).
Table 5.3: Internal efficiency of different grades at sampled schools (%)
5.2.2.6 Summary of Expenditure at the School Level
Physical Facility and Improvement
• Auditor has pointed out many irregularities in its report, particularly in the case of those expenditures made on physical facility improvement programs. The irregular amount made in this program was found to be the highest in Lalitpur (NRs. 380 million), among the four districts.
4 Here not promoted refers to the total of repetition and drop out students. It has been lumped in together as it was not possible to
segregate these two.
Grade Particular 2064 2065 2066 2067
Grade 1
Promoted 58.19 69.47 73.51 54.35
Not promoted4 41.81 30.53 26.49 45.65
Grade 2
Promoted 67.59 80.15 83.76 65.49 Not promoted 32.41 19.85 16.24 34.51
Grade 3
Promoted 74.84 80.95 85.99 73.15 Not promoted 25.16 19.05 14.01 26.85

PUBLIC EXPENDITURE TRACKING STUDY ON PRIMARY EDUCATION IN NEPAL
26
• Physical facility improvement programs are very sensitive since it involves a lot of construction activities. Schools can make their own decision Actions are generally taken on mutual consent and one can easily imagine what kind of kick-backs and in what form it takes place.
• Conflict of School Management Committee (SMC), Building Construction Committee (BCC), Teachers and Staff has also created adverse issues in fund utilization. There is usually a conflict of interest between SMC and BCC and teachers in term of number of class rooms. Usually SMC is influenced politically; they keep their political commitments as priorities, rather than the school’s requirement.
• Most of the schools hardly follow the plan and design approved by the DEOs. Technical officers will not approve such reports if they are not consistent with the approved plan and design. In such cases even though building has been constructed it is considered under Beruju.
• Lack of community contribution also creates problems in the utilization of funds. Generally, Government provides 0.65 million to 0.8 million rupees for primary school construction. Community contribution or matching fund of 0.2 million or contribution in kind is expected from the community. Cases were recorded where the fund could not be utilized as the community could not contribute their share for school construction. For example, in Salyan two schools returned back the sum of 0.65 million due to lack of community contribution.
Scholarship and Textbook Distribution Fund
• Given that the availability of books and other instruction materials are keys to improving the quality of schooling, schools are given scholarship funds and textbook distribution funds based on the enrollment figure given by the schools. In this situation, schools can receive more scholarship than the actual number of students. In such cases, schools can distribute scholarship to more students. According to Resource Person, due to the increasing trend of false reporting of student numbers, DEOs tend to provide funds to only 70-80% of the total students reported in Flash I reports.
• This practice of showing up inflated enrollment figures has been blown up in a news headline
on “Schools Shown Fake Students” carried over by Kantipur daily publication on December 15, 2011. The news headline further shows how and why the tendency among community schools is rising to show an increased enrollment with fake students so as to get the opportunity to miss-use the funds for self-interest and benefit, in the name of providing quality education.
Teacher's Salary
• Since most of the financial aspects of schools are taken care by the headmasters, there are high chances of funds being misused by them if they have ill intentions. In one of schools in Salyan it was informed that head teacher has misused and seized the salary of teachers for months. Though the team could not visit the school, the team discussed the issue with the DEO. They were aware of the case and were in the process of investigation.
Teacher Appointment and Recruitment Funding
• School Management Committee, due to political influence in schools, could not recruit teachers and even hindered the regular salary payments. District like Salyan and Dolakha SMC seems to have major political influences, creating hindrance to school development.
Fund from NGO Other than Government
• Schools receive funds from NGOs also. In one of the sample districts (Dolakha) one NGO named CMC- Nepal was found to be helping, with approval from the respective government

PUBLIC EXPENDITURE TRACKING STUDY ON PRIMARY EDUCATION IN NEPAL
27
bodies like DDC, DEO and even DOE. However, some NGOs in other districts were found to be directly providing funds to school, without any consensus from government authorities. It was noticed that such funds have higher chances of being misused.

PUBLIC EXPENDITURE TRACKING STUDY ON PRIMARY EDUCATION IN NEPAL
28
Chapter 6
CONCLUSION AND RECOM MENDATIONS
6.1 Conclusion
In accordance with the priority given to education and particularly primary education as an instrument for poverty reduction, the government investment in the sector increased significantly over the years. In 2009/10, expenditure on primary education stood at 11 percent of the total government expenditure and 60 percent of the total education expenditure. This, however, is supposed to be grossly underestimated since the study team could not track that expenditure which is integrated with other projects.
The study team has tried to track many gaps and shortcomings in the government expenditure in the sector from the central level to the district level and to the school level with some recommendations to address these problems which are enumerated as follows:
Central Level
1. Public investment in primary education activities seems to have increased significantly during the period under review (2005/06-2009/10), but it does not give the full picture. There are many other integrated education programs, which among others include primary education related activities, but their disaggregated expenditure figure is not available. Likewise, ministries and local bodies other than the MOE also do make investments in primary education related activities, but they were not accessible.
2. Most of the program-wise expenditure trend shows erratic results, owing to its merger either with education for all or with SSRP in the course of program implementation, and hence any conclusion cannot be derived on the role and contribution of specific programs towards meeting the goal of education for all by 2015.
3. Fund utilization rate has been found to be quite high, but it does not tell us how effectively and efficiently they are used. It includes many hidden agendas. However, internal efficiency observed demonstrates a high wastage of resources provided in the education system, which means enormous resources invested in the sector have been subject to fund misuse.
4. Fund flow particularly from DOE to DEO and from DEO to schools do not take place as scheduled, owing to the delay in submitting the annual program from DEO itself.
District Level
1. Time series expenditure data at DEO were not available. Available data, however, showed that a larger part of the expenditure went to education for all and school sector reform programs, with its major focus on infrastructure improvement, very little to school nutrition programs, education for child development (ECD) and also capacity improvement programs.
2. Fund utilization seems to be quite high in almost all the sample districts. It, however, does not tell us whether that fund is efficiently or effectively used. Audit reports have pointed out most of the spending as un-audited (irregular). Among the four districts, the highest was Beruju for Lalitpur with 380 million rupees. It raises serious questions about the way funds are being utilized at the DEO level.
PUBLIC EXPENDITURE TRACKING STUDY ON PRIMARY EDUCATION IN NEPAL
29
3. DEO provides Teachers Professional Development (TPD) training to enhance the quality of the teachers, but the teachers particularly the permanent ones were found to be the least interested in the training. They lack enthusiasm for new learning and improving their teaching skills and adopt new interactive teaching techniques inhibits the quality of teachers.
4. Resource persons are required to visit schools in their area and provide monthly reports to resource centers and ultimately to the DEO. In was noticed that there is a poor practice of formal written reporting by the resource persons. Most of the reporting is done verbally during their regular meetings.
5. Construction programs require M&E reports approved by technical officers of the DEOs prior to its fund release. However, other programs like scholarship funds, curriculum funds do not have any supervision and monitoring. Though, yearly financial audit reports and social audits were submitted by schools, they were hardly reviewed by the DEO.
6. The team noticed that Resource Centers decide on the payment rate for the auditors. The payment rate for auditors range from 30 paisa per 100 NRS. audited to 25 paisa per 100 NRS. audited. The DEO provides only NRs. 1000 as a token amount to encourage auditing at the primary school level.
School Level
1. Schools in the sample districts receive funding from various sources, among which government funds are the major source. It is said that about 90 percent of the DEO expenditure comprises of primary education related activities broken down into salary payments, scholarship funds, textbook distribution funds, the administrative budget and so on. But when checked, the study team found the school to be receiving lump-sum amounts. It is, however, understood that the resource persons help the schools in allocating the lump-sum amount by programs.
2. Category-wise expenditure of each sampled schools showed the major share going to the salary payment of the teachers, followed by school improvement programs. Expenditure on scholarships, curriculum and physical facility improvement programs were also reported, but it remained very low – even below the administrative expenditure.
3. It was noticed that most of the time, the schools receive more scholarship funds than the actual number of student and so is with the curriculum fund as the students registered do not turn up during the academic session. And the schools are not bound to return such excess amount to the government as there is no such system also in place. In such cases schools have the luxury to distribute scholarships to all students, and also to fulfill their own self-interest.
4. Fund release to schools is done on a trimester basis, and is applicable mostly to salary payment for school teachers and staff. It means even teachers do not get their salary on time (on a monthly basis). Teachers usually get their salary either in September or October - three-four months after the beginning of the new fiscal year. In between teachers will have to survive either on their parental property or borrowing from schools funds. Given the situation, it would not be surprising to find why the quality of teaching in the schools did not improve in-spite of huge government investment in teachers training.
5. Each and every school has School Management Committee (SMC), and it is supposed to work for the overall school management. But in many cases, these SMCs are under political influence. SMC cannot not recruit appropriate teachers in time and in some cases even hinder the regular salary payments. Some of the teachers have been victimized by unfair evaluation which has affected their motivation and also their promotion. Districts like Salyan and Dolakha SMC seem to have major political influence, creating hindrance to school development.

PUBLIC EXPENDITURE TRACKING STUDY ON PRIMARY EDUCATION IN NEPAL
30
6. The school audit in its reports had mentioned something about irregularities of the school funds and seems to have attached the list of areas where such irregularities are taking place in a separate annex, but unfortunately the annex was missing and hence the study team could not see where and how such fund misuse took place.
6.2 Recommendations
1. Those primary education related expenditures which are integrated under other education projects or programs are required to be disaggregated.
2. The process of submitting the annual program down from DEO to DOE and to MOE should be speeded up for getting approval from NPC on an accumulated basis instead of a piece-mil enabling as early as possible, so as to prevent the issuing of the letter of authority and practice of transferring the amount to the schools account at the eleventh hour of the financial year closing.
3. The practice of submitting inflated students’ enrollment figures by schools in order to receive more grants-in aid in various forms should be reviewed, and firm action must be taken to make realistic number of students.
4. Construction activities under physical facility improvement programs in the schools should be done according to local purchase bidding so as to prevent the leakages in the use of public funds.
5. Salary payments should be released regularly on a monthly basis as most of the teachers showed their dissatisfaction with the system of a trimester salary payment scheme. This will at least help prevent unnecessary financial burden on teachers as well as schools from where borrow advance payments from other available program budgets.
6. In the schools, where nutrition programs have been introduced, they had very good flow of students. Based on these facts, DEO should allocate resources to the schools for introducing the nutrition program in those schools where such programs have not been launched for the sake of making education accessible to all, targeting particularly the women, Dalit and marginalized children.
7. Audit reports from the schools should be followed up and monitored closely in order to make it more effective and stringent.
8. The funds provided by the government for financial audit of NRs. 1000 only per school are not sufficient, and hence needs to be raised.
9. The role of RP is considered very crucial in identifying the issues and achievements of schools. The study team also saw the potential threat if RPs lack professionalism, they might mislead the DEO. A standard format should be developed and provided to the RPs for supervision and monitoring of the schools, in terms of output indicators by program targets. RPs should be encouraged to visit the school more frequently to find out the ground reality of the schools in terms of their achievements.

PUBLIC EXPENDITURE TRACKING STUDY ON PRIMARY EDUCATION IN NEPAL
31
REFERENCE
1. Central Bureau of Statistics/National Planning Commission, His Majesty’s Government of Nepal, Nepal Living Standard Survey 2003,04, Volume II.
2. Evaluation Department, Norad, Joint Evaluation of Nepal’s Education for All 2004-2009 Sector program, Evaluation Report 1/2009.
3. Government of Nepal, Ministry of Education, Department of Education; Flash I Report 2067 (2010-011).
4. Government of Nepal, Ministry of Education/Department of Education, Annual strategic Implementation Plan (ASIP) for 2007/08, 2010/11and 2011/012.
5. Government of Nepal, Ministry of Education, Department of Education; School Level Educational Statistics of Nepal June 2011.
6. Government of Nepal, Ministry of Finance, Economic Survey, Fiscal 2010/11, Volume I and Volume II, July 2011.
7. Government of Nepal, Ministry of Finance, Estimates of Income for 2005/06, 2006/07, 2008/09, 2009/10, 2010/11 and 2011/12.
8. Government of Nepal, Ministry of Health and Population/policy Planning and International Cooperation Division, Health Economics and Financing Unit, Nepal National Health Accounts II (2004-2006), Kathmandu, Nepal July 2009.
9. Government of Nepal, National Planning Commission/United Nations Country Team of Nepal, Nepal Millennium Development Goals, Progress Report 2010.
10. Government of Nepal, National Planning Commission/United Nations development Program, Nepal Millennium Development Goals, Needs Assessment for Nepal 2010.
11. Government of Nepal, National Planning Commission, Three Year Interim Plan (2007/08 – 2009/10), December 2007.
12. Government of Nepal, National Planning Commission, Annual Program, 2009/10, 2010/11 and 2011/12, Volume I and Volume II.
13. Government of Nepal, National Planning Commission, Nepal Government/UNICEF Nepal, Analysis of Basic Social Services in Nepal, 2004/05 to 2008/09, Kathmandu, March 2010.
14. Ritva Reinikka and Nathanael Smith, Public Expenditure tracking Survey in Education International Institute for Educational Planning, UNESCO.
15. The World Bank Group, Cambodia-Public Expenditure Tracking Survey (PETS) in Primary Education, December 2005.
16. The World Bank, Lao PDR, Public Expenditure Tracking Survey (PETS) in Primary Education and Primary Health, March 2008.

PUBLIC EXPENDITURE TRACKING SURVEY FOR PRIMARY EDUCATION SECTOR IN NEPAL
32
APPENDIX -1: PROGRAM WISE BUDGET IN PRIMARY EDUCATI ON
________________________________________________________________________________________________
Program wise budgeted amount in primary education (2005/06 - 2009/10)
S.N Project and Programs
Budget in NRs. Million
2062/63 (2005/06) 2063/64 (2006/07) 2064/65 (200708) 2065/66 (2008/09) 2066/67 (2009/10) Total (2005/06-2009/10)
GoN Donor Total GoN Donor Total GoN Donor Total GoN Donor Total GoN Donor Total GoN Donor Total
1 Education for All - Primary Education
7094 0 7094 7222 256 7478 9433 0 9433 12376 0 12376 13854 0 13854 49979 256 50234
2 School Sector Reform Program
0 0 0 0 0 0 0 0 0 0 0 0 2522 10350 12872 2522 10350 12872
3 Non Formal Education 5 0 5 5 0 5 5 0 5 6 0 6 7 0 7 27 0 27 4 Special Education 34 0 34 34 0 34 34 0 34 40 0 40 47 0 47 189 0 189
5 School Transfer and Incentive
1 150 150 0 101 101 0 70 70 0 13 13 0 0 0 1 333 334
6 Physical Facilities Improvement
85 415 500 2 0 2 0 0 0 9 0 9 0 0 0 95 415 510
7 Education for All - Child Development
0 15 15 0 18 18 0 10 10 0 10 10 0 45 45 0 98 98
8 Education for All Program 385 2874 3259 519 3160 3678 678 4779 5457 637 6499 7137 0 1056 1056 2219 18368 20587
9 Teachers Training Project 99 247 346 100 275 375 113 238 351 102 230 331 0 0 0 414 989 1403
10 Integrated School Education
0 0 0 5 70 75 3 68 70 6 74 80 3 74 77 16 286 302
11 Community School Capacity improvement
0 0 0 0 0 0 0 10 10 14 611 625 0 384 384 14 1005 1019
12 Conflict affected family education
0 0 0 0 0 0 0 0 0 50 0 50 50 0 50 100 0 100
13 Non-formal Ed. & National Literacy
87 48 135 119 8 126 149 4 153 1040 0 1040 1040 0 1040 2435 60 2495
14 Primary School Nutrition 123 653 776 139.7 891 1031 108 526 634 112 508 620 131 503 634 614 3081 3695
15 Food for education, Karnali Zone
0 0 0 34 0 34 0 0 0 0 0 0 0 0 0 34 0 34
Total 7911 4402 12313 8178 4778 12956 10523 5704 16228 14392 7944 22337 17654 12412 30066 58658 35241 93898
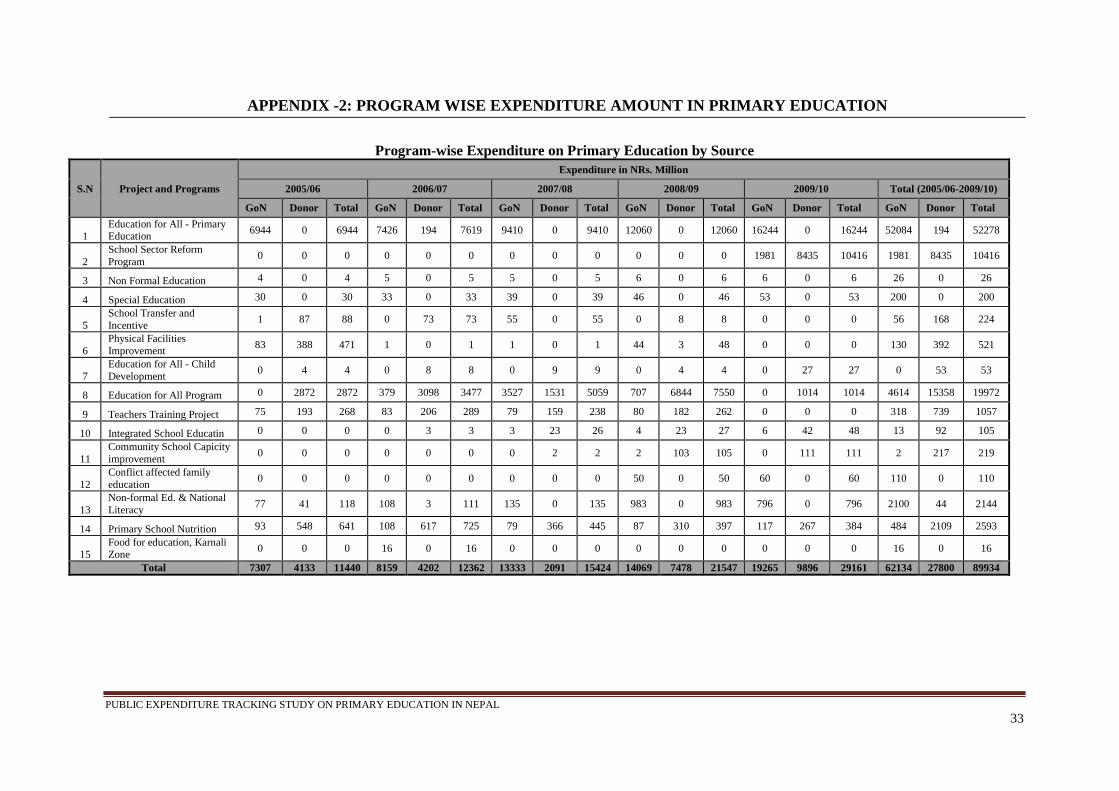
PUBLIC EXPENDITURE TRACKING STUDY ON PRIMARY EDUCATION IN NEPAL
33
APPENDIX -2: PROGRAM WISE EXPENDITURE AMOUNT IN PRI MARY EDUCATION
Program-wise Expenditure on Primary Education by Source
S.N Project and Programs
Expenditure in NRs. Million
2005/06 2006/07 2007/08 2008/09 2009/10 Total (2005/06-2009/10)
GoN Donor Total GoN Donor Total GoN Donor Total GoN Donor Total GoN Donor Total GoN Donor Total
1 Education for All - Primary Education
6944 0 6944 7426 194 7619 9410 0 9410 12060 0 12060 16244 0 16244 52084 194 52278
2 School Sector Reform Program
0 0 0 0 0 0 0 0 0 0 0 0 1981 8435 10416 1981 8435 10416
3 Non Formal Education 4 0 4 5 0 5 5 0 5 6 0 6 6 0 6 26 0 26
4 Special Education 30 0 30 33 0 33 39 0 39 46 0 46 53 0 53 200 0 200
5 School Transfer and Incentive
1 87 88 0 73 73 55 0 55 0 8 8 0 0 0 56 168 224
6 Physical Facilities Improvement
83 388 471 1 0 1 1 0 1 44 3 48 0 0 0 130 392 521
7 Education for All - Child Development
0 4 4 0 8 8 0 9 9 0 4 4 0 27 27 0 53 53
8 Education for All Program 0 2872 2872 379 3098 3477 3527 1531 5059 707 6844 7550 0 1014 1014 4614 15358 19972
9 Teachers Training Project 75 193 268 83 206 289 79 159 238 80 182 262 0 0 0 318 739 1057
10 Integrated School Educatin 0 0 0 0 3 3 3 23 26 4 23 27 6 42 48 13 92 105
11 Community School Capicity improvement
0 0 0 0 0 0 0 2 2 2 103 105 0 111 111 2 217 219
12 Conflict affected family education
0 0 0 0 0 0 0 0 0 50 0 50 60 0 60 110 0 110
13 Non-formal Ed. & National Literacy
77 41 118 108 3 111 135 0 135 983 0 983 796 0 796 2100 44 2144
14 Primary School Nutrition 93 548 641 108 617 725 79 366 445 87 310 397 117 267 384 484 2109 2593
15 Food for education, Karnali Zone
0 0 0 16 0 16 0 0 0 0 0 0 0 0 0 16 0 16
Total 7307 4133 11440 8159 4202 12362 13333 2091 15424 14069 7478 21547 19265 9896 29161 62134 27800 89934

PUBLIC EXPENDITURE TRACKING SURVEY FOR PRIMARY EDUCATION SECTOR IN NEPAL
34
APPENDIX -3: SAMPLED DISTRICT EDUCATION OFFICE FINA NACIAL DATA
DEO Lalitpur
Table 3a.1: Expenditure on primary education by program in Lalitpur (In Percent)
Program 2006/07 2007/08 2008/09 2009/10 2010/11 Education for all -Primary NA NA 79.4 0.0 0.0
Informal Education and National literacy Campaign NA NA 3.0 0.0 0.0
Special Education Council NA NA 2.6 0.0 0.0
Infrastructure Improvement Project NA NA 10.8 0.0 0.0
Education for all NA NA 4.2 0.0 0.0
School Sector Reform Program NA NA NA 100.0 100.0
Early Child Development and Education NA NA NA 8.5 5.2
Assurance for School Education NA NA NA 5.4 2.3
Literacy and Continual Education NA NA NA 2.9 1.7
Improvement of Educational Quality NA NA NA 16.3 12.7
Teachers Training and Development NA NA NA 1.5 2.6
School Management and Monitoring NA NA NA 7.9 4.4
PCF Non Salary NA NA NA 16.3 21.9
Encouragement and Support NA NA NA 0 0
Infrastructure Improvement and Development NA NA NA 41.1 40.2
Total NA NA 100 100 91.1
Table 3a.2: Lalitpur District DEO Financial Data (I n NRs. thousand)
S.N Program Budget Code
2065/66 2066/67 2067/68 Average Budget
Average Expenditure
Budget Expenditure Budget Expenditure Budget Expenditure
1 Education for all -Primary 65-3/4-804 43885.64 40244.775 NA NA NA NA 14,628.55 13,414.93
1.1 Education for all (primary) 65-3-804 30125.64 26484.775 NA NA NA NA 10,041.88 8,828.26
1.2 Education for all (primary) 65-4-804 13760 13760 NA NA NA NA 4,586.67 4,586.67
2 Informal Education and National literacy Campaign
65-3-600 2505.2 1543.49 NA NA NA NA
835.07 514.50
3 Special Education Council 65-3-170 1309.9 1309.9 NA NA NA NA 436.63 436.63
4 Infrastructure Improvement Project 65-3/4-415 5487.8 5465.94 NA NA NA NA 1,829.27 1,821.98
4.1 Infrastructure Improvement Project 65-3-415 225 203.14 NA NA NA NA 75.00 67.71

PUBLIC EXPENDITURE TRACKING STUDY ON PRIMARY EDUCATION IN NEPAL
35
S.N Program Budget Code
2065/66 2066/67 2067/68 Average Budget
Average Expenditure
Budget Expenditure Budget Expenditure Budget Expenditure
4.2 Infrastructure Improvement Project 65-4-415 5262.8 5262.8 NA NA NA NA 1,754.27 1,754.27
5 Education for all 65-4/3-417 2123.4 2126.4 NA NA NA NA 707.80 708.80
5.1 Education for all 65-4-417 1050 1050 NA NA NA NA 350.00 350.00
5.2 Education for all 65-3-417 1073.4 1076.4 NA NA NA NA 357.80 358.80
6 School Sector Reform Program 65-3/4-815 NA NA 78112.13 73644.472 133609.21 133670.488 70,573.78 69,104.99
6.1 School Sector Reform Program 65-3-815 NA NA NA NA NA NA 0.00 0.00
6.2 Early Child Development and Education 65-3-815 NA NA 6292.2 6292.2 6292.2 6999.8 4,194.80 4,430.67
6.3 Assurance for School Education 65-3-815 NA NA 4360.72 4009.48 4360.72 3090.65 2,907.15 2,366.71
6.4 Literacy and Continual Education 65-3-815 NA NA 2210.99 2150.65 2210.99 2210.5 1,473.99 1,453.72
6.5 Improvement of Educational Quality 65-3-815 NA NA 13167.64 12015.86 13167.64 17022.505 8,778.43 9,679.46
6.6 Teachers Training and Development 65-3-815 NA NA 1095.75 1095.75 1095.75 3483.6 730.50 1,526.45
6.7 School Management and Monitoring 65-3-815 NA NA 8092.77 5798.74 8425.33 5934.153 5,506.03 3,910.96
6.8 PCF Non Salary NA NA 12597.06 11985.8 30,280.98 29287.6 14,292.68 13,757.80
6.9 Encouragement and Support 65-3-815 NA NA 0 0 12170.6 11958.68 4,056.87 3,986.23
6.1 Infrastructure Improvement and Development 65-4-815 NA NA 30295 30295.992 55605 53683 28,633.33 27,993.00
7 School Sector Reform Program-SSRP 65-3/4-428 NA NA NA NA NA NA NA NA
7.1 School Sector Reform Program 65-4-428 NA NA NA NA NA NA NA NA
7.2 School Sector Reform Program 65-3-428 NA NA NA NA NA NA NA NA
8 Education for All- ECD 65-3-416 NA NA NA NA NA NA NA NA
9 Community School Capacity Improvement Program 65-3-426
NA NA NA NA NA NA NA NA
10 Primary School Nutrition Program 65-3-620 NA NA NA NA NA NA NA NA
11 School Handover and Encouragement Program
65-3-412 NA NA NA NA NA NA NA NA
Total 55311.94 50690.505 78112.13 73644.472 133609.21 133670.488 89011.09333 86001.82167

PUBLIC EXPENDITURE TRACKING STUDY ON PRIMARY EDUCATION IN NEPAL
36
DEO Dolakha: Table 3b.1: Expenditure on primary education by program in Dolakha (In Percent)
Program 2005/06 2006/07 2007/08 2008/09 2009/10 Education for all 100 100 100 11 0 School Sector Reform Program 0 0 0 89 100 School Sector Reform Program 0 0 0 0 0 Total 100 100 100 100 100
Table 3b.2: Dolakha district DEO financial data (In NRs. thousand)
S.N Program Budget code
2063/64 2064/65 2065/66 2066/67 2067/68 Average Budget
Average Exp Budget Exp Budget Exp Budget Exp Budget Exp Budget Exp
1 Education for all -Primary 65-3/4-804 NA NA NA NA NA NA NA NA NA NA NA NA 1.1 Education for all (primary) 65-3-804 NA NA NA NA NA NA NA NA NA NA NA NA 1.2 Education for all (primary) 65-4-804 NA NA NA NA NA NA NA NA NA NA NA NA 2 Informal Education and NIC 65-3-600 NA NA NA NA NA NA NA NA NA NA NA NA 3 Special Education Council 65-3-170 NA NA NA NA NA NA NA NA NA NA NA NA 4 Infrastructure Improvement Project 65-3/4-415 NA NA NA NA NA NA NA NA NA NA NA NA
4.1 Infrastructure Improvement Project 65-3-415 NA NA NA NA NA NA NA NA NA NA NA NA 4.2 Infrastructure Improvement Project 65-4-415 NA NA NA NA NA NA NA NA NA NA NA NA 5 Education for all 65-4/3-417 44112 41117 60063 55336 4882.5 4882.5 16746.4 12866.4 NA NA 7,209.63 5,916.30
5.1 Education for all 65-4-417 NA NA NA NA NA NA NA NA NA NA 0.00 0.00 5.2 Education for all 65-3-417 NA NA NA NA NA NA NA NA NA NA 0.00 0.00 6 School Sector Reform Program 65-3/4-815 NA NA NA NA NA NA 114181.5 109046.9 149854.8 187896.6 88,012.10 98,981.17
6.1 School Sector Reform Program 65-3-815 NA NA NA NA NA NA 114181.5 109046.9 149854.8 187896.6 88,012.10 98,981.17 6.2 ECD 65-3-815 NA NA NA NA NA NA NA NA NA NA NA NA 6.3 Assurance for School Education 65-3-815 NA NA NA NA NA NA NA NA NA NA NA NA 6.4 Literacy and Continual Education 65-3-815 NA NA NA NA NA NA NA NA NA NA NA NA 6.5 Quality Improvement 65-3-815 NA NA NA NA NA NA NA NA NA NA NA NA 6.6 Teachers Training and Devt. 65-3-815 NA NA NA NA NA NA NA NA NA NA NA NA 6.7 School Mgmt and Monitoring 65-3-815 NA NA NA NA NA NA NA NA NA NA NA NA 6.8 PCF Non Salary NA NA NA NA NA NA NA NA NA NA NA NA 6.9 Encouragement and Support 65-3-815 NA NA NA NA NA NA NA NA NA NA NA NA 6.1 Infrastructure Improve and Dev 65-4-815 NA NA NA NA NA NA NA NA NA NA NA NA 7 SSRP 65-3/4-428 NA NA NA NA NA NA NA NA NA NA NA NA
7.1 School Sector Reform Program 65-4-428 NA NA NA NA NA NA NA NA NA NA NA NA 7.2 School Sector Reform Program 65-3-428 NA NA NA NA NA NA NA NA NA NA NA NA 8 Education for All- ECD 65-3-416 NA NA NA NA NA NA NA NA NA NA NA NA 9 Community School Capacity 65-3-426 NA NA NA NA NA NA NA NA NA NA NA NA 10 Nutrition Program 65-3-620 NA NA NA NA NA NA NA NA NA NA NA NA 11 School Handover/ Encouragement 65-3-412 NA NA NA NA NA NA NA NA NA NA NA NA Total 44112 41117 60063 55336 4882.5 4882.5 130927.9 121913.3 149854.8 187896.6 95221.7333 104897.47

PUBLIC EXPENDITURE TRACKING STUDY ON PRIMARY EDUCATION IN NEPAL
37
DEO Kapilvastu Table 3c.1: Expenditure on primary education by program in Kapilvastu (In Percent)
Program 2006/07 2007/08 2008/09 2009/10 2010/11
Education for all -Primary 81 NA NA 17 0
Informal Education and National literacy Campaign 17 NA NA 17 38
Infrastructure improvement and development NA NA NA 64 29
School Sector Reform Program NA NA NA 0 15
Education for All- ECD NA NA NA - 3
Community School Capacity Improvement Program NA NA NA 1 16
School Handover and Encouragement Program 3 NA NA 0 0
Total 100 NA NA 100 100
Table 3c.2: Kapilvastu district DEO financial data (In NRs. thousand)
S.N Program Budget code
2063/64 2064/65 2065/66 2066/67 2067/68 Average Budget
Average Exp Budget Exp Budget Exp Budget Exp Budget Exp Budget Exp
1 Education for all -Primary 65-3/4-804 15085 15085 NA NA NA NA 16230.15 16230.15 NA NA 10,438.38 10,438.38
1.1 Education for all (primary) 65-3-804 0 0 NA NA NA NA 16230.15 16230.15 NA NA 5,410.05 5,410.05
1.2 Education for all (primary) 65-4-804 15085 15085 NA NA NA NA NA NA NA NA 5,028.33 5,028.33
2 Informal Education and National literacy Campaign
65-3-600 3486.29 3124.66 NA NA NA NA
16230.15 16230.15 13687.746 11547.724 11,134.73 10,300.84
3 Special Education Council 65-3-170 NA NA NA NA NA NA NA NA NA NA NA NA
4 Infrastructure Improvement Project
65-3/4-415 NA NA NA NA NA NA NA NA NA NA NA NA
4.1 Infrastructure Improvement Project
65-3-415
NA NA NA NA NA NA NA NA NA NA NA NA
4.2 Infrastructure Improvement Project
65-4-415
NA NA NA NA NA NA NA NA NA NA NA NA
5 Education for all 65-4/3-417 NA NA NA NA NA NA NA NA NA NA NA NA
5.1 Education for all 65-4-417 NA NA NA NA NA NA NA NA NA NA NA NA
5.2 Education for all 65-3-417 NA NA NA NA NA NA NA NA NA NA NA NA
6 SSRP 65-3/4-815 NA NA NA NA NA NA 263835.05 77069.883 254208.242 213968.51 172,681.10 97,012.80
6.1 School Sector Reform 65-3-815 NA NA NA NA NA NA 203109.05 16438.378 245403.242 205163.51 149,504.10 73,867.30

PUBLIC EXPENDITURE TRACKING STUDY ON PRIMARY EDUCATION IN NEPAL
38
S.N Program Budget code
2063/64 2064/65 2065/66 2066/67 2067/68 Average Budget
Average Exp Budget Exp Budget Exp Budget Exp Budget Exp Budget Exp
Program
6.2 ECD and Education 65-3-815 NA NA NA NA NA NA NA NA NA NA NA NA
6.3 Assurance for School Education
65-3-815
NA NA NA NA NA NA NA NA NA NA NA NA
6.4 Literacy and Continual Education
65-3-815
NA NA NA NA NA NA NA NA NA NA NA NA
6.5 Quality Improvement 65-3-815 NA NA NA NA NA NA NA NA NA NA NA NA
6.6 Teachers Training and Development
65-3-815
NA NA NA NA NA NA NA NA NA NA NA NA
6.7 School Mgmt and Monitoring 65-3-815 NA NA NA NA NA NA NA NA NA NA NA NA
6.8 PCF Non Salary NA NA NA NA NA NA NA NA NA NA NA NA
6.9 Encouragement and Support 65-3-815 NA NA NA NA NA NA NA NA NA NA NA NA
6.1 Infrastructure Improvement and Development
65-4-815
NA NA NA NA NA NA 60726 60631.505 8805 8805 23,177.00 23,145.50
7 SSRP 65-3/4-428 NA NA NA NA NA NA NA NA 4464.868 4464.868 1,488.29 1,488.29
7.1 SSRP 65-4-428 NA NA NA NA NA NA NA NA 0 0 0.00 0.00
7.2 SSRP 65-3-428 NA NA NA NA NA NA NA NA 4464.868 4464.868 1,488.29 1,488.29
8 Education for All- ECD 65-3-416 NA NA NA NA NA NA NA NA 846.815 846.815 282.27 282.27
9 Community School Capacity Improvement Program
65-3-426 NA NA NA NA NA NA
2937.7 1199.946 4875 4875 2,604.23 2,024.98
10 Nutrition Program 65-3-620 NA NA NA NA NA NA NA NA NA NA NA NA
11 School Handover and Encouragement Program
65-3-412 486.4 486.4 NA NA NA NA NA NA NA NA
162.13 162.13
Total 19057.69 18696.06 NA NA NA NA 299233.05 110730.13 278082.671 235702.917 198791.137 121709.7021

PUBLIC EXPENDITURE TRACKING STUDY ON PRIMARY EDUCATION IN NEPAL
39
DEO Salyan
Table 3d.1: Expenditure on primary education by program in Salyan (In Percent)
Program 2063/34 2064/65 2065/66 2066/67 2067/68
Education for all - Primary Education NA NA 75 10 - Informal Education and National literacy Campaign
NA NA 4 4 3
Education for all NA NA 13 1 1 School Sector Reform Program NA NA - 84 96 School Sector Reform Program NA NA - 55 65 Infrastructure Improvement and Development
NA NA 29 31
Community School Capacity Improvement Program
NA NA - 1 -
Primary School Nutrition Program NA NA 8 1 Total NA NA 100 100 100
Table 3d.2: Salyan district DEO financial data (In NRs. thousand)
S.N Program Budget code 2065/66 2066/67 2067/68
Average Budget Average Exp Budget Expenditure Budget Expenditure Budget Expenditure
1 Education for all -Primary 65-3/4-804 55160.062 44941.562 14946.72 14946.72 NA NA 23,368.93 19,962.76
1.1 Education for all (primary) 65-3-804 55160.062 44941.562 14946.72 14946.72 NA NA 23,368.93 19,962.76
1.2 Education for all (primary) 65-4-804 NA NA NA NA NA NA NA NA
2 Informal Education and National literacy Campaign
65-3-600 2316.74 2102.54659 6709.27 6292.815 6928.144 6826.44 5,318.05 5,073.93
3 Special Education Council 65-3-170 NA NA NA NA NA NA NA NA
4 Infrastructure Improvement Project 65-3/4-415 NA NA NA NA NA NA NA NA
4.1 Infrastructure Improvement Project 65-3-415 NA NA NA NA NA NA NA NA
4.2 Infrastructure Improvement Project 65-4-415 NA NA NA NA NA NA NA NA
5 Education for all 65-4/3-417 7974.928 7974.928 NA NA NA NA 2,658.31 2,658.31
5.1 Education for all 65-4-417 NA NA NA NA NA NA NA NA
5.2 Education for all 65-3-417 7974.928 7974.928 NA NA NA NA 2,658.31 2,658.31
6 School Sector Reform Program 65-3/4-815 NA NA 130301.422 122125.809 192157.15 188075.171 107,486.19 103,400.33
6.1 School Sector Reform Program 65-3-815 NA NA 88056.422 79880.809 130987.15 126905.171 73,014.52 68,928.66

PUBLIC EXPENDITURE TRACKING STUDY ON PRIMARY EDUCATION IN NEPAL
40
S.N Program Budget code 2065/66 2066/67 2067/68
Average Budget Average Exp Budget Expenditure Budget Expenditure Budget Expenditure
6.2 Early Child Development and Education
65-3-815
NA NA NA NA NA NA NA NA
6.3 Assurance for School Education 65-3-815 NA NA NA NA NA NA NA NA
6.4 Literacy and Continual Education 65-3-815 NA NA NA NA NA NA NA NA
6.5 Improvement of Educational Quality 65-3-815 NA NA NA NA NA NA NA NA
6.6 Teachers Training and Development 65-3-815 NA NA NA NA NA NA NA NA
6.7 School Management and Monitoring 65-3-815 NA NA NA NA NA NA NA NA
6.8 PCF Non Salary NA NA NA NA NA NA NA NA
6.9 Encouragement and Support 65-3-815 NA NA NA NA NA NA NA NA
6.1 Infrastructure Improvement and Development
65-4-815
NA NA 42245 42245 61170 61170 34,471.67 34,471.67
7 School Sector Reform Program-SSRP
65-3/4-428 NA NA NA NA
788.393 788.393 262.80 262.80
7.1 School Sector Reform Program 65-4-428 NA NA NA NA 250 250 83.33 83.33
7.2 School Sector Reform Program 65-3-428 NA NA NA NA 538.393 538.393 179.46 179.46
8 Education for All- ECD 65-3-416 NA NA NA NA 790.988 789.865 263.66 263.29
9 Community School Capacity Improvement Program
65-3-426 NA NA
2087.79 1983.125 NA NA
695.93 661.04
10 Primary School Nutrition Program
65-3-620 6220.8 4856.64751 NA NA NA NA
2,073.60 1,618.88
11 School Handover and Encouragement Program
65-3-412 NA NA NA NA NA NA NA NA
Total 71672.53 59875.6841 154045.202 145348.469 200664.67 196479.869 142127.4683 133901.3407

PUBLIC EXPENDITURE TRACKING SURVEY FOR PRIMARY EDUCATION SECTOR IN NEPAL
41
APPENDIX -4: SAMPLED SCHOOL’S FINANACIAL DATA
Table 4a.1: Source-wise income of the sampled schools School 1: Shree Shanti VidhyaShram P.S, Lalitpur
SN Income heading
Fiscal Year
2063/64 2064/65 2065/66 2066/67 2067/68
1 Government 88% 87% 89% 95% NA
1.1 District Education Office Grant (NRs.) 88% 87% 89% 95% NA
2 School Own Source - 2% 1% 23% NA
2.1 School Own Source (NRs.) - 2% 1% 23% NA
3 Others 12% 13% 11% 5% NA 3.1 Carryover from the past (NRs.) 12% 10% 11% 5% NA
School 3: Bal Mandir Primary School, Taulihawa, Kapilvastu
S.N Income Heading
Fiscal Year 2063/64 2064/65 2065/66 2066/67
1 Government 79% 81% 78% 81% 1.1 Salary 66% 62% 66% 56% 1.2 Administrative 3% 3% 2% - 1.3 School Management and Stationeries 0.21% 0.16% 0.14% 5% 1.4 Scholarship 4% 8% 3% 4% 1.5 Curriculum - - 3% 2% 1.6 School Sector Reform Program 7% 8% 3% - 1.7 Auditing Expenses - - 0.16% 0.11% 1.8 Sundry - - - 15% 2 Carryover from the past 21% 19% 22% 19%
School 2: Shree Darfe Devisthan P.S., Darfe, Dolakha
S.N Income heading Fiscal Year
2063/64 2064/65 2065/66 1 Government 92% 91% 93%
1.1 District Education Office Grant (NRs.) 92% - 93%
1.2 Salary (NRs.) - 57% -
1.3 Scholarship (NRs.) - 1% -
1.4 Curriculum (NRs.) - 1% -
1.5 School Improvement Program (NRs.) - 28% -
1.6 ECD (NRs.) - 5% -
2 NGO Grant - - 1%
3 School Own Source - - 0%
4 Carryover from the past/ Bank Balance 8% 8% 6%
5 Miscellaneous 1%

PUBLIC EXPENDITURE TRACKING STUDY ON PRIMARY EDUCATION IN NEPAL
42
School 4: Shree Mahendra Primary School, Taulihawa, Kapilvastu
S.N Income Headings Fiscal Year
2063/64 2064/65 2065/66 2066/67 2067/68 1 Government 57% 69% 77% 72% NA 1.1 Salary 50% 56% 54% 42% - 1.2 Stationeries 0.13% 0.13% 0.12% 1% - 1.3 Administrative 1% 2% 1% 2% - 1.4 Curriculum - - - 2% - 1.5 Scholarship 2% 4% 3% 4% - 1.7 School Day Meal Program - - - 16% - 1.8 Administrative - 1% 13% 3% - 1.9 School Improvement Program 4% 7% 6% 3% - 2 NGO 13% - - - NA 2.1 NGO Grant 13% - - - - 3 School Own Source 5% 6% 6% 4% NA 4 Carryover from the past 24% 23% 16% 23% NA 5 Other 2% 2% 1% 1% NA School 5: Shree Primary School, Taulihawa, Kapilvastu
S.N Income Heading Fiscal Year
2063/64 2064/65 2065/66 2066/67 2067/68 1 Government 84% 84% 1.1 Salary NA NA NA 35% 18% 1.2 Non-Salary NA NA NA - 3% 1.3 Administrative NA NA NA 3% 2% 1.4 School Improvement Program NA NA NA 6% - 1.5 Curriculum NA NA NA 3% 2% 1.6 Scholarship NA NA NA 2% 3% 1.7 PCF NA NA NA 7% 5% 1.8 Physical Facilities Improvement NA NA NA - 32%
1.9 Community school Capacity Improvement Program
NA NA NA - 4%
1.10 School Handover and Incentive Program
NA NA NA - 1%
1.11 Auditing Expenses NA NA NA 0.1% 0.04% 1.12 Teacher's Uniform NA NA NA - 0.3% 1.13 Sundry NA NA NA 24% 14% 1.14 PCF Donation NA NA NA 2% -
2 Local Bodies NA NA NA - 7% 2.1 VDC Grant NA NA NA - 7%
3 NGO NA NA NA 6% 4% 3.1 NGO Grant NA NA NA 6% 4%
4 Carryover from the past NA NA NA 10% 5%
5 Interest from Bank NA NA NA 0% 0%

PUBLIC EXPENDITURE TRACKING STUDY ON PRIMARY EDUCATION IN NEPAL
43
School 6: Shree Siddha Primary, Hiwalcha, Madana,Salyan
S.N Income Headings Fiscal Year
2063/64 2064/65 2065/66 2066/67 2067/68 1 Government 84% 69% 90% 50% 84%
1.1 Salary 64% 53% 40% 42% 64%
1.2 Scholarship 2% 3% 2% 2% 2%
1.3 Curriculum 14% 7% 1% 2% 14%
1.4 Administrative 4% 2% - - 4%
1.5 Non-Salary - - - 0.04 -
1.6 Stationeries - 1% 1% - -
1.7 Physical Facilities Improvement - - 45% - -
1.8 School Improvement Program - 3% - - -
2 Local Bodies - 14% 1% 4% -
3 School Own Source - - - 4% -
4 Carryover from the past 16% 18% 9% 42% 16% School 7: Shree Khadga Devi Primary School, Khalanga, Salyan S.N Income Headings Fiscal Year
2063/64 2064/65 2065/66 2066/67 2067/68 1 Government 89% 89% 85% 83% NA
1.1 Salary 76% 74% 58% 75% - 1.2 Non-Salary - - - 4% - 1.3 Administrative 1% 2% - 1.4 Curriculum 6% 5% 2% 2% - 1.5 Scholarship 2% 3% 3% 2% - 1.6 District Education Office Grant - - - 1% - 1.7 District Education Office Grant - - 12% - - 1.8 Physical Facilities Improvement - - 0% - - 1.9 Auditing Expenses - - 1% - -
1.10 School Improvement Program 3% - 1% - - 1.11 Salary - - 2% - - 1.12 Computer - 5% 7% - -
2 Local Government Grant - - - 4% NA 3 School Own Source - - - 0% NA 4 Miscellaneous 8% 0% 0% 0% NA 5 Carryover from the past 3% 10% - 12% NA 6 Bank Balance - - 14% - NA
School 8: Shree Shikshya Mandir Primary, Dhuldhara, Salyan S.N
Income Headings
Fiscal Year 2063/64 2064/65 2065/66 2066/67 2067/68
1 Government NA 89% 89% 92% NA 1.1 Salary - 78% 73% 81% - 1.2 Scholarship - 3% 3% 2% - 1.3 Curriculum - 6% 3% 2% - 1.4 Administrative - 3% - - - 1.5 Non-Salary - - - 6% - 1.6 School Improvement Program - - 3% - -
1.7 Physical Facilities Improvement - - 8% - -
2 Carryover from the past NA 9% 8% 6% NA 3 Miscellaneous NA 2% 3% 2% NA

PUBLIC EXPENDITURE TRACKING SURVEY FOR PRIMARY EDUCATION SECTOR IN NEPAL
44
Table 4a.2: Sample Schools Financial Data by Income Source
District School SN Income head Fiscal Year
Description 2063/64 2064/65 2065/66 2066/67 2067/68 Lalitpur Shree Shanti
VidhyaShram P.S
1 ut cf= aif{sf] df}hbft c= Nof= Carryover from the past 80774.41 68571.21 90358.41 55826.29 - 2 gub c= Nof= Carryover from the past - 22866.20 - - - 3 lh= lz= sf= cgbfg District Education Office Grant 570677.00 586642.00 728524.00 1096591.00 - 4 lghL >f]taf6 cfDbfgL School Own Source - 13007.00 4125.00 270500.00 - 5 cleefjs ;xof]u Parents Support - - - - - hDdfhDdfhDdfhDdf Total 651451.41 691086.41 823007.41 1422917.29 -
Dolakha Shree Darfedevisthan P.S.
1 ut cf= aif{sf] df}hbft Carryover from the past 17930.43 - 29305.56 - - 2 lh= lz= sf= lgsf;L District Education Office Grant 202485.33 - 454966.00 - - 3 lzIfs sd{rf/L tna etf vr{ Teacher Salary - 172664.00 - - - 4 s ; sf]]if bflvnf vr{ Teacher Salary - 35606.80 - - - 5 5fqj[lt ljt/0f vr{ Scholarship - 2020.00 - - - 6 kf7\ok':ts Curriculum - 2360.00 - - - 7 ljBfno 3]/fjf/ / dd{t ;'wf/ School Improvement Program - 11750.00 - - - 8 sIff Joj:yfkg School Improvement Program - 91000.00 - - - 9 ljljw vr{ Miscellaneous - 2581.00 - - -
10 afn ljsf; tkm{sf] kfl/>lds tyf d;nGb vr{ ECD - 17900.00 - - -
11 a}+s tyf df}hbft Bank Balance - 29305.56 - - - 12 l;kf8{ cg'bfg NGO Grant - 3544.00 13 ljlj„cfDbfgL -bfp/f_ School Own Source - 1000.00 hDdfhDdfhDdfhDdf Total 220415.76 365187.36 488815.56 0.00 0.00
Kapilvastu Bal Mandir P. S.
1 ut aif{ a}+s df}hbft Carryover from the past 89430.08 106285.88 135468.08 175299.28 - 2 tna Salary 282791.00 341283.00 418253.00 530041.00 - 3 vfhf Sundry - - - 141024.00 - 4 k|zf;lgs vr{ Administrative 11000.00 16900.00 14711.00 - - 5 ljBfno Joj:yfkg / d;nFGb School Mgmt and Stationeries 900.00 900.00 900.00 46200.00 - 6 5fqj[lt Scholarship 15568.00 42891.00 21609.00 33434.00 - 7 kf7\ok:ts jfkt Curriculum - - 18015.00 19966.00 - ljBfno ;'wf/ School Sector Reform Program 30704.00 43512.00 19240.00 - - 8 ;fdflhs n]vfk/LIf0f jfkt Auditing Expenses - - 1000.00 1000.00 - hDdfhDdfhDdfhDdf Total 430393.08 551771.88 629196.08 946964.28 -
Shree P.S. 1 ut aif{ *!# a}+s vftf df}hbft Carryover from the past - - - 128857.44 72557.74 2 ut aif{ !^%#*\#! art Carryover from the past - - - 1233.29 1274.63 3 ut aif{ @&@^) art df}hbft Carryover from the past - - - 5312.25 5533.64 4 ut aif{ txljn ljBfno df}hbft Carryover from the past - - - - 42332.00

PUBLIC EXPENDITURE TRACKING STUDY ON PRIMARY EDUCATION IN NEPAL
45
District School SN Income head Fiscal Year
Description 2063/64 2064/65 2065/66 2066/67 2067/68 5 tna etf ;/sf/L Salary - - - 178808.00 180370.00 6 /fxt cgbfg a9 tna ;d]t Salary - - - 286200.00 286200.00
7 Non Salary P.C.F. Non-Salary - - - - 86590.00 8 k|zf;lgs vr{ Administrative - - - - 42000.00
9 SIP jfkt School Improvement Program - - - 63215.00 - 10 lgzNs kf7\ok:ts jfkt Curriculum - - - 43702.00 60145.00 11 Joj:yfkg vr{ jfkt Administrative - - - 40350.00 - 12 5fqj[lt 5fqf Scholarship - - - 22020.00 60800.00 13 5fqj[lt blnt Scholarship - - - 9400.00 11200.00 14 5fqj[lt ckfu+ Scholarship - - - 500.00 1000.00
15 P.C.F Psd'i7 PCF - - - 98571.00 126842.00 16 vfhf Joj:yfkg Sundry - - - 317304.00 363270.00 17 ljBfno ejg tyf zf}rfno lgdf{0f Physical Facilities Improvement - - - - 850000.00 18 uflj; cgbfg Psd'i7 VDC Grant - - - - 182600.00 19 l;bfy{ ;f lj s]Gb|af6 kmlg{r/ lgdf{0f NGO Grant - - - - 10000.00 20 lzIfs kf]zfs Teacher's Uniform - - - - 7500.00
21 ;fd'bflos/0f jfkt Joj:yfkg Community school capacity improvement program - - - - 100000.00
22 k|f]T;fxg cgbfg School Handover and Incentive Program - - - - 34000.00
23 ;fdflhs n]vfk/LIf0f jfkt Auditing Expenses - - - 1000.00 1000.00 24 ;/;kmfO School Improvement Program - - - 17000.00 - 25 k/LIff ;xof]u Administrative - - - 4798.00 18340.00 26 rGbf ;xof]u NGO Grant - - - 76220.50 103825.00 27 rGbf ;xof]u P.C.F. af6 PCF Donation - - - 21754.00 - 28 cGo rGbf ;xof]u NGO Grant - - - 2200.00 - 29 Aofh Interest from Bank - - - 117.00 172.62
hDdfhDdfhDdfhDdf Total - - - 1318562.48 2647552.63 Shree Mahendra P. S.
1 ut aif{sf] lhDd]jf/L Carryover from the past 217135.06 210017.23 160770.68 320252.03 - 2 tna etf lgsf;L Salary 455435.60 512747.00 584486.00 735241.00 - 3 d;nGb jfkt Stationeries 1200.00 1200.00 1200.00 7967.25 - 4 k|zf;lgs vr{ Administrative 11000.00 16900.00 11000.00 22000.00 - 5 kf7\ok:ts jfkt Curriculum - - - 32896.00 - 6 5fqj[lt Scholarship 17166.00 36750.00 29761.00 51686.00 - 7 lbjf vfhf sfo{s|d School Day Meal Program - - - 219672.00 - 8 Joj:yfkg nufot ljljw Administrative - 8257.00 130165.00 42642.75 -

PUBLIC EXPENDITURE TRACKING STUDY ON PRIMARY EDUCATION IN NEPAL
46
District School SN Income head Fiscal Year
Description 2063/64 2064/65 2065/66 2066/67 2067/68 9 ljBfno ;wf/ of]hgf School Improvement Program 34138.00 59015.00 55899.00 40000.00 - 10 ;]l/u+ af6 k|fKt Other 14675.00 14600.00 14800.00 15000.00 - 11 /fxt lzIfs sf]if t=d= Salary - 50240.00 87838.00 135006.00 - 12 ;3g ;xof]]u sfo{s|daf6 NGO Grant 119300.00 - - - - 13 hUufsf] cfo:yfaf6 School Own Source 10500.00 11000.00 26305.00 14100.00 - 14 sf]7f ef+8f af6 School Own Source 5640.00 5070.00 2900.00 1080.00 - 15 cGo ljjLw cfo School Own Source 25616.00 36491.05 30009.00 40021.65 - hDdfhDdfhDdfhDdf Total 911805.66 962287.28 1135133.68 1677564.68 -
Salyan Shree Siddha P. S.
1 ut aif{sf] df}hbft -lhDd]jf/L_ Carryover from the past 47250.14 96201.94 112915.54 437241.94 - 2 tna etf lgsf;L Salary 183640.00 284310.00 492440.00 442796.00 - 3 5fqj[lt Scholarship 6250.00 18840.00 27926.00 26100.00 - 4 kf7\ok:ts jfkt Curriculum 40200.00 36000.00 16668.00 16942.00 - 5 k|zf;lgs vr{ Administrative 11600.00 11000.00 - - -
6 Non salary Non-Salary - - - 45280.00 - 7 d;nGb tyf cGo Stationeries - 7500.00 7085.00 - - 8 zNsaf6 Fees - - - - - 9 k|dfgkqaf6 Fees - - - - - 10 uflj;af6 Local Government Grant - 73000.00 - 40000.00 - 11 ;+;b ljsf; sf]if Local Government Grant - - 15000.00 - - 12 ejg lgdf{0f Physical Facilities Improvement - - 550000.00 - - 13 ljBfno >f]t School Own Source - - - 43416.00 - 14 ljBfno ;wf/ of]hgf School Improvement Program - 13800.00 - - - hDdfhDdfhDdfhDdf Total 288940.14 540651.94 1222034.54 1051775.94 0.00
Shree Khadga Devi P. S.
1 a+}s c= Nof= Carryover from the past 24623.26 81571.46
- 134757.66 2 gub c= Nof= Carryover from the past - - - 3 jrt k|fKt Carryover from the past - - - - - 4 kf7\ok:ts jfkt Curriculum 44400.00 40500.00 15019.00 18109 - 5 tna etf lgsf;L Salary 583468.00 582500.00 540519.20 845108.00 -
6 Non Salary Non-Salary - - - 43200.00 - 7 k|zf;lgs vr{ Administrative 11000.00 16900.00 - 8 ljljw cfDbfgL Miscellaneous 61502.00 - 500.00 5200.00 - 9 5fqj[lt Scholarship 14250.00 24150.00 29022.00 24833.00 - 10 uflj;af6 Local Government Grant - - - 50000.00 - 11 cfwf/et lzIff District Education Office Grant - - - 12000.00 - 12 Aofh School Own Source - - - 186.56 - 13 sd{rf/L ;+rosf]if District Education Office Grant - - 94114.60 - -

PUBLIC EXPENDITURE TRACKING STUDY ON PRIMARY EDUCATION IN NEPAL
47
District School SN Income head Fiscal Year
Description 2063/64 2064/65 2065/66 2066/67 2067/68 14 hLjg ljdf District Education Office Grant - - 18000.00 - - 15 ejg dd{t Physical Facilities Improvement - - 1881.00 - - 16 sDKo"6/ Computer - 41000.00 67500.00 - - 17 n]]vfk/LIf0f Auditing Expenses - - 5000.00 - - 18 ljBfno Aoj:yfkg tyf ;'wf/ School Improvement Program 24500.00 - 10427.00 - - 19 sfo{no ;xof]lu tna Salary - - 15600.00 - - 20 gub df}hbft Bank Balance - - 134757.66 - - 21 d;nGb Miscellaneous 1500.00 1500.00 357.00 - - hDdfhDdfhDdfhDdf Total 765243.26 788121.46 932697.46 1133394.22 0.00
Shree Shikshya Mandir P.S
1 ut aif{ c= Nof Carryover from the past - 37272.74 45685.34 42568.54 - 2 tna etf lgsf;L Salary - 331228.00 427649.00 549615.00 - 3 5fqj[lt Scholarship - 11550.00 16137.00 16609.00 - 4 kf7\ok:ts jfkt Curriculum - 27000.00 16106.00 15693.00 - 5 k|zf;lgs vr{ Administrative - 11000.00 - - -
6 Non salary Non-Salary - - - 43480.00 - 7 ljBfno ;'wf/ School Improvement Program - - 17137.00 - - 8 d;nGb Miscellaneous - 900.00 - - - 9 cGo Miscellaneous - 8300.00 18137.00 - - 10 lkmN8 lgdf{0f Physical Facilities Improvement - - 45000.00 - - 11 cfwf/et lzIff Miscellaneous - - - 12000.00 -
hDdfhDdfhDdfhDdf Total - 427250.74 585851.34 679965.54 -
Note: SIP = School Improvement Program

PUBLIC EXPENDITURE TRACKING SURVEY FOR PRIMARY EDUCATION SECTOR IN NEPAL
48
Expenditure of Sampled Schools
Table 4b.1: Program-wise expenditure of the sampled schools
School 1: Shree Shanti Vidhyashram P.S, Lalitpur
SN Expenditure head
Fiscal Year
2063/64 2064/65 2065/66 2066/67
1 Salary 86% 81% 88% 64%
2 School Improvement Program 1% 0% 0% 0%
3 Curriculum 3% 2% 2% 1%
4 Scholarship 2% 2% 2% NA
5 Administrative 0.3% 0.2% 0.2% NA
6 Physical Facilities Improvement 4% NA NA NA
7 Uniform to Students 0% 0% 1% NA
8 Auditing Expenses 0% 0% 0% 1%
9 Sundry 4% 1% 0% 1%
10 Miscellaneous 0% 0% 0% 1%
School 3: Bal Mandir Primary School, Taulihawa, Kapilvastu
S.N Expenditure head
Fiscal Year 2063/64 2064/65 2065/66 2066/67 2067/68
1 Salary 90% 85% 97% 76% NA
2 Scholarship 4% 8% 0% 7% NA
3 Curriculum 4% 4% 2% 2% NA
4 Field Visit/ Education Tour 1% 1% NA NA NA
5 Physical Facilities Improvement NA 2% NA NA NA
6 Administrative NA NA 0.21% NA NA
7 Stationeries NA NA N A 0.29% NA
8 Sundry NA NA NA 13% NA
9 School Sector Reform Program 1% NA 0.16% NA NA
10 Auditing Expenses NA NA 0.22% 1% NA
11 Miscellaneous 0.46% 0.22% 0.20% 0.32% NA
School 2: Shree Darfe Devisthan Primary School, Darfe, Dolakha S.N
Expenditure Headings Fiscal Year
2063/64 2064/65 2065/66 2066/67 2067/68 1 Administrative 1% NA NA 2 Salary 90% 82% 81% NA NA 3 Scholarship 1% 1% 1% NA NA 4 Curriculum 1% 1% 1% NA NA 5 Stationeries 2% - 2% NA NA 6 Physical Facilities Improvement 4% 8% 12% NA NA 7 ECD - 7% NA NA 8 Field Visit - - 1% NA NA 9 NGO Grant -Scholarship - - 1% NA NA 10 Miscellaneous - 1% NA NA

PUBLIC EXPENDITURE TRACKING SURVEY FOR PRIMARY EDUCATION SECTOR IN NEPAL 49
School 4: Shree Mahendra Primary School, Taulihawa, Kapilvastu S.N
Expenditure head
Fiscal Year
2063/64 2064/65 2065/66 2066/67 2067/68
1 Salary 64% 68% 82% 69% NA 2 Stationeries 0.17% 0.15% 0.15% 0.63% NA 3 Administrative 3% 2% 6% 3% NA 4 Curriculum NA NA NA 3% NA 5 Scholarship 2% 3% NA 4% NA 6 School Day Meal Program NA NA NA 14% NA 7 School Improvement Program 6% 7% 6% 5% NA 8 Physical Facilities Improvement 0.03% 0.48% 3% 0.41% NA 9 NGO Grant 22% 15% NA NA NA 10 Miscellaneous 1% 0.28% 0.46% 1% NA
11 School Own Source-salary 3% 4% 2% 1% NA
School 5: Shree Primary School. Katuwa, Kapilvastu
S.N Expenditure head
Fiscal Year 2063/64 2064/65 2065/66 2066/67 2067/68
1 Salary NA NA NA 47% 42%
2 School Improvement Program NA NA NA 0.17% 22%
3 Curriculum NA NA NA 5% 4%
4 Administrative NA NA NA 1% 2%
5 Scholarship NA NA NA 4% 5%
6 Sundry NA NA NA 25% 22%
7 Physical Facilities Improvement NA NA NA 4% 1%
8 VDC Grant-return NA NA NA - 0.31%
9 Teacher's Uniform NA NA NA - 0.48%
10 Field Visit/ Education Tour NA NA NA - 0.24%
11 Auditing Expenses NA NA NA - 0.34%
12 Stationeries NA NA NA 0.18% 0.18%
13 Administrative NA NA NA - -
14 PCF Donation NA NA NA - -
15 Land purchase NA NA NA 13% -
16 Resource Center Fund NA NA NA 0.03% -
17 Miscellaneous NA NA NA 1% 0.35%
School 6: Shree Siddha Primary School, Hiwalcha, Madana, Salyan
S.N
Expenditure head
Fiscal Year
2063/64 2064/65 2065/66 2066/67 2067/68
1 Salary 88% 61% 72% 50% - 2 Scholarship 6% 2% 3% - 3 Curriculum 8% 3% 2% 2% - 4 Administrative 4% 5% 7% 1% - 5 Stationeries - - 1% 0.40% - 6 Physical Facilities Improvement - 25% 0.25% 0.02% - 7 Auditing Expenses - - 0.33% 0.30% - 8 School Improvement Program - - 16% 44% -

PUBLIC EXPENDITURE TRACKING SURVEY FOR PRIMARY EDUCATION SECTOR IN NEPAL 50
School 7: Shree Khadga Devi Primary School, Kalanga, Salyan
S.N
Expenditure head
Fiscal Year 2063/64 2064/65 2065/66 2066/67 2067/68
1 Salary 74% 93% 84% 82% - 2 Curriculum 2% 2% 2% 2% - 3 Stationeries 0.22% 0.40% 0.04% 1% - 4 Administrative 2% 12% - 5 School Improvement Program 13% 1% - 6 Scholarship 3% 3% 4% 2% - 7 Physical Facilities Improvement - - 0.24% - - 8 Computer - - 8% - - 9 Auditing Expenses - - 1% 0.29% - 10 Miscellaneous 6% 1% 0.06% - -
School 8: Shree Shikshya Mandir Primary School, Duldhara, Salyan S.N
Expenditure head
Fiscal Year 2063/64 2064/65 2065/66 2066/67 2067/68
1 Salary - 87% 80% 91% -
2 Scholarship - 3% 2% 3% -
3 Curriculum - 4% 4% 3% -
4 Administrative - 3% 2% 2% -
5 School Improvement Program - - 8% 1% -
6 Auditing Expenses - - 1% 0.31% -
7 Miscellaneous - - 1% 0.15% -
8 Physical Facilities Improvement - 0.24% 1% - -
9 Stationeries - 3% 0.46% - -
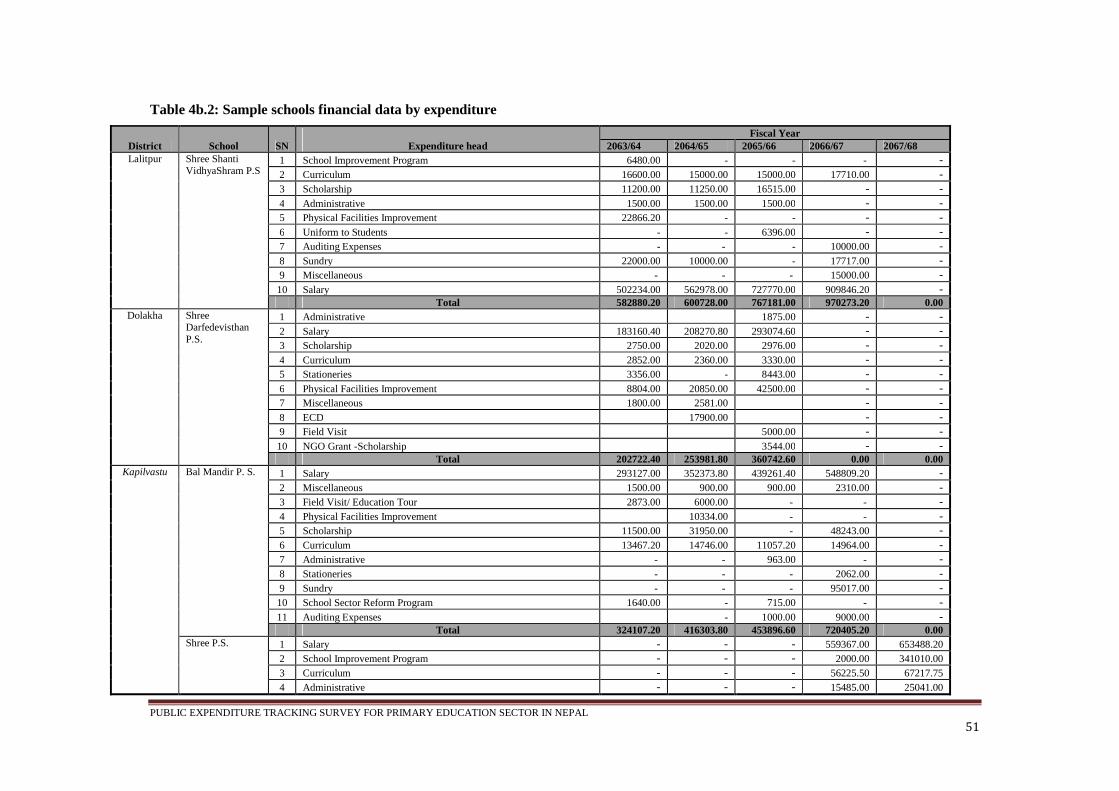
PUBLIC EXPENDITURE TRACKING SURVEY FOR PRIMARY EDUCATION SECTOR IN NEPAL
51
Table 4b.2: Sample schools financial data by expenditure
District School SN
Expenditure head Fiscal Year
2063/64 2064/65 2065/66 2066/67 2067/68 Lalitpur Shree Shanti
VidhyaShram P.S 1 School Improvement Program 6480.00 - - - - 2 Curriculum 16600.00 15000.00 15000.00 17710.00 - 3 Scholarship 11200.00 11250.00 16515.00 - - 4 Administrative 1500.00 1500.00 1500.00 - - 5 Physical Facilities Improvement 22866.20 - - - - 6 Uniform to Students - - 6396.00 - - 7 Auditing Expenses - - - 10000.00 - 8 Sundry 22000.00 10000.00 - 17717.00 - 9 Miscellaneous - - - 15000.00 - 10 Salary 502234.00 562978.00 727770.00 909846.20 - Total 582880.20 600728.00 767181.00 970273.20 0.00
Dolakha Shree Darfedevisthan P.S.
1 Administrative 1875.00 - - 2 Salary 183160.40 208270.80 293074.60 - - 3 Scholarship 2750.00 2020.00 2976.00 - - 4 Curriculum 2852.00 2360.00 3330.00 - - 5 Stationeries 3356.00 - 8443.00 - - 6 Physical Facilities Improvement 8804.00 20850.00 42500.00 - - 7 Miscellaneous 1800.00 2581.00 - - 8 ECD 17900.00 - - 9 Field Visit 5000.00 - - 10 NGO Grant -Scholarship 3544.00 - - Total 202722.40 253981.80 360742.60 0.00 0.00
Kapilvastu Bal Mandir P. S. 1 Salary 293127.00 352373.80 439261.40 548809.20 - 2 Miscellaneous 1500.00 900.00 900.00 2310.00 - 3 Field Visit/ Education Tour 2873.00 6000.00 - - - 4 Physical Facilities Improvement 10334.00 - - - 5 Scholarship 11500.00 31950.00 - 48243.00 - 6 Curriculum 13467.20 14746.00 11057.20 14964.00 - 7 Administrative - - 963.00 - - 8 Stationeries - - - 2062.00 - 9 Sundry - - - 95017.00 - 10 School Sector Reform Program 1640.00 - 715.00 - - 11 Auditing Expenses - 1000.00 9000.00 - Total 324107.20 416303.80 453896.60 720405.20 0.00
Shree P.S. 1 Salary - - - 559367.00 653488.20 2 School Improvement Program - - - 2000.00 341010.00 3 Curriculum - - - 56225.50 67217.75 4 Administrative - - - 15485.00 25041.00

PUBLIC EXPENDITURE TRACKING SURVEY FOR PRIMARY EDUCATION SECTOR IN NEPAL 52
District School SN
Expenditure head Fiscal Year
2063/64 2064/65 2065/66 2066/67 2067/68 5 Scholarship - - - 52724.00 83200.00 6 Sundry - - - 298040.00 348144.00 7 Physical Facilities Improvement - - - 42181.00 22069.00 8 VDC Grant-return - - - - 4800.00
9 NGO Grant - - - - 10 Teacher's Uniform - - - - 7500.00
11 Community school capacity improvement program - - - - 12 Field Visit/ Education Tour - - - - 3720.00
13 Auditing Expenses - - - - - 14 Stationeries - - - 2163.00 2895.00
15 Administrative - - - - - 16 NGO Grant - - - - - 17 PCF Donation - - - - - 18 NGO Grant - - - - - 19 Land purchase - - - 155000.00 - 20 Resource Center Fund - - - 400.00 -
21 Miscellaneous - - - 12809.70 5425.18 22 Auditing Expenses - - - - 5325.20 Total 1196395.20 1569835.33
Shree Mahendra P. S.
1 Salary 449436.80 545548.80 667856.00 868344.00 - 2 Stationeries 1200.00 1200.00 1200.00 7967.00 - 3 Administrative 18445.00 19440.00 48464.00 38843.00 - 4 Curriculum 32881.75 - 5 Scholarship 15050.00 21700.00 48551.00 - 6 School Day Meal Program 176120.00 - 7 School Improvement Program 38916.00 53000.54 52293.00 62170.00 - 8 Physical Facilities Improvement 240.00 3823.50 22647.00 5140.00 - 9 Salary - - - - - 10 NGO Grant 154680.00 121080.00 - - - 11 Miscellaneous 6003.00 2223 3759.00 13424.00 - 12 School Own Source-salary 17820.00 33500.00 18660.00 10975.00 - Total 701790.80 801515.84 814879.00 1264415.75
Salyan Shree Siddha P. S.
1 Salary 183640.00 261673.60 541606.40 583492.00 - 2 Scholarship 27450.00 12282.00 29821.00 - 3 Curriculum 17705.00 13520.00 16439.00 20652.00 - 4 Administrative 8393.00 20092.00 50000.00 16467.00 - 5 Non-Salary - - - - - 6 Stationeries - - 10035.00 4676.00 - 7 Fees - - - - - 8 Fees - - - - -

PUBLIC EXPENDITURE TRACKING SURVEY FOR PRIMARY EDUCATION SECTOR IN NEPAL 53
District School SN
Expenditure head Fiscal Year
2063/64 2064/65 2065/66 2066/67 2067/68 9 Local Government Grant - - - - - 10 Local Government Grant - - - - - 11 Physical Facilities Improvement - 105000.00 1900.00 250.00 - 12 Auditing Expenses - - 2500.00 3555.00 - 13 School Improvement Program - - 120000.00 515738.00 -
Total
209738.00
427735.60
754762.40
1174651.00
0.00
Shree Khadga Devi P. S.
1 Curriculum 14929.00 14680.00 15019.00 18109.00 2 Salary 504392.00 585817.00 668233.00 771986.00 3 Stationeries 1500.00 2500.00 357.00 8600.00 4 Administrative 11000.00 117232.00 5 Miscellaneous 38760.00 6200.00 500.00 6 Scholarship 23350.00 20700.00 29022.00 21400.00 7 Local Government Grant - - - - - 8 District Education Office Grant - - - - - 9 School Own Source - - - - - 10 District Education Office Grant - - - - - 11 District Education Office Grant - - - - - 12 Physical Facilities Improvement - - 1881.00 - - 13 Computer - - 67500.00 - - 14 Auditing Expenses - - 5000.00 2731.00 - 15 School Improvement Program 89740.00 - 10427.00 - - 16 Salary - - - - - 17 Bank Balance - - - - - 18 Miscellaneous - - - - - Total 683671.00 629897.00 797939.00 940058.00 0.00
Shree Shikshya Mandir P.S
1 Salary - 331228.00 436936.00 587631.00 - 2 Scholarship - 11550.00 11269.00 16609.00 - 3 Curriculum - 15972.00 20500.00 20000.00 - 4 Administrative - 9600.00 10500.00 11300.00 - 5 Non-Salary - - - - - 6 School Improvement Program - - 45000.00 8000.00 - 7 Auditing Expenses - - 6000.00 2000.00 - 8 Miscellaneous - - 3200.00 943.00 - 9 Physical Facilities Improvement - 900.00 7377 - - 10 Stationeries - 12315.00 2500.00 - - Total 381565.00 543282.00 646483.00

PUBLIC EXPENDITURE TRACKING SURVEY FOR PRIMARY EDUCATION SECTOR IN NEPAL
54
APPENDIX -5: QUESTIONNAIRE
Questionnaire for School Survey Date of Interview:___________ Interview Start Time:_______ Interview Finished Time:_______ I. General 1. Name of the School: 2. Establishment Date: 3. Address: 4. Name of the Respondent: 5. Respondent’s designation in school: 6. Ownership of School building: 1. School owned 2.Rented 3. Others
7. Area of the building? 8. Date of Establishment: 9. Years of Operations: 10. Number of total student 11. Number of student per class Class 1: Class 4:
Class 2: Class 5: Class 3: If possible provide number of student record for 2005 to 2010 ( See the Table below) Gross Enrollment: Net Enrollment:
2005 Grade 1 Grade 2 Grade 3 Grade 4 Grade 5
Enrollment Promoted Dropped Out Male Female
2006 Grade 1 Grade 2 Grade 3 Grade 4 Grade 5
Enrollment Promoted Dropped Out Male Female
2007 Grade 1 Grade 2 Grade 3 Grade 4 Grade 5
Enrollment
Promoted Dropped Out Male Female
2008 Grade 1 Grade 2 Grade 3 Grade 4 Grade 5
Enrollment
Promoted
Dropped Out
Male
Female
2009 Grade 1 Grade 2 Grade 3 Grade 4 Grade 5 Enrollment Promoted Dropped Out Male Female

PUBLIC EXPENDITURE TRACKING SURVEY FOR PRIMARY EDUCATION SECTOR IN NEPAL 55
II. Personal Information about head teacher
1. Name of Head Master 2. Gender 3. Age 4. Number of Years of teaching? 5. Number of years of being head Master? 6. Number of years as a head master this school? 7. Highest level of education of head master High School, Diploma, Under Graduate,
Masters, Post- Graduate, PhD III. Personal Information about teacher
1. How many teaching positions are officially allocated to this school?
2. How many types of teacher are appointed? 3. How many of these positions are actually filled? 4. How many of them are present and teaching in school today?
4.1 What was the reason for absentee’s teacher? 4.2 How long have they been absent? 4.3 How are classes being covered?
5. How many of the teachers has been fired or laid off in the past 12 months? What was the reason for firing the teacher?
6. How much does the primary teacher receive in salary each month? For each types of teacher
7. How is the teacher being paid? Check, Cash 8. Who pay to teacher? Govn. only, community, school, others 9. Are teachers being paid each month or others? E.g. once in a
three months,
Teacher’s information
S.N Name Gender Age Position Years of employment
Highest Education
Trained/ Untrained
1 2 3 4
Select any two teachers from above list and ask following questions Teacher 1 1. Name: 2. Home Address: 3. Do you think it is possible to support a family in this reason on the salary
that this teacher earns?
4. Does teacher have housing provided by school? 5. How many hours per week does this teacher work at the school? 6. Does the teacher have another job outside of school? 7. Do you have any issues in terms of payments? 8. Others Teacher 2 1. Name: 2. Home Address: 3. Do you think it is possible to support a family in this reason on the salary
that this teacher earns?
4. Does teacher have housing provided by school? 5. How many hours per week does this teacher work at the school? 6. Does the teacher have another job outside of school? 7. Do you have any issues in terms of payments? 8. Others

PUBLIC EXPENDITURE TRACKING SURVEY FOR PRIMARY EDUCATION SECTOR IN NEPAL 56
IV. Facilities
1. How many class rooms are there in school? How many of them are useable? 2. If there is any seepage or damage in the class rooms? If yes, explain how long it has
been there and why it hasn’t been repaired?
3. What is the number of inadequate class room? 4. Does each class have black board? If no, find reason if possible 5. Does each class have desk and benches? If no, find reason if possible 6. Does this school have a library ? Estimate the number of books 7. Does school have playground? 8. Does school have extracurricular activities facility ? Like sports, computers etc 9. Is there any issue with the logistic and facility in the school? 10. Are there enough working toilets for the students to use? 11. Are there separate toilets for girls? 12. How many of the classrooms in the school have electricity? 13. What is the main source of drinking water at the school? 14. Is the school surrounded by the fence? 15. How do student have their lunch? 16. Is there any staff room? 17. Does school receive newspaper? 18. How do they get their teaching material? 19. What would be the cost of teaching materials?
a) Grade 1 b) Grade 2 c) Grade 3 d) Grade 4 e) Grade 5
20. When did they received the text book for a) Grade 1 b) Grade 2 c) Grade 3 d) Grade 4 e) Grade 5
V. Location Distance and School Choice 1. Is the school located in urban or rural area? 2. What is the population of the village/ town where school is located?
3. What other VDC or towns do students at this school come from? ( List up to three ranked according to largest number of students to this school)
4. How far away is each of the villages? 5. How would you get to each of these villages? 6. Are there any other schools that students can go instead of this one?
7. Name other schools that are there in this catchments and their type
8. What are the main reasons that parents or children choose this school? VI. Organization and Governance 1. Does school have School Management Committee (SMC)? 2. How many people are there in SMC? 3. How many times do SMC meets? 4. When was the last meeting? 5. What are the major agenda during SMC meetings? 6. Does the school have Parents Teacher Association? 7. Who has the most say in
a) Approving the budget
b) Designing the curriculum c) Setting the level of fees at this school d) Choosing the teachers e) Assessing teachers f) Deciding on maintenance work at this school
Others

PUBLIC EXPENDITURE TRACKING SURVEY FOR PRIMARY EDUCATION SECTOR IN NEPAL 57
Questionnaire for District Education Officer Date of Interview: ___________ Interview Start Time: _______ Interview Finished Time: _______ Address: ________________________ I. General Name of the Respondent: Respondent’s designation in: Years of Service Years of Service at this district How many community schools are within the district?
How many are primary schools only? How many are primary plus other level? How many private schools are within the district?
How many are primary private schools?
How do they plan to build the physical facility of the schools?
II. Budget
1. What was the allocated total budget and expenditure made in last 5 years for your district? Please provide the programs-wise information as per the following Table
Program 2005/06 2006/07 2007/08 2008/09 2009/10
Budget Exp Budget Exp Budget Exp Budget Exp Budget Exp
2. What were the reasons that failed to fully utilize the allocated budget? Please provide the reasons in
order of priority. a) b) c) d)
3. If the reason is associated with the delay in fund release, explain the budget flow mechanism from center to DEO, and from DTCO to DEO
a) Scheduled date for fund release b) Actual date that DEO received the budget c) Lack of documents for submission to DTCO d) Gap between (a) and b) in terms of days
4. How are the program executed in which there is no clear demarcation roles and responsibilities of
central and districts? Who utilizes the fund?

PUBLIC EXPENDITURE TRACKING SURVEY FOR PRIMARY EDUCATION SECTOR IN NEPAL 58
5. Of the programs mentioned in (1), which of them are implemented by schools, which of them by DEO, and which of them jointly?
6. If the program is directly implemented by schools, please, explain the budget flow mechanism from
DEO to school. Please explain how many days it takes to reach the budget to schools.
7. How the delay factor in releasing the budget affected the access, equity and quality of education in general and public schools in particular?
8. Why only little improvement is seen in access, equity and quality of education in spite of those
programs that could fully utilize the allocated budget. III Supervision and Monitoring
1. How often supervision and monitoring of the project and programs, and of public schools? What problems you noticed in your supervision in terms of efficiency, equity and quality of education?
2. Do you have a copy of supervision report? If yes, please, provide us a copy of the report. If not please
list out the contents of your report in order of priority IV. Recommendations
1. What is the status of the programs? Physical and Financial status. Please provide M&E report if conducted
2. What are the school level programs in this district?
3. What is the budgeting and financing mechanism for the school level program?
4. What is the role of DEO in school financial audit and how are the audit findings addressed?
III. Teachers
1. How many types of teachers are now at school in this district?
2. How do they access the quality of the teacher?
3. What is the frequency or system for school inspection?
4. What are the issues for the quality of teachers? VII. Supervision and Accountability 1. How many times did the school inspector visit in last five years? 2. What was the purpose of the inspector’s visit? 3. What was the specific purpose of last visit by inspector? 4. What kind of feedback did he /she gave? Any written feedback
5. What outside officials made visits to this school? Like DEO, Secretary of Ministry etc. 6. Others
VIII. School Source of Funding 1. Source In 2005 In 2006 In 2007 In 2008 In 2009 National Government Local government NGOs Fees Others

PUBLIC EXPENDITURE TRACKING SURVEY FOR PRIMARY EDUCATION SECTOR IN NEPAL 59
2. How much was the school entitled to receive from this source? Source In 2005 In 2006 In 2007 In 2008 In 2009 National Government Local government NGOs Fees Others Note: 3. On what schedule were the funds from the source disbursed? 1= All at once, 2= Two or more trances, 3= monthly, 4= trimester 5= other ( Please circle the response) Source In 2005 In 2006 In 2007 In 2008 In 2009 National Government 1 /2/ 3/ 4/ 5 1 /2/ 3/ 4/ 5 1 /2/ 3/ 4/ 5 1 /2/ 3/ 4/ 5 1 /2/ 3/ 4/ 5 Local government 1 /2/ 3/ 4/ 5 1 /2/ 3/ 4/ 5 1 /2/ 3/ 4/ 5 1 /2/ 3/ 4/ 5 1 /2/ 3/ 4/ 5 NGOs 1 /2/ 3/ 4/ 5 1 /2/ 3/ 4/ 5 1 /2/ 3/ 4/ 5 1 /2/ 3/ 4/ 5 1 /2/ 3/ 4/ 5 Fees 1 /2/ 3/ 4/ 5 1 /2/ 3/ 4/ 5 1 /2/ 3/ 4/ 5 1 /2/ 3/ 4/ 5 1 /2/ 3/ 4/ 5 Others 1 /2/ 3/ 4/ 5 1 /2/ 3/ 4/ 5 1 /2/ 3/ 4/ 5 1 /2/ 3/ 4/ 5 1 /2/ 3/ 4/ 5 Note: 4. How much delay was there in receipt of these funds? 1= None, 2= Less than two weeks, 3= 1 months, 4= 2 months 5= other Source In 2005 In 2006 In 2007 In 2008 In 2009 National Government 1 /2/ 3/ 4/ 5 1 /2/ 3/ 4/ 5 1 /2/ 3/ 4/ 5 1 /2/ 3/ 4/ 5 1 /2/ 3/ 4/ 5 Local government 1 /2/ 3/ 4/ 5 1 /2/ 3/ 4/ 5 1 /2/ 3/ 4/ 5 1 /2/ 3/ 4/ 5 1 /2/ 3/ 4/ 5 NGOs 1 /2/ 3/ 4/ 5 1 /2/ 3/ 4/ 5 1 /2/ 3/ 4/ 5 1 /2/ 3/ 4/ 5 1 /2/ 3/ 4/ 5 Fees 1 /2/ 3/ 4/ 5 1 /2/ 3/ 4/ 5 1 /2/ 3/ 4/ 5 1 /2/ 3/ 4/ 5 1 /2/ 3/ 4/ 5 Others 1 /2/ 3/ 4/ 5 1 /2/ 3/ 4/ 5 1 /2/ 3/ 4/ 5 1 /2/ 3/ 4/ 5 1 /2/ 3/ 4/ 5 5. What procedure did the school go through to get this kind of funds?
I. National Government
II. Local Government III. NGOs IV. Fees ( other than tuition fee) V. Others
6. Did the funding come earmarked for certain categories of spending? Yes / No 7. If so, what categories of spending was this source of funding intended for? Paying Staffs 1= Paying Staffs, 2= Scholastic material, 3= Maintenance, 4= Admin 5= Special Programs, 6=Construction or expansion of facilities 7= Other Source In 2005 In 2006 In 2007 In 2008 In 2009 National Government Local government NGOs Fees Others 8. How much is the budget allocated in following items and others each year Source In 2005 In 2006 In 2007 In 2008 In 2009 Salary Administration Costs Maintenance Utilities Others

PUBLIC EXPENDITURE TRACKING SURVEY FOR PRIMARY EDUCATION SECTOR IN NEPAL 60
9. How much is the budget spent in following items and others each year Source In 2005 In 2006 In 2007 In 2008 In 2009 Salary Administration Costs Maintenance Utilities Others 10. Does school have yearly audit? Can they provide the copy of the report? 11. How many numbers of scholarships are distributed in school for the student?
12. How many types of scholarships are provided?
13. What is the budget for each type of scholarship? 14. What is the total budget for scholarship?
IX. Quality Records 1. Does school keep receipts from its spending? 2. Does school have school calendar and do they follow it?
3. Record keeping system