nepal: program budgeting and benefit incidence analysisprad-nepal.com/add_study/pbia_final_rep_march...
TRANSCRIPT

PROGRAM BUDGET AND BENEFIT INCIDENCE ANALYSIS
OF PUBLIC EXPENDITURE ON
HEALTH, EDUCATION AND DRINKING WATER SECTOR
IN NEPAL1
STRENGTHENING INSTITUTIONS TO IMPROVE PUBLIC EXPENDITURE ACCOUNTABILITY PROJECT
Submitted to Global Development Network (GDN)
& Result for Development (R4D)
Submitted by Policy Research and Development Nepal (PRAD)
October, 2010
1 The study is a part of the GDN/DFID supported program on Strengthening Institutions to Improve Public Expenditure
Accountability.
PROGRAM BUDGET AND BENEFIT INCIDENCE ANALYSIS OF PUBLIC EXPENDITURE ON
HEALTH, EDUCATION AND DRINKING WATER SECTOR
IN NEPAL
STRENGTHENING INSTITUTIONS TO IMPROVE PUBLIC EXPENDITURE ACCOUNTABILITY PROJECT
Submitted to Global Development Network (GDN)
& Result for Development (R4D)
Study Team Prithvi R. Ligal (Team Leader)
Prof. Dr. Devendra P. Shrestha (Health Sector) Kishor Maharjan (Education Sector)
Dadhi Adhikari (Drinking Water Sector)
Submitted by Policy Research and Development Nepal (PRAD)
October, 2010

Acknowledgement Policy Research and Development Nepal (PRAD Nepal) wishes to express its sincere gratitude to GDN
and R4D for giving us opportunity to work under their global study project entitled ” Strengthening
Institutions to Improve Public Expenditure Accountability”. We appreciate the technical support and
valuable inputs provided during different stages of the project. We are particularly indebted to Ms.
Ramona Angelescue, Ms. Savi Mull, Ms. Courtney Tolmie and Dr. Charles Griffin for their technical
and other support during the study. Ms. Pooja Sarin of GDN deserves thanks for her support in
making our job easier.
We would like to appreciate the support provided by Ministry of Finance, Financial Comptroller
general’s office, Auditor general’s office, Central Beuro of Statistics, Ministry of education, ministry
of Health and Department of Drinking Water and sanitation for providing us information on the
subject and also in sharing their views on the topics. We would also like to thank the Local
Development Officers of the sampled DDCs, Executive Officers of the sampled Municipalities and all
the Secretaries of the sampled VDCs in sharing their budgetary records and assistance during the
field survey.
Special thanks go to all the Household of the sampled VDCs who share their valuable time in
responding the survey questionnaire. Similarly, to the selected school management committee and
the teachers and other government and Local Bodies officials who helped us in collecting data and in
sharing their own views on the areas of our concern.
We have also greatly benefited from the participants representing policy making bodies, line
agencies and academics at the policy level dissemination seminar organized by PRAD Nepal on the
key findings of the present report. We thank them all for their valuable comments and suggestions.
Last but not the least; we take this opportunity to thank all the resource persons and the partner
organizations in the Washington and the Prague seminar in sharing their expertise.
Prithvi R Ligal October, 2010
Team leader

NEPAL AT A GLANCE
Population mid-2009 27.5 millions
Crude Birth Rate 29 per 1000
% population urban 17
GNI PPP per capita (US $) 2008 1120
HDI –Rank/Value (2005) 142/0.534
Health
Crude Death Rate 9 per 1000
Life Expectancy at Birth
Both Sexes 64
Males 63
Females 64
Neonatal Mortality (per 1000 live births) 33
Infant Mortality Rate (per 1000 live births) 48
Under 5 Mortality Rate 61
Maternal Mortality Rate (per 100,000 live birth0 281 (2005)
Total Fertility Rate 3.1
CPR (all methods) 48%
% of population with HIV/AIDS (15-49 ages) 0.5
Total Health Expenditure as % of GDP (2005/06) 5.3
Per Capita Government Health Expenditure (US $) 8
Education
Adult Literacy Rate (%)
Total 52
Male 70
Female 38
Drinking Water and Sanitation
Renewable internal fresh water resources per capita (cubic meters) (year 2007) 7051.482
Improved water source (% of population with access) (Year 2006) 89 %1
Percentage of household using piped water 453
Percentage of household using hand pump/ boring 39.12
Percentage of household having modern flushing toilet 25.42
Percentage of household having ordinary toilet 23.42
2 WDI
3 Nepal Labor Force Survey 2008

Figure 1 — District Map of Nepal and Survey Districts
Humla
Mugu
Sankhuwa
Solu
Rasuwa
Rolpa
Dolpa
Mustan
g
Manang
Juml
a
Kalikot
Dolakha
Bajura
Bajhang
Darchula
Salyan
Achham
Doti
Dadeldhur
a
Baitad
i
Jajarkot
Dailek
h
Rukum
Myagdi
Baglung
Lamjung
Gorkha
Dhading
Nuwakot
Kavre
e
Ramechha
ap
Okhaldhung
a
Khotang
B
ho
jp
ur
Dhankut
a
Tehrat
hum
Panchth
ar
Ilam
Sindhuli
Makawanpur
Tanahu
Sya
ngja
Palp
a
Gulmi
Arghak
hachi
Py
ut
ha
n
Kanchanp
ur
Kailali
Bardiya
Banke
Dang
Kapilv
astu
Rupan
dehi
Nawalparasi
Chitwan
Parsa
Bara
R
a
u
t
a
h
a
t
Sarlahi
M
Dh
an
us
ha
Siraha
Saptari
Sunsari
Mor
ang
Jhapa
P
a
r
b
a
t
Udaypur
K
L
Surkhet
Sindh
upalch
owk
B
Taplejung
Kaski
Survey Districts

Acronyms ADB Asian Development Bank
BIA Benefit Incidence Analysis
CBS Central Bureau of Statistics
CDR Central Development Region
DDC District Development Committee
DFID Department for International Development (UK)
EDR Eastern Development Region
EFA Education for All
FINIDA Finnish Development Agency
FWDR Far Western Development Region
FY Fiscal Year
GDN Global Development Network
GoN Government of Nepal
HH Households
I/NGO International/ Non - Governmental Organization
IDA International Development Agency
LDO Local Development Officer
LSGA Local Self Governance Act
MDGs Millennium Development Goals
MOHP Ministry of Health and Population MOHP
MWDR Mid -Western Development Region
NIP National Immunization Program
NLSS II Nepal Living Standard Survey II
NRs Nepalese Rupees
PBA Program Budget Analysis
PEM Public Expenditure Management
PSU Primary Sampling Units
SDC Swiss Development Corporation
SSR School Sector Reform
TYIP Three Year Interim Plan
UNICEF United Nations Children's Fund
VDC Village Development Committee
WB The World Bank
WDR Western Development Region WFP World Food Program

Abstract
This study is a part of a larger project on Strengthening Institutions to Improve Public Expenditure
Accountability undertaken by GDN and R4D with the funding support from DFID. As a part of the
project activities, the present study analyses the trends and patterns of government expenditure
over the period of five years during FY 2005/06 to 2009/10 on education, health and drinking water.
The analyses helped in identifying various issues associated with public expenditure management in
Nepal. The study also attempted to undertake the benefit incidence analysis of all three sectors to
examine the extent of benefits of public services enjoyed by different segment of the people.
Government expenditure on health as a whole is steadily increasing in Nepal. However, this trend
has reversed during 2008/09 and 2009/10. Recurrent expenditure continues to claim
overwhelmingly larger share of more than three – fourths of the total health expenditure in the
country. in recent years most of the increase in health sector funding appears to have been
channeled away from primary health care (health centers/dispensary) to other services. Largest
share of donors support is in the area of preventive services in which donors share account more
than 85 percent of the total expenditure. The benefits of heath care services are availed more by
highest expenditure quintile and less by lowest expenditure quintile indicating the incidence of the
benefit in favor of highest income/expenditure quintile.
Total public sector expenditure in drinking water sector is less than 5%, which does not indicate a
high priority sector. Domestic funding is picking up for expenditures in drinking water sector and the
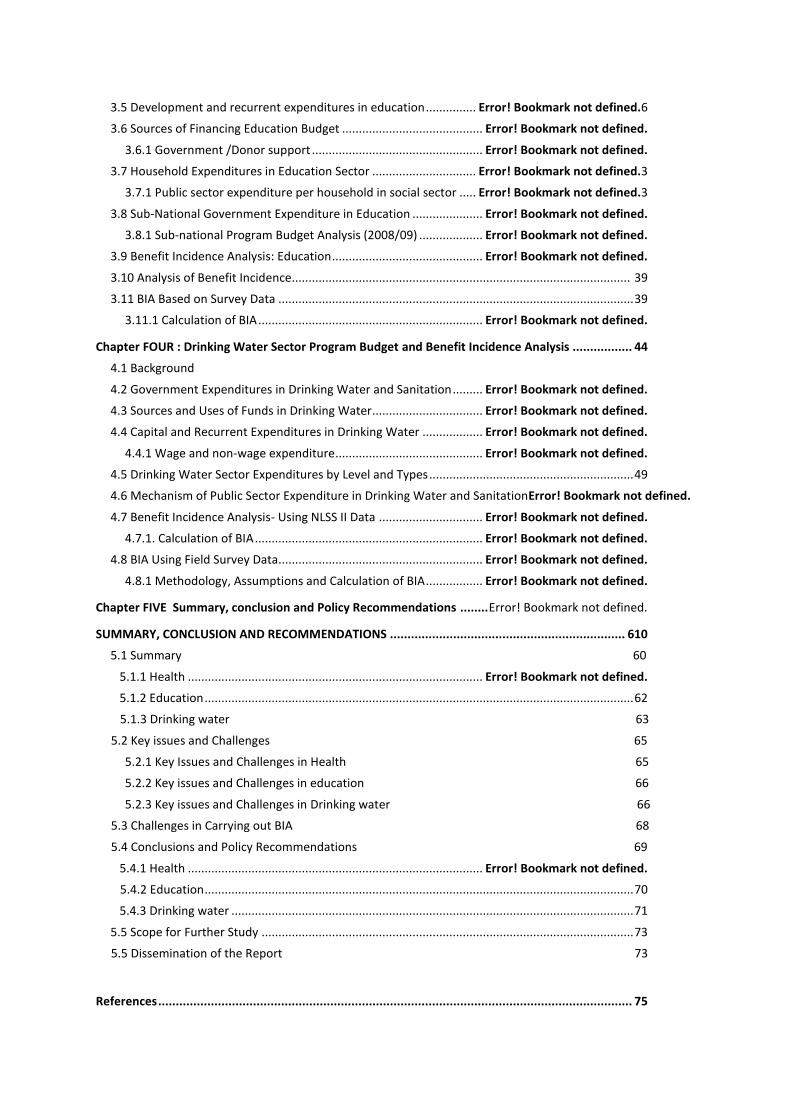
donor contribution is gradually going down. Over time the proportion of capital (development)
expenditures has been increasing, and has reached to 93% of the total expenditure. This can be
considered that the expenditure is efficient in that the increased expenditure is more diverted to
expanding drinking water and sanitation services. The public expenditure in drinking water and
sanitation is slightly dominated by private connections, which is less pro-poor. While the distribution
of benefits by quintile is not too skewed towards any quintile group, which is a positive aspect in the
sector, the domination of private connections over public tap-stands is an issue that should be given
attention.
More than half of government expenditure in education is spent on primary education. Wage and
salary constitutes the largest item of expenditure in primary school. Development expenditure in
education is much lower than recurrent expenditures. Education subsidies are much higher in
tertiary education.
Different communication strategies have been suggested to influence the policy makers and stake
holders so that better results could be obtained from the public expenditure in education, health
and drinking water.

Table of Contents
Acknowledgement ............................................................................................................................ iii
Nepal at a glance iv
District map of Nepal and surveyed districts v
Acronyms vii
Abstract .......................................................................................................................................... ivii
Chapter ONE: Introduction ................................................................................................................ 1
1.1 Context ........................................................................................................................................... 1
1.2 Objectives ....................................................................................................................................... 1
1.3 Methodology .................................................................................................................................. 2
Household Survey ................................................................................................................................ 3
1.3.1 Techniques Used in the Estimation of Benefit Incidence........................................................ 4
1.3.2 Assumptions ............................................................................................................................ 7
1.4 Study Limitation 7
Chapter TWO : Health sector Program Budget and Benefit Incidence Analysis 9
2.1 Background 9
2.2 Trends in Health Expenditure 9
2.2.1 Health expenditure/GDP ratio 10
2.2.2 Per capita health expenditure 10
2.3 Recurrent and Capital Expenditure ........................................................................................... 111
2.3.1 Wage and Non-Wage within Recurrent Expenditure ......................................................... 122
2.4 Health Sector Spending by Facility ............................................................................................. 133
2.5 Health Budget and Role of Donors Assistance ............................................................................. 15
2.6 Health Expenditure by Funding Source ........................................................................................ 16
2.7 Health Sector Expenditure at Sub-national level 17
2.8 Benefit Incidence Analysis: NLSS II Data..................................................................................... 178
2.8.1 Steps Involved in the Calculation of Benefit Incidence ......................................................... 18
2.8.2 Results and Discussion - Benefit Incidence .......................................................................... 20
2.9 Benefit Incidence Analysis: Field Survey Data 21
Chapter THREE : Education Sector Program Budget and Benefit Incidence Analysis ........................ 23
3.1 Background 23
3.2 Trends in Educational Expenditures 23
3.3 Education Expenditures by Level................................................................................................ 234
3.3.1 Primary education .................................................................... Error! Bookmark not defined.
3.3.2 Secondary Education ............................................................... Error! Bookmark not defined.
3.3.3 Tertiary/Higher Education ....................................................... Error! Bookmark not defined.
3.3.4 Other Education ....................................................................... Error! Bookmark not defined.
3.3.5 Ministerial and Regional Administration ................................. Error! Bookmark not defined.
3.4 Government Expenditure and Subsidies in Education .................... Error! Bookmark not defined.
3.5 Development and recurrent expenditures in education ............... Error! Bookmark not defined.6
3.6 Sources of Financing Education Budget .......................................... Error! Bookmark not defined.
3.6.1 Government /Donor support ................................................... Error! Bookmark not defined.
3.7 Household Expenditures in Education Sector ............................... Error! Bookmark not defined.3
3.7.1 Public sector expenditure per household in social sector ..... Error! Bookmark not defined.3
3.8 Sub-National Government Expenditure in Education ..................... Error! Bookmark not defined.
3.8.1 Sub-national Program Budget Analysis (2008/09) ................... Error! Bookmark not defined.
3.9 Benefit Incidence Analysis: Education ............................................. Error! Bookmark not defined.
3.10 Analysis of Benefit Incidence..................................................................................................... 39
3.11 BIA Based on Survey Data .......................................................................................................... 39
3.11.1 Calculation of BIA ................................................................... Error! Bookmark not defined.
Chapter FOUR : Drinking Water Sector Program Budget and Benefit Incidence Analysis ................. 44
4.1 Background
4.2 Government Expenditures in Drinking Water and Sanitation ......... Error! Bookmark not defined.
4.3 Sources and Uses of Funds in Drinking Water ................................. Error! Bookmark not defined.
4.4 Capital and Recurrent Expenditures in Drinking Water .................. Error! Bookmark not defined.
4.4.1 Wage and non-wage expenditure ............................................ Error! Bookmark not defined.
4.5 Drinking Water Sector Expenditures by Level and Types ............................................................. 49
4.6 Mechanism of Public Sector Expenditure in Drinking Water and SanitationError! Bookmark not defined.
4.7 Benefit Incidence Analysis- Using NLSS II Data ............................... Error! Bookmark not defined.
4.7.1. Calculation of BIA .................................................................... Error! Bookmark not defined.
4.8 BIA Using Field Survey Data............................................................. Error! Bookmark not defined.
4.8.1 Methodology, Assumptions and Calculation of BIA ................. Error! Bookmark not defined.
Chapter FIVE Summary, conclusion and Policy Recommendations ........ Error! Bookmark not defined.
SUMMARY, CONCLUSION AND RECOMMENDATIONS ................................................................... 610
5.1 Summary 60
5.1.1 Health ........................................................................................ Error! Bookmark not defined.
5.1.2 Education ................................................................................................................................ 62
5.1.3 Drinking water 63
5.2 Key issues and Challenges 65
5.2.1 Key Issues and Challenges in Health 65
5.2.2 Key issues and Challenges in education 66
5.2.3 Key issues and Challenges in Drinking water 66
5.3 Challenges in Carrying out BIA 68
5.4 Conclusions and Policy Recommendations 69
5.4.1 Health ........................................................................................ Error! Bookmark not defined.
5.4.2 Education ................................................................................................................................ 70
5.4.3 Drinking water ........................................................................................................................ 71
5.5 Scope for Further Study ............................................................................................................... 73
5.5 Dissemination of the Report 73
References ....................................................................................................................................... 75

Annexure
Annex 1.1 — List of Sampled VDCs and Municipality and Household Interviewed 77
Annex 2.1 — Recurrent and Development Spending by Facility Level Amount – Health 77
Annex 2.2 — Health Sector/Program Project Classification by Budget Head 80
Annex 2.3 --- Calculation of Concentration Index 81
Annex 4.1 – Use of Drinking Water Services by Quintile for the five sample districts 83 Annex 4.2 — Price Paid for Drinking Water by Region and Types of Connection 84
Annex 4.3 — Calculation of Concentration Index: Drinking Water rinking Water ............................ 84

Chapter ONE
Introduction
1.1 Context
It has often been claimed that public spending in Nepal has not been able to bring desired
expenditure outcome. Number of factors is attributed for such a state of affairs. Deficiencies in
budget planning along with resource allocation and expenditure management process have been
identified as some of the key contributing factors for the low expenditure outcome. A High Level
Public Expenditure Commission in its report which was submitted on May 2008 identified weak
financial structure, inability of prioritizing projects, inefficient implementation and lack good
governance as the major constraints in public expenditure management. Previous studies have
documented several weaknesses in public expenditure system in Nepal which includes: (i) heavily
over programmed budget; (ii) little prioritization of the budget; (iii) weak institutional mechanisms
for project screening and expenditure management; (iv) faulty fund release process. Institutional
weaknesses have continued to remain the most critical set of factors affecting project
implementation and effectiveness of public spending across sectors in Nepal. The problem is further
compounded by the fact that the existing civil institutions are so weak to hold governments
accountable for unsatisfactory public expenditure outcome. There is a perceived lack of capacity
within institutions to undertake high quality monitoring, analysis, and communication of public
expenditure management (PEM) practices, particularly in regard to sectors of high development
significance.
It is in this background the project “Strengthening Institutions to Improve Public Expenditure
Accountability” aims to provide opportunities and mechanisms for strengthening the capacity of
country based institutions so that these institutions could influence governments through their
evidence based research in better public expenditure management which has significant impacts on
development and equity.
1.2 Objectives
The overall objectives of the present study are to analyze the pattern and effectiveness of public
expenditure in Nepal. The specific objectives of the study, however, are:
To analyze the trends and patterns of program budget expenditure in education, health and
drinking water sector;
To undertake the benefit incidence analysis of public expenditure in education, health and
drinking water services; and

To recommend and execute strategies to influence policy makers for better public expenditure
management in Nepal
1.3 Methodology 1.3.1 Data Sources and Types
The design for the present project involved the use of both secondary and primary data.
Secondary Source of Data
Annual Red Book and Economic Survey published by the Ministry of Finance provided information on
program budget by sources including allocation, release and expenditure. Further, Annual Reports of
the Auditor General also provide the audited expenditure data by projects. Five years data (2005/06
to 2009/10) on program budget for three sectors viz., education, health and drinking water have
been gathered from these two sources. The data sheets obtained were examined and verified before
carrying out program budget and expenditure analysis. In the process of analysis the budget heads
were classified and reclassified to suit the need of GDN format of PBA. Data published in the Annual
Reports of respective ministries have been used to analyze program budget and BIA. In the case of
health sector Nepal National Health Accounts II (2004-2006) data have also been used for analysis.
For the sake of carrying out benefit incidence analysis existing survey data have been reviewed and
used for the analysis. Nepal Living Standard Survey 2003/04 (NLSS II) is the second multi-topic
national household survey conducted by the Central Bureau of Statistics (CBS) from April 2003 to
April 2004. The first NLSS was conducted in 1995/96. Both the surveys are the nationally
representative household survey. NLSS II follows the World Bank’s Living Standards Measurement
Survey (LSMS) methodology and uses a two stage stratified sampling frame. The Survey enumerated
3912 households from 326 Primary Sampling Units (PSU) of the country. In addition to these cross
sectional households NLSS II interviewed 1160 households from 95 panel PSUs (962 out of 1160
were panel households that were also interviewed in NLSS I).
The Survey solicited information on access to and utilization of services on social services such as
education, health and drinking water. In education the survey gathered data on literacy, past and
current enrolment by grade and type of educational institutions (community/private) of those
currently attending school/college. In health services, the survey collected data on chronic illness of
household members, illness and injuries, place of consultation (government facility/private). The
survey also solicited information on out of pocket expenses by types in education (level of
education), health (types of services) and drinking water. Nepal Living Standard Survey II has been
used to undertake the benefit incidence analysis.
The present study has thus made the best use of all available secondary data including public data
sources.

Primary Data
The collection of primary data involves two surveys: (i) Survey of Local Bodies (LBs) and (ii)
Household Survey.
A. Local Bodies Survey
Local Bodies (LBs)4 in Nepal are required to spend a part of their annual revenue on social sector
development such as health, education and drinking water. Survey of LBs was carried out to assess
their annual expenditure pattern in social sectors. In the first stage five districts and its
corresponding District Development Committees (DDCs) across the country representing ecological
and development region were selected. In the second stage one Municipality and five Village
Development Committees (VDCs) were purposively selected from respective sampled districts.
Information pertaining to expenditure of these LBs in health, education and drinking water were
gathered. The list of surveyed districts is shown in Table 1.1
B. Household Survey
Besides, the present study also conducted its own survey in five districts across the country
representing both ecological and development region of the country as mentioned above.
Household survey was conducted in five districts namely, Chitwan, Kailali, Kavre, Dolakha and Kaski.
From each of these districts, besides District Development Committees (DDCs), five Village
Development Committees (VDCs) and one Municipality were selected for collecting local bodies’
expenses on education, health and drinking water sector as well as for the household survey of
beneficiaries. This resulted into 5 DDCs, 25 VDCs and 5 Municipalities in total. VDCs represented the
rural cluster and Municipality represented the urban cluster for household sampling. 20 households
from rural (VDC) and 25 households from urban (Municipality) cluster were randomly selected
resulting to a total of 100 rural household (20x5) and 25 urban (25x1) households from each
surveyed district. A total of 625 households (500 rural and 125 urban) were interviewed for
gathering required information about access to drinking water, education and health services.
The field survey was conducted in two phases. In Phase one the survey was conducted in three
districts viz., Kaski, Kavre and Kailali and in the remaining two districts (Dolakha and Chitwan) survey
was conducted in Phase Two. The survey was carried out during August/September 2009. Chitwan
and Kailali districts belonged to lowland part of Nepal, popularly known as Terai while remaining
three districts are in Hilly region.
The distribution of sample districts representing different ecological regions and the household
interviewed in rural and urban cluster is presented in Table 1.1. The VDCs in each district were
selected in consultation with the LDO of the DDCs to make the sample VDCs representative of
different developmental and location features of the districts.
4 Local Bodies in Nepal is represented by 75 District Development Committees (DDCs), 58 Municipalities and 3915 Village
Development Committees.

Table 1.1: Distribution of rural and urban clusters and households interviewed by surveyed districts
Sample District No. of Sampled Cluster Households Interviewed Ecological Representation
Rural Urban Rural Urban Total
Dolakha 5 1 100 25 125 Mountain (CDR)
Kavre 5 1 100 25 125 Hill (CDR)
Kaski 5 1 100 25 125 Hill (WDR)
Chitwan 5 1 100 25 125 Terai (CDR)
Kailali 5 1 100 2 126 Terai (FWDR)
Sample VDCs and Municipalities by districts and households interviewed are presented in Annex 1.1 Districts selected are shown in the Map of Nepal.
1.3.2 Techniques Used in the Estimation of Benefit Incidence
Benefit Incidence Analysis (BIA) describes the distribution of government expenditure across
individuals ranked by their living standards. On the basis of this distribution, one can assess whether
government expenditure is consistent with narrowing the relative, or even the absolute, gap
between the living standards of the rich and the poor. According to (Demery, 2000), calculation of
Benefit Incidence involves three basic steps i.e. estimating unit subsidies; identifying users of basic
services; and aggregating individuals into groups. Based on (Demery, 2000), following procedure has
been carried out for the present BIA.
Step 1: Calculation of Unit Subsidy The unit subsidy or the average benefit refers to the average unit cost of providing a public service.
Unit subsidy is thus, obtained after dividing total subsidy by total number of beneficiaries. In this
study, total public spending for sub sector has been taken as total subsidy. So the unit subsidy is
simply given by i
i
E
Swhere S is total subsidy, E is total number of beneficiaries and i is the
particular subsector.
However, in this formula, user’s payment for utilizing services has not been shown explicitly. If we
take users payment into account then public subsidy is given by

i.d for k byamount paif
jthe regionding k in t of proviunit c
iinidvidualbyutilizedkserviceofquantityq
kserviceforiinidvidualbyreceivedsubsidypublicS
where
fcqS
ki
kj
ki
ki
kikjkiki
cos
,
)1.1(
But for education sector gross expenditure has been considered zero due to lack of data on
education expenditure by facility that goes to revenue of the government.
Following sub-sectors of health, education and drinking water sectors have been considered for the
benefit incidence analysis (BIA).
Table 1.1: Subsectors included for the Benefit Incidence Analysis
Sectors Health Education Drinking Water
Subsectors Hospital and Health Centre/Dispensary
Preventive (NIP)
Primary
Secondary
Tertiary
Piped drinking water with
private connection
public connection
Step 2: Identifying Users of Services Next step is to identify users of services. How users of different subsectors are identified has been
discussed in corresponding section.
Step 3: Aggregating Individuals into Sub-groups of the Population According to Demery (2000), “the incidence of the benefit of government spending can be estimated
across household groups”. This study has grouped beneficiaries on the basis per capita consumption
expenditure quintile in order to compare how the subsidy is distributed among rich and poor.
Calculating Benefit Incidence Next step is to calculate benefit incidence. According to Demery (2000), group specific benefit
incidence is given by
5
1
5
1
)2.1(i
ii
ij
i i
iijj S
E
E
E
SEX
Where,

water)drinking education, (health, sectors within sectors-sub = i
i levelon spendingnet government S
group income theacross iesbeneficiar ofnumber
j group and i levelsector in iesbeneficiar ofnumber E
group eexpenditur quintile = j
j group income toaccruing incidencebenefit or subsidy totalof value
i
ij
i
j
E
X
Evaluation of Benefit Incidence - Concentration Curve and Concentration Index
Benefit incidence ratio tells how subsidy varies across the full distribution of living standards
(O’Donnell et al, 2008). Graphic presentation of benefit incidence results can be helpful in
demonstrating how targeted and progressive subsidies are. Concentration curve is one such graphic
measure which shows the distribution of benefit across income/expenditure classes. It displays the
share of health accounted for by cumulative proportions of individuals in the population ranked
from poorest to richest (Kakwani 1977; Kakwani et al. 1997; Wagstaff et al. 1991 cited in O’Donnell
et al, 2008). The concentration curve for grouped data is a plot of cumulative percentage of subsidy
(y-axis) against cumulative percentage of users of services ranked in consumption expenditure
quintile beginning with poorest and ending with richest consumption quintile (x-axis).
The concentration index, on the other hand, measures the degree of inequality in subsidy with
reference to consumption expenditure. It is measured as twice the area between concentration
curve and line of equality (O’Donnell et al, 2008). The value of concentration index lies between -1
and 1. If there is no consumption expenditure related inequality in subsidy then concentration index
takes the value zero. Negative concentration index means the subsidy is skewed towards poor and
vice versa.
According to Fuller and Lury (1977), concentration index for t = 1 … T groups are calculated using
following formula (O’Donnell et al, 2008):
te.rve ordinatration cuing concencorrespondLgroup tstatus in economic ranked bythe sampleofpercentagecumulativep
indexionconcentratCwhere
t
t
,
For this study tp represents the cumulative percentage of beneficiaries ranked in consumption
quintile and tL represents the cumulative percentage of subsidy.
Data Source — Benefit Incidence Analysis (BIA) has been carried out using two sets of data i.e. (i)
Nepal Living Standard Survey 2003/04 data and (ii) Household Survey Data carried out for five
districts of Nepal.
)3.1()( 111
ttt
t
tt LpLpC

1.3.2 Assumptions For calculating benefit incidence following assumptions have been made for different sectors.
Health
Out-patient data has been assumed as the proxy of health facility usage;
There has been no significant change in the pattern of health facility usage between
2003/04 and 2007/08 among different expenditure quintile groups;
Government expenditure is assumed to be equal for each visitor irrespective to the type
of health facility;
Only infants’ population has been considered for preventive services under National
Immunization Program (NIP)
Education
Government grant to school or government spending in education has been assumed as the
total subsidy in education.
Fees and other payments by parents in the school have been deducted from government
spending in education to estimate net subsidy amount.
Private school has been defined as one where the schools are run without government grant
or subsidy.
Drinking Water
Benefit from a particular public service is assumed as equal to the average cost of providing
the service. Hence, this study focuses on the distribution of average benefits.
Benefits of public spending on drinking water accrue to individual. Hence, total spending of
household has been equally divided to each member of household, irrespective of their age.
Household spending needed to obtain drinking water services has been taken into account
with the assumption that all expenditure made by household to obtain drinking water goes
to government revenue. In reality, the exception can be in Kathmandu valley where, many
households pay money for purchasing water from private supplier.
All public expenditure for drinking water goes to provide piped drinking water- either private
connection or public connection. Furthermore this study assumes that all piped drinking
water is provided through public expenditure. In reality there are I/NGOs as well to provide
piped drinking water in rural area.
1.4 Study Limitation The study tries to estimate the total expenditures on health, education and drinking water in the
country by consolidating expenditures on these sector by the government, local bodies and
household sector. Although the selection of districts for the data collection are representative of
the topography of the country, data relating to Local Bodies and household are collected based
on a limited sample size, the result should therefore, be interpreted with caution.

Benefit incidence analysis in the sector are primarily based on the data generated by Nepal
Living Standard Survey II. The survey was carried out in 2002/03. Hence, the calculation showing
benefit incidence in the sector needs to be seen carefully.
Although a house hold survey in five districts representing different topographical location are
carried out to compare the benefit incidence in the sector against NLSS II data, the limited
sample size needs to be kept in mind and the result should be taken as an indication towards the
changes in the benefit incidence in the sector.

Chapter TWO
Health Sector Program Budget and Benefit Incidence Analysis
2.1 Background
Government of Nepal (GON) has endorsed Millennium Declaration and is committed to attain MDGs.
The Tenth Plan/Poverty Reduction Strategy Paper (2002 – 2007) incorporated MDGs in its strategic
framework. The Second MDG Progress Report 2005 provides the latest insights on the status of the
MDG and the challenges they pose in Nepal. Of all eight MDGs, three dealing with health are the
most off-track. Studies have also documented that health expenditure over the last decades has had
limited impact on the health outcomes. Three-year rolling Medium-Term Expenditure Framework
(MTEF) was implemented to strengthen the public expenditure management and improve the
allocation and use of public funds. It is in these backgrounds this chapter analyzes the health sector
expenditure by levels and types during last five years. It also attempts to assess the magnitude of
donors support in health sector expenditure. It may be mentioned here that the PBA in health
sector include health expenditure incurred in other Ministries as well. For example, Teaching
Hospitals under Ministry of Education, Hospitals under the Ministry of Defense, Hospitals under
Ministry of Home and other health associated expenditure in other Ministries.
2.2 Trends in Health Expenditure The trend in health expenditure during last five years period is presented in Table 2.1 and also
shown in Figure 2.1. Government expenditure on health as a whole is steadily increasing. The
average annual increase in total government expenditure has been estimated to be 39.46 during
2005/06 - 2009/10. The average annual increase on health expenditure during the same period has
been even much higher to the tune of 52.86 percent during the same period.
Data presented in the table further reveal that for the past four years under reference the annual
growth of expenditure in health sector has consistently remained higher as compared to the annual
rise in government total expenditure (52% vs 32% for example during 2006/07 and 2007/08). This
trend has reversed during 2008/09 and 2009/10 (19% vs 43%).

Figure 2.1 — Government expenditure in health sector, Nepal 2005/06-2009/10 Figure 2.1: Government Expenditure in Health Sector, Nepal,
2005/06 -2009/10
57287440
9811
14946
17840
0
4000
8000
12000
16000
20000
2005/06 2006/07 2007/08 2008/09 2009/10
Fiscal Year
Healt
h E
xp
en
dit
ure
( i
n
Mln
Rs.)
2.2.1 Health Expenditure/GDP Ratio The true level of government expenditure on health may be assessed through this ratio. The ratio
that represents governments' expenditure on health as a share of GDP has shown a continuous rise
from 0.87% in 2005/06 to 1.55% in 2008/09. Available estimates reveal that the share of health
expenditure on GDP in Nepal is comparable to neighboring Bangladesh (1.5 %), Sri Lanka (1.8%) and
China (2%) but slightly higher compared to India (0.9%) and much lower compared to Bhutan
(3.6%)(CBS, 2006).
There has been a significant increase in the government expenditure and correspondingly there has
been a rise in health expenditure as well. This has well been reflected in the share of health
expenditure in the total government expenditure, which has increased from 5.16% in 2005/06 to
about 7% in 2008/09(Table 2.1).5
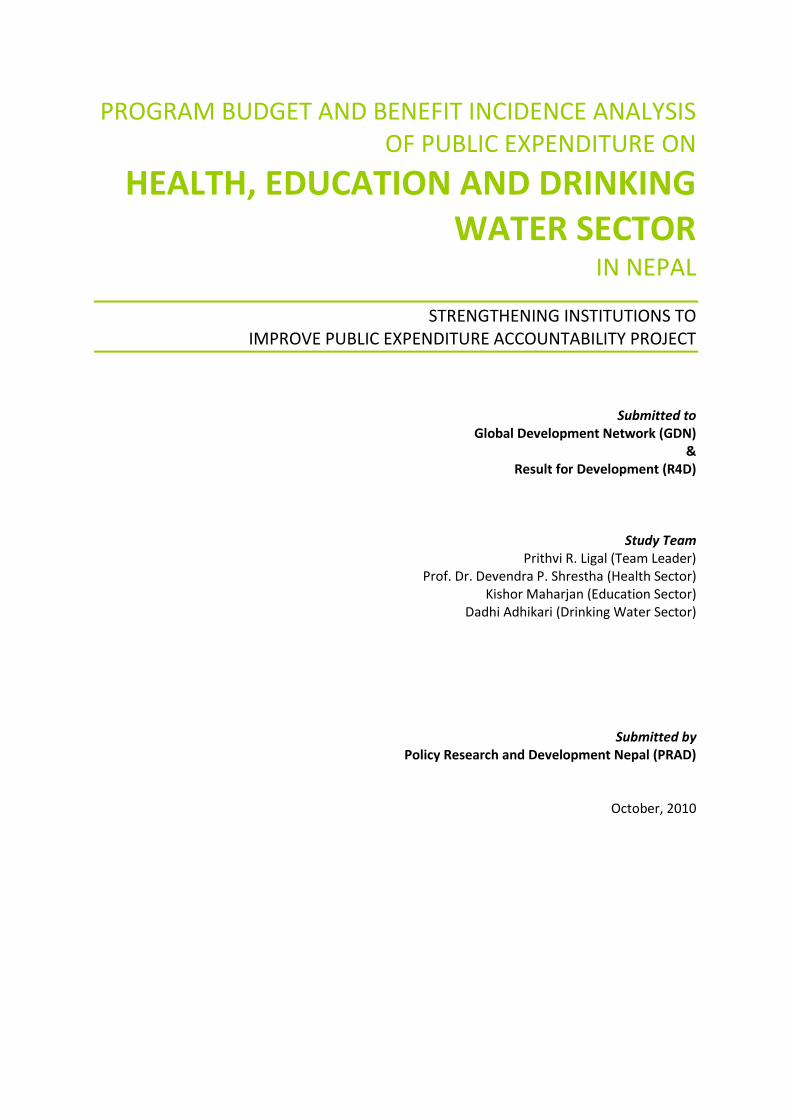
2.2.2 Per Capita Health Expenditure As may be seen from the table the per capita expenditure in health is also on the rise. During the
period of five years it has almost tripled. The trend in per capita health expenditure is also illustrated
in Figure 3.2. In the fiscal year 2005/06 it was recorded at NPR 218, which has now almost tripled
and reached to NPR 623 (US $ 8). When compared to US $ 3 per capita health expenditure in 2005
this is a remarkable improvement. After People’s uprising Two in 2006, health for all has been a
slogan and it has been enshrined in the interim constitution as the fundamental rights of the people.
With a view of making easy access and provide quality health services Government of Nepal has
introduced many new initiatives in health sector resulting to the sharp rise in the health expenditure
including per capita expenditure in recent years.
5 The tables presented in the text have been synthesized. Detailed tables as per to the guidelines of GDN are presented in
Annexes. 2.1
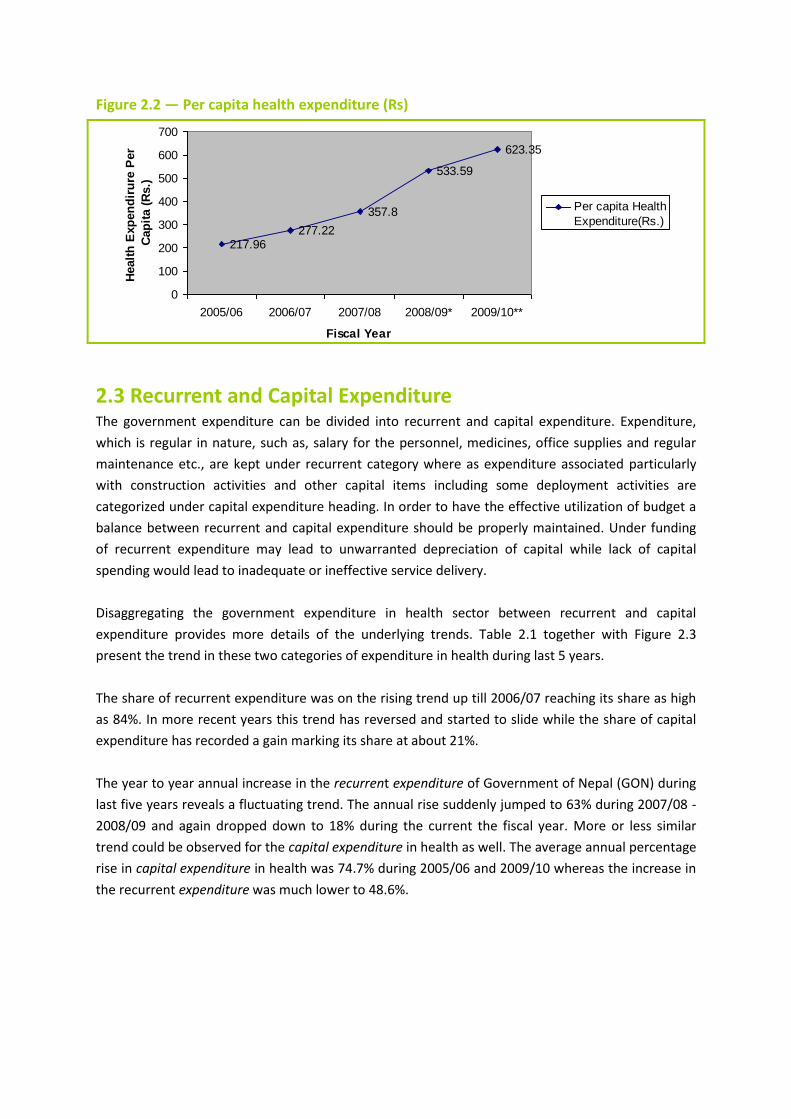
Figure 2.2 — Per capita health expenditure (Rs) Figure 2.2 : Per Capita Health Expenditure (Rs.)
217.96277.22
357.8
533.59
623.35
0
100
200
300
400
500
600
700
2005/06 2006/07 2007/08 2008/09* 2009/10**
Fiscal Year
Healt
h E
xp
en
dir
ure
Per
Cap
ita (
Rs.)
Per capita Health
Expenditure(Rs.)
2.3 Recurrent and Capital Expenditure The government expenditure can be divided into recurrent and capital expenditure. Expenditure,
which is regular in nature, such as, salary for the personnel, medicines, office supplies and regular
maintenance etc., are kept under recurrent category where as expenditure associated particularly
with construction activities and other capital items including some deployment activities are
categorized under capital expenditure heading. In order to have the effective utilization of budget a
balance between recurrent and capital expenditure should be properly maintained. Under funding
of recurrent expenditure may lead to unwarranted depreciation of capital while lack of capital
spending would lead to inadequate or ineffective service delivery.
Disaggregating the government expenditure in health sector between recurrent and capital
expenditure provides more details of the underlying trends. Table 2.1 together with Figure 2.3
present the trend in these two categories of expenditure in health during last 5 years.
The share of recurrent expenditure was on the rising trend up till 2006/07 reaching its share as high
as 84%. In more recent years this trend has reversed and started to slide while the share of capital
expenditure has recorded a gain marking its share at about 21%.
The year to year annual increase in the recurrent expenditure of Government of Nepal (GON) during
last five years reveals a fluctuating trend. The annual rise suddenly jumped to 63% during 2007/08 -
2008/09 and again dropped down to 18% during the current the fiscal year. More or less similar
trend could be observed for the capital expenditure in health as well. The average annual percentage
rise in capital expenditure in health was 74.7% during 2005/06 and 2009/10 whereas the increase in
the recurrent expenditure was much lower to 48.6%.

Figure 2.3 — Recurrent and capital expenditure in health, 2005/06 – 2009/10 Figure 2.3 : Recurrent and Capital Expenditure in Health, 2005/06 - 2009/10
0 2000 4000 6000 8000 10000 12000 14000 16000
2005/06
2006/07
2007/08
2008/09
2009/10
Fis
cal
Year
Expenditure (Rs. in Million)
Capital
Recurrent
Source: Table 2.1
Table 2.1: Expenditure pattern of health budget, FY 2005/06 - 2009/10, Nepal (Rs. in Million)
Description 2005/06 2006/07 2007/08 2008/09* 2009/10**
Recurrent Exp. 4796.99 6254.98 7376.32 12006.56 14127.40
Annual Growth (%) X 30.39 17.93 62.77 17.66
Capital Exp. 931.18 1185.60 2434.81 2939.39 3713.06
Annual Growth (%) X 27.32 105.37 20.72 26.32
Total 5728.18 7440.59 9811.13 14945.96 17840.46
Annual Growth (%) X 29.89 31.86 52.34 19.37
Government Expenditure 110889.15 133604.60 161349.89 213578.37 285930.00
Annual Growth (%) X 20.48 20.77 32.37 33.88
Social Sector Expenditure 35534.40 45026.90 55356.86 105375.68ª 130366.74
Health Total (% of SS Exp.) 16.12 16.52 17.72 14.18 13.68
Health Total (% of Govt. Exp) 5.16 5.56 6.08 6.99 6.24
Health Total (% of GDP) 0.87 1.02 1.19 1.55 NA
Per Capita Health Expenditure (Rs.) 217.96 277.22 357.80 533.59 623.35
* Revised Estimate, ** Allocation
Source: Economic Survey 1998/99, Ministry of Finance, Budget Speech 2001/02, Ministry of Finance
Note: The expenditure figures in Economic Survey and Red Book do not tally
Social Sector includes (as per MOF definition): Education, Health, Drinking Water, Local Development & Other Social Services
Regarding their share in the total health expenditure, the recurrent expenditure continues to claim
overwhelmingly larger share of more than three – fourths of the total health expenditure in all the
years under reference. During 2005/06 and 2006/07 the share remained as high as 84 percent with
only 16 percent left for the capital expenditure. In more recent years it has come down to the ratio
of 80:20. This clearly shows that the share of recurrent expenditure is disproportionately high in
health sector.
2.3.1 Wage and Non-Wage within Recurrent Expenditure The analysis of recurrent expenditure into wage and none-wage category further provides some
insight about the efficiency of resource use in health sector. Results presented in Table 3.2 reveal a

consistent decline in the share of wage/salary expenditure of the recurrent expenditure. In total the
proportion of salary/wage expenditure dropped from 59% in 2005/06 to 36% in 2009/10 while the
share of no-wage has increased correspondingly during the same period. This is a positive
development.
The analysis of wage and non-wage data by facility presents some interesting insights.
At all facility type the proportion of wage/salary recorded a consistent decline during last five
years.
This decline was more severe in “other service type” (decline from 42% in 2005/06 to merely
16% in 2009/10)
In preventive services more than 95% of the resources are spent in non-wage activities
throughout the reference years.
At the Ministerial and regional administration the trend has however, reversed. The share of
wage expenditure has reduced significantly from 90% in 2008/09 to more than half to 35% while
the proportion of none-wage has reached to 65%
Table 2.2: Wage and non-wage within recurrent expenditure (Rs in ‘000)
2005/06 % 2006/07 % 2007/08 % 2008/09 % 2009/10 %
Health Total
Recurrent 4796998 100.0 6254988 100.0 7376321 100.0 12006568 100.0 14127405 100.0
Wages 2838994 59.2 2992496 47.8 3224937 43.7 5521706 46.0 5077121 35.9
Non-Wages 1958004 40.8 3262492 52.2 4151384 56.3 6484862 54.0 9050284 64.1
Hospital
Recurrent 773376 100.0 809310 100.0 1062594 100.0 1178574 100.0 1543586 100.0
Wages 640972 83.0 647530 80.0 634691 60.0 1147075 97.0 958896 62.0
Non-Wages 132404 17.0 161780 20.0 427903 40.0 31499 3.0 584690 38.0
Health Center
Recurrent 1987551 100.0 2901570 100.0 3075668 100.0 3399429 100.0 4148610 100.0
Wages 1694163 85.0 1762382 61.0 2010178 65.0 2393656 70.0 3041472 73.0
Non-Wages 293388 15.0 1139188 39.0 1065490 35.0 1005773 30.0 1107138 27.0
Preventive
Recurrent 1045507 100.0 1235288 100.0 1361942 100.0 2963495 100.0 2865880 100.0
Wages 54156 5.0 23264 19.0 25535 2.0 57315 2.0 81415 3.0
Non-Wages 991351 95.0 1212024 81.0 1336407 98.0 2906180 98.0 2784465 97.0
Others
Recurrent 844001 100.0 1102823 100.0 1707173 100.0 3706136 100.0 5110472 100.0
Wages 355288 42.0 400772 36.0 433290 25.0 1243946 34.0 836910 16.0
Non-Wages 488713 58.0 702051 64.0 1273883 75.0 2462190 66.0 4273562 84.0
Ministerial
Recurrent 146563 100.0 205997 100.0 168944 100.0 758934 100.0 458857 100.0
Wages 94415 64.0 158549 77.0 121243 72.0 679714 90.0 158428 35.0
Non-Wages 52148 36.0 47449 23.0 47702 28.0 79220 10.0 300429 65.0
Source: Red Book of various years, MOF/GON
2.4 Health Sector Spending by Facility This section attempts to analyze the pattern of health expenditure by type of facilities. Under the
Ministry of Health and Population there are all together 48 different program and projects listed at
Central and District level for which budget allocation has been made. For the sake of meaningful

analysis all those programs were reclassified into five broad categories following GDN’s requirement. 6
As expected health centers/dispensary has occupied the largest share (between 36 to 40%) of health
expenditure until 2006/07. Since then its share has declined to less than one-fourth (Table 2.2).
Other service has, however, gained significantly. Its share which remained less than one-fourth in
2005/06 has almost doubled (43%) by 2009/10. This is no doubt a significant gain but at the cost of
health center/ dispensary. The data thus reveal that in recent years most of the increase in health
sector funding appears to have been channeled away from primary health care (health
centers/dispensary) to other services. This is obviously not a health development and thus needs
further probing. The share of hospitals in the total health spending has also been in the declining
trend while the share of preventive services has remained more or less constant at 20 percent with
some fluctuating in between. The ministerial and regional administration has accounted less than 5
percent of the total health spending. The relative shares of health spending by type of facility have
also been demonstrated in Figure 2.4.
Figure 2.4 — Health sector spending by facility, Nepal, 2005/06-2009/10 Figure 2.4: Health Sector Spending by Facility, Nepal, 2005/06 -
2009/10
0.0
20.0
40.0
60.0
80.0
100.0
2005/06 2006/07 2007/08 2008/09 2009/10
Fiscal Year
% S
hare
of
Facil
ity
Others
Ministerial/Reg.Adm.
Preventive
Health Centers/dispensary
Hospital
6 The definition of the categories is presented in Annex 2.2.

Table 2.3: Health Spending by Facility in Nepal, 2005/06 – 2009/10 (Rs. in Million)
Total % Hospital %
Health Centers/
dispensary % Preventive %
Ministerial & Regional
Adm. % Others %
2005/06 5728 100 1068 18.6 2078 36.3 1092 19.1 174 3.0 1316 23.0
2006/07 7440 100 1286 17.3 2951 39.7 1282 17.2 225 3.0 1696 22.8
2007/08 9811 100 1836 18.7 3134 31.9 1482 15.1 216 2.2 3143 32.0
2008/09 14946 100 1742 11.7 3647 24.4 3208 21.5 854 5.7 5495 36.8
2009/10 17840 100 2202 12.3 4425 24.8 3084 17.3 560 3.1 7569 42.4
Source: Red Book of various years, MOF/GON
2.5 Health Budget and Donors Assistance Both multilateral and bilateral partners are providing financial assistance in health sector. WHO, The
World Bank, UNICEF and UNFPA are the major multilateral donors while bilateral donors include
USAID, DFID, GTZ, JICA and SDC. Besides, many INGOs are also actively engaged in health sector.
Table 2.4: Recurrent and Development Spending in Health Sector by Funding Source,
2005/06 - 2009/10 (Rs. in '000)
2005/06 2006/07 2007/08 2008/09 2009/10
Total Health Expenditure 5728180 7440595 9811130 14945964 17840465
Recurrent 4796998 6254988 7376321 12006568 14127405
Wages 2838994 2992496 3224937 5521706 5077121
Non-Wages 1958004 3262492 4151384 6484862 9050284
Domestic 3419896 3826768 4411804 6457214 7732586
Donor 1377102 2428219 2964517 5549354 6394819
Development 931182 1185607 2434809 2939396 3713060
Domestic 412227 343810 1068721 1042273 1595185
Donor 518955 841797 1366088 1897123 2117875
Donors’ total 1896057 3270016 4330605 7446477 8512694
Donors share in Health Recurrent Expenditure 28.71 38.82 40.19 46.22 45.27
Donors share in Health Development Expenditure 55.73 71.00 56.11 64.54 57.04
Donors share in Total Health Expenditure 33.10 43.95 44.14 49.82 47.72
Source: Red Book of various years, MOF/GON
The donors financing in health sector in Nepal has been increasing steadily and continue to account
about half of the total health expenditure of the country (48%) in 2009/10 indicating continued
donors dependency in health sector. Donors’ share in health development expenditure over the
years has recorded a continuous decline from 71 percent in 2006/07 to 57 percent in 2009/10.
Excessive donors’ dependency in health sector is evident from the fact that almost half of the
recurrent expenditure is still borne by donors’ fund. This obviously raises the question of
sustainability in health expenditure. It should be noted here that the analysis presented above does
not include donors support to number of directly executed health projects that are not listed in
government Red Book.

Data on donors funding by type of health facility reveal that largest share of donors support is in the
area of preventive services in which donors share account more than 85 percent of the total
expenditure. Donors support has also remained significant in other services accounting more than
three-fifths (61%) of the total health expenses. Donors’ contributions in more recent years in
hospitals and health administration has declined remarkably and remained less than 5 percent
(Table 2.5).
Table 2.5 — Health Sector Spending by Source of Financing and by Type of Facility, 2005/06 -2009/10, Nepal
2005/06 2006/07 2007/08 2008/09 2009/10
Hospital
GON 99.12 84.45 74.66 95.98 96.32
Donors 0.88 15.55 25.34 4.02 3.68
Health Centers
GON 92.18 69.72 73.81 71.49 72.95
Donors 7.82 30.28 26.19 28.51 27.05
Preventive
GON 18.18 19.32 10.17 7.90 14.66
Donors 81.82 80.68 89.83 92.10 85.34
Other Services
GON 38.54 33.40 46.50 38.53 39.36
Donors 61.46 66.60 53.50 61.47 60.64
Ministerial/Regional Administration
GON 86.89 94.46 85.27 99.47 97.64
Donors 13.11 5.54 14.73 0.53 2.36
Source: Red Book of various years
2.6 Health Expenditure by Funding Source The Nepal National Health Accounts (NNHA) 2004-2006 is the latest health account prepared and
published in July 2009 by the Ministry of Health and Population. This one is the second in the series.
The preliminary draft of the report provides data on health expenditure by funding source.
Total health expenditure is funded from several sources which include government, private
household out-of pocket expenditures, official donor agencies and INGOs. Figure 2.5 shows the
composition of total health expenditure by major funding source for the fiscal year 2005/06. Private
out of pocket expenditure continued to be the single largest source accounting half of the total
expenditure (50%). This is followed by government (24%) and INGOs (13%) in order. External
Development Partners (EDPs) accounts 8 percent of the total health expenditure. Likewise, the share
of non profit institutions and corporations other than health insurance remained negligible with 4
percent and 1 percent respectively (MOHP, 2009).

Figure 2.5 — Total health expenditure by funding source, 2005/06
Source: Nepal National Health Accounts II (2004-2006), Table 3.2
2.7 Health Sector Expenditure at Sub-national Level
As mentioned under the methodology section, the present study conducted the survey of LBs to assess their contribution in health care expenditure. Summary table indicating the level of health care expenditure incurred by surveyed DDCs, Municipalities and VDCs are shown in Table 2.6.
Table 2.6: Sub-national allocation of health budget in Nepal, 2008/09 (Rs. in ‘000) DDCs (N=5) Municipalities (N=5) VDCs (N=20)7
Total Budget 254746 680481 42483
Health Budget 4176 3089 1734
Share of health budget in total budget
1.64% 0.45% 4.08
Health spending by LBs has remained negligible. In the case of Municipalities it was less than one percent and lowest among all LBs. This has clearly shown that health sector does not
receive any priority in the LBs resource allocation.
7 Five VDCs of Kaski District are not considered due to poor data quality.
Figure 2.5: Total Health Expenditure by Source, 2005/06
24
50
4 1
8
13 Government
Private household Expenditure
Non profit institutions
All corporations (other than Health insurance)
Official donor agencies
INGOs

2.8 Benefit Incidence Analysis: NLSS II Data
Health gap between rich and poor as well as between the rural and urban people has been a major
concern in Nepal. Nearly one quarter of the population still have life expectancy less than 40 years
and they live in extreme poverty in rural and remote areas. There has been an increased spending in
health sector over the years. Studies have shown that wealthiest households use more government
health services than their poorer counterparts. How does one address these claims? Benefit
incidence analysis is a tool that addresses this question. This section analyses the benefit incidence
in health by using NLSS II data and survey data collected from five sampled districts. For BIA in
health, two types of services are considered. They are: (i) Hospital and health facility and, (ii)
National Immunization Program as preventive service
2.8.1 Steps Involved in the Calculation of Benefit Incidence
Step One - Calculation of Unit Subsidy
The calculation of unit subsidy requires data on service usage by types of facility and total
expenditure which are presented in Table 2.7.
Table 2.7: Calculation of Unit Subsidy in Health Sector by Facility
Variable Value Reference Year Source
I. Hospital/Health Facility
No of new OPD patients visit (A) 12,137,059 2007/08 Annual Report DOHS
Total health expenditure(Hospital and Health facility together) (B)
Rs 1,294,500,000 2007/08 Red Book, MOF
Unit Subsidy 106.65 B/A
II. Preventive – National Immunization Program (NIP)
Total infant population covered by the program (C) 657307 2007/08 Annual Report DOHS
Total Expenditure for NIP(D) Rs. 547,869,929 Red Book, MOF
Unit Subsidy Rs. 833.50 D/C
The unit subsidy calculated above does not consider expenses incurred by sick people for getting
treated in the public health facilities8. The net unit subsidy has been obtained by subtracting
payment made by each individual for their treatment from unit subsidy. The NLSS II provides the
household level payment for health care expenses. Individual level payment has derived after
dividing by household size. Though NLSS provide health care expenses both at public and private
facilities for the calculation of net subsidy expenses incurred for public facilities only have been
considered. NLSS has gathered data on medical expenses under three heads: medicine,
transportation and other diagnostic fees. It should further be noted that only medicine and
diagnostic fees have been considered to adjust with the total subsidy for obtaining net subsidy. Since
8 Public health facilities provide medical facilities including some medicines free of charges.

transportation cost does not enter into the revenue of the public health facilities it has been
excluded.
Tables from BIA Requirements
Per – User Government Subsidy for Health Services, by facility Level (1H) Service Type Unit Subsidy
Hospital and Health Facility/Dispensary NRs. 106.65
Preventive
National Immunization Program
NRs. 833.50
Step Two - Identification of Expenditure Quintile
Benefit incidence requires to aggregate users across expenditure or income quintile. Instead of
income, expenditure has been considered to measure the standard of living of the people. NLSS II
provided information about food expenditure and non food expenditure. Total expenditure has been
calculated by taking average value of these two totals.
NLSS provides total expenditure for household only. Household expenditure has been divided to
individual expenditure using conversion factor (Refer to Drinking Water Section). Once individual
expenditure was determined, expenditure quintile was generated for those who were sick and
visited the government health facility for treatment and the proportion in each expenditure quintile
was obtained. Using these proportion to the number of new OPD patients visit numbers of patients
who have visited the health facility for treatment were obtained. Likewise, the wealth quintile
generated for the immunization coverage in Nepal Demographic Health Survey (NDHS) 2006 was
adopted to generate the children fully immunized in FY 2007/08. Table 2.8 provides the distribution
of new OPD patients and children fully immunized by expenditure quintile.
Table 2.8 — Estimated number of sick people using health facility by expenditure quintile (2H)
Service Type
1
(Lowest)
2 3 4 5
(Highest)
A. Hospital and Health Facility/Dispensary 1848474 2233219 2517226 2619177 2918963
B. Preventive
National Immunization Program (NIP) 169585 132776 136720 113057 105169
Source: Health Survey, 2006
Step Three - Total Subsidy for Different Expenditure Quintile
Total subsidy has been calculated as the sum of the net subsidy received by users in each quintile.
Table 2.9 presents total subsidy for hospital/health facility and preventive services.
Table 2.9 — Total subsidy of health care expenditure by expenditure quintile and facility (3H)
Service Type 1 (Lowest) 2 3 4 5 (Highest)
A. Hospital and Health Facility/Dispensary*
297,870,650 276,253,419 248,319,525 238,615,502 135,203,814

B. Preventive Services
National Immunization Program (NIP) 141,349,098 110,668,796 113,956,120 94,233,010 87,658,362
Source: Calculated from NLSS II data
* Net Subsidy has been calculated for hospital and health facility only. For preventive services it is not applicable as all types of immunization services in the government facilities are free.
2.8.2 Results and Discussion- Benefit Incidence
Based on Table 2.9 benefit incidence of both the facilities have been arrived and shown in Table 2.10
Table 2.10 — Distribution of benefits of health care expenditure (%) by expenditure quintile and facility (4H)
Service Type 1 (Lowest) 2 3 4 5 (Highest)
A. Hospital and Health Facility/Dispensary* 24.90% 23.09% 20.76% 19.95% 11.30%
B. Preventive Services
National Immunization Program (NIP) 25.80% 20.20% 20.80% 17.20% 16.00%
Source: Derived from Table 2.9
As may be observed from the upper segment of Table 2.10 the government subsidy in the hospital
and health facility/dispensary appears to be pro poor. However, the distribution is not very skewed.
Lowest 20 percent of the people (poor) have received 25 percent of the subsidy which is highest
among all quintiles while highest 20 percent of the people (rich) have enjoyed only 11 percent of the
government subsidy. It is more or less fairly equal for remaining 3 quintile groups.
Similar results have been obtained for preventive services (lower segment of Table 2.10). Preventive
services appears to be more pro poor and the subsidy declines as one moves from lower to higher
expenditure quintile. This is an interesting finding. Data limitation could have caused this problem.
Two different sources of information were used for the calculation. Infants immunized were
obtained from the government service statistics which essentially captures only services rendered in
the government facility and fails to capture services received in private facility. For the distribution
of immunized infants by expenditure quintile we have relied on the NDHS 2006 estimate of the
wealth quintile (MOHP, 2007). The difference in the reference years of these variables could also
account. This needs further probing.
Concentration Index and Concentration Curve: Benefit incidence can be evaluated by calculating
concentration index using techniques as mentioned in methodology section.
Table 2.11 — Evaluation of benefit incidence of health service
Note: For details of calculation see table Annex 2.3
Since concentration index (-0.05383) is negative, overall public expenditure in hospital and health
Types of Service Concentration Index Distribution of Benefit
Hospital and Health Facility/Dispensary -0.053835 Pro-Poor

facility is progressive (pro-poor) in absolute term (See Annex 2.3). Figure 2.6 represents the
corresponding concentration curve. As the concentration curve for hospital and health facility level
subsidy lies above the line of perfect equality (PE) the government spending on health can be
considered as progressive (pro-poor).
From the results presented in Table 2.10 inference can be drawn that in general government
expenditure on health service is well targeted as benefits enjoyed by poor are more than benefits
enjoyed by rich.
Note: Calculated from Annex 2.3
Our analysis suffers from following limitations:
It does not take into account the regional and other variations in unit cost;
Though health expenditure considered in the present exercise for hospital and health
facility service is both for out patient and in patient service but due to lack of classified
data on inpatient service it has not been considered;
Administrative expenditure of District Public Health Office has also been included in the
total health expenditure though they are not directly involved in service provision except
monitoring and health administration in the districts;
2.9 Benefit Incidence Analysis: Field Survey Data
The survey conducted for the present study in five districts both in rural and urban cluster on the
whole reveal that there is no significant difference in seeking health care during illness by income
quintile. 93% of the lowest income quintile group who reported ill received health care services
while almost all (99%) from the highest income quintile received health care during illness.
As expected lowest income quintile avail relatively more government facility (44%) compared to
highest income quintile (28%). However, a pattern of increasing use of private facility irrespective of
income quintile is quite evident from Table. While 75% of the reported ill person belonging to
Fig 2.6: Concentration Curve for Hospital and Health Facility
Visit
0
0.2
0.4
0.6
0.8
1
1.2
0.2 0.4 0.6 0.8 1
Cumulative Distribution of Subsidy (%)
Cumulative Distribution of
Users (%)
Line of Perfect Equality
Cumulative % of Subsidy

second lowest income quintile seek private facility this figure is not much different for the highest
income quintile (82%). This indicates towards the growing tendency of all income groups with little
difference to seek health care services from private facilities which is a matter of serious concern for
the health policy makers. One plausible reason for such trend towards private facilities may be due
to non-availability of medical professionals, testing equipments and poor health services in the
public health facilities. Government therefore, needs to look at these matters and try to improve
service delivery in public health facilities.
No clear pattern of the share of health care expenditure on total household expenditure by income
quintile may be seen in Table 2.12. A comparison between lowest and highest income quintile
indicate that the former tend to spend relatively more (8%) of their total household expenditure as
compared to 6% by later group. The fourth highest income quintile however, spends the largest
share (11%) among other income quintile group.
Table 2.12 — Access to health care and facility by expenditure quintile in survey districts, and share of public and private facilities (%)
Quintile
Proportion of people reporting ill during last 12 months
seeking health care
Source of Health Care Share of total household expenditure
(%) Government Private
First (Lowest) 92.8 44.4 55.6 7.9
Second 95.8 25.0 75.0 5.4
Third 94.7 22.2 77.8 5.1
Fourth 94.8 30.8 69.2 11.2
Fifth (Highest) 99.0 18.4 81.6 5.8
Total 95.4 28.0 72.0
N= 461 129 332 461
Source: Field Survey Data

Chapter THREE
Education Sector Program Budget and Benefit Incidence Analysis
3.1 Background Nepal has been striving to attain its MDG in education. It has made remarkable improvement in
student’s enrollment, particularly in the rural areas. Not only there is increment in boys and girls’
enrollment, girl’s enrollment is found exceeding that of boys in the rural school. Present study
focuses on education program budget analysis (PBA) and benefit incidence analysis (BIA) of
government education expenditure. Study has also addressed sub national level analysis. The
national PBA is classified in five different facilities level namely, primary, secondary,
tertiary/university, other education and ministerial/regional administration level. National PBA
covers program budget spent by ministry. It also captures recurrent and development expenditures.
Recurrent expenditure is analyzed in wages and non-wages categories.
3.2 Trends in Educational Expenditures Every year government spends huge amount on education sector. In 2008/09, Government
expenditure on education is estimated as 16.4% of total budget. The trend of government
expenditure is increasing since last several years (Fig 3.1). The annual average growth in education
sector is estimated as 14.5% per annum. From 2005/06, GoN is allocating expenditure in the sector
through 43 programs. The programs are clustered in 5 levels namely, primary, secondary,
tertiary/university, other education and ministerial and regional administration.
Figure 3.1: Government expenditure in education (in million)
Source: Red Books

3.3 Education Expenditures by Level
3.3.1 Primary education
Primary schools provides five years of education to all children consisting of five different grades
from class 1 to 5.This cluster covers 15 programs; namely Education for All -Primary Education, Non
Formal Education Center, Special Education Council School Transfer and Incentive Program, Physical
Facility Improvement Project, Education for All-Child Development Program, Education for All
Program, Teachers Education Project, Integrated School Education Structural Program, School Sector
Capacity Development Program, Conflict victim, Non-formal Education & National Literacy
Campaign, Food for Education Program - Primary School Nutritious Food, Population Education,
Education for All Program.
More than 50% (2005–2010) of total education expenditure is spent on primary education (Fig 3.2).
Highest amount is spent on Education for All Program - Primary Education (80.5%) and the lowest is
in population education (0.02%). AS primary education in the country mostly based on human
resources that is teachers in the school, recurrent expenditure of primary education is 99% and
development is just 1.0%. Wages expenditure is 85% and non-wage 15%. The source of recurrent
expenditure is met 89.0% by domestic and 11.0% from donors. Source of capital expenditure is 100%
from domestic.
3.3.2 Secondary Education
Secondary education consists of lower secondary, secondary and higher secondary levels. Lower
secondary comprises 6 to 8 grades, secondary 9, 10 and higher 11+2. Programs like Office of
Examination Controller, Various Secondary & Lower Secondary Schools, Secondary Education
Support Program, Higher Secondary Education, and Secondary Education Support Program are being
conducted in this category.
National secondary education expenditure is about 24.4% (2005-10) (Fig 3.2). Highest expenditure is
on various Secondary & Lower Secondary Schools program (75%) and the lowest is on Office of
Examination Controller (2.0%). Recurrent expenditure of secondary education is more than 99% and
development is less than 1.0%. Wages expenditure is 89% and non–wage 11%. The source of
recurrent expenditure is met 81.0% by domestic and 19.0% is from donors. Source of capital
expenditure is 100% from domestic.
3.3.3 Tertiary/Higher Education
GoN has made expenditure in tertiary and higher education to build up the technical and high-tech
manpower for the nation. It spends through University Grant Commission, Sanothimi Technical
Education, Council for Technical Ed. & Vocational Training, Skills for Employment Program, Man
Mohan Poly Technique Institute programs.
About 10% of total expenditure on education (2005-2010) falls in this category (Fig 3.2). Highest
expenditure is on University Grant Commission (83%) and the lowest is on Man Mohan Poly
Technique Institute (0.1%). Recurrent expenditure of tertiary and higher education is 86% and
development is 14.0%. Wages expenditure is 95% and non –wage 5%. The source of recurrent

expenditure is met 99.0% by domestic and 1.0% is from donors. Source of capital expenditure is
98.0% from domestic and 2.0% from donors
3.3.4 Other Education
Various programs are being initiated to develop quality of education in the country. As such, several
institutions were created in the past to improve the quality of teaching materials and manpower,
besides programs that promote and help create manpower to help in the extracurricular activities.
The Curriculum Development Centre, National Educational Manpower Development Center,
Libraries-3 ( Dilli Raman, Kesher, National), Nepal Scout, National Sports Council, School Area
Development Program, National Youth Mobilization Program, Sports and Extra Activities, Food for
Education Program - Karnali Zone, School Area Development Programs etc., are but some of the
institutions and the program that are solely devoted for this.
National expenditure on Other Education is about 9.0% (2005-10). Highest expenditure is on various
School Area Development Programs (96%) and the lowest is on Curriculum Development Centre
(0.001%). Recurrent expenditure of Other Education is 71% and development is 29.0%. Wages
expenditure is 87% and non –wage 13%. The source of recurrent expenditure is met 39.0% by
domestic and 61.0% is from donors. Source of capital expenditure is 23% from domestic and 77%
from donors
3.3.5 Ministerial and Regional Administration
Ministries of Education and Sports and its subordinate agencies such as, Department of Education,
Regional Education Directorate, District Education Offices, National Teacher Service Commission,
School Teacher’s Documentation, and Teacher Pension Facilities are the institutions and programs
run by central government to facilitate education development in the country.
National expenditure on Ministerial and Regional Administration is about 5.0% (2005-10). Highest
expenditure is on Teacher Pension Facilities (46%) and the lowest is on Department of Education (0.
01%). Recurrent expenditure of Ministerial and Regional Administration is 97% and development is
3.0%. Wages expenditure is 91% and non –wage 9%. The source of recurrent expenditure is met
100.0% by domestic. Source of capital expenditure is 100% from domestic.
Figure 3.2 Facility level wise Education expenditure (2005/06-2009/10)
Source: Red Books

3.4 Government Expenditure and Subsidies in Education
Government provides subsidies in all level of education - primary, secondary and tertiary level.
However, the primary level education, although being given more importance, shares lower subsidy
than secondary and tertiary level. Its average annual growth rate is 7.9%. Secondary level has three
tiers namely lower secondary, secondary and higher secondary, its growth rate is 11.6% whereas
growth rate of tertiary is 7.9%. Per student government expenditure is higher in tertiary/university
level. There is decrement in subsidy in primary level in 2008/09, because a large amount of
expenditure has been shifted to school area development program under other education category.
Table 3.1 — Subsidies in various levels (in Rs)
Level 2005/06 2006/07 2007/08 2008/09 2009/10
Primary 2541 2734 3490 5202 3724
Secondary 2117 2408 3090 4128 3809
Tertiary 10201 9941 10836 12345 14674
Source: Red Books, Economic Surveys of various years and educational statistics of Nepal (2005/06-2009/10)
Subsidy in tertiary /university level is much higher than those of primary and secondary level. It is
more than three times. Figure 3.3 — Subsidies in different level (2005/06-2009/10)
Derived from table 3.2
3.5 Development and recurrent expenditures in education
Analysis of expenditures by types shows, recurrent expenditure sharing about 91% and development
9% in the total educational expenditures. Between wage and non-wage, expenditure on wages
shares 81% and 10% on non-wage of total expenditure. Of the development expenditures, about 80
% comes from donor assistance and only 20 % is financed by domestic sources.
On the sources of financing, the study tries to look at the sources of financing on both recurrent
expenditures as well as development expenditure. Table -3.2 below depicts the budget expenditure
on education from 2005/06 to 209/10 by program and expenditure types.

Table 3.2 — Recurrent and development spending by facility level (Rs. in ‘000)
Actual Actual Actual
Revised estimate
Budgeted
2005/06 2006/07 2007/08 2008/09 2009/10
Education 19418448 21715045 27288441 39078456 46616672
Primary 11439238 12342835 15420140 23497443 17196554
Recurrent 10392223 11452178 13893228 20433613 17151254
Wages 9637074 10007250 12189842 17978390 14526061
Non-Wages 755149 1444928 1703385 2455223 2625193
Domestic 7480163 8150478 10055830 14413673 15205033
Donor 2912061 3301700 3837398 6019940 1946221
Development 1047015 890657 1526913 3063830 45300
Domestic 167353 129853 325759 428582 45300
Donor 879662 760804 1201154 2635248 0
Secondary 4698556 5251366 7298512 10307065 10053218
Recurrent 4278670 4840446 6143164 10106064 10037798
Wages 4060554 4406772 5371193 8861575 8942267
Non-Wages 218116 433674 771971 1244489 1095531
Domestic 3885487 4343932 5471505 8335955 8152448
Donor 393183 496513 671659 1770109 1885350
Development 419885 410920 1155348 201001 15420
Domestic 35362 106158 123363 45450 15420
Donor 384524 304763 1031985 155551 0
Tertiary/University 2075458 2428147 2955505 3550176 4449526
Recurrent 1945317 2141884 2708238 3365626 3838959
Wages 1943896 2141287 2704200 3001565 3661299
Non-Wages 1421 597 4039 364061 177660
Domestic 1930878 2135064 2635785 3153851 3838949
Donor 14439 6820 72453 211775 10
Development 130141 286263 247267 184550 610567
Domestic 130141 164393 177457 178810 601651
Donor 0 121870 69810 5740 8916
Other Education 220235 310891 321723 94507 12988204
Recurrent 219263 310391 305025 94157 9345687
Wages 199038 259805 249688 66627 8131376
Non-Wages 20225 50586 55337 27530 1214311
Domestic 219263 310391 305025 94157 3657845
Donor 0 0 0 0 5687842
Development 971 500 16698 350 3642517
Domestic 971 500 16698 350 821635
Donor 0 0 0 0 2820882
Ministerial / Regional
984962 1381806 1292561 1629265 1929170
Recurrent 965794 1360335 1204838 1584615 1870833

Actual Actual Actual
Revised estimate
Budgeted
2005/06 2006/07 2007/08 2008/09 2009/10
Wages 892475 1168353 1021205 1429190 1707307
Non-Wages 73319 191981 183633 155425 163526
Domestic 965794 1360335 1204838 1584615 1870833
Donor 0 0 0 0 0
Development 19168 21471 87722 44650 58337
Domestic 19168 21471 87722 44650 58337
Overall, the trend of total education expenditure is increasing. Major facility level like primary,
secondary, tertiary/university, and other education and ministerial/programs have been increasing
proportionately till 2008/09. In 2009/10, expenditure on other education program has increased
immensely. Recently, as a SWAp program, GoN has introduced a comprehensive School Sector
Reform Program –SSR allocating large sum of money in the sector.
Figure 3.4 — Facility level spending (in '000)
Derived from table 3.3.1
Recurrent and development spending by facility level in percentage is presented in table below:
Recurrent expenditure in primary level ranges from 87 % to 99.7%, development expenditure ranges
from 0. 3% to 13%. Proportion of wage in recurrent expenditure is 84.7% to 92.7% and non-wage is
7.3% to15.3%. Recurrent Expenditure has been sourced by domestic and donors. Contribution of
donors ranges from 11.3% to 29.5% during 5 years. Similarly, secondary, tertiary/university, other
education and ministerial/regional program’s details is presented in table 2.3:
Table 3.3 — Recurrent and development spending by facility level (%)
Actual 2005/06
Actual 2006/07
Actual 2007/08
Revised Estimate 2008/09
Budgeted 2009/10
Primary 100.0 100.0 100.0 100.0 100.0
Recurrent 90.8 92.8 90.1 87.0 99.7

Actual 2005/06
Actual 2006/07
Actual 2007/08
Revised Estimate 2008/09
Budgeted 2009/10
Development 9.2 7.2 9.9 13.0 0.3
Recurrent 100.0 100.0 100.0 100.0 100.0
Wages 92.7 87.4 87.7 88.0 84.7
Non-Wages 7.3 12.6 12.3 12.0 15.3
Domestic 72.0 71.2 72.4 70.5 88.7
Donor 28.0 28.8 27.6 29.5 11.3
Secondary 100.0 100.0 100.0 100.0 100.0
Recurrent 91.1 92.2 84.2 98.0 99.8
Development 8.9 7.8 15.8 2.0 0.2
Recurrent 100.0 100.0 100.0 100.0 100.0
Wages 94.9 91.0 87.4 87.7 89.1
Non-Wages 5.1 9.0 12.6 12.3 10.9
Domestic 90.8 89.7 89.1 82.5 81.2
Donor 9.2 10.3 10.9 17.5 18.8
Tertiary/University 100.0 100.0 100.0 100.0 100.0
Recurrent 93.7 88.2 91.6 94.8 86.3
Development 6.3 11.8 8.4 5.2 13.7
Recurrent 100.0 100.0 100.0 100.0 100.0
Wages 99.9 100.0 99.9 89.2 95.4
Non-Wages 0.1 0.0 0.1 10.8 4.6
Domestic 99.3 99.7 97.3 93.7 100.0
Donor 0.7 0.3 2.7 6.3 0.0
Other Education 100.0 100.0 100.0 100.0 100.0
Recurrent 99.6 99.8 94.8 99.6 72.0
Development 0.4 0.2 5.2 0.4 28.0
Recurrent 100.0 100.0 100.0 100.0 100.0
Wages 90.8 83.7 81.9 70.8 87.0
Non-Wages 9.2 16.3 17.2 29.1 9.3
Domestic 100.0 100.0 100.0 100.0 39.1
Donor 0.0 0.0 0.0 0.0 60.9
Ministerial / Regional 100.0 100.0 100.0 100.0 100.0
Recurrent 98.1 98.4 93.2 97.3 97.0
Development 1.9 1.6 6.8 2.7 3.0
Recurrent 100.0 100.0 100.0 100.0 100.0
Wages 92.4 85.9 84.8 90.2 91.3
Non-Wages 7.6 14.1 15.2 9.8 8.7
Domestic 100.0 100.0 100.0 100.0 100.0

Actual 2005/06
Actual 2006/07
Actual 2007/08
Revised Estimate 2008/09
Budgeted 2009/10
Donor 0.0 0.0 0.0 0.0 0.0
Source: Red Book of different years
The average annual growth of education expenditure by types and sources are shown in figure 3.5 Figure 3.5 — Average annual growth (2005/06-2009/10)
Derived from table 3.3.2
Total education expenditure is increasing by 14.5% annually. Average annual expenditure of
recurrent, wage, non wage, domestic, donor, development, domestic and donor is 14.4%. 13.7%,
19.9%, 13.9%, 16.2%, 15.7%, 19.2% and 13.8% respectively. Trend of non-wage under recurrent is
slightly higher than other expenditures. Recurrent and development expenditure by sector is
presented in table below.
Table 3.4 — Recurrent and development spending by sector (Rs in ‘000)
Actual 2005/06
Actual 2006/07
Actual 2007/08
Revised Estimate 2008/09
Budgeted 2009/10
Total Education Expenditure
19418448 21715045 27288441 39078456 46616672
Recurrent 17801268 20105233 24254493 35584075 42244531
Wages 16733037 17983467 21536129 31337347 36968310
Non-Wages 1068231 2121767 2718364 4246728 5276221
Domestic 14481585 16300200 19672984 27582251 32725108
Donor 3319683 3805033 4581510 8001824 9519423
Development 1617181 1609811 3033948 3494381 4372141
Domestic 352995 422375 730999 697842 1542343
Donor 1264186 1187437 2302949 2796539 2829798
Recurrent expenditure is much higher in comparison to development expenditure. However growth
rate of development expenditure is slightly higher than recurrent expenditure.

Figure 3.6 — Recurrent and development expenditure (in '000)
Derived from table 3.3.3
Proportion of wage expenditure is much higher than non-wage expenditure in recurrent expenditure
although increasing rate of non-wage is higher than that of wage expenditure.
Figure 3.7 — Wage and non-wage ex-expenditure (in '000)
Derived from table 3.3.3
Table 3.5 — Recurrent and development spending by sector (Percentage)
Actual 2005/06
Actual 2006/07
Actual 2007/08
Revised Estimate 2008/09
Budgeted 2009/10
Recurrent 91.7 92.6 88.9 91.1 90.6
Wages 94.0 89.4 88.8 88.1 87.5
Non-Wages 6.0 10.6 11.2 11.9 12.5
Domestic 81.4 81.1 81.1 77.5 77.5
Donor 18.6 18.9 18.9 22.5 22.5
Development 8.3 7.4 11.1 8.9 9.4
Domestic 21.8 26.2 24.1 20.0 35.3

Donor 78.2 73.8 75.9 80.0 64.7
Total Education Expenditure
100.0 100.0 100.0 100.0 100.0
3.6 Sources of Financing Education Budget
3.6.1 Government /Donor support
National education budget is supported by government and donors, 74 % is supported by
government and 26% is supported by donors in total education expenditure (2005/06 – 2009/10).
Government expenditure is increasing by 14.1% and donor is by 15.7%, total expenditure is
increasing by 14.6%.
Table 3.6 — Sources of Spending by Sector (Rs in ‘000)
Education 2005/06 2006/07 2007/08 2008/09 2009/10
Government 14834579 16722575 20403983 28280093 34267451
Donor 4583869 4992470 6884459 10798363 12349221
Total 19418448 21715045 27288441 39078456 46616672
Figure 3.8 — Sources of expenditure
Derived from table 3.4.1
Proportion of donor is higher in development expenditure than that of domestic source. But growth
rate of domestic source is slightly higher than donor source.
National budget for education is spent through Ministry of Education (MOE) from the center. The
major sources are domestic and donors. Recurrent as well as development expenditures are met by
these sources. Domestic source dominated the education expenditure. Many donor agencies are
contributing to meet the recurrent and development expenditure in this sector. Donors contribute in
terms of grant and loans. Table below depicts the source details of project financed with donor
assistance in terms of grant and loan and GoN counterparts in FY 2009/10:

Table 3.7 — Details of Sources for Project Financed with Foreign Assistance - 2009/10 (Rs in’000)
Projects Donors GoN Grants Loan Total
Second Higher Education Project IDA 5000 1265350 1270350
Education for All - Child Dev. UNICEF 44656 44656
Integrated School Education Structural ADB 2725 74100 76825
Community School Capacity Development ADB 383760 383760
School Sector Reform Program- SSR SSR- Recurrent 26490 229019 113877 369386
School Sector Reform Program- SSR SSR- Capital 1845 6355 2050 10250
Council for Technical Education Switzerland –SDC 284899 10000 294899
Skills for Employment Program ADB – Recurrent 56202 234158 290360
Skills for Employment Program ADB-Capital 8984 8916 17900
Food for Education – Primary WFP 131350 502720 634070
Population Education UNFPA 80 3365 3445
Education for All EFA Donor 739463 316913 1056376
School Sector Reform Program- SSR SSR Recurrent 1676327 5343102 1843542 8862971
School Sector Reform Program- SSR SSR -Capital 817373 2126507 685970 3629850
Secondary Education Support Program ADB 186000 186000
Secondary Education Support Program Denmark 434000 434000
Total 3011275 11162397 3391426 17565098
Major donors in the education sector are World bank-IDA, UNICEF, ADB, Switzerland- SDC, WFA,
UNFPA, EFA Donor and Denmark. The contribution is made by either cash, or reimbursable or direct
payment or commodity in grant category whereas direct payment, reimbursable, cash is used in loan
category. Chart below shows the contribution made by donors in education sector. SSR is the biggest
donor and UNFPA is the smallest.
Figure 3.9 — Donor contribution in education (2009/10)
Derived from table 3.4.2
3.7 Household Expenditures in Education Sector
3.7.1 Public sector expenditure per household in social sector
Central government and all tiers of local governments (DDC, VDC, and Municipality) are involved in
the development of social sector (i.e. education, health, drinking water) Table 3.8 gives the figures

for the government expenditure in social sector in the sample five districts – Dolakha, Chitwan,
Kavre, Kaski, and Kailali.
Table 3.8 — Public sector expenditure per HH (Rs in '000)
Expenditures for 2008-09 Amount Expenditure per HH (N=392836)
GON 5317524 13,540
District Development Committee
254746 650
Village Development Committee 301499 770
Municipality 680481 1,730
Sub-National Government 1236726 3,150
Public Sector Total 6554250 16,680
According to the population census 2001, the total number of households in the sample 5 districts
are 392,836. Table 3.8 above shows that the public sector expenditure per household for the FY
2008-09 is close to NRs 17,000. The share of central government expenditure is significantly high,
which comes out over 81 percent of the total expenditure. Sub-national governments share of about
Rs. 3,150 per household. Where as, Municipalities are found spending, on average, Rs. 1730 per HH,
DDCs and VDCs combined spend less than 1,500 per household. It can thus be noted that the urban
local government (municipalities) spend significantly higher amount per HH than rural local
governments.
Central government and all tiers of local governments (DDC, VDC, and Municipality) are involved in
the development of education sector. Table 3.9 gives the figures for the government expenditure in
social sector in the sample five districts – Dolakha, Chitwan, Kavre, Kaski, and Kailali.
Table 3.9 — Education sector expenditure per HH (Rs in 000)
Expenditures for 2008-09 Amount Expenditure per HH (N=392836)
GON 2174140 5,535
District Development Committee 13152 33
Village Development Committee 63008 160
Municipality 7259 18
Sub-National Government 83419 212
Education Sector Total 2257559 5,747
Table 3.9 above shows that the education expenditure per household for the FY 2008-09 is close to
NRs 6000. The share of central government expenditure is significantly high, which comes out over
96 percent of the total expenditure. Sub-national governments share is slightly above 200 per
household.

3.8 Sub-National Government Expenditure in Education
3.8.1 Sub-national Program Budget Analysis (2008/09)
Sub national PBA captures sectoral budget spent by district sectoral office (i.e.: education), District
Development Committee (DDC), Municipality and Village Development Committee (VDC) on
education sector. However, data segregating wage, non wage, recurrent and capital is not readily
available at sub national level.
Education expenditure is also made by the sub national entities. District education office receive
amount from central government and District Development Committee and Municipality generate
some funds from local tax. VDC also receive fund from central government via DDC. All agencies
made education expenditure for the district. Study team had selected 5 districts and 25 VDCs as
sample for estimating education expenditure.
More than 40% of total government expenditure of the district goes to education. DDC spends 5.16
%, VDC spends 21.0% and municipality spends just 1.07% on education. Majority of students of
municipality goes to private schools (which is not being captured by the study). In overall, 34.35% of
total expenditure of the district is spent on education.
Table 3.10 — Sub-nationals PBA (in %)
Level
Education Expenditure
GoN % DDC % VDC % Muni % Total %
Total District Expenditure (sectoral offices)
5317524
100.00
254746
100.00
301499
100.00
680481
100.00
6554250
100.0
Total District Edu Expenditure
2174140 40.89 13152 5.16 63312 21.00 7259 1.07
2257863
34.45
Dolakha 341812 6.43 350 0.14 26214 8.69 2177 0.32 370553 5.7
Kavre 460541 8.66 3300 1.30 16071 5.33 1517 0.22 481429 7.3
Chitwan 500463 9.41 1727 0.68 3434 1.14 281 0.04 505905 7.7
Kaski 382967 7.20 3500 1.37 5256 1.74 2225 0.33 393948 6.0
Kailali 488357 9.18 4275 1.68 12338 4.09 1059 0.16 506029 7.7
GoN through district education office are found spending highest amount followed by VDC, DDC and
municipality.

Figure 3.10 — Sub national education expenditure (2008/09)
Derived from table 3.6.1
3.9 Benefit Incidence Analysis: Education Government Expenditure on education is expected to improve the well being of beneficiaries and
enhance their capabilities to earn in future. In this sense, directing education expenditure to the
poor holds a promise for breaking the intergenerational transmission of poverty. Given this
perspective, the study addresses public expenditure and the distribution by quintile groups in
education especially primary, secondary and tertiary and university level. Tables given below show
the estimated enrollment and budget expenditure during 2005-2009.
Table 3.11 — Estimated enrolment in public educational institutions from 2005- 2009
Enrollment 2005 2006 2007 2008 2009
Primary 4502697 4515059 4418713 4516969 4617409
Secondary 2219240 2180852 2362245 2496793 2639004
Tertiary 203449 244268 272746 287580 303220
Figure 3.11 — Estimated student enrolment
Derived from table 3.7.1

National budget expenditure in education as stated in PBA is as follows;
Table 3.12 — Budget expenditure (2005-2009)
Expenditure/Budgeted 2005 2006 2007 2008 2009
Primary 11439238 12342835 15420140 23497443 17196554
total secondary 4698556 5251366 7298512 10307065 10053218
Tertiary 2075458 2428147 2955505 3550176 4449526
Source: Red Books
Figure 3.12 — Budget expenditure (in '000)
Derived from table 3.7.2
NLSS 2003/04 is the latest available data for benefit incidence at national level. The report discusses
the BIA for education sector of Nepal using two sets of data i.e. (i) Nepal Living Standard Survey
2003/04 data and (ii) Household Survey Data carried out for five districts of Nepal.
Per-student Government Subsidy for School Enrollment, by Facility Level
Benefit incidence has been assessed on the basis of NLSS 2003/04 data; Based on above tables, unit
subsidy in education in 2005/06 is as follows:
Table 3.13 — Unit subsidy
Level 2005/06
Primary 2541
Secondary 2117
Tertiary 10201
Based on NLSS 2003/04, Estimated School Enrollment Level by Expenditure Quintile and Facility
Level (2E) in 2005/06 is as follows:

Table 3.14 — Estimated School Enrolment Level by Expenditure Quintile and Facility Level
Level
Expenditure Quintile
Total Quintile 1 Quintile 2 Quintile 3 Quintile 4 Quintile 5
Primary 868942 1041294 998206 940755 660683 4502697
Secondary 133435 287939 470535 646108 681222 2219240
Tertiary 7139 7139 14277 32124 146341 203449
Figure 3.13 — Student enrollment by expenditure quintiles
Derived from table 3.7.4
Table 3.15 — Education expenditure by expenditure quintiles (in Rs.000)
Level
Expenditure Quintile
Total Quintile 1 Quintile 2 Quintile 3 Quintile 4 Quintile 5
Primary 2207982 2645928 2536441 2390458 1678796 11441353
Secondary 282482 609567 996123 1367811 1442147 4698131
Tertiary 72825 72825 145640 327697 1492825 2075383
Figure 3.14 — Education expenditure by quintile
Derived from table 3.7.5
Distribution of Benefits of Education Expenditures (%), by Expenditure Quintile and Facility based on
NLSS in 2005/06 is as follows:

Table 3.16 — Distribution of Benefits of Education Expenditures (%), by Expenditure Quintile and Facility
Level
Expenditure Quintile
Total Quintile 1 Quintile 2 Quintile 3 Quintile 4 Quintile 5
Primary 19.3 23.1 22.2 20.9 14.7 100.0
Secondary 6.0 13.0 21.2 29.1 30.7 100.0
Tertiary 3.5 3.5 7.0 15.8 71.9 100.0
Figure 3.15 — Distribution of benefit of education expenditure
Derived from table 3.7.6
3.10 Analysis of Benefit Incidence A simple line of equity based upon table 5.9 has been used to measure the benefit incidence of
public spending on education, analysis of benefit incidence revealed that public spending on primary
education is slightly progressive indicating pro-poor. Public spending on secondary education which
includes spending on lower secondary, secondary level and higher secondary level is regressive
indicating not so pro-poor. Spending on tertiary is highly regressive as shown in figure. Figure 3.16 — Benefit incidence of education spending (2005/06)
Derived from table 3.7.6
3.11 BIA Based on Survey Data Study team conducted survey to assess the benefit incidence in education for 2009. Since data for
unit subsidy was not available so national level data of enrollment and expenditure have been taken

for unit subsidy calculation. Quintiles distribution has been taken from the survey. A questionnaire
had been prepared, 3858 households (villages and municipalities) had participated in the survey. The
quintiles had been identified by simple breakpoint of 772 households in each quintile.
Table 3.17 — Quintiles distribution
Quintile People (Lower Bound, Upper Bound)
1 Quintile (1,772)
2 Quintile (773, 1543)
3 Quintile (1544, 2315)
4 Quintile (2316, 3086)
5 Quintile (3087, 3858)
The quintiles by expenditure level had been identified as follows
Table 3.18 — Quintiles by Expenditure Level
Quintiles Yearly Expenditure
Quintiles 1 Below 15885
Quintiles 2 15886 – 22560
Quintiles 3 22561 – 30396
Quintiles 4 30397 – 41910
Quintiles 5 Above 41911 (256800)
Per unit subsidy has been taken from national estimated per unit subsidy of 2009. Table 3.19 — per unit subsidy
Education Estimated Unit Subsidy (National)
Primary 3724
Secondary 3809
Tertiary 14674
Total 22207
Table 3.20 — Estimated School Enrolment by Expenditure Quintile and Facility Level
Education
Expenditure Quintile
Quintile 1
Quintile 2
Quintile 3
Quintile 4
Quintile 5 Total
Primary 136 222 104 94 79 635
Secondary 109 122 135 146 162 674
Tertiary 9 14 23 37 125 208

Figure 3.17 — Student enrolment expenditure quintile (survey)
Table 3.21 — Education Expenditure by Expenditure Quintiles
Education
Expenditure Quintile
Quintile 1
Quintile 2
Quintile 3
Quintile 4
Quintile 5 Total
Primary 506464 826728 387296 350056 294196 2364740
Secondary 415181 464698 514215 556114 617058 2567266
Tertiary 132066 205436 337502 542938 1834250 3052192
Table 3.22 — Distribution of Benefits of Education Expenditures (%)
Education Expenditure Quintile
Quintile 1 Quintile 2 Quintile 3 Quintile 4 Quintile 5 Total
Primary 21 35 16 15 12 100
Secondary 16 18 20 22 24 100
Tertiary 4 7 11 18 60 100
Figure 3.23 — Distribution of benefits of education expenditures (survey)
3.11.1 Calculation of BIA
Based on survey data 2008/09, it is found that public spending on primary is progressive whereas
spending on secondary and tertiary education is regressive. Figure 3.20 — Benefit incidence of education spending (survey)

Derived from table 3.9.5
Comparing with BIA based on NLSS data 2003/04, it is found that access of lower quintile to tertiary
and university education has been improving slowly. Access of lower quintiles to primary education
is increasing. Similarly, benefit of primary education to higher quintiles is decreasing. Quintile 2 is
being benefited rapidly in all type of education facility. Benefit to quintile 5 is decreasing in all
education facility level indicating that this quintile has been shifting to private education.
In primary education, there is increment in quintile1 and quintile 2 by 2% and 12% respectively
whereas there is decrement in quintile 3, 4 and 5 indicating that population of later quintiles are
shifting to other alternatives.
Figure 3.21 — Primary education benefit distribution (2005/06-2009/10)
In secondary education, the access of lower quintiles is increasing rapidly but there is a decrement in
higher quintiles.

Figure 3.22 — Secondary education benefit distribution (2005/06 – 2009/10)
In Tertiary education, the access of quintile 1 has not been changed much but the access of quintile
2, 3 and 4 is increasing. There is a significant decrement in quintile 5.
Figure 3.23 — Tertiary education benefit distribution (2005/06 – 2009/10)
There is sharp decrease of tertiary education in quintile 5 meaning that a large population has been shifted to other alternatives, either choosing private schools or opting for studying abroad.

Chapter FOUR
Drinking Water Sector Program Budget and Benefit Incidence Analysis
4.1 Background
Safe drinking water is one of the most basic of human needs. Access to water and sanitation plays a
crucial role in the overall social and economic development of a community. Health hazards caused
by unsafe water supplies are recognized as major problems in developing countries. “…. An
estimated 80% of all diseases and over one-third of deaths in developing countries are caused by the
consumption of contaminated water, and on average, as much as one-tenth of each person’s
productive time is sacrificed to water related diseases”. (GON, 2008))
Every year about 45,000 children below the age of five years die in Nepal from water related
diseases caused by inadequate supplies of water and/ or its poor quality and poor sanitation.
Improving the quality of the water supply and sanitation has been shown to reduce the morbidity in
a significant way. The projected reduction in morbidity due to improvement in water supply and
sanitation are estimated by WHO (1992) as; Cholera, Typhoid, Dracunculiasis (80-100%);
Schistosomiasis (60-70%); and Dysentery, Diarrheal diseases (40-50%). The median anticipated
reduction in child mortality was estimated at 55% due to improved water supply and sanitation. This
indicates that improving water and sanitation is a critical step towards protecting public health in a
significant way. (Dinesh, 2007)
Adequate water supply nearby to the community is a key issue in Nepal. Women in particular are
often deprived of opportunities to engage in income generating activities because of the need to
spend hours in fetching water. It is estimated that a minimum of 30 per cent of the total time saved
in fetching water could be used for other economically productive activities. Inadequate water
supplies nearby can also have a significant impact on sanitation. (Dinesh, 2007)
The Department of Water Supply and Sewerage’s database shows that 80 per cent of households
use an improved drinking-water source (DWSS 2010), exceeding the 2015 target of 73 per cent. A
larger proportion of households in urban areas (94 per cent) have access to improved drinking water
sources than in rural areas (78 per cent). However, access for urban households is yet to reach its
target of 95 per cent, while access for rural households has exceeded its target of 72 per cent. Access

to a sanitation facility is also much higher in urban areas (78 per cent) than in rural areas (37 per
cent) (DWSS 2010), averaging around 43 %, far less than the MDG target of 67 per cent by 2015.
(NPC, 2010)
Distribution of households shows that 57.8 per cent use piped water, 38 per cent use hand
pump/boring, four per cent use protected spring or dug-well and only 0.2 per cent use other sources
such as rainwater harvesting (Figure 7.8) (DWSS 2010). The most common source of drinking water
in the Mountains and Hills is piped water; whereas hand pump, deep tube well and protected dug-
well are the main sources of drinking water in Terai areas. (NPC, 2010)
4.2 Government Expenditures in Drinking Water and Sanitation According to the data published in the Budget Red Book, GoN on average spent 6.78 percentage of
GDP in drinking water sector during last five year (2005-2009). This share was only 3.71 percent in
2005 which stood at 9.79 percent in 2009.
Data on national program budget and expenditures in drinking water in the past five years is
provided in the Table 4.1.
Table 4.1 — Recurrent and development spending by facility level - drinking water
2005 2006 2007 2008 2009
Recurrent 392740713 446176315 426084032 505406000 590172000
Wages 310192151 351230113 302006954 390842000 454088000
Non-Wages 82548562 94946203 124077078 114564000 136084000
Domestic 343439954 333262763 367231152 440260000 563658000
Donor 49300759 112913553 58852880 65146000 26514000
Capital (development) 1640115034 2804952576 3236934376 5491651000 8049933000
Domestic 572317398 1079427256 1659362081 1944720000 7018330000
Donor 1067797636 1725525320 1577572295 3546931000 1031603000
GDP 548485 million 611118 million 676210 million 756756 million 882955 million
Drinking water expenditure as a percentage of GDP
3.71 5.32 5.42 7.92 9.79
Total DW Expenditure 2032855747 3251128891 3663018408 5997057000 8640105000
Source: Extracted and calculate from Red Book, Ministry of Finance

Fig 4.1 — Government expenditure in drinking water and sanitation (Rs in Millions)
0
1000
2000
3000
4000
5000
6000
7000
8000
9000
10000
2005 2006 2007 2008 2009
Recurrent Capital (development)
Source: Table 4.1
The growth of public expenditure over the five years is impressive. The trend is given in figure 4-2.
The growth trend shows that the expenditure on 2009 has grown up over 4 fold than that of in 2005.
Government expenditure in drinking water sector is increasing not only in current price but in
constant price as well. Fig 4.2 shows that government spent about Rs 1627 million (measured at
constant price) in 2005 which stood up to Rs. 5042.46 million in 2009. That is there is more than
threefold increase in public expenditure in drinking water sector. This is the indication of
government priority for this sector.
Figure 4.2 — Total expenditure in drinking water at constant price (in Rs. million)
1626.964758
2474.476696 2580.067346
3817.163478
5042.462709
2005 2006 2007 2008 2009
Fig 4.2: Total Expenditure in Drinking Water at Constant Price (in Rs Million)
Source: Calculated from the data available in Red Book and Economic Survey
4.3 Sources and Uses of Funds in Drinking Water Public sector expenditures in drinking water and sanitation are made through domestic and donor
sources. The share of domestic sources and donor sources in the sector expenditures is shown in
Figure 4.3.

Figure 4.3 — Sources of funding drinking water expenditure
0%
10%
20%
30%
40%
50%
60%
70%
80%
90%
100%
2005 2006 2007 2008 2009
Fig 4.3: Sources of Funding Drinking Water Expenditure
Donor Domestic
Source: Calculated from data available in Red Book
The figure clearly shows the importance of donor funding in the drinking water sector of Nepal. Out
of last five years, share of donor source is more than fifty percent for three years. For 2009, share of
domestic source seems to be considerably high. But this may be the fact that the data for this year is
only the estimated but not realized data.
4.4 Capital and Recurrent Expenditures in Drinking Water Where actually the expenditure in the drinking water and sanitation sector is being utilized is a
matter of inquiry in program budget analysis, Table 4-2 gives the percent allocation in capital and
recurrent expenditures in the past 5 years. The table shows that the amount of recurrent
expenditures has been below 10% in the later days; however, it has been almost one-fifth in the year
2005.
Table 4.2 — Recurrent and development spending by facility level - drinking water (in Rs.)
Year 2005 2006 2007 2008 2009
Recurrent 392740713 446176315 426084032 505406000 590172000
(19.32%) (13.72%) (11.63%) (8.43%) (6.83%)
Development 1640115034 2804952576 3236934376 5491651000 8049933000
(80.68%) (86.27%) (88.36%) (91.57%) (93.17%)
Total 2032855747 3251128891 3663018408 5997057000 8640105000
Source: Calculated from data available in Red Book
More importantly, it is also noticeable that the growth has been remarkable in capital expenditures
than in recurrent – while the capital expenditure grew by almost 5 folds during the period it is 1.5
times in case of recurrent expenditures. Capital expenditure is increasing not only in absolute term
but its share in the total expenditure is also increasing in last five years. Share of capital expenditure
was about eighty percent in the year 2005 which increased to 91 percent in 2008 and 93 percent in
2009 (Fig 4.4).
Figure 4.4 — Share of capital expenditure in total drinking water expenditure (in percentage)
74
76
78
80
82
84
86
88
90
92
94
96
2005 2006 2007 2008 2009
Fig 4.4: Share of Capital expenditure in Total Drinking Water Expenditure (in percentage)
Source: Calculated from table 4.2
Declining share of recurrent expenses while growing total expenditure in drinking water and
sanitation suggests that the efficiency of program budgeting has been increasing.
Figure 4.5 — Share of donor fund in recurrent and capital expenditure
0
10
20
30
40
50
60
70
2005 2006 2007 2008 2009
Fig 4.5: Share of Donor Fund in Recurrent and Capital Expenditure
Donor (Recurrent expenditure) Donor (Capital expenditure)
Source: Calculated from table 4.1
As mentioned earlier, there is very high contribution of donor communities in drinking water sector.
More than fifty percent of the capital expenditure and more than ten percent of recurrent
expenditure is met by donor’s funding. Somewhat different picture is seen for the year 2009 but it
should be kept in mind that the data for this year is only estimated data.
4.4.1 Wage and non-wage expenditure Large chunk of the recurrent expenditure goes to the wage expenditure. Data reveals share of wage
and non-wage expenditures to the total recurrent expenditure is about 77% and 23% respectively.

Figure 4.6 — Share of wage expenditure
0
20
40
60
80
100
120
2005 2006 2007 2008 2009
Fig.4.6: Share of Wage Expenditure
Share of Wage to the Recurrent Expenditure Funded by Domestic Source
Share of Wage to the Total Expenditure Funded by Domestic Source
Share of Wage Expenditure in Recurrent Expenditure
Source: Calculated from table 4.1
Similarly more than eighty percent of recurrent expenditure financed by domestic source goes to the
wage expenditure and about twenty percent of total expenditure funded by domestic source goes to
this head.
4.5 Drinking Water Sector Expenditures by Level and Types Table 4.3 gives an overview of the national program expenditure in drinking water and sanitation
sector in Nepal. The table shows that Melamchi drinking water project is the biggest expenditure
program which consumes almost one-third of the total drinking water and sanitation budget. Second
to Melamchi, that consumes over one-fourth of the total budget is isolated drinking water projects.
Rural drinking water and sanitation fund is third in terms of budget, followed by community drinking
water and sanitation project. These four programs together constitute 92.4% of the total budget.
The types of programs show that budget for rehabilitation of drinking water schemes and drinking
water quality improvement have together got slightly more than one percent of the total budget.
This suggests that the national priority has been in the area of expansion of drinking water and
sanitation services, rather than maintenance of the quality and service quality in terms of water
quality, supply regularity and adequacy.
Table 4.3: National programs in drinking water and sanitation sector
Name of expenditure programs Amount (2008-09) (in Rs.) Expenses by program (%)
Department of Drinking Water & Sewerage 29,258,000 0.49
Extensive Drinking Water Rehabilitation Project 30,276,000 0.51
Deep Tube-well & Metering Project -Repair 12,449,000 0.21
Drinking Water Quality Improvement Project 83,829,000 1.40
Rural Drinking Water & Sanitation Fund 1,129,992,000 18.93
Rural Drinking Water Project (Western Region) 18,789,000 0.31
Small Town Drinking Water & Sanitation Project 276,924,000 4.64
Melamchi Drinking Water Project 1,894,624,000 31.75
Community Drinking Water and Sanitation Project 984,372,000 16.49
Improved Quality Water, Sanitation & Service Delivery 30,992,000 0.52
Drinking Water Projects 1,505,552,000 25.23
Total 5,967,799,000 100.00
Source: Extracted and calculated from Red Book

The analysis points out towards the tendency of concentration of resources among few projects and
programs.
4.6 Mechanism of Public Sector Expenditure in Drinking Water and Sanitation In Nepal, ensuring access to water and sanitation facilities is devolved to local government through
the Local Self Governance Act (LSGA). Sector policies prescribe a supporting role to the department
of the line ministry (Shrestha and Wicken, 2008). However Central government and District
Development Committees are also involved for developing central and district level projects. Beside
the government involvement in providing water and sanitation facilities, several I/NGO’s and donor
agencies like ADB, WB, UNICEF, FINIDA etc (for whole list see Shrestha and Wicken, 2008) are also
involved in this sector. The flow of funds into a district for water and sanitation is as shown in the
4.7.
Figure 4.7 — Water supply and sanitation financing blocks and fund flows
Source: Adopted from Shrestha and Wicken (2008)
4.7 Benefit Incidence Analysis- Using NLSS II Data In NLSS II questionnaire, drinking water related questions are found in Section 2, Housing, and Part
C. There are three questions that give information regarding source and expenses of drinking water.
First question asks the source with four options (a) Piped water supply (b) Covered well/Hand Pump
(c) Open well and (d) Other Water sources. Second question asks the question for those who have
access to piped water asking whether the housed hold has piped water facility in house or outside
the house. If piped water is inside the house then it is assumed to have private connection otherwise
household is assumed to have public connection. Third question asks the total payment made by
household for drinking water for one year.
Ministry of Local Development
Ministry of Physical
Planning
Donors
Inter Governmental Transfers
Local Government Revenue
Community WSS User Group Fee
Ministry of Physical Planning
Department of Water Supply and Sanitation
Sector Projects
Community WSS Services
Off Budget Projects
NGOs

According to NLSS II, 43.9 percent of household have access to piped drinking water facility in
comparison to 32.8 percent household in 1995/96. Similarly, only 14 percent of households in Nepal
have access to drinking water piped to the house and 30 percent have their drinking water piped but
outside the house. The remaining 56 percent of households depend on covered well (37 percent),
open well (5 percent) and others (14 percent) (CBS, 2004).
In the development region, Central Development Region (CDR) has highest percentage (20.5
percent) of household having access to drinking water piped to the house followed by Western
Development Region (WDR) (14.1 percent), Eastern Development Region (EDR) (12.6 percent). Far
Western Development Region (FWDR) has lowest percent (3 percent) of household having access to
piped drinking water to the house followed by Mid Western Development Region (MWDR) (7
percent). In case of access to the piped drinking water outside of house (public connection), WDR
has the highest percentage (45 percent) of household having access followed by FWDR (29.5
percent), MWDR (28.3 percent), CDR (27.8 percent) and EDR (19.6 percent).
Figure 4.8 — Access to the piped drinking water by development region (in percentage)
12.6
20.5
14.1
7
3
19.6
27.8
45
28.3
29.5
East
Central
West
Mid West
Far West
Fig.4.8: Access to the Piped Drinking Water by Development Region (Percentage)
Piped to House Piped Outside of House
Source: CBS (2004)
In ecological belt, hill area has the highest percentage (23.5 percent) household having access to
drinking water piped to the house followed by mountains (10.5 percent) and Terai (6.2 percent).
Similarly, mountain region has the highest percentage (61.8 percent) household having access to
drinking water piped outside of house followed by hill area (46.3 percent) and Terai (8.5 percent).
Terai region has lower percentage of household having access to the piped water because it’s quite
easy to fetch water from well at free of cost. So people may not prefer to use piped water where
they have to pay some money. In Rural-Urban case, 53.3 percentage of urban household have access
to drinking water piped to the house in comparison to only 6.7 percent rural household. Similarly
32.5 percentage of rural household have access to drinking water piped outside of house in
comparison to 1.3 percent rural household. This indicates that relatively well off section of the
society (i.e. urban people) have more freedom to use drinking water than relatively worse off
section.

Figure 4.9 — Access to piped drinking water by ecological belt and rural-urban
10.5
23.5
6.2
53.3
6.7
61.8
46.3
8.5
14.3
32.5
Mountains
Hills
Tarai
Urban
Rural
Fig 4.9: Access to Piped Drinking by Ecological Belt
and Rural-Urban (Percentage of HH)
Piped to House Piped Outside of House
Source: CBS (2004)
Access to piped water is positively associated with household consumption. 39 percent of
households in the richest quintile have their drinking water piped to their housing units. This figure is
only 3 percent among households in the poorest quintile.
Figure 4.10 — Access to piped drinking water by expenditure quintile (percentage of HH)
2.6
5.2
5.7
10.8
39
25
28.7
33.2
34.5
25.8
Poorest
Second
Third
Fourth
Richest
Fig. 4.10: Access to Piped Drinking Water by Expenditure Quintile (Percentage of HH)
Piped to House Piped Outside of House
Source: CBS (2004)
4.7.1. Calculation of BIA Benefit Incidence Analysis has been calculated with following four steps.
Estimation of Unit Subsidy Unit subsidy has been calculated by dividing total public expenditure by number of people using
piped drinking water facility. Although government expenditure may be in the hand pump and
various kinds of well as well, the data of NLSS II does not identify which household is using
government funded well and which household not. This distinction has not been made for piped
water as well. But the existing practice in Nepal is that piped water is provided either through public
sector or by any I/NGO through users group. Regarding I/NGO, neither there is information about
I/NGOs involvement for particular piped drinking water nor any information about the expenditure
made by them in NLSS II data. So it is assumed that all public sector expenditure in drinking water
sector goes to provide piped water.
Calculation of unit subsidy requires the number of people using the service. NLSS II has recorded
information for 21,531 people. The data file also includes the sample weight. So the total population

with access to piped drinking water has been estimated using weight as importance weight in STATA
software.
The estimation shows that total population having access to pipe drinking water facility is 9,483,345.
According to the Red Book, Government of Nepal spent Rs 2,602,874,000 in drinking water sector in
the year 2003/04. The calculation as shown in Table 4.4 gives unit subsidy equal to Rs 223.47 per
person per year.
Table 4.4 — Calculation of Unit Subsidy
Variable Value Source
Total population having access to piped drinking water (A) 9483345 Estimated from NLSS II
Total public expenditure in drinking water in year 2003 (B) Rs 2602874000 Red Book
Unit Subsidy Rs. 274.46 (USD 3.64)* B/A
* using exchange rate of 2003 US$1= Rs.75.3
Since the public expenditure data has not been disaggregated into private connection and public
connection, it is not possible to calculate unit subsidy separately for these two types of connection.
The unit subsidy calculated above does not consider payment made by individual for drinking water.
The net unit subsidy, as given in equation (1.1) has been obtained by subtracting payment made by
each individual from unit subsidy. The NLSS II provides the household level payment for drinking
water. Individual level payment has derived after dividing by household size.
Identifying Expenditure Quintile Benefit incidence requires to aggregate users across expenditure or income quintile. Since Nepal has
huge informal sector, expenditure has been taken as a measure of how “well off” an individual is
instead of income. Central Bureau of Statistics (CBS) has categorised each individual under Nominal
Per Capita Consumption Quintile for NLSS II data set and it is available with data provided by CBS.
Table 4.5 shows the number of individuals in each quintile estimated using ranking provided by CBS
and weight as importance weight.
Table 4.5 — Number of people by types of connection and expenditure quintile
Connection
type
Consumption quintile
Total 1 2 3 4 5
Private 682839 671365 667972 576658 538339 3137173
Public 1310357 1324268 1290430 1224426 1196691 6346172
Total 1993196 1995633 1958402 1801084 1735030 9483345
Source: Estimated from NLSS II
The table shows the different number in each quintile. This is because the NLSS II has generated
consumption quintile for household and household vary in their size.

Total Subsidy for Different Quintile Total subsidy has been calculated as the sum of the net subsidy received by users in each quintile.
Table 4.6 exhibits total subsidy for private and public connection of drinking water.
Table 4.6 — Drinking water subsidy by expenditure quintile and types of connection (in Rs.)
Connection Type Consumption quintile
Total 1 2 3 4 5
Private 115071966.8 76457241.56 68366687.1 11648657 -49887394 221657158.7
Public 343586180 342979108.5 342248128 324175306 318430871 1671419593
Total 458658146.8 419436350 410614816 335823963 268543477 1893076752
Source: Authors calculation from NLSS II data
Table 4.6 shows that net subsidy for fifth quintile is negative. The negative subsidy shows that the
quintile group is paying more for the piped drinking water. Following
http://siteresources.worldbank.org/INTPAH/Resources/Publications/Quantitative-
Techniques/health_eq_tn12.pdf (page 5), the negative net subsidy has been changed to zero for
calculating benefit incidence.
Calculating the Benefit Incidence Based on the table 4.7, the benefit incidence (percentage) has been determined as below.
Table 4.7 — Benefit incidence for drinking water by connection type
Connection Type
Consumption Quintile
Total 1 2 3 4 5
Private 42.38% 28.16% 25.18% 4.29% 0.00% 100.00%
Public 20.56% 20.52% 20.48% 19.40% 19.05% 100.00%
Total 23.61% 21.59% 21.13% 17.28% 16.39% 100.00%
Source: Derived from table 4.6
Table 4.7 exhibits that government subsidy for drinking water seems to be fairly equal for all quintile
of the population for public connection while it is highly pro-poor for private connection. The benefit
incidence by quintile group in the private connection shows a declining level of subsidy with increase
in the quintile group. This seems fairly reasonable because;
a. Private connections are confined mostly in the urban areas, where the water supply company
put meters and charge the household according to the monthly water uses by the HH,
b. There is a flat fee for drinking water services up to certain unit per month and the rate
increases once it crosses the minimum units. Besides, drinking water charges varies with the
size of the pipe used for connection. A half inch connection is charged less than three fourth
of an inch connection or more. As such, the quintile group using minimum units of drinking
water pays less and enjoys more subsidy than that of the groups using more water.
c. People having private connection in the urban areas pay more for the piped drinking water.
Urban area water distribution in Nepal shows that, around forty percent of total users’ of private
connections of drinking water reside in Kathmandu who pays, on average, Rs. 1664 per year for

drinking water and other 35 percent of total users’ of private connections of drinking water reside in
other urban area who, on average, pay Rs.1461. Similarly more than 55 percent of total users of
private connection of drinking water reside in urban area and more than fifty percent of users of
private connection in Kathmandu lie in fifth quintile (see table Annex 4.2). The reason for fairly
equitable distribution of subsidy for public connection is that majority of people residing in rural
area in mountain and hill region gets mostly free services and even if they have to pay, it is only a
very nominal amount for drinking water services. This is true even in the case of public connection in
the urban areas.
Concentration Curve and Concentration Index As mentioned in the section 4.6, benefit incidence can be evaluated by calculating concentration
index using equation (4.2).
Table 4.8 — Evaluation of benefit incidence
Types of Connection Concentration Index Distribution of Benefit
Public 0.004101 Slightly Regressive
Private -0.390 Highly progressive
Source: Authors Calculation
Note: For details of calculation see table Annex 4.3
The value of concentration index indicates that public connection is slightly regressive towards
receiving public subsidy while private connection is highly progressive. As mentioned earlier the
possible reason for such distribution is that majority of users of private connection reside in urban
area who pay price for water far higher than subsidy and who falls in fourth or fifth quintile while
majority of public connection users are in rural area and distribution of population and hence
subsidy is almost equal. Fig.4.8 shows the corresponding concentration curve.
Figure 4.8 — Concentration curve for drinking water subsidy
0
0.2
0.4
0.6
0.8
1
1.2
0 0.2 0.4 0.6 0.8 1
Fig.4.8: Concentration Curve for Drinking Water Subsidy
Line of Equality Private Connection Public Connection
Source: Calculated from table Annex 6-3

4.8 BIA Using Field Survey Data The questionnaire has asked questions regarding source of drinking water and household
expenditure beside others. Table 4.9 below shows the distribution of households in quintile by the
type of water sources used by a household (details for each district is provided in Annex 4.1).
As in other districts of the country, government has spent huge amount of money for drinking water
provision. The figure with regard to the public sector expenditure on drinking water and sanitation
for the FY 2008-09 in these five districts is shown in the Table 4.9below.
Table 4.9 — Drinking water and sanitation expenditures vis-à-vis total public sector expenditure
GoN DDC VDC Mun Total
Rs % Rs % Rs % Rs % Rs %
Total Expenses 5317524 100 254746 100 301499 100 680481 100 6554250 100
Drinking Water 226247 4.25 37215 14.61 33121 10.99 5249 0.77 301832 4.61
The table shows that expenditures in drinking water and sanitation by public sector agencies
comprise more than 4.6 per cent of the total public sector expenditure. The share in case of DDCs
and VDCs is very high, 14.6 and 11% respectively among the public sector agencies. The
municipalities spend less than one percent. Central government expenditures stand at 4.25%, which
is close to the national figures of 4.6%.
Figure 4.11 — Drinking Water and Sanitation Expenditure as a Percentage of Total Expenditure
4.25
14.61
10.99
0.77
GoN DDC VDC Mun
Table 4.10 shows that about 52% of the public subsidy on drinking water goes for private
connections, while for public taps the subsidy is around 48%. It is generally taken that the subsidy for
public taps tends to be more pro-poor than private connections in the context of Nepal. In this
regard the public expenditure in drinking water and sanitation is slightly dominated by private
connections, which is less pro-poor.

Table 4.10 — Quintile distribution of households by source of drinking water
Quintile No. of
Households No. of households using
public taps No. of households with
private connection Percent households with
private connection
Lowest 125 49 76 60.8%
Second 124 55 69 55.6%
Third 125 66 59 47.2%
Fourth 125 66 59 47.2%
Highest 126 65 61 48.4%
Total 625 301 324 51.8%
Interestingly, the lowest quintile is the group of population that uses highest number (about 61%) of
private connections in the sample five districts. However, it is noted that of the 76 connections of
the lowest quintile 56 are in one district (Chitwan) alone. If the district of Chitwan is an outlier then
the connection in the lowest quintile falls far below to 30%. Table 4.11 gives the figures for the
situation of four districts shunning Chitwan as the outlier.
Table 4.11 — Quintile distribution of households by source of drinking water in the four districts
Quintile No. of
Households No. of households using public taps
No. of households with private connection
Percent households with private connection
Lowest 67 47 20 29.9%
Second 102 54 48 47.1%
Third 111 66 45 40.5%
Fourth 111 66 45 40.5%
Highest 109 65 44 40.4%
Total 500 298 202 40.4%
Comparison of Table 4.9 and 4.10 suggests that the proportion of households provided with private
connections for drinking water reduces significantly by 11 percent point to slightly more than 40% in
the other districts.
Table 4.12 gives the figures for the government expenditure in drinking water and sanitation sector
in the sample five districts – Dolakha, Chitwan, Kavre, Kaski, and Kailali.
Table 4.12 — Public sector expenditure per HH (Rs in ‘000)
Expenditures for 2008-09 Amount Expenditure (Rs 000) per HH (N=392836)
GON 5317524 13.54
District Development Committee 254746 0.65
Village Development Committee 301499 0.77
Municipality 680481 1.73
Sub-National Government 1236726 3.15
Public Sector Total 6554250 16.68
According to the census 2001, the total number of households in the sample 5 districts is 392,836.
Table 4.5 above shows that the public sector expenditure per household for the FY 2008-09 is close
to Nrs 17,000. The share of central government expenditure is significantly high, which comes out
over 81 percent of the total expenditure. Among the sub-national governments share of slightly
above 3,000 per household, the DDCs and VDCs combined spend less than 1,500 per household. It

can thus be noted that the urban local government (municipalities) spend significantly higher
amount per HH than rural local governments.
4.8.1 Methodology, Assumptions and Calculation of BIA9
Calculation of Unit Subsidy According to the population census 2001, total population of the surveyed five districts is 2059173.
According to present survey percentage of people having access to pipe drinking water is 64 percent.
We assume that this survey represents the whole five districts. So population in the surveyed district
who has access to piped drinking water is assumed to be 64 percent of total population. Based on
the assumption, following table shows the calculation of unit subsidy.
Table 4.13 — Table showing calculation of unit subsidy for five districts
Variable Value Source
Total Population of the Districts (A) 2059173 Census 2001
Percent of people having access to piped drinking water (B) 64 Field Survey
Total population having access to piped drinking water (C) 1317871 (A*B)/100
Total public expenditure in drinking water in survey year (D) Rs 6554250000 Red Book and Records of VDC and DDC
Unit Subsidy Rs. 497.34 (USD 6.84) D/C
Since the public expenditure data has not been disaggregated into private connection and public
connection, it is not possible to calculate unit subsidy separately for these two types of connection.
The unit subsidy calculated above does not consider payment made by individual for drinking water.
The net unit subsidy has been obtained by subtracting payment made by each individual from unit
subsidy. The survey provides the household level payment for drinking water. Individual level
payment has derived after dividing by household size.
Identifying Expenditure Quintile As in previous case expenditure quintile has been calculated for individual data. But the difference is
that the expenditure, in this case, has been divided equally to all household members, irrespective
of their age and sex. This is because the survey lacked the information regarding age of household
members. Table 4.14 shows the information regarding expenditure quintile group.
Table 4.14 — Population by Source of Drinking Water and Expenditure Quintile in Surveyed District
Source of Drinking Water Expenditure Quintile
1 2 3 4 5 Total
Public Connection 377 364 370 372 367 1,850
Private Connection 124 125 121 122 122 614
Well Covered 5 33 0 0 15 53
Well Open 38 14 7 20 8 87
9 Assumptions in this section are same as in previous analysis using NLSS II data unless mentioned otherwise.

Hand Pump/ Machine Pump 320 290 211 176 222 1,219
River and other 7 21 0 7 0 35
Total 773 771 772 771 771 3,858
Source: Calculated from field survey data
Table shows that public connection and hand pumps are major source of drinking water for poorest
people while richest people depend on private connection as well. Private connection increases with
the increase in the expenditure quintile.
Total Subsidy for Different Quintile Total subsidy has been calculated by multiplying unit subsidy and number of people in each quintile.
Table 4.15 exhibits total subsidy for private and public connection of drinking water. Although table
4.14 shows the various source of drinking water but BIA has been carried out only for first two types
of sources i.e. private and public connection. This is because there is no information regarding
government’s involvement in other source precisely. In some cases government provide subsidy for
hand pump and machine pump but in most of the case hand pump is installed by people in their own
expenditure. Same is true for other sources as well. So our assumption is that public expenditure
goes only to the public and private connection.
Table 4.15 — Total subsidy in Rs. by types of connection and expenditure quintile
Source of Drinking Water Expenditure Quintile
1 2 3 4 5
Public Connection 181496.8 177719.36 181059.5 181629 178872.13
Private Connection 34579.88 61987.5 56977.69 30025.42 25975.02
Source: Derived from table 4.14
Calculating Benefit Incidence Based on Table 4.15, benefit incidence is shown in the table 4.16.
Table 4.15 — Benefit incidence for drinking water from surveyed data
Source of Drinking Water Expenditure Quintile
1 2 3 4 5
Public Connection 20.15% 19.73% 20.10% 20.16% 19.86%
Private Connection 16.50% 29.58% 27.19% 14.33% 12.40%
Source: Derived from table 4.14
The benefit incidence shows that there is approximately equitable distribution of public expenditure
for public connection in drinking water. This result is backed by the result from NLSS II as well. In
case of private connection the result is slightly different. In NLSS II, the distribution was more for
poor people but in this case middle class people are getting more.
The difference may be due to time and district specific characteristics. For example Chitwan districts
is supposed to be highly developed district in comparison to other four district while in Kailali district
most of the people find easy to dig up well in their home instead of paying monthly fee for running
water sources.

Concentration Index and Concentration Curve As mentioned in the section 1.3, benefit incidence can be evaluated by calculating concentration
index using equation (1.3).
Table 4.16: Evaluation of Benefit Incidence
Types of Connection Concentration Index Distribution of Benefit
Public 0.001996 Slightly Regressive
Private -0.08839 Highly progressive
Source: Authors Calculation
Although the benefit incidence from survey data showed slightly different result than result from
NLSS II data, concentration index showed same result. The following concentration curve also shows
similar result.
Figure 4.10 — Concentration curve for public and private connection of drinking water

Chapter FIVE
Summary, Conclusion and Policy Recommendations
5.1 Summary
5.1.1 Health Over the review period, Government expenditure on health, as a whole, is steadily increasing.
Annual growth of expenditure in health sector has consistently remained higher as compared to the
annual rise in total government expenditure (52% vs 32% during 2006/07 and 2007/08). This trend
has reversed during 2008/09 and 2009/10. In terms of GDP also it shows a rise from 0.87% in
2005/06 to 1.55% in 2008/09.
The share of health expenditure in the total government expenditure has increased from 5.2 % in
2005/06 to about 7% in 2008/09. The per capita expenditure in health is also on the rise. In the fiscal
year 2005/06 it was recorded at NRs. 218, which has now almost tripled and reached to NRs. 623 (US
$ 8).
The recurrent expenditure in health during last five years recorded a fluctuating trend. The average
annual percentage rise in capital expenditure in health was 74.7% during 2005/06 and 2009/10
whereas the increase in the recurrent expenditure was much lower to 48.6%. Recurrent expenditure
continues to claim overwhelmingly larger share that is more than three–fourths, of the total health
expenditure. During 2005/06 and 2006/07 the share remained as high as 84 percent with only 16
percent left for the capital expenditure. This clearly shows that the share of recurrent expenditure is
disproportionately higher in health sector. Analysis of the trend in expenditure however, shows the
proportion of salary/wage expenditure declining while the share of non-wage is increasing. This is a
positive development.
Health centers/dispensary which occupied the largest share (between 36 to 40%) of health
expenditure until 2006/07 has declined to less than one-fourth in recent year. Other service has,
however, gained significantly. Its share which remained less than one-fourth in 2005/06 has almost
doubled (43%) by 2009/10. This is no doubt a significant gain but at the cost of health center/
dispensary. The data thus reveal that in recent years most of the increase in health sector funding
appears to have been channeled away from primary health care (health centers/dispensary) to other
services. This is obviously not a healthy development and thus needs further probing. The share of
hospitals in the total health spending has also been in the declining trend while the share of
preventive services has remained more or less constant at 20 percent.

Health spending by LBs is very negligible, on average; it is less than 5 percent of the total
spending of the LBs.
Health expenditure data by source of funding revealed that private out of pocket expenditure
continued to be the single largest source accounting half of the total expenditure (50%) followed by
government (24%) and INGOs (13%) in order.
The donors financing in health sector in Nepal has been increasing steadily and continue to account
about half of the total health expenditure of the country (48%) in 2009/10 indicating continued
donors dependency in health sector. Largest share of donors support is in the area of preventive
services in which, donors share account more than 85 percent of the total expenditure.
The analysis of the health sector benefit incidence shows benefits of heath care services are availed
more by highest expenditure quintile and less by lowest expenditure quintile. Highest two
expenditure quintile enjoys relatively more health care benefit compared to lowest two expenditure
quintile. Highest expenditure quintile spend disproportionately largest amount (Rs 14974) for
modern medicine as compared to lowest expenditure quintile (Rs 1187).
Lowest income quintile avail relatively more government facility (44%) compared to highest income
quintile (28%). However, a pattern of increasing use of private facility irrespective of income quintile
is evident. This indicates towards the growing tendency of all income groups to seek health care
services from private facilities which is a matter of serious concern for the health policy makers
5.1.2 Education Government of Nepal is spending huge amount for education development. Proportion of annual
budget allocation in this sector is much higher than other sectors. Substantial expenditure is made
on primary, secondary and tertiary education. About 86% education spending is covered by these
facilities. Most of the amount, about 91 %, goes in financing recurrent expenditure.
Although donors are found financing about 18 % of the recurrent expenditure, it is mostly financed
by domestic sources. Development expenditure has been well supported by donors.
GoN along with sub-national government entities like DDC, VDC and municipalities are found
involved in developing education sector. These entities have made some spending for education, but
the amount is nominal. Average contribution of DDC, VDC and Municipality is 5.03%, 21% and 1.07%
respectively. The fund is mostly spent from the government unconditional grant bestowed to them.
Household survey revealed that of the total educational expenditures at the grass root level in public
school, about 97% of education expenditure is born by government expenditure and only 3% is
contributed by household expenditure.
Education in Nepal has been taken as a priority sector, government has opened private sector to
impart education at all levels. Many institutional schools and colleges are providing education

especially in urban areas. Although, there are many public schools in urban as well as in rural areas,
public schools still dominates education sector in the country. Availability of data of institutional
schools is very scanty, so we have used public schools only for PB and BIA.
Development Expenditure in education is much lower than recurrent expenditures. Expenditure on
other education program has increased immensely. GoN has introduced School Sector Reform
Program –SSR allocating whopping sum of amount in the school level education.
Proportion of wage expenditure is much higher than non-wage expenditure in recurrent expenditure
although increasing rate of non-wage is higher than that of wage expenditure. Since wage includes
salaries and allowance of teachers that is hard to cut down. Domestic source dominated the
education expenditure especially in recurrent expenditure. Proportion of donor contribution is
higher in development expenditure than that of domestic source
GoN through district education office spends highest amount followed by VDC, DDC and
municipality. There is need of formulating policies at sub national level regarding education
expenditure to accelerate their education expenditure. Municipality being a powerful sub national
entity has very less spending on education. Majority of students of municipality go to private schools
(which is not being captured by the study)
Public spending for primary education is largely captured by poor. Access of poor to tertiary
education is very nominal, but it is increasing slowly.
More than half of government expenditure is spent on primary education. It is the poor that benefit
from government subsidy in basic education. Thus more the investment in primary education the
greater are the gains poorer households gets. Per student government expenditure and subsidies is
much higher in tertiary / university students. Poorer has less access to this facility. Subsidies have
been enjoyed by highest quintiles.
Benefit incidence analysis shows, access of lower quintile to tertiary and university education
increasing. Tertiary and university education is largely benefiting to highest quintiles. State
intervention in provision of primary education serves a win- win case for government and society,
expansion of public expenditure in education services not only strengthen national economy but also
improve the distribution of income by enabling poor to have access on education.
5.1.3 Drinking Water The long term vision of the water supply and sanitation sector in the three year interim plan (TYIP) is
to contribute towards raising the living standard and the status of public health by making
sustainable and equitable water supply and sanitation services available. The National Water Plan
2005 has set the target of achieving total population coverage of basic level drinking water supply
and sanitation services by the year 2017. The target of the Three Year Interim Plan (2008-2010) is to
cover 85% of population. The achievement in the provision of drinking water and sanitation services

thus is directly attributable to poverty reduction, which is the overriding theme of the long term
plans.
Total public sector expenditure in the sector is less than 5%, which does not indicate a high priority
sector. While the local governments, particularly the DDCs and VDCs are spending above 10% of
their total expenditure it is less than 1% for the Municipality. The Municipality and the central
government expenditures in the sector are low. However, the public sector expenditure is increasing
over the past years, which indicate that the sector is getting priority in terms of public expenditure.
In terms of source of financing, data shows that the domestic funding is picking up for expenditures
in the sector and the donor contribution is gradually going down. Similarly while both development
and capital expenditures are in an increase the rate of increase for capital (development) purpose is
higher, which is positive. The efficiency of expenditure in the sector can be viewed from the
composition of capital and recurrent expenditures. Data shows that over time the proportion of
capital (development) expenditures has been increasing, and has reached to 93% of the total
expenditure. This can be considered that the expenditure is efficient in that the increased
expenditure is more diverted to expanding drinking water and sanitation services.
Four major programs together consume over 92% of the total public sector expenditures on drinking
water sector. Expenditures for rehabilitation of drinking water schemes and drinking water quality
improvement have together got slightly more than one percent of the total budget. This suggests
that the national priority has been in the area of expansion of drinking water and sanitation services,
rather than maintenance of the quality and service quality in terms of water quality, supply
regularity and adequacy. The public sector expenditures tend to concentrate among a few projects
and programs. A total of NRs 17,000 per household is expended in the five districts for drinking
water and sanitation services.
Public expenditure of drinking water sector seems to be pro-poor. Private connection of drinking
water seems to be highly pro-poor while public connection is not too regressive. The result of private
connection is a bit surprising. But the data showed that it is due to the fact that private connection is
concentrated in Kathmandu valley (capital city of Nepal) where people pay large amount of money
for drinking water.
Finally, the drinking water sector expenditure is satisfactory from the view point of poverty. This is
also evident from the fact that drinking water is the least contributor for MPI poverty in Nepal
(Alkire and Santos, 2010). However there are other things that should be taken into consideration.
There is huge investment of I/NGOs in drinking water sector which is not captured by this study.
I/NGOs are mainly implementing the drinking water projects for public connection. This may be the
reason that the BIA shows the almost equitable distribution in public connection. Rich people are
less interested for public connection. But public expenditure is the only source of private connection
which is highly skewed towards rich people. To make it equitable, government needs to spend more
in rural area with people’s participation.

5.2 Key Issues and Challenges
5.2.1 Key Issues and Challenges in Health During 2005/06 and 2006/07 the share of regular expenditure in health remained as high as 84
percent with only 16 percent left for the capital expenditure. In more recent years it has come down
to the ratio of 80:20. This clearly shows that the share of recurrent expenditure is still
disproportionately high in health sector. The proportion of salary/wage expenditure dropped from
59% in 2005/06 to 36% in 2009/10 while the share of no-wage has increased correspondingly during
the same period. This is a positive development however; donors’ dependency in the preventive
services is disproportionately high to the tune of 85 percent. This raises the issue of the
sustainability in preventive services. Governments’ effort should be towards reducing this
dependency gradually.
Though the subsidy in hospital and health facility is pro – poor, the magnitude is believed to have
declined. Efforts should be made to rationalize the health expenditure. More and more resources
should be spent in primary health care services where more poor people visit to receive health
services. The issues in the health sector can be summarized as follows;
Though there has been a significant rise in health expenditure in recent years, the per capita
expenditure in health in the country is still quite low.
Health Center/dispensary (primary care) is the only source of heath care services to the poor,
marginalized and deprived population in the rural area. The decline in its share in the total
health expenditure in recent years is not a healthy development. The challenges lie in
reallocating the scare resources so that access to health care services could be ensured to the
rural masses.
The share of recurrent expenditure in total health expenditure is disproportionately high (80%).
The major challenge is to bring down at a manageable level. Notwithstanding, the proportion of
salary/wage expenditure has dropped while the share of non-wage has increased. This is a
positive development.
There has been excessive donor dependency in health sector. Donors support in the area of
preventive services is as high as 85 percent of the total health expenditure. This trend may create
problem of sustainability and thereby hamper the quality of service delivery in future.
The data on health facility usage by expenditure quintile is not available for the recent years.
Furthermore the disaggregated data on expenditure separately for district hospital and other
lower health facility is not readily available. This has created problem in carrying out the desired
analysis.
Preventive services in Nepal comprise many vertical programs with different target population.
Though health management information system is in place data for each of these programs that
form the preventive services are not available. Paucity of data has been a serious challenge for
carrying out BIA for preventive services.

5.2.2 Key Issues and Challenges in Education Quality of data and regular updating remains key issues in the education sector. Quite often, the data produced by the ministry use to be much different than that of CBS and other sources. This makes the reliability of data in question. A critical issue with MOE reported data is that it publishes data as reported by schools without verifying the numbers thru its district level offices. It is claimed that the school over-report the number of student because of the tying of school grants to the number of enrolled students through per child funding. Schools are more likely to over report the number of girls and Dalit students because additional grants are associated with the number of such children in each school. This requires a periodic monitoring of school and a penalty system for minimizing this attitude among the school.
According to government estimate, still about 6.3 % of the school age children, particularly from the marginalized community and poor family are out of school. These children need some special program to accommodate. Since some years back, government has introduced scholarships and other incentives to encourage the participation of marginalized children in basic education, these schemes are inadequate, both in their coverage and in the amounts distributed to individual students. Continuation of scholarships is necessary to retain individuals in the system.
National data show that access to primary education has improved significantly in recent years (CBS 2004). However, there is still considerable variation in the level of accessibility to school by region. For instance, the Tarai, which accounts for nearly 50 per cent of the country's population, has only 30 per cent of total schools (DOE 2009). As a result, there is considerable overcrowding in Tarai schools, which negatively affects the attendance of girls in a culture characterized by significant gender discriminatory practices. Challenges also remain with the curriculum and associated textbooks. Textbooks are not delivered on time: in 2009, nearly 40 per cent of students at primary level did not have the required textbooks even two weeks after the start of the new academic year (DOE 2009), thus affecting the regularity of teaching– learning in school.
5.2.3 Key Issues and Challenges in Drinking Water Supply of pure drinking water is necessary for achieving several millennium development goals.
Government data shows that 76.6 percent of the population has access to basic drinking water
supply services and 8 percent have access to improved quality of drinking water. But the experience
of Kathmandu metropolitan city, where people don’t get drinking water every day rather they collect
water in their private connection twice or thrice a week for three to four hour, is not encouraging. In
this context, data speak somewhat wrong and government has major challenge to renovate existing
water supply system and to implement new projects. Many projects in the country are so old that
they are not functioning properly. In some cases it is found that same old projects have been
renovated in the name of new projects. This has created double count of the number of
beneficiaries. In other cases there is project and even tap in the house but people are not getting

water. So it is serious challenge for government to assure that all the people recorded in the data as
beneficiary get safe drinking water. This needs government to spend huge amount of money in
rehabilitation and maintenance of existing drinking water projects. But there is lack of sufficient
resources and government has to be dependent on donor.
The BIA carried out doesn’t include the quality of drinking water. The quality of drinking water has
always been questioned in Nepal. Three Year Interim Plan document says that “The quality standard
of the constructed facilities and uniformity of the available services could not be maintained due to
ineffective monitoring and evaluation of programs executed by different agencies”. In this context
maintaining quality is another major challenge for the government.
Finally, many drinking water projects are successful where there is community participation and they
are cost effective as well. Similarly research have shown that community participation and local
financing makes drinking water project more equitable and efficient (see Shrestha and Wicken,
2008). This finding is supported by present BIA analysis as well. So it is challenge for government to
provide authority for local government to implement sub-national level projects and to increase
community participation.
Broadly, the key issues and challenges in drinking water sector relates to sustaining increase in the
coverage of quality DW and also maintaining equity in terms of benefit incidence. The key challenge
that lies ahead are;
Drinking water sector needs huge resources and better management for achieving government goal
of universal access to safe drinking water by 2017. Program budget analysis shows more than 50%
resources for the sector coming from donor funding. To sustain it, government needs to allocate
more of its own resources in a better way in the coming years.
Quality of drinking water is not a bigger problem in hill and some part of Terai but, is crucial in urban
areas. Arsenic has been a critical issue in some part of Terai. Quality of water should get priority in
coming years. Similarly, improvement in service delivery including regularity and adequacy is a
challenge especially in the urban area.
Both Government and Rural Water Supply and Sanitation Fund Development Board (RWSSFDB) are
found concentrating more on new DW projects than rehabilitation and maintenance of already
completed projects. During the field visit, it was observed that many projects listed in the record are
not functioning, but both agencies showing little interest to rehabilitate. A small amount spent for
maintenance or rehabilitation would have been much cheaper than starting new projects.
The field study shows almost 25-30 % of the DW programs created earlier are not functioning. But
they are in the record as functioning projects. This certainly misleads the number of population
covered by drinking water facility in the country. If one takes into account of the functioning

projects, this number might come down to less than 60% - a big challenge to attain MDG in the
sector by 2015.
Duplication and lack of coordination among implementing agencies seems a critical issue in the
sector. Large number of I/ NGOs are as well as a number of government agencies, both at the centre
and at the local level are working in providing drinking water facilities to the people. Many times,
these agencies are found working in the same place, duplicating the effort and wasting precious
resources. There is no coordinating agency, both at the centre as well as at the local level, to
coordinate plan and programs of these agencies in the sector. This strongly calls for such an agency
to coordinate the activities carried out by multiple of agencies working in drinking water sector. This
can save huge amount of precious resources to be spent in the needy areas.
Sanitation coverage is lagging far behind water supply coverage. Some agency, such as, RWSSFDB
has been lunching sanitation programme as an integral component of drinking water program in
rural areas, but it is not adequate enough.
The MDGs progress report 2010 shows attainment of sanitation related activities as 43 % as
against the MDG target of 65 % by 2015. The challenge to fill this big gap calls for massive
program in the sanitation sector.
Increase the public sector expenditure for drinking water and sanitation service provision.
Particularly, the expenditure by the central government and the municipalities are relatively
fewer, which needs to be given proper attention.
While the distribution of benefits by quintile is not too skewed towards any quintile group,
which is a positive aspect in the sector, the domination of private connections over public tap-
stands is an issue that should be given attention. However, to make public connection more
equitable government needs to invest in rural area with people’s participation.
Continue increasing domestic funding. Recently published multidimensional poverty index (MPI)
for Nepal shows that among the ten components of poverty, lowest deprivation is in drinking
water sector. It means drinking water sector has greatest contribution to bring down poverty
level in Nepal. In this context if, country is dependent on donors and donors stop providing
support then there is high possibility of increasing poverty level further. So it’s necessary to
make drinking water sector sustainable
5.3 Challenges in carrying out BIA The scanty data on services used by the beneficiary are the main bottleneck in carrying out benefit
incidence analysis. The Nepal Living Standard Survey data (NLSS II) which tries to capture the
services used by the people at the grass root in a limited scale is also available for 2003/04 and not
beyond. Given the increase in the expenditures level on education, health and drinking water since

last few years, it is difficult to assess the benefit incidence by these increases in the level of
expenditures. In the absence of annual/recent data on services use, the present study tries to
estimate benefit incidence on the sectors by using NLSS II data and cross check the benefit incidence
in these sector by carrying out a Household survey of five districts. As CBS is carrying out a NLSS III
survey, it is hoped that a fresh new data on services use will be available in 2011. The updated
benefit incidence analysis in 2011 will provide much clearer picture in the respective sector.
Regarding, health sector, no data of health facility usage separately for hospital and health
center/dispensary are available. Out-patient data obtained from the service statistics of the MOHP
has been used as the proxy of health facility usage. However, classified outpatient data by hospital
and health center facility are not available. Furthermore, the disaggregated data on expenditure
separately for district hospital and other lower health facility is not available. Hence for the sake of
analysis we have merged hospital and health center into one to estimate the BIA. We have also
assumed that there has been no significant change in the pattern of health facility usage between
2003/04 and 2007/08 among different expenditure quintile. We have therefore safely adopted the
health facility usage pattern of 2003/04 for 2007/08 to compute BIA for the same year. We have to
restrict to 2007/08 as the out-patient data available relates to that year.
Likewise, preventive services in Nepal comprise many vertical programs with different target
population. Though health management information system is in place data for each of these
programs that form the preventive services are not available. Paucity of data has been a serious
challenge for carrying out BIA for preventive services. A deeper enquiry of existing data and
interaction with different preventive service Program Heads has been planned. In our subsequent
analysis we should be able to carry out the BIA analysis for preventive services separately. In the
present analysis we have picked up NIP as special case for the estimation of BIA of preventive
program. Furthermore, data on preventive services by expenditure quintile is not readily available. In
view of this multiple sources have to be used which could affect the results obtained. One should
therefore be quite cautious in interpreting the results.
On education, it is again the quality of data and annual updating which remains a critical issue to be
tackled at the earliest. Although there are several sources that generates educational data at the
centre but, it is hardly consistent.
5.4 Conclusions and Policy Recommendations 5.4.1 Health The current level of government expenditure in health is inadequate. If the country is to attain
the health MDGs then the current level of expenditure should be raised to 8 to 10% of the total
government expenditure.
Inter- sectoral and intra-sectoral restructuring of government budget is needed so that health
sector receives adequate resources and within the sector primary health care receives major
priority in resource allocation.

Budgetary analysis revealed an overwhelmingly high proportion of recurrent expenses in health
to the tune of 80%. Long term policy measures should be designed so that the recurrent
expenses could be brought down to reasonable level.
Donor dependency is the major sustainability concern. Efforts should be geared towards
reducing such dependency in the future.
Field survey data revealed that there has been a tendency to seek the private service providers
as compared to government facility. This signifies the need for increasing access to and quality of
services in terms of availability of essential drugs and presence of providers in government
facility.
For any meaningful analysis disaggregated data is very essential. HMIS could act in acquiring and
compiling health data at a more disaggregated level so that meaningful analysis of data could be
attempted. .
5.4.2 Education More than half of government expenditure is spent on primary education. Primary education is
basic education. It is the poor that benefit from government subsidy in basic education from
subsidies in primary education, thus more investment in primary education the greater will be
the benefit the poorer households get. Government should therefore, increase its spending on
primary education.
Per student government expenditure and subsidies is much higher in tertiary / university
students. Poorer has less access to this facility. Subsidies have been enjoyed by highest quintiles.
Revisit in this policy is desirable. Government should strive on a strategy to provide more access
to tertiary/higher education to the poor.
Development Expenditure in education is found much lower in the education sector signifying a
less than adequate investment in infrastructures and equipments. This will affect quality in the
education sector. Attempts should therefore be increased to spend more in these expenditure
heads.
Expenditure on other education program has increased immensely, GoN has introduced School
Sector Reform Program –SSR allocating whopping sum amount. This heading is rather general;
Expenditure must be focused on specific headings for efficient and effective spending.
Local bodies- DDC, Municipality and VDCs are found spending negligible amount of their annual
expenses on education sector. As the improvement in the educational level and its quality
should also be the primary concern of the agencies, GoN should bring out policies to encourage
such expenditures by these entities.
The study shows public spending in primary education largely benefiting the poor. There is a
need for increasing public spending on primary education to improve upon the educational
status of this group.
State intervention in the provision of primary education serves a win- win case for government
and society. Expansion of public expenditure in education services not only strengthen national
economy but also improve the distribution of income by enabling poor to have access on
education. Government of Nepal should focus on achieving its MDG through commitment and
consistent policies.

In the short term, the MOE can use ad hoc missions to check enrolment data and enforce
controlling measures on schools that engage in over-reporting. However, in the longer term, the
MOE should be relieved of this responsibility. As there is concern about the quality of
government data, there is a need for third-party, periodic Nepal Education Surveys that produce
reliable data on enrolment as well as on other outcomes of public investment in education.
Repetition in the same class and high drop out rates are critical in the Ist grade. A number of
reasons such as, the school environment, regularity of class, availability of school teacher and
also the affordability of HH to send their child to the school regularly may be prominent for such
a high drop outs and repetition rate among Ist grade students. This requires strategy to minimize
these reasons for ensuring regularity in the class.
5.4.3 Drinking water
Based on the analysis, the policy recommendation in the sector can briefly be listed as follows;
Drinking water sector is seen attracting many implementing agencies, both government and
non-government. A strong coordination mechanism at the centre and district can maximize the
resource use in the sector.
Increase public expenditure for maintenance, rehabilitation and quality of water along with
sanitation service provision. Encourage LBs to allocate more in the sector. The sector needs
more collaborative effort.
Multidimensional poverty index (MPI) for Nepal shows drinking water as the lowest deprived
sector in terms of poverty hence, government needs more resource allocation in the sector in
the coming years.
As donor support in drinking water sector are seen very high, it is necessary that such funding
ratio be gradually replaced by own resources for sustaining the resource requirements in the
sector.
Drinking water projects with people’s participation, User’s group approach or else, have been
found cheaper and sustainable. So government needs to promote this mechanism for availing
drinking water, especially in rural area.
Since public connection of drinking water seems to be more equitable, government should give
priority for these types of connection.
Based on the benefit incidence of private connection, it is recommended that people in higher
income groups (using more water) should be charged more and the rights to decide the user
charges and discriminating price as per its use should be given to local level, because of the
proximity of these agencies to the actual users. Such policy can ensure equity in the service use.
Similarly, the improvement in the quality of service needs more emphasis.

Rural Water Supply and Sanitation Fund Development Board (RWSSFDB) across the country have
introduced insurance system with the aim of ensuring project sustainability. The approach
seems innovative in the sense that it can minimize the risk and save huge amount of resources if
there is a need to rehabilitate the program or construct new programs as the case is now.
Besides, it may also promote a sense of ownership of the program among the beneficiary who
needs to pay a nominal amount of say between Rs. 2. 50 to Rs 4.0 per thousand rupees invested
in the project as premium.
Given the importance of sanitation program in people’s health, the program needs special
emphasis in the coming years. This can be done by promoting sanitation as a campaign
nationwide and making all water supply schemes/ project mandatorily includes sanitation
activities as an integral part of the scheme/ project.
5.5 Scope for Further Study
As mentioned above the benefit incidence analysis is based on NLSS 2003/04 data which is relatively
old. Central Bureau of Statistics is carrying out the third round of NLSS. Field survey is in progress.
The data is expected to be available in early 2011. The new survey also includes extra information on
health care, education and drinking water accessibility. Similarly, Ministry of Health and Population
(MOHP) is carrying out Nepal Demographic Health Survey. This time, the Survey is collecting more
detailed information on health seeking behavior including out of pocket expenditure. MOHP is also
engaged in conducting series of surveys to come out with the National Health Account III. More
updated data on health spending by funding sources is expected to be available from this Health
Account III.
The Ministry of Education also conducting a survey on educational status of the people in Nepal
besides, it is also compiling national level school enrollment data by caste, age group and gender.
On private sector educational institutions, the national level association is working on a plan to
consolidate the educational information and update it annually.
Ministry of Physical Planning and Works is also planning to strengthen the coordination mechanism
at the centre to manage drinking water sector in Nepal in a better way. As an important step
towards that, it is consolidating all the information relating to drinking water sector. Once all these
new data sets are available, an updated analysis of benefit incidence can be made. The scope for
further study is thus wide.

Particularly for drinking water sector, this study took only one sources of drinking water into
consideration- piped drinking water. But large number of population, especially in Terai region, is
dependent in well and hand pump. Similarly, in the mountain and hill areas, it is the spring water
and dug-well which plays crucial role in providing drinking water in isolated areas and also in areas
where there is no piped drinking water facilities. Thus, the study can be expanded to capture other
source of drinking water as well. Similarly, this study did not capture I/NGO’s expenditure. After the
central level coordination in drinking water is in place, more information on drinking water programs
and its coverage are expected to be available for future study including, the benefit incidence
analysis.
5.5 Dissemination of the Report
A multipronged approach was taken to disseminate the findings of the study so that the community
of policy makers, political representatives, academics, practitioners and the general public can
benefit from the study. Not limiting to, PRAD Nepal adopted following communication strategies to
influence the policy makers and stake holders through both print and electronic media:
Dissemination of major findings to policy makers and stakeholders both, at the center and
sub-national level- At the Centre, a one day seminar for the policy makers, parliamentarians,
academics, practitioners and the media persons was organized where in a presentation of
the findings are shared. The idea is to share the findings of the study so that the policy
makers can adjust allocation of resources in the forthcoming budget accordingly.
PRAD Nepal developed and published policy briefs on education, health and drinking water
separately. These policy briefs highlight major findings of the study and the policy
prescription for better targeting the services. This was widely circulated. This is expected to
create awareness among masses about the efficiency and effectiveness of public
expenditure in education, health and drinking water.
PRAD Nepal also published and circulated “one pager” for those interested in the sector. The
one pager was designed to highlight the status and basic issues in the three sectors, so that
the person becomes aware of the issues in the sector. This was targeted mainly to provide
information on the sector to parliamentarians and the media, who can really put pressure to
government in accommodating the recommendation of the study while allocating resources
in the budget.
PRAD Nepal also posted the full report as well as the policy briefs and one pager in its web
site www.prad-nepal.com . This is hoped to provide complete information on the sectors to

all those who are really interested in the sector. Besides, the posting of the report in the
GDNet web site is expected to provide a wider coverage of the study report.
************

References CBS (2004): Nepal Living Standard Survey 2003/04: Statistical Report Volume I. Central Bureau of
Statistics, Kathmandu
CBS (2006): Resilience amidst Conflict, an Assessment of Poverty in Nepal 1995-96 and 2003-04,
Central Bureau of Statistics, National Planning Commission, Government of Nepal
Cuenca, J.S. (2008). Benefit Incidence Analysis of Public Spending on Education in the Philippines: A
Methodological Note. Discussion Paper Series No. 2008-09, Philippine Institute for Development
Studies
David R Hotchkiss et al (1998). “Household Health Expenditure in Nepal Implications for Health Care
Financing Reform,” Health Policy and Planning 13(4): 371-383
Demery, Lionel. (2000). Benefit Incidence: A Practitioner’s Guide. Poverty and Social Development
Group, Africa Region, World Bank.
Kakwani, N. C. (1977). “Measurement of Tax Progressivity: An International Comparison.” Economic
Journal 87(345): 71–80.
Kakwani, N.C., A.Wagstaff, and E.van Doorslaer, 1997, “Socioeconomic Inequalities in Health:
Measurement, Computation and Statistical Inference.” Journal of Econometrics 77(1): 87–104.
Ministry of Education and Sports (2006): School Level Educational Statistics of Nepal, Consolidated
Report 2005 (2062), Department of Education, Research and Educational Information Management
Section, Ministry of Education and Sports
Ministry of Education and Sports (2008): School Level Educational Statistics of Nepal, Consolidated
Report 2007 (2064), Department of Education, Research and Educational Information Management
Section, Ministry of Education and Sports
Ministry of Finance (2008): Economic Surveys, 2008, Ministry of Finance
Ministry of Finance ( ): Red Book of Various Years, Ministry of Finance
Ministry of Health (2004): Nepal Health Sector Implementation Plan (NHSP-IP) 2004-2009, Ministry
of Health.
Ministry of Health and Population (MOHP) (2007): Nepal Demographic and Health Survey 2006,
Population Division, MOHP, New ERA, Macro International Inc. USA
Ministry of Health and Population (MOHP) (2009): Nepal National Health Accounts II (2004-2006),
Preliminary Draft, Policy Planning and International Cooperation Division, Health Economics and
Financing Unit, Ministry of Health and Population

Ministry of Health and Population (MOHP): Annual Report 2064-65(2007/2008), Department of
Health Services, MOHP
O’Donnell, Owen, Eddy van Doorslaer, Adam Wagstaff and Magnus Lindelow. (2008): Analyzing
Health Equity Using Household Survey Data: A Guide to Techniques and Their Implementation. The
World Bank
Shrestha, R.L. and Wicken, J. (2008). Nepal: Effective financing of local governments to provide water
and sanitation services. A Water Aid Report available at
http://www.wateraid.org/documents/plugin_documents/local_financing__nepal.pdf
Wagstaff, A., E. van Doorslaer, and N. Watanabe. 2003. “On Decomposing the Causes of Health
Sector Inequalities, with an Application to Malnutrition Inequalities in Vietnam.” Journal of
Econometrics 112(1): 219–27.

Annex 1 — Health
Annex 1.1 — List of Sampled VDCs and Municipality and Household Interviewed
S.N. Selected VDC/ Municipality Households Interviewed
Kavre
1. Kusa Devi VDC 20
2. Kavre Bhanjyang VDC 20
3. Ugrachandi Nala VDC 20
4. Nasiga Sanga VDC 20
5. Phakhal VDC 20
6. Banepa Municipality 25
Total 125
Kaski
1. Bhalam VDC 20
2. Hemja VDC 20
3. Bharat Phokhari VDC 20
4. Nirmal Phokhari VDC 20
5. Pumdi Humdi VDC 20
6. Pokhara Municipality 25
Total 125
Chitwan
1. Padampur VDC 20
2. Phulbari VDC 20
3. Shiva Nagar VDC 20
4. Gita Nagar VDC 20
5. Pathihani VDC 20
6. Bharatpur Municipality 25
Total 125
Dolakha
1. Kavre VDC 20
2. Boach VDC 20
3. Lakuri Dada VDC 20
4. Chetrapa VDC 20
5. Jiri VDC 20
6. Bhimeswor Municipality 25
Total 125
Kailali
1. Urma VDC 20
2. Phulbari VDC 20
3. Uadasipur VDC 20
4. Pahalmanpur VDC 20
5. Shadepani VDC 20
6. Dhangadi Municipality 25
Total 125

Annex 2.1 — Recurrent and Development Spending by Facility Level Amount – Health (in Rs '000)
2005/06 2006/07 2007/08 2008/09 2009/10
1H
Health 5728180 7440595 9811130 14945964 17840465
Hospital 1068767 1285734 1836384 1741774 2202456
Recurrent 773376 809310 1062594 1178574 1543586
Wages 640972 647530 634691 1147075 958896
Non-Wages 132404 161780 427903 31499 584690
Domestic 773376 806413 997594 1158574 1533586
Donor 0 2897 65000 20000 10000
Development 295390 476424 773790 563200 658870
Domestic 286008 279424 373418 513200 587870
Donor 9383 197000 400372 50000 71000
Health Centers/Dispensary 2077847 2951480 3134277 3646429 4424760
Recurrent 1987551 2901570 3075668 3399429 4148610
Wages 1694163 1762382 2010178 2393656 3041472
Non-Wages 293388 1139188 1065490 1005773 1107138
Domestic 1890764 2052883 2305222 2583829 3156660
Donor 96787 848686 770446 815600 991950
Development 90296 49910 58609 247000 276150
Domestic 24638 4982 8191 23100 71150
Donor 65658 44928 50418 223900 205000
Preventive 1090876 1281750 1481556 3208208 3083720
Recurrent 1045507 1235288 1361942 2963495 2865880
Wages 54156 23264 25535 57315 81415
Non-Wages 991351 1212024 1336407 2906180 2784465
Domestic 198263 243893 142114 244078 435844
Donor 847244 991394 1219828 2719417 2430036
Development 45369 46463 119614 244713 217840
Domestic 74 3730 8508 9498 16265
Donor 45295 42733 111106 235215 201575
Other Health 1316014 1696491 3142914 5495311 7569362
Recurrent 844001 1102823 1707173 3706136 5110472
Wages 355288 400772 433290 1243946 836910
Non-Wages 488713 702051 1273883 2462190 4273562
Domestic 415756 518209 809335 1711799 2160847
Donor 428245 584615 897837 1994337 2949625
Development 472012 593667 1435741 1789175 2458890
Domestic 91467 48377 651969 405667 818590
Donor 380545 545291 783772 1383508 1640300
Ministerial / Regional Administration 174676 225140 215999 854242 560167
Recurrent 146563 205997 168944 758934 458857
Wages 94415 158549 121243 679714 158428
Non-Wages 52148 47449 47702 79220 300429
Domestic 141737 205370 157539 758934 445649
Donor 4826 627 11405 0 13208
Development 28114 19143 47055 95308 101310
Domestic 10040 7297 26635 90808 101310

2005/06 2006/07 2007/08 2008/09 2009/10
Donor 18074 11845 20420 4500 0
2H
Hospital 100.0 100.0 100.0 100.0 100.0
Recurrent 72.4 62.9 57.9 67.7 70.1
Development 27.6 37.1 42.1 32.3 29.9
Recurrent 100.0 100.0 100.0 100.0 100.0
Wages 82.9 80.0 59.7 97.3 62.1
Non-Wages 17.1 20.0 40.3 2.7 37.9
Domestic 100.0 99.6 93.9 98.3 99.4
Donor 0.0 0.4 6.1 1.7 0.6
Health Centers/Dispensary 100.0 100.0 100.0 100.0 100.0
Recurrent 95.7 98.3 98.1 93.2 93.8
Development 4.3 1.7 1.9 6.8 6.2
Recurrent
Wages 85.2 60.7 65.4 70.4 73.3
Non-Wages 14.8 39.3 34.6 29.6 26.7
Domestic 95.1 70.8 75.0 76.0 76.1
Donor 4.9 29.2 25.0 24.0 23.9
Preventive 100.0 100.0 100.0 100.0 100.0
Recurrent 95.8 96.4 91.9 92.4 92.9
Development 4.2 3.6 8.1 7.6 7.1
Recurrent 100.0 100.0 100.0 100.0 100.0
Wages 5.2 1.9 1.9 1.9 2.8
Non-Wages 94.8 98.1 98.1 98.1 97.2
Domestic 19.0 19.7 10.4 8.2 15.2
Donor 81.0 80.3 89.6 91.8 84.8
Other Health 100.0 100.0 100.0 100.0 100.0
Recurrent 64.1 65.0 54.3 67.4 67.5
Development 35.9 35.0 45.7 32.6 32.5
Recurrent 100.0 100.0 100.0 100.0 100.0
Wages 42.1 36.3 25.4 33.6 16.4
Non-Wages 57.9 63.7 74.6 66.4 83.6
Domestic 49.3 47.0 47.4 46.2 42.3
Donor 50.7 53.0 52.6 53.8 57.7
Ministerial / Regional Administration 100.0 100.0 100.0 100.0 100.0
Recurrent 83.9 91.5 78.2 88.8 81.9
Development 16.1 8.5 21.8 11.2 18.1
Recurrent 100.0 100.0 100.0 100.0 100.0
Wages 64.4 77.0 71.8 89.6 34.5
Non-Wages 35.6 23.0 28.2 10.4 65.5
Domestic 96.7 99.7 93.2 100.0 97.1
Donor 3.3 0.3 6.8 0.0 2.9
3H
Total Health Expenditure 5728180 7440595 9811130 14945964 17840465
Recurrent 4796998 6254988 7376321 12006568 14127405
Wages 2838994 2992496 3224937 5521706 5077121
Non-Wages 1958004 3262492 4151384 6484862 9050284
Domestic 3419896 3826768 4411804 6457214 7732586
Donor 1377102 2428219 2964517 5549354 6394819

2005/06 2006/07 2007/08 2008/09 2009/10
Development 931182 1185607 2434809 2939396 3713060
Domestic 412227 343810 1068721 1042273 1595185
Donor 518955 841797 1366088 1897123 2117875
4H
Total Health Expenditure
Recurrent 83.7 84.1 75.2 80.3 79.2
Wages 59.2 47.8 43.7 46.0 35.9
Non-Wages 40.8 52.2 56.3 54.0 64.1
Domestic 71.3 61.2 59.8 53.8 54.7
Donor 28.7 38.8 40.2 46.2 45.3
Development 16.3 15.9 24.8 19.7 20.8
Domestic 44.3 29.0 43.9 35.5 43.0
Donor 55.7 71.0 56.1 64.5 57.0
Annex 2.2 — Health Sector/Program Project Classification by Budget Head Budget Head Health Sector Program/Project Classification
A. Hospital
70-3-134 Regional and Zonal Hospital
70-3-150 Hospitals
70-3-166 Ayurved Hospitals
70-3-171 Pashupati Homeopathic Hospital
70-3-301 National Academy of Medical Sciences - Including Bir Hospital
70-3-302 Kanti Children Hospital
70-3-303 Epidemic Disease Hospital
70-3-304 Paropakar Indra Rajya Laxmi Maternity Hospital
70-3-305 Nepal Eye Hospital
70-3-306 BP Koirala Memorial Cancer Hospital
70-4-307 Manmoham Cardio-Verscular Center -Teaching Hospital
70-3-321 Sahid Gangalal Heart Center, Maharajgunj
70-3-330 BP Koirala Institute of Health Sciences
70-4-335 Ram Briksha Yadav Memorial Center-Janakpur Zonal Hospital
70-4-336 Suresh Wagle Memorial Cancer Center- T.U. Teaching Hospital
70-3-755 Ayurvedic Hospital, Nardevi
70-3-762 B.P Koirala Centre for Opthalmic Studies
B. Health Centers/Dispensary
70-3-122 Primary Health Service - DHO, HC, HP and Sub HP
70-3-167 Ayurved Clinics
70-3-172 Unani Clinics
70-3-610 Drug and Equipment Supply
70-3-758 Singhadurbar Vaidyakhana
C. Preventive
70-3-401 Tuberculosis Control
70-3-402 Control of Aids and Sexually Transmitted Diseases

Budget Head Health Sector Program/Project Classification
70-3-451 Family Planning, MCH and Female Health Volunteer Program
70-3-470 National Polio & Immunization Programme
70-3-472 Diarrhoeal, Resperitory & Nutrition Programme
70-3-500 Human Influenza -Bird Flu
70-3-510 Epidemiology, Maleria, Kalajar Control & Natural Disaster Management
70-3-512 Leprosy Control
70-3-801 Tuberculosis Control
D. Other Health
70-3-210 National Population Program
70-4-456 Women Health Volunteer
70-3-620 Hospital Construction, Maintenance & Management Information System
70-3-650 National Health Education, Information & Communication Centre
70-3-660 National Training Programme
70-3-661 Vector Diseases Control Research & Training Center
70-3-680 Health Laboratory Service
70-3-690 Drug Management
70-3-701 Programs Operated From Health Tax Fund
70-3-763 Nepal Netrajyoti Assocation
70-3-765 Health Research Council
70-3-768 Monitoring, Evaluation & Project Strengthening
70-3-770 Social Security Program on Health
70-3-805 Rural Health Development Project -Ramechap & Dolakha
70-3-815 National Health Education Information & Communication Service
70-3-816 National Traning Programme
70-3-855 Integrated District Health Program
E. Ministerial / Regional Administration
70-3-110 Ministry of Health
70-3-120 Department of Health Service
70-3-121 Regional Health Directorates
70-3-128 Health Training Centre (Regional & sub-regional centres)
70-3-129 National Public Health Laboratories
70-3-160 Medicine Management Department
70-3-165 Department of Ayurved
70-3-756 Miscellaneous Program -Ayurvedic Department
Annex 2.3: Calculation of Concentration Index
Quintile No of Users % of Users Cum % of
Users Total Subsidy % of
Subsidy Cum % of Subsidy
Concentration Index
1 1848474 15.23% 15.23% 297870650 24.90% 24.90% -0.001062
2 2233219 18.40% 33.63% 276253419 23.09% 47.99% 0.000317
3 2517226 20.74% 54.37% 248319525 20.76% 68.75% -0.007522

4 2619177 21.58% 75.95% 238615502 19.95% 88.70% -0.045568
5 2918963 24.05% 100.00% 135203814 11.30% 100.00% 0.000000
Total 12137059 100.00% 1196262912 100.00% -0.053835
Fig 2.6: Concentartion Curve for Hospital and Health Facility
Visit
0
0.2
0.4
0.6
0.8
1
1.2
0.2 0.4 0.6 0.8 1
Cumulative Distribution of Subsidy(%)
Cu
mu
lati
ve D
istr
ibu
tio
n o
f
Users
(%)
Line of Perfect Equality
Cumulative % of Subsidy

Annex 4.1: Use of Drinking Water Services by Quintile for the five sample districts
Kavre No of HH No.using public taps No. with private connection % with private connection
Lowest 13 12 1 7.69
Second 18 15 3 16.67
Third 31 24 7 22.58
Fourth 28 20 8 28.57
Highest 35 26 9 25.71
Kaski No of HH No.using public taps No. with private connection % with private connection
Lowest 18 15 3 16.67
Second 16 15 1 6.25
Third 28 23 5 17.86
Fourth 31 26 5 16.13
Highest 32 28 4 15.63
Chitwan No of HH No.using public taps No. with private connection % with private connection
Lowest 58 2 56 96.55
Second 22 1 21 95.45
Third 14 0 14 100.00
Fourth 14 0 14 100.00
Highest 17 0 17 100.00
Dolakha No of HH No.using public taps No. with private connection % with private connection
Lowest 21 19 2 9.52
Second 30 24 6 20.00
Third 28 19 9 32.14
Fourth 27 19 8 29.63
Highest 19 10 9 47.37
Kailali No of HH No.using public taps No. with private connection % with private connection
Lowest 15 1 14 93.33
Second 38 0 38 100.00
Third 24 0 24 100.00
Fourth 25 1 24 96.00
Highest 23 1 22 95.65

Annex 4.2 — Price Paid for Drinking Water by Region and Types of Connection
Source: Calculated from NLSS II data set
* Number in brackets is total number of users
Annex 4.3 — Calculation of Concentration Index: Drinking Water
Quintile No of Users % of Users Cum % of
Users
Total
Subsidy
% of
Subsidy
Cum %
of Subsidy
Concentration
Index
Concentration Index for Private Connection
1 682839 21.77% 21.77% 115071966.8 51.91% 51.91% -0.036020
2 671365 21.40% 43.17% 76457241.56 34.49% 86.41% -0.050841
3 667972 21.29% 64.46% 68366687.05 30.84% 117.25% -0.181650
4 576658 18.38% 82.84% 11648657.1 5.26% 122.51% -0.396666
5 538339 17.16% 100.00% -49887393.85 -22.51% 100.00% 0.000000
Total 3137173 100.00% 221657158.7 100.00% -0.665177
Concentration Index for Public Connection
1 1310357 20.65% 20.65% 343586180 20.56% 20.56% -0.000526
2 1324268 20.87% 41.52% 342979108.5 20.52% 41.08% 0.001483
3 1290430 20.33% 61.85% 342248128.5 20.48% 61.55% 0.001197
4 1224426 19.29% 81.14% 324175305.5 19.40% 80.95% 0.001946
5 1196691 18.86% 100.00% 318430870.9 19.05% 100.00% 0.000000
Total 6346172 100.00% 1671419593 100.00% 0.004101
Region Private Connection Public Connection Total
Urban, Kathmandu 1731.6986
(1572)*
188.42828
(172)
1585.7012
(1744)
Urban, Others 1442.4183
(1461)
157.22384
(736)
1064.6494
(2197)
Western Rural, Mountain/Hill 35.150327
(313)
46.91388
(2024)
45.255928
(2337)
Eastern Rural, Mountain/Hill 170.23759
(633)
24.281866
(2334)
56.396495
(2967)
Western Rural, Tarai 1200
(6)
61.328533
(303)
82.742361
(309)
Eastern Rural, Tarai 358.40507
(115)
89.200889
(283)
171.31885
(398)
