nepal mics 2014key findings report 20141101 revrosa...
TRANSCRIPT

Nepal
Multiple Indicator Cluster Survey
2014
Key Findings
January, 2015
Government of Nepal
National Planning Commission Secretariat
Central Bureau of Statistics

TABLE OF CONTENTS
NEPAL MICS AT A GLANCE 1
CHILD MORTALITY 2
NUTRITION 3
CHILD HEALTH 5
WATER AND SANITATION 8
REPRODUCTIVE HEALTH 9
CHILD DEVELOPMENT 11
LITERACY AND EDUCATION 12
CHILD PROTECTION 13
HIV/AIDS 15
ACCESS TO MASS MEDIA AND ICT 16
SUBJECTIVE WELL-BEING 16
TOBACCO AND ALCOHOL USE 17
NOTES 18
The Nepal Multiple Indicator Cluster Survey (MICS) was carried out in 2014 by Central Bureau of Statistics,
Government of Nepal, as part of the global MICS programme. Technical support was provided by the United
Nations Children’s Fund (UNICEF). UNICEF and the Government of Nepal provided financial support.
The global MICS programme was developed by UNICEF in the 1990s as an international household survey
programme to collect internationally comparable data on a wide range of indicators on the situation of
children and women. MICS surveys measure key indicators that allow countries to generate data for use in
policies and programmes, and to monitor progress towards the Millennium Development Goals (MDGs) and
other internationally agreed upon commitments.
The objective of this report is to facilitate the timely dissemination and use of results from the Nepal MICS
prior to the release of full tables and the final survey report that will contain detailed information on all survey
findings by various demographic, social, economic and cultural characteristics. The final survey report is
expected to be released in the second quarter of 2015.
Results presented in this report are not expected to change and are considered final. For more information on
indicators and the analysis conducted in the full final report please go to mics.unicef.org and childinfo.org.
Suggested citation:
Central Bureau of Statistics. 2014. Nepal Multiple Indicator Cluster Survey 2014, Key Findings. Kathmandu,
Nepal: Central Bureau of Statistics and UNICEF Nepal.


Nepal MICS 2014
Page | 1
NEPAL MICS AT A GLANCE
Survey implementation Sample frame
- Updated
National Population and
Housing Census, 2011
September-October, 2013
Questionnaires Household
Women (age 15-49)
Children under five
Water quality testing
Interviewer training January-February, 2014 Fieldwork February-June, 2014
Survey sample
Households
- Sampled
- Occupied
- Interviewed
- Response rate (Per cent)
13,000
12,598
12,405
98.5
Children under five
- Eligible
- Mothers/caretakers interviewed
- Response rate (Per cent)
5,663
5,349
94.5
Women
- Eligible for interviews
- Interviewed
- Response rate (Per cent)
14,936
14,162
94.8
Water quality testing for households
- Selected for testing
- Occupied
- Tested
- Response rate (Per cent)
1,560
1,511
1,492
98.7
Survey population
Average household size 4.6 Percentage of population living in
- Urban areas
- Rural areas
17.2
82.8
Percentage of population under:
- Age 5
- Age 18
10.1
40.2
Percentage of women age 15-49 years
with at least one live birth in the last 2
years
14.5
Housing characteristics Household or personal assets
Percentage of households with
- Electricity
- Finished floor
- Finished roofing
- Finished walls
84.9
34.9
85.3
41.2
Percentage of households that own
- A television
- A refrigerator
- Agricultural land
- Farm animals/livestock
51.5
13.6
75.5
68.8
Mean number of persons per room
used for sleeping
2.4
Percentage of households where at
least a member has or owns a
- Mobile phone
- Car or truck
91.2
1.9

Nepal MICS 2014
Page | 2
CHILD MORTALITY
Early childhood mortality
MICS
Indicator Indicator Description ValueA
1.1 Neonatal mortality rate Probability of dying within the first month of life 23
1.2 MDG 4.2 Infant mortality rate Probability of dying between birth and the first birthday 33
1.3 Post-neonatal mortality
rate
Difference between infant and neonatal mortality rates 11
1.4 Child mortality rate Probability of dying between the first and the fifth
birthdays
5
1.5 MDG 4.1 Under-five mortality rate Probability of dying between birth and the fifth birthday 38
A Indicator values are per 1,000 live births and refer to the five-year period before the survey
F i gure 1 : E arl y chi ldhood mortal i ty rates ,
N epal MICS, 2014
27
17
44
13
56
29
15
44
6
51
23
11
33
5
38
Neonatal mortality rate Post-neonatal mortality
rate
Infant mortality rate Child mortality rate Under-five mortality rate
Years preceding the
survey
Note: Indicator values are per 1,000 live births
10-14 5-9 0-4

Nepal MICS 2014
Page | 3
NUTRITION
Nutritional statusi
MICS
Indicator Indicator Description Value
2.1a
2.1b
MDG 1.8 Underweight prevalence
(a) Moderate and severe
(b) Severe
Percentage of children under age 5 who fall below
(a) minus two standard deviations (moderate and severe)
(b) minus three standard deviations (severe)
of the median weight for age of the WHO standard
30.1
8.6
2.2a
2.2b
Stunting prevalence
(a) Moderate and severe
(b) Severe
Percentage of children under age 5 who fall below
(a) minus two standard deviations (moderate and severe)
(b) minus three standard deviations (severe)
of the median height for age of the WHO standard
37.4
15.8
2.3a
2.3b
Wasting prevalence
(a) Moderate and severe
(b) Severe
Percentage of children under age 5 who fall below
(a) minus two standard deviations (moderate and severe)
(b) minus three standard deviations (severe)
of the median weight for height of the WHO standard
11.3
3.2
2.4 Overweight prevalence Percentage of children under age 5 who are above two
standard deviations of the median weight for height of the
WHO standard
2.1
F i gure 2 : Underweigh t, s tunted, wasted and overwei ght
ch i ld ren und er age 5 (mode rate and se ve re) ,
N epal MICS, 2014
Underweight
Stunted
Wasted
Overweight
0
10
20
30
40
50
60
0 12 24 36 48 60
Pe
r ce
nt
Age in months

Nepal MICS 2014
Page | 4
Breastfeeding and infant feeding
MICS
Indicator Indicator Description Value
2.5 Children ever breastfed Percentage of women with a live birth in the last 2 years
who breastfed their last live-born child at any time
97.3
2.6 Early initiation of
breastfeeding
Percentage of women with a live birth in the last 2 years
who put their last newborn to the breast within one hour
of birth
48.7
2.7 Exclusive breastfeeding
under 6 months
Percentage of infants under 6 months of age who are
exclusively breastfedii
56.9
2.8 Predominant
breastfeeding under 6
months
Percentage of infants under 6 months of age who received
breast milk as the predominant source of nourishmentiii
during the previous day
74.9
2.9 Continued breastfeeding
at 1 year
Percentage of children age 12-15 months who received
breast milk during the previous day
93.6
2.10 Continued breastfeeding
at 2 years
Percentage of children age 20-23 months who received
breast milk during the previous day
86.7
2.11 Median duration of
breastfeeding
The age in months when 50 percent of children age 0-35
months did not receive breast milk during the previous day
36
2.12 Age-appropriate
breastfeeding
Percentage of children age 0-23 months appropriately fediv
during the previous day
79.3
2.13 Introduction of solid, semi-
solid or soft foods
Percentage of infants age 6-8 months who received solid,
semi-solid or soft foods during the previous day
73.5
2.14 Milk feeding frequency for
non-breastfed children
Percentage of non-breastfed children age 6-23 months
who received at least 2 milk feedings during the previous
day
59.5
2.15 Minimum meal frequency Percentage of children age 6-23 months who received
solid, semi-solid and soft foods (plus milk feeds for non-
breastfed children) the minimum number of timesv or
more during the previous day
74.4
2.16 Minimum dietary diversity Percentage of children age 6–23 months who received
foods from 4 or more food groupsvi during the previous
day
37.0
2.17a
2.17b
Minimum acceptable diet (a) Percentage of breastfed children age 6–23 months who
had at least the minimum dietary diversity and the
minimum meal frequency during the previous day
(b) Percentage of non-breastfed children age 6–23 months
who received at least 2 milk feedings and had at least the
minimum dietary diversity not including milk feeds and the
minimum meal frequency during the previous day
32.3
22.8
2.18 Bottle feeding Percentage of children age 0-23 months who were fed with
a bottle during the previous day
11.5
Salt iodization
MICS
Indicator Indicator Description Value
2.19 Iodized salt consumption Percentage of households with salt testing 15 parts per
million or more of iodide
81.5
Low-birthweight
MICS
Indicator Indicator Description Value
2.20 Low-birthweight infants Percentage of most recent live births in the last 2 years
weighing below 2,500 grams at birth
24.2
2.21 Infants weighed at birth Percentage of most recent live births in the last 2 years
who were weighed at birth
60.0

Nepal MICS 2014
Page | 5
CHILD HEALTH
Vaccinations
MICS
Indicator Indicator Description Value
3.1 Tuberculosis
immunization coverage
Percentage of children age 12-23 months who received
BCG vaccine by their first birthday
95.7
3.2 Polio immunization
coverage
Percentage of children age 12-23 months who received the
third dose of OPV vaccine (OPV3) by their first birthday
91.8
3.3 Diphtheria, pertussis and
tetanus (DPT)
immunization coverage
Percentage of children age 12-23 months who received the
third dose of DPT vaccine (DPT3) by their first birthday
88.3
3.4 MDG 4.3 Measles immunization
coverage
Percentage of children age 12-23 months who received
measles vaccine by their first birthday
92.6
3.5 Hepatitis B immunization
coverage
Percentage of children age 12-23 months who received the
third dose of Hepatitis B vaccine (HepB3) by their first
birthday
88.3
3.6 Haemophilus influenzae
type B (Hib)
immunization coverage
Percentage of children age 12-23 months who received the
third dose of Hib vaccine (Hib3) by their first birthday
88.3
3.8 Full immunization
coverage
Percentage of children age 12-23 months who received
allvii vaccinations recommended in the national
immunization schedule by their first birthday
84.5
F i gure 3 : Vacc inat ions by age 12 m on ths, Nepal MICS, 2014
96
96
95
92
95
93
88
93
95
93
88
95
93
88
85
3
BCG
Polio1
Polio2
Polio3
DPT1
DPT2
DPT3
Measles
HepB1
HepB2
HepB3
Hib1
Hib2
Hib3
Fully vaccinated
No vaccinations
Per cent
Children Age 12-23 months
Nepal MICS 2014
Page | 6
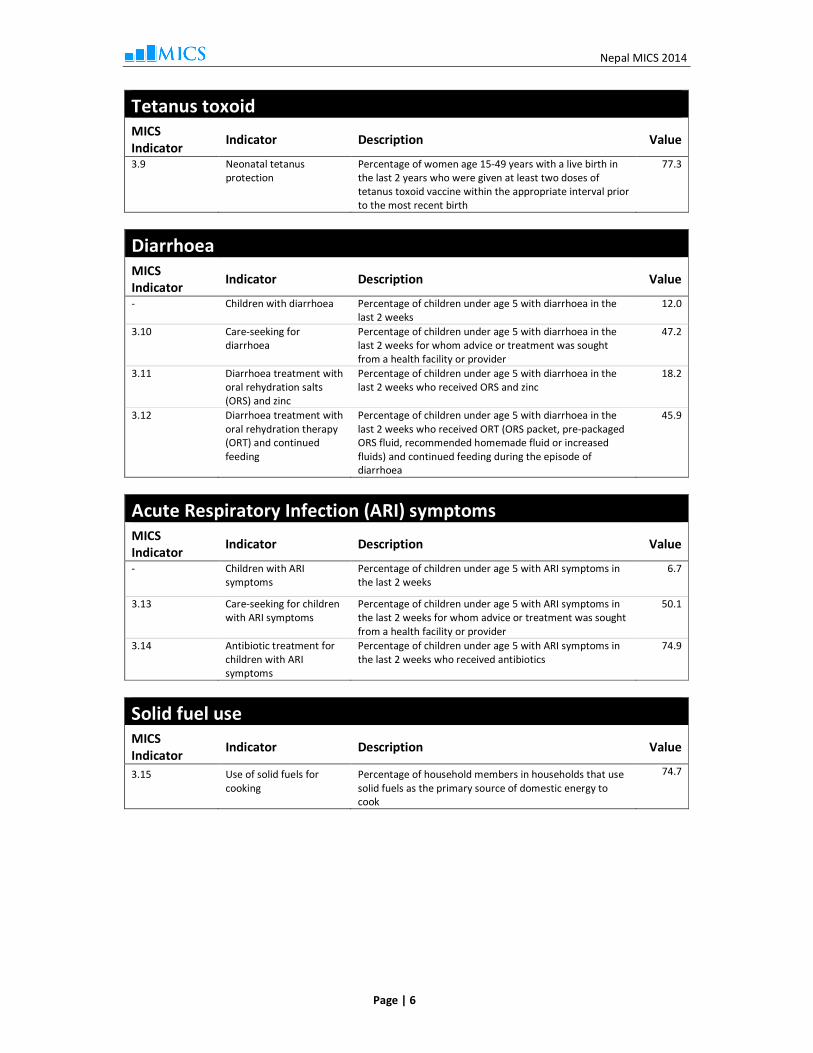
Tetanus toxoid
MICS
Indicator Indicator Description Value
3.9 Neonatal tetanus
protection
Percentage of women age 15-49 years with a live birth in
the last 2 years who were given at least two doses of
tetanus toxoid vaccine within the appropriate interval prior
to the most recent birth
77.3
Diarrhoea
MICS
Indicator Indicator Description Value
- Children with diarrhoea Percentage of children under age 5 with diarrhoea in the
last 2 weeks
12.0
3.10 Care-seeking for
diarrhoea
Percentage of children under age 5 with diarrhoea in the
last 2 weeks for whom advice or treatment was sought
from a health facility or provider
47.2
3.11 Diarrhoea treatment with
oral rehydration salts
(ORS) and zinc
Percentage of children under age 5 with diarrhoea in the
last 2 weeks who received ORS and zinc
18.2
3.12 Diarrhoea treatment with
oral rehydration therapy
(ORT) and continued
feeding
Percentage of children under age 5 with diarrhoea in the
last 2 weeks who received ORT (ORS packet, pre-packaged
ORS fluid, recommended homemade fluid or increased
fluids) and continued feeding during the episode of
diarrhoea
45.9
Acute Respiratory Infection (ARI) symptoms
MICS
Indicator Indicator Description Value
- Children with ARI
symptoms
Percentage of children under age 5 with ARI symptoms in
the last 2 weeks
6.7
3.13 Care-seeking for children
with ARI symptoms
Percentage of children under age 5 with ARI symptoms in
the last 2 weeks for whom advice or treatment was sought
from a health facility or provider
50.1
3.14 Antibiotic treatment for
children with ARI
symptoms
Percentage of children under age 5 with ARI symptoms in
the last 2 weeks who received antibiotics
74.9
Solid fuel use
MICS
Indicator Indicator Description Value
3.15 Use of solid fuels for
cooking
Percentage of household members in households that use
solid fuels as the primary source of domestic energy to
cook
74.7

Nepal MICS 2014
Page | 7
Fever
MICS
Indicator Indicator Description Value
- Children with fever Percentage of children under age 5 with fever in the last
2 weeks
20.1
3.20 Care-seeking for fever Percentage of children under age 5 with fever in the last
2 weeks for whom advice or treatment was sought from
a health facility or provider
46.1

Nepal MICS 2014
Page | 8
WATER AND SANITATION
Water and sanitation
MICS
Indicator Indicator Description Value
4.1 MDG 7.8 Use of improved drinking
water sources
Percentage of household members using improved sources
of drinking water
93.3
4.2 Water treatment Percentage of household members in households using
unimproved drinking water who use an appropriate
treatment method
13.6
4.3 MDG 7.9
Use of improved
sanitation
Percentage of household members using improved
sanitation facilities which are not shared
60.1
4.4 Safe disposal of child’s
faeces
Percentage of children age 0-2 years whose last stools
were disposed of safely
48.0
4.5 Place for hand washing Percentage of households with a specific place for hand
washing where water and soap or other cleansing agent
are present
72.5
4.6 Availability of soap or
other cleansing agent
Percentage of households with soap or other cleansing
agent
94.9
4.C1 E.coli concentration in
household drinking water
Percentage of household members with E. coli risk level in
household water ≥ 1 cfu/100ml
82.2
4.C2 E.coli concentration in
source water
Percentage of households with E. coli risk level in source
water ≥ 1 cfu/100ml
71.1
F i gure 4 : Use of improved wate r and san i tat ion in u rb an and
rural areas , Nepal MIC S , 2014
93
60
96
63
93
60
Percentage of household members using
an improved water source
Percentage of household members using
an improved sanitation facility which is not shared
Per cent
Total
Urban
Rural

Nepal MICS 2014
Page | 9
REPRODUCTIVE HEALTH
Contraception and unmet need
MICS Indicator Indicator Description Value - Total fertility rate Total fertility rateA for women age 15-49 years 2.3
5.1 MDG 5.4 Adolescent birth rate Age-specific fertility rateA for women age 15-19 years 71
5.2 Early childbearing Percentage of women age 20-24 years who had at least
one live birth before age 18
16.0
5.3 MDG 5.3 Contraceptive
prevalence rate
Percentage of women age 15-49 years currently married or
in union who are using (or whose partner is using) a
(modern or traditional) contraceptive method
49.6
5.4 MDG 5.6 Unmet need Percentage of women age 15-49 years who are currently
married or in union who are fecund and want to space
their births or limit the number of children they have and
who are not currently using contraception
25.2
A The age-specific fertility rate is defined as the number of live births to women in a specific age group during a specified period,
divided by the average number of women in that age group during the same period, expressed per 1,000 women. The age-specific
fertility rate for women age 15-19 years is also termed as the adolescent birth rate.
The total fertility rate (TFR) is calculated by summing the age-specific fertility rates calculated for each of the 5-year age groups of
women, from age 15 through to age 49. The TFR denotes the average number of children to which a woman will have given birth by
the end of her reproductive years (by age 50) if current fertility rates prevailed.
F i gure 5 : Use of contracep tion, Nepal MICS , 2014.
Modern methods 47.1 Traditional methods 2.5
Female sterilization 18.0 Periodic abstinence 0.2
Male sterilization 4.7 Withdrawal 2.2
IUD 1.7 Other 0.1
Injectables 13.0
Implants 1.3 Any method 49.6
Pill 4.7
Male condom 3.7 No method 50.3
Female condom 0.0
Diaphragm/Foam/Jelly 0.1 Note: The total does not add to 100% as 0.1% of
responses were either "Don't know" or missing.
Modern methods
Traditional
methodsNo method
0 10 20 30 40 50 60 70 80 90 100
Per cent

Nepal MICS 2014
Page | 10
Maternal and newborn health
MICS
Indicator Indicator Description Value
5.5a
5.5b
MDG 5.5
MDG 5.5
Antenatal care coverage Percentage of women age 15-49 years with a live birth in
the last 2 years who were attended during their last
pregnancy that led to a live birth
(a) at least once by skilled health personnel
(b) at least four times by any provider
68.3
59.5
5.6 Content of antenatal care Percentage of women age 15-49 years with a live birth in
the last 2 years who had their blood pressure measured
and gave urine and blood samples during the last
pregnancy that led to a live birth
61.2
5.7 MDG 5.2 Skilled attendant at
delivery
Percentage of women age 15-49 years with a live birth in
the last 2 years who were attended by skilled health
personnel during their most recent live birth
55.6
5.8 Institutional deliveries Percentage of women age 15-49 years with a live birth in
the last 2 years whose most recent live birth was delivered
in a health facility
55.2
5.9 Caesarean section Percentage of women age 15-49 years whose most recent
live birth in the last 2 years was delivered by caesarean
section
8.6
Post-natal health checks
MICS
Indicator Indicator Description Value
5.10 Post-partum stay in
health facility
Percentage of women age 15-49 years who stayed in the
health facility for 12 hours or more after the delivery of
their most recent live birth in the last 2 years
76.0
5.11 Post-natal health check
for the newborn
Percentage of last live births in the last 2 years who
received a health check while in facility or at home
following delivery, or a post-natal care visit within 2 days
after delivery
57.6
5.12 Post-natal health check
for the mother
Percentage of women age 15-49 years who received a
health check while in facility or at home following delivery,
or a post-natal care visit within 2 days after delivery of
their most recent live birth in the last 2 years
57.9
F i gure 6 : P lace of de l i ve ry and pos t-natal he al th checks ,
N epal MICS, 2014
43
17 18
55
91 91
Place of delivery Post-natal health check
for the newborn
Post-natal health check
for the mother
Per cent
Home deliveries Health facility deliveries

Nepal MICS 2014
Page | 11
CHILD DEVELOPMENT
Child development
MICS
Indicator Indicator Description Value
6.1 Attendance to early
childhood education
Percentage of children age 36-59 months who are
attending an early childhood education programme
50.7
6.2 Support for learning Percentage of children age 36-59 months with whom an
adult has engaged in four or more activities to promote
learning and school readiness in the last 3 days
67.2
6.3 Father’s support for
learning
Percentage of children age 36-59 months whose biological
father has engaged in four or more activities to promote
learning and school readiness in the last 3 days
10.1
6.4 Mother’s support for
learning
Percentage of children age 36-59 months whose biological
mother has engaged in four or more activities to promote
learning and school readiness in the last 3 days
30.4
6.5 Availability of children’s
books
Percentage of children under age 5 who have three or
more children’s books
4.8
6.6 Availability of playthings Percentage of children under age 5 who play with two or
more types of playthings
59.2
6.7 Inadequate care Percentage of children under age 5 left alone or in the care
of another child younger than 10 years of age for more
than one hour at least once in the last week
20.6
6.8 Early child development
index
Percentage of children age 36-59 months who are
developmentally on track in at least three of the following
four domains: literacy-numeracy, physical, social-
emotional, and learning
64.4

Nepal MICS 2014
Page | 12
LITERACY AND EDUCATION
Literacy and educationviii
MICS
Indicator Indicator Description Value
7.1 MDG 2.3 Literacy rate among young
women
Percentage of young women age 15-24 years who are able
to read a short simple statement about everyday life or
who attended secondary or higher education
84.0
7.2 School readiness Percentage of children in first grade of primary school who
attended pre-school during the previous school year
74.2
7.3 Net intake rate in primary
education
Percentage of children of school-entry age who enter the
first grade of primary school
57.3
7.4 MDG 2.1 Primary school net
attendance ratio
(adjusted)
Percentage of children of primary school age currently
attending primary or secondary school
85.9
7.5 Secondary school net
attendance ratio
(adjusted)
Percentage of children of secondary school age currently
attending secondary school or higher
66.1
7.6 MDG 2.2 Children reaching last
grade of primary
Percentage of children entering the first grade of primary
school who eventually reach last grade
98.9
7.7 Primary completion rate Number of children attending the last grade of primary
school (excluding repeaters) divided by number of children
of primary school completion age (age appropriate to final
grade of primary school)
99.5
7.8 Transition rate to
secondary school
Number of children attending the last grade of primary
school during the previous school year who are in the first
grade of secondary school during the current school year
divided by number of children attending the last grade of
primary school during the previous school year
97.2
7.9 MDG 3.1 Gender parity index
(primary school)
Primary school net attendance ratio (adjusted) for girls
divided by primary school net attendance ratio (adjusted)
for boys
0.99
7.10 MDG 3.1 Gender parity index
(secondary school)
Secondary school net attendance ratio (adjusted) for girls
divided by secondary school net attendance ratio
(adjusted) for boys
1.02
F i gure 7 : Educat ion in dicators b y sex , Ne pal M IC S, 2014
School
readiness
75 73
Net intake
rate in
primary
education
Primary
school
completion
rate
Transition
rate to
secondary
school
59 55 105 95 97 98
Attendance
to early
childhood
education
Primary school attendance Secondary school attendance
52 49 86 85 65 67
Children reaching last grade of primary
99 99 Boys Girls
Note: All indicator values are in per cent
Nepal MICS 2014
Page | 13
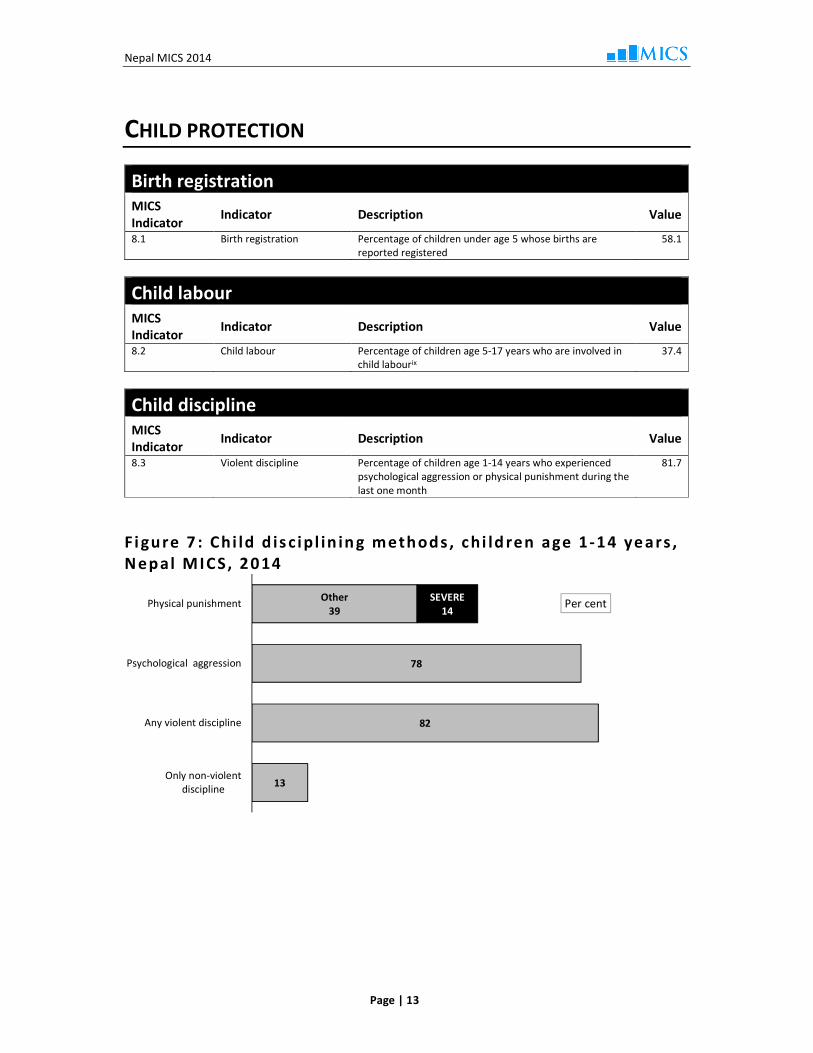
CHILD PROTECTION
Birth registration
MICS
Indicator Indicator Description Value
8.1 Birth registration Percentage of children under age 5 whose births are
reported registered
58.1
Child labour
MICS
Indicator Indicator Description Value
8.2 Child labour Percentage of children age 5-17 years who are involved in
child labourix
37.4
Child discipline
MICS
Indicator Indicator Description Value
8.3 Violent discipline Percentage of children age 1-14 years who experienced
psychological aggression or physical punishment during the
last one month
81.7
F i gure 7 : Chi ld d is c ipl in in g methods , chi ld ren age 1-14 ye ars ,
N epal MICS, 2014
13
82
78
Other
39
SEVERE
14
Only non-violent
discipline
Any violent discipline
Psychological aggression
Physical punishment Per cent

Nepal MICS 2014
Page | 14
Early marriage and polygyny
MICS
Indicator Indicator Description Value
8.4 Marriage before age 15
Percentage of women age 15-49 years who were first
married or in union before age 15
15.5
8.5 Marriage before age 18
Percentage of women age 20-49 years who were first
married or in union before age 18
48.5
8.6 Young people age 15-19
years currently married or
in union
Percentage of women people age 15-19 years who are
married or in union
24.5
8.7 Polygyny
Percentage of women age 15-49 years who are in a
polygynous union
4.1
8.8a
8.8b
Spousal age difference Percentage of young women who are married or in union
and whose spouse is 10 or more years older,
(a) among women age 15-19 years,
(b) among women age 20-24 years
6.3
7.5
Children’s living arrangements
MICS
Indicator Indicator Description Value
8.13 Children’s living
arrangements
Percentage of children age 0-17 years living with neither
biological parent
4.8
8.14 Prevalence of children with
one or both parents dead
Percentage of children age 0-17 years with one or both
biological parents dead
4.3
8.15 Children with at least one
parent living abroad
Percentage of children 0-17 years with at least one
biological parent living abroad
18.2

Nepal MICS 2014
Page | 15
HIV/AIDS
HIV/AIDS knowledge and attitudes
MICS
Indicator Indicator Description Value
- Have heard of AIDS Percentage of women age 15-49 years who have heard of
AIDS
78.4
9.1 MDG 6.3 Knowledge about HIV
prevention among young
people
Percentage of young women age 15-24 years who correctly
identify ways of preventing the sexual transmission of HIVx,
and who reject major misconceptions about HIV
transmissionxi
36.4
9.2 Knowledge of mother-to-
child transmission of HIV
Percentage of women age 15-49 years who correctly
identify all three meansxii of mother-to-child transmission
of HIV
38.4
9.3 Accepting attitudes
towards people living with
HIV
Percentage of women age 15-49 years expressing
accepting attitudes on all four questionsxiii toward people
living with HIV
48.6
HIV testing
MICS
Indicator Indicator Description Value
9.4 People who know
where to be tested for
HIV
Percentage of women age 15-49 years who state knowledge
of a place to be tested for HIV
57.9
9.7 HIV counselling during
antenatal care
Percentage of women age 15-49 years who had a live birth in
the last 2 years and received antenatal care during the
pregnancy of their most recent birth, reporting that they
received counselling on HIV during antenatal care
14.1
Nepal MICS 2014
Page | 16
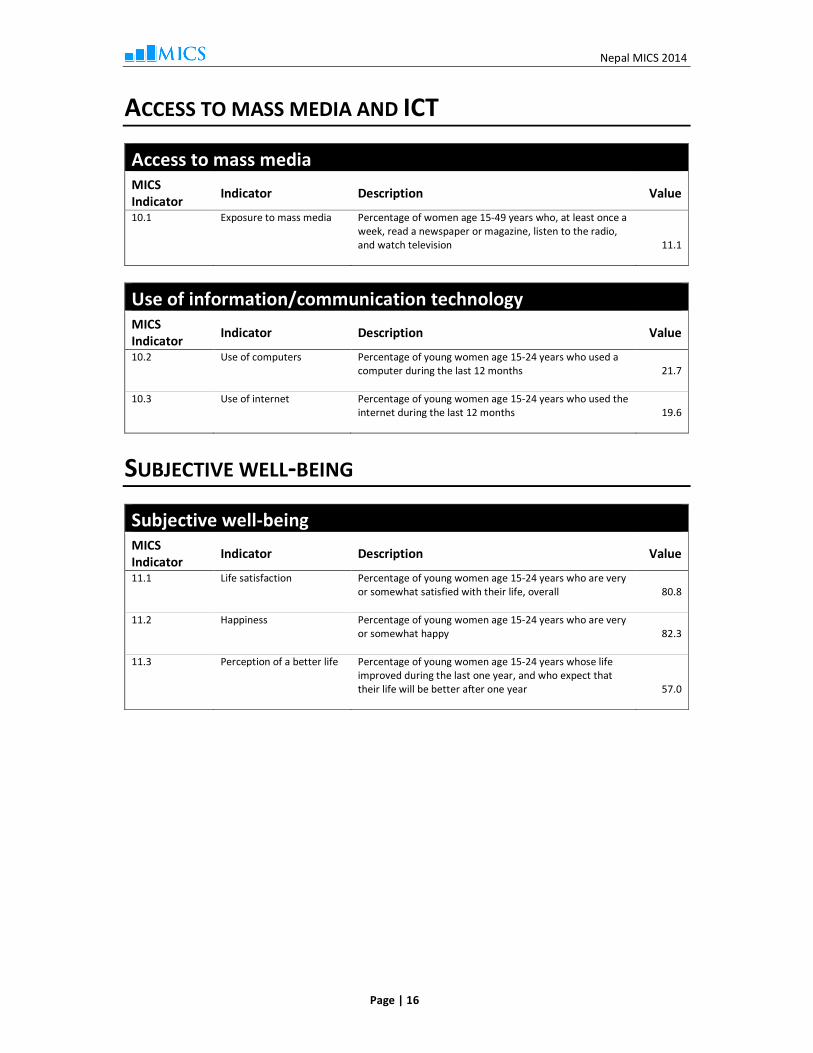
ACCESS TO MASS MEDIA AND ICT
Access to mass media
MICS
Indicator Indicator Description Value
10.1 Exposure to mass media
Percentage of women age 15-49 years who, at least once a
week, read a newspaper or magazine, listen to the radio,
and watch television
11.1
Use of information/communication technology
MICS
Indicator Indicator Description Value
10.2 Use of computers
Percentage of young women age 15-24 years who used a
computer during the last 12 months
21.7
10.3 Use of internet
Percentage of young women age 15-24 years who used the
internet during the last 12 months
19.6
SUBJECTIVE WELL-BEING
Subjective well-being
MICS
Indicator Indicator Description Value
11.1 Life satisfaction
Percentage of young women age 15-24 years who are very
or somewhat satisfied with their life, overall
80.8
11.2 Happiness
Percentage of young women age 15-24 years who are very
or somewhat happy
82.3
11.3 Perception of a better life
Percentage of young women age 15-24 years whose life
improved during the last one year, and who expect that
their life will be better after one year
57.0

Nepal MICS 2014
Page | 17
TOBACCO AND ALCOHOL USE
Tobacco use
MICS
Indicator Indicator Description Value
12.1 Tobacco use Percentage of women age 15-49 years who smoked
cigarettes, or used smoked or smokeless tobacco products
at any time during the last one month
9.2
12.2 Smoking before age 15
Percentage of women age 15-49 years who smoked a
whole cigarette before age 15
3.9
Alcohol use
MICS
Indicator Indicator Description Value
12.3 Use of alcohol
Percentage of women age 15-49 years who had at least
one alcoholic drink at any time during the last one month
9.5
12.4 Use of alcohol before age
15
Percentage of women age 15-49 years who had at least
one alcoholic drink before age 15
6.8

Nepal MICS 2014
Page | 18
NOTES
i Weight and height/length measurements were successfully completed for 97.6 and 96.6 per cent of children under age 5,
respectively
ii Infants receiving breast milk, and not receiving any other fluids or foods, with the exception of oral rehydration solution,
vitamins, mineral supplements and medicines
iii Infants receiving breast milk and certain fluids (water and water-based drinks, fruit juice, ritual fluids, oral rehydration
solution, drops, vitamins, minerals, and medicines), but do not receive anything else (in particular, non-human milk and
food-based fluids)
iv Infants age 0-5 months who are exclusively breastfed, and children age 6-23 months who are breastfed and ate solid,
semi-solid or soft foods
v Breastfeeding children: Solid, semi-solid, or soft foods, two times for infants age 6-8 months, and three times for children
9-23 months; Non-breastfeeding children: Solid, semi-solid, or soft foods, or milk feeds, four times for children age 6-23
months
vi The indicator is based on consumption of any amount of food from at least 4 out of the 7 following food groups: 1)
grains, roots and tubers, 2) legumes and nuts, 3) dairy products (milk, yogurt, cheese), 4) flesh foods (meat, fish, poultry
and liver/organ meats), 5) eggs, 6) vitamin-A rich fruits and vegetables, and 7) other fruits and vegetables
vii Full vaccination includes the following: BCG, Polio3, Pentavalent3 (DPT3, HepB3, Hib3) and Measles before age 1 in the
national immunization schedule.
viii Education indicators, wherever applicable, are based on information on reported school attendance (at any time during
the school year), as a proxy for enrolment.
ix Children involved in child labour are defined as children involved in economic activities at or above the age-specific
thresholds, children involved in household chores at or above the age-specific thresholds, and children involved in
hazardous work
x Using condoms and limiting sex to one faithful, uninfected partner
xi The two most common misconceptions about HIV transmission are included in the indicator calculation: i) mosquito bites
and ii) sharing food with someone with HIV
xii Transmission during pregnancy, during delivery, and by breastfeeding
xiii People (1) who think that a female teacher who is HIV-positive and is not sick should be allowed to continue teaching, (2)
who would buy fresh vegetables from a shopkeeper or vendor who is HIV-positive, (3) who would not want to keep secret
that a family member is HIV-positive, and (4) who would be willing to care for a family member with AIDS in own home