nepal fiscal restructuring and public resource management
TRANSCRIPT
Report No. 12281-NEP
NepalFiscal Restructuring and PublicResource Management in the Nineties(In Two Volumes)Volume II Review of Sector Expenditures, and Statistical Appendix
March 17, 1994
South Asia Country Department ICountry Operations, Industry and Finance Division
FOR OFFICIAL USE ONLY
Document of the World Bank
This document has a restricted distribution and may be used by recipientsonly in the performance of their official duties. Its contents may not otherwisebe disclosed without World Bank authorization
Pub
lic D
iscl
osur
e A
utho
rized
Pub
lic D
iscl
osur
e A
utho
rized
Pub
lic D
iscl
osur
e A
utho
rized
Pub
lic D
iscl
osur
e A
utho
rized
Pub
lic D
iscl
osur
e A
utho
rized
Pub
lic D
iscl
osur
e A
utho
rized
Pub
lic D
iscl
osur
e A
utho
rized
Pub
lic D
iscl
osur
e A
utho
rized

FOR OFFICIAL USE ONLY
ABEBRVIATIONS AMD ACRONYNS
ADB - Asian Development Bank
ADB/N - Agricultural Development Bank of NepalAGO - Auditor General's OfficeAIC - Agricultural Inputs CorporationARC - Administrative Reform Commission
BAU - Business-As-UsualBOP - Balance of PaymentsBPE - Basic and Primary Education
BPEP - Basic and Primary Education Project
CBPASS - Commercial Bank Problem Analysis and Strategy Study
CEM - Country Economic Memorandum
CPR - Contraceptive Prevalence Rate
CTEVT - Council for Technical Education and Vocational Training
DANIDA - Danish International Development Agency
MDc - Dairy Development CorporationDOI - Department of IrrigationDOR - Department of Roads
DTOs - District Treasury Offices
DNPWC - Department of National Parks and Wildlife ConservationDSCWM - Department of Soil Conservation and Watershed ManagementDWSS - Department of Water Supply and Sanitation
BP - Eighth PlanBPI - Expanded Program for Immunization
ESAF - Enhanced Structural Adjustment Facility
FCGO - Financial Controller General's Office
FGF - Fully Government FundedFP/MCH - Family Planning and Maternity and Child Health
FY - Fiscal Year
GDP - Gross Domestic Product
HC - Health Centers
HFP - Health and Family Planning
HMG - His Majesty's GovernmentHPs - Health Posts
HPP - Health and Population Program
HRD - Human Resource DevelopmentHS - Higher Secondary
IDA - International Development Association
11si - International Irrigation Management Institute
ILC - Irrigation Line of CreditIMC - Irrigation Management Center
ISP - Irrigation Sector Project
This docmn bas a retricted distbuion and may be used by recipients only in te perfomnce of thdrofficial d rues Its contnts may not otherwise be tisclosed without World Bank auorizaton.
LRMP - Land Resources Mapping Project
MCH - Maternity and Child Health
MGA - Ministry of General AdministrationMOP - Ministry of Finance
MOH - Ministry of HealthMPE - Manufacturing Public EnterprisesMRCU - Maintenance and Rehabilitation Coordination Unit
NARC - Nepal Agricultural Research CouncilNBA - Nepal Electricity AuthorityNGO - Non-Governmental OrganizationNPC - National Planning CommissionNWSC - Nepal Water and Sewerage Corporation
OECD - Organization for Economic Cooperation and DevelopmentOGL - Open General LicenseO&M - Operations and Maintenance
PBPM - Program Budgeting and Project MonitoringPE - Public Enterprise
PEDP - Primary Education Development ProjectPEP - Primary Education ProjectPFP - Policy Framework Paper
PHC - Public Health CenterPME - Public Manufacturing EnterprisesPPAD - Perspective Plan for Agricultural Development
RNAC - Royal Nepal Airline CorporationROR - Rate of Returns
SAL - Structural Adjustment FacilitySFYP - Seventh Five Year PlanSMD - System Management DivisionSTW - Shallow Tubewells
TA/DA - Travel And Daily AllowanceT&D - Transmission and DistributionT&T - Trade and TransitTVE - Technical and Vocational Education
UNDP - United Nations Development ProgramUNICEF - United Nations Children's Education FundUPE - Universal Primary Education
VAT - Value-Added Tax
FISCAL RESTRUCTURING AND PBMLIC REBOURCEMANAGEMENT IN THE NINETIES
VOLUMM II: REVIEW OF SECTOR EXPENDITURES AND STATISTICAL APPMWDIX
C0NTBNT8
PRan
Chapter 5 SECTC-. EXPENDITURE PERFORMaNCE AND REFORMS
A. Agriculture .... . . . . . .. . . . . . . . . . 82e Introduction and Background . . . . . . . . . . 82* Irrigation .86e Irrigation Credit and Subsidies . . . . . . . . 92* Fertilizer .94
• Research and Extension . . . . . . . . . . . . . 98o Livestock ................... 100* Forestry .... . . . . . . . . . . . . . . . . 101o Conclusions ... . . . . . . . . . . . . . . . 107
B. Industry ....................................... 109e Performance . . . . . . . . . . . . . . . . . . 109o Expenditure Priorities and Reforms ... . . . . 110
C. Power ................. . . . . . . . . . . 112* Performance and Overview of Issues ... . . . . 112* Sector Objectives and Strategy . . . . . . . . . 114e Priorities for Intermediate Power Supply . . . . 114o The Arun III Project . . . . . . . . . . . . . . 115* Commercialization of NEA . . . . . . . . . . . . 118* Rural Electrification Programs . . . . . . . . . 119* Summary and Conclusions . . . . . . . . . . . . 120
D. Transport . .................. . . . . . . . . . 120* Introduction and Background . . . . . . . . . . 120* Road Transport ... . . . . . . . . . . . . . . 123* The Trail System . . . . . . . . . . . . . . . . 129* Aviation .... . . . . . . . . . . . . . . . . 130* Conclusions ... . . . . . . . . . . . . . . . 132
E. Education . .................. . . . . . . . . . 134* Background and Main Issues . . . . . . . . . . . 134• Basic and Primary Education . . . . . . . . . . 137* Secondary Education . . . . . . . . . . . . . . 140* Technical and Vocational Education . . . . . . . 141* Higher Education .143o Conclusion ................... 145
Contents
RFa
F. Health and Family Planning . . . . . . . . . . . . . 147• Introduction and Background . . . . . . . . . . 147o Health Service Institutions . . . . . . . . . . 150o Expanded Program for Immunication (EPI) . . . . 154
e Family Planning and Maternal and Child Health 155o Malaria Eradication Program . . . . . . . . . . 156o ronclusion . . . . . . . . . . . . . . . . . . . 156
G. Water Supply and Sanitation . . . . . . . . . . . . 15So Background and Performance . . . . . . . . . . . 158o EP Expenditure Policies and Priorities . . . . . 160* Sustainability and Resource Mobilization . . . . 164
o Conclusion . . . . . . . . . . . . . . . . . . . 165
H. Expend-ture Reforms and Environmental Policy . . . . 166
STATISTZCAL APPNMDIX
MAP
TXT TABLES
Table Pae
Chapter S
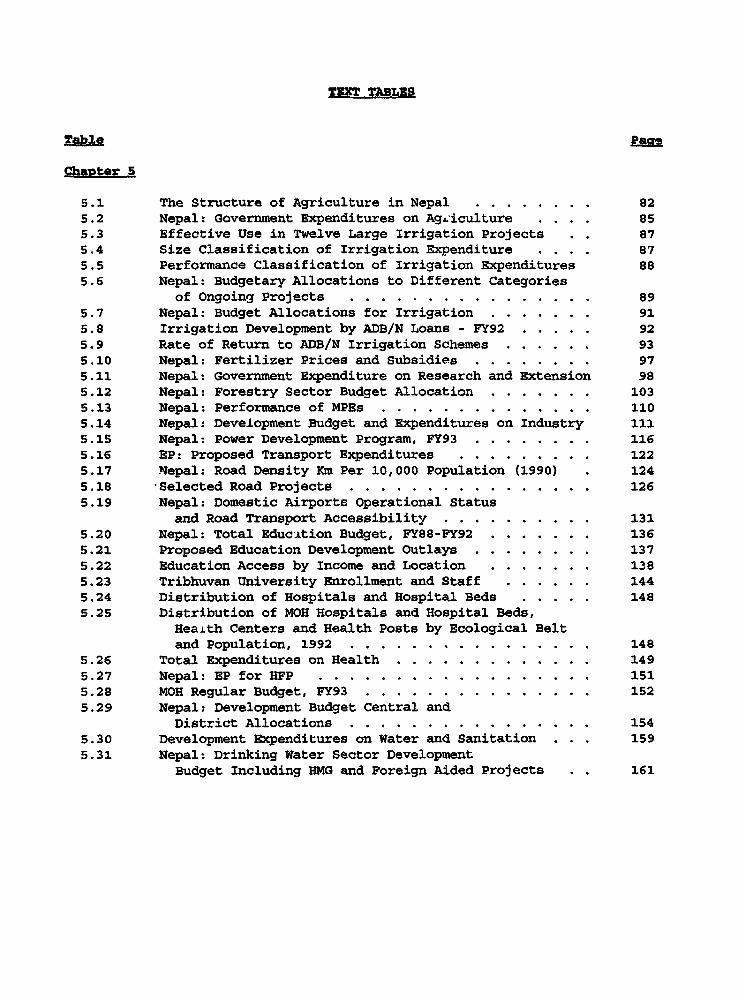
5.1 The Structure of Agriculture in Nepal . . . . . . . . 825.2 Nepal: Government Expenditures on Agriculture . . . 855.3 Effective Use in Twelve Large Irrigation Projects . . 875.4 Size Classification of Irrigation Expenditure . . . . 875.5 Performance Classification of Irrigation Expenditures 885.6 Nepal: Budgetary Allocations to Different Categories
of Ongoing Projects .895.7 Nepal: Budget Allocations for Irrigation . . . . . . . 91
5.8 Irrigation Development by ADB/N Loans - FY92 . . . . . 92
5.9 Rate of Return to ADB/N Irrigation Schemes . . . . . . 935.10 Nepal: Fertilizer Prices and Subsidies . . . . . . . . 97
5.11 Nepal: Government Expenditure on Research and Extension 985.12 Nepal: Forestry Sector Budget Allocation . . . . . . . 103
5.13 Nepal: Performance of MPEs . . . . . . . . . . . . . . 1105.14 Nepal: Development Budget and Expenditures on Industry 111
5.15 Nepal: Power Development Program, FY93 . . . . . . . . 1165.16 EP: Proposed Transport Expenditures . . . . . . . . . 122
5.17 Nepal: Road Density Km Per 10,000 Population (1990) 1245.18 Selected Road Projects .126
5.19 Nepal: Domestic Airports Operational Status
and Road Transport Accessibility . . . . . . . . . . 131
5.20 Nepal: Total Educltion Budget, FY88-PY92 . . . . . . . 1365.21 Proposed Education Development Outlays . . . . . . . . 137
5.22 Education Access by Income and Location . . . . . . . 1385.23 Tribhuvan University Enrollment and Staff . . . . . . 144
5.24 Distribution of Hospitals and Hospital Beds . . . . . 1485.25 Distribution of MOH Hospitals and Hospital Beds,
Health Centers and Health Posts by Ecological Belt
and Population, 1992 .1485.26 Total Expenditures on Health . . . . . . . . . . . . . 149
5.27 Nepal: EP for HFP .151
5.28 MOH Regular Budget, FY93 . . . . . . . . . . . . . . . 1525.29 Nepal: Development Budget Central and
District Allocations .1545.30 Development Expenditures on Water and Sanitation . . . 159
5.31 Nepal: Drinking Water Sector Development
Budget Including HMG and Foreign Aided Projects . 161

page lof 2
COUNTRY DATA - NEPAL
AREA POPULATION(1991) DEI (1991)147.181 km2 18.5 million 126 perkm2
Censusgrowthrate: 2.1%hA
POPULATION CHARACTURISTICS (1991) HEALTH (1992)Crude birth rate (per 1,000): 37.5 Populaion per physician: 15s,0Crude death a (per 1,000): 13.8 Population per hospital bed: 3,808Infant mortelity (per 1.000 live births): 102
INCOME DlSTRIBUTION DISTRIBUTION OF LANDOWNERSHIP% ofnational income, highest quintile: - % owned by top 10% of ownas:% of nation1 inconma, lowest quintile: - % owned by smallest 10% :
ACCESS TO SAFE WATER (1992) ACCESS TO ELECTRICITY% of population - urban: 62.0 % of populton - urban:% ofpopuation -rual: 380 % ofpopuation -rural:
NUTRITION(1986) EDUCATIONCalorie intake per peson: 2,078 Adult lltaay rate (% of population) (1991) 67Pea capita ptmein intake day): 53 Primary school enrlu nt - (% of
relevant apge goup -1988) 86
GNP PIR CAPITA IN 1992: US5170 lb
GROSS NATIONAL PRODUCT (FY93)uSSIn %
GNP at Market Prixs 2,891 100.0;hoss Domestic lnvestent 598 20.7Gas Naiona Saviwn 358 12.4Curet Accotmt Balance 263 8.9EWpt of Goods. NFS 593 20.2
Vnort ofoods. NFS 899 31.1
OUTfUT (FY92)Value Added
US$ Mln 3
Agriculture 1,408 48.7Induy 474 16.4Services 1.009 34.9
Total 2,891 100.0
GOVERNMENT FINACECenti Government
Rs Mln % ofGDPFY93 FY83 FY92 FY93
CurentReceipts 15,148 SA 10.7 10.4C etExpendtu 12,001 11.8 7.9 8.3CuentBance 3,147 .3A 2.8 2.1Capital Expeditures 20,405 8.7 13.1 14.1
la 1981-1991 intr censal gowth rate./b C tau in accordance with Atla5 methodoloy.- Not available.
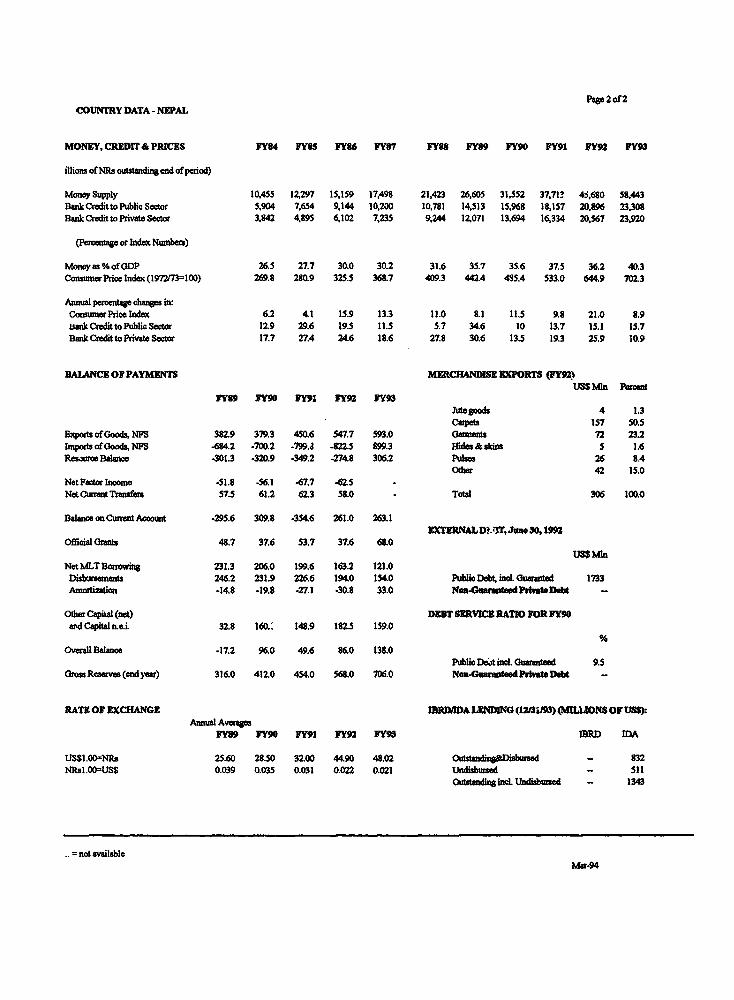
Pae 2 of2COUNTRY DATA - NIPAL
MONEY, CREDIT& PRICES FY84 FY8S FY6 FY87 FY88 FY89 FY90 FY91 FY92 FY93
illion ofNRs outUndiend of piod)
Money Supply 10,455 12,297 15,159 17,498 21,423 26,605 31.552 37,71' 4J,680 58.443BamkCredittoPublicSector 5,904 7,654 9,144 10,200 10.781 14,513 15,968 18.157 20,896 23,308Bank Credit to Pivate Scaor 3,842 4,895 6,102 7,235 9,244 12,071 13,694 16,334 20,567 23,920
(Percenag or Index Number)
Monqas %ofODP 26.5 27.7 30.0 30.2 31.6 35.7 35.6 37.5 36.2 40.3Consuer Price Index(1972M=100) 269.8 280.9 325.5 368.7 409.3 442.4 4S5.4 533.0 644.9 702.3
Annual pactage changes in:ConaumerPricelndex 6.2 4.1 15.9 13.3 11.0 8.1 11.5 9.8 21.0 8.9bankCredittoPublicSctor 12.9 29.6 19.5 11.5 5.7 34.6 10 13.7 15.1 15.7BankkCreditto Privatector 17.7 27.4 24.6 18.6 27.8 30.6 13.5 19.3 25.9 10.9
BALANCE OF PAYMENTS MERCHAN EPORTS (FY92)USSMln Pecet
FY89 FY90 FY91 FY92 FY93JAtegoods 4 1.3Capet 157 50.5
lixpots ofGoods, NFS 382.9 379.3 450.6 547.7 593.0 Gannets 72 23.2Impoit ofGoods, NFS -684.2 -700.2 -799.J 822.5 899.3 Hides& sain 5 1.6Resatre Balence -301.3 -320.9 -349.2 -274.8 306.2 Palsae 26 SA
Otber 42 15.0NeotFstor noome -51.8 -56.1 -67.7 -65Net Current Trnafers 57.5 61.2 62.3 58.0 - Totl 306 100.0
Balance en Current Account -295.6 309.8 -354.6 261.0 263.1EXTERNAL DE 1T, June 30,1992
Official rants 48.7 37.6 53.7 37.6 68.0US$Mln
NetMLTBorrowing 231.3 206.0 199.6 163.2 121.0DisUXmnart 246.2 231.9 226.6 194.0 154.0 Pablc Det il uarantd 1733Amortization -14.8 -19.8 -27.1 -30.8 33.0 Nan-GuaratedPatDebt -
Other Capita (net) DEBT SlERVICE RATO FOR FY90wd Capitalnei. 32.8 160.: 148.9 182.5 159.0
Overall Balance -17.2 96.0 49.6 86.0 138.0Public Det ind. Guaanteed 9.5
Gro Resenw (end year) 316.0 412.0 454.0 568.0 706.0 Non-Guateed Privste Debt -
RATE OF EXCHANGE IDRDIIDA LEDG (12/31193) (IALUONS OF 11SS):Anual Averages
FY89 FY90 FY91 FY92 FY93 WIRD IMA
USSI.O=NRs 25.60 28.50 32.00 44.90 48.02 - 832NRsl.00=USS 0.039 0.035 0.031 0.022 0.021 Ussed - 511
O_utding ind Undisbrd - 1343
=not availableMsr-94

SE1CTOR EXPENDIZTRE PEMRFoANCE AND REWOR_M
A. AGRICULTURm
a. Introduction and Backaround
Overview of Aaricultural Performance
5.1 Agriculture/ is the largest sector in the economy of Nepal,accounting for over half of GDP, over 80 percent of employment and 15 percentof recorded exports. Ninety-five percent of the poor are in rural areas,dependent mainly on agriculture for their livelihood.33/ Nepal has adiverse agro-climat'c structure, with a corresponding diversity of croppingpatterns. The Terai contributes 48.0 percent of the sector's value-added,closely followed by the Hills with 44.1 percent, and with the mountainsproducing only 7.8 percent (Table 5.1). The Terai is more dominant in cropproduction, with 52.4 percent of the total, while the Hills
Table 5.1s: T STRUCTURE OF AQRIULTUR IN NPALtPercent of Agricultural GDP FY89)
Total of
gcological
Crops Livestock Forestry Fisheries Other Zone Nepal
mountain 56.3 32.3 9.8 0.0 1.6 100.0 7.8(7.4) (9.0) (8.2) (0.0) (7.4)
sill 54.s 34.1 9.9 0.0 1.6 100.0 44.1(40.2) (S3.3) (46.5) (1.4) (40.2)
Terai 6S.1 22.1 8.8 2.1 1.9 100.0 48.1(S2.4) (37.7) (4S.3) (98.6) (S2.4)
Total of Sub-
Sectors (100.0) (100.0) (100.0) ( .0) (100.0) - -
Nepal 59.7 28.2 9.3 1.0 1.7 - 100.0
Note: The entries not in parenthesis in the table are the percentages of the agro-ecological zone value-
added contribut^d by the sub-sector indicated by the column heading. The entries in parenthesis in
the table are the percentages of the sub-sectoral value-added produced in the agro-ecological zone
indicated by the rsw heading. The entries under the column labelled aNepala show the percentage of
total value-added for the sector produced in the relevant agro-ecological zone. The entries in the
row labelled "Nepal" show the percentage of total value-added foz the whole agricultural sector
produced by the relevant sub-sectors.
Source: NPC Special compilation, January 1993.
TU throughout this chapter, unless the content demands otherwise, the term agriculture is taken
to subsume the whole sector, including livestock, forestry, and irrigation.
-U World Bank, Nepal: Poverty and Incomes, A World Bank Country Study, Washington DC, 1991,
pp.13.
- 83 -
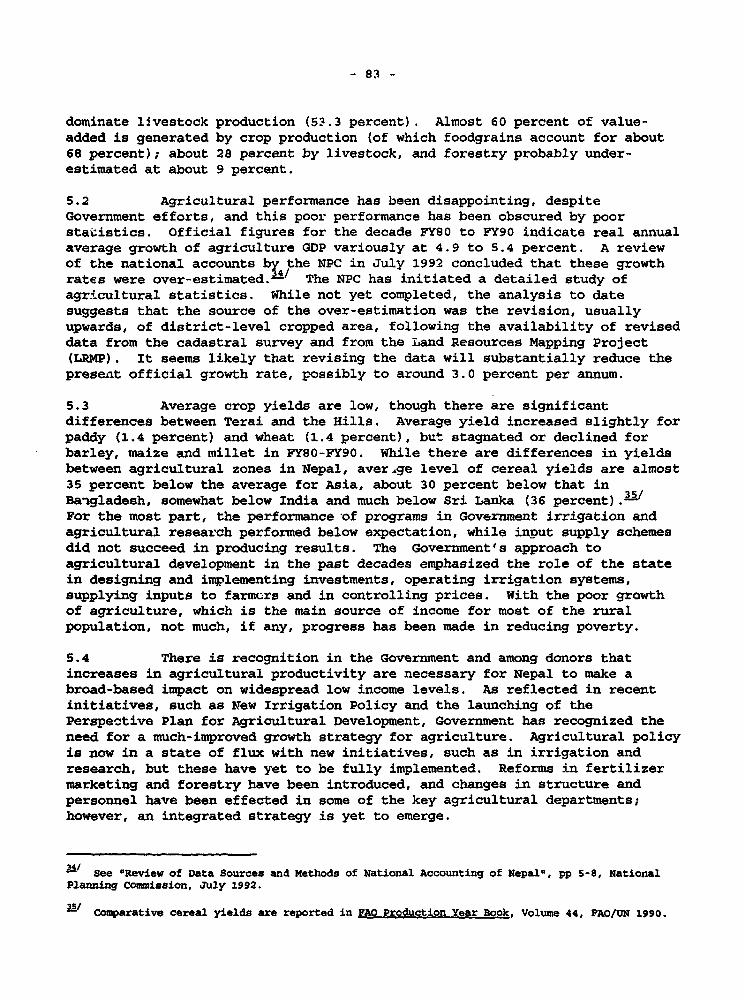
dominate livestock production (5?.3 percent). Almost 60 percent of value-added is generated by crop production (of which foodgrains account for about68 percent); about 28 percent by livestock, and forestry probably under-estimated at about 9 percent.
5.2 Agricultural performance has been disappointing, despiteGovernment efforts, and this poor performance has been obscured by poorstaiAstics. Official figures for the decade FY80 to FY90 indicate real annualaverage growth of agriculture GDP variously at 4.9 to 5.4 percent. A reviewof the national accounts by the NPC in July 1992 concluded that these growthrates were over-estimated._ The NPC has initiated a detailed study ofagricultural statistics. While not yet completed, the analysis to datesuggests that the source of the over-estimation was the revision, usuallyupwards, of district-level cropped area, following the availability of reviseddata from the cadastral survey and from the Land Resources Mapping Project(LRMP). It seems likely that revising the data will substantially reduce thepresent official growth rate, possibly to around 3.0 percent per annum.
5.3 Average crop yields are low, though there are significantdifferences between Terai and the Hills. Average yield increased slightly forpaddy (1.4 percent) and wheat (1.4 percent), but stagnated or declined forbarley, maize and millet in FY8O-FY90. While there are differences in yieldsbetween agricultural zones in Nepal, aver.ge level of cereal yields are almost35 percent below the average for Asia, about 30 percent below that inBangladesh, somewhat below India and much below Sri Lanka (36 percent).3/For the most part, the performance of programs in Government irrigation andagricultural research performed below expectation, while input supply schemesdid not succeed in producing results. The Government's approach toagricultural development in the past decades emphasized the role of the statein designing and implementing investments, operating irrigation systems,supplying inputs to farmers and in controlling prices. With the poor growthof agriculture, which is the main source of income for most of the ruralpopulation, not much, if any, progress has been made in reducing poverty.
5.4 There is recognition in the Government and among donors thatincreases in agricultural productivity are necessary for Nepal to make abroad-based impact on widespread low income levels. As reflected in recentinitiatives, such as Wtew Irrigation Policy and the launching of thePerspective Plan for Agricultural Development, Government has recognized theneed for a much-improved growth strategy for agriculture. Agricultural policyis now in a state of flux with new initiatives, such as in irrigation andresearch, but these have yet to be fully implemented. Reforms in fertilizermarketing and forestry have been introduced, and changes in structure andpersonnel have been effected in some of the key agricultural departments;however, an integrated strategy is yet to emerge.
S1/ See "Review of Data Sources and Methods of National Accounting of Nepal", pp 5-8, NationalPlanning Commission, July 1992.
35/Comparative cereal yields are reported in FAO Production Year Book, Volume 44, PAO/UN 1990.
- 84 -
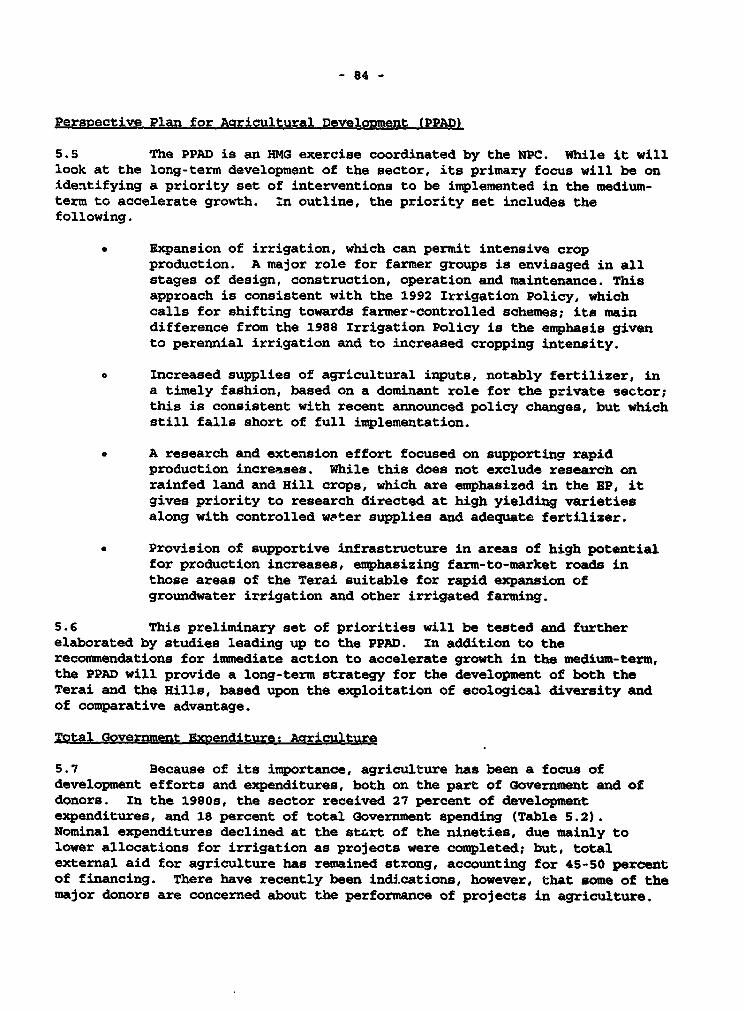
Perspective Plan for Aqricultural Develonment (PPAD)
5.5 The PPAD is an HMG exercise coordinated by the NPC. While it willlook at the long-term development of the sector, its primary focus will be oni.dentifying a priority set of interventions to be implemented in the medium-term to accelerate growth. in outline, the priority set includes thefollowing.
Expansion of irrigation, which can permit intensive cropproduction. A major role for farmer groups is envisaged in allstages of design, construction, operation and maintenance. Thisapproach is consistent with the 1992 Irrigation Policy, whichcalls for shifting towards farmer-controlled schemes; its maindifference from the 1988 Irrigation Policy is the emphasis givento perennial irrigation and to increased cropping intensity.
Increased supplies of agricultural inputs, notably fertilizer, ina timely fashion, based on a dominant role for the private sector;this is consistent with recent announced policy changes, but whichstill falls short of full implementation.
e A research and extension effort focused on supporting rapidproduction increases. While this does not exclude research onrainfed land and Hill crops, which are emphasized in the BP, itgives priority to research directed at high yielding varietiesalong with controlled w'ter supplies and adequate fertilizer.
* Provision of supportive infrastructure in areas of high potentialfor production increases, emphasizing farm-to-market roads inthose areas of the Terai suitable for rapid expansion ofgroundwater irrigation and other irrigated farming.
5.6 This preliminary set of priorities will be tested and furtherelaborated by studies leading up to the PPAD. In addition to therecommendations for immediate action to accelerate growth in the medium-term,the PPAD will provide a long-term strategy for the development of both theTerai and the Hills, based upon the exploitation of ecological diversity andof comparative advantage.
Total Government Expenditure: Aariculture
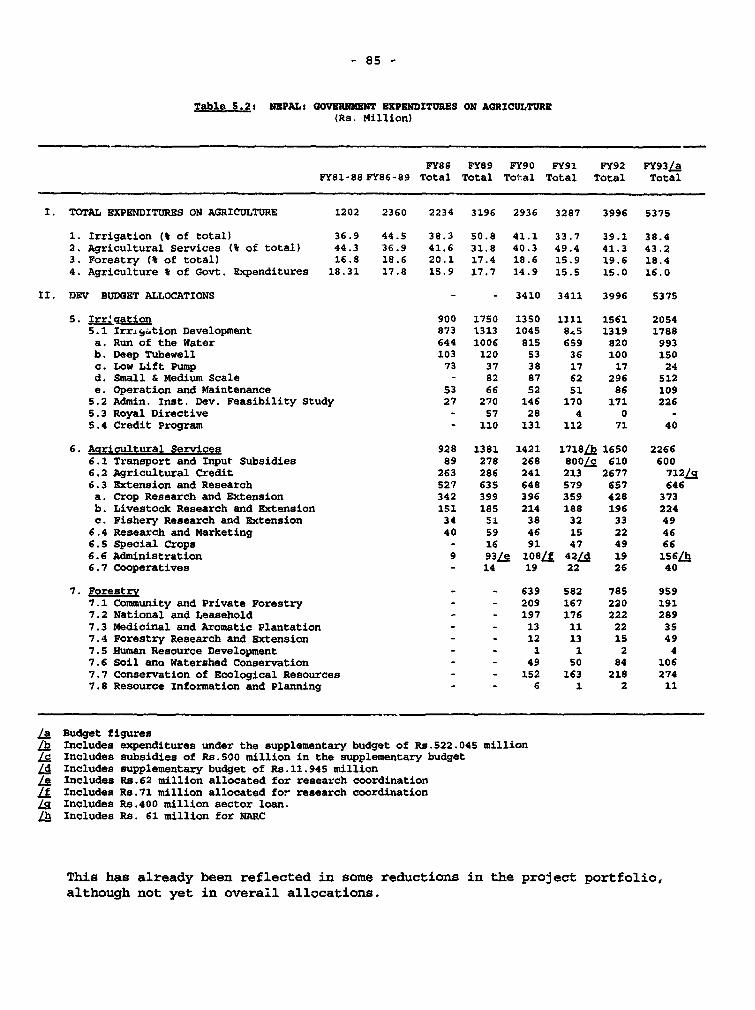
5.7 Because of its importance, agriculture has been a focus ofdevelopment efforts and expenditures, both on the part of Government and ofdonors. In the 1980s, the sector received 27 percent of developmentexpenditures, and 18 percent of total Government spending (Table 5.2).Nominal expenditures declined at the start of the nineties, due mainly tolower allocations for irrigation as projects were completed; but, totalexternal aid for agriculture has remained strong, accounting for 45-50 percentof financing. There have recently been indications, however, that some of themajor donors are concerned about the performance of projects in agriculture.
- 85 -
Table 5.2: NEPAL: GOVERUKNBT EXBPNDITUREt ON AGRICULTURE
(Rs. Million)
FY88 FY89 FY90 FY91 FY92 FY93LaFY81-88 FY86-89 Total Total Total Total Total Total
I. TOTAL EXPENDITU4RES ON AGRICULTURE 1202 2360 2234 3196 2936 3287 3996 5375
1. Irrigation (t of total) 36.9 44.5 38.3 50.8 41.1 33.7 39.1 38.4
2. Agricultural Services (t of total) 44.3 36.9 41.6 31.8 40.3 49.4 41.3 43.2
3. Forestry (% of total) 16.8 18.6 20.1 17.4 18.6 15.9 19.6 18.4
4. Agriculture & of Govt. Expenditures 18.31 17.8 15.9 17.7 14.9 15.5 15.0 16.0
II. DRV BUDGET ALLOCATIONS - - 3410 3411 3996 5375
S. Irr2aation 900 1750 1350 1311 1561 2054
5.1 Irr~.ytion Development 873 1313 1045 8.5 1319 1788
a. Run of the Water 644 1006 815 659 820 993
b. Deep Tubewell 103 120 53 36 100 150
c. Low Lift Pump 73 37 38 17 17 24
d. Small & Medium Scale - 82 87 62 296 512
e. operation and Maintenance 53 66 52 51 86 109
5.2 Admin. Inst. Dev. Feasibility Study 27 270 146 170 171 226
5.3 Royal Directive - 57 28 4 0 -
5.4 Credit Program - 110 131 112 71 40
6. Agricultural Services 928 1381 1421 1718/b 1650 2266
6.1 Transport and Input Subsidies 89 278 268 800ag 610 6006.2 Agricultural Credit 263 286 241 213 2677 712a
6.3 Extension and Research 527 635 648 579 657 646
a. Crop Research and Extension 342 399 396 359 428 373
b. Livestock Research and Extension 151 185 214 188 196 224
c. Fishery Research and Extension 34 5i 38 32 33 49
6.4 Research and Marketing 40 59 46 1S 22 46
6.5 Special Crops - 16 91 47 49 66
6.6 Administration 9 93/e 108/f 42Ld 19 1S6Lh
6.7 Cooperatives - 14 19 22 26 40
7. Forestry - - 639 582 785 959
7.1 Community and Private Forestry - - 209 167 220 191
7.2 National and Leasehold - - 197 176 222 289
7.3 Medicinal and Aromatic Plantation - - 13 11 22 35
7.4 Forestry Research and Extension - - 12 13 15 49
7.5 Human Resource Development - - 1 1 2 4
7.6 Soil ano Watershed Conservation - - 49 50 84 106
7.7 Conservation of Ecological Resources - - 152 163 218 274
7.8 Resource Information and Planning - - 6 1 2 11
/a Budget figures/b Includes expenditures under the supplementary budget of Rs.522.04S million
/c Includes subsidies of Rs.S00 million in the supplementary budget
/d Includes supplementary budget of Rs.11.945 million/e Includes Rs.62 million allocated for research coordination
/f Includes Rs.71 million allocated for research coordination
Lg Includes Rs.400 million sector loan.Lh Includes Rs. 61 million for NARC
This has already been reflected in some reductions in the project portfolio,although not yet in overall allocations.
- 86 -
b. Irriaation
5.8 Over one-third of cultivated land in Nepal is irrigated, althoughthere are differences between the Terai on the one hand (over one halfirrigated) and the Mountains and Hills on the other (less than one fifthirrigated) .361 Of the total area irrigated, no less than 71 percent isaccounted for by farmer-owned schemes, and the remaining 29 percent areDepartment of Irrigation (DOI) schemes. Farmer schemes cover about 94 percentof all irrigated area in the Mountains and Hills, but only 65 percent in theTerai. About 95 percent of DOI irrigated area is in the Terai, of which 89percent is included in surface water schemes. This reflects not only thedifference in the availability of irrigable land in the Terai and the Hills,but also the irrigation development potential of the Terai; 2.2 million ha orsome 80 percent of the country's total irrigable area is located in the Terai.
5.9 Irrigation absorbed 10-11 percent of development expenditures inthe eighties, with the bulk of these going to DOI surface and groundwaterschemes; and the planred allocation for the sector unler the EP remains muchthe same, at 10.5 percent. The performance of the irrigation sub-sector incontributing to increased output and farm incomes is mixed. First, since mostschemes are designed to augment monsoon rains for main season paddy, theyessentially provide some insurance against monsoon failure, rather thanleading to significant expansion of irrigated year-round production. Thus,while they are almost certainly highly cost-effective, many of them do notsustain high cropping intensities and high yields. Second, the performance oflarge-scale public irrigation schemes has generally been disappointing. Re-estimated ROR at project completion has most often been less than at appraisaland actual ROR even lower. Kankai irrigation project, for example, had 16percent ROR at appraisal and 5.2 percent at completion, and similarly forSunsari Morang I. Only three out of ten projects recently reviewed had RORabove 10 percent.17/ These low ROR reflect low effective use (area actuallysupplied with water) of large-scale irrigation projects. For example, 12large DOI projects reviewed by the Irrigation Master Plan!-, which togetherhad a planned net command area of about 221,000 ha, had an the average rate ofeffective use of only 57 percent even in the monsoon (Table 5.3).
L See Table 5.7
/ Master Plan for Irrigation Develooment in NeDal, February 1990, Annex Volume 3, Table D3-13.
3/ Master Plan for Irriaation Development in Nepal, February 1990, Annex Volume 2, Annex C2,Table C2-2.

- 87 -
Table 5.3s BFFBCTXVB VBO IN TWELVE LARGE ZRRaATION PROJECTS
Effective Use/aPlanned Net
rype Conumand Area Summer Winter spring
Monsoon- 113,133 0.49 0.13 0.06Irrigated
Year-Round 108,000 0.67 0.36 0.05
Total 221,133 0.57 0.23 0.05
/a "Bffective Use" is the proportion of Net Command Area that is effectively irrigated in theseason indicated.
Source: Table C2-2, Irriaation Master Plan on cit.
Even the year-round schemes achieved an effective use only of 36% and 5S inthe two dry seasons. Thus, the impact of such schemes must be anticipated tobe low. But there have been exceptions. Bhairawa-Lumbini, a large projectbased upon deep tubewells, and Mahakali Stage I, a command area developmentproject with year-round irrigation, have had some measure of success inraising production levels and farmers, incomes. Third, in response to the
problems noted above, increasing attention has been paid to developing small-
scale, farmer managed projects and to involving farmers in all stages ofproject identification, design, construction, operation and maintenance of DOI
schemes. These changes culminated in the new Irrigation Policy 1992, issuedby the Ministry of Water Resources. The preliminary indications are that the
newer style projects are most promising.
Irriaation Exnenditure Patterns
S.10 The Government's approach to irrigation in the past emphasized
large-scale projects. It has paid much less attention to smaller projects, to
managing and maintaining irrigation assets, and to providing training and
support to farmer groups. While the new Irrigation Policy of 1992 proposes to
change the Government's emphasis, the new directions are yet to be reflectedin budget or expenditure patterns, which continue to be dominated by the large
Table 5.4: SIZ8 CLASSIFICATION OF IRRIGATION EXPENITnuR(Re . I °°°)
FY91 FY92 Budget FY93
Expenditure on large projects 770,784 769,061 945,598
Total Bxpenditure 1,529,334 1,544,862 2,054,320
Share of large projects 50.4 49.8 46.0(percent)
* The six large projects are Mahakali, Bhairawa-Lumbini, Bagmati, Babai, Narayani, SunsariMorang.
Source: Table 5.6
- 88 -
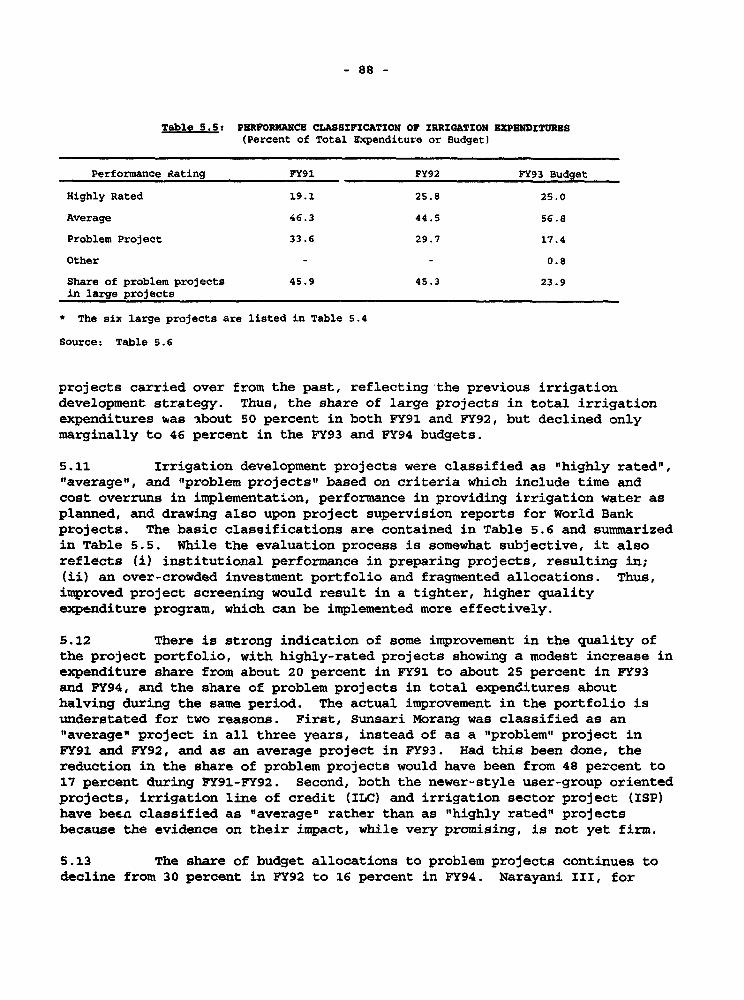
Table 5.5: PERFORMANCE CLASSIFICATION OF XRRI9ATION hXP8NDI$VRUS(Percent of Total Expenditure or Budget)
Performance Rating FY91 FY92 FY93 Budget
Highly Rated 19.1 25.8 25.0
Average 46.3 44.5 56.8
Problem Project 33.6 29.7 17.4
Other - - 0.8
Share of problem projects 45.9 45.3 23.9in large projects
* The six large projects are listed in Table 5.4
Source: Table 5.6
projects carried over from the past, reflecting the previous irrigationdevelopment strategy. Thus, the share of large projects in total irrigationexpenditures was -bout 50 percent in both FY91 and FY92, but declined onlymarginally to 46 percent in the FY93 and FY94 budgets.
5.11 Irrigation development projects were classified as "highly rated","average", and "problem projects" based on criteria which include time andcost overruns in implementation, performance in providing irrigation water asplanned, and drawing also upon project supervision reports for World Bankprojects. The basic classifications are contained in Table 5.6 and summarizedin Table 5.5. While the evaluation process is somewhat subjective, it alsoreflects ti) institutional performance in preparing projects, resulting in;(ii) an over-crowded investment portfolio and fragmented allocations. Thus,improved project screening would result in a tighter, higher qualityexpenditure program, which can be implemented more effectively.
5.12 There is strong indication of some improvement in the quality ofthe project portfolio, with highly-rated projects showing a modest increase inexpenditure share from about 20 percent in FY91 to about 25 percent in FY93and PY94, and the share of problem projects in total expenditures abouthalving during the same period. The actual improvement in the portfolio isunderstated for two reasons. First, Sunsari Morang was classified as an"average" project in all three years, instead of as a "problem" project inFY91 and FY92, and as an average project in FY93. Had this been done, thereduction in the share of problem projects would have been from 48 percent to17 percent during FY91-FY92. Second, both the newer-style user-group orientedprojects, irrigation line of credit (ILC) and irrigation sector project (ISP)have been classified as "average" rather than as "highly rated" projectsbecause the evidence on their impact, while very promising, is not yet firm.
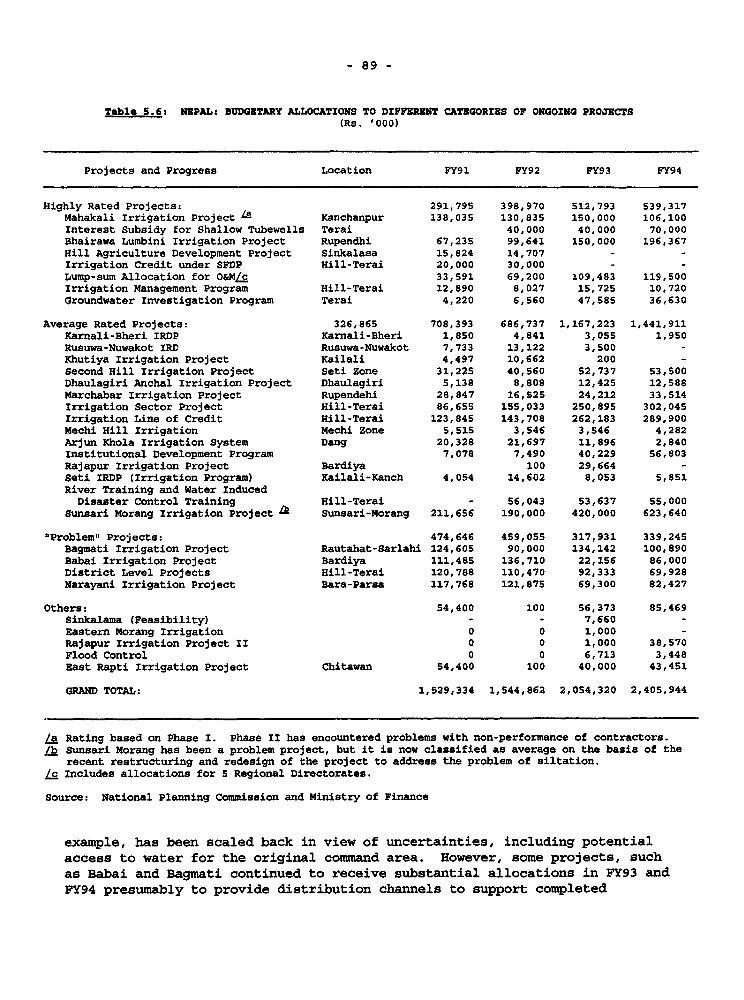
5.13 The share of budget allocations to problem projects continues todecline from 30 percent in FY92 to 16 percent in FY94. Narayani III, for
- 89 -
Table 5.6: NEPALs BUDGETARY ALLOCATIONS TO DIFFERENT CATEGORIES OF ONGOrNG PROJECTS(Rs. '000)
Projects and Progress Location FY91 FY92 FY93 FY94
Highly Rated Projects: 291,795 398,970 512,793 539,317Mahakali Irrigation Project l Kanchanpur 138,035 130,835 150,000 106,100Interest Subsidy for Shallow Tubewells Terai 40,000 40,000 70,000Bhairawa Lumbini Irrigation Project Rupendhi 67,235 99,641 150,000 196,367Hill Agriculture Development Project Sinkalasa 15,824 14,707 - -Irrigation Credit under SFDP Hill-Terai 20,000 30,000 - -
Lump-sum Allocation for O&MLc 33,591 69,200 109,483 119,500Irrigation Management Program Hill-Terai 12,890 8,027 15,725 10,720Groundwater Investigation Program Terai 4,220 6,560 47,585 36,630
Average Rated Projects: 326,865 708,393 686,737 1,167,223 1,441,911Karnali-Bheri IRDP Karnali-Bheri 1,850 4,841 3,055 1,950Rusuwa-Nuwakot IRD Rusuwa-Nuwakot 7,733 13,122 3,500 -Khutiya Irrigation Project Kailali 4,497 10,662 200 -
Second Hill Irrigation Project Seti Zone 31,225 40,560 52,737 53,500Dhaulagiri Anchal Irrigation Project Dhaulagiri 5,138 8,808 12,425 12,588Marchabar Irrigation Project Rupendehi 28,847 16,525 24,212 33,514Irrigation Sector Project Hill-Terai 86,655 155,033 250,895 302,045Irrigation Line of Credit Hill-Terai 123,845 143,708 262,183 289,900Mechi Hill Irrigation Mechi zone S,515 3,546 3,546 4,282Arjun Khola Irrigation System Dang 20,328 21,697 11,896 2,840Institutional Development Program 7,078 7,490 40,229 56,803Rajapur Irrigation Project Bardiya 100 29,664 -Seti IRDP (Irrigation Program) Kailali-Kanch 4,054 14,602 8,053 5,851River Training and Water InducedDisaster Control Training Hill-Terai - 56,043 53,637 55,000
Sunsari Morang Irrigation Project Z Sunsari-Morang 211,656 190,000 420,000 623,640
"Problem" Projects: 474,646 459,055 317,931 339,245Bagmati Irrigation Project Rautahat-Sarlahi 124,605 90,000 134,142 100,890Babai Irrigation Project Bardiya 111,485 136,710 22,156 86,000District Level Projects Hill-Terai 120,788 110,470 92,333 69,928Narayani Irrigation Project Bara-Parsa 117,768 121,875 69,300 82,427
Others: 54,400 100 56,373 85,469Sinkalama (Feasibility) - - 7,660 -Eastern Morang Irrigation 0 0 1,000 -
Rajapur Irrigation Project II 0 0 1,000 38,570Flood Control 0 0 6,713 3,448East Rapti Irrigation Project Chitawan 54,400 100 40,000 43,451
GRAND TOTAL: 1,529,334 1,544,862 2,054,320 2,405,944
/a Rating based on Phase I. Phase II has encountered problems with non-performance of contractors.lb Sunsari Morang has been a problem project, but it is now classified as average on the basis of the
recent restructuring and redesign of the project to address the problem of siltation./c Includes allocations for S Regional Directorates.
Source: National Planning Commission and Ministry of Finance
example, has been scaled back in view of uncertainties, including potentialaccess to water for the original command area. However, some projects, suchas Babai and Bagmati continued to receive substantial allocations in FY93 andFY94 presumably to provide distribution channels to support completed
- 90 -
headwork. Allocations for District level projects declined oteadily sinceFY91; these district have projects sufferred from fragmentation of financingamong too many sub-projects. In F':92, for example, over 75 percent of schemeswere allocated less than Rs.500,000, which was too small to support meaningfulconstruction. There is little documentation of their economic viability, andsome of the allocations represent routine administrative expenses which shouldbe classified appropriately as regular expenditures. The Government and somedonors have reviewed and scaled back selected irrigation projects. 3 9 /However, there is still some scope for shifts in resources away from lowquality projects. For example, the number of district level projects, exceptthose already close to completion, could be cut back; even redesigned projectssuch as Narayani should continue to be monitored for possible cancellation ifappropriate, and pending action should be taken on other projects consideredproblematic. Also, experience would warrant restrictions on new large-scalestate-managed project starts.
Institutional Development and Maintenance
5.14 Policy statements and sector studies have called for a shift inthe approach to irrigation development.-0/ Tl shift would: (i) emphasizesmall- and medium-scale farmer managed rather than large-scale schemes;(ii) change Government focus from physical investment expansion to irrigationmanagement; (iii) support private sector participation in irrigation schemes,including turnover of suitable publicly managed schemes to the private sector;and (iv) build institutional support for irrigation management and stressmaintenance of projects. There is awareness that the new priorities requiretransforming the role of Government agencies, and efforts to provide suchinstitutional reform are being made. The Irrigation Management ProjeoLstarted in 1985, for example, is concerned with supporting farmerorganizations and providing them with management training and improvingjresource mobilization, including cost recovery. The Irrigation Ma'iAgement and.ater Utilization Division of the Department of Irrigat.i.n was established inOctober 1991 (as a successor to the Ministry of Agriculture's FarmerIrrigation and Water Utilization Division), and this institutionalized theIrrigation Management Project. Initially, two agencies, namely, the SystemManagement Division (SMD) and Irrigation Management Center (IMC) wereestablished; but the fact that they were created outside the regulargovernment structure limited their acceptance as part of the normalorganizational set-up of the DOI. The merging of SMD and IMC and the officialestablishment of the Irrigation Management and Water Utilization Divisionwithin DOI provides it with the capacity and the opportunity to takeinitiative on the main issues, such as expenditure reforms, user fees,
-/This saved an estimated US$50 million, comprising US$8 million from Second Hill Project,US$21 million from East Rapti, and US$21 million from Irrigation Sector Loan.
40/ See, for example, "The Irrigation Management Project"; USAID, 1991. "Topics Paper on O0MStatus of Selected Large Scale Irrigation Projects", HMG, 1991. "Action Plan for ParticipatoryManagement Program", HMG, 1989. "Irrigation Directive", HMG, 1989. "The Role of ProgramBudgeting in the Development of the FY89 Irrigation Budget", HMG, 1988. "Irrigation Policy",1992, HMG, Ministry of Water Resources.

- 91 -
financing and monitoring of O&M activities, training farmers and expandingfarmer-managed schemes.
5.15 Given that Government currently has direct responsibility foroperating and maintaining large schemes covering over 250,000 hectares ofirrigation system, a strategy and program to support priority O&M needs to beadopted. Financing support for O&M activities increased in nominal terms asshown in Table 5.7; but the share of allocations for system utilization andmaintenance has been about 11.2 percent during FY88-92. Expenditures onroutine maintenance were 5.7 percent of recurrent expenditures during the sameperiod. Thus the financing of needed spare parts and materials has suffered,as personnel costs alone accounted for 48 percent of the O&M cost per ha inFY91 compared to 23 percent in FY89.4/ During the period FY88-FY92,budgetary allocations for system utilization averaged Rs. 126 per ha, under 25percent of estimated optimal requirements of Rs. 520 per ha. Moreover, theweak expenditure reporting system undermines the ability to monitor and ensurethat budgeted funds are utilized as envisaged.
Table 5.7: NEPAL: BUDGET ALLOCATIONS FOR IRRIGATION(Rs. Million)
FY88 FY89 FY90 FY91 FY92 FY93/a
Budgetary Allocations
1. Recurrent Budget Allocation 109 279 339 337 379(a) Administration 96 199 274 338 301 -
of which: Salary & Allowances 58 75 81 97 126 -(b) System Utilization & Maintenance 16 21 18 34 69 -
of which: Repair & Maintenance 11 13 11 8 31 -(c) Other Recurrent Budget 7 66 58 39 79 -
1(i) System Utilization & Maintenance (%) 1.8 1.2 1.3 2.1 4.4 -1(ii) Repair & Maintenance (%) 1.2 0.7 0.8 0.5 2.0
2. Capital Budget Allocation 790 1471 1025 1210 1192(a) Rehabilitation & Construction 730 1389 956 1185 1133(b) Purchase of Land Building 41 55 41 15 31(c) Equipment & Vehicles 19 27 28 10 28 -
3. Total Budget Allocation 899 1756 1364 1587 1571 2054
/a Budget
Source: Compiled from MOD data
-/ Based on a simple survey conducted by DOI on selected irrigation systems in the KathmanduValley.
- 92 -
c. Irriaation Credit and Subsidies
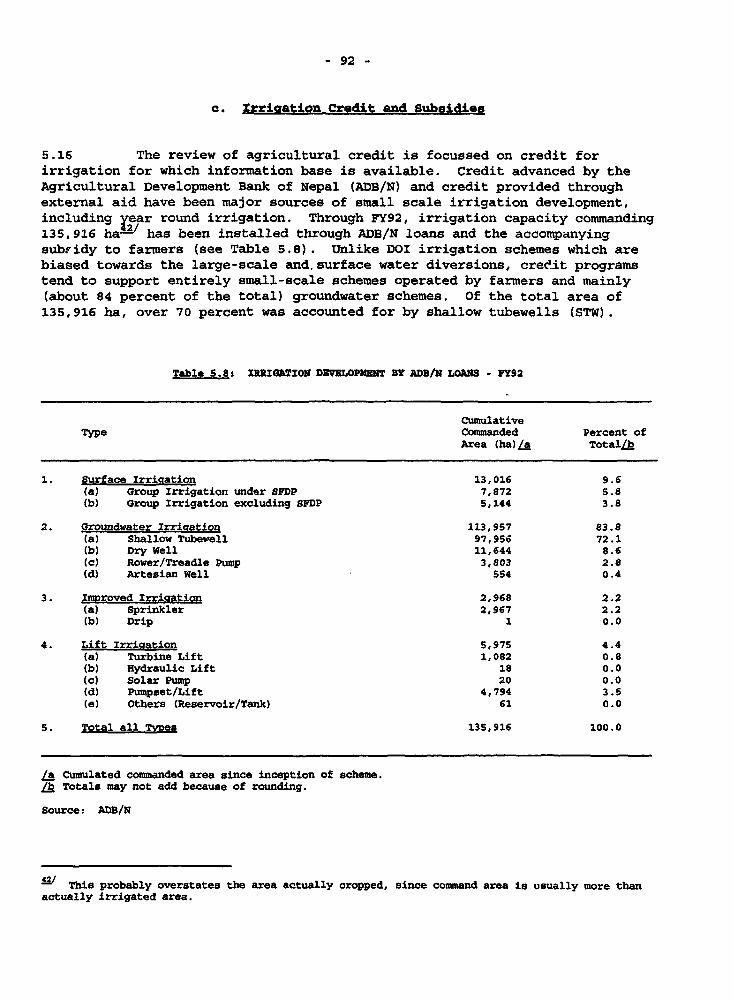
5.16 The review of agricultural credit is focussed on credit forirrigation for which information base is available. Credit advanced by theAgricultural Development Bank of Nepal (ADB/N) and credit provided throughexternal aid have been major sources of small scale irrigation development,including vear round irrigation. Through FY92, irrigation capacity commanding135,916 ha 2/ has been installed through ADB/N loans and the accompanyingsubridy to farmers (see Table 5.8). Unlike DOI irrigation schemes which arebiased towards the large-scale and,surface water diversions, creeit programstend to support entirely small-scale schemes operated by farmers and mainly(about 84 percent of the total) groundwater schemes. Of the total area of135,916 ha, over 70 percent was accounted for by shallow tubewells (STW).
Table 5.8s :RRIGATION DIVULOPUHET BY ADB/N LOANS - PY92
CumulativeType Commanded Percent of
Area (ha)la Total/b
1. Surface Irrication 13,016 9.6(a) Group Irrigation under SFDP 7,872 5.8(b) Group Irrigation excluding SFDP 5,144 3.8
2. Groundwater Irrication 113,957 83.8(a) Shallow Tubevell 97,956 72.1(b) Dry Well 11,644 8.6(c) Rower/Treadle Pump 3,803 2.8(d) Artesian Well 554 0.4
3. Imroved Irrigation 2,968 2.2(a) Sprinkler 2,967 2.2(b) Drip 1 0.0
4. Lift Irrigation 5,975 4.4(a) Turbine Lift 1,082 0.8(b) Hydraulic Lift 18 0.0(c) Solar Pump 20 0.0(d) Pumpset/Lift 4,794 3.5(e) Others (Reservoir/Tank) 61 0.0
5. Total all Tvyes 135,916 100.0
/a Cumulated commanded area since inception of scheme.lb Totals may not add because of rounding.
Source: ADB/N
iv This probably overstates the area actually cropped, since command area is usually more thanactually irrigated area.

- 93 -
Table 5.9s RATE OF RETURN TO ADB/N IRRIGATZON SCREU38jA(Percent)
Hill Terai Overall
Surface 26.q 67.6 47.2
STW - 40.6 40.6
La The IRR reported in the Table are the financial rates of returnwhich are lower than the economic rates of return calculated byIIMI (see Footnote 10). These IRR assume the opportunity costof farmer labor contributed to the construction of the surfaceschemes is half the minimum wage rate, and the investment costsare not reduced by the amount of the Government subsidy.
Source: Tables 5.6 and 5.9 in IIMI, Proces' and PerformanceEvaluation of ADB/N Sunnorted Irrigation Schemes, op cit
5.17 Evaluations conducted recently by The Internatiornal IrrigationManagement Institute (IIMI) on the economic performance of the irrigation sub-projects financed by ADB/N,43/ particularly the farmer-managed small surfaceirrigation schemes and the STW loans to farmers, indicate that the rates ofreturn (even without the government subsidies) are high, being about (i) 48percent for STW in the Terai; and (ii) 27 percent and 68 percent for surfaceschemes in the Hills and Terai respectively (see Table 5.9). Theseinvestments are profitable without subsidies. However, for surface schemes,the government provides over 70 percent of total construction costs, and 40percent (increased to 50 percent recently for a few months due to droughtconditions in FY93) for private STW.>1/ The subsidy rate is 8b percent forcommunity STW and 90 percent for new deep tubewells as well as for surface andgroundwater schemes constructed by government and turned over to water users'groups.
~/ The evaluation is more concerned with the sub-projects Per se, rather than with the lendingactivities of the ADB/N or of the SPDP. That is, it focuses mainly on the investment process,its impact upon agricultural output, and its economic and financial rates of return. Evaluatingthe lending activities, which would focus upon lending costs, loan servicing and other financialcriteria of a credit activity, was only partially undertaken. See Process and PerformanceEvaluation of ADB/N SuDvorted Irrication Schemes, Intarnational Irrigation Management Institute,Kathmandu, Nepal, 1991. It might be noted that, in calculating economic rates of return,international prices of commodities (which were about 1.7 times the financial prices) wereemployed. It can be argued that, because of the porous border with India, financial prices (whichreflect prices in India) are the appropriate border prices (in the sense of measuring opportunitycosts) for an economic evaluation in Nepal. For this reason, the financial rates of return(after netting out subsidies) which are also provided in the evaluation study are probably thebest indication of social or economic rates of return.
L/ These different subsidy rates on construction costs are intended to reflect to some extentthe very different operations and maintenance costs relative to construction costs of differentforms of irrigation. However, it is not clear that the actual subsidy formula employed is suchas effectively to equalize costs or shares or costs paid by farmers and government over differenttypes of irrigation. More generally, it is not clear that an appropriate formula should seek toequalize costs: there is a case for more expensive forms of irrigation, and for poorbeneficiaries paying less than richer.
- 94 -
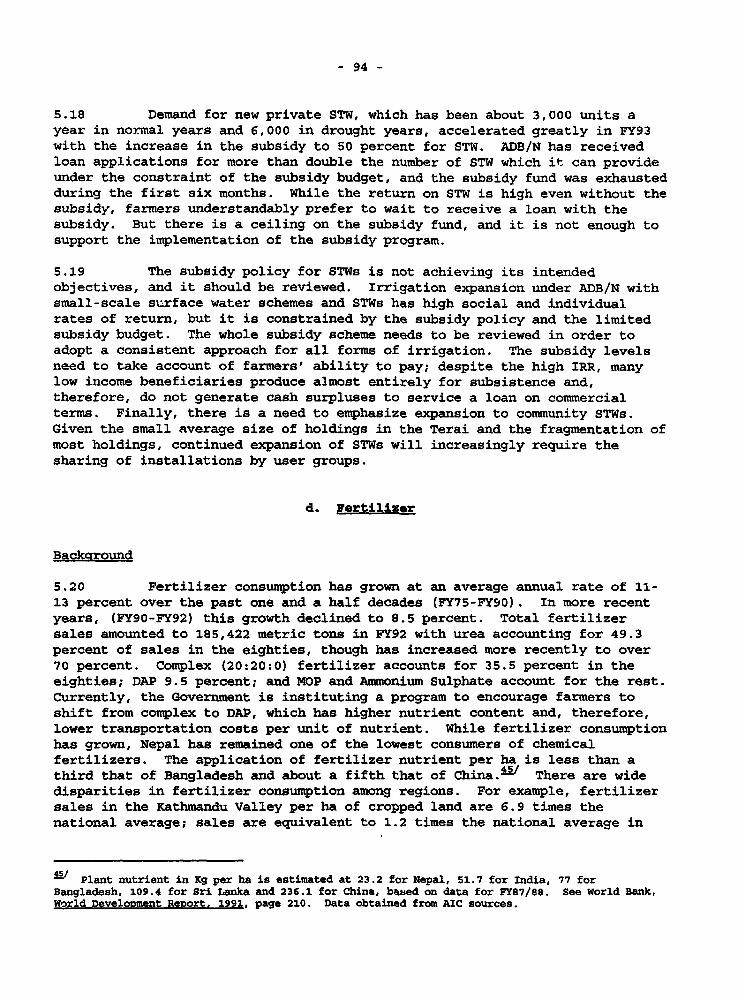
5.18 Demand for new private STW, which has been about 3,000 units ayear in normal years and 6,000 in drought years, accelerated greatly in FY93with the increase in the subsidy to 50 percent for STW. ADB/N has receivedloan applications for more than double the number of STW which it can provideunder the constraint of the subsidy budget, and the subsidy fund was exhaustedduring the first six months. While the return on STW is high even without thesubsidy, farmers understandably prefer to wait to receive a loan with thesubsidy. But there is a ceiling on the subsidy fund, and it is not enough tosupport the implementation of the subsidy program.
5.19 The subsidy policy for STWs is not achieving its intendedobjectives, and it should be reviewed. Irrigation expansion under ADB/N withsmall-scale surface water schemes and STWs has high social and individualrates of return, but it is constrained by the subsidy policy and the limitedsubsidy budget. The whole subsidy scheme needs to be reviewed in order toadopt a consistent approach for all forms of irrigation. The subsidy levelsneed to take account of farmers' ability to pay; despite the high IRR, manylow income beneficiaries produce almost entirely for subsistence and,therefore, do not generate cash surpluses to service a loan on commercialterms. Finally, there is a need to emphasize expansion to community STWs.Given the small average size of holdings in the Terai and the fragmentation ofmost holdings, continued expansion of STWs will increasingly require thesharing of installations by user groups.
d. Fertilizer
Backaround
5.20 Fertilizer consumption has grown at an average annual rate of 11-13 percent over the past one and a half decades (FY75-FY90). In more recentyears, (FY90-FY92) this growth declined to 8.5 percent. Total fertilizersales amounted to 18S,422 metric tons in FY92 with urea accounting for 49.3percent of sales in the eighties, though has increased more recently to over70 percent. Complex (20:20:0) fertilizer accounts for 35.5 percent in theeighties; DAP 9.5 percent; and MOP and Ammonium Sulphate account for the rest.Currently, the Government is instituting a program to encourage farmers toshift from complex to DAP, which has higher nutrient content and, therefore,lower transportation costs per unit of nutrient. While fertilizer consumptionhas grown, Nepal has remained one of the lowest consumers of chemicalfertilizers. The application of fertilizer nutrient per ha is less than athird that of Bangladesh and about a fifth that of China.!J There are widedisparities in fertilizer consumption among regions. For example, fertilizersales in the Kathmandu Valley per ha of cropped land are 6.9 times thenational average; sales are equivalent to 1.2 times the national average in
-5/ Plant nutrient in Kg per ha is estimated at 23.2 for Nepal, 51.7 for India, 77 forBangladesh, 109.4 for Sri Lanka and 236.1 for China, batsed on data for FY87/88. See World Bank,World Development Renort. 199i, page 210. Data obtained from AIC sources.
- 95 -
the Terai, and half the national average in the Hills. 46t Fertilizerdistribution has been marked by shortages during the planting season in allparts of the country.
Fertilizer Issues
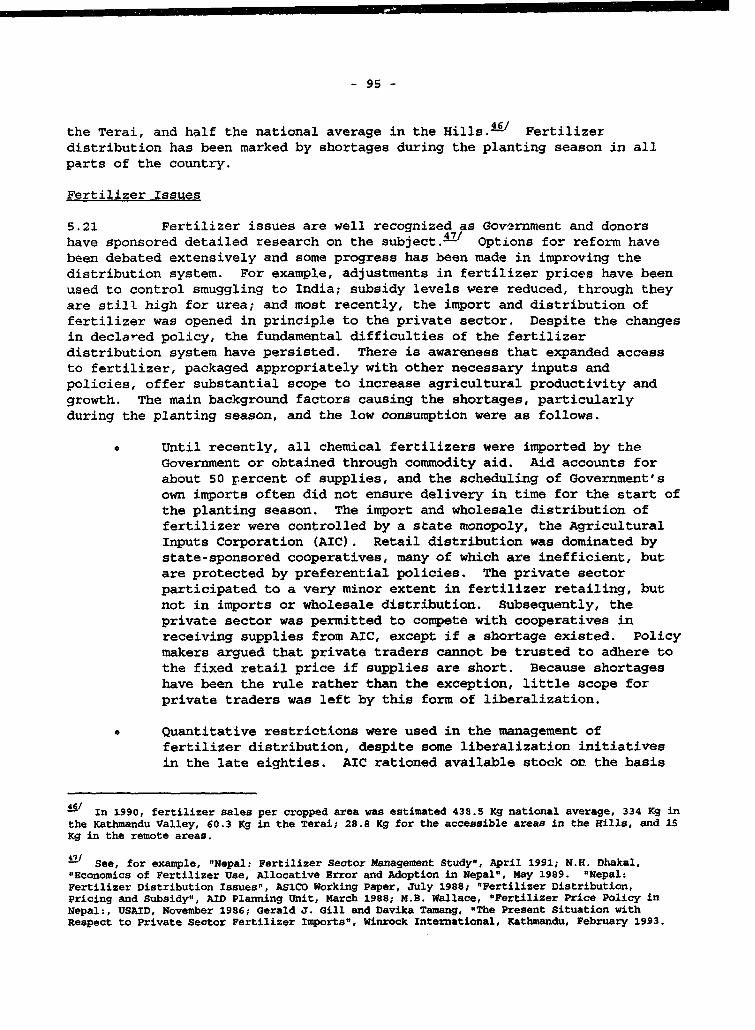
5.21 Fertilizer issues are well recognized as Government and donorshave sponsored detailed research on the subject. 47/ Options for reform havebeen debated extensively and some progress has been made in improving thedistribution system. For example, adjustments in fertilizer prices have beenused to control smuggling to India; subsidy levels were reduced, through theyare still high for urea; and most recently, the import and distribution offertilizer was opened in principle to the private sector. Despite the changesin declared policy, the fundamental difficulties of the fertilizerdistribution system have persisted. There is awareness that expanded accessto fertilizer, packaged appropriately with other necessary inputs andpolicies, offer substantial scope to increase agricultural productivity andgrowth. The main background factors causing the shortages, particularlyduring the planting season, and the low consumption were as follows.
e Until recently, all chemical fertilizers were imported by theGovernment or obtained through commodity aid. Aid accounts forabout 50 percent of supplies, and the scheduling of Government'sown imports often did not ensure delivery in time for the start ofthe planting season. The import and wholesale distribution offertilizer were controlled by a state monopoly, the AgriculturalInputs Corporation (AIC). Retail distribution was dominated bystate-sponsored cooperatives, many of which are inefficient, butare protected by preferential policies. The private sectorparticipated to a very minor extent in fertilizer retailing, butnot in imports or wholesale distribution. Subsequently, theprivate sector was permitted to compete with cooperatives inreceiving supplies from AIC, except if a shortage existed. Policymakers argued that private traders cannot be trusted to adhere tothe fixed retail price if supplies are short. Because shortageshave been the rule rather than the exception, little scope forprivate traders was left by this form of liberalization.
* Quantitative restrictions were used in the management offertilizer distribution, despite some liberalization initiativesin the late eighties. AIC rationed available stock on the basis
In 1990, fertilizer sales per cropped area was estimated 438.5 Kg national average, 334 Kg inthe Kathmandu Valley, 60.3 Kg in the Terai; 28.8 Kg for the accessible areas in the Hills, and 15Kg in the remote areas.
-ii See, for example, "Nepal: Fertilizer Sector Management Studyu, April 1991; N.H. Dhakal,"Economics of Fertilizer Use, Allocative Error and Adoption in Nepal", May 1989. "Nepal:Fertilizer Distribution Issues", ASICO Working Paper, July 1988; "Fertilizer Distribution,Pricing and Subsidy", AID Planning Unit, March 1988; M.S. Wallace, "Fertilizer Price Policy inNepal:, USAID, November 1986; Gerald J. Gill and Davika Tamang, "The Present Situation withRespect to Private Sector Fertilizer Imports", Winrock International, Kathmandu, February 1993.
- 96 -
of targets and requests from zonal officials, and dealers wererestricted to distributing in designated zones.
Fertilizer prices were controlled and the administered pricescarried large subsidies, though existing studies suggest thataccess to fertilizer has to do less with price increases and morewith inadequate supply delivery on a timely basis. In FY91, forexample, the administered prices in Nepal were close to thecorzesponding Indian border prices; but because Indian prices weresubsidized below world market prices, Nepal's prices were alsosubsidized and were equivalent to 42 percent of actual costs forurea and 53 percent for complex, which together accounted for over80 percent of fertilizer sales. The direct subsidies allocated inthe Government budget for AIC to finance fertilizer purchases,excluding financial sector credit and unpaid bills, were Rs.733million in FY91, and Rs.610 million in FY92, equivalent to 37percent of the total development expenditure allocations foragricultural services; it declined to Rs.600 million in FY93.Under the pricing and subsidy policy which existed untilrecently,L- budgetary difficulties and limited Governmentcapacity to support the financing of the subsidy were majorconstraints on AIC's imports and on fertilizer supply. This ledto the paradoxical situation that the subsidies, which wereintended to increase fertilizer consumption by encouraging demand,actually acted as a brake on consumption by restricting supply.
Nepal's policies regarding fertilizer pricing are circumscribed toa large extent by policies in India, both at the central and stategovernment level. Under the policy which has been in effect fromthe late eighties, Nepal's fertilizer prices were to be adjustedto equal the corresponding prices at the border with India.However, because India's fertilizer is subsidized below worldprices, Nepal's existing policy of Indian border price paritystill involves substantial subsidies.
Recent Reforms and Future Action
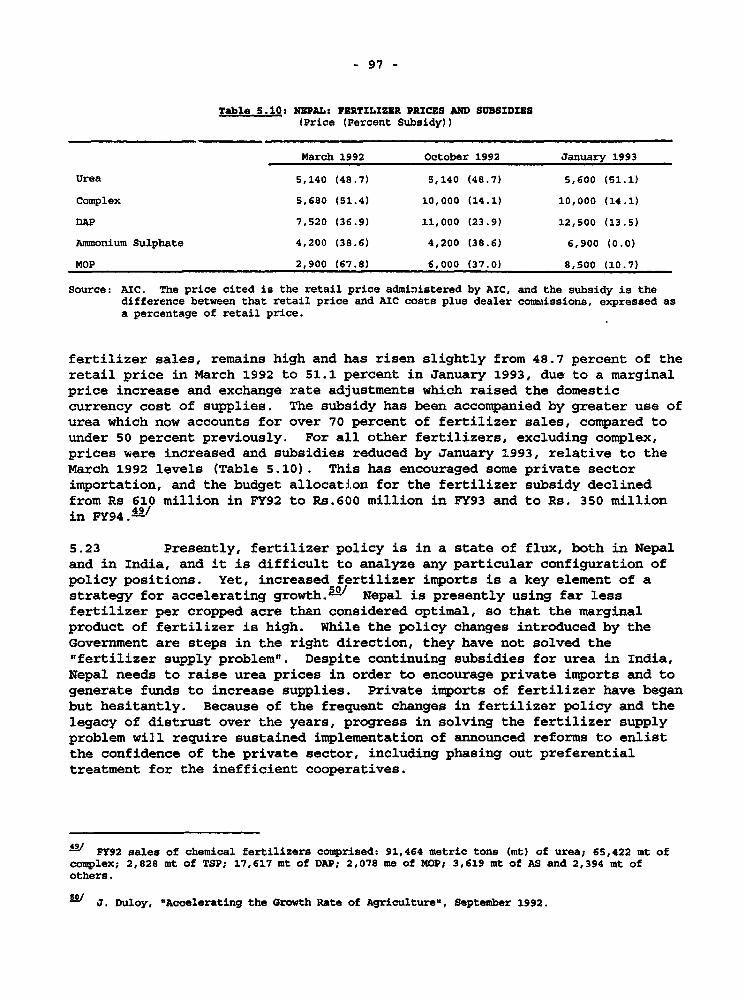
5.22 Government took some steps to liberalize Nepal's fertilizer marketin October 1992. Under these reforms: (i) the import of fertilizers would beon open general license; (ii) price controls would be abolished for allfertilizers, except urea and ammonium sulphate (which together account for 50percent of total sales); (iii) foreign exchange would be provided to theprivate sector at the official rate (equivalent to an implicit subsidy of 15percent relative to the free market exchange rate) for the import offertilizers; and (iv) the Government would phase out the remaining subsidiesgradually. As shown in Table 5.10 below, the reforms generally resulted inhigher prices and lower subsidies. The subsidy on urea, over 40 percent of
IV It is not yet clear whether or not recent policy changes will materially affect the situationdescribed in the text.
- 97 -
Table 5.10: NEPAL: FERTILIZER PRICES AND SUBSIDIES(Price (Percent Subsidy))
March 1992 October 1992 January 1993
Urea 5,140 (48.7) 5,140 (48.7) 5,600 (51.1)
Complex 5,680 (51.4) 10,000 (14.1) 10,000 (14.1)
DAP 7,520 (36.9) 11,000 (23.9) 12,500 (13.5)
Ammonium Sulphate 4,200 (38.6) 4,200 (38.6) 6,900 (0.0)
MOP 2,900 (67.8) 6,000 (37.0) 8,500 (10.7)
Source: AIC. The price cited is the retail price administered by AIC, and the subsidy is thedifference between that retail price and AIC costs plus dealer commissions, expressed asa percentage of retail price.
fertilizer sales, remains high and has risen slightly from 48.7 percent of theretail price in March 1992 to 51.1 percent in January 1993, due to a marginalprice increase and exchange rate adjustments which raised the domesticcurrency cost of supplies. The subsidy has been accompanied by greater use ofurea which now accounts for over 70 percent of fertilizer sales, compared tounder 50 percent previously. For all other fertilizers, excluding complex,prices were increased and subsidies reduced by January 1993, relative to theMarch 1992 levels (Table 5.10). This has encouraged some private sectorimportation, and the budget allocation for the fertilizer subsidy declinedfrom Rs 610 million in FY92 to Rs.600 million in FY93 and to Rs. 350 millionin FY94.9-/
5.23 Presently, fertilizer policy is in a state of flux, both in Nepaland in India, and it is difficult to analyze any particular configuration ofpolicy positions. Yet, increased fertilizer imports is a key element of astrategy for accelerating growth.'/ Nepal is presently using far lessfertilizer per cropped acre than considered optimal, so that the marginalproduct of fertilizer is high. While the policy changes introduced by theGovernment are steps in the right direction, they have not solved the"fertilizer supply problem". Despite continuing subsidies for urea in India,Nepal needs to raise urea prices in order to encourage private imports and togenerate funds to increase supplies. Private imports of fertilizer have beganbut hesitantly. Because of the frequent changes in fertilizer policy and thelegacy of distrust over the years, progress in solving the fertilizer supplyproblem will require sustained implementation of announced reforms to enlistthe confidence of the private sector, including phasing out preferentialtreatment for the inefficient cooperatives.
if/ FY92 sales of chemical fertilizers comprised: 91,464 metric tons (mt) of urea; 65,422 mt ofcomplex; 2,828 mt of TSP; 17,617 mt of DAP; 2,078 me of MOP; 3,619 mt of AS and 2,394 mt ofothers.
/ J. Duloy, "Accelerating the Growth Rate of Agriculture", September 1992.
- 98 -
e. Research and Extension
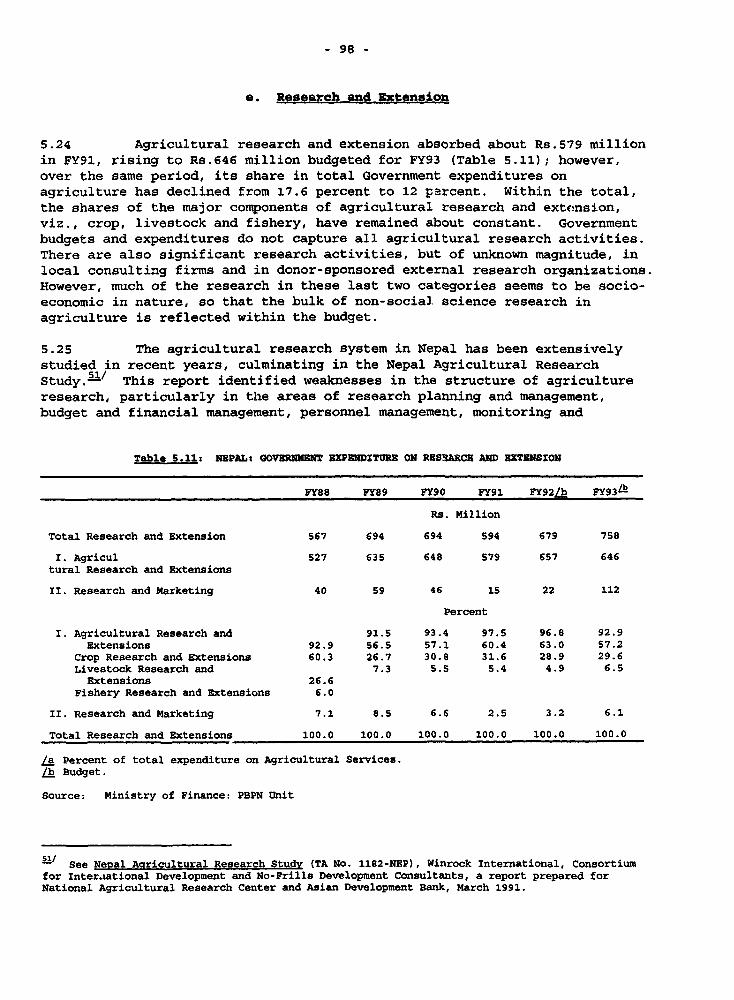
5.24 Agricultural research and extension absorbed about Rs.579 millionin FY91, rising to Rs.646 million budgeted for FY93 (Table 5.11); however,over the same period, its share in total Government expenditures onagriculture has declined from 17.6 percent to 12 parcent. Within the total,the shares of the major components of agricultural research and extcnsion,viz., crop, livestock and fishery, have remained about constant. Governmentbudgets and expenditures do not capture all agricultural research activities.There are also significant research activities, but of unknown magnitude, inlocal consulting firms and in donor-sponsored external research organizations.However, much of the research in these last two categories seems to be socio-economic in nature, so that the bulk of non-social science research inagriculture is reflected within the budget.
5.25 The agricultural research system in Nepal has been extensivelystudied in recent years, culminating in the Nepal Agricultural ResearchStudy. 51 This report identified weaknesses in the structure of agricultureresearch, particularly in the areas of research planning and management,budget and financial management, personnel management, monitoring and
Table S.11: NEPAL: GOVERMNT EXENDITR ON RESa8CR AND XTESNSION
FY88 FY89 PY90 FY91 FY92/b FY93b
Rs. Million
Total Research and Extension 567 694 694 594 679 758
I. Agricul 527 635 648 579 657 646tural Research and Extensions
II. Research and Marketing 40 59 46 15 22 112
Percent
I. Agricultural Research and 91.5 93.4 97.5 96.8 92.9Extensions 92.9 56.5 57.1 60.4 63.0 57.2
Crop Research and Extensions 60.3 26.7 30.8 31.6 28.9 29.6Livestock Research and 7.3 5.S 5.4 4.9 6.5
Extensions 26.6Fishery Research and Extensions 6.0
II. Research and Marketing 7.1 8.5 6.6 2.5 3.2 6.1
Total Research and Extensions 100.0 100.0 100.0 100.0 100.0 100.0
/a Percent of total expenditure on Agricultural Services./b Budget.
Source: Ministry of Finance: PBPN Unit
-1/ See Nepal Agricultural Research Studv (TA No. 1182-NEP), Winrock International, Consortiumfor Inter.iational Development and No-Frills Development Consultants, a report prepared forNational Agricultural Research Center and Asian Development Bank, March 1991.
- 99 -
evaluation, and research outreach programs. The Government has accepted inprinciple the main recommendations of this report. The main thrusts of reformare to: (i) reconstitute the Nepal Agricultural Research Council (NARC) intoan autonomous organization with authorit-y to strengthen agricultural researchactivities; (ii) decentralize research programs to give more responsibilitiesto the divisions; (iii) provide regional and district research centers morescope to set research priorities in response to farmers' needs;(iv) strengthen NARC's capacity to evaluate, monitor and coordinate programs;(v) identify opportunities for the growth of private agro-enterprises anddevelop research programs to support them; and (vi) restructure and unifyextension services to complement reforms in agricultural research.L' TheGovernment has taken steps to implement proposed measures to enhance themanagerial autonomy of NARC. NARC needs to take full advantage of increasedautonomy to develop effective and well-justified research programs, and toreallocate its resources to achieve the objectives. This leadership isnecessary to warrant increased resources to agricultural research.
5.26 In the extension area, Government is taking steps to streamlinevarious activities and improve their performance. For example, extensionservices have now been reconstituted under a new department, and close to 30activities were consolidated in the FY94 budget in order to reduce duplicationand waste. Also, the share of allocation to fully Government funded programs,which have less supervision was reduced from 17 percent of the FY93 budget to14 percent in FY94. However, more expenditure management issues remain to beaddressed in order to enhance the performance of resources channelled toextension. First, state farms engaged in production and distributionactivities, such as in fisheries, seedlings and nurseries, which are alreadybeing undertaken by the private sector, need to be phased out in order to putmore resources into research and extension. In this regard, recent Governmentaction to lease out six state farms to the private sector is in the rightdirection. In addition, a privatization cell has been established in theMinistry of Agriculture to assess and imple;nent options for leasing out anddivesting state farms. In this connection steps could be taken to expand therole of the private sector in delivering suitable extension services, such asveterinary services. Second, many ac;.;vities are funded every year withouttermination. Some of them, including regional agricultural directorate,training centers and horticultural farms appear to be recurrent in nature.While these activities have been recently consolidated, it would makeallocations transparent, if they are appropriately classified under the"regular" budget. Third, more financing needs to be provided to supportoutreach programs for farmers. Facilities requiring more financing includeTA/DA and transportation. The need for new infrastructure for offices andstations requires to be reviewed in order to release resources to financethese support services for outreach programs.
The Government has recently announced an intention to pilot-test other approaches toextension, particularly through the private sector. See Garesh B. Thapa and Tek B. Thapa, oncit.
- 100 -
f. Liveotock
5.27 Officially, livestock account for almost 30 percent ofagricultural sector GDP, 15 percent of total GDP, and is dominated by milk andmilk products (54 percent) and meat (26 percent). Exports of live animals,hides and skin accounted for over 10 percent of merchandise exports.Agricultural activity, especially in the Hills, is linked closely withlivestock which are important for transport, producing manure to maintain thefertility of the land, meat, dairy and clothing. The most high valuedlivestock are cattle (over 6 million), buffalo (over 3 million), goat (over 5million) and sheep (under 1 million). Officially, average growth of livestockvalue added was estimated at 4-5 percent during FY81-FY90, originating mainlyfr.... poultry and eggs. The growth of the total animal population has remainedunchanged or declined since the mid-eighties at -0.2 percent for cattle, 1.1percent for buffalo and 1.7-2.5 percent for goats and sheep. Diminishingfodder supply and malnourishment are the main causes of low growth. Openaccess to communal land has contributed to over-grazing, and small farm sizeslimit the scope for allocating more individual holding for livestockexpansion. 53
Expenditure Priorities
5.28 Concerns about land degradation and the limited scope forproviding more land for livestock expansion have renewed debate on asustainable livestock development strategy and the role of Governmentexpenditure programs in that regard. Current thinking in Nepal stresseslimiting increases in the livestock population, while promoting increases inlivestock productivity through research and reforms.-/ Reform policiescall for consolidating major livestock research work under the NARC,restructuring the Dairy Development Corporation (DDC) to improve itsperformance and promoting private sector expenditures on livestock activitiesthrough deregulation. Measures to promote livestock development are toemphasize (i) preventive health, focusing on animal nutrition and foddersupply; (ii) breeding and curative health care; and (iii) livestockmanagement.
5.29 The share of livestock from the agricultural research budget hasremained more or less at 30 percent since FY90, but it declined in real terms(based on GDP deflator) at an average rate of 8 percent during FY90-93.W'Less than 5 percent of the livestock research and extension budget wasallocated to pasture development in only ten districts in recent years,
_/ Typical farm size is 2-3 ha in the Terai and 0.5 ha in the Hills, an estimated 40% of Hillfarms are o.s ha.
-/ Current policies are discussed in detail in Master Plan for Livestock Development 1992; DairyDevelopment Master Plan, 1991; Livestock Research Under NARC, in Nepal Agricultural Researchstudy, 1991.
Sf/ FY93 deflator is based on expected inflation of 10%.
- 101 -
despite the importance attached to fodder development. Livestock wouldreceive the equivalence of 13 percent of allocations for agricultural servicesunder the EP; this is virtually unchanged from the ratio of 13.5 percentduring FY88-FY92. Increased allocations would require a research program inthe priority area of fodder supply. Measures to expand the role of theprivate sector in livestock development need to be developed and adopted. Onearea is in the delivery of veterinary services. Measures proposed under theTen-Year Dairy Development Plan to commercialize the Dairy DevelopmentCorporation and expand the supply of dairy products need to be implementedwithout creating new public enterprises in the manufactrring sector. Therecord of poor performance of public manufacturing enterprises andprivatization measures already underway, would suggest that new publicinvestments in manufacturing be limited and new projects be promoted forprivate sector investment and management control.
g. Forestrv
Introduction and Backcrround
5.30 Forestry is the source of at least 11 percent of agricultural GDP.It provides about 74 percent of national energy use, and is a source of foddersupply for livestock, which accounts for over 40 percent of farm income in theMid-Hills and High-Hills. Over the past decades Nepal has faced problems offorestry degradation related to limited energy alternatives and a pressingdemand for fuelwood, growing pressure on agricultural land from populationgrowth as well as from increased livestock numbers on grazing lands, illegalfelling of timber and lack of forest resource management. There is greaterpressure on accessible forests, as close to 50 percent of forest cover isestimated to be in the remote middle Hills. An estimated 19 percent of forestcover was lost in the Terai with economic expansion in the seventies andeighties, and nation-wide deforestation was then estimated at about 4 percent,one of the highest in South Asia.1/ Though Government proposed variousforest plans since the start of the sixties, it was not until the earlyeighties that forestry development began to receive some attention.
Sector Obiectives and Stratec*v
5.31 The broad objectives of the Forestry Master Plan (1989) and themore recent EP (1993-1997) are to:
Meet the basic needs of the people for forest products in asustained fashion;
O other countries which have experienced serious deforestation problems include Sri Lanka (3.5percent) and Thailand (1.6 percent). See World Bank, "Strategy For Forest Sector Development inAsia", 1992; pages. 2-5.
- 102 -
O Classify forests under different management for production and forprotection to foster efficient forest resource utilization whileimproving environmental quality;
* Increase the supply of industrial raw materials throughagro-forestry and industrial forestry, and increaseincomes and employment of the rural poor;
* Protect watersheds from environmental damage andprotect forest resources from destruction and overuse by peopleand livestock.
Within this framework, the approach to forestry development under the EPinvolves a variety of institutional arrangements. These include broadbasedparticipation through community and user group management, private leaseholds,improved market-oriented management of state forests and improved statemanagement of protected areas.
5.32 The increased attention being paid to forestry development isreflected in rising resource allocations to the sector. There have been some125 projects so far, sponsored jointly by HMG, 28 major donors and 40 otheragencies, including NGOs. In FY93, for example, HMG and foreign allocationstotalled US$10 million each, representing a 50 percent increase in the last 4years. Overall Government expenditures on the sector have risen from 2.7percent of total Government expenditures in FY80 to 3.2 percent by the end ofthe decade, and forestry was allocated 4.7 percent of development resourcesunder the EP. The expenditure pattern of Table 5.12 conveys the main emphasisof forestry development. Three program areas, namely, Community Forestry (29percent), National and Leasehold Forestry (30 percent), and Conservation ofEcosystems and Genetic Resources (26 percent), accounted for 80 percent ofsector allocations during FY90-FY93. While initially, Community programs wereexpected to absorb over 45 percent of sector allocations under the EP, thefirst year (FY93) allocation shows a lower share of 19 percent, as humanresource development needs and the needs of resource information and planningsupport for forestry programs received increased attention, particularly fromexternal funding sources.
Sector Performance, Priorities and Adiustments
5.33 It is difficult to assess quantitatively the performance offorestry projects and programs, (i) in the absence of systematic evaluation ofthe impact on the environment, forest productivity and other sectorobjectives; (ii) lack o effective monitoring of the imiplementation ofprojects; and (iii) poor project accounts. However, there are preliminaryindications that while intra-sectoral expenditures conform broadly to sectorstrategy and objectives, performance has generally been below expectation invarious respects. Thus, new policies for developing the sector were just madeunder the Forestry Act of 1993, and the By-Laws which will guide sectoractivities and programs are now under preparation.
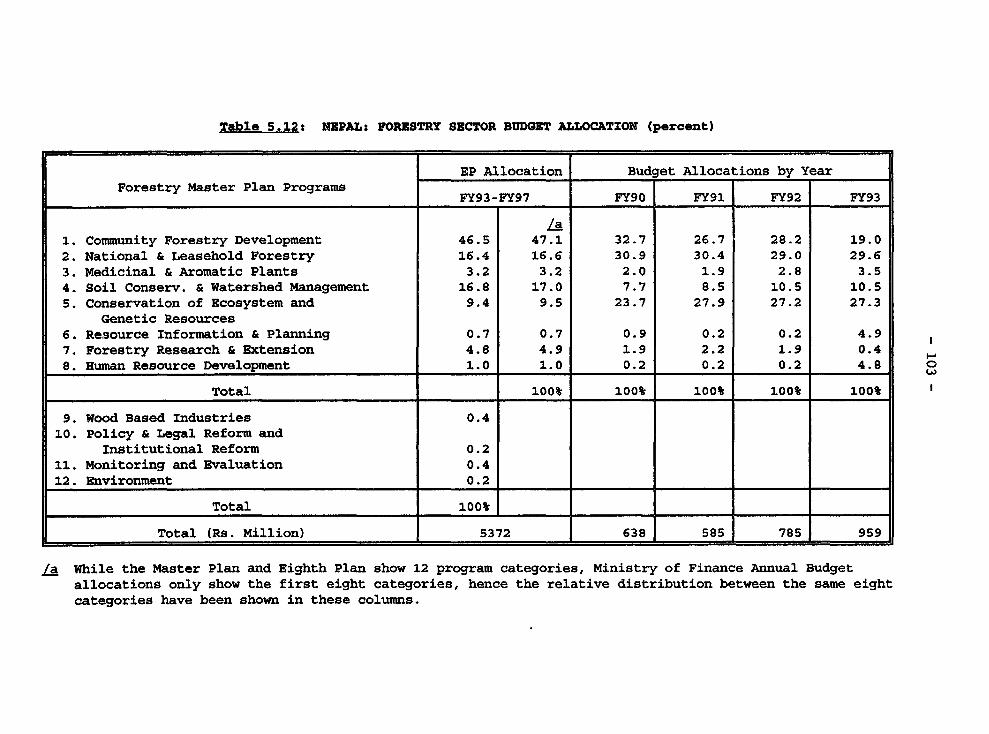
Table 5.12s NEPAL: FORESTRY SECTOR BtDGET ALLOCATXON (percent)
EP Allocation Budget Allocations by Year
Forestry Master Plan Programs FY93-FY97 FY90 FY91 FY92 FY93
/a1. Community Forestry Development 46.5 47.1 32.7 26.7 28.2 19.0
2. National & Leasehold Forestry 16.4 16.6 30.9 30.4 29.0 29.6
3. Medicinal & Aromatic Plants 3.2 3.2 2.0 1.9 2.8 3.5
4. Soil Conserv. & Watershed Management 16.8 17.0 7.7 8.5 10.5 10.5
S. Conservation of Ecosystem and 9.4 9.5 23.7 27.9 27.2 27.3
Genetic Resources6. Resource Information & Planning 0.7 0.7 0.9 0.2 0.2 4.9
7. Forestry Research & Extension 4.8 4.9 1.9 2.2 1.9 0.4
8. Human Resource Development 1.0 1.0 0.2 0.2 0.2 4.8 0
Total t100% 100 100% 100% 100%
9. Wood Based Industries 0.4
10. Policy & Legal Reform andInstitutional Reform 0.2
11. Monitoring and Evaluation 0.4
12. Environment 0.2
Total 100%_
Total (Rs. Million) 5372 638 585 785 959
ja While the Master Plan and Eighth Plan show 12 program categories, Ministry of Finance Annual Budget
allocations only show the first eight categories, hence the relative distribution between the same eight
categories have been shown in these columns.
- 104 -
5.34 The major problem is weak implementation and low resourceabsorption. For example, only 65 percent of the sector budget was utilized inFY92, and preliminary estimates indicate a similar situation for FY93 as someprojects, including the second tranche of the ADB-supported Forestry Programloan were cancelled. Some of the poor implementation relate to lack oftechnical skills and adequate operational guidelines to design and translatethe Master Plan into feasible projects. Also, administrative practices favorbureaucratic control, especially over nationalized forests at the expense ofpromoting efficient use and regenerating forest resources. Until recently,clear guidelines for transferring resources to Community and User groups werelacking; and poor management of project finances and weak monitoring adverselyaffected fund release for programs. In the absence of functioning local levelorganizations, O&M support was inadequate and completed programs could not besustained. Often, such activities were operated at much diminished levels,and project staff laid off. This has been so even for most of therevenue-generating programs which were to be self-sustaining, but tended tofold up at the end of external support. Training and other opportunitiesprovided by externally-funded projects were often not well utilized.
5.35 Despite the generally poor implementation performance, there areindications of differences in progress across sub-sectoral programs. The restof this section will examine performance in the major program areas, startingwith Community Forestry.
5.36 The top priority program area is Community Forestry, which appliesmainly in the Hills. It is the largest single program area envisaged underthe Master Plan, and it accounted for 28-30 percent of forestry sectorallocations in FY90-FY92. Its main activity is to transfer management rightsand responsibilities over assigned forest land from the Fcrest Department toUser Groups, and for the Forest Department to provide technical services tohelp User Groups achieve efficient and sustained utilization as described insimple operational plans. To date some l90O User Groups are reportedly atdifferent stages of formation, and 500 Operational Plans have been approved.As awareness of the program spreads, the Forest Department's role would haveto shift gradually from handing over forest land to User Groups to providingthem with technical and extension advice for managing community forest landsfor multiple uses, responding to the rural economy. Anecdotal evidencesuggests that the program may be starting to mitigate deforestation, with aslow but gradual forest regeneration in some parts of the Hills. The programis entering a consolidation phase, as local communities are getting more awareof the benefits of participation. The program has the potential to reduceGovernment expenditures on forestry development, with increased communityparticipation in forest management; lead to the withdrawal of subsidies forforest watchers; increase user group contributions of which 50-75 percent havebeen recorded; and emphasize regeneration through protection rather thanplantation. It is estimated that Government allocations to the program couldbe reduced by about a third without adversely affecting program performance.Core activities that have to be retained include trained technical staff withadequate budget and facilities to support user groups with advice on extensionand on the technical options for harvesting and regeneration.
- 105 -
5.37 Another important program area is private forestry, which mainlyinvolves supplying free seedlings to private landowners to grow trees. Thedemonstrated success of lucrative tree crops has given impetus to the rapidestablishment of private nurseries, primarily in the Terai. With this privatesector expansion, the commercial production of seedlings by the ForestDepartment needs to be sharply reduced and the Department's efforts refocussedon research and provision of new technology and improved seeds. The singlemost important impediment to this program has been restrictions on cuttingtrees on private land, which is considered to be providing a cover for illegalfelling in the nationalized forests. The new Forest Act has removed theserestrictions.
5.38 Another major program area undergoing reform is productionforestry. Unlike in the past, the emerging policy is to manage nationalforests as productive concerns. The new Forest Act implicitly (i) requiresthe line Ministry to assess and allocate national forests for sustainable usein line with social, economic and environmental goals; and (ii) providesalternatives to Government management of forests by making provisions forleasehold (concession) forestry. The emerging policy calls for Government toestablish clear goals for managing national forestry to:
Identify ecologically sensitive, severely degraded or fragileareas, (such as parts of the Siwaliks) that require protection.These areas are to be retained under the territorial functions ofthe District Forest Officers.
Identify potential production forests; that is, areas which havegood growth and regeneration potential and would be economicallyviable. These are to be managed through concessions or by theGovernment. Excluding the parks and reserves, middle mountainsand the fragile Siwalik range, some 400,000 ha have beenidentified for producing forest products, mainly logs andfirewood. From these, an annual sustainable production has beenestimated conservatively at Rs.6,450 million ($130 million) instumpage value alone, a sizeable revenue compared to the Rs.5,372million envisaged under the EP for the entire forestry sector.
e Remove all restrictions on the distribution and pricing of forestproducts by adopting a market responsive supply system, includingabolishing the virtual monopoly of the Timber Corporation andother agencies and making them financially autonomous. Removeopen-ended subsidies; target the socially desirable ones andreplace them with explicit budgetary allocations. Collect feesand royalties systematically as part of forest resource managementinstead of the present ad hoc subsidies to a variety of users.
Strengthen the capacity of Government tc manage and monitorproduction forests; develop research capacity, especially inforest regeneration; establish transparency and accountability andscope to enforce environmental codes.

- 106 -
5.39 The program of the Department of Soil Conservation (DSC) operatesin 30 districts, and attempts to address environmental problems caused by(a) intensified use of forest resources by rapidly growing population in theHills, resulting in deforestation, overgrazing and demand for cropping land;and (b) poorly designed and maintained infrastructure, including roads,channels and dams. Various measures, such as afforestation, stall feeding andfodder production, conservation farming, rehabilitation of infrastructureprojects and river bank protection are used to prevent rapid land degradationand erosion. The effort required is multi-disciplinary and requirescoordinating various Departments. Yet, the secondment of specialists fromother line agencies to DSC and attempts to coordinate line departments havenot been satisfactory. Working relationships between the agencies andDistrict and Village Development Committees are still being fashioned, and atthe technical level, programs require substantial field presence of extensionagents and operating budgets which are not often adequately provided. Thereis also a Conservation of Ecosystems and Genetic Resources program implementedthrough a network of protected areas covering 10.8 percent of Nepal. All buttwo of the areas are managed by the Department of National Parks and WildlifeConservation (DNPWC). The capacity of DNPWC to manage these areas has notkept up with increasing pressures from adjoining settlements and from tourism;this has threatened the biological and economic value of the parks, especiallyin the Terai. Allocations are inadequate at approximately $50 per square Km ayear for parks and reserves, and the costs of protection by armed guardsabsorb 80 percent of the annual budget.
Conclusion
5.40 Reform efforts need to emphasize strengthening the institutionaltechnical and managerial capacity to implement, monitor and evaluate projects.While policies and strategies have been developed, poor project preparationand weak implementation have limited resource absorption relative toallocations; and inadequate monitoring and data limitations undermine theability to assess the outcome of expenditures and policies. The situationwarrants paying more attention to capacity building rather than increasingresource flows to the sector. For example, administrative guidelines to guidethe management and implementation of National Leasehold forests need to bedeveloped and implemented; and bye-laws need to be publicized and enforced.Other important measures to stress include research and extension service forcommunity and leasehold programs, and training support at the local level todevelop skills required to sustain user group activities. It is estimatedthat allocations, for example, to community and user group programs could bereduced substantially, possibly by a third, if such programs are appropriatelydesigned on the basis of local level input, participation and contribution.
5.41 The Forestry Act seeks to improve the management of nationalizedforests. The By-Laws formulated to implement the Act should support privatesector development, including community organizations, user groups, leaseholdsand the delegation of production forests to autonomous agencies on acompetitive basis, while phasing out monopoly controls. Other importantmeasures to stress include promoting private production and use of trees,phasing out subsidies on public sector tree nurseries and fostering private

- 107 -
sector role in this area. Finally, Government departments need to bestrengthened to monitor the use of the national production forests andenvironmental codes.
h. Conclusions
5.42 The reasons for agricultural stagnation in Nepal may be found inan inappropriate development strategy in t}. past, which involved anexcessively large role of government in operating irrigation systems,supplying inputs to farmers, intervening in product and input markets,controlling prices and in maintaining a research establishment separated fromthe realities of farmers' needs. There is now recognition in the Governmentof the need for changes in the approach to agricultural development, and theNPC has started the process of preparing the PPAD which is intended toidentify priority actions to accelerate growth. While the PPAD is only in theearly preparatory stages of its work, the key elements of a sector developmentstrategy have already become clear, although they need to be furtherelaborated and validated. These key elements are as the following.
* Expansion of perennial irrigation which can permit year-roundcropping at higher yield levels. A major role of farmer groups isenvisaged in all stages of design, construction, operation andmaintenance.
e Increased supplies of inputs, notably fertilizer, in a timelyfashion and drawing upon the services of the private sector.
* A research and extension service focused on supporting rapidproduction increases.
* Provision of supportive infrastructure in areas of high potentialfor production increases.
e Provide a longer term strategy for the development of both theTerai and the Hills, based on exploiting the ecological diversityand comparative advantage.
5.43 While some progress has been made in adjusting policies andexpenditures in each of these areas, performance has been uneven among thevarious agencies of the Government. Thus, there is a long way to go toovercome the low growth record of the past.
5.44 In irrigation, efforts are being made to improve the quality ofthe existing development project portfolio and to implement the new policyemphasizing farmer managed schemes. First, there is still a level ofexpenditure on some problem projects, which is difficult to justify. Whilethe FY92 Irrigation Policy calls for changes in the approach to irrigationdevelopment, the EP also provides for large scale irrigation schemes to cover37 percent of newly irrigated land, compared to 41 percent for small scale
- 108 -
schemes and 18 percent for small and medium scale schemes. The experiencewith the poor productivity of large scale schemes, especially those managed bythe state and have no secure access to water all year round, would suggest alimit on such new project starts. The advantages of a strategy that couldpromote more productive small scale farmer-managed schemes and involve lessGovernment expenditures need to be exploited. Second, DOI needs to developthe capacity and departmental culture necessary to implement the participatoryprojects specified in the New Irrigation Policy and to shift its focus fromdirect Government investment to managing and maintaining irrigation schemes.Third, the complex mix of current subsidy levels needs to be reviewed.Because of increased demand for private STW installations as the subsidy rateincreased from 40 to 50 percent, the subsidy budget for FY93 was grosslyinadequate. The subsidy policy on STW should be brought in line with auniform policy on charges for irrigation water. Fourth, greater provisionsneed to be made to rehabilitate existing suitable irrigation schemes to beturned over to farmer groups. Sustained liberalization of the distribution ofirrigation equipment for STW would also promote private O&M financing.
S.45 For fertilizer, controls on its marketing have been officiallyliberalized. The subsidies have been reduced greatly or eliminated for allchemical fertilizers, apart from urea, which remains subsidized at a very highrate. While the private import of fertilizer has started, supply shortagesstill exist, and steps need to be taken to relieve the situation for the shortand longer term. Continuing price controls need to be phased out; a levelplaying field needs to be provided for the private sector, and the protectiongiven to the cooperatives in terms of having first call on AIC's fertilizerover private retailers (in times of shortage) needs to be reviewed.Government needs to enforce the announced policy to liberalize the trade inchemical fertilizer, and the urea price should be increased to reduce thesubsidy. The role of private wholesale and retail distributors should beexpanded. Also, it is equally important to encourage farming systems that usea judicious application of organic and inorganic fertilizers.
5.46 The implementation of reforms to restructure NARC and efforts toimprove extension services by re-organizing the department are encouraging.The Government has privatized some activities by leasing out state farms andsetting up a privatization cell in the Ministry of Agriculture to expanddivestiture and the role of the private sector. The privatization of statefarms should be accelerated to release resources for research and extensionwork, instead of for Government production. Options for private delivery ofsuitable extension services, such as in veterinary services, improved seedsand tree nurseries need to be explored and adopted. Also, a system should bedeveloped to monitor and evaluate agricultural performance and to update andmaintain the agricultural production data base; and the departments andagencies dealing with agriculture need to develop an effective monitoring andevaluation system for sector activities. The limits imposed by the lack ofreliable agricultural statistics on the assessment of agricultural progressand on effective analysis of policy alternatives has been recognized for along time, and it needs to be seriously addressed. Restructuring the basicagricultural statistical system should be a high-priority activity, although arelatively low cost one in terms of the expenditures required.
- 109 -
B. INDUSTRY
Performance
5.47 The main expenditure efficiency issue in the industrial sector isthe poor performance of the Public Manufacturing Enterprises (PMEs). The PMEsexpanded output, especially in the eighties; and they dominate the productionof cement (62 percent), sugar (55 percent), tobacco products (65 percent),agro and chemical lime (80 percent), and petroleum products and agriculturaltools. But most PMEs have uncompetitive cost., and large financiallosses.57/ Only five of the 25 operating MPEs generated surplusesconsistently during FY86-FY91, but even these surplus generating units are notnecessarily cost-efficient. In FY91, 86 percent of the surpluses originatedfrom only two enterprises; namely, Birgunj Sugar, an old unit which makes noprovision for capital replacement, and Janakpur Cigarette, which is highlyprotected with 100 percent tariff on tobacco products. The financialperformance of the PMEs has deteriorated through the eighties, and net lossesas a ratio of fixed assets rose from 3 percent in FY86 to 9 percent by FY91(Table 5.13), the most recent data available.
5.48 The poor financial performance reflects serious problems,including poor quality of some investments, government intervention in PMEaffairs in the past, ineffective management and weak financial structure.Investments were driven more by national self-sufficiency; and some projects,such as in jute and sugar, evolved from Government takeover of failed privatecompanies in order to preserve jobs. Cement industries, which accounted for59 percent of total Government investment in manufacturing during the last tenyears were considered doubtful investments at inception. Hetauda Cement, forexample, had an appraisal rate of return of 12.8 percent, but was riskybecause of the low quality and lack of accessible limestone deposits, thebasic raw material. In the event, Hetauda Cement operated below capacity; andthis added to 81 percent cost overrun in implementation and weak managementcontributed to the poor performance. The performance of Himal Cement has beensimilarly undermined by unreliable sources of input supply, especially coaland limestone. The Udaypur Cement plant, which is nearly completed, wouldalso face the same problems. The jute enterprises have suffered from adeclining world market, over-employment, weak capital structure reflecting theimpact of accumulated losses, and controls which have raised raw jute pricesto the mills. Neither Raghupati nor Biratnagar jute mill has potential to beself-supporting, but each has been maintained for domestic self-sufficiencyand to avoid job losses. The main investments in the food processing area insugar, dairy and tea have shown mixed performance. Birgunj Sugar, forexample, has been profitable, mainly because of the surpluses generated by thebeverage division. The Tea Development Corporation has made marginalsurpluses; however, there is potential to improve performance by relaxingstate controls. The cigarette and tobacco enterprises have done well
-Neval: Non-financial Public Enterorises Sector", Report No. 9076-NEP; 1991.

- 110 -
Table 5.13: NEPAL PERFORMANCE OF PMBs
FY86 FY87 FY88 FY89 FY90 FY91
Loss Making PMEs
Dairy Dev. Corp. -5.4 -21.6 -14.6 8.6 -26.1 -16.8Hetauda Cement -72.2 -155.6 -95.2 -94.2 -100.0 -83.3Hetauda Textiles -0.5 10.9 8.6 6.9 -1.3 -10.0Himal Cement 0.0 7.0 -1.4 -18.4 -43.5 -13.2orind Magnesite 11.6 -9.0 1.5 -2.1 -2.1 -113.0Raghupati Jute -21.8 -17.7 -30.8 -25.1 -33.3 -30.9Rosine & Turpen. - - -1.2 2.7 -17.7 -10.3Others -17.5 -16.5 -21.3 -124.1 -14.9 -12.4
Total -105.8 -202.5 -154.4 -245.7 -238.9 -289.9
Profitable PMEs
Birgunj Sugar 8.0 12.3 21.0 15.7 34.4 24.9Janakpur Cigarette 35.8 70.3 65.9 7.6 26.6 25.6Royal Drugs 3.5 1.7 6.5 8.7 -3.8 4.8Nepal Lube Oil - - - 28.1 3.3 0.2others - 3.9 8.8 16.6 16.8 3.1
Total 47.3 88.2 102.2 76.7 77.3 58.6
Net Profits
Net Profits -58.5 -114.3 -52.2 -169.0 -161.6 -231.0
Profit (% of Fixed Assets) -3.0 -7.8 -2.5 -8.1 -6.3 -9.0
Source: Ministry of Finance, Corporation Coordination Division
financially, with the monopolistic control of the Janakpur Company and aidedby protection; but non-commercial sales centers maintained in remote areas ofthe country at Government behest and private sector expansion are erodingJanakpur's market share and profits. Finally, other assorted PMEs, includingRoyal Drugs and Bhrikuti Paper, have generated marginal surpluses.
ExDenditure Priorities and Reforms
5.49 The poor performance of the PMEs has fostered MPE dependence onGovernment subsidies for operations, rehabilitation of investment and debtrepayment. Expenditures on industry have risen from 3.9 percent of totalGovernment spending in FY86-FY89 to over 6 percent in FY90-FY93; this is highrelative to officially stated policies, and it is significantly above theaverage for developing countries.-S/ As shown in Table 5.14, the bulk ofthe allocations for industry have been for public enterprise development.Also, of the Rs.2,245 million of EP resources allocated for industry under the
La For Nepal the share of industry from total Government spending was 5.2 percent in 1981-85, 3.9percent in 1986-89 and 6.2 percent in 1990-91, compared to 1.8 percent (1985) for Bhutan, 3.0 percent(1986) for Pakistan, 4.5 percent (1987) for Nigeria, and 1.2 percent (1987) for Bukina Paso.
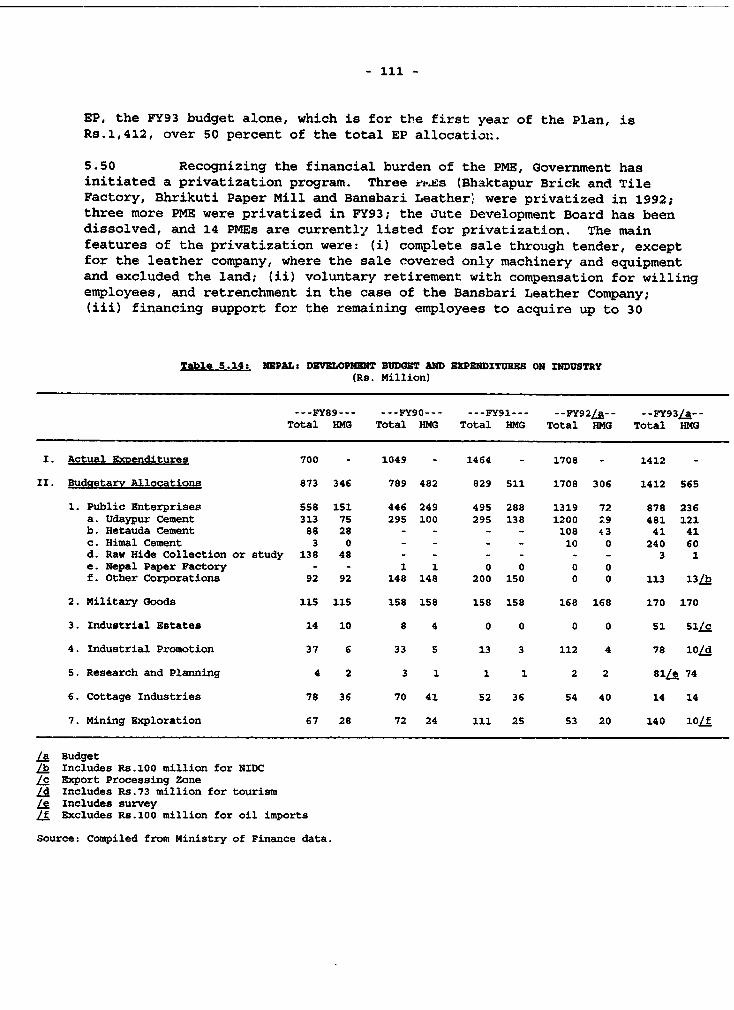
~~~~~~~~~~~~- 11
- ill -
EP, the FY93 budget alone, which is for the first year of the Plan, isRs.1,412, over 50 percent of the total EP allocation.
5.50 Recognizing the financial burden of the PME, Government hasinitiated a privatization program. Three n38s (Bhaktapur Brick and TileFactory, Bhrikuti Paper Mill and Bansbari Leather' were privatized in 1992;three more PME were privatized in FY93; the Jute Development Board has beendissolved, and 14 PMEs are currently listed for privatization. The mainfeatures of the privatization were: (i) complete sale through tender, exceptfor the leather company, where the sale covered only machinery and equipmentand excluded the land; (ii) voluntary retirement with compensation for willingemployees, and retrenchment in the case of the Bansbari Leather Company;(iii) financing support for the remaining employees to acquire up to 30
Table 5.14: NEPAL: DEVELOPMNW BUDGET AND EXPENDITURB8 ON INDUSTRY(Rs. Million)
--- FY89--- --- FY90--- --- FY91--- -- FY92/a-- --FY93La--Total HMG Total HMG Total HMG Total HMG Total HMG
I. Actual Exvenditures 700 - 1049 - 1464 - 1708 - 1412 -
II. Budctetarv Allocations 873 346 789 482 829 511 1708 306 1412 565
1. Public Enterprises 558 151 446 249 495 288 1319 72 878 236a. Udaypur Cement 313 75 295 100 295 138 1200 ,.9 481 121b. Hetauda Cement 88 28 - - 108 43 41 41c. Himal Cement 3 0 - - - - 10 0 240 60d. Raw Hide Collection or study 138 48 - - - - - - 3 1e. Nepal Paper Factory - - 1 1 0 0 0 0f. Other Corporations 92 92 148 148 200 150 0 0 113 13/b
2. Military Goods 115 115 158 158 158 158 168 168 170 170
3. Industrial Estates 14 10 8 4 0 0 0 0 51 5l/c
4. Industrial Promotion 37 6 33 S 13 3 112 4 78 10Ld
5. Research and Planning 4 2 3 1 1 1 2 2 81Le 74
6. Cottage Industries 78 36 70 41 52 36 54 40 14 14
7. Mining Exploration 67 28 72 24 111 25 53 20 140 10/f
/a Budget/b Includes Rs.100 million for NIDC/c Export Processing Zone/d Includes Rs.73 million for tourismle Includes survey/f Excludes Rs.100 million for oil imports
Source: Compiled from Ministry of Finance data.

- 112 -
percent shares in the privatized PMEs; and (iv) a strategy for expanded
reforms to cover both manufacturing and non-manufacturing PEs, using further
privatization, closure and liquidation of inherently unviable units,
restructuring and introduction of management contracts for other PEs,
especially utilities, which would be retained in the public domain. Private
sector activity is also being promoted through the FY92 Industrial Policyreforms to deregulate investment sanctioning procedures.
5.51 The Government is reviewing expenditures on industry in the
context of on-going privatization policies; and investments in new PMEs has
been restricted. Accordingly, the proposed Export Processing Zone project
with an initial allocation of Rs.51 million in the FY93 budget has been
cancelled; and total allocations for industry declined by 17 percent in FY93
and by 58 percent to Rs. 588 million in FY94. First, experience would suggest
the freeze be maintained and proposals to establish new PMEs in dairy and
fertil4.zer be transferred to private sector management control. Second,
assorted expenditures, such as on the military, which are located in the
industry budget need to be capped and appropriately classified in the regular
budget or phased out. The share of the military spending in the industry
budget rose to 12 percent in FY93 after declining from 16.4 to 9.8 percent
during FY89-FY91.
C. POWER
Performance and Overview of Issues
5.52 Nepal has substartial hydropower resource endowments of which an
estimated 25000 MW is exploitable, but only about one percent of this has been
developed so far. Commercial sources of energy, such as coal, petroleum
products59/ and electricity represent four percent of energy consumption,with hydropower accounting for just under one percent. There has been
shortages of commercial energy since the seventies; and despite the completion
of two hydro projects, quadrupling hydropower capacity to 241 MW installed
since 1981, power consumption remains supply-constrained. Nine percent of the
population has access to electricity, and per capita commercial energy
consumption (18 kilograms of oil equivalent) is among the lowest for the LDCs.
The main power sector development issues are the following.
Power shortage is a serious problem. The shortage is compounded
by alternative drought and flood conditions which disrupted theoperational capacity of existing hydropower plants. Kulekhanihydro, for example, was damaged by recent floods and requiredrehabilitation and reconstruction; and load shedding has beeninstituted in Kathmandu and other major industrial centers.
Petroleum imports, for example, were equivalent to 30 percent of merchandize export earnings,close to $60 million in FY91.

- 113
Electricity consumption grew at an average rate of 12.3 percentduring FY81-FY90, starting from a very low base. Householdsabsorbed 32.3 percent and industries 24.1 percent of supplies;commercial and other users absorbed 14.2 percent, and lossesamounted to 29.4 percent. Current power consumption approximatesor exceeds the total of 240 MWio/ of dependable capacity.
O The costs of developing Nepal's substantial hydropower resourcesare high; the terrain is difficult and road infrastructure isinadequate. Power alone absorbed 20 percent of project aid in themid-seventies and 24 percent in the eighties. Arun III (402 Mw)hydropower is the one project in the most advanced stage ofpreparation; but it is lumpy, requiring a phased implementation.The first phase (201 MW) has an estimated cost of US$ 760 millionincluding physical and price contingencies and excluding taxes andduties. The project requires constructing a 122 Km access road,and the first phase (201 MW) is not likely to be commissionedbefore the year 2002. Thus, additional measures are required toaddress the intermediate power shortages. Also, Arun would putmore stress on Nepal's already fragile fiscal balance, adding tothe urgency for reforms (as discussed in detail in Chapter 3).
Uneconomic power tariffs are being reformed. Tariffs have beenuneconomic and on average estimated to be about 50 percent oflong-run marginal cost during the eighties. Average tariffs wereraised by 61 percent in November 1991, by 24 percent in March 1993to about USS.059, and again by 38 percent effective March 1994.The estimated LDC average tariff is US$0.1061/.
e Power delivery requires substantial efficiency improvements.Unauthorized connections and low technical capacity, includingincorrect metering and obsolete equipment in transmission anddistribution have caused significant power losses, estimated at25-30 percent of total supplies during FY81-FY90. The NepalElectricity Authority (NEA) is over-staffed, and average laborproductivity of 81 MWh reflects the highest staff to consumerratio for any Asian utility. Previous hydropower projects had RORof about 3 percent or less at completion, and the financial ROR onNEA's revalued assets was estimated at 1.3 percent in FY89 andminus 0.46 percent in FY92. While reforms are being implementedto improve efficiency, progress is uneven and impact onperformance remains to be seen.
Total existing power capacity is 268 Mw, comprising 232 Mw of hydro, and 36 Mw of diesel andmulti-fuel thermal plants; and the dependable capacity is 240 Mw (206 hydro and 34 multi-fuel).
I/ Cited from Gunter Schamm, et al. Electric Power in Develomina Countries: Status. Problems andProspects". Annual Energy Review, Vol 15, 1990, pages 307-332.
- 114 -
Sector Obiectives and Strategv
5.53 Expenditure programs and policies must meet the short to medium-
term shortages as well as provide for longer term capacity expansion.Specific objectives are to (i) provide adequately for domestic consumption,
including rural electrification; (ii) improve the reliability and quality of
electricity supply; and (iii) develop power surplus for exports. Thedevelopment expenditure portfolio has activities to (i) rehabilitate and
improve existing hydropower investments and extend capacity; and (ii) invest
in large projects principally for exports, medium size projects for the
national grid system, and small and micro hydro projects mainly for regional
needs and for isolated communities. Reforms are being introduced to encourage
private investment in the sector, and some actions to promote institutional
development have already been taken. These include measures to make NEA
commercially oriented through efficient pricing and restructuring itsmanagement and personnel. An estimated Rs.23.7 billion (20.9 percent) of EP
expenditures is allocated to power.
Priorities for Intermediate Power Supolv
5.54 Measures to mitigate the short-term power supply shortages shouldbe given top priority. The options include (i) improving the maintenance and
rehabilitation of existing projects; (ii) private investments; (iii) potential
imports; and (iv) load management. These measures are expected to provide
over 123 MW- of addit:onal supply by the second half of the nineties.
5.55 Improvements in O&M and rehabilitation have potential to augment
generation capacity by an estimated 15-20 MW. M.ajor projects which could help
to recover capacity are already in the current development budget, and their
implementation should be expedited. For example, the Trisuli plant with an
installed capacity of 21 MW and a rated capacity of 18 MW actually has a
running capacity of 14.1 MW. For the Devighat plant which reuses waterdischarged from Trisuli, its actual output has fallen to 11.8 MW relative to
the installed and rated capacity of p4.1 MW. -The rehabilitation and upgrade
of Trisuli-Devighat would provide a net capacity increase of an estimated 8.3
MW. Similarly an additional 2 MW is expected to be coaxed from Gandak which
currently provides about 8 MW dependable capacity, compared to 15 MW installedcapacity and 8 MW rated capacity."/ Other important rehabilitation
activities include protection, reinforcement and spare renewal for selected
projects, (e.g., Kulekhani Protection Project, High Voltage Reinforcement
Project, High Voltage Spare Parts Strengthening Project and Power PlantReinforcement Project). Also, reactivating the Government's diesel and multi-
fuel plants could provide aome 34 MW of energy. Measures to strengthen
institutional support for O&M include improving procurement practices for
-/ This includes 8 MW from rehabilitating Trisuli-Devighat, 2MW from Gandak, 12 MW from the
completion of Thirmruk by FY95, 60 MW from Khimte Kola, 11 MW from Modi Khola, 5 MW from power lossreduction through the power sector efficiency project and 25 MW imports from India.
-/ "Nepal: Review of On-Going Development Projects in the Power Sector, Issues and PreliminaryRanking", Mimeo, May 1992.
- 115 -
spare parts as well as the standardization and accommodation of physicalstores.
5.56 At least a third of the 25-30 percent losses in power suppliesrelate to difficulties in transmission and distribution (T&D) management, suchas overloaded lines, obsolete equipment and malfunction of metering devices.T&D projects absorbed over 25 percent of power sector expenditures duringFY90-FY92, and recent budgets have programs to upgrade the T&D system andlimit power losses. Examples are Attariya-Dipayal and Duhabi-Kataiya projectsand ae'2itional 132 XV transmission line linking India and Nepal in the Westcurrently under discussion. These projects aim at upgrading over-extendedlines, reducing overloading and improving the stability and metering of thesystem. The Duhabi-Kataiya and a transmission line linking Nepal and India inthe Western part of Nepal would also support power exchange with India fromthe current level of 25 MW to an estimated 50 MW. At the same time, not allthe T&D projects should have top priority, especially those which are notproperly sequenced. Since T&D investments are complementary to generationinvestments, the expansion of the T&D system should match the growth ofgeneration capacity and demand priorities. T&D projects need to be reviewedto delay those not appropriately sequenced relative to generation capacity.
5.57 Private investments in power, especially mini hydro projects whichcan be executed quickly, need to be promoted to improve power supply duringthe implementation of Arun. One example is the Jhimruk plant now underconstruction, which will provide 12 MW at completion in the next few years.Other potential small projects include Khimti Khola 1 (60 MW), which could beexecuted for commissioning possibly by 1997, and Modi Kola (10-15 MW)"'.The transport sector development budget would need to give priority to theroads which could provide access to these projects. Kali Gandaki A (100 MW),a medium sized project with an estimated cost is US$ 250-300 million, is alsolisLed in the sector development expenditure portfolio.
5.58 Other efficiency measures and supply sources include peak loadmanagement, energy conservation, imports from India and investment in thermalpower. Serious load management requires conservation campaigns andincentives, such as peak load pricing and negotiations with major consumers.Also, arrangements for power exchange with India in the short term hasrelevance for Nepal's power export strategy. Fifty MW of potential powerimports are available from existing exchange agreements with India, andaugmenting this would help to mitigate intermediate supply shortages. Also,selective investments in thermal power would provide scope to manage peak loadsupply and help meet interim shortages.
The Arun III Proiect
S.S9 Of the 12 or more major hydropower generation projects in thedevelopment portfolio (Table 5.15), the Arun III hydropower project (AHP) isin the most advanced stage of preparation. AHP (402MW) is technically
/ See Nepal Hydropower Strategy and options, USAID, September 1992.

- 116 -
Table 5.15: NEPAL: POWER DEVELOPMENT PROGRAM, FY93(Rs. Million)
Budget Heading Total
Small Hydro Power Project 10.0Biogas (ADB/W) 36.0Karnali Multiple (incl. Upper Karnali) 37.4Mahakali (Pancheswor) Water Power 67.3Water & Energy Commission 5.7Kali Gandaki-A Hydro Power Project 23.1Darchula Small Hydro Power Project II P. 1.5Accham Small Hydro Power Project 28.1Namcha Small Hydro Power Project 10.4Tatopani (Myagdi) Small Hydro Power Project 38.7Arun III Hydro Power Project 139.5Trisuli-Devighat Reconstruction 416.6Khotang, Dolpa and Kalikot 1.5Small Hydro Power Master Plan 9.3Modi Kola 3.5West Seti 1.0Hydro Power Survey 10.7Seventh Gandaki 1.0Chamliya Gad 1.0Nepal-Mahendranagar 132 KV 29.4Attaria-Dadeldhura-Dipayal 66 KV 142.0Lahan-Jaljale 33 KV 15.9Tulsipur - Salyan 4.1Surkhet-Dailekh 33 KV 1.5Tikapur-Rajapur Electrification 4.0High Voltage Improvement 123.1High Voltage Stock Part 10.0Dhubahi-Bhantabari 132 KV 15.2Power House Improvement 15.0Dumre-Basisahar Electrification 2.1Seventh Power 79.4Sixth Power 155.8Pokhara Rural Electrification 35.7Kathmandu Valley Power System Improvement 10.5Rural Electrification 30.0Nepal Power Tech. Read Office Complex Building 7.0Central Workshop Construction 21.3Training Facility Establishment 53.9Planning Management 10.0Computerize Billing 20.4Leakage Control Project 189.2Kulekhani Conservation Project 176.5Marsyangdi Hydro Power Center 260.3Small Hydro Power Improvement Project 3.7
Total 2715.8
feasible, and it has tremendous strategic importance both in terms of helpingto overcome persistent domestic power shortages and generating surpluses forexports. It is considered a first step in a sequence of investments in theArun valley, which will form a major part of Nepal's power export developmentstrategy. Its implementation is expected to open the Arun area for lower costexport-oriented hydropower projects. Investment in AHP is also part of theeffort to accelerate overall growth and development and raise widespread lowincome leveis. While agricultural growth is important in that regard, its
- 117 -
scope is limited by various factors, including farm sizes and populationpressure; and accelerating the growth rate requires a sustained high rate ofindustrial expansion, which will be difficult in the face of persitent powershortages. Industry has been a leading source of growth -- about 6-7 percent-- in recent years. In addition, expansion of tourism, which is a majorpotential source of growth, requires reliable supply of power to deliver urbanservices. AHP is lumpy; the total estimated cost is US$1,466 million,including physical and price contingencies and import duties. It will beimplemented in two phases, and the first phase (201MW) costing an estimatedUS$760 million is expected to be commissioned by the year 2002 or later.
5.60 The power sector has been allocated Rs.23.7 billion (US$ 550million in FY92 prices), 20.9 percent of EP expenditures. However, based onthe revised resource envelope, expenditures on power would be equivalent to anestimated 36 percent of total development expenditures and AHP close to 20percent during the peak implementation phase, FY1997 to FY1999. Power willaccount for 40 percent of foreign and 15 percent of local resource (excludinginterest during construction) utilization for the rest of the nineties.Because of its size, the project raises serious macroeconomic issues, such asits effects on fiscal stability, its claims on local resources which arealready severely constrained and its potential to displace other importantdevelopment activities. Studies were undertaken to assess the budgetaryfeasibility of AHP and the related power sector investment program. 5/
5.61 An "Affordability Analysis" of various versions of AHP project wasconducted to assess the feasibility of the overall power sector expenditureprogram. The analysis distinguished between local cost and foreign costfinancing and between HMG and NEA contributions in order to draw attention tothe need for reforms both (i) in overall fiscal and public resource managementand (ii) in the power sector activities, including expenditures as well asmanagement of NEA. The details of the macroeconomic framework underlying theaffordability analysis are discussed in Chapter 3 sections B and C.661 TheBase Case simulation shows that the principal expenditure programs of theGovernment, including AHP, human resource development and rural infrastructurewould be feasible provided the Government adopts critical reform measures to(i) restructure revenues and enhance domestic resource mobilization; (ii) re-orient the development expenditure program to emphasize resource flow to thehigh rate of return activities and phase out low priority programs; (iii)
See "Nepal: Government Expenditures and Financing of Power Investments", World Bank, March 1992."Nepal: Government Expenditures and Financing of Power Investments, Addendum", May 1992.
The resource envelope of the Base Case assumes (i) real GDP growth of 4.2 percent during FY94-FYOO, which is considered good relative to the long term growth of 3.5 percent prior to the Tradeand Transit Impasse in the eighties; (ii) an average increase in revenue effort of 0.5-0.6 percentof GDP in FY94-FY96 and 0.3 percent of GDP for the rest of the nineties, compared to about 0.2percent in the eighties; and (iii) a stable macro-fiscal environment with a fall in domesticborrowing from over 2 percent of GDP since the mid-eighties (over 3 percent of GDP in each of FY92and FY93) to a little over one percent for the rest of the nineties; and (iv) a tighter expenditureprogram emphasizing (a) containing sharp increases in regular expenditures through limits on wageincreases, continuing civil service reforms with selected hiring and improved support for nonwagerecurrent costs and (b) the adoption of a priority development expenditure program and pruning lowpriority activities.
- 118 -
improve the performance of development management institutions in screening,implementing, monitoring and evaluating programs in order to raise theefficiency of investments; and (iv) raise the efficiency of NEA and theperformance of the power sector so that the country can get the benefit of theproposed investments. The analysis shows that while foreign financing supportis likely to be adequate, local financing would be severely constrained.Beyond the fiscal and institutional reforms necessary to improve overallpublic resource management, NEA's performance needs to improve significantlyso that it can implement AHP with minimal cost overruns and also generateinternal resources to the equivalent of about 0.3 percent of GDP to augmentlocal resources. The simulation indicates strongly that the budgetarysituation and public resource management would be difficult if the proposedpower sector investments were to be inserted into the development expenditureportfolio, while maintaining a business as usual stance in public resourcemanagement and keeping existing projects and sector expenditure allocationpatterns. The main elements of the proposed revenue reforms are discussed inChapter 2; the main expenditure reform proposals are summarized in Chapter 3;and institutional reforms are in Chapter 4. The rest of this section willfocus on power sector reform issues.
Commercialization of NEA
5.62 Government has started reforms to improve the performance of NEA.Some of the major issues being addressed include overlapping institutionalcontrols, inadequate management, unsatisfactory accounting practices and weak
controls7/, over-staffing and uneconomic tariffs. Progress onthese issues has been uneven, and the impact on overall performance remains tobe seen. In the institutional area, The Electricity Development Act and theNBA Act were amended in October 1992 to facilitate private sector entry intothe power sector and enhance NEA's autonomy. NEA's Board now has a majoritynon-Governmental representation, and in November 1992, NEA's Managing Directorand senior managers were replaced by a much more qualified team. However, notmuch progress has been made on the other issues. For example, one hundredemployees were retired in a start to reduce over-employment, but the staffingto consumer ratio is still high and productivity low; and a more substantiveplan prepared to rationali - 3taffing and retire close to 1000 more employeeshas yet to be implemented. While accounts receivables are now equivalent tothree and half months billings,, compared to up to six previously, accountingpractices and financial control and performance remain unsatisfactory.
5.63 Uneconomic pricing policies, which undermined effective loadmanagement and the financial health of NEA, are being changed. The averagepower tariff was estimated to be about SO percent of long-run marginal costduring the eighties 68, and recent estimates of long-run marginal cost of
L/ See "NeDal: Power Sector Efficiencv Proiect", Report No. 9077-NEP, 1992
Sfg World Bank, 'Nepal: Power Subsector Review", Report No. 6879A-NEP, 1988, pages 9-10 and 54-59.

- 119 -
the Nepal system vary widely up to about Rs.6.44 per Kw/h.691 By 1991, theaverage tariff was Rs.1.38 per Kwh. This was raised by 60.4 percent to Rs.2.3per Kwh in November 1991, by 24 percent in March 1993 to about Rs.2.88 per Kwh(US$0.059), and again by 38 percent effective March 1994. The estimated LDCaverage tariff is US$0.107°/ However, tariff adjustments need to beaccompanied by efficiency improvements to promote consumer compliance. Sincefixing prices over long periods has often created the necessity for eventualsharp increases which are politically sensitive, measures are being consideredto reform the system, through a Tariff Fixation Commission, which will providemore flexibility in tariff decisions and also promote private investments inthe sector.
Rural Electrification Proarams
5.64 Over 90 percent of Nepalese live in the rural areas, but less than2 percent of the rural population has access to electricity. Ruralelectrification is costly and uneconomic and, there is currently nosustainable strategy for it. Even where power supply from the national gridmakes generation costs comparable to those of urban areas, final deliverycosts tend to be much higher in the rural areas because of the high costs oftransmission and distribution to dispersed communities in a very difficultterrain. On the other hand, apart from a few exceptions, locating mini hydroprojects near local communities to save on the transmission and distributioncosts still result in high overall costs because of the higher costs of smallgeneration investments. Low rural income levels limit the ability to pay foreven operating costs, which, in turn, undermine the scope for sustainingprograms.
5.65 A strategy for sustainable rural electrification development needsto be developed as the current approach is not effective. For example, theFY92 budget allocated Rs.475,000 for projects in 42 districts, with no orlimited evaluation and documentation of the benefits. This fragmentedallocation is not likely to support any meaningful rural electrificationdevelopment. NEA has already created a separate Directorate for ruralelectrification. In addition, some of the small hydropower plants have beenadvertised for leasing to the private sector, and separate accounts will bemaintained for rural electrification schemes to explore efficient and economicoperations. However, reimbursing NBA for losses incurred in the ruralelectrification area is not likely to be sustained in view of the tight fiscalsituation. This has to be studied to develop alternative options forsustainable programs.
/ Actual marginal costs depend on the voltage, time of consumption and the investment expansioncosts. See NEA: Report on uLong Run Narainal Cost and Tariff Study" (6th report), December 1990,and World Bank: "Nenal Power Sector Efficiency Prolect", Staff Appraisal Report, February 1992,pages 4-50.
See Gunter Schamm, "Electric Power in Developing Countries: Status, Problems and Prospects",Annual Energy Review, Vol. 1S, 1990, pages 307-332.
- 120 -
Summary and Conclusions
5.66 Power sector expenditure policies need to adopt a two prongedapproach (i) to meet short, medium and long term internal demand on prioritybasis; and (ii) pursue export of surplus power. The main expenditure issuesfor the power sector are the following.
e Stress expenditures for a priority sector investment program,which will include (i) rehabilitating existing projects to raisecapacity use and mitigate the power shortages; (ii) sustaining therenovation and efficiency improvement programs related totransmission and distribution to reduce power losses; (iii) roadconstruction projects, which will provide access to privateinvestments in the power sector (Khimti, Modi, etc); (iv) ArunIII; and some thermal generation as needed. Other projects,including rural transmission and distribution projects need to besequenced appropriately to support generation investments.
o Adopt macro-fiscal reforms to support the management of Arun III.Measures will include (i) revenue reforms and revenue mobilizationdiscussed in Chapter 2; and (ii) a tight development expenditureprogram with core activities, pruning of low priority expenditureand the adoption of a 3-year rolling budget (Chapter 3).
e Continue implemantation of reforms (deregulation of investmentstariff liberalization, etc.,) to promote private investments inpower. Reform the tariff structure and establish a TariffCommission.
* sustain on-going institutional, managerial and staffing reformsand implement retrenchment to make NEA commercially oriented tohelp generate returns from investments.
* Develop a feasible strategy for rural electrification.
D. TRANSPORT
a. Introduction and Background
5.67 Transport development is a more difficult challenge in Nepal thanin most LDCs. Nearly 80 percent of the terrain is unusually rugged andmountainous; and this, with periodic flooding, has made road construction andmaintenance costs very high. 1 The landlocked nature of the country, weak
I/ in the case of highway construction, for example, the two lane paved 51 Km Dharan-Dhankutahighway cost US$ 932,804 per Km; and the 61 Km two lane paved Narayaghat-Muglin-Gorkha highway costUS$ 593,895 per Km, compared to average costs of USS 360,000 to USS 400,000 for similar quality newroads in landlocked Sahelian African countries. See, for example, 'Road Construction in the Nepal
- 121 -
project screening and poor implementation have compounded these costproblems. 2 Traffic density is lower than normal, especially in theMountains, where 8 percent of the population resides. The transport systemcomprises (i) a network of highways, feeder roads and district roads most ofwhich are in the Mid-Hills and Terai of Central and Eastern regions; (ii) anextensive system of tracks, trails and suspension bridges in the remote areasof the Hills and the Mountains; and (iii) essential landing strips and basicairports to reach remote areas. The total road mileage is about 8300 Km,compared to less than 650 Km in the mid-fifties. There are also 7000 Km ofmain trails supported by 400 modern suspension bridges and 43 domesticairports, including some 30 which are operational.
5.58 The transport sector absorbed 36 percent of total foreign aid (28percent of development expenditures) from the fifties up to the end of theseventies, declining to 17 percent in the eighties.-3/ Roads received up to80 percent of resources allocated to transport, and aviation is a distantsecond with 10 to 15 percent. Road user revenues, i.e., fuel and vehiclerelated taxes, are an important but decreasing scurce of revenues for theGovernment. An overall assessment of the road sector's financial performanceindicates a substantial net loss to the sector, resulting in cash flows fromthe Government equivalent to 8 percent of Government revenues. Including theestimated shortfall in regular maintenance, the net loss is substantial.equivalent to 17 percent (US$ 44 million) of Government revenues in FY91.
The EP Exoenditure Oblectives
5.69 Currently, the state of transport deve-opment is under reviewunder the EP. The sector objective is to support frowth and povertyalleviation efforts, expand the links between ad7 nistrative centers andimprove regional balance in access to road transport facilities. The strategyfocusses on new construction, strengthening of road sector institutions,decentralizing road management and upgr7ding and rehabilitating deterioratingassets. It proposes to construct farm-to-market roads and special roads tosupport tourism and hydropower. However, the main emphasis is on constructingNorth-South Roads. Total sector resources are estimated at Rs.16.195 billion,14.8 percent of EP development expenditures. The main activities aresummarized in Table 5.16. Road transport will absorb over 70 percent ofsector resources; air transport 16.2 percent; trails, tracks, suspensionbridges and other remote area works will absorb 7.5 percent; and others 9.7
Himalaya: Experience from Lamosangu-Jiri Road Project, ICIMOND occasional Paper, no 8; March 1987(costs adjusted to 1988 values using MNUV index).
/ For example, in the Third Highway Project, the road between Naubise & Maleku financed throughICE cost $150,000 per Km, compared to Maleku-Muglin, a segment of the same road, which was financedunder management contract at $570,000 per Km.
-/ Total expenditures on transport, including regular and development expenditures, accounted for19.7 percent of total Government expenditures in FY80, and between 9 to 11 percent during FY86-FY92.

- 122 -
percent. The target for highway construction under the EP iS 763 KmZ4/,mostly North-South routes.
Table 5.16: EP: PROPOSED TRANSPORT EXPEDMITURES(Ra. million)
Rs. (%)
Highway and Feeder Road Construction La 8,107 50.0Maintenance and Rehabilitation lb 2,844 17.6Rural Transport Development La 1,058 6.5Assorted Programs /d 1,239 7.7Miscellaneous /e 320 2.0Air Transport 2,631 16.2
Total 16,1S. 100.0
/a Includes new construction and upgrading /b Includes road strengthening,periodic maintenance, reconstruction, repairs and improvement
/c Construction and improvement of tracks, trails, suspension bridges, and cablecrossing Ld Ropeways, railway, trolley bus services, internal waterways,containerized transportation Le Feasibility studies, institutionaldevelopment, procurement of road machinery and equipment, etc.
Source: NPC: EP Appendix 4D
ExDenditure Efficiency Issues
5.70 The Government is aware of the need to improve the efficiency ofexpenditures among the competing pressures on sector resources.7-/ Some ofthe main pressures for resources include (i) demand for highway and feederroads as indicated by economic factors and emerging demographic trends in theTerai and the Mid-Hills; (ii) farm-to-market roads to support agriculture,especially cereal development initially, and feeder roads to provide access toimportant national projects in hydropower and tourism; (iii) the maintenanceneeds of the main highway and feeder road network, including 4000 Km of theexisting roads; (iv) required improvements for the trails and suspensionbridges and expanding these to the West and the Far-West, where roadconstruction is expensive and uneconomic; and (v) improvements for internalaviation to the remote areas. Also, the EP emphasizes road transportdevelopment to meet the need for equitable regional distribution of roadtransport assets. The problem, however, is that first, the existing transport
74/ This includes 48 Km of black topped roads, 149 Km of gravel roads and 566 Km of fair weatherroads.
75/ See "Nepal EFYP: Road Transport"; HMG, May 1992. "Nepal: Infrastructure Development Study";World Bank, December, 1992. n Nepal: Project Selection and Prioritization in the Road Sector"; HMG,April 1992. "Nepal: The Transport Sector Profile Study"; ADB, 1988. "Nepal: Evaluation of SectoralExpenditures - Infrastructure Sector"; World Bank, September 1991. "Nepal: Expenditures on the RoadSector". World Bank, 1993. "Resource allocation, Budgeting and Resource Transfer System in the RoadSector of Nepal - Statistical Tables"; World Bank, January 1992.

- 123 -
investment portfolio is already over-extended, resulting in fragmentedfinancing, weak implementation and delayed completion of most projects. Forexample, only 38 percent of North-South (N-S) roads under the Seventh FiveYear Plan were completed by 1991, a year after the end of the plan period, andsome projects have been under construction over a decade without muchprogress. Second, the emphasis of the EP on N-S roads would cost an estimatedat Rs.7.8 billion and displace more economically viable projects. Third,transport assets have been eroding, and this requires a systematic approach toroutine and periodic maintenance, which is more cost-effective thanrehabilitation. The 17.6 percent of EP resources allocated to rehabilitationand maintenance would cover at most an average 7 percent of the existing roadnetwork, 12 percent of the strategic network a year over the plan period.
5.71 While there is need for work on network analysis and performance,the preliminary indication from the sector expenditure review suggests theneed for economic transport projects to enhance the contribution of transportdevelopment to the achievement of the Government's overall stated economicgrowth and poverty alleviation objectives. Despite the importance of theobjective of equitable regional access to road transport over the long term,an expanded construction program in that direction will be difficult tosustain, given the resource envelope of the transport sector, the existingover-crowded project portfolio and the need to reduce fragmented allocationsand promote more effective implementation, and the rehabilitation andmaintenance needs of the existing network. The Government is beginning totake steps to address the efficiency issues and sector spending trade-offs.Among the main measures adopted recently, the Government is to (i) prepare andimplement a 3-year rolling plan for the sector with a ceiling on b4dgetaryallocations and expenditures as part of the FY95 budget cycle, (ii) prepare apriority investment plan for new construction, upgrading and maintenance ofroads, spelling out the scope of work, sources of financing and time table forimplementation, (iii) increase funding for carrying out periodic, emergencyand routine maintenance of all roads in the strategic road network and (iv)establish a mechanism, including guidelines and procedures for funding themaintenance activities. The priority investment plan would help to focusresources on the core network as well as other selected roads needed foragriculture, hydropower and tourism and foster rural income generatingactivities and develop strategic national resources. The strategy for theremote areas would include improving the Trails, Tracks and Suspension Bridgesand updating the basic domestic aviation infrastructure, while continuingreforms to promote private investments in commercial aviation equipment. Inthis regard, the completion of other transport projects would need to beselective, based on sunk cost and strategic considerations.
b. Road Transport
Evolution of the Road Network
5.72 Roads account for up to over 80 percent of sector expenditures.While the road network expanded significantly over the past decades from a

- 124 -
total of 624 Km in 1956 to about 8300 Km presently, the quality of the roadnetwork is varied: 40.8 percent is paved; 22.4 percent is graveled, and therest is covered with earth. Despite progress in expanding the network, accessto road transport remains very limited. Terai has the highest road density(Table 5.17), and most of the existing network is in poor to fair condition.
Studies76/ indicate that the average national road density of 3-4 Km per10,000 population is less than half the average for the LDCs. For example,the Te-:ai which is best served by road networks has an average density in Kmper 10,000 population of 4.6 compared to 18 for Bangladesh, 19 for India, 16for Sri Lanka and 11 for Pakistan.-7/ Nepal's traffic volume is also
Table S.17: NEPAL: ROAD DENSITY RM PER 10,000 POPULATION (1990)
Terai Hill Total
Road density Road density Road density Road density Road density Road densityper 100 sq. per 10,000 per 100 sq. per 10,000 per 100 sq. per 10,000
KM population KM population KM population
Eastern 17.07 4.64 1.68 1.96 S.72 3.s8
central 9.63 2.74 8.11 4.83 8.52 3.27
Western 15.67 7.08 1.79 2.15 3.10 3.22
Mid-Western 7.10 4.85 .68 2.36 1.06 2.9s
Par-Western 3.02 3.80 2.70 2.78 2.73 3.75
10.50 4.62 2.99 2.82 4.43 3.35
Source: "Road Situation in Nepal", Department of Roads.
relatively low, although average vehicle growth picked up at 7 percent intotal and 11 percent for private vehicles during 1981-91.21/
Hiqhwav and Feeder Road Construction
5.73 This section examines the efficiency of road projects. in absenceof detailed network analysis, the review is based on existing ROR estimates,
16/ Some of the recent reports include: NPC, "Approach to the Eighth Plan, 1992-97 (April 1992)";NPC, "Project Selection and Prioritization in the Transport Sector (April 1992) "n World Bank, "PublicExpenditures in the Road Sector (August 1992)"; World Bank, "Transport Sector Issues (1990).
" Nepal: Infrastructure Development Study"; World Bank, December, 1992.
78/ Traffic volume varies considerably from an annual average daily count of 1600 on the Kathmandu-Retauda route to the Indian border to less than 200 in other areas.
- 125 -
the strategic role of networks, linkage between road projects and developmentactivities, and the sunk costs of on-going projects. The main road transportsystem which evol-ed over the past decades has various elements, including:(i) an East-West highway (E-WH) passing through the major towns of the Terai;(ii) a corridor from Kathmandu to Hetauda and linking with the Terai E-WH;(iii) a second E-WH passing through the Mid-Hills and about parallel to theTerai E-WH and (iv) a series of North-South roads linking with the East-Westsystems and supported by feeder roads connecting the regional and districtadministrative centers.
5.74 There are differences in the economic potential of the main roadschemes. The Terai E-WH, for example, is justified essentially by economicactivity, internal and external trade, and overall economic growth anddevelopment considerations. It is the most well developed highway and isalmost complete except for selected routes, such as between Karnali River andMakahali in the Far-West Region. With the opening of the Karnali Bridge andthe remaining road sections, Nepal would have the basic highway to linkKathmandu with the major population centers and the potential agriculturalgrowth areas in the Terai. The demand for this network will grow with thetrend in population movements in recent years, and it will support access toexternal markets. The Government attaches priority to completing importantsegments of the E-WH and some feeder roads during the EP period. The mainprojects, which would be completed within the next 3-4 years include Kohalpur-makahali, Pokhara-Baglung, Chaughada-Dhinka (which has substantial sunkcosts), Charali-Illam and MRM-Gaighat. These projects were allocated justover Rs.400 million, 12-13 percent of the FY93-FY94 budget. However, theeconomic viability of constructing more connections in the corridor betweenKathmandu and Hetauda to the Terai is a major issue, and this concernsespecially the viability of the proposed Sindhuli-Dhulikel road. Anotherefficiency issue is the expansion of the Mid-Hills E-WH. Segments of thishighway linking parts of the West to the Central region (from Pokhara toKathmandu and to Jiri) are in demand; however, there is need for a review todetermine the economic viability of extending this road to other parts of thecountry. For example, an evaluation of the growth potential of such areas asDipayal, Surkhet and Dhankuta would help to determine extending the Mid-HillsEast-West highway to the Far-West at this time.79/
5.75 While some of the N-S road projects (e.g., Charali-Ilam) wouldpromote economic activities, such as tourism and agricultural diversification,in the long term, many of them are costly with relatively low returns as theytraverse difficult terrain with limited potential for benefits. Quite anumber of them are motivated by the understandable desire to linkadministrative centers and to provide equitable access to road transport. Ofthe 23 district centers not linked to the national road network, work is inprogress for 14, and 9 more had allocations in the FY93 budget to startconstruction. The main N-S roads have an estimated total cost of Rs.7.8billion and would absorb virtually all the resources planned for roadconstruction under the EP. Table 5.18 shows a sample of road projects,
M/ Nepal: Project Selection and Prioritization in the Road Sector"; HMG, April 1992.
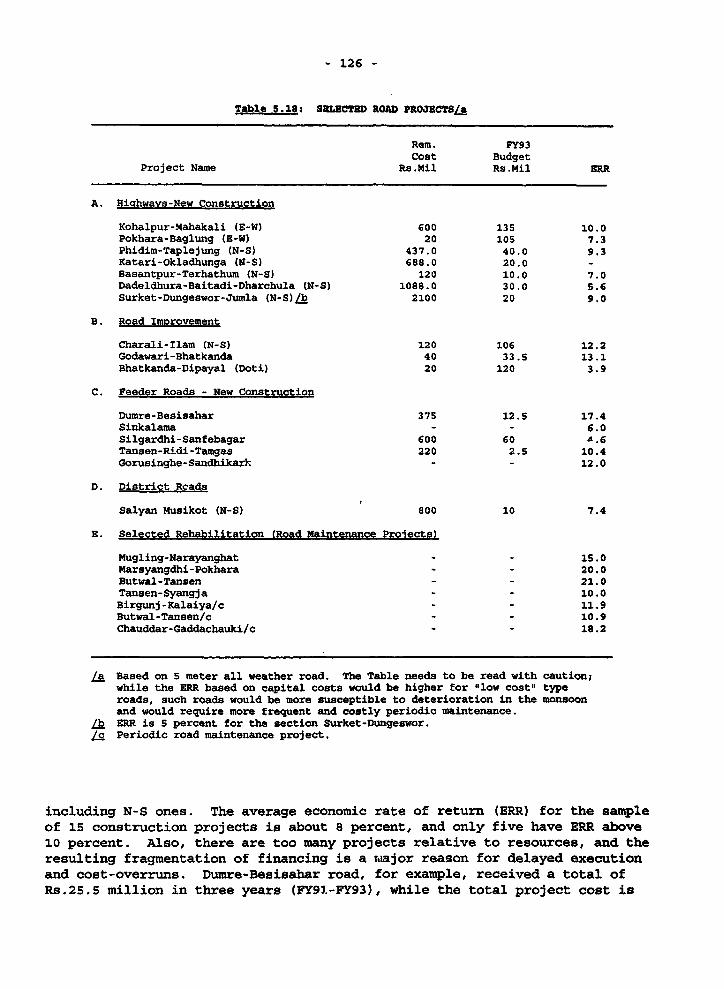
- 126 -
Table 5.18: SELUCTED ROAD PROJECTS/A
Rem. FY93Cost Budget
Project Name Rs.Mil Rs.Mil ERR
A. Hichwavs-New Construction
Kohalpur-.Mahakali (E-W) 600 135 10.0Pokhara-Baglung (E-W) 20 l05 7.3Phidim-Taplejung (N-S) 437.0 40.0 9.3Katari-Okladhunga (N-S) 688.0 20.0 -Basantpur-Terhathum (N-S) 120 10.0 7.0Dadeldhura-Baitadi-Dharchula (N-S) 1088.0 30.0 5.6Surket-Dungeswor-Jumla (N-S)/b 2100 20 9.0
B. Road Improvement
Charali-Ilam (N-S) 120 106 12.2Godawari-Bhatkanda 40 33.5 13.1Bhatkanda-Dipayal (Doti) 20 120 3.9
C. Feeder Roads - New Construction
Dumre-Besisahar 375 12.5 17.4Sinkalama - - 6.0Silgardhi-Sanfebagar 600 60 4.6Tansen-Ridi-Tangas 220 2.5 10.4Gorusinghe-SandhikarF. - - 12.0
D. District Reads
Salyan Musikot (N-S) 800 10 7.4
E. Selected Rehabilitation (Road Maintenance Prolects)
Mugling-Narayanghat - - 15.0t4arsyangdhi-Pokhara - - 20.0Butwal-Tansen - - 21.0Tansen-Syangja - - 10.0Birgunj-Kalaiya/c - - 11.9Butwal-Tansen/c - - 10.9chauddar-Gaddachauki/c - - 18.2
/a Based on 5 meter all weather road. The Table needs to be read with caution;while the ERR based on capital costs would be higher for "low cost" typeroads, such roads would be more susceptible to deterioration in the monsoonand would require more frequent and costly periodic maintenance.
/b ERR is 5 percent for the section Surket-Dungeswor./c Periodic road maintenance project.
including N-S ones. The average economic rate of return (ERR) for the sampleof 15 construction projects is about 8 percent, and only five have ERR above10 percent. Also, there are too many projects relative to resources, and theresulting fragmentation of financing is a r.ajor reason for delayed executionand cost-overruns. Dumre-Besisahar road, for example, received a total ofRs.25.5 million in three years (FY91-FY93), while the total project cost is
- 127 -
Rs.375 million, and it has been under construction for a over decade. Only 38percent of the N-S road construction target was completed in FY91, a yearafter the Seventh Five Year Plan period. Fragmented financing has been thecase especially for the fully Government funded (FGF) projects. In FY92, theFGF road projects absorbed 23.4 percent of new road construction; and thebudget for FY93 had over 20 rural projects, many with an allocation of Rs.5million, which was not adequate for meaningful project execution. Over twentyFGF projects were added in the FY93 budget, while HMG resource allocation forthese FGF projects declined by 45 percent to Rs.464 million. While voluntarylabor has heeil used to supplement Government resources in some localities,this accounts for 10-15 of construction costs, and there is need for technicalskills to address drainage, soil erosion and other environmental concerns.
5.76 Efforts to improve the implementation and performance of theseexpenditures need to be selective to help overcome the fragmented allocation,long implementation periods and delayed generation of benefits. Some of theconstruction projects (Rapti Road and Bhatkanda-Dipayal) which have alreadyincurred significant sunk costs will be completed in the next 2-3 years.Other N-S road projects need to re-assessed to focus resources on executingthem selectively and more effectively. In this regard, for example, some ofthe projects which need to be reviewed include Baitadi Darchula (section ofDadeldhura-Dharchula), Phidim-Taplejung, Chhahare-Thoka, Galchi-Devighat,Mahedra-Jogbuta, Sahajpur-Dipayal and Chhinchu-Jajakot and the Trolley Busextension project. These projects have an estimated cost of over Rs.3,000million, 20 percent of EP allocations.
5.77 The transport development program contains specific interventionroads to complement the core highway and feeder road system. The main onesinclude the special feeder roads to support agricultural development, hydroand tourism. In agriculture, while supportive feeder roads will have torelate to the priorities determined by the PPAD which is now in preparation,there is preliminary indication that cereal development will have to bestressed initially, and this would need to be supported by selected farm-to-market roads in the Terai and Mid-Hills to provide access to inputs (smallscale irrigation equipment, fertilizers and improved seeds, etc.) and helpevacuate the marketable surplus. The estimated cost of these 1,000-1,200 Kmall weather and low-cost farm-to-market roads is US$21-25 million in FY91prices, and they would require annual expenditures of US$2-3 million based ona 10-year implementation schedule. Comparative advantage and diversificationin other crops will also need similar transport sector support.
5.78 Decentralization is the main option being considered to promoteroad transport development at the district and local levels. The approach isto enhance the authority and responsibility of district level agencies L;:developing and managing the non-strategic local level roads. Currently, apilot project is being prepared to devolve responsibility of district roads tothe District Development Committees (DDC). It involves building managerialcapacity at the district level by providing (i) training in planning,evaluating and selecting road projects; (ii) developing road standards andappropriate labor based technologies, organizing training for localcontractors and providing incentives to execute projects to meet such
- 128 -
standards; (iii) promoting resource mobilization at the local level tocomplement grants from the central Government; and (iv) acquiring capacity tosupervise and monitor projects.
Road Rehabilitation and Maintenance
5.79 Road maintenance and rehabilitation have the highest ERRestimates, generally over 30 percent among transport projects for which dataare available.-S/ While estimates suggest that the costs of rehabilitationare less economic, about 4 to 5 times those of routine and period maintenance,a systematic approach to providing routine maintenance is yet to emerge.Sixty-six percent-U/ of paved roads require extensive repair andrehabilitation, and 75 percent-82/ of all roads are in poor to faircondition. The fair roads (25 percent; have significant defects which requireresurfacing, reshaping or strengthening; and the poor roads (S0 percent)require immediate rehabilitation and reconstruction. In the highway systemalone, surveys of road conditions in the late eighties indicate a back-log of300iKmeL2 plus another 522 Km planned for improvement under various projects.More recent estimates indicate a total of 529 Km of back-log, which isequivalent to 24 percent of the existing Highway or 50 percent of all roadsconstructed before 1981.14/ The poor quality of construction and theterrain contribute to road deterioration, requiring more than normalmaintenance. There is lack of institutional support for maintenance. Also,f inncing for routine maintenance is low relative to other countriesW', andit has declined from 16 to 8.9 percent of sector expenditures in FY88-FY92.
5.80 The BP would provide Rs.2.844 billion (US$63 million), 17.6percent of transport allocations for roed strengthening, repairs andmaintenance as well as for improvement and reconstruction. Upgrading workwill be done for 1083 Km of roads; periodic repairs, maintenance andreconstruction will cover 1475 Km; and 48 Km of flood damaged roads will bereconstructed. All these would cover 7 percent of the road network a year,less than what is required to provide adequate maintenance andrehabilitation. For example, simulations based on low to medium scenario for
Q2/ Cited from ADM Maintenance Study, 1987. Also, a study of seven maintenance projects indicatean average ERR of 27.6 percent with a high of 54.8 percent for Hetauda-Narayanghat and a low of 10percent for Dhanagadhi-Godawari (see "Resource Allocation, Budgeting and Resource Transfer Systemin the Road Sector of Nepal". January 19921 Table 19.
31/ ADS, "Nepal: The Transport sector Profile Study", 1988.
. World Bank, "Nepal: Expenditures on the Road Sector", 1992.
Q Tech Fcon, Scott Wilson Kirkpatrick and Partners, "Transport Sector Profile Study, Final Report",ADB, 1988.
U/ World "ank, "Nepal: Expenditures in the Road Sector", 1992, Chapter VII.
AV Nepal's financing ratio of 0.2 percent of GDP for routine and periodic maintenance is at the lowend for South Asian reoqlirements which range from 0.2 to 1.1 percent of GDP. The under-funding ismore serious, given the nature of Nepal's terrain and the related greater incidence of roaddeterioration. See World Bank, "Road Deterioration in Developing Countries," pp.23-27).
- 129 -
rehabilitating 45 to 60 Km a year, with routine maintenance for 2200-3900 Kmand periodic maintenance for 600-1000 Km would raise the coverage ofmaintenance from 20 to 50 percent of the network. This scenario, accompaniedby improvements for trails, bridges, etc., would cost approximately US$195million or about s0 percent of the planned resources for the transport sectorunder the EP.-/ However, given resource limitations and the need to linkmaintenance to demand, a priority maintenance program has to be determined inrelation to traffic volume and road network conditions.
5.81 More financing alone is not likely to provide improvements inroad conditions unless it is accompanied by institutional support for roadmanagement. Thus, Government has recognized the need to restructure the roleof road agencies. Currently, the Department of Roads (DOR) is responsible forplanning, designing, constructing and maintaining the road system, and despiteits efforts, DOR has limited scope to manage all types of roads, includinglocal and urban roads, effectively. Under proposed Government reforms, roadmanagement responsibilities will be decentralized, district authorities willbe assisted to have more responsibility for managing local level roadnetworks, and DOR will be strengthened. A road Maintenance and RehabilitationCoordination Unit (MRCU) has been established in DOR. This unit would enhancethe adoption of common construction standards and promote road selectionconsistent with overall network development objectives. The MRCU would needto update the inventory of the road network, evaluate road conditions andtraffic volume, determine the appropriate maintenance strategy and identifythe segments of the road network which should have priority for maintenance.Expanded responsibilities at the district level would need to be accompaniedby capacity building to ensure accountability for resources.
c. The Trail Svstem
5.82 The trail system is the only feasible surface transportation inmost of the Mountains and the Hills. Currently, 7,000 Km of main trailsnetwork exists of which S,000 Km are in Western, Mid-Western and Westernregions; and there are also 2,500 trail bridges of which 400 are modernsuspension bridges. The trail system is a suitable facility for pedestrians,carriage animals, tractors and motorcycles. The expansion and improvement inthe trail system would continue to be emphasized, given the low populationdensity and the prohibitive road construction costs in most of the remote Hilland Mountain areas. Recent reviews of the condition of the trail systemindicate a need for improvement and upgrading for at least 20 percent of thetrails in the Mid-West. Mule trails, for example, require an expansion towiden the width. In addition, a program needs to be instituted to renovatetrail bridges. Government plans to improve the trail system, ropeways and
M/ See simulation analysis in "Nepal Expenditures on the Road Sector", pages 57-62, World BankOctober 1992.
- 130 -
cable crossing during the EP with an allocation of Rs.1,058 million, 6.5percent of proposed expenditures.
d. Aviation
Introduction and Backaround
5.83 Aviation was allocated 10.7 percent of the development budget inFY91 and 14.9 percent in FY92, and the bulk of these went to support expansionand renovation of the Tribuvan International Airport. Domestic airportsaccounted for only 0.4 percent of the development budget in FY91 and 3.6percent in FY92, though aviation is an important part of domestic transportand will remain so in the foreseeable future. Aviation is more efficient thanroad transport in several parts of the country; for example, in some parts ofthe Western region for which data are available, the cost of road constructionis estimated at about 7 times that of air transport. In 1990, half of the 32domestic airports in operation were located in areas not accessible by road,mostly in the Mid-West and Far-West. Aviation is the only mechanizedtransportation for carrying passengers, food and construction materials, etc.,to the inaccessible areas. During the ten year period ending in FY87,domestic passenger traffic grew at an annual rate of 4 percent; passengerkilometer grew at 5 percent, and this could have been higher if appropriatepolicies were adopted to redress shortages in passenger space during theperiod. Tariffs are subsidized; most of the aircrafts are aged and the vastmajority of the air fields are not adequately equipped for regular traffic.
5.84 Table 5.19 summarizes the status of the domestic airport system.The busiest airports are in Kathmandu, Nepaljung, Pokhara and Biratnagar,which together account for close to 40 percent of the passenger traffic.There are significant variations in the quality of the airports. Only fiveairports, including the Kathmandu airport are classified as all weather withpaved runway (except for Pokhara which has a gravel runway), though facilitiesare not adequate for landing in inclement weather. Seven are unpavedfair-weather airports, and the rest are high altitude and short take-off andlanding fields. Only Kathmandu and Biratnagar have operational approachlighting systems, and only 5 have fueling facilities. Most of RNAC's aircraftfleet is aged; a third have been in service for over 20 years and anotherthird for at least 15 years. Air service has been a state monopoly under theRNAC until 1991, when the aviation industry was deregulated. Now, threeprivate companies with ten aircraft are in operation.
Expenditure Reforms
5.85 While internal aviation has been an integral part of the transportnetwork to establish links with all parts of the country and improve tourism,it has remained rudimentary. Allocations for developing internal aviationinfrastructure have been minimal, and the number of airports large. Thus, the
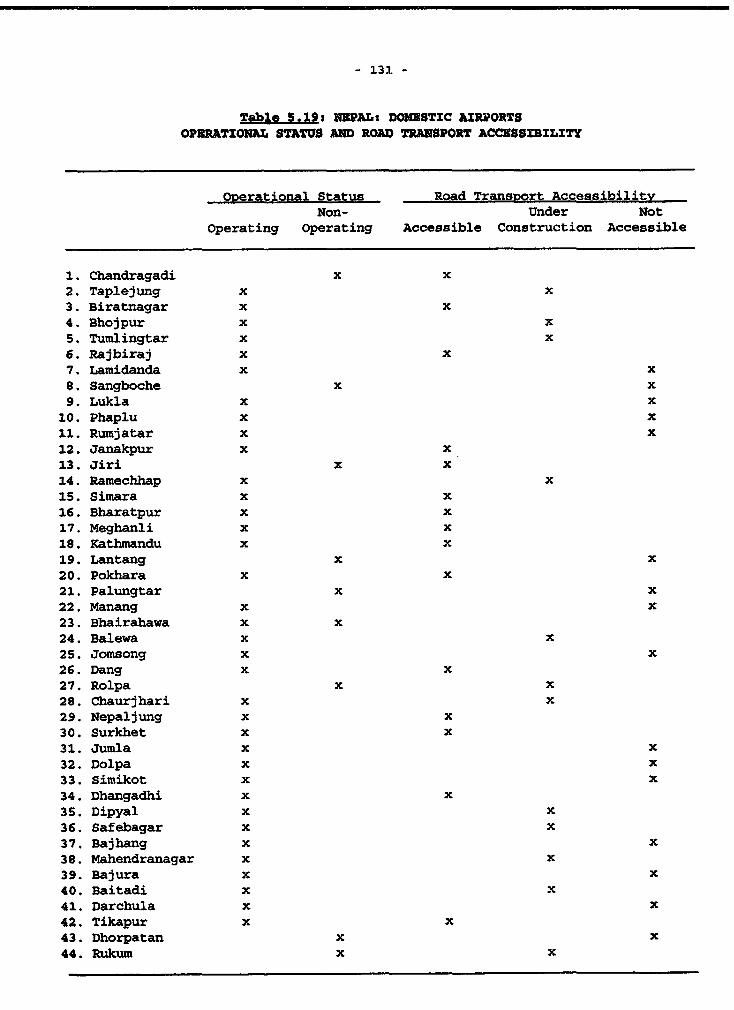
- 131 -
Table 5.19: NEPAL: DOMESTIC AIRPORTS
OPERATIONAL STATUS AND ROAD TRANSPORT ACCESSIBILITY
ODerational Status Road Transport Accessibility
Non- Under Not
Operating Operating Accessible Construction Accessible
1. Chandragadi x x
2. Taplejung x x
3. Biratnagar x x
4. Bhojpur x x
S. Tumlingtar x x
6. Rajbiraj x x
7. Lamidanda x x
S. Sangboche x x
9. Lukla x x
10. Phaplu x x
11. Rumjatar x x
12. Janakpur x x
13. Jiri x x
14. Ramechhap x x
15. Simara x x
16. Bharatpur x x
17. Meghanli x x
18. Kathmandu x x
19. Lantang x x
20. Pokhara x x
21. Palungtar x x
22. Manang x x
23. Bhairahawa x x
24. Balewa x x
25. Jomsong x x
26. Dang x x
27. Rolpa x x
28. Chaurjhari x x
29. Nepaljung x x
30. Surkhet x x
31. Jumla x x
32. Dolpa x x
33. Simikot x x
34. Dhangadhi x x
35. Dipyal x x
36. Safebagar x x
37. Bajhang x x
38. Mahendranagar x x
39. Bajura x x
40. Baitadi x x
41. Darchula x x
42. Tikapur x x
43. Dhorpatan x x
44. Rukum x x
- 132 -
current strategy for improving the system calls for assessing the role ofindividual airports in ':andem with expanded road construction in order tophase out redundant air strips and focus on upgrading retained facilities.More importantly, Government is reviewing its role and options for developingthe aviation system. The number of airports in operation was reduced from 43to 32 by FY90; controls on air tariffs have been relaxed, and private airlineshave been licensed to compete internally with the public sector. For thefuture, private sector participation in both external and internal aviationneeds to be promoted. Public expenditure priorities need to emphasize(i) upgrading the quality of the basic aviation infrastructure;(ii) maintaining safety standards through improved facilities and appropriateregulations; and (iii) liberalizing private investments in direct servicedelivery. Finally, proposals to build a second international airport need tobe reviewed relative to other options such as upgrading one of the existingdomestic airports.
e. Conclusions
5.86 The main sector expenditure issues involve balancing allocations(i) between new construction and O&M activities; and (ii) between roadprojects based mainly on economic considerations and those warranted mainly byequitable regional distribution and access to road transport facilities. Thetransport sector expenditure program has become over-extended with too manyprojects, with delayed execution of investments and inadequate maintenance ofexisting transport assets. Under any realistic scenario of resources thatwould be available for the sector, it will be difficult to implement on-goingroad projects and also meet the requirements for maintenance as well as forproposed new construction, while improving the implementation and performanceof sector activities. Thus, proposed reforms stress more focussedexpenditures to raise the quality of the project portfolio, redress thefragmentation of allocations and improve the implementation of projects so asto support the Government's overall growth and development objectives. Inthis regard, though a thorough network analysis is yet to be done, theGovernment's recent decision to define a preliminary strategic road network toinclude 4000 Km of highways and feeder roads is an initial step to beginrationalizing sector expenditures. A priority sector expenditure programbased on economic growth potential and demands for rural infrastructure cogive impetus to rural income generating activities and broadbased povertyimprovement needs to be formulated. This would include a core transportsystem which would have priority claim on resources and would emphasize:completing and maintaining the East-West Highway system; suitable farm-to-market roads to support cereal development initially, and agriculturaldiversification in the longer term; special purpose projects to help develophydropower and tourism with due consideration to environmental concerns; andimproving the trails and suspension bridges as well as internal aviation toremote areas. The overall appioach to sector expenditure re-orms wouldinclude the following.
- 133 -
* Formulate a 3-year rolling budget with sectoral ceiling onresources, emphasizing allocations to the strategic or corepriority network.
O Develop a tight and focussed transport development expenditureportfolio and a review process that would:
(A) Give top priority to projects to be completed within the next3-4 years, including Kohalpur-Makahali, Pokhara-Baglung, Charali-Illam, Bhatkanda-Dipayal, Godwari-Patan and MRM-Gaighat. Theseprojects were allocated a total of Rs.539 million, 16 percent ofthe FY93 budget;
(B) Overhaul the approach to road rehabilitation and maintenancethrough institutional reforms and increased financing of periodicand routine maintenance; and focus maintenance activities on thestrategic or core network. A road Maintenance and RehabilitationCoordination Unit (MRCU) has been created with improvedallocations to keep up the condition of the strategic network.Reform measures are to (i) develop and upgrade informationmanagement system on road inventory, evaluate road conditions,formulate quality standards in road construction and provideincentives to enforce these standards; (ii) adopt a maintenancestrategy that would keep up good conditions for the core networkas a priority; and (iii) provide more financing for maintenanceand rehabilitation; and
e Limit new road project starts and cap allocations for uneconomicprojects fully funded from HMG resources.
* Emphasize the construction of selected farm-to-market roads tosupport agricultural development, especially intensified cerealproduction initially and agricultural diversification in thelonger term; and support roads required to get access to strategicprojects, especially in hydropower and tourism.
* Improve and upgrade the trails, tracks, ropeways, etc., andassociated bridges to serve mostly the remote Hill and Mountainareas where road construction is uneconomic.
* Improve internal aviation to complement the road and trailnetworks to the remote areas. Re-orient aviation expenditures toemphasize safety standards and to update the basic infrastructure.Assess the proposal to build a second international airportrelative to other alternatives such as upgrading an existingdomestic airport. Extend on-going liberalization measures tofoster private sector investment in aircraft and other equipment.
- 134 -
E. EDUCATION
a. Background and Main Issues
Introduction
5.87 Education is a critical element of any poverty alleviationstrategy, mainly because it exercises a positive influence on skillacquisition and earning capacity, family planning and health practices.Education expenditures have potentially high social ROR87/, with beneficialeffects on other sectoral programs, such as agriculture.-e/ Nepal madenotzble progress in education over the last decades. As of 1991, there were18,600 primary schools (321 in 1951), 6,000 secondary schools (11 in 1951),seven technical schools and one major university with 195 campuses. A thirdof adults are literate, compared to under 5 percent in the early fifties.Despite the progress, access to education and actual school outcomes have beenpoor. The main efficiency issues raised by reviews of the education systemare the following.-9/
Access to education needs to be expanded; access is limited forlarge segments of the population, despite the fast growth inenrollments. Net enrollment in the primary school is estimatedofficially at 80 percent, though other estimates suggest about 50percent, 61 percent for boys and 35 percent for girls.90/ Thereare resional disparities in access; for example, primary schoolenrollment ratios range from 30 percent for the Terai rural poor
J There are no recent studies of the ROR on education in Nepal, but studies conducted in theseventies show significant differences in the ROR for the various levels of the education system.Generally, the ROR is higher at the primary school level, declining towards the higher levels. Forexamples, the social ROR estimates are estimated at 29.1 percent for Lower Secondary, 18 percent forgeneral undergraduate, 7.5 percent for Higher Secondary and 11.5 percent for Bachelor's Degree. SeeNirmal Pasad Pandey, "Cost Benefit Analysis of Education: A Case Study of Nepal, Cited in NepalEducation and Human Resource Assessment', May, 1988; pp. 2-1S8 to 2-162.
-/See Som Pudasaini, "Education and Agricultural Efficiency in Nepal", World Bank, Discussion PaDerNo. 82-3, 1982; Nepal Education and Human Resource Sector Assessment, IEES, USAID, May, 19e8, pp.2-152-155.
- See, for example, "Nepal: Education and Human Resource Sector Assessment", IEES, USAID, May,1988. "Nepal: National Program of Action for Children and Development for the 1990s", November,1991. "Nepal: Basic and Primary Education Master Plan", July, 1991. "Nepal: Education and Culturein the Eighth Plan", November, 1992. "Nepal: Financing Secondary Education", (study in progress).
- Estimates of enrollments are not reliable. Official estimates put net enrolment et 80 percentin FY90 and 77 percent in FY91, which would make progress towards Universal Primary EC:,cation lessdaunting, compared to estimates under 50 percent. However, a review of the data shows significantstatistical anomalies and discrepancies. For example, net enrolment was 131 percent for Parbatdistrict and 114 percent for 11 districts in the Western Hill area. On the other hand, a study ofearly grade dropout in 20 sample schools shows an average attendance of 46-47 percent, with a lowernet enrolment.
- 135 -
to 79 percent for the Hills Urban non-poor.9'/ Gross enrollmentis estimated at 26.9 for lower secondary and 19.5 percent forsecondary schools ror girls; and at 52.1 and 44.3 respectively forboys. Overall, secondary school enrollment is 13 percent for theTerai rural poor and 49 percent for Hills urban non-poor.
* School outcomes need to be improved. Only 35 percent of thoseenrolled in the first grade are promoted to the second grade, andthe completion rate in the primary school is 35 percent, half theaverage for Asia. The average pass rate for the secondary schoolleaving certificate (SLC) was 35 percent in FY89-FY91. Theaverage primary school completion cycle is 12 years instead of 5,and in the secondary schools, the actual average instruction yearstaken to pass the SLC is 12.5 instead of 5 as expected.
* There are imbalances in the allocation of resources among thevarious levels of the education system. The percentage of totaleducation expenditure spent on primary education is 46-48 percent,which is in the range of the LDC average of 40-50 percent (48percent for Asia). However, secondary education appears under-funded (Table 5.20), with a share of 14 percent compared to anaverage of 31 percent for Asia. The share of higher education, onthe other hand, is 25 to 28 percent (23 percent in FY91).
* Education financing depends mostly on local resources, and itsshare of external aid has been lowest among all sectors. Itreceived 2.5 percent of project aid in FY75-FY80 and less than 5percent in the eighties, compared to 20 percent for agricultureand 36.8 percent for transport. Education's share of thedevelopment budget increased from 10.7 percent in FY80 to 16.4percent in FY92-FY93; however, the share from total Governmentspending, including regular expenditures stagnated at 10.1 percentfor the twelve year period ending FY92. This is equivalent to 2.2percent of GDP, which is at the low end of the Asian average ofabout 3 percent. Sector expenditures increased to 13.6 percent oftotal Government spending or about 2.9 percent of GDP in FY93, andthis increase has to be sustained to have Nepal close to themiddle group of LDCs.
The EP and Sector Obiectives
5.88 The principal sector objectives of the EP are over-ambitious: toachieve 90 percent enrollment rate in the primary school system, providesecondary education to 45 percent of the children in grades 6-10, make 1.4million adults literate through adult literacy programs and increase thenumber of female teachers. The approach to the sector's development is to:(i) make Basic and Primary Education (BPE) accessible to all; (ii) expandsecondary education opportunities; (iii) increase the supply of technical
91 Nepal: Poverty and Incomes Study, 1991, The World Bank, p.21. Survey, 1989.
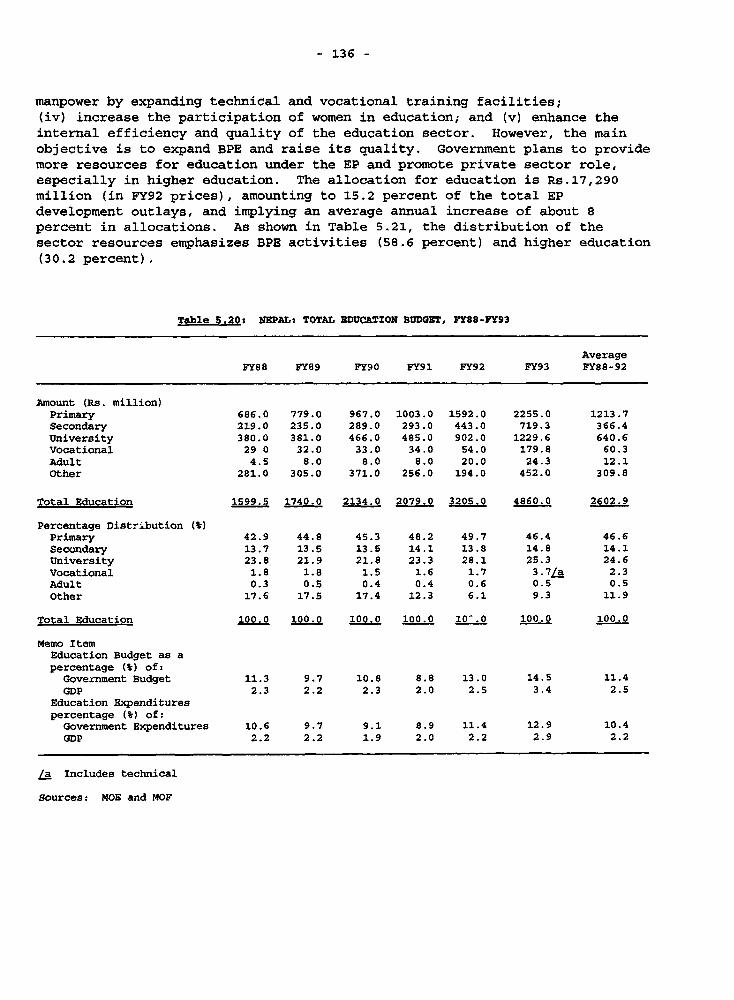
- 136 -
manpower by expanding technical and vocational training facilities;(iv) increase the participation of women in education; and (v) enhance theinternal efficiency and quality of the education sector. However, the mainobjective is to expand BPE and raise its quality. Government plans to providemore resources for education under the EP and promote private sector role,especially in higher education. The allocation for education is Rs.17,290million (in FY92 prices), amounting to 15.2 percent of the total EPdevelopment outlays, and implying an average annual increase of about 8percent in allocations. As shown in Table 5.21, the distribution of thesector resources emphasizes BPE activities (58.6 percent) and higher education(30.2 percent).
Table S.20: NEPALs TOTAL EDUCATION BUDGET, FY88-FY93
AverageFY88 FY89 FY90 FY91 FY92 FY93 FY88-92
Amount (Rs. million)Primary 686.0 779.0 967.0 1003.0 1592.0 2255.0 1213.7Secondary 219.0 235.0 289.0 293.0 443.0 719.3 366.4University 380.0 381.0 466.0 485.0 902.0 1229.6 640.6Vocational 29 0 32.0 33.0 34.0 54.0 179.8 60.3
Adult 4.5 8.0 8.0 8.0 20.0 24.3 12.1Other 281.0 305.0 371.0 256.0 194.0 452.0 309.8
Total Education 1S99.S 1740.0 2134.0 2079.0 3205.0 4860.0 2602.9
Percentage Distribution (M)Primary 42.9 44.8 45.3 48.2 49.7 46.4 46.6Secondary 13.7 13.5 13.5 14.1 13.8 14.8 14.1University 23.8 21.9 21.8 23.3 28.1 25.3 24.6Vocational 1.8 1.8 1.5 1.6 1.7 3.7/a 2.3Adult 0.3 0.5 0.4 0.4 0.6 0.5 0.5Other 17.6 17.5 17.4 12.3 6.1 9.3 11.9
Total Education 100.0 100.0 100.0 100.0 10^.0 100.0 100.0
Memo ItemEducation Budget as apercentage (t) of:
Government Budget 11.3 9.7 10.8 8.8 13.0 14.5 11.4
GDP 2.3 2.2 2.3 2.0 2.5 3.4 2.5Education Expenditurespercentage (e) of:
Government Expenditures 10.6 9.7 9.1 8.9 11.4 12.9 10.4GDP 2.2 2.2 1.9 2.0 2.2 2.9 2.2
/a Includes technical
Sources: MOE and MOF
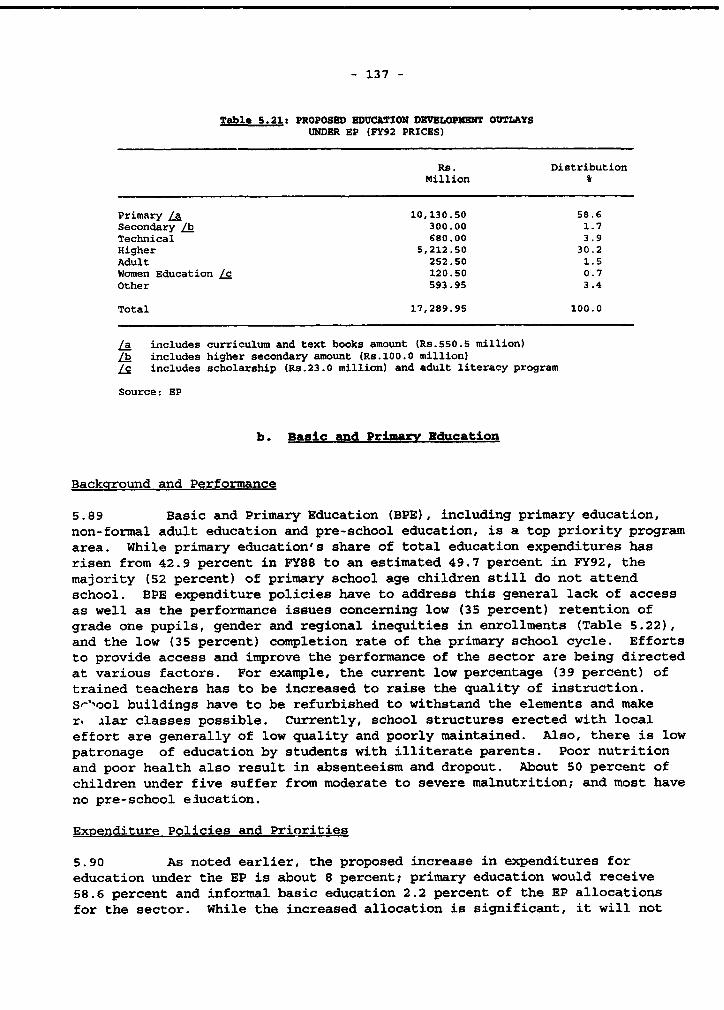
- 137 -
Table 5.21: PROPOSBD EDUCATION DEVBLOPMENT OUTLAYSUNDER EP (FY92 PRICES)
Rs. DistributionMillion S
Primary /a 10,130.50 58.6Secondary lb 300.00 1.7Technical 680.00 3.9Higher 5,212.50 30.2Adult 252.50 1.5Women Education /c 120.50 0.7Other 593.95 3.4
Total 17,289.95 100.0
/a includes curriculum and text books amount (Rs.550.5 million)/b includes higher secondary amount (Rs.100.0 million)/c includes scholarship (Rs.23.0 million) and adult literacy program
Source: EP
b. Basic and Primary Education
Backcrround and Performance
5.89 Basic and Primary Education (BPE), including primary education,non-formal adult education and pre-school education, is a top priority programarea. While primary education's share of total education expenditures hasrisen from 42.9 percent in FY88 to an estimated 49.7 percent in FY92, themajority (52 percent) of primary school age children still do not attendschool. BPE expenditure policies have to address this general lack of accessas well as the performance issues concerning low (35 percent) retention ofgrade one pupils, gender and regional inequities in enrollments (Table 5.22),and the low (35 percent) completion rate of the primary school cycle. Effortsto provide access and improve the performance of the sector are being directedat various factors. For example, the current low percentage (39 percent) oftrained teachers has to be increased to raise the quality of instruction.S^'-ool buildings have to be refurbished to withstand the elements and maker. zlar classes possible. Currently, school structures erected with localeffort are generally of low quality and poorly maintained. Also, there is lowpatronage of education by students with illiterate parents. Poor nutritionand poor health also result in absenteeism and dropout. About 50 percent ofchildren under five suffer from moderate to severe malnutrition; and most haveno pre-school education.
Expenditure Policies and Priorities
5.90 As noted earlier, the proposed increase in expenditures foreducation under the EP is about 8 percent; primary education would receive58.6 percent and informal basic education 2.2 percent of the EP allocationsfor the sector. While the increased allocation is significant, it will not
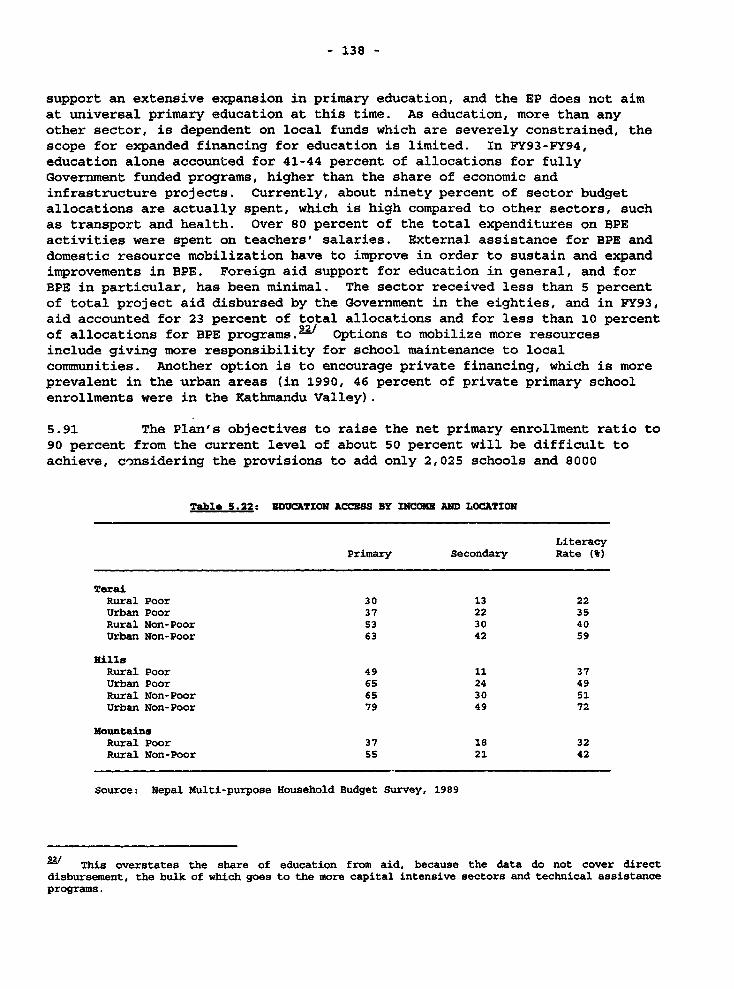
- 138 -
support an extensive expansion in primary education, and the EP does not aimat universal primary education at this time. As education, more than anyother sector, is dependent on local funds which are severely constrained, thescope for expanded financing for education is limited. In FY93-F'Y94,education alone accounted for 41-44 percent of allocations for fullyGovernment funded programs, higher than the share of economic andinfrastructure projects. Currently, about ninety percent of sector budgetallocations are actually spent, which is high compared to other sectors, suchas transport and health. Over 80 percent of the total expenditures on BPEactivities were spent on teachers' salaries. External assistance for BPE anddomestic resource mobilization have to improve in order to sustain and expandimprovements in BPE. Foreign aid support for education in general, and forBPE in particular, has been minimal. The sector received less than 5 percentof total project aid disbursed by the Government in the eighties, and in FY93,aid accounted for 23 percent of total allocations and for less than 10 percentof allocations for BPE programs.-/ Options to mobilize more resourcesinclude giving more responsibility for school maintenance to localcommunities. Another option is to encourage private financing, which is moreprevalent in the urban areas (in 1990, 46 percent of private primary schoolenrollments were in the Kathmandu Valley).
5.91 The Plan's objectives to raise the net primary enrollment ratio to90 percent from the current level of about 50 percent will be difficult toachieve, cornsidering the provisions to add only 2,025 schools and 8000
Table S.22s EDUCATION ACCESS BY INCOME AND LOCATION
LiteracyPrimary Secondary Rate (&)
TeraiRural Poor 30 13 22Urban Poor 37 22 35Rural Non-Poor 53 30 40Urban Non-Poor 63 42 59
HillsRural Poor 49 11 37Urban Poor 65 24 49Rural Non-Poor 65 30 51Urban Non-Poor 79 49 72
MountainsRural Poor 37 18 32Rural Non-Poor 55 21 42
Source: Nepal Multi-purpose Household Budget Survey, 1989
-2/ This overstates the share of education from aid, because the data do not cover directdisbursement, the bulk of which goes to the more capital intensive sectors and technical assistanceprograms.
- 139 -
teachers. These targets will increase the teaching force and enrollments eachby 2 percent a year during the Plan period, and given population growth, theyare not likely to expand access or raise the enrollment ratio unlesssignificant improvements occur in dropout and repetition rates. The schoolsare already over-crowded, especially in grades one and two, and the averagepupil teacher ratio is 36:1. If only 12 percent of the Government budget isallocated to education, the full expansion in BPE activities proposed in theBPE Master Plan, will raise BPE's share of the education budget to 82 percentby FY95 and 74 percent by FY96-FYOO; this is not compatible with otherprograms, such as higher education which currently accounts for close to 30percent of the sector's resources.
5.92 The focus of basic and primary education (BPE) activities is toimprove the efficiency and equity of the existing system through variousinterventions, including the Basic and Primary Education Project (BPEP) andPrimary Education Development Project (PEDP). These interventions emphasizeraising the retention of students, especially after grades one and two;reducing dropout and repetition rates; raising the completion rate for theprimary school cycle; and bridging the gender gap in performance. Reducingthe dropout and repetition rates by 20 percent, for example, will raise theenrollment ratio from the current 48 to -bout 60 percent. Expanded resourcesare also needed to raise efficiency, which will involve the introduction ofnew curriculum and revised textbooks, improvements in physical structure ofschools, training of teachers, improved management of the system throughbetter organization of supervision and support for equity programs for women.Free textbooks are provided to all pupils in grades 1-3 and to girls in grades4 and 5. A special scheme to train female teachers and aid girls from poorhouseholds has been introduced as school fees are often high enough to preventthe very poor, especially girls from attending school. The allocation for theentire BPE, including the primary school system and the various interventionsunder the EP, is about Rs.10,1 billion. BPE is dominant in the Core Programof the FY94 budget which will receive priority claim on resources. The BPEactivities covered by the Core include Primary Education program (PEP), Basicand Primary Education Project (BPEP) and the Primary Education DevelopmentProject (PEDP), which together accounted for 21.3 percent of the localresources needed for the entire Core development program.
5.93 Some progress has been made in recent years in improving programmanagement and in absorbing resource allocations effectively. This is shownto some extent by the ability of the implementing units of the BPS project tointroduce the first year of the new curriculum, provide new textbooks andtrain teachers. Also, a complex planning and delivery system to provideflexible approaches to constructing primary school classrowms is beingdeveloped. This performance reflects the leadership of the projectimplementation unit, the availability of a small cadre of well trainedprofessionals from the pilot primary education project and the central
- 140 -
priority accorded to BPE by the Government.,' While it is too early tojudge the results, the outcome of an earlier pilot project is promising. Forexample, students in the pilot project scored 3 times as much as non-pilotstudents. However, despite the satisfactory institutional performance so far,there is scope to improve the management of resources. Overall capacity isfragile as the professionals are few and require technical support. There isa perception that better school supervision could improve detection ofinflated enrollments; and this will help reallocate teaching staff and otherresources more effectively. The strengthening of resource management capacityis continuing with the implementation of BPEP and PEDP, through workshops,exposure of leaders to schemes in other countries and technical assistance.
5.94 In the area of non-formal education, the Plan target is to make anestimated 1.4 million adults literate. This is a high target to attain withRs.460 million, about 2.7 percent of allocations, which represents no increaserelative to the SFYP. While past programs have been successful in attractingmore women than men and Nepal has a foundation of good cadres and materialsfor adult education programs, a broad-based delivery system is yet to beorganized.
c. Secondarv Education
Background and Performance
5.95 Secondary school education is divided into lower secondary (grades6-8) and secondary (grades 9-10). Higher secondary (grades 11 and 12) isprovided in the university. There were over 4,000 lower secondary schools and2,000 secondary schools in 1991 with a total enrollment of 773,808 of whom 30percent were girls. There are three types of secondary schools in Nepal,namely, Government-aided schools (GS); community schools (CS), usuallygovernment-aided primary schools upgraded to lower secondary and secondary;and private schools (PS). The GS serve about 78 percent of the enrolledstudents; and the CS serve 15 percent. The CS are at the bottom of thesecondary school system in terms of resources and school outcomes, while theelite PS are at the top with only about 7 percen' of the students. Access tosecondary education is limited. The gross enrollment ratio for the secondaryschool system was 36 percent in 1991, and the projected enrollment ratio underthe EP is 43 percent. The gross enrollment ratio for girls was estimated at26.9 percent in lower secondary and 19.5 percent in secondary compared to 52.1percent and 44.3 percent for boys. The enrollment ratio in rural Terai was 13percent, while that of urban Hills was 49 percent. The average pass rate forthe secondary school leaving certificate (SLC) was 35 percent in FY89-FY91.The pass rate for regular candidates in the SLC examination was only 25percent in 1991 and 32 percent in 1992. In the same years, the private
The first Primary Education Project (PEP) implemented from 1984-92 strengthened theadministrative capacity of the Ministry of education. The unit developed in implementing the PEPhas been absorbed by the ministry to help manage basic education programs. See The PEP CompletionReport, February 1993.
- 141 -
schools pass rates were 79 percent and 81 percent. In 1992, the CS pass ratewas 24 percent, lower than the GS pass rate of 29 percent. Teachers areunder-qualified; in FY91, for example, only 20 percent of teachers haduniversity degrees, and the secondary school curriculum is obsolete.
Expenditure Issues and Reforms
5.96 Secondary education is seriously under-funded. The average shareallocation for secondary education from the total education budget was 13.6percent during FY88-FY92, compared to an average of 31 percent for Asia, whilethe allocation to university education was 28 percent. Private financing(parents and community) accounted for about 74 percent of total nationalresources devoted to secondary education. The PS are privately financed, andsome community schools are starting to receive one or two teaching positionspaid for by the Government. Thus, most of the Government financing forsecondary education goes to the GS. Recently, the Government announced apolicy of free secondary education and it is implementing it for grades 6 and7 in GS. It is highly doubtful Lhat such a policy is affordable andsustainable. Moreover, as the policy does not promote increased efficiency,quality and equity in government-aided and community schools, availableGovernment funds should be reallocated on a priority basis to the reform ofcurricula, examinations and textbooks, as well as to improved teacherdevelopment and supervision programs, all of which are urgently needed.Efficiency could be further improved with measures to achieve cost savings,such as the introduction of the higher secondary education reform. Targetingof Government programs at specific groups would benefit students in thebackward rural and remote areas, girls and other educationally disadvantagedgroups. In order to compensate for the low levels of public investment, theGovernment may need to provide further incentives for the establishment andoperation of private and community schools. Finally, additional Governmentresources will need to be allocated to the secondary sector just to keep upwith enrollment growth.
d. Tecbnical and Vocational Education
Introduction and Background
5.97 Technical and vocational education (TVE) received 1.7 percent ofeducation sector allocations during FY88-FY92, and this will expand to 3.9percent under the EP to produce a target of 2595 TVE graduates. Currently,there are seven technical institutions under the Council for TechnicalEducation and Vocational Training (CTEVT). Total enrollment was 1025 in1992,94/ and about one-fifth or less of the places are occupied by females.
9/ In addition, there are other agencies providing VTE, e.g., the labor supply centers under theDepartment of Labor; the training centers and institutions under the Ministry of Agriculture, Cottageand Small Industry, Health and Tourism, Lard Reform and Forestry; technical institutions and tradeprograms under Tribhuvan University. This section deals only with the institutions managed byCouncil for Technical and Evaluation Council and included in the budget of MOF.

- 142 -
Twenty-eight percent of all students were registered in agricultural courses,20 percent in construction, 17 percent in health and sanitary technology andthe rest in assorted programs, including mechanics, tailoring and plumbing.Girls are registered mainly in health and agriculture. A recent tracer studyfound that 60 percent of graduates got jobs after a year, though this variedamong schools.-/
Expenditure Policies
5.98 The main concern about expenditures on technical and vocationaleducation is the high cost of producing graduates. In FY92, the average costper trainee was estimated at Rs.36,028 with a range of Rs.14,700 to Rs.56,890,several times more than the cost of secondary education. This high cost isattributed to various factors. The average three-year duration of courses isconsidered too long and is equivalent to a college degree program. Manytechnical schools have low trainee to staff ratios, ranging from 6:1 to 12:1,with a mean of 8:1 for instructional staff, usually about 3:1 for totalstaff.-961 There is no indication that such small class sizes have promotedbetter outcomes. Also, technical schools operating under CTEVT do not chargetuition; in fact, most provide stipends in the range Rs.300-400 permonth.97- It is widely felt that the stipends may be encouraging somestudents to stay longer at the institutions. While the stipends wereappropriate in the initial stages because of the low social esteem of VTEgraduates and lack of demand for VTE training, the situation needs to bereviewed, especially since some private VTE programs have attracted students,while charging fees.
5.99 The National Education Commission (NEC) has recommended changes inthe organization of technical and vocational education, and the Governmentconsiders the technical education and vocational training project as a toppriority activity. The NEC has proposed that special emphasis be given toproviding professional and technical education at the higher secondary (HS)level to help HS graduates find employment in their local communities. TheGovernment's goal is to establish one vocational school in each of the 75districts in Nepal to provide employable skills within the framework of theregular school system. So far, several previous attempts to implement asystem-wide vocational training have not succeeded. The multipurpose schoolmovement in the 1960s and the vocational education system envisaged in the NewEducational System Plan in the 1970s failed because of lack of funding andmeager results: linkages with the labor market were weak; students lackedoccupational motivation, and employment opportunities corresponding to the
-9/ Employment levels vary among graduates substantially. For example, in Balajiu Tech School - therate of employment was 87.1, but only 33% in Lahan Techni._al School; in Dhankuta and Jiri TechnicalSchools, the employment rate was about 45%.
-/ The Labor Supply Centers target trainee to instructor ratios of 10:1 for most trades and as lowas 5:1 for some.
Stipend for full-time training in the Labor Supply Centers are typically in the range of Rs.200-300/month.

- 143 -
training were not there.9/ If the aim of having technical and polytechnicstreams in the higher secondary system is to ensure that graduates from highersecondary schools can find employment in the local community, then the locallabor market has to be examined carefully before implementing the proposal.To be sustainable, the training institutions would have to develop asorganizations which are beneficial to the graduates and to industry, and thiswould require enlisting private sector support for the effort. In thiscontext, based on the preliminary results of Lamjung technical school whichare considered promising, reforms need to stress courses which are of shortterm nature; students paying fees, instead of receiving stipends; and atraining which has practical relevance for students.
e. Hicrher Education
5.100 With the exceptlon of a small Sanskrit University and a newprivate university, Tribhuvan University is the principal provider of highereducation in Nepal. It has 195 campuses, of which 65 are public and 130private. Enrollment in the four-year Bachelor's degree and the two-yearMasters degree programs has risen from 22,765 in 1975 to 113,792 in 1991; 62.8percent of the students, however, are in first two Certificate yearsequivalent to grades 11-12 in other countries so that only 37.2 percent areactually receiving higher education. 99/ Since students spend on average twoyears less in higher education than their counterparts in most othercountries, Bachelor's degree holders in Nepal have only 14 years of schooling.A Master's degree from Tribhuvan University is equivalent to a Bachelor'sdegree elsewhere. More than 80 percent of students take courses inhumanities, social sciences, and law; academic specialization does not existper se (Table 5.23). If Certificate-level students are excluded, the grossenrollment ratio for higher education is only 1.95 percent as compared to themedian enrollment ratio of 3.7 percent of other low-income countries.
5.101 Expenditures on the university, like those on primary andsecondary education are low relative to GDP. In 1990, only 0.44 percent ofGDP was devoted to higher education. This was much below the internationalaverage of 0.7-1.2 percent for higher education. If Certificate-levelstudents were excluded, the proportion of GDP devoted to higher educationwould be a nominal 0.15 percent. However, in the existing system, given thetotal resources allocated to education, the share of higher education is
- The Technical Schools operating today under the CTEVT are not directly comparable with theearlier attempts to vocationalize general education because they are outside the regular schoolsystem and because they have some linkage with industry.
J If Certificate Level or Higher Secondary students (grades 11 and 12) are excluded, the grossenrollment ratio for higher education is only 1.95 percent as compared to the median enrollment ratioof 3.7 percent of other low income countries. The proportion of GDP devoted to higher educationwould be only o.15 percent as compared to an international average of 0.7-1.2 percent. But becauseNepal's tax effort and total allocations for education have been well below the internationalaverages, higher education actually obtains a disproportionate share of resources available foreducation.
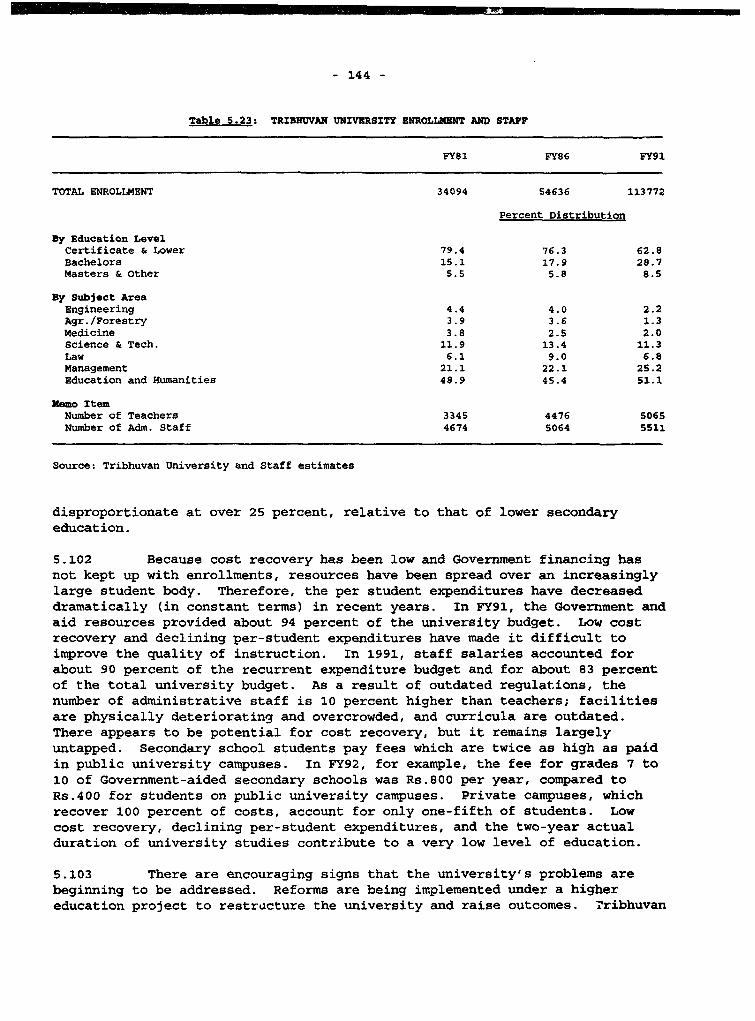
- 144 -
Table 5.23: TRIBTHVAN UNIVRRSITY ENROLLMENT AND STAFF
FY81 FY86 FY91
TOTAL ENROLLMENT 34094 54636 113772
Percent Distribution
By Education LevelCertificate & Lower 79.4 76.3 62.8Bachelors 15.1 17.9 28.7Masters & Other 5.5 5.8 8.5
By Subject AreaEngineering 4.4 4.0 2.2Agr./Forestry 3.9 3.6 1.3Medicine 3.8 2.5 2.0Science & Tech. 11.9 13.4 11.3Law 6.1 9.0 6.8Management 21.1 22.1 25.2Education and Humanities 48.9 45.4 51.1
Memo ItemNumber of Teachers 3345 4476 5065Number of Adm. Staff 4674 5064 5511
Source: Tribhuvan University and Staff estimates
disproportionate at over 25 percent, relative to that of lower secondaryeducation.
5.102 Because cost recovery has been low and Government financing hasnot kept up with enrollments, resources have been spread over an increasinglylarge student body. Therefore, the per student expenditures have decreaseddramatically (in constant terms) in recent years. In FY91, the Government andaid resources provided about 94 percent of the university budget. Low costrecovery and declining per-student expenditures have made it difficult toimprove the quality of instruction. In 1991, staff salaries accounted forabout 90 percent of the recurrent expenditure budget and for about 83 percentof the total university budget. As a result of outdated regulations, thenumber of administrative staff is 10 percent higher than teachers; facilitiesare physically deteriorating and overcrowded, and curricula are outdated.There appears to be potential for cost recovery, but it remains largelyuntapped. Secondary school students pay fees which are twice as high as paidin public university campuses. In FY92, for example, the fee for grades 7 to10 of Government-aided secondary schools was Rs.800 per year, compared toRs.400 for students on public university campuses. Private campuses, whichrecover 100 percent of costs, account for only one-fifth of students. Lowcost recovery, declining per-student expenditures, and the two-year actualduration of university studies contribute to a very low level of education.
5.103 There are encouraging signs that the university's problems arebeginning to be addressed. Reforms are being implemented under a highereducation project to restructure the university and raise outcomes. .rribhuvan
- 145
University is to adopt measures to match enrollment growth to availablecapacity through campus-level decisions by administrators and entranceexaminations. Other planned reforms are to add one more year to universitystudies, decentralize authority at the campus level, enforce more budgetaryaccountability for campus-level services and promote campus-level resourcemobilization in order to improve the quality of instruction. Actions havebeen initiated to increase the university's internal resource mobilizationgradually from about 10 percent to about 20 percent over the next six years.However, earlier fee increases were met with student unrest, and this mayprove an ambitious target. The Government is encouraging private sectorparticipation and establishment of new private campuses for higher andtechnical education. Also, the Ministry of Education and Culture andTribhuvan University are developing a joint plan to transfer the twoCertificate years to secondary education as grades 11 and 12, offering theprospect of significant short term reductions of the size of the student body.A semi-autonomous Council of Higher Secondary Education has been constitutedto develop grades 11 and 12 with new curricula, trained t-achers, andappropriately equipped space in secondary schools. Sinc ait costs insecondary education are typically lower than unit costs -L. -iigher education,transferring these two years to secondary education should reduce universityexpenditures provided that staff, buildings, and budgets are reallocatedproportionately to higher secondary education. These reallocations aresensitive, and the university requires significant inputs to restore qualityof physical facilities to an acceptable level. The Government is proceedingvery cautiously.
f. Conclusion
5.104 First, more than other sectors, education requires substantialrecurrent cost financing. Yet, the manner of budgetinc for education obscuresthis financing implications of the sector's activities. The existing practiceof providing O&M for secondary schools in the regular budget, while providingO&M for primary and higher education under the development budget obscures therecurrent cost financing commitments on resources and the scope for financingnew programs. This undermines the urgency for more local resourcemobilization for development. Thus, the budget process needs to berestructured to make transparent the recurrent cost financing commitments ofsocial sector programs and reveal the actual size of revenue surplusesavailable for other activities. Progress in restructuring the budget wouldhelp underline the urgency of reforms to mobilize more revenues and the needfor more direct donor financing for recurrent costs.
5.105 Second, the recent increases in allocations for education and thepriority attached to Basic and Primary Education activities need to besustained; and more resources need to be provided for Government aidedsecondary and community secondary schools. These increases are warranted bythe estimated high ROR, the low sector share of resources in the past decadeand the importance of human resource development programs for growth andpoverty alleviation objectives. The increased financing is needed to improve

- 146 -
quality: to raise the primary school completion rate from the current level of35 percent; increase the proportion of trained teachers from the current ratioof a third with special emphasis on female teachers; improve access toeducation for girls; renovate deteriorating school facilities; improve schoolsupervision; and reform the obsolete curriculum. Also, while progress isbeing made in developing the capacity to manage the existing system, suchcapacity is still fragile. The skilled professionals managing the qualityimprovement program are few and require technical assistance.
5.106 Various studies have proposed a real increase of about 8 percentin education expenditures, and the sector allocation under the EP (Rs.17,290million) repre3ents about 8 percent real increase (FY92 base). A higherincrease would have to be considered in the context of institutional capacityas well as the claims of other sectoral programs, especially power. Giventhat the resource situation is likely to be more limited than envisaged underthe Plan, correcting for imbalances in allocations among programs within thesector would help to ensure the financing targets of BPE activities.
5.107 Third, reforms in higher education which have already started atTribhuvan University need to be supported with effective action in secondaryeducation. For example, the transfer of the two Certificate years from theUniversity to the normal secondary stream would need to be supported withincreased allocations for secondary schools, which are considerably under-funded. The transfer needs to be planned carefully so that most students whopass the Secondary School Certificate examination can continue grades 11 and12 at or near their secondary schools and at much lower Government andparental cost than is currently the case. Appropriate and attractivecurricula must be implemented, teachers (excess university professors to theextent possible) must be allocated and trained, and space must be found eitherby building additions to secondary schools that have grounds available or bytransferring the smaller university campuses to secondary education. Also,the current policy of increasing subsidies for the salaries ofsecondary-school teachers starting from grade 6 needs to be reviewed in thecontext of measures necessary to improve the quality of the system: to supportteacher pre-service and in-service training with emphasis on Government-aidedsecondary and community secondary schools.
5.108 Fourth, other proposals to restructure higher education need to befollowed through. Some of the measures under active consideration involveusing entrance examinations to screen students and raise outcomes,decentralizing university administration to give more responsibility andaccountability to campus level administrators, and reviewing the fee policyfor university students as well as the current policy of providing stipend fortechnical school students.

- 147 -
F. HEALTH AND FAMILY PLAMNING
a. Introduction and Backaround
5.109 The prospects for economic growth and poverty alleviation in Nepalare highly susceptible to the health status and rapid levels of populationgrowth. The rapidly expanding population is exerting pressure on scarceforest and agricultural land resources as well as on essential utilities andservices, and it has consequences for sustainable economic growth andenvironmental quality. The recent Poverty and Income Study concluded that,while there is no easy strategy for poverty alleviation in Nepal, the cost ofcontinuing low growth and of wrong public policy - especially with respect tocurbing population growth - is a stagnation of per capita incomes at probablyUS$180 and an additional 15 million absolute poor over the next two decades.The report argues that all else will be meaningless in the absence of aneffective program to limit population growth.100/
5.110 The official growth rate of Nepal's current population of 19million is estimated to be 2.1 percent, based on the FY91 census. The totalfertility rate (average number of children a woman can be expected to bearover her entire reproductive life) is estimated to be nearly 5.7; and abouthalf the population is young at below 15 years of age, with enormous potentialfor continued rapid future population growth. The contraceptive prevalencerate remains about 24 percent despite over two decades of official efforts tospread the practice of family planning. Thus, even under the most optimisticprojections of future fertility trends, the total population is likely todouble in the next 29 years and much sooner if fertility decline does notaccelerate substantially. Also, the infant and child mortality rates (102 and165 respectively per thousand) are among the highest in the world; lifeexpectancy is among the lowest, at 54 years; the maternal mortality rate of8.5 per 1000 live births, is one of the highest; and nutrition indicatorsremain in a critical range.
5.111 Government has recognized the importance of health and familyplanning (HFP) programs for improving health status and raising productivity,while limiting population growth and increasing per capita income. Despitemeager resources, a good deal has been achieved over the past forty years; andin fact, the current indicators of health status represent some improvementover the past 40 years. The Government's efforts have led to the expansionof health service delivery institutions over the past decades. Currently,there are a total of 113 hospitals (Table 5.24). The Government accounts for67 percent of total hospital beds, including 77 under the Ministry of Health(MOH) hospitals and 7 military and police hospitals. Missions control 9, NGOs12 and the private sector the rest. MOH also operates 18 health centers and816 health posts. Despite the growth in health facilities, general access islimited. The population to hospital bed ratio, for example, is 3848 and like
See Nepal "Poverty and Incomes". World Bank, 1991; page xiii.
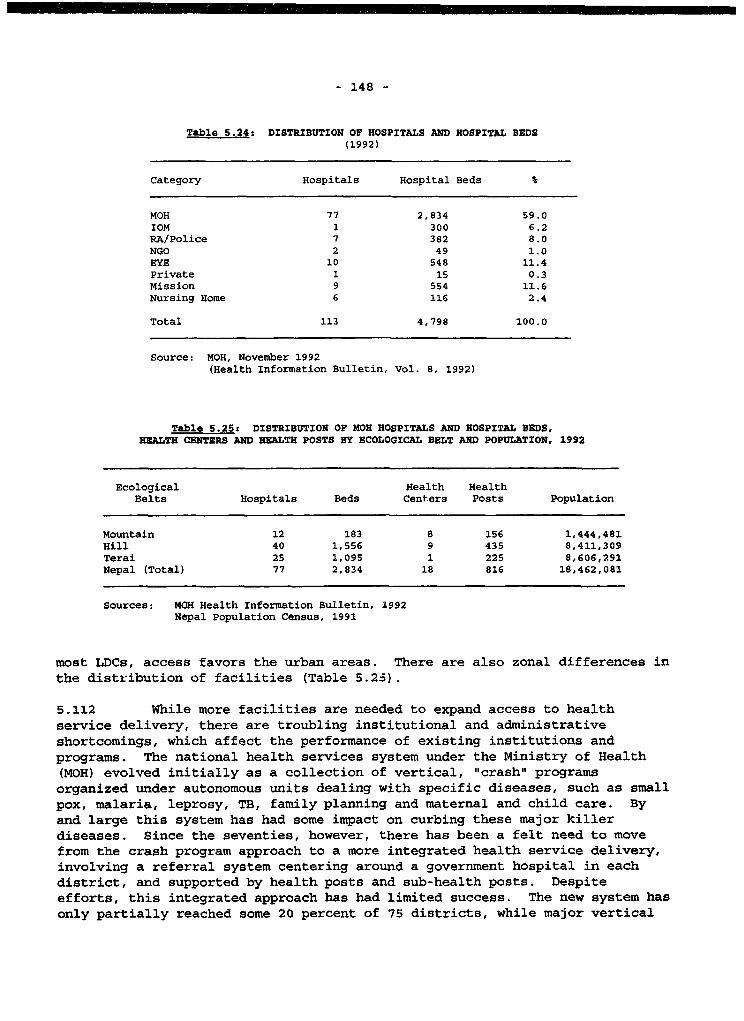
- 148 -
Table 5.24: DISTRIBUTION OF HOSPITALS AND HOSPITAL BEDS(1992)
Category Hospitals Hospital Beds %
MOH 77 2,834 59.0IOM 1 300 6.2RA/Police 7 382 8.0
NGO 2 49 1.0EYE 10 548 11.4Private 1 15 0.3Mission 9 554 11.6Nursing Home 6 116 2.4
Total 113 4,798 100.0
Source: MOH, November 1992
(Health Information Bulletin, Vol. 8, 1992)
Table 5.25s DISTRIBUTION OF MOH HOSPITALS AND HOSPITAL BEDS,HEALTH CENTERS AND HEASTR POSTS BY ECOLOGICAL BELT AND POPULATION, 1992
Ecological Health HealthBelts Hospitals Beds Centers Posts Population
Mountain 12 183 8 156 1,444,481Hill 40 1,556 9 435 8,411,309Terai 25 1,095 1 225 8,606,291Nepal (Total) 77 2,834 18 816 18,462,081
Sources: MOH Health Information Bulletin, 1992Nepal Population Census, 1991
most LDCs, access favors the urban areas. There are also zonal differences inthe distribution of facilities (Table 5.2,).
5.112 While more facilities are needed to expand access to healthservice delivery, there are troubling institutional and administrativeshortcomings, which affect the performance of existing institutions andprograms. The national health services system under the Ministry of Health(MOH) evolved initially as a collection of vertical, "crash" programsorganized under autonomous units dealing with specific diseases, such as smallpox, malaria, leprosy, TB, family planning and maternal and child care. Byand large this system has had some impact on curbing these major killerdiseases. Since the seventies, however, there has been a felt need to movefrom the crash program approach to a more integrated health service delivery,involving a referral system centering around a government hospital in eachdistrict, and supported by health posts and sub-health posts. Despiteefforts, this integrated approach has had limited success. The new system hasonly partially reached some 20 percent of 75 districts, while major vertical

- 149 -
programs persist with considerable autonomy. In July 1993, the Governmentannounced the long-awaited reorganization of the MOH, officially integratingprimary health care delivery throughout the country. However, it will taketime before the new system can become fully operational.
Government Expenditures
5.113 MOH's expenditures on health (Table 5.26) are low and have beendeclining, from 4.3 percent of total Government expenditures in the eightiesto 3.3 percent in FY91-FY92. Foreign aid accounts for 35-40 percent offinancing; however, a third of the aid representing an estimated 15 to 20percent of the development budget is spent outside MOH's budget. Majorhealth expenditures made outside MOH's budget include: (i) allocations in theeducation sector budget for training and research at the Institute ofMedicine, which were equivalent to about 37 percent (Rs.445 million) of MOHexpenditures in FY93; (ii) user fees collected and retained by hospitals;(iii) the budgets of some 30 to 40 NGOs partially involved in HFP activitiesin Nepal, estimated at Rs.322 million or some US$70 million in FY91; and (iv)services provided by private and mission hospitals. Total public expenditureson health account for a little over one percent of GDP, which is lower than anaverage of 2.1 percent for the low income LDCs and over 9 percent for allLDCs. While Government financing is inadequate relative to notional demandfor health services, allocations are not fully spent, especially for thedevelopment budget (Table 5.26). An average 64 percent of the sectordevelopment budget was snent during FY90-FY92, lower than the average of over70 percent for the entire development budget. This reflects the institutionaland local fund limitations which are discussed later. However, the use of thebudget rise to over 90 percent in FY93. The approach to the Linancing ofhealth undermines continuity of programs. Over 70 percent of the sectordevelopment budget is recurrent in nature and require sustained financing
Table 5.26: TOTAL SXPZNDITUREB ON HEAL2H(Rs. Million)
----------Regular---------- --------Development---------- -----------Total Government----------% of
t of % of of TotalBudget Expenditure Budget Budget Expenditure Budget Budget Expenditure Budget Govt.Rxp
FY84 -- 137.2 -- 319.9 199.8 62.5 319.9 337.0 -- --
FY85 -- 161.4 -- 332.8 254.8 76.6 332.8 416.2 -- --
FY86 189.4 150.0 79.2 403.4 255.7 63.4 592.8 405.7 68.4 4.1PY87 200.4 182.5 91.1 379.6 309.2 81.5 580.0 491.7 84.8 4.3FY88 231.9 204.1 88.0 583.3 385.2 66.0 815.2 589.3 72.3 4.2FY89 268.7 251.1 93.4 819.0 616.0 75.2 1087.7 867.1 79.7 4.8FY90 318.6 296.6 93.1 614.9 393.8 64.0 933.5 690.4 74.0 3.5FY91 316.0 293.8 93.0 568.8 366.8 64.5 884.8 660.6 74.7 3.3FY92 427.0 410.9 96.2 591.6 387.2 65.4 1018.6 798.1 78.4 3.3FY93 473.2 468.4 88.4 741.4 683.0 92.1 1214. 1151.4 94.8 3.7FY94 529.9 -_ __ 931.5 - -- 1461.4 -- -- --

- 150 -
under the regular budget; yet more than half of the expenditures are parcelledinto projects under the development budget for financing by donors.Implementing these programs under the development budget has resulted inunreliable service delivery because financing is linked to the project cycle.
Sector Obiectives and Priorities
5.114 The main sector objectives are to: (i) reduce total fertility from5.7 to 4.5; (ii) lower maternal mortality rate from 8.5 to 7.5; (iii) raiselife expectancy from 54 to 61; and (iv) reduce infant mortality from 102 to80. The approach is to re-organize MOH and health service delivery andstrengthen primary health service delivery through a comprehensive referralstructure based on sub-health posts at the bottom up to health posts, primaryhealth centers, district and zonal hospitals, and to regional hospitals.Specific actions envisaged are to (i) establish 3,199 Sub-Health Posts at theVillage Development Committee level; (ii) build 103 Primaxy Health Centers,each under a doctor and with a three bed facility; (iii) expand the programfor immunization (EPI) against six diseases; and (iv) expand family planningservices to raise the contraceptive prevalence rate from an estimated 23 to 32percent. The sector allocation is Re.S,466 million, ..8 percent of EPexpenditures (Table 5.27), equivalent to about US$1.3 per capita a year (inFY92 prices) during the Plan period; and it represents a real increase ofabout 20 percent a year, compared to 12 percent in the eighties. The Planputs strong emphasis on preventive and promotive health services, which willreceive 76 percent of allocations; about half of this will go for familyplanning and maternal and child health (FP/MCH), and 38 percent would be forimmunization. Curative health care will absorb 16 percent of EP allocations;hospitals will account for 14 percent; and drugs 2 percent.
5.115 While Government rightly emphasizes primary health care, capacityto manage the rate of expansion envisaged, especially the planned expansion ofPHCs and SHPs is a serious concern. Besides the limited financial andpersonnel resources, the organizational structure is still unsettled, and thesituation of managerial personnel is in a state of flux. The scale ofexpansion also glosses over (i) the state of existing facilities, most ofwhich require refurbishing and upgrading; and (ii) the minimal performance ofthese facilities, which are largely under-funded and operate poorly. Thus,there is a need to follow a slower and a more realistic expansion of newhealth facilities, in particular, primary health care. The rest of thissection will review major expenditure programs, including health institutions,family planning, malaria eradication and immunization; and it will discussoptions to focus sector expenditures accordingly.
b. Health Service Institutions
5.116 The health service delivery institutions under MOH include 77hospitals and over 830 health centers and health posts. Primary health careprovided by these facilities accounted for 59 percent of the regular budget in

- 151 -
Table 5.27: NBPAL: SP FOR HFP(FY93-FY97)
Projects Rs.
A. Preventive and Promotive
1. PP and MCH 2,0082. Disease Prevention and Control 1,5953. Nutrition and Health Promotion 894. PHC Construction and Services 431
5. Epidemiology 20
Total 4,143 75.8(531) (72.2)
B. girative
1. Hospitals 7552. Health Laboratories 30
3. Drug Supply 404. Ayurvedic 40
Total 865 15.8(144) (19.6)
C. Research and Manpower Development
1. Training and Development 3532. Research 7
Total 360 6.6(35) (4.8)
D. Miscellaneous 98 1.8(25) (3.4)
TOTAL 5,466 100.0(735) (100.0)
Source: National Planning Commission, November, 1992
FY92-FY93, including 56 percent received directly and about 3 percent obtainedthrough the Regional Directorate in the form of medical supplies.Approximately 43 percent of allocations support mainly curative care suppliedby hospitals. In the case of the development budget, approximately 75 percentof allocations in FY92 and FY93 were provided for primary health care,compared to 25 percent for hospitals.
5.117 Since service delivery is labor intensive, personnel compensationdominates the cost structure of health service institutions (Table 5.28). InFY93, for example, personnel compensation accounted for 87 percent of thecosts of district health offices and health posts, 71 percent for hospitalsand 72 percent for health centers. Like the regular budget, the coststructure of development programs is dominated by personnel pay; 70 percent of

- 152 -
Table 5.28: MOR RUOULAR BUDGET, PY93 (Rs. in Millions)
District Hospitals (N = 61, i.e., excl. 14 Zonal Hospitals)
Categories Rs.
Salaries 50.0 71.4Allowances 8.5 12.1Food/Materials 4.8 6.8Equipment, Medicines 2.8 4.0Other 3.9 5.6
Total 70.0 100.0
Health Centers (N = 18)
Categories Rs.
Salaries 4.2 72.4Allowances 1.1 19.0Other Equipment, Medicine 0.1 1.7Other 0.4 6.9
Total 5.8 100.0
District Public Health Offices (75) and Health Posts (817)
Categories Rs.
Salaries 225.0 87.4Allowances 28.0 10.9Rent 0.7Medicines/Office 0.9 1.7Other 3.9
Total 257.5 100.0
Regional Health Directorates (N 5)
Categories Rs. %
Salaries 4.5 1S.2Allowances 0.6 2.0Medicines/Supplies 23.7 80.3Other 0.7 2.4
Total 29.5 100.0
Source: Internal MOH Estimates, August 1992

- 153 -
development resources are allocated to administration. Despite the high shareof staff compensation, there is shortage of skilled staff. The total manpowerfor MOH until recently exceeded 17,000; about half is permanent staffsupported by the regular budget, while the rest is temporary and financed fromthe development budget. About 40 percent of the 17,000 sanctioned posts areconsidered "administrative". As of 1992, the vacancy rate in MOH was 14percent on average, but 33 percent for doctors and 25 percent for healthassistants. Outreach worker coverage is currently 1 to 5,000 population,compared to 1 to 2,000 required for staff to visit a family once every twomonths. As a result of recent retrenchment and retirement of a large numberof staff and following the July 1993 reorganization of MOH, the critical massof managers and supervisors is lacking both at headquarters and in the field.Most vacancies for Auxiliary Nurse Midwives are not filled because the skillsare not available, and those available are not attracted to out stations,where they are needed the most. The size of the budget also limits staffing;for example, the hiring of 500 lower grade female Maternal Child HealthWorkers was stopped for nearly two years because of inadequate budget.Meanwhile, there is concern that the termination of a huge number of MOH stafflabelled as temporary and hired under the development budget will crippleservice delivery even more. With the recent measures to restructure theinstitutional set-up of the MOH, Government needs to give greater attention toaddressing these staffing issues, including recruitment, skill mix, retention,training and redeployment in order to improve the delivery of services.
5.118 Non-wage O&M costs are also under-funded. The total allocationfor medicine, including provisions for the central supplies held by theRegional Directorate, was equivalent to 6 percent of the regular budget inFY93 (Table 5.28). Although 80 percent of the Regional Directorate budget isearmarked for medicines and supplies for District Hospitals and Health Postsin the region, the amounts are considered meager compared requirements. TA/DAallowances, which are required to support operational travel are alsoinadequate; and this has restricted supervisory field visits and outreachprograms. Most often, the budget for TA/DA is allocated under the regularbudget, while the activities to be supported are covered in the developmentbudget. Since the regular budget is funded mostly from local funds, localfund constraints on TA/DA undermine the utilization of resources in thedevelopment budget. The raise in TA/DA announced in September 1993 will needto be sustained and adjusted further to alleviate this problem.
5.119 Aid resources for the development projects are oftenunder-utilized. This under-utilization intensified slightly in the last threefiscal years even as the development budget declined from a high of Rs.819million in FY89 to Rs.592 million by FY92. In FY92, for example, 65 percentof the development budget was actually spent, compared to 96 percent for theregular budget. While about 95 percent of the initial budget proposal wasapproved, only 75 percent of the approved budget was released, and 87 percentof the release was actually spent. Eight projects accounting for 15 percentof the development budget and 33 percent of foreign assistance disbursed anaverage 17 percent of allocations, and the lowest budget utilization rate was

- 154 -
Table 5.29: NEPAL: DBVZLOHN? BSUDGET (Rs. in thousands)CENTRAL AMD DISTRXCT ALLOCATXONS
Items FY92 FY93Central District Central District
1. Epidemiological andDisease Control 83,681 - 38,452 119,024
2. Disease Prevention 38,510 - 44,760 33,2983. Public Health Service 52,507 196,747 75,544 56,0954. PP and MCH 37,887 - 36,433 72,5135. Epidemiology 2,889 - 3,418 -
6. Health Promotion 3,738 - 2,556 -7. Training 4,942 - 13,809 22,9808. Lab Services 1,939 - 2,252 -9. Medicines, Instruments,
Supplies 86,598 - 9,139 -
10. Research 4,00n - - -
11. Central/RegionalHealth Services 9,:52 - 10,910 -
12. Construction(Hospital and PHC) 12,687 30,761 21,400 87,120
13. Health Assistance 33,000 - 25,000 -14. Hospitals (specified) 32,885 - 66,770 -
SUB-TOTAL 404,915 227,508 350,443 391,030
GRAND TOTAL 632,423 741,473
Sources: HMG 'Red Books,, FY91/92, FY92/93; Financial Comptroller's General Office (FCGO)
4 percent. The eight projects which show the least resource utilization cover
VD, Diarrhoea Disease, Nutrition, Goiter and Cretinism Control, Family
Planning Worker Program, Health Information Service, Primary Health Training
and Health Assistance Project. Some of these are training for family planning
and public health staff; supply of drugs, family planning devices, vitamin
capsules and other types of medicines. Stringent fund release procedures for
aid, inadequate local resource allocations to leverage aid and insufficient
allocations for staff travel have impeded the use of resources.
c. 3xDanded Prooram for Zmunixation (DPI)
5.120 Allocations for BPI accounted for 10.5 percent (Rs.78 million) of
the development budget in FY93, and 47 percent of this was aid. Immunization
started as a vertical program carried out by travelling teams of vaccinators,
and it has made significant impact since the mid-eighties. By 1990,
indications from districts show steady growth in coverage of all antigens,
almost exceeding 80 percent for DPT3, polio and BCG, 67 percent for measles
and 21 percent for TT2. On the whole, it appears that BPI has fared well
under integration and is making rapid and sustained progress; but the success
may have come at a cost for other preventive and promotive health services at
the outreach level. Assessments of Village Health Workers, performance, for
instance, seem to indicate that those (male) multi-purpose outreach workers
- 155 -
give priority to immunizations, for which supplies are mostly available (fromUNICEF), in preference to family planning and other preventive health measureswhich were less well understood, had limited resources and were difficult todeliver. There are now reasons to query the sustainability of the EPIprogram. UNICEF, its main financier, expects a growing proportion of the EPIprogram to be financed from domestic resources over the coming years. Unlessserious action is taken by HMG, the prospect might be a decline in thecoverage ana effectiveness of the EPI program.
d. Family Planning and Maternal and Child Realth
5.121 Systematic delivery of family planning and maternal and childhealth services (FP/MCH) started in the early seventies as vertical programswith external aid support. The program focussed on sterilization providedthrough mobile camps, which were easier to organize and deliver. The numberof procedures rose through the eighties, peaked at 68,000 in FY84, and fellsubsequently to less than 20,000 a year. The Contraceptive Prevalence Rate(CPR), that is, the proportion of women of reproductive age practicing someform of contraception, is estimated to have risen from 2 percent in 1976 to 7percent in 1981 and is currently close to 20 percent.10/ But this isbelow the rate required to achieve significant i.paet on population growthrates. Studies indicate that a CPR of 40 percent by the end of the centurywould be needed to bring down the population growth rate to 2 percent peryear, and a 60 percent CPR would be needed for the population to begin tostabilize. About 86 percent of all contraceptive use in 1986 wassterilization, performed mostly on older women. Even as of the 1991 nationalsurvey, nearly 80 percent of CPR was accounted for by sterilization.=/Though there has been a weak shift towards younger women, this has beenaccompanied by a sharp drop in the number of procedures. At the same time,studies indicate strong unmet demand for contraceptive use, about 32 percentof child bearing women in some studies.Q_/ The main reasons for thedecline in sterilization include concerns about potential abuse ofsterilization procedures, decline in mobile camps and lack of facilities instatic clinics. Other reasons are a desire to emphasize non-terminal forms ofbirth control, which are yet to take-off, and lack of compensation for theoperating physicians.
5.122 The new approach to FP/MCH service delivery is to provideintegrated services through multi-purpose workers. The health aspect of theprogram is the erection of a four-tier referral system comprising thesub-health posts, health posts, primary health centers and governmenthospitals. Health post services will be expanded to include family planning,
- H/ Estimates vary and include these practicing traditional methods of contraception.
n2j Nepal Fertility, Family Planning and Health Survtey (NFHS 1991).
L03/ See New ERA: "Factors Relat_.ng to Non-Use of Contraception Among Couples, with an Unmet Needfor Pamily Planning in Nepal", 1988.

- 156 ^
and sterilization services will be institutionalized gradually in staticfacilities, along with strengthening of mobile facilities for the immediatefuture. Also, manpower for FP/MCH will be expanded through outreach andtraining. In reality, progress has been slow, and until lately, integrationhas partially reached only 20 of the 75 districts in some form so far, andonly 12 of 75 districts provide sterilization on a year-round basis.
e. Malaria Eradication Program
5.123 In FY93,. the program accounted for 17 percent (Rs.126 million) ofthe sector development budget, and about half was aid. For 25 years, sincethe inception of the program, it has been totally dependent on aid for theprocurement and supply of insecticides and other physical inputs. Even withsubsequent Government financing support, the program has continued to dependon aid for the supply of insecticides. However, aid assistance for the sectoris diminishing. Current external commitment by DANIDA covers limited amountsof insecticides for two years of spraying high priority areas, starting in1992 as a bridging arrangement only, on the understanding that Nepal itselfwould provide the necessary supplies at the end of that period. HMG has toallocate sufficient resources for malaria control after 1994. This is amatter of grave concern in view of the resurgence of malaria in the southernlower altitude half of the country. In addition to the dramatic rise in thenumber of cases, an increasing percentage of these were of '-he malignant formof malaria (6 percent in 1982, 18 percent in 1985). Malaria experts recognizethat the integrated approach has the potential to be more effective than thevertical one, provided HPs, in particular, are strengthened with microscopes,along with trained staff to operate the equipment. However, necessaryinvestments ranging from possible needs of $7 million (HMG estimate) to $12million (DANIDA estimate) are not foreseen under the EP. Today, the target isto protect 800,000 people, those most at risk, approximately 7 percent of thepopulation in malaria areas. Given the short horizcn for commodity grantassistance and insufficient HMG budgetary allocations for control activities,the malaria situation must again be rated as critical. Danish support is onecomponent, which is expiring at the end of the current fiscal year, andfailure to provide alternative support to supply insecticides would raisegrave concern.
f. Conclusion
5.124 First, the low priority attached to health and family planning inthe past appears to be changing, with the increased share of MOH in recentyears. While the direction for the health sector in terms of decentralizedadministration, restructuring of departments to focus more on primary healthcare at the local level, and integration ot health care services under ar,.ferral system are appealing and probably correct over the longer run, thereare serious concerns about the feasibility cf the expansion envisaged at thistime. The financing of the sector Plan rests on very optimistic revenue and

- 157 -
aid flow scenarios; the MOH has just undergone a re-organization, and theadministrative and personnel situation needs to settle; vacancies need to befilled, and the capacity to absorb resources effectively requiresstrengthening. Thus, there is a strong case for a more focussed approach tothe sector's development, taking into consideration the underlying human andphysical capital base and the scope for effective use of resources.
5.125 Second, the approach to the financing of health service recurrentcosts is unsatisfactory. Mainly because of the constraint on local resources,allocations for health under the regular budget are inadequate; and thecurrent practice is to parcel most recurrent programs into projects forfunding under the development budget. While this has yielded aid support, thefinancing depends on the project cycle, lacking continuity and reliableservice delivery, and the local fund shortages limit the atilization of manyaided programs. The problem would intens4.fy if proposals to transferprograms, such as malaria eradication ar.d immunization, from donor support tothe regular budget are effected in the mid-nineties. For example, at least 7"percent the FY93 health development budget is recurrent; and proper recurrentcost financing with budget reclassification would raise the regular budget toabout Rs.l billion, compared to the allocation uf ,rs.473 million in FY93.Explicit aid financing for recurrent expenditure.-, in addition to more revenuemobilization, would support more reliable service delivery, making the budgetmore transparent and improving expenditure programming for health activities.
5.126 Third, Government has realized the need to adjust the proposed EPexpenditures, given the institutional and financial constraints noted earlier.It has developed an initial core program for the health sector, focussing onimmunization, family planning and maternal and child care, malaria eradicationand diahroea control. It is also aiming at phasing in the Plan carefully,adhering to the outline of four-tier health/family planning service deliverysystem in principle and in the long term, but prioritizing the investments toput the new system in place gradually. The selection of sites would be basedon the findings of the recently completed study on Infrastructure Inventoryand on criteria for ensuring equity of access for the population. The focuswould be on the district hospitals, the existing HPs, and only some PHCs. TheGovernment needs to emphasize and foster local level participation in planningand managing service delivery in order to build community support forsustaining the delivery of services. The main sector priorities andexpenditure efficiency issues include the following:
* Emphasize promotive and preventive health, especially maternal andchild health care, family planning, immunization and malariaeradication. The approach will stress improving service deliveryfrom existing health institutions and seek to relax supplyshortages in areas such as drugs ard personnel, including doctors,female nurses, outreach staff and other professionals required tooperate existing institutions adequately. The aim is to enhanceand consolidate the performance of the current system and extendthe network gradually according to financial, staffing andmanagement potential.

- 158 -
* Increase the coverage and quality of services based on resourcesclose in magnitude to the Rs.5,466 million envisaged in the Plan.Critical program components not fully reflected in the existingbudget would be funded. These should include provision of about$6-8 million for TA/DA to support operational travel for staff andsupervisors, and for supplies which are currently under-funded;and $7 million (HMG estimate) to $12 million (DANIDA estimate) formalaria eradication for the Plan period. The budget should ensurefunding of the female MCH Workers and also support basic O&Mactivities, including maintenance of equipment and facilities.Expenditures on infrastructure would focus first on constructingand refurbishing the Health Posts and clinical services at theoutreach level, limiting PHC expansion to the most denselypopulated sources of demand.
* The critical mass of staff for outreach and clinical services aswell as for program management and supervision must be protected.At the same time, more recognition would need to be given to non-wage operational costs for district hospitals and lower levelfacilities. This will provide the materials for staff to deliverservices effectively.
G. WATER SUPPLY AND SANITATION
a. Backaround and Performance
5.127 While the coverage of drinking water supply and sanitation (DWSS)facilities increased over the past decades, major shortfalls in thereliability and quality of service delivery have persisted. The institutionscreated to serve the public have yet to become effective in responding to theneeds of users and in helping to sustain the delivery of services. Often,additional investments are required to repair and recover earlier ones soonafter completion.104/ Thus, while sector expenditures have expanded fromunder 2 percent of development spending in the seventies to 5 percent by FY92(Table 5.30), actual service delivery has been below expectation.
5.128 Officially, water supply covers 67 percent and sanitation 40percent of the urban population. In reality, delivery is sporadic in all buttwo (Po'khara and Dhulikel) urban areas. Moreover, inadequate design and
IU See, for example, "Fifteen Year Comprehensive Development Program". WSS Corporation, July 1989."Nepal Drinking Water Supply and Sanitation Sector Review and Development Plan"; April 1991. "Nepal:Water Supply and sanitation Sector Issues paper"; World Bank, February 1993. "Monitoring theStrategies for Health for All by the Year 2000; Basic Minimum Needs Steering Committee, HMG. 1988.

- 159 -
Table 5.30: DEVELOPMENT EXPENDITURES ON WATER AND sANITATION(Rs. Million)
Development Expenditure Donors/a WSS as t Sanitationof Total as t of
Total WSS Rs.Mil. % Dev. WSSEXP. Exp.
Third Plan (1965-70) 2101 31 1.5
Fourth Plan (1970-75) 5048 92 1.8
Fifth Plan (1975-80) 10985 437 4.0
Sixth Plan (19Y80-85) 29529 1126 438 38.9 3.5 6.8
Seventh Plan (1985-90) 53410 2302 892 38.7 4.3 3.3
Budget FY91 13279 681 305 44.8 5.1 1.4
Budget FY92 16297 1012 360 35.6 6.2 0.7
Budget FY93 21595 1212 651 53.7 5.6 1.8
Eighth Plan(1993-97) 113479 6273 NA NA 5.5 12.5
/a Excludes WHO contribution
Sources: SRDP, Budgets for FY91-FY93, Eighth Plan.
maintenance, and under-financing of treatment facilities have undermined thequality of water supplies. These factors have motivated the development ofprivate wells, estimated at over 330 in Kathmandu alone. Sanitationfacilities are even more limited as only about 25 percent of the population ofKathmandu, Lalitpur and Bhaktapur, accounting for 9 percent of the total urbanpopulation in 1991, is served by sewerage facilities, in addition to another25 percent of the total urban population that has access to private sanitaryfacilities. The productivity of Nepal Water and Sewerage Corporation (NWSC)which implements urban programs is estimated at 49 connections per staffmember which is at the low end relative to the range of 40 to 300 connectionsper staff among most LDCs. Estimates of water supply that is unaccounted forvary up to 40 percent of urban water supply, compared to the average loss of20 percent in most countries; 30 percent is considered unsatisfactory. Forrural areas, the reliable delivery of safe water from completed projects isconsidered lower that official estimates which indicate 40 percent coveragefor safe water and one percent coverage for sanitation facilities. Forexample, studies conducted to help formulate the Sector Review DevelopmentPlan (1991) show that 282 (92 percent) of the 306 piped water supply schemescompleted by the Department of Water Supply and Sanitation (DWSS) as ofmid-1990 were in need of some kind of rehabilitation, and 25 percent of DWSS-implemented rural water schemes require rehabilitation shortly aftercompletion.
5.129 The main reasons for the poor performance include a history ofuneconomic tariffs and weak financial base of the supply agencies, inadequatemanagement and inability to sustain services. There have been over-ambitions
- 160 -
targets relative to resources, motivating inappropriate design and poorquality construction. Until recently, DWSS tended to implement projectswithout beneficiary involvement in the decision process. Such projectsemphasized hardware installation, and paid less attention to skills andinstitutional support required to operate and sustain the facilities. Otherfactors include overly costly design, excessive costs due to delayedimplementation, procurement practices and cost-overruns.
b. BP and Xxvenditure Policies and Priorities
5.130 The WSS sector is expected to receive Rs. 6,273 million, 5.5percent of EP expenditures, and provide drinking water facilities to 72percent of the population by the end of the Plan period. This would involveextending water facilities to additional 6.8 million rural and 443,000 urbanresidents. Also, sanitation facilities will be extended to 1.159 million inrural and 414,000 in urban areas. Seventy four percent of allocations is forwater; 12.5 percent is for sanitation, compared to 7 percent in the pastdecades; 4 percent is for training and research, and the rest 12 percent wouldbe for overheads. Rural water supply would absorb S2 percent and urban 38percent of the water budget.
5.131 While access to safe drinking water needs to be expanded, there isserious doubt that the EP allocations and targets would accomplish thisobjective under this existing practices, witbout a much stronger role thanevident so far from the private sector. First, the sector targets are basedon cost under-estimation; hence, the expenditure program is most likely tocreate the same types of pressures as under the Seventh Five Year Plan, whichcontributed to poor quality construction as efforts were made to meetspecified physical targets. For example, under the BP, the cost per capita ofa new gravity water for 1,027,000 rural residents is Rs.901 (in FY92 prices),compared to over Rs.1,000 (in FY90 prices) determined by sector reviewreports; the current unit cost gap is about 20-25 percent. Second, the BPcalls for a new approach to drinking water development for rural programs,based on decentralization and "mandatory" involvement of local communities inall phases of the project; and it advocates enlisting the support of theprivate sector and NGOs, and providing matching grants to mobilize local levelresources. Yet, actual progress has been slow; sector resource allocationsare yet to reflect the new policies substantively, and the role of centralagencies remains strong. In turn, there is a lag in moving towards greatercommunity level planning, implementation and management control. While manyof the 22 major projects costing Rs.1,211 million in the FY93 developmentbudget (Table 5.31) have some form of community participation, less than fiveprojects totalling Rs.120 million or about 10 percent of the sector allocationinvolve community management controllOS/, and this will increase by Rs.35
These schemes are in fact directly implemented by UNICEF and FINNIDA. They include DrinkingWater Training Project, Terai Tubewell Project, Rural Drinking Water Project and People ParticipationProject.
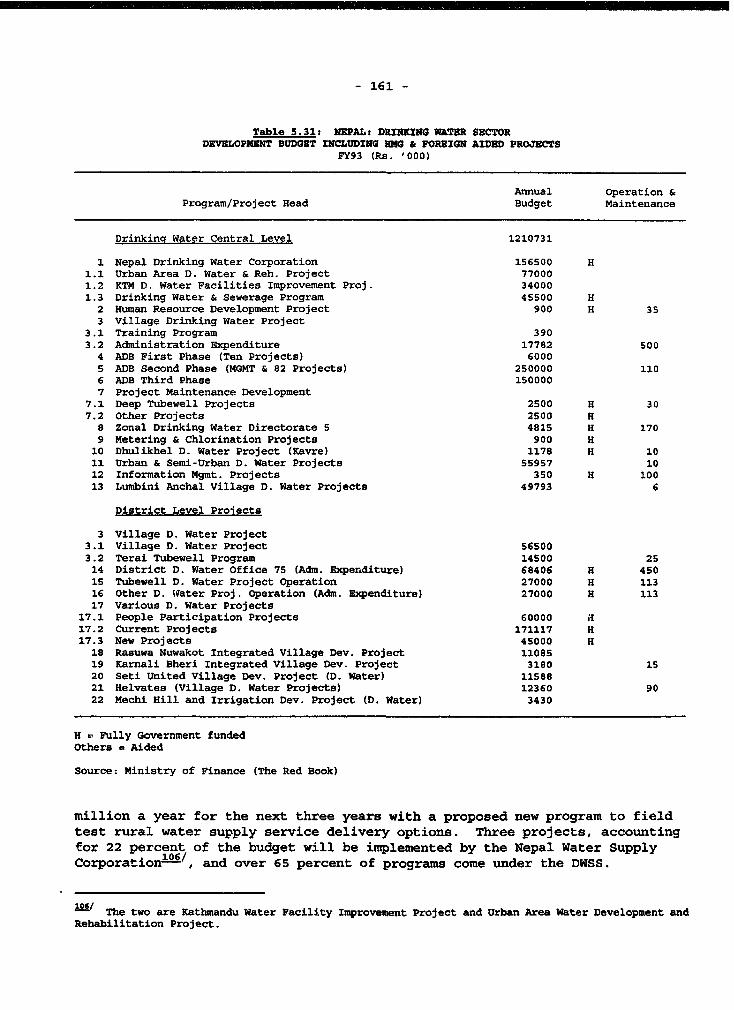
- 161 -
Table 5.31: NEPAL: DRINKING WATER SECTORDEVELOPMENT BUDGET INCLUDIMN 9MG & FOREIGN AIDED PROJECTS
FY93 (Rs. '000)
Annual Operation &Program/Project Head Budget Maintenance
Drinking Water Central Level 1210731
1 Nepal Drinking Water Corporation 156500 H1.1 Urban Area D. Water & Reh. Project 770001.2 KTM D. Water Facilities Improvement Proj. 340001.3 Drinking Water & Sewerage Program 45500 H
2 Human Resource Development Project 900 H 353 Village Drinking Water Project
3.1 Training Program 3903.2 Administration Expenditure 17782 soo
4 ADB First Phase (Ten Projects) 60005 ADB Second Phase (MGMT & 82 Projects) 250000 1106 ADB Third Phase 1500007 Project Maintenance Development
7.1 Deep Tubewell Projects 2500 H 307.2 Other Projects 2500 H
8 Zonal Drinking Water Directorate 5 4815 H 1709 Metering & Chlorination Projects 900 H
10 Dhulikhel D. Water Project (Kavre) 1178 H 1011 Urban & Semi-Urban D. Water Projects 55957 1012 Information Mgmt. Projects 350 H 10013 Lumbini Anchal Village D. Water Projects 49793 6
District Level Prolects
3 Village D. Water Project3.1 Village D. Water Project 565003.2 Terai Tubewell Program 14500 2514 District D. Water Office 75 (Adm. Expenditure) 68406 H 45015 Tubewell D. Water Project Operation 27000 H 11316 Other D. Water Proj. Operation (Adm. Expenditure) 27000 H 11317 Various D. Water Projects
17.1 People Participation Projects 60000 a17.2 Current Projects 171117 H17.3 New Projects 45000 H
18 Rasuwa Nuwakot Integrated Village Dev. Project 1108519 Karnali Bheri Integrated Village Dev. Project 3180 1520 Seti United Village Dev. Project (D. Water) 1158821 Helvates (Village D. Water Projects) 12360 9022 Mechi Hill and Irrigation Dev. Project (D. Water) 3430
H = Fully Government fundedOthers = Aided
Source: Ministry of Finance (The Red Book)
million a year for the next three years with a proposed new program to fieldtest rural water supply service delivery options. Three projects, accountingfor 22 percent of the budget will be implemented by the Nepal Water SupplyCorporation.1 , and over 65 percent of programs come under the DWSS.
The two are Kathmandu Water Facility Improvement Project and Urban Area Water Development andRehabilitation Project.
- 162 -
5.132 Experience with sector performance would suggest that the existingapproach to allocating resources and organizing service delivery under themanagement control of state agencies is not likely to expand reliable accessand improve the quality of urban and rural drinking water supply. Thus, newapproaches to overcome the widespread difficulties in sustaining water supplyschemes need to be pursued. One option for rural water supply is the smallbut growing number of investments which have been made by NGOs and bilateraldonors to deliver rural water service based on greater community participationin the decision process. This approach emphasizes software and theresponsibility of communities and user groups for operating and maintainingschemes. Preliminary results are promising, with indications of bettersustainability, greater efficiency through lower per capital investment costs,shorter construction periods and a low financing requirement through greatercommunity contribution to capital costs. 17/ Though results arepreliminary, they are encouraging enough to warrant follow up in this area toevolve a suitable and effective delivery system.
5.133 Evolving new approaches would require for both urban andrural water supply and sanitation schemes: (i) inscitutional changes to limitthe role of the state in service delivery, promote community participation,give more responsibility to district level institutions, support training andbuild new capacities for managing and operating programs at the local level;(ii) to channel budgetary allocations to local level agencies, support themwith incentives for community resource mobilization and mandate communityparticipation to enforce accountability to users; (iii) to revise unrealisticexpansior targets, re-orient allocations to emphasize quality improvementthrough rehabilitation and renovation, and pay greater attention to O&M; (iv)to limit new construction starts, including fully Government funded programs,which are based on existing modes of operation; and (v) to promote resourcemobilization, including tariff reforms.
Institutional Reforms
5.134 Options which emphasize the role oZ the private sector, localcommunities, user groups and NGOs in WSS development would involve(i) shifting the focus of the central Government from direct service delivery;and (ii) re-orienting the role of existing institutions gradually, especiallythe Department of Water Supply and Sewerage (DWSS) with its large staffestimated at 6000. Ultimately, reorganizing the approach to sector activitiesand expanding the role of communities and user groups would involverestructuring central level agencies, retaining a role for a scaled downcentral agency in formulating WSS sector-wide policies and strategies, whilepromoting the role of local level institutions and user groups in managing anddelivering services. For a while now, DWSS has been responsible for mostgovernment rural water and sanitation schemes (RWSS) and it sharesresponsibility with -he Nepal Water Supply Corporation (NWSC) for urban watersupplies in 36 municipalities which account for 1.7 million of 18.5 million
107/ East Consult, "Rural Water Supply and Sanitation Project Preparation Study", Final InterimReport, Kathmandu, April 1992, 3 volumes.

- 163 -
population in 1991. 108 DWSS, with its. heavy burden, has no autonomy; it hasemphasized new construction, and there has been no clear strategy and programfor maintenance. For a long time, its p'rojects have been driven mainly byengineering with less emphasis on local skills and institutions required tosustain services. As new options diminish the role of existing centralagencies in direct service delivery, they would need to focus on sectorpolicies and planning; enforcement of budgetary accountability throughmonitcring and evaluating programs; and emphasizing human resource developmentto assist local areas to acquire needed management skills. In turn, rurallevel agencies would focus on planning, implementing, operating andmaintaining services. The urban areas would pursue the aevelopment ofindependent, autonomous entities with clearly defined performance objectives,and managed by appropriately skilled staff.
5.135 The role of the private sector in contracting and constructingfacilities and providing other professional maintenance services would need tobe expanded. For example, the system of supplying subsidized pump spare partsmakes it more difficult for communities to secure spares and maintaincompleted facilities. It also limits competitive supply of these items.
ImDrovincr The Expenditure Procram
5.136 Various steps need to be taken to review sector expenditures. Forexample, there is a need to define more realistic performance targets andscale back the current target for physical construction accordingly. Thiswould reduce pressures to compromise the quality of construction in order tomeet the targets. Another is to limit new rural project starts, except thosewh-ch are dominantly community based and accounted for less than Rs.200million, less than 20 percent of the FY93 budget. Also, on-going projectsneed to be reviewed and restructured, redesigned or deferred as appropriate toensure the enforcement of new policies regarding greater communityparticipation in implementation and management. The Karnali-Bheri project,for example, has been initiated since FY85; about 65 percent of the commitmenthas been disbursed; 15 of its projects are still incomplete, and 16 of the 35completed projects need repair to function properly. Some elements of theThird Phase water program are also being considered for restructuring. Thisis a major project, involving over 5,000 hand-pump tubewells, rehabilitationand improvement in sanitation under DWSS institutional control and practices.The fully Government funded (FGF) programs also need to be reviewed. TheseFGF programs amounted to Rs.456 million, 38 percent of the sector expenditureprogram in FY93: 38 percent of this is to subsidize the Nepal Drinking WaterCorporation; Rs.95 million (21 percent) is for district administrativeagencies, mainly regular type of expenditures; and Rs.60 million is for"People participation projects", and the rest is controlled by DWSS. Aserious attempt to improve the performance of WSS schemes would requirerestricting new project starts under DWSS in its present form and promoting
Ot other Ministries, such as Local Development, Health and education, undertake promotion of ruralworks, sanitary, health and hygiene education. The Ministry of Water Resources is responsible foroverall water rights and water use.
- 164 -
rural projects based on direct community organizational and managerialsupport. This would help to save on project investment costs while creatingthe rural level support for sustaining the operation of completed projects.
c. gustainabilitv and Resource Mobilization
5.137 Greater effort needs to be put into sustaining and improving watersupply delivery. Expenditures on urban water supply rehabilitation accountedfor 30 percent of the FY93 budget.19 Also, recent tariff reforms haveimproved somewhat the financial base for maintaining urban schemes, thoughthere is still the need to strengthen this capability over the longer term.In Kathmandu, for example, average revenues are now about Rs.S per M3 ofwater, while the estimated costs of O&M, excluding debt se :e anddepreciation, are about Rs.4.2 per M3 of water consumed; but this would behigher with appropriate periodic maintenance. WSS institutions require moreresources than currently available from budgetary allocations and user fees tobe financially strong and be able to sustain and improve services. Forexample, based on a regular maintenance requirement equivalent to 0.5 percentof revalued fixed civil work assets and 5 percent for electrical andmechanical equipment, NWSC should spend Rs.47 million a year on maintenance,which is 7 times its actual expenditures in recent years.
5.138 Mobilizing more resources would require pricing reforms. Despitea series of previous adjustments, urban water tariffs have remained belowcosts until the 100 percent increase in January 1993 raised the average toRs.5 per M3, close to the estimated Rs.5.16 required to cover operatingexpenses and working capital. While estimated low elasticities of demand forwater support raising tariffs further, compliance and collections will bedifficult in absence of improved quality of services. Also, raisingcollections require improved performance in monitoring, billing and financialcontrols and in reducing the estimated 40 peccent urban water supply that isunaccounted for. An important urban pricing policy issue relates toestablishing a Tariff Commission which would provide a wedge between theGovernment and the NWSC, depoliticize tariff adjustment decisions, regulatethe monopoly authority of the water agencies and provide predictability intariff policy. The practice of fixing tariffs over long periods has oftencreated the need for steep adjustments which are not politically popular.While the Government's 1993 decision to allow 5 percent tariff escalation ayear is nelpful, it may not enable NWSC to meet reasonable resourcemobilization objectives. The Tariff Commission being introduced under theElectricity Act of 1992 would provide a useful model, provided it hasauthority to determine tariffs rather than be advisory.
109/ These include allocations for Nepal Drinking Water Corporation, Urban Area Drinking Water andRehabilitation Project, Kathmandu Drinking Water Facilities project, Drinking Water and SewerageProgram, and Urban and Semi-Urban Drinking Water Projects.

- 165 -
5.139 For rural schemes, the main issue is to search for options thatwould sustain the safety and delivery of services. Rural schemes have beenallocated 1.3 percent (Rs.84 million) of EP expenditures for maintenance andimprovement, and only 0.15 percent of the FY93 budget is allocated for routinemaintenance, despite the widespread malfunction of projects. There is aperception that rehabilitation, by itself, (i) would not improvesustainability without institutional reforms to promote community and usergroup participation, and (ii) would be inappropriate and too costly because ofweak design, poor quality construction and inappropriate location (which insome cases resulted in contaminated water) of some existing projects.Sustained maintenance would require community contributions, which undercurrent practice, involves 5 percent (in remote areas) to 20 percent (groundwater) of the capital costs of projects. Also, communities are usuallyiiilling to cont.ribute unskilled l;bor and local materials to construction, andthese amount to more than 5-20 percent of costs. These prac:ices could beextended to contributions to reserves against repair and maintenance. Suchcontributions have precedence in NGO schemes, and they could also motivate asearch for low cost and better quality construction.
d. Conclusion
5.140 While access to safe drinking water needs to be expanded,increased allocations alone without substantive changes in the existing modeof operation would most likely not accomplish much. Institutional reforms arecritical to raise the outcome of expanded expenditures on the sector.The main conclusion of the review are the following.
Experiment with new approaches to WSS delivery based on (i)decentralized management to limit the role of the centralGovernment in directly investing in facilities and deliveringservices; (ii) restructuring DWSS to eliminate its role inimplementing projects and delivering services, while re-orientingits activities towards sector-wide planning, providing training inskills at the local level and monitoring the performance ofprograms and projects to enforce accountability; (iii) promotingthe participation of autonomous bodies, and (iv) emphasizing therole of user and community groups in planning, implementing andmanaging the cL._livery of services.
* Adopt a multi-year rolling budget focussed on institutionalreforms as noted above. Emphasize the maintenance of existingschemes and promote only new construction starts based oni directuser group planning, implementation and management, whilereviewing and restructuring projects based on the old approach ofstate-managed service delivery.
For rural areas, the new strategy and expenditure programs woulddraw on lessons learned from NGO community based and demand drivenprograms. This should involve some testing of an institutional
- 166 -
approach that would eniance the managerial autonomy of rural watersupply schemes. The timing of such transfer of authority and itsreplication would have to be phased, depending on field tests andlessons.
For urban schemes, institutional reforms would involve (i) asupportive legal framework that would foster commercialization and(ii% a review of pricing policy with the establishment of a TariffCommission to provide a more stable and predictable pricingpolicy.
H. EXPENDITURE REFORMS AND ENVIRONMENTAL POLICY
5.141 The major development challenges facing Nepal and the efforts toaddress these challenges, such as population pressure, stagnating agricultureand the poor performance of development projects affect environmental qualityor its degradation. In turn, some emerging environmental issues, such asdemand for fuelwood, deforestation and soil erosion, affect the scope tosustain the outcome of development efforts. Thus, a sound environmentalpolicy, which is integrated with development policy, is critical for makingsustained progress in accelerating growth and improving the poverty situation.For example, since agriculture is the mainstay of the economy, its expansionwould improve living conditions for the bulk of the population. However, thescope to achieve this is constrained by various factors, which have alreadybeen noted: farm sizes are generally small; there is population and livestockpressure on land resources and deforestation is a serious concern in variousparts of the country, including the Hills and parts of the Terai. Moreover,sustained agricultural growth requires significant improvements inagricultural productivity which, apart from isolated cases, has eluded Nepalso far. Also, even the expansion of non-agriculture under the EP emphasizestourism and industry, which require supportive environmental programs.Against this background, the environmental concerns and policies enunciated inNepal's Environmental Policy and Action Plan (NEPAP) recently adopted by theGovernment relate to managing natural and physical resources efficiently tosupport sustainable economic growth in agriculture, forestry and other areasand to help reduce widespread poverty. In turn, development policies stressefficient utilization of public resources together with a strong emphasis onpopulation and human resource development programs.
5.142 The various reforms proposed in this report to re-orient sectoralexpenditures would reinforce the Government's environmental policies relativeto development objectives. For example, in the area of human resourcedevelopment, the report recommends expanded expenditures for basic and primaryeducation, family planning, and maternity and child health to help improve theoverall quality of the work force, raise incomes and impact on populationgrowth over the long term. The expanded resource allocations in these areastogether with well designed programs and strong institutional performancewould help to attain program objectives.

- 167 -
5.143 Expenditure reforms to raise agricultural productivity havepotential to lessen the pressure on agricultural land and to promotebroadbased growth essential for having significant impact on reducing poverty.In irrigation, for example, there are indications that the ne% policy proposedto shift from large-scale, state-managed irrigation to the more promisingsmall-scale, farmer-managed schemes would raise agricultural productivity andgrowth, while reducing Government expenditures. This policy is consistentwith the NEPAP, which argues that small-scale schemes are less likely toencounter environmental problems associated with the sicnificant hydrologicalchanges that often accompany large irrigation projects. Also, proposedexpenditure reforms to reduce fertilizer subsidies and liberalize fertilizerimport and marketing through private sector participation stand to reduce theperennial fertilizer supply shortages, thereby expanding its utilization andraising agricultural productivity. In addition, the strategy for livestockdevelopment stresses limiting the expansion of livestock numbers to more land,while emphasizing fodder research and other extension services to raise thequality and productivity of livestock. Also, while stressing the efficientsupply of chemical fertilizers, it is equally important to encourage farmingsystems that use a judicious application of organic and inorganic fertilizersand encourage farmers to invest in long-term soil conservation measures, whichare b6ing emphasized under the forestry development program. The ForestryMaster Plan and the EP have proposed expenditure reforms aimed at curbinggrowing deforestation and environmental degradation by (i) emphasizingcommunity participation, especially in the Hills; these make less demand onlimited public resource, (ii) identifying the ecologically sensitive andseverely degraded areas for protection, while supporting the development ofproduction forests which have potential for regeneration, (iii) reviewingrestrictions on the distribution and pricing of forest products to encourage amarket responsive supply system and strengthening the capacity of theGovernment to monitor and enforce environmental codes. Also, expenditures onpower, especially Arun, are being supported with specific measures, forexample, to protect bio-diversity, and the expected increased supply of powerwould release pressure on forest resources as a source for fuelwood.
5.144 The emphasis on institutional reforms in the report is also veryimportant for the effectiveness of environmental policy. This is because,though the various policies and reforms have potential environmental benefits,effective implementation of programs has been lagging. In addition, there isabsence of systematic evaluation of the implementation of programs andmonitoring of their impact on the environment. This is especially so in thecase of forestry, where weak program design and weak accounting havecontributed to the under-utilization of resources, making it difficult toassess the outcome of projects. Thus, there is a pressing need to develop theinformation base for evaluating resource allocations as well as theimplementation and performance of programs and the effects on the environment.More work is needed in other sectors to address environmental concerns. Onearea is to adopt and enforce guidelines for industrial emission. Another areais in transport, where work is needed to investigate the potential for morewidespread use of low cost, low traffic, fair weather village access roads; toreview the tariff structure of imported vehicles; and to continue pricingpolicy reforms for energy including petroleum products.
STATISTICAL APPEDICES
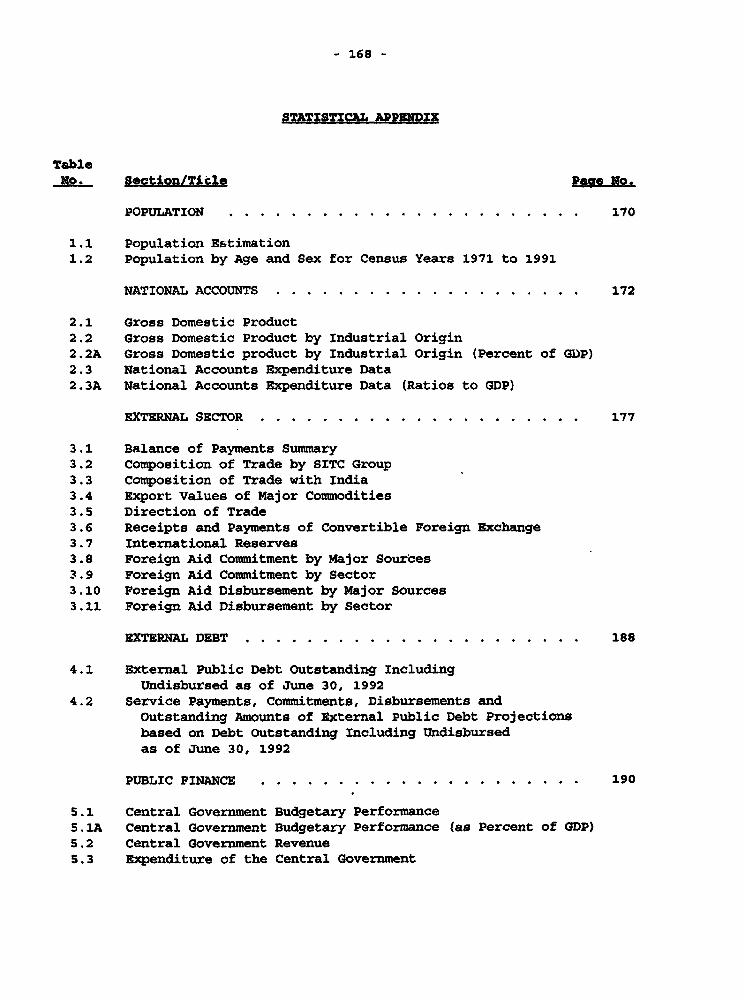
- 168 -
STATISTICAL APPMNDIX
Table
No. Section/Title PaQ NoI.
POPULATION . . . . . . . . . . . . . . . . . . . . . . . 170
1.1 Population Estimation1.2 Population by Age and Sex for Census Years 1971 to 1991
NATIONAL ACCOUNTS . . . . . . . . . . . . . . . . . . . . 172
2.1 Gross Domestic Product2.2 Gross Domestic Product by Industrial Origin2.2A Gross Domestic product by Industrial Origin (Percent of GDP)2.3 National Accounts Expenditure Data2.3A National Accounts Expenditure Data (Ratios to GDP)
EXTERNAL SECTOR ... . . . . . . . . . . . . . . . . . . 177
3.1 Balance of Payments Summary3.2 Composition of Trade by SITC Group3.3 composition of Trade with India3.4 Export Values of Major Commodities3.5 Direction of Trade3.6 Receipts and Payments of Convertible Foreign Exchange3.7 International Reserves3.8 Foreign Aid Commitment by Major Sources3.9 Foreign Aid Commitment by Sector3.10 Foreign Aid Disbursement by Major Sources3.11 Foreign Aid Disbursement by Sector
EXTERNAL DEBT .... . . . . . . . . . . . . 188
4.1 External Public Debt Outstanding IncludingUndisbursed as of June 30, 1992
4.2 Service Payments, Commitments, Disbursements andOutstanding Amounts of External Public Debt Projectionsbased on Debt Outstanding Including Undisbursedas of June 30, 1992
PUBLIC FINACE .................... . 190
5.1 Central Government Budgetary PerformanceS.1A Central Government Budgetary Performance (as Percent of GDP)5.2 Central Government Revenue5.3 Expenditure of the Central Government

- 169 -
TableN.I Section/Title Paae o-
MONETARY STATISTICS . . . . . . . . . . . . . . . . . . . 197
6.1 Nepal - Monetary Survey6.2 Nepal - Assets and Liabilitiea of Nepal Rastra Bank6.3 Nepal - Assets and Liabilities of Commercial Bank6.4 Structure of Interest Rates
AGRICULTURAL STATISTICS . . . . . . . . . . . . . . . . . 201
7.1 Area, :';)duction and Yield of Principal Food Crops7.2 Area, Production and Yield of Principal Cash Crops7.3 Production of Major Agricultural Crops7.4 Index of Agricultural Production
INDUSTRIAL STATISTICS ... . . . . . . . . . . . . . . . 205
8.1 Production of Manufacturing Industries8.2 Production Index of Manufacturing Industries8.3 Capacity Utilization of Selected Industries8.4 Sourcc." and Uses of Electricity8.5 Imports of Petroleum Products by Types8.6 Extension of Transport Facilities and Uses
PRICES .... . . . . . . . . . . . . . . . . . . . . . 213
9.' National Urban Consumer Price Index9.4 Monthly Wages in Major Sectors
EDUCATION4 AND HEALTH ... . . . . . . . . . . . . . . . 215
10.1 Number of Students in Primary, Lower Secondary andSecondary Schools
10.2 Number of Teachers in Primary, Lower Secondary andSecondary Schools
10.3 Health Services

- 170 -
5Wble 1.1
Dzo5eationj (thouneada) with 0RR1I by 2025
fge Qou9 1985 1990 1995 2000 2005 2010 2015 2020 2025 2030
Total MhF 16602 18916 21476 24110 26787 29426 31997 34398 36556 30695
Ibles0-4 1449 1357 1762 1... 15s 1875 1872 1827 1734 1757
5-B 1157 1376 1486 1690 1741 1797 1827 1834 1800 1717
10-14 1004 1141 1350 1468 1671 1724 1783 S815 1024 1793
lS-19 845 991 1127 1342 1453 1655 1710 1769 103 181420-24 702 031 976 1111 1325 14S5 1637 1692 1753 178825-29 602 690 817 960 1094 1306 1417 1617 1674 1735-30-34 532 590 677 802 945 1078 1288 1398 1599 165655-39 464 519 877 663 787 928 1060 1268 1379 157740-44 401 450 505 562 646 769 907 1038 1244 1SS445-49 344 38S 433 486 542 625 745 001 1009 121150-54 285 325 365 410 462 517 597 712 044 96935-59 227 263 300 337 381 430 482 557 667 79260-64 171 201 233 267 302 341 9o7 434 504 60465-69 120 143 168 196 225 2SS 290 330 372 4as
70-74 74 91 109 129 151 175 199 227 259 294
75+ 65 77 95 115 139 165 194 225 260 299
Total 8443 9630 10966 1234S 13719 18075 1639S5 17624 18723 19793
tW1.s
0-4 1395 1476 1677 1736 1798 1011 1001 1751 1656 16925-9 1098 1311 1397 1604 1677 1746 1766 1764 1724 16"3
10-14 940 1070 1289 1377 1585 1660 1730 1753 1754 171615-19 785 929 1058 1266 1359 1566 1644 1716 1741 174420-24 693 T6S 907 1035 1244 1336 1544 1623 1698 172725-29 633 672 743 884 1012 1219 1312 1520 1603 168130-34 581 612 651 722 061 908 1194 1289 1498 158435-39 494 558 590 629 700 837 965 1170 1267 147740-44 407 472 535 567 608 678 014 941 1145 124445-49 334 306 450 512 545 585 656 790 916 111850-54 267 313 364 428 486 510 859 629 761 8855-59 206 245 289 337 395 454 487 527 596 72460-64 156 182 218 258 303 350 413 446 487 553
65-69 112 130 153 105 220 261 310 361 393 48370-74 70 05 100 119 145 174 209 251 295 32475+ 61 72 8S 107 130 160 198 243 299 36
Total 8239 9266 10810 11765 13068 14351 15602 16774 17633 10902
Si*th Rate 40.2 39.6 35.5 32.2 29.0 26.1 23.3 20.3 19.2Death Rate 15.1 14.0 12.5 11.2 10.2 9.4 9.7 S.2 7.9Rate of at. Iaa. 2.51 2.56 2.30 2.10 1.00 1.67 1.45 1.21 1.13Not Nlxpatieo sate 0.0 0.0 0.0 0.0 0.0 0.0 0.0 0.0 0.0Growth Rate 2.51 2.56 2.30 2.10 1.88 1.67 1.45 1.21 1.13
Total rt lity 5.86 5.56 4.96 4.36 3.76 3.23 2.70 2.39 2.25Nu 2.01 2.00 1.87 1.72 1.52 1.34 1.18 1.04 1.00
e(0)-oth Sexes 51.00 52.64 54.62 56.75 50.54 60.39 62.30 64.28 66.33e(15)-both Bexes 49.52 50.10 80.89 51.66 52.42 53.20 54.01 54.94 55.69
rn-Soth Somms 127.10 117.30 105.60 93.00 83.00 73.00 62.90 52.90 42.90
q(S)-Both gexes 0.180 0.173 0.153 0.133 0.117 0.102 0.086 0.071 0.055
Dep. Ratio 82.7 82.3 62.0 77.6 73.4 67.0 61.5 56.2 51.1 47.4
Soawne: W*cl1 Sank Staff Maetitee.

- 171 -
Table 1.2
POPULATION BY AQB AND S8X FOM CESU8 YZARS 1971 TO 1991
(in Percent)
1971 1981 1991
Age Groups Male Female Male Female Male Female
All ages 100.00 100.00 100.00 100.00 100.00 100.00
0-4 13.S9 14.70 15.47 15.34 14.74 14.45
5-9 15.23 14.94 14.52 14.65 15.35 14.76
10-14 12.08 10.35 11.95 10.75 13.15 12.11
15-19 9.41 0.71 9.04 6.63 9.53 9.83
20-24 8.01 8.78 8.28 9.54 7.94 9.10
25-29 7.84 8.26 7.41 8.07 7.10 7.79
30-34 6.63 7.42 6.09 6.92 6.36 6.51
35-39 6.64 6.25 6.00 5.89 5.60 5.53
40-44 5.19 5.36 4.90 5.13 4.46 4.72
45-49 4.22 3.76 4.28 3.95 4.06 3.90
50-54 3.51 3.42 3.77 3.44 3.34 3.18
55-59 2.29 2.17 2.44 2.15 2.73 2.34
60-64 2.38 2.71 2.49 2.40 2.34 2.37
65-69 1.23 1.2i 1.31 1.19 1.54 1.39
70-74 0.96 1.06 1.08 1.01 1.03 0.98
75+ 0.78 0.1. 0.97 0.94 1.03 1.03
Source: CBS, Population Census (Advanced Tables)

table 2.1
sac" DaNC SS68Pc!
COAm. aU111ea
1975/76 19S0/81 1981/82 1982/B3 19t)3/4 1984/85 198S/S6 1986/67 19S7/SS 1988/89 1989/S0 1990/91 1991/92
oul.na tDP 17394 27307 30908 33761 39390 44417 S0428 59246 68973 77740 91008 103948 1261S9
A4riaultur 11611 1S679 17903 19282 22771 24171 26819 30759 35825 41079 47441 52247 61696
Nan-Agziaulture 5783 11628 13085 14479 16619 20246 23609 28487 33148 36661 43567 S1701 64490
Peal MtO a/ 17300 20150 20920 20297 22262 23630 24645 2S617 27515 20748 31034 32448 33115
Agzitulture 1161S 12066 12616 12478 13668 13990 14705 14709 15993 17234 18513 19026 18805
Sbn-4ArLaultuze 5605 0092 6304 7019 8594 9640 9940 10828 11522 11314 12521 13422 14310
CDP Deflator b/ 100.5 135.S 146.1 166.3 176.9 180.0 204.6 231.3 250.7 270.4 293.3 320.4 381.1
Agricaltore 100.0 129.9 141.9 154.5 166.6 172.0 182.4 208.0 224.0 238.4 256.3 274.6 328.1
Non-A4rian2tuze 101.7 143.7 157.6 105.2 193.4 210.0 237.5 263.1 P27.7 310.4 348.0 305.2 450.7
Porcent Chang. over tbe Prev$oua Year
Sew-.n GDP 5.0 16.9 13.5 0.9 16.7 12.0 13.5 17.5 16.4 12.7 17.1 14.2 21.4
4 riculture 0.5 14.6 14.2 7.7 18.1 6.3 11.0 14.7 16.S 14.7 15.5 10.1 t8.1
Nou-agricu..tur 15.2 20.3 12.5 10.7 14.8 21.1 16.6 20.7 16.4 10.6 10.0 16.7 24.7
eal GDP */ 4.4 8.3 3.8 -3.0 9.7 6.1 4.3 3.9 7.4 4.5 8.0 4.6 2.1
4griadultur 0.6 10.4 4.6 -1.1 9.5 2.4 5.1 0.6 8.1 7.0 7.4 2.8 -1.2
Non-Agriculture 13.2 5.5 2.6 -5.8 9.9 12.2 3.1 8.9 6.4 -0.1 6.7 7.? 6.6
GDP Deflator O.S 7.9 9.4 12.3 6.4 6.2 8.9 13.0 8.4 7.9 8.5 9.2 19.0
Agriculture 0.0 3.8 9.2 8.9 7.8 3.7 S.6 14.0 7.7 6.4 7.5 7.1 19.5
Ebn-Agrioulture 1.7 14.0 9.7 17.S 4.4 8.6 13.1 10.6 9.4 10.7 9.3 10.7 17.0
a/ Zn 1974/7S inuket price".
b/ 1974/75 - 100.
80asa: Central Burea of 8SAtietLOS.
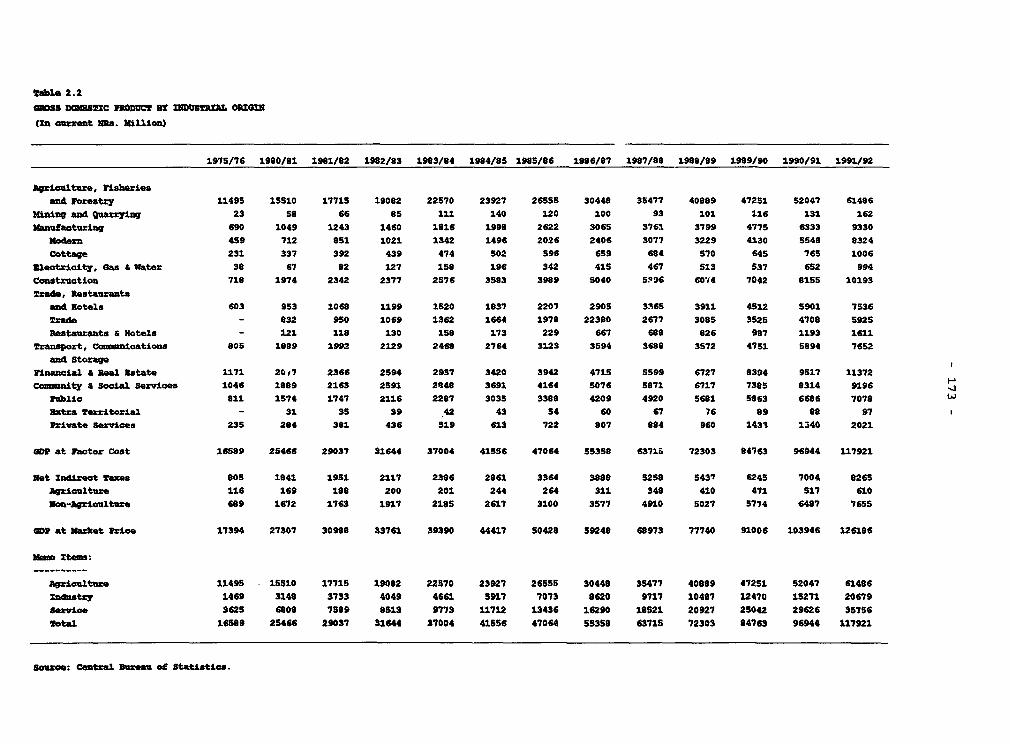
Table 2.2
mOS DSMMC BYv s r 10S! ORIGIN
(Zn current NRa. million)
1975/76 1980/91 1981/82 1982/83 1903/84 1904/05 19S/86 1906/87 1997/80 1980/09 1909/90 1990/91 1991/92
Agriculture, Wishrieaand Worestry 11495 15510 17715 19082 22570 23927 26555 30440 35477 40089 47251 52047 61486
Mining and Quarrying 23 58 66 0S 111 140 120 100 93 101 116 131 162
Manurfacturing 690 1049 1243 1460 1016 1990 2622 3065 3761 3799 4775 6333 9330
Moderm 459 712 851 1021 1342 1496 2026 2406 3077 3229 4130 5548 8324
Cotta;e 231 337 392 439 474 S02 596 659 684 570 645 765 1006
Elentricity, Gas & Water 38 67 02 127 158 196 342 415 467 513 537 6S2 994
Constrction 718 1974 2342 2377 2S76 3503 3989 5040 5396 6074 7042 0155 10193
!zada, Rastaurants
and Hotels 603 953 1060 1199 1520 1837 2207 2905 3365 3911 4512 5901 7536
Trade - 032 9S0 1069 1362 1664 1978 22380 2677 300S 3525 4708 5925
Restaurants a Hotels - 121 118 130 158 173 229 667 688 826 907 1193 1611
Transport, Comsnicationa 805 1089 1992 2129 2460 2764 3123 3594 3608 3572 4751 594 76S2
anl StorageVinaviial a Real Xatate 1171 20s7 2366 2594 2937 3420 3942 4715 5S99 6727 8394 9S17 11372
Cinm ity a Social Services 1046 18S9 2163 2591 2R40 3691 4164 5076 S071 6717 7385 0314 9196
Public ll 1574 1747 2116 2207 3035 3300 4209 4920 5601 S063 6686 7070
*atra Territorial - 31 3S 39 42 43 54 60 67 76 89 00 97
Private Services 235 204 301 436 519 613 722 007 894 960 1433 1340 2021
GDP at Factor Cost 165S9 25466 29037 31644 37004 41556 47064 5535 6371LS 72303 84763 96944 117921
get adirect Taxes 805 1041 1951 2117 2306 2961 3364 398 5258 S437 6245 7004 8265
Agriculture 116 169 1S 200 201 244 264 311 340 410 471 S17 610
Won-Agriculture 689 1672 1763 1917 2105 2617 3100 3577 4910 5027 5774 6407 765S
GDP at Market Price 17394 27307 30900 33761 39390 44417 50420 59248 69973 77740 91006 103946 126196
Nm Item:
Agriculture 11495 15510 17715 19082 22570 23927 26555 30440 35477 40089 47251 52047 61406
Znuastry 1469 3140 3733 4049 4661 5917 7073 0620 9717 10407 12470 15271 20679
Service 3625 6000 7599 9513 9773 11712 13436 16290 10521 20927 25042 29626 35756
Sotal 16509 25466 29037 31644 37004 41556 47064 55359 63715 72303 84763 96944 117921
sourem: Central Burea" of Statistics.
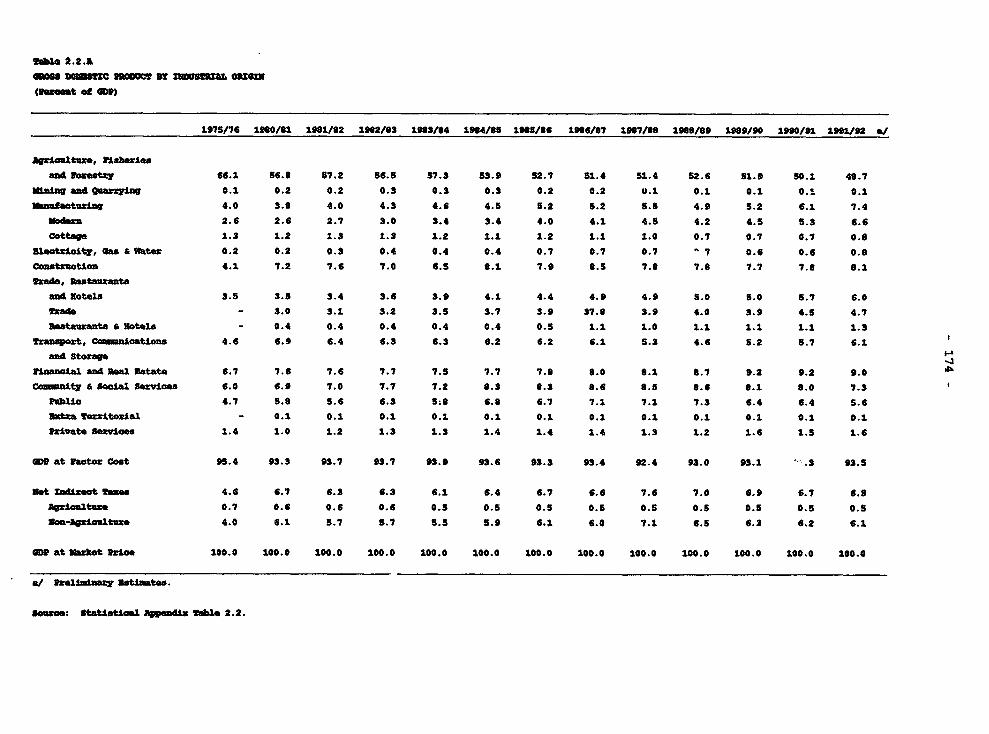
Vable 2.2.1
mmDM= CM sr tona_ ORX0
(larget of 4t)
197S/76 1990061 1901/62 1902/63 1903/64 1904/65 1985/86 1906/07 1907/68 1909/69 1989/90 1990/91 1991/92 a/
agricutue, 91arlies
and ottty 66.1 56.6 57.2 S.5 57.3 53.9 52.7 51.4 51.4 52.6 S1.9 50.1 49.7
in-4 a Quarryin 0.1 0.2 0.2 0.3 0.3 0.3 0.2 0.2 U.1 0.1 0.1 0.1 0.1
1£ufacturing 4.0 3.0 4.0 4.3 4.6 4.S S.2 5.2 S.S 4.9 5.2 6.1 7.4
Modern 2.6 2.6 2.7 3.0 3.4 3.4 4.0 4.1 4.S 4.2 4.S 5.3 6.6
Cottaep 1.3 1.2 1.3 1.3 1.2 1.1 1.2 1.1 1.0 0.7 0.7 0.1 0.6
Eleotaicity, a" & mater 0.2 0.2 0.3 0.4 0.4 0.4 0.7 0.7 0.7 7 7 0.6 0.6 0.8
CeosteUtin 4.1 7.2 7.6 7.0 6.S 6.1 7.9 8.5 7.8 7.8 7.7 7.6 8.1
Irae, Restamrants
an llotels 3.5 3.5 3.4 3.6 3.9 4.1 4.4 4.9 4.9 S.0 S.0 5.7 6.0
2*ade - 3.0 3.1 3.2 3.S 3.7 3.9 37.6 3.9 4.0 3.9 4.S 4.7
Rstaurants & Riotanl - 0.4 0.4 0.4 0.4 0.4 0.5 1.1 1.0 1.1 1.1 1.1 1.3
Iranspact, comicnnations 4.6 6.9 6.4 6.3 6.3 6.2 6.2 6.1 5.3 4.6 S.2 S.7 6.1
and storage
rinancial MA fA.a Estate 6.7 7.6 7.6 7.7 7.5 7.7 7.8 6.0 0.1 8 .7 9.2 9.2 9.0
cn ity a socia servies 6.0 6.9 7.0 7.7 7.2 8.3 6.3 8.6 6.5 6.6 9.1 8.0 7.3
Public 4.7 5.8 S.6 6.3 5:8 6.8 6.7 7.1 7.1 7.3 6.4 6.4 S.6
Wt !eritorial - 0.1 0.1 0.1 0.1 0.1 0.1 0.1 0.1 0.1 0.1 0.1 0.1
ivatute Services 1.4 1.0 1.2 1.3 1.3 1.4 1.4 1.4 1.3 1.2 1.6 1.S 1.6
GD at Factor Cost 95.4 93.3 93.7 93.7 93.9 93.6 93.3 93.4 92.4 93.0 93.1 .3 93.S
net Indirect Taxe 4.6 6.7 6.3 6.3 6.1 6.4 6.7 6.6 7.6 7.0 6.9 6.7 6.5
agricultue 0.7 0.6 0.6 0.6 O.S 0.5 O.S 0.5 0.5 0. 0.5 0.5 O.S
son-agziaulture 4.0 6.1 5.7 S.1 S.S S.9 6.1 6.0 7.1 6.S 6.3 6.2 6.1
MP at Market Price 100.0 100.0 100.0 100.0 100.0 100.0 100.0 100.0 100.0 100.0 100.0 100.0 100.0
a/ r e13nazy UsUaes".
Source: Statiaticel agpendi ftb 2.2.
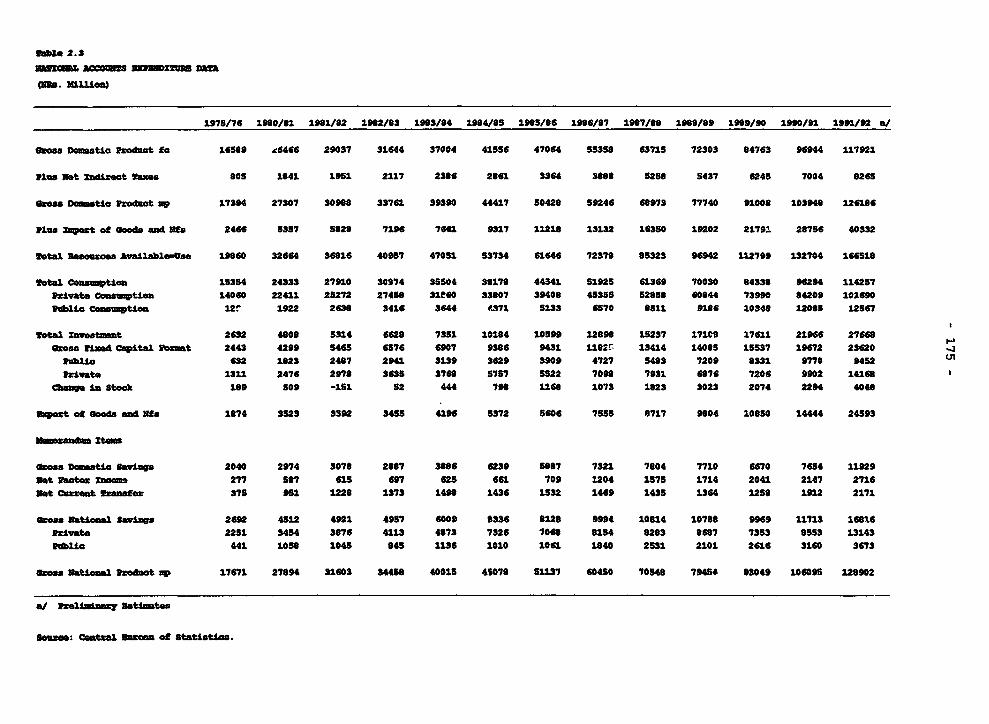
Mle 2. 3
M aM& - O mmURB DA
(1. Illuos
1975/76 1980/11 1981/82 1992/83 1903/84 1904/SB 19#5/86 1966/87 197/08 19BB/B9 19B9/90 1990/91 1991/92 a/
oman Dogmatic Product La 16569 xS466 29037 31644 37004 415S6 47064 $5350 63715 72303 B4763 96944 117921
PlAs not Tdizoct Taxo" BOS 1041 1951 2117 23S6 2861 S364 S98B 8258 5437 6245 7004 8268
gmor DMc tic Puoduct Up 17394 27307 30908 33761 39390 44417 50420 59246 69973 77740 91008 103948 126186
Plus bacwt d ocf d and NfS 2466 S357 S82B 7196 7661 9317 11218 13132 163S0 19202 21791 28756 403S2
fotal Raogurces Available-Use 19060 32664 36016 40957 47051 S3734 61646 72378 8S323 96942 112799 132704 166a51
Sotal Consution 15354 24333 27910 S0274 35504 30170 44341 S1925 61369 70030 04338 96294 114257
Private ceuwpstion 14060 22411 2S272 27450 Sleso 33907 39408 4535S 52858 60844 73990 84209 101690
Public Consumtion 12r 1922 2630 3416 3644 4.171 5133 6570 0511 91B6 10348 12005 12567
Sotal xnvo.stm.t 2632 400 5S314 6620 7351 10184 105S9 12099 15237 17109 17611 21966 27669
Omoaa ised Capital r.o t 2443 4299 546S 6576 6907 9386 9431 l182S 13414 1408S 15S37 19672 23620 o
Publia 632 1023 24B7 2941 3139 3629 3909 4727 5483 7209 0331 9770 94S2 Ln
rivat,e 1ll 2476 2970 3635 3760 5757 SS22 7090 7931 6076 7206 9902 14160
Chang In Stock 189 509 -151 52 444 790 l160 1073 1823 3023 2074 2294 4048
sho-t off Goods and Ise 1874 3523 3S592 345S 4196 5372 5606 7555 6717 9004 10850 14444 24593
_rand ztin
Gross Dogastic Savings 2040 2974 3078 2807 3086 6239 5007 7321 7804 7710 6670 7654 11929
not hater mom 277 587 613 697 625 661 709 1.204 1575 1714 2041 2147 2716
Net curent Srensfer 375 951 1220 1573 1490 1436 1532 1469 1435 1364 1250 1912 2171
Cues. National Savings 2692 45S2 4921 4957 6009 0336 0120 999t 10014 10780 9969 11713 16096
Private 2251 S454 3S76 4113 4873 7326 7069 0154 0203 0697 7353 553 131U43
Publc 441 1058 1045 845 1136 1010 101 1840 2531 2101 2616 3160 3673
atom Entoaml Product ap 17671 2794 31603 34459 40015 45070 51137 604so 70540 79454 93049 10609S 120902
af Pelimanary antimten
kurce: cntral Ducca of statistics.
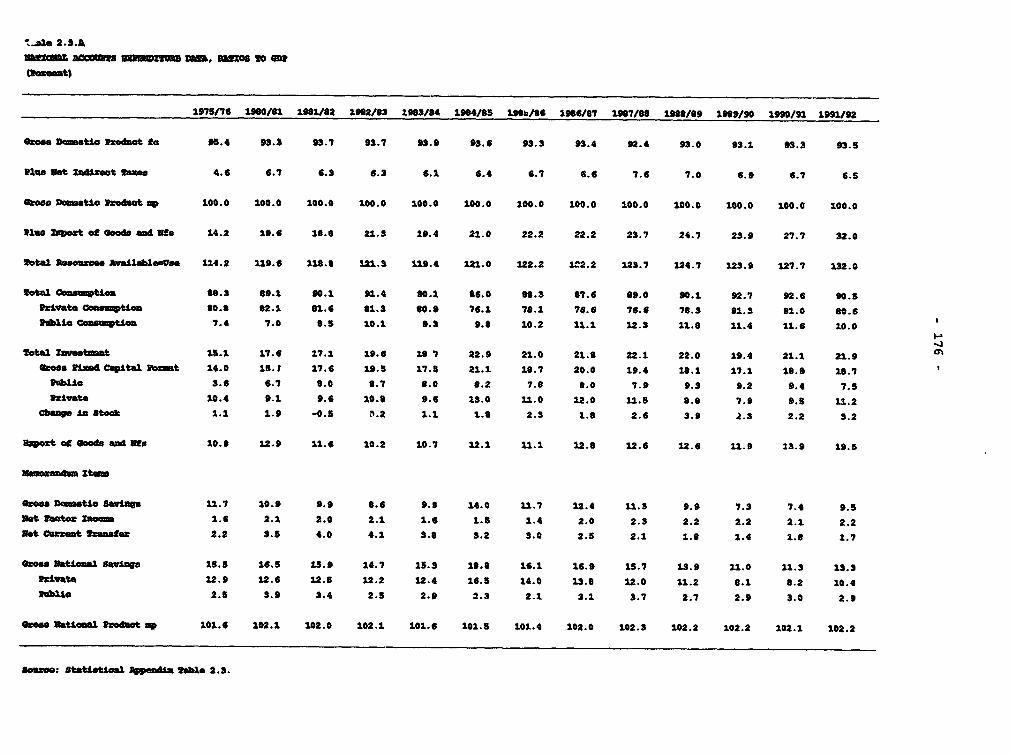
- s.o 2.3.A
_mL , ama!, 3!UM , WOO 0 GM
1975/76 19'0/01 1981/02 1902/03 29803/4 1984/85 19*b/86 1986/87 1987/00 1988/09 1909/90 1990/91 1991/92
_f., Dmastio Pods.t to 95.4 93.3 93.7 93.7 93.9 93.6 93.3 93.4 92.4 93.0 93.1 93.3 93.5
*CJ Net ladi"eot Taxes 4.6 6.7 6.3 6.3 6.1 6.4 6.7 6.6 7.6 7.0 6.9 6.7 6.5
4s." Dmatio Podeot up 100.0 100.0 100.0 100.0 100.0 100.0 100.0 100.0 100.0 100.0 100.0 100.0 100.0
P1s Inpost of Goods and Ns 14.2 19.6 18.0 21.3 19.4 21.0 22.2 22.2 23.7 24.7 23.9 27.7 32.0
2taO fle.uzae Availablog".e 114.2 119.6 11U.8 121.1 119.4 121.0 122.2 122.2 123.7 124.7 123.9 127.7 132.0
getal" 0-mstioan 90.3 09.1 90.1 91.4 90.1 *6.0 80.3 07.6 09.0 90.1 92.7 92.6 90.S
hrivate Comauntilon 80.8 02.1 01.6 01.3 00.9 76.1 78.1 76.6 76.6 78.3 91.3 81.0 00.6
'b1vm C0ounmtuos 7.4 7.0 0.5 10.1 9.3 9.0 10.2 11.1 12.3 11.0 11.4 11.6 10.0
lotal Iavesnt 15.1 17.6 17.1 19.6 19 7 22.9 21.0 21.8 22.1 22.0 19.4 21.1 21.9
OzSa Fixsed Capital Dormat 14.0 15.1 17.6 19.5 17.5 21.1 10.7 20.0 19.4 18.1 17.1 18.9 18.7
labile 3.6 6.7 0.0 8.7 8.0 9.2 7.8 8.0 7.9 9.3 9.2 9.4 7.5
Paivate 10.4 9.1 9.6 10.8 9.6 13.0 11.0 12.0 11.5 8.0 7.9 9.5 11.2
Cbange in Bt.ah 1.1 1.9 -0.3 0.2 1.1 1.0 2.3 1.8 2.6 3.9 2.3 2.2 3.2
EbqpVt at Goods and RSY 10.0 12.9 11.6 10.2 10.7 12.1 11.1 12.B 12.6 12.6 11.9 13.9 19.5
ee4 tos0atin Savins 11.7 10.9 9.9 0.6 9.9 14.0 11.7 12.4 11.3 9.9 7.3 7.4 9.5
net asctor Ions, 1.6 2.1 2.0 2.1 1.6 1.5 1.4 2.0 2.3 2.2 2.2 2.1 2.2
xet Cumomnt !zanier 2.2 3.5 4.0 4.1 3.8 3.2 3.0 2.5 2.1 1.8 1.4 1.B 1.7
6ams Eatioml Saving 15.5 16.5 13.9 14.7 15.3 10.8 16.1 16.9 15.7 13.9 11.0 11.3 13.3
ltivate 12.9 12.6 12.5 12.2 12.4 16.5 14.0 13.0 12.0 11.2 8.1 8.2 10.4
Publio 2.5 3.9 3.4 2.5 2.9 2.3 2.1 3.1 3.7 2.7 2.9 3.0 2.9
ces Watiosal Produat up 101.6 102.1 102.0 102.1 101.6 101.5 101.4 102.0 102.3 102.2 102.2 102.1 102.2
Ocuger: Statist4cal Appendix Pablo 2.3.
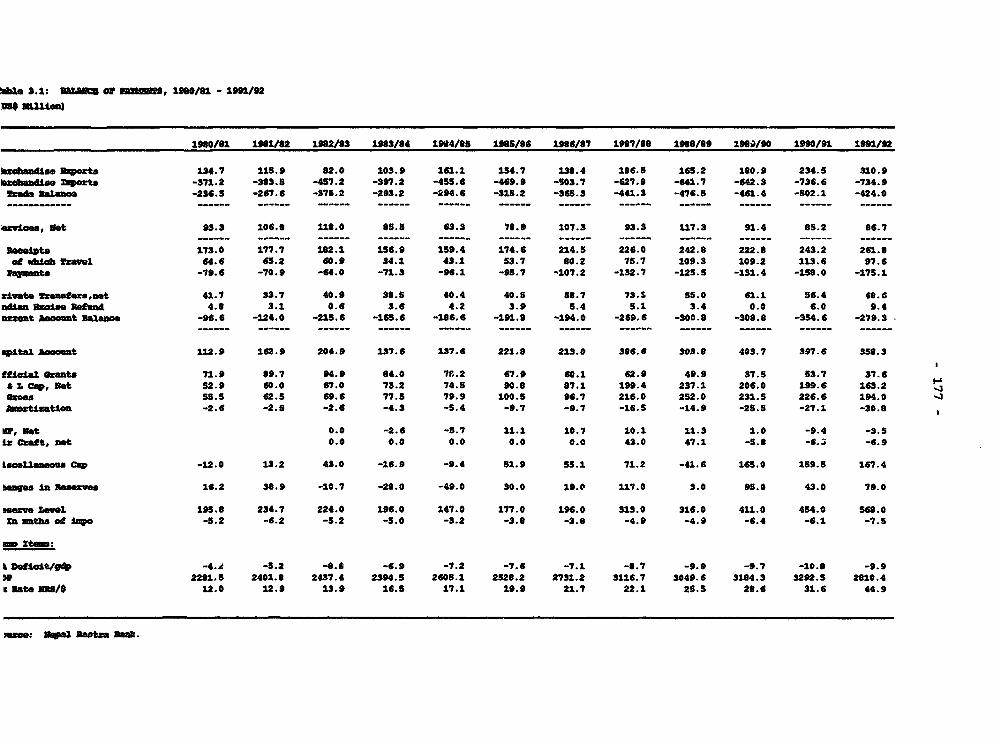
be 3.1: 1Wh3O 0 iuin , 1980/81 - 19 291
1980/S1 1981/82 192/3 1913/84 1984/55 19BS/86 1986/87 1987/SB 1988/69 1982)/90 1990/91 1991/92
_obaudise l3pezta 134.7 115.9 62.0 103.9 161.1 154.7 138.4 186.5 165.2 160.9 234.5 310.9aidbaaiin Zezts -371.2 -303.5 -4S7.2 -397.2 -455.6 -469.9 -503.7 -627.8 -641.7 -642.3 -736.6 -734.9!taie SaLana. -236.5 -267.6 -375.2 -293.2 -294.6 -315.2 -36S.3 -441.3 -476.5 -461.4 -502.1 -424.0
eawiaS, not 93.3 106.0 110.0 5.5 63.3 70.9 107.3 93.3 117.3 91.4 B 5.2 86.7
aeaPta 173.0 177.7 182.1 156.9 159.4 174.6 214.5 226.0 242.8 222.8 243.2 261.9oE vh Trzavel 64.6 45.2 60.9 34.1 43.1 53.7 60.2 75.7 109.3 109.2 113.6 97.6ntap t -79.6 -70.9 -64.0 -71.3 -96.1I -95.7 -107.2 -132.7 -12S.S -131.4 -158.0O -175.1
tiwate ftauser snt. 41.7 33.7 40.9 3S.5 40.4 40.5 58.7 73.S 55.0 61.1 56.4 40.6diant e"se Refund 4.8 3.1 0.6 3.6 4.2 3.9 5.4 5.1 3.4 0.0 6.0 9.4.zzt Amount salame -96.6 -124.0 -215.6 -165.6 -166.6 -191.8 -194.0 -269.6 -300.8 -305.6 -354.6 -279.3
QitaL Aoeunt 112.9 162.9 204.9 137.6 137.6 221.8 213.0 386.6 303.6 403.7 397.6 355.3
fial alL ants 71.9 S9.7 94.9 64.0 78.2 67.9 60.1 62.9 49.9 37.5 53.7 37.63 c, not 52.9 60.0 67.0 73.2 74.5 90.B 87.1 199.4 237.1 206.0 199.6 163.2
oxoss 55.S 62.5 69.6 77.5 79.9 100.5 96.7 216.0 252.0 231.S 226.6 194.0>rtisatioa -2.6 -2.5 -2.6 -4.3 -5.4 -9.7 -9.7 -16.S -14.9 -2S.5 -27.1 -30.6
Mr, not 0.0 -2.6 -5.7 11.1 10.7 10.1 11.3 1.0 -9.4 -3.5i exact not 0.0 0.0 0.0 0.0 0.0 43.0 47.1 -5.B -6.S -6.9
Iaaellaneu Cap -12.0 13.2 43.0 -16.9 -9.4 51.9 55.1 71.2 -41.6 165.0 159.5 167.4
hane in aesaezv 16.2 38.9 -10.7 -26.0 -49.0 30.0 19.0 117.0 3.0 95.0 43.0 79.0
aerve Level 19S.6 234.7 224.0 19.0 147.0 177.0 196.0 313.0 316.0 411.0 454.0 568.0Xs ntba of 1 o -s.2 -6.2 -5.2 -5.0 -3.2 -3.8 -3.6 -4.9 -4.9 -6.4 -6.1 -7.5
no 1tm:
L 9ajl"t/S* -4.2 -5.2 -B.6 -6.9 -7.2 -7.6 -7.1 -B.7 -9.9 -9.7 -10.B -9.9n 22B1.5 2401.6 2437.4 2394.5 2605.1 2520.2 2731.2 3116.7 3049.6 31S4.3 3292.5 2810.4t Rate 235/8 12.0 12.9 13.9 16.5 17.1 19.9 21.7 22.1 25.5 26.6 31.6 44.9
mac NJe1l Ratza 1aab.

rable 3.2
oanoomus or Twu Byr S6TC Grim
"S. ILllm
197S/76 19,0/01 1901/02 1982/83 1903/84 1984/8S 1985/96 1906/97 1907/80 198989 1989/90 1990/91 1991/92
aports, f.o.b. 1185.8 160S.6 1491.5 1132.0 1703.0 2740.6 3078.0 2991.4 4128.3 4211.1 5169.5 7403.3 13938.0
rood and live aniinls 804.0 500.7 735.9 327.7 584.1 992.1 835.6 703.7 004.4 577.6 616.0 986.0 2096.0
2bbaoqo anid bvaanoges 4.0 15.4 10.4 13.3 5.3 5.0 0.2 3.S 10.1 6.6 4.0 12.0 4.0
Crod- mat egi:s, Luedsl4 , except fuels 226.3 561.6 397.3 336.4 372.7 416.0 412.9 491.1 513.7 249.9 239.0 312.0 479.0
liaxl fgols and lubzrcmtn 1.7 0.4 1.0 0.7 3.3 1.0 0.2 0.i 0.8 - - - -
Animal nsd vegtLable oLls and fate 1.8 37.8 44.0 42.2 67.6 57.1 61.3 117.1 171.5 100.3 20.0 202.0 120.0
Cheicals and drugs 9.3 3.9 1.5 1.8 6.3 1.2 2.5 2.0 12.6 26.0 11.0 18.0 31.0
bacfaatuod goowd, abiefly classified
by naterisl 104.7 254.3 225.4 357.3 681.6 649.1 899.9 1009.5 1601.6 1902.6 2693.0 4312.0 7628.0
_biazy aad t:ansUoztatioa *qpi_t 3.7 1.0 9.1 7.9 24.4 33.7 38.6 2.6 0.5 5.8 0.0 0.0 0.0
other anoufactured pzodtacts 23.0 143.0 58.1 44.6 57.7 513.4 826.S 661.5 996.9 1246.5 1573.0 1546.0 3581.0
Other 7.3 1.7 0.8 0.1 0.8 L.2 0.3 0.2 16.2 15.8 13.5 15.3 -
Iopruts, c.l.f. 1901.0 4420.2 4930.2 6314.0 6514.3 7742.1 9341.0 10905.2 13093.0 16356.8 18355.7 23255.7 329S2.6
rood and live -n4lals 291.1 601.2 619.2 924.7 728.4 782.9 971.1 1028.9 1523.7 1332.6 1607.7 1821.0 3671.0
Tobacco and besazaes 42.4 24.0 35.6 62.5 71.0 79.4 112.9 144.0 172.2 197.1 226.6 256.9 152.0
Cradf atezials, inadibles, except fuels 88.7 115.S 142.6 206.3 266.2 424.5 393.0 657.2 1036.9 1102.7 1571.1 2013.0 3751.0
Miueral fnels and lubrioants 211.7 583.6 579.3 701.9 749.2 918.0 1054.0 929.5 1049.9 1116.7 1515.5 2278.0 3673.0
nnuzl and vegetable oils and fats 7.4 92.5 64.3 66.3 78.5 122.7 101.9 175.9 352.6 402.7 476.3 742.0 813.0
Chemioals and drugs 190.1 527.3 599.2 646.0 698.4 908.0 1110.0 1287.6 1495.3 1532.7 2823.9 1051.0 4437.0
)buuiactured goods, cbiefly classified
br mteriaL1s 545.9 1259.2 1SSS.5 1936.8 1001.9 2376.9 2759.5 3226.9 3359.2 4671.0 5065.0 5951.0 8751.0
Maucinry and transportatioan equlpmt 413.4 802.9 892.0 1180.9 1651.2 1671.4 2134.7 2184.1 4143.7 4847.0 3790.4 5990.0 5873.0
Otbei nuasoaatwred psdtats 168.4 407.6 430.2 S04.3 466.3 450.6 637.2 664.0 729.1 1036.5 1247.8 1121.0 1657.0
Other 22.7 13.6 12.3 4.3 2.4 6.9 6.7 7.3 31.2 37.0 31.4 31.0 174.6
Sow"e: _1a Sstra Sak.

Tole 3.3
amwumc@IW o Wmm van IUD
M. nuioX
1975/76 1990/81 19S1/S2 1902/03 1903/94 1904/95 1993/86 1986/87 1907/08 1908/09 1989/90 1990/91 1991/92 a/
bpeztm, f.o.k. 893.7 992.4 994.2 843.3 1160.7 1601.7 1241.1 1302.5 1581.2 1050.7 61S.S 1S67.5 1S68.0
Food and live anhw1m 721.6 484.2 S3S.S 317.S s61.2 872.0 S73.0 560.0 773.2 498.6 349.0 789.0 040.0tobao zad bevaeages S.5 0.4 1.6 12.S 4.5 4.6 0.1 2.7 1.8 1.4 1.0 3.0 4.0Cude mtegias, inedibles, except fuels 136.1 444.1 296.9 264.9 266.9 338.1 3S4.5 459.6 389.8 217.4 180.0 212.0 310.0Mineal fhels and luhlcanta 1.0 0.0 1.0 0.7 3.3 1.0 0.2 0.2 O.8 - - - -A3MLZ and vegetable oils and fats 1.4 37.6 41.9 42.2 67.6 57.0 56.0 73.8 144.3 97.1 11.0 1B5.6 120.0
eo -l and dznga S.9 0.1 0.9 0.9 1.0 0.9 1.0 1.2 11.1 16.5 0.0 8.0 9.0Ibaffactured good , chiefly cls.ified
bywte1a1 14.5 19.0 91.6 191.S 227.4 295.0 201.7 193.1 228.5 181.0 $3.0 338.5 256.0)babjmey a tzanpzortatiL equAmnt 1.4 1.3 S.S 7.1 22.4 32.6 37.5 0.9 0.1 4.2 0.0 0.1 0.0Other unnufaotumed pxodtota 3.1 4.6 15.6 5.6 4.6 8.6 6.B 10.8 15.7 18.7 8.0 16.0 29.0Other 5.3 0.9 0.6 0.1 0.8 1.2 0.3 0.2 15.9 15.8 13.S 15.3 -
tpozts c.L.f. 1227.2 2179.2 2280.9 2499.6 3058.0 389S.6 3971.0 4262.1 4619.9 4271.6 470S.3 73S1.0 11816.S
20.4 and lUve anlIs 259.2 473.6 446.7 564.4 S52.7 676.9 738.5 764.2 1163.2 921.9 1138.3 1497.0 3111.02bkuaco and bevarag_ 31.9 24.0 30.0 46.8 69.7 74.d 112.1 140.6 163.0 187.3 202.8 254.0 142.0Crafd watfeila, inedlbleo, aecpk fuels 31.1 69.0 100.1 89.2 134.3 199.8 99.0 143.2 128.9 87.9 80.5 178.0 303.0Mmemzal helm and lubricants 95.3 51.7 50.1 65.0 9S.2 151.2 149.3 133.2 146.7 94.4 36.9 210.0 372.0ahiL sand vegetable olls and Sato 5.5 23.8 11.1 26.4 47.2 62.1 15.8 5.0 6.4 3.6 0.6 2.0 0.0Cihecas anA dung. 114.* 273.4 341.9 376.3 410.6 512.9 547.1 672.1 816.9 652.5 934.4 1280.0 1829.0
# eufaotue goods, cielr classified
by iteasxla 409.S 655.1 714.8 763.4 940.0 1293.7 1399.2 1401.7 1097.6 1218.9 1352.4 1949.0 3295.0obiLLnez a tsansapxtaet±c equ"imt 159.1 399.7 391.0 410.4 649.0 694.1 693.4 7S6.0 825.9 018.9 687.9 1629.0 2260.0Otb n nuLfaotuxred pxsoccs 105.4 199.3 200.2 1S7.4 1S7.4 227.7 213.2 242.2 242.7 251.6 240.6 322.0 514.0Otbhs 17.3 9.4 4.1 0.3 2.9 2.9 3.4 3.9 26.6 34.7 30.9 30.8 0.5
Pr ozvisional.
Sawe: Nepol histsa Dani%, astca based dat.

9&W4 3.4
xmw WA=w aap eu
-l. 9011.
197S/76 1900/e1 1981/82 1982/93 1983/04 1994/85 19#/86 1906/87 1987/i: 1990/89 1909/90 1990/91 199/92
1. ampeets to IndiL 669.1 S24.0 440.3 372.8 300.4 652.9 414.9 305.9 483.2 321.1 190.4 424.2 295.5
Ri.o suake) 495.4 117.6 196.5 11.3 75.2 236.3 93.2 14.4 0.0 0.0 0.0 0.0 0.0
Wdare 54.1 226.2 87.2 28.8 7.9 8.6 0.0 0.0 0.0 0.0 0.0 0.0 0.0
maLze 0.0 24.S 26.1 0.3 0.4 10.0 0.0 0.0 0.0 1.3 0.1 3.8 0.0
Ibatard a ZIlseeds 40.3 0.0 0.0 0.0 75.8 18.8 59.1 103.1 141.3 49.8 11.2 62.1 61.0
Nebas 2.8 16.5 6.4 S.9 8.0 2s.. 16.6 8.1 16.4 13.5 6.9 2;.3 13.2
tfba 60.S 54.0 26.2 36.8 45.0 28.0 47.0 46.6 46.7 49.1 18.7 27.6 13.2
txled "nl" 13.0 10.8 15.3 19.3 37.0 28.3 30.3 35.2 37.3 29.0 17.6 29.4 16.2
Mv ate 0.0 46.4 43.4 05.3 36.5 43.9 2.3 14.5 44.1 33.8 133.7 S.7 0.0
Jate CutttiWo 0.0 17.7 10.2 S.2 1.2 0.0 u.0 0.0 8.6 10.5 0.0 0.0 O.S
jute goods 0.0 10.3 81.0 179.7 211.8 254.0 167.4 164.0 188.7 134.1 11.2 272.3 191.4
o/l HussABn 0.0 3.6 27.1 70.5 91.7 117.1 78.2 91.0 84.9 38.S 2.2 103.2 72.2
o/W v0klna 0.0 S.9 49.8 e 8.6 85.6 85.6 S7.9 40.6 68.4 46.7 4.0 78.0 29.5S
o/l T"Iri 0.0 0.8 4.1 12.6 34.5 51.3 31.3 32.4 35.4 20.9 S.0 89.1 89.7
XX. Uxponta to !Lixd Counttsiw 63.7 27S.1 268.1 261.1 466.6 1089.7 1697.1 1380.3 23S6.4 3046.0 4301.7 S573.4 11400.2
zaxqe Camuxhnm 18.0 13.4 7.4 5.9 6.5 14.6 23.7 100.6 0.0 14.9 5.6 0.0 0.0
Ride" & Skins 24.9 117.7 93.3 93.1 1lS.6 242.7 233.2 21.6 162.3 161.3 283.9 210.6 218.0
Pulaes 0.0 0.0 58.2 3.0 6.0 97.6 240.4 0.0 0.0 46.0 200.0 169.9 1144.3
cazspe 9.3 56.2 04.0 137.0 265.4 249.4 376.4 624 4 1223.7 1620.2 2331.4 3733.0 703S.1
suadicrafts 12.7 83.8 12.2 9.4 12.6 12.7 17.7 32.4 S3.8 77.9 72.7 06.9 159.9
seaeewmd ftzmants 0.0 0.0 13.0 10.0 20.5 472.7 003.7 609.3 916.6 1117.7 1399.3 1372.2 *251.9
T. lotal (X and II) 733.8 799.1 708.4 633.9 967.0 1742.6 2112.0 1774.2 2839.6 3367.1 4501.1 5997.6 12103.7
Douexs: !zade Vzantlob Centow and Nepel Maltra Eank.

nI&= 3.5D3 X~0 01 38
MSG. ml11o
1974/75 1980/01 1981/J2 1902/83 1903/04 1904/O5 1905/36 1986/87 1997/OS 1999/09 1999/90 1990/91 1991/92
b.eta 009.6 1600.7 1491.5 llS2.0 1703.9 2740.6 3070.0 2991.4 4114.6 4195.3 5235.5 7603.7 13939.4
India 746.7 02.4 994.4 043.3 1160.7 1601.7 1241.1 1302.6 1567.0 1034.9 666.6 1701.2 1568.9
Other Conntzies 142.9 616.3 497.1 200.7 543.2 l113.9 1856.9 1680.0 2S46.8 3160.4 4569.9 5902.5 12370.5
ttporot 1014.6 4420.2 4930.3 4314.0 6514.3 7742.1 9341.2 10905.2 13069.6 16263.7 18401.3 24197.9 32951.3
India 1475.7 2179.2 2260.9 2499.6 30S8.0 3095.6 3970.9 4262.0 4593.0 4230.7 4646.3 7772.4 11815.9
Other Coutzies 338.9 2249.0 2649.4 3014.4 3456.3 3046.3 S370.3 6643.2 9273.0 12023.0 1373S.2 16425.5 21135.4
tueds Blau"m -92S.0 -2019.5 -3438.8 -5102.0 -4810.4 -5001.S -6263.2 -7913.0 -975S.0 -12068.4 -13166.0 -16594.2 -19011.9
IndI -729.0 -1186.0 -1206.8 -1656.3 -1897.3 -2294.1 -2729.0 -2959.4 -3028.0 -3203.0 -3979.7 -8071.2 -10247.0
Otbh. COuAtui.s -196.0 -1632.7 -2152.3 -3S2S.7 -2913.1 -2707.4 -3533.4 -49S4.4 -6727.0 -9964.6 -9106.3 -10523.0 -0764.9
ftl. .a oSad. 2704.2 6036.9 6421.8 7446.0 0218.2 10402.7 12419.2 13996.6 17994.2 20459.0 23637.0 31801.6 46090.7
IndIa 2222.4 3171.6 327S.3 3342.9 4210.7 5497.5 5212.0 5564.6 6163.6 5273.6 5312.9 9473.6 13304.0
Otb4r CaUntZ .Ai 491.6 2065.3 3146.5 4103.1 3999.3 4905.2 7207.2 0332.0 11820.6 15105.4 10324.1 22328.0 3350i.9
VW: aot abate(0
Indi- 83.9 61.7 66.7 74.5 68.1 50.4 40.3 43.5 30.1 24.7 12.7 22.4 1.3
Other Countrlts 16.1 30.3 33.3 25.5 31.9 41.6 39.7 56.5 61.9 75.3 87.3 77.6 00.7
India 81.3 49.2 46.3 39.6 46.9 50.3 42.5 39.1 35.1 26.1 25.2 32.1 35.9
Other Countsi. 10.7 50.0 53.7 60.4 53.1 49.7 S7.5 60.9 66.9 73.9 74.8 67.9 64.1
Wade 3aa_ndAL 70.0 42.1 37.4 32.0 39.4 45.9 43.6 37.4 31.0 26.5 30.2 36.6 53.9
Otbor Countrfs 21.2 57.9 62.6 68.0 60.6 54.1 56.4 62.6 69.0 73.3 69.0 63.4 46.1
tIdi -2.2 52.5 51.0 44.9 51.3 52.4 42.0 40.0 34.3 2S.0 22.5 29.0 28.S
Otbhr CoWntries 17.6 47.5 49.0 55.1 40.7 47.6 58.0 60.0 65.7 74.2 77.5 70.2 71.3
m: Nev Instra Bank
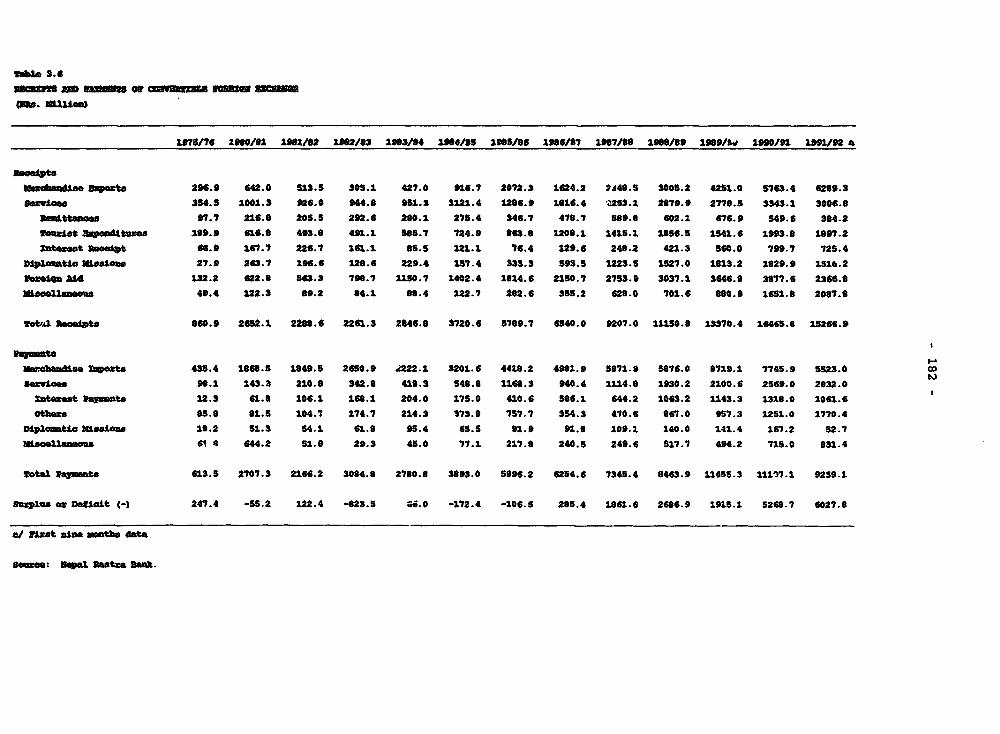
table - 94mso mm6uwm
(A. 111.a)
1075/76 1N91 1901/92 1952/83 1363/84 19U4195 1935/86 1986/97 1997/86 1990/89 1909/A 1990/91 1/92
mezoban6tne Unt_ 296.9 642.0 513.S 305.1 427.0 916.7 2072.3 1624.2 2j48.5 3005.2 4281.0 5763.4 6289.3
8ozviea 354.5 1001.3 926.0 944.8 9S1.5 1121.4 1286.9 1816.4 '.253.1 2879.9 2778.5 3343.1 3006.0
97.7 216.9 205.S 292.6 290.1 275.4 346.7 478.7 589.8 602.1 676.9 549.6 384.2
1.521t 8* eitt1ns 199.9 616.8 493.0 491.1 W55.7 724.9 863.8 1200.1 1415.1 1856.5 1541.6 1993.0 1697.2
lategeot 9moedt 66.9 167.7 226.7 161.1 65.5 121.1 76.4 129.6 248.2 421.3 560.0 799.7 725.4
D1p1a meiss" 27.9 263.7 194.6 128.6 229.4 157.4 333.3 593.5 122S.5 1527.0 1613.2 1829.9 1516.2
lomIqe JId 132.2 622.8 563.3 796.7 11S0.7 1402.4 1814.6 2150.7 2753.9 3037.1 3646.8 3077.6 2366.8
-aoe11aaemin 49.4 122.3 69.2 84.1 88.4 122.7 202.6 355.2 628.0 701.6 890.9 16S1.9 2087.8
14*&'Al1 AaeOs 860.9 2652.1 2288.6 2261.3 2046.9 3720.6 5789.7 6540.0 9207.0 11150.9 13370.4 16465.0 15266.9
)bidObandiee zott 435.4 1868.5 1649.5 2650.9 4222.1 3201.6 4419.2 4981.9 5971.9 5876.0 8719.1 7745.9 SS23.0 c
so8yloe 98.1 143.3 210.0 342.6 418.3 S48.0 1168.3 940.4 1114.6 1930.2 2100.6 2569.0 2832.0
13t*50t 8a* nts 12.3 61.8 106.1 168.1 204.0 175.0 410.6 S86.1 644.2 1063.2 1143.3 1318.0 1061.6
Otba 85.8 91.5 104.7 174.7 214.3 373.8 757.7 354.3 470.6 867.0 957.3 1251.0 1770.4
Dmlptia )Uha^i< 18.2 S1.3 54.1 61.8 95.4 65.5 91.9 91.8 109.1 140.0 141.4 167.2 52.7
1 _.sm11ene.s 6? 4 644.2 51.6 29.3 45.0 77.1 217.0 240.5 249.6 517.7 494.2 715.0 831.4
lotal Patmte 613.5 2707.3 2166.2 3084.8 2780.8 3993.0 5096.2 6254.6 7345.4 8463.9 1145S.3 11107.1 9239.1
Suzplne es Dfait -) 247.4 -55.2 122.4 -823.5 ".0 -172.4 -106.5 28S.4 1861.6 2686.9 1915.1 5268.7 6027.9
a/ VSzft nine 23tb8 data
Some: _mp1l Emotes sank.
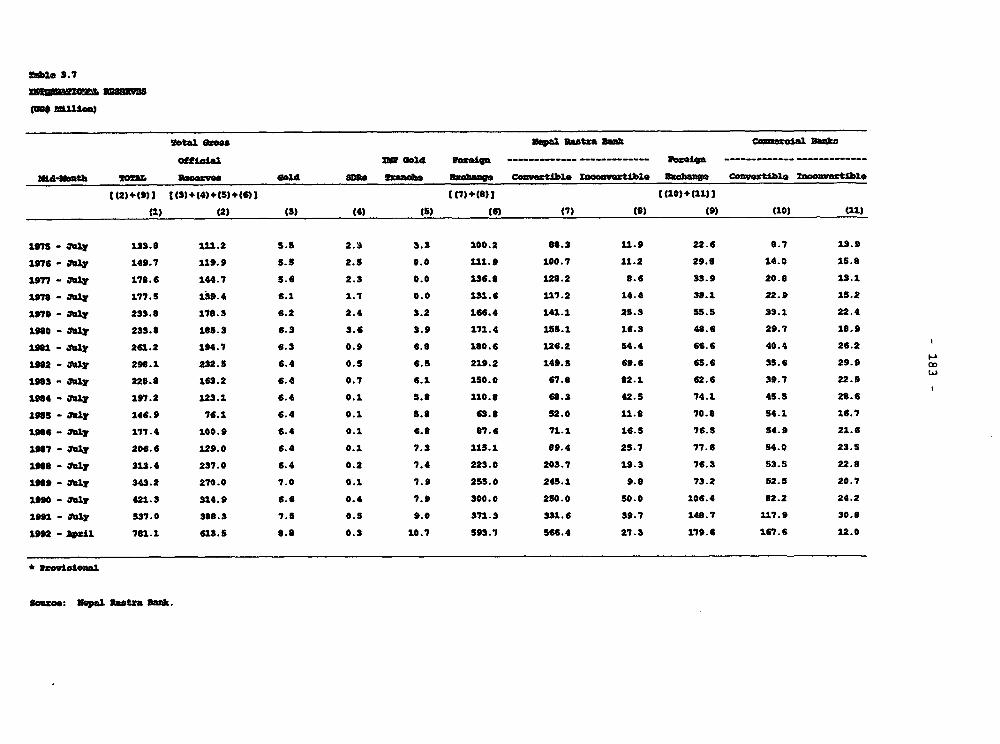
SeW S. 7
- mi.w
sow tal Z Nepel bAtza Bank colmoal 3saw
0oSj.o1al zW Cad4 Vcx1ga ------ ------ oe - ----- ---- -
mid4bmotb 20MA eanezyas a"1 MUS ftanabe Saabaawt*rncveto tgs Cov~11 Iapat~. obie 0nvwztib1 ZaoCUSwtt1b1e
(1) (2) (3) (4) (5) ()(7) (9) (9) (10) (1a)
197 - ft1y 133.6 111.2 5.5 2.3 3.3 100.2 66.3 11.9 22.6 0.7 13.9
1976 - .7f2 149.7 119.9 5.5 2.5 0.0 111.9 100.7 11.2 29.6 14.0 15.6a
1877 - Ufly 176.6 144.7 5.6 2.3 0.0 136.6 1L28.2 6.6 33.9 20.0 13.1
1876 - say1 177.5 139.4 6.1 1.7 0.0 131. 6 117.2 14.4 36. 1 22.9 15.2
1979 - ftb1y 233.6 170.3 6.2 2.4 3.2 166.4 141.1 25.3 55.5 33.1 22.4
1960 - sa1y 233.0 165.3 6.3 3.6 3.9 171.4 155.1 16.3 46.6 29.7 16.9
1361 - .113' 261.2 194.7 6.3 0.9 6.6 180.6 126.2 54.4 66.6 40.4 26.2
1962 - .m1y 296.1 232.5 6.4 0.5 6.5 219.2 149.5 69.6 65.6 35.6 29.9
1963 - fn1y 225.6 163.2 6.4 0.7 6.1 150.0 67.0 62.1 62.6 39.7 22.9
1964 - E01y 197.2 123.1 6.4 0.1 5.6 110.6 66.3 42.5 74.2. 45.5 26.6
1oss5- UI2y 146.9 76.1 6.4 0.1 5.6 63.6 52.0 11.6 70.6 54.1 16.7
1966 - OMTh1 177.4 100.9 6.4 0.1 6.9 97.6 71.1 16.5 76.5 S4.9 21.6
1967 - f.1y 206.6 128.0 6.4 0.1 7.3 115.1 09.4 25.7 77.6 54.0 23.S
1966 - Uu1y 318.4 237.0 6.4 0.2 7.4 223.0 203.7 19.3 76.3 S3.5 22.0
1969 - at1r 343.2 270.0 7.0 0.1 1.9 255.0 245.1 9.0 73.2 52.5 20.7
1990 - ML 421.3 314.9 6.6 0.4 7.9 300.0 250.0 50.0 106.4 02.2 24.2
1961 - oar 537.0 368.3 7.5 0.5 9.0 371.3 331.6 39.7 146.7 117.9 30.6
1992 - awel 761.1 613.5 6.6 0.3 1.0.7 593.7 566.4 27.3 119.6 167.6 12.0
* I.OvloDiem&
lne:Nepal RasIza Sank.
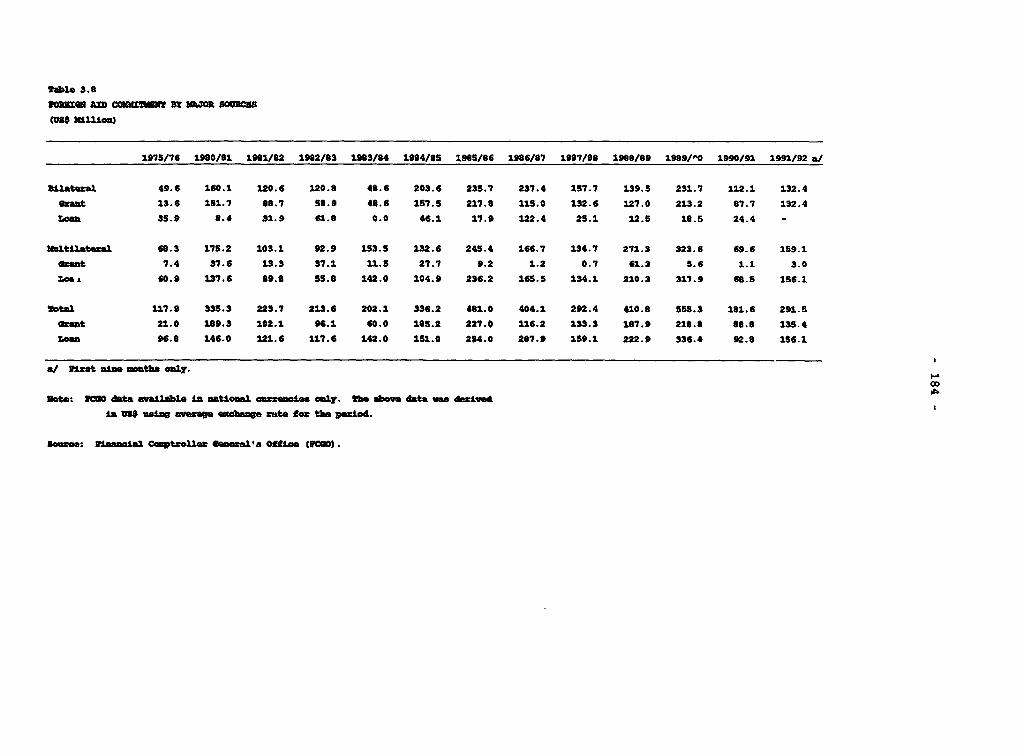
!abl. 3.0
1w0 AiD COUB' Ba3r0R SOUS
(U0$ wiflica)
1975/76 1900/91 1981/B2 1902/S3 1983/84 1984/S5 1905/96 1986/07 19S7/00 1900/89 1989/^0 1990/91 1991/92 a/
llatozal 49.6 160.1 120.6 120.0 40.6 203.6 235.7 237.4 157.7 139.5 231.7 112.1 132.4
Aaut 13.6 151.7 00.7 50.9 40.6 157.5 217.0 115.0 132.6 127.0 213.2 87.7 132.4
raoo S5.9 0.4 31.9 61.0 0.0 46.1 17.9 122.4 25.1 12.5 10.5 24.4 -
lblAtlaral 60.3 175.2 103.1 92.9 153.5 132.6 245.4 166.7 134.7 271.3 323.6 69.6 159.1
ent 7.4 37.6 13.3 37.1 11.5 27.7 9.2 1.2 0.7 61.3 5.6 1.1 3.0
18A. 60.9 137.6 89.0 55.0 142.0 104.9 236.2 165.5 134.1 210.3 317.9 60.S 1S6.1
Wotal 117.9 335.3 223.7 213.6 202.1 336.2 401.0 404.1 292.4 410.0 555.3 101.6 291.S
gmt 21.0 109.3 102.1 96.1 60.0 108.2 227.0 116.2 133.3 107.9 210.0 00.8 135.4
r.ca "94.0 146.0 121.6 117.6 142.0 151.0 254.0 207.9 159.1 222.9 336.4 92.0 156.1
/ zt 3e Netb onl-
Ut. V= data avallable In natIoal am.oi.. ionly. !h. abov data mm derived
in =$ u8. 4 avweage ahane tt fort tb. peiod.
s8ne.: Vllsnal mpXtouo meaalX OCeti" (10).
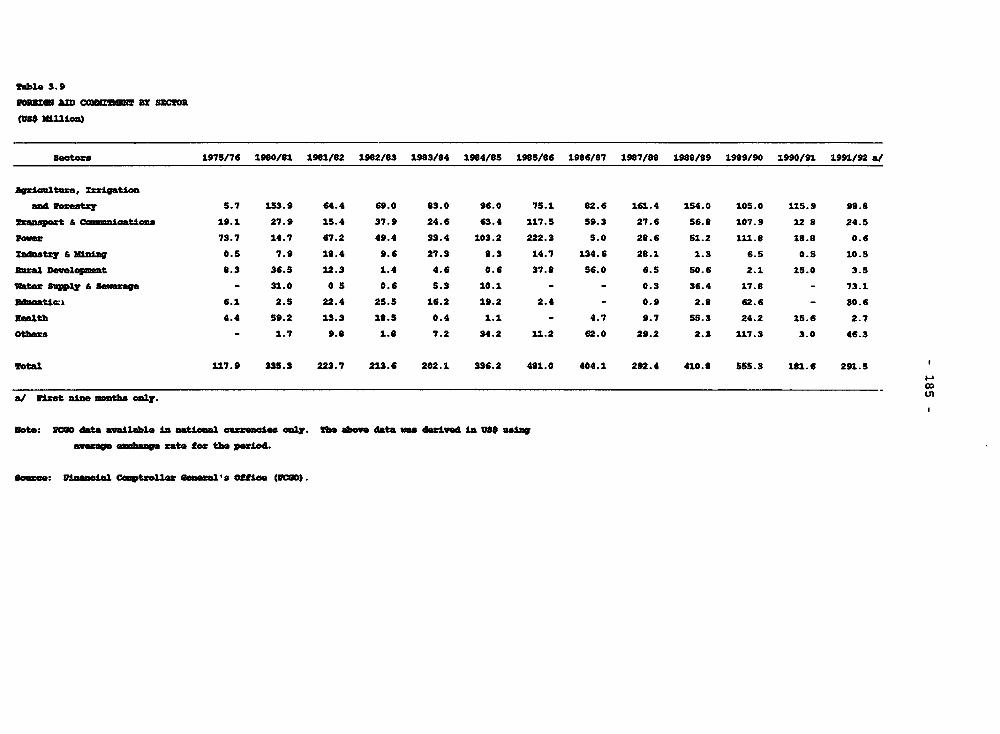
fable 3.9
go=W AZD COSiZU By SRC!OR
(VS* MU±enLO
seatorn 1975/76 1980/81 1981/82 1982/83 1993/64 1984/8S 1965/66 1966/67 1987/66 1986/89 1969/90 1990/91 1991/92 a/
Agqi±altm, Srrigatio
and lozatzy S.7 153.9 64.4 69.0 63.0 96.0 7S.1 62.6 161.4 154.0 lOS.0 11S.9 99.6
2xanarpot 6 Cc3sania tiona 19.1 27.9 1S.4 37.9 24.6 63.4 117.5 S9.3 27.6 56.6 107.9 12 8 24.5
Pow.a 73.7 14.7 67.2 49.4 33.4 103.2 222.3 S.0 26.6 S1.2 111.8 18.8 0.6
Znantzy a mnaini O.S 7.9 16.4 9.6 27.3 6.3 14.7 134.6 26.1 1.3 6.5 O.S 10.S
Bua1 Develxpont 6.3 36.5 12.3 1.4 4.6 0.6 37.8 56.0 6.S S0.6 2.1 15.0 3.5
water luSply & sewerage - 31.0 0 s 0.6 S.3 10.1 - - 0.3 36.4 17.8 - 73.1
admaatica 6.1 2.S 22.4 2S.S 16.2 19.2 2.4 - 0.9 2.6 62.6 - 30.6
uaelth 4.4 59.2 13.3 16.5 0.4 1.1 - 4.7 9.7 SS.3 24.2 S.6 2.7
Otbora - 1.7 9.8 1.6 7.2 34.2 11.2 62.0 29.2 2.3 117.3 3.0 46.3
otal 117.9 33S.3 223.7 213.6 202.1 336.2 461.0 404.1 292.4 410.6 SSS.3 181.6 291.5
a/ heat nine nrnth only. t
Note: DC00 data available In national anreuaxiea only. She aboe data wma drived in VS. u5ia
aveage ehmbaage, sate for the period.
Souse: Ninanclal omptroller Genetal's OfEioe CVU).
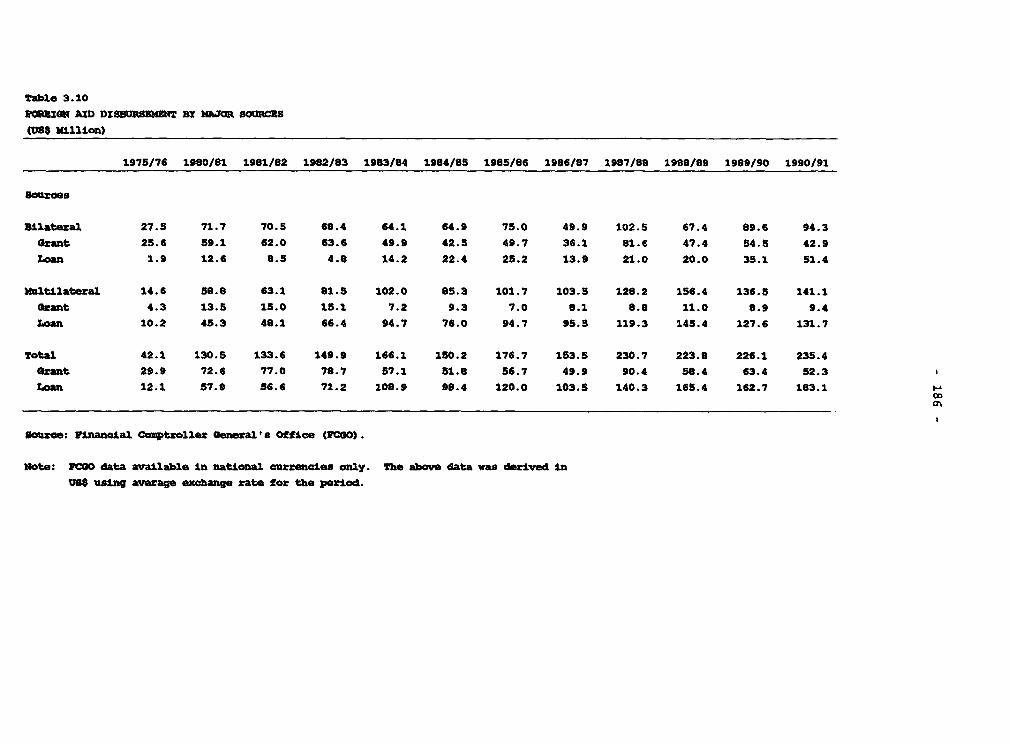
Table 3.10
PCOXZIN AXD DI8BURMEHST BS MJOKR SOWRC=S
(USW Million)
1975/76 1980/81 1981/82 1982/83 1983/84 1984/85 1985/86 1986/87 1987/88 1988/89 1989/90 1990/91
sources
bilateral 27.5 71.7 70.5 68.4 64.1 64.9 75.0 49.9 102.5 67.4 89.6 94.3
Grant 25.6 59.1 62.0 63.6 49.9 42.5 49.7 36.1 81.6 47.4 54.5 42.9
Loan 1.9 12.6 8.5 4.8 14.2 22.4 25.2 13.9 21.0 20.0 35.1 51.4
Multilateral 14.6 58.8 63.1 81.5 102.0 85.3 101.7 103.5 128.2 156.4 136.5 141.1
Grant 4.3 13.5 15.0 15.1 7.2 9.3 7.0 8.1 8.8 11.0 8.9 9.4
Loan 10.2 45.3 48.1 66.4 94.7 76.0 94.7 95.5 119.3 145.4 127.6 131.7
Total 42.1 130.5 133.6 149.9 166.1 150.2 176.7 153.5 230.7 223.8 226.1 235.4
Grant 29.9 72.6 77.0 78.7 57.1 51.8 56.7 49.9 90.4 58.4 63.4 52.3
Loan 12.1 57.9 56.6 71.2 108.9 98.4 120.0 103.5 140.3 165.4 162.7 183.1co
Sinus: Financial Comptroller GeneralIs Office (PC0O).
Note: FWO data available In national currecaies only. The ablxe data was derived in
US$ using average exchange rate for the period.

table 3.11
MO8 million)
1975/76 1980/91 19al/82 1982/83 1983/84 1984/85 1985/96 1986/87 1987/99 1988/99 1989/90 1990/91
agriculture Total 10.4 27.0 35.2 43.3 49.4 59.1 65.7 48.0 56.1 57.9 52.3 40.2
agricultur 7.6 11.7 14.1 17.0 20.6 26.1 31.7 16.1 25.1 20.9 16.8 19.5Zrrigation 2.0 12.4 15.6 19.3 22.0 25.2 29.2 23.8 21.6 31.3 27.1 14.0Portet 0.8 2.7 5.5 6.7 6.6 7.6 4.7 7.7 9.4 5.7 6.3 6.7Others * 0.0 0.2 0.1 0.2 0.3 0.2 0.1 0.3 0.0 0.0 0.0 0.0
Zafrastruature 19.2 83.6 60.1 46.8 56.0 54.4 66.9 68.2 126.7 123.2 93.9 82.6
transport 16.9 34.4 32.2 19.1 19.6 31.2 17.4 18.7 27.5 40.2 26.3 43.5Power 1.9 46.8 24.5 22.6 30.2 18.4 45.1 43.1 75.8 68.5 63.2 37.3Ccnlmnicatlon 0.4 2.3 3.4 5.1 6.2 4.8 4.4 6.4 23.4 14.5 4.4 1.8
Infstrzy andCro5 ce 5.2 5.8 11.2 15.2 32.3 10.8 14.0 e.5 20.2 7.6 23.0 44.6
Social Servioes 7.2 12.2 26.0 44.2 28.2 24.4 29.7 27.1 23.7 33.4 55.3 24.7 J
2dacation 1.9 2.6 6.0 12.1 9.0 5.7 9.8 7.9 8.2 10.6 6.5 3.9sesith 4.0 4.0 5.8 8.4 6.5 7.9 7.0 S.9 6.3 11.4 4.5 3.4Drinking Water 0.5 2.6 3.8 8.4 5.1 3.1 7.2 7.9 3.5 4.6 8.4 5.8GherA ** 0.9 3.0 10.5 15.2 7.5 7.6 5.6 4.5 5.7 6.7 35.8 8.3
Otbers *e* 0.1 2.0 1.0 0.3 0.2 1.5 0.5 1.6 4.1 1.7 1.6 3.3
Total 42.1 130.5 133.6 149.9 166.1 150.2 176.7 153.5 230.7 223.8 226.1 235.4
* rey & 6.nd Sefom
** nabyat a Otber Services*e Statistics & Others
Note: I010 data available in national acuenci*8 only. The aboe data wasderived in VS using the averag anhage rate for the period.
Somre: winanCal coptrolles Generl' Office (1060).
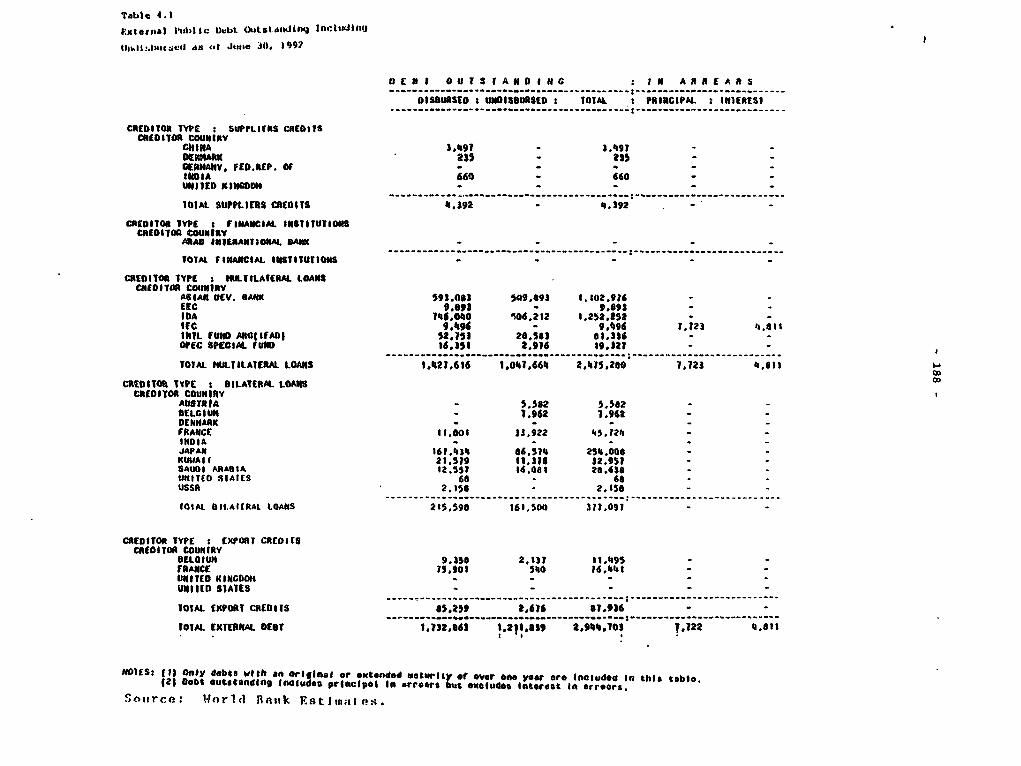
Table 4. 1
txteternal I tbIl Ickebt. (s3. n0dlg IncI udi u9
jU,bIlf.a1e4ci.d adS *.t June 30, 1997
' E b I O U T S l A N OI N C a t A A E A Ak
D;S;USEDto t Wot09602t : TOIAtL I PRINICIPAL : lItitRIsi
CREDITOR TYPe : suPPnIf.is CREDItalCREDItOR cousltty
CNINA 3.I91 _ 3.t91 _
OIENRRt 23$ 235
OtRANAIY. FED.REP. OF , 2S
INlDA 660 - 660 -
UNITED KIImeO
lOIAL SUPPLIERS CREOITS N.392 - N.392 -
CREItOIo TYPE a fINANCIAL INSTITUTIONSctottlla COUNtRY
ARAB INIERANTIONAI. BASNK-
TOTAL FINANCIAL ST OS - - - -
CREDITOR tYPE KiJLTILAICRAL LOANS
CREDITOR ColmIRYACIAN uEV. OMAE 593.0(1 509.893 t.102,916 -
Etec 9093 9.89S -
IDA 746.04ON 306.212 1.252,152
tIC 9.N9d - 9,C96 r.123 al8l3
llL FUtND ANO fAlAD 52.153 20.503 81.3S6 -
OPEC SPECIAL utRO 36.351 2.916 19.321... _.._. .___.__.._.. .......... _. ......... _........ --------------
TOIAL MULTILATERAL LOANS 1.a21.616 1,0I.O 661a 2,%175,20 71,123 4,1
CREDITOR TYPE t BILATERtAL LOAIIS 0
CREDOTOR COUNIRYAUSTR IA - 5.582 5.502 -
CLOS. - 7.962 7.962 - -
DENNARK 9 - -- 2
FRANCE t.eot1 33,922 4 5,t
INDIAJAPAN 86.571 25R.006KUUAI 3 23.519 11.318 32.951 SAUDI AtAtI IA 551 14.063 28 6
tO18141( SKAtES 68 - 68
USSR 2.158 - 2,358 -... .,.. .. .. .......... . .. . ..... _ . . -- - - - - - - - - - - - -
IOSA. BlIAICtnAL LOAlS 235.598 161.500 31t.097
CREDITOR TYPE: ExPOrT CREDI*SCREDITOR COUNtRY
BELOIUM 9.358 2.317 1.195 -1-
FRANCE 75.901 StO 16.441 -
UNITlED KINCDOOS * - --
UNI ItD SlAlES * - - -
101TA EXPORT CittfDlS 85.259 2,616 81,936 -
TOTAL EX7ERNtAL DEBlT 1,132,663 1.12t,039 2*9111..01 7,722 4.811
HOlES: 1)Only debts withs an original or eKtenOded melurlty of over *on year or. Included in this tabo..
121 0ebt outstanding Includese orIncIpal n r areiss but eol udes interest In arr t hrs.
5;otrce: Wt rlr 1 Bc aik Est 111 K! o.
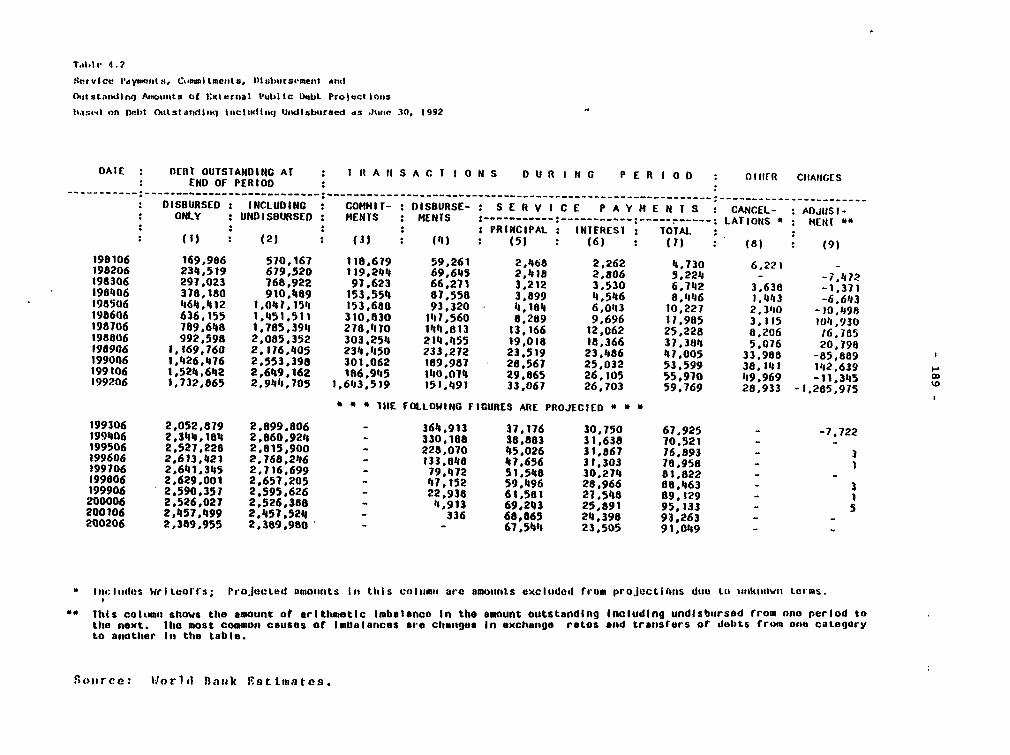
Solvt vie. l,ytwtntt;, Com.ILments, I)1a3b.rs..ment wtxf
()aet stanlnq Amcou.ts of Externsal P'uhlic Debt Project loas
Ixue.l *an n)ebt )tttstat anl tnIClidIq USu indbursed ds .June 30, 1992
DAIE MEIIT OUJTSTANDING AT I It A ti S A C T I 0 N S D U R I N C P E R I 0 D O:llrR CIANICES
- END OF PERIOD
DISBURSED : INCLUDING : COMMIT- : DISBURSE- S E R V I C E P A Y N E N T S CANCEL- : ADJIISY-
ONLY : UNDISBURSED : MEN7S : MENTS - ____---_--- -- : LATIONS * : H4EN( "0PRINCIPAL : INIEREST TOTAL
(1) (23 : (31 (it) : (53 (6) (: ) (8) (9)
198106 169,986 570,167 118,679 59,261 2,468 2,262 4,730 6,221 -
198206 234,519 619,520 119,244 69,645 2,4t8 2,806 5,224 - -J,472
198306 297,023 768,922 97,623 66,271 3,212 3,530 6,7112 3,638 -1.371
198406 378,180 910,489 153,5511 87,558 3.899 4,546 8,4486 1,443 -6.643
1985(36 464,4112 1,041,1581 153.688 93.320 11,1811 6,0*13 10,227 2.3810 -10.498
198606 636,155 14851.51) 310,830 1111,560 8.289 9,696 11,985 3,115 10*,930
198706 789.648 1,785,394 278,1110 1,'I1.813 13.166 12,062 25,228 8,206 16,785
198806 992,598 2.085.352 303,25tt 214,455 19,018 18,366 37,384 5.076 20.798
498906 1,169,760 2,176,405 234,4a50 233,272 23.519 23,486 47,005 33,988 -85,889
199006 1,426,476 2,553,398 301,062 189,987 28,567 25,032 53,599 38 11f1 142,639 -
199106 1,524,642 2.649,162 186,945 140.071 29,865 26,105 55.970 419.969 -11,345 O
199206 1,732,865 2,9414,705 1,643,519 t51,491 33.067 26,703 59,769 28,933 -1.285,975
* 111E FOLLOWING FICURES ARE PROJECIED I * *
199306 2,052,879 2.899,806 - 364,913 37.176 30,750 67.925 - -7,722
199406 2,344,184 2,860,924 - 330,188 38,883 31,638 70.521 - -
199506 2,527.228 2,815,900 - 228,070 45,026 31.867 76,893 - 3
199606 2,613,421 2,768,246 - 133,848 47,656 31,303 78,958 - 1
199106 2,641,345 2,716.699 - 79,472 51.548 30,274 81,822 -199806 2,629.001 2,657,205 - 47,152 59,496 28,966 88,463 - 3
199906 2,590,351 2.595,626 - 22,938 61,581 27,548 89,129 - 1
200006 2,526,027 2,526,388 - 11913 69,243 25,891 95,133 - 5
200106 2,457,499 2,457,524 - 336 68,865 24,398 93,263 -
200206 2,389,955 2,389,980 - - 67,5114 23,505 91,049 -
* Ilelluiles WrIteol's; Projecteod amoimts it timis columnii are amouinits excIltdeci from projections due La taknknawfi tcrms.
* This column shows the amotnt ot arithmetic Imbalance In the amount outstanding Including undisbuirsed from one period to
the next. lhe most common causes of Imlialances are changea In exchange rates and traisfrers or debts frot one category
to another In the table.
Smo3rce: Worlid Batik Estisttates.
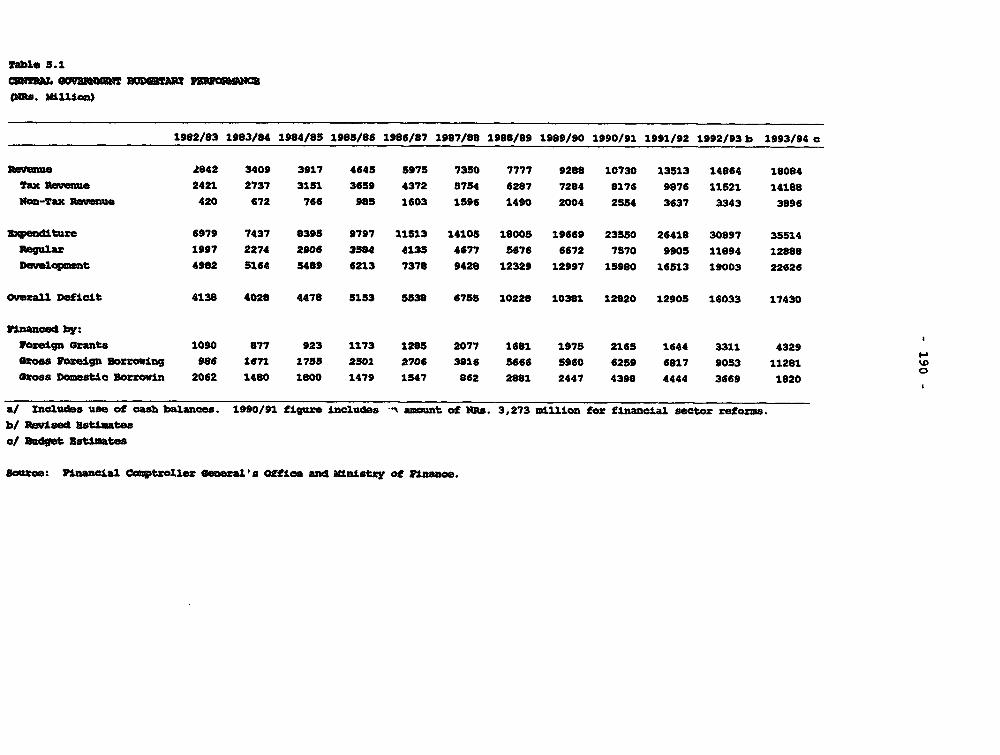
Sablo 5. 1
GUR. ilica)
1982/83 1983/84 1984/85 1985/86 1986/87 1987/88 1988/89 1989/90 1990/91 1991/92 1992J93 b 1993/94 c
Raenue 2842 3409 3917 4645 5975 7350 7777 9288 10730 13513 14864 18084
TaX FUevene 2421 2737 3151 3659 4372 5754 6287 7284 8176 9876 11521 14188
Nan-Tax R2venua 420 672 766 985 1603 1596 1490 2004 2554 3637 3343 3896
3meniature 6979 7437 8395 9797 11513 14105 18005 19669 23550 26418 30897 35514
Regular 1997 2274 2906 3584 4135 4677 5676 6672 7570 9905 11894 12888
Devvelopnt 4982 5164 5489 6213 7378 9428 12329 12997 15980 16513 19003 22626
OWveall Dafi¢lt 4138 4028 4478 5153 5538 6755 10228 10381 12820 12905 16033 17430
vdnanceG by:
Vciegn Grants 1090 877 923 1173 1285 2077 1681 1975 2165 1644 3311 4329
ross Forelgn Sorrowing 986 6on 1785 2501 2706 3816 S666 5960 6259 6817 9053 11281
Gross Deastic Dorrowin 2062 1480 1800 1479 1547 862 2881 2447 4398 4444 3669 1820
a/ Ineludes use of cash balances. 1990/91 figure includes - amoamt of Rs. 3,273 million for financial sector reforms.
b/ Pwiue4 Ustimate.
c/ Dudget Estimates
saoce: laancial Cotptrollez Goeeral's Office and Ministry of Finance.
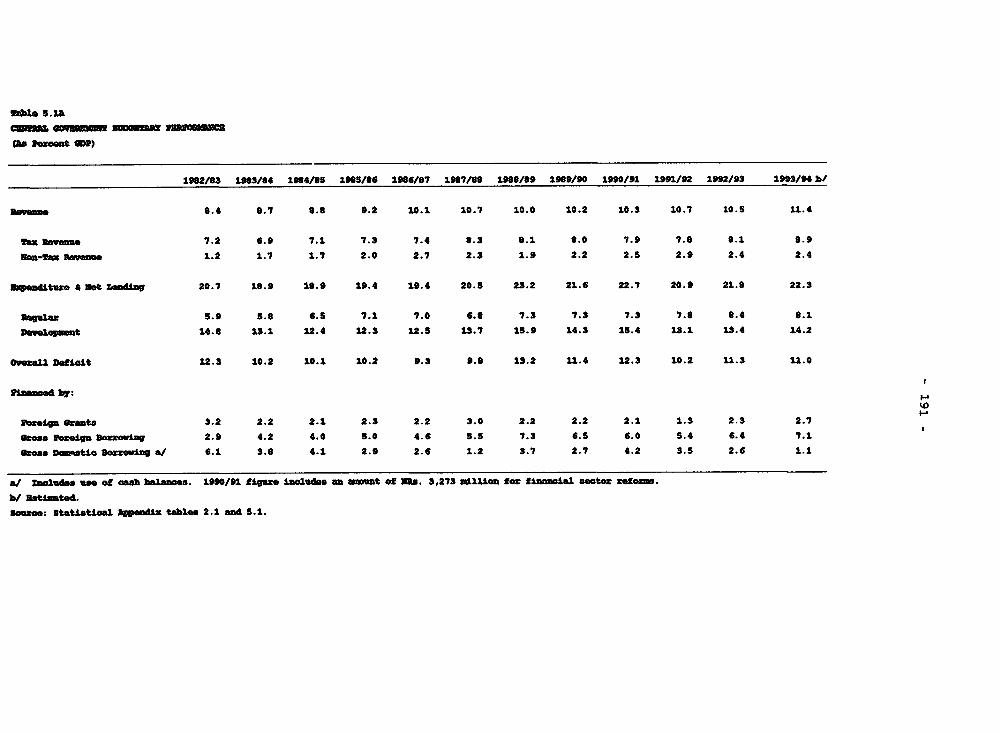
Table 5.1&
CEM"gonas ao-m liowolumm
1902/03 1903/84 1904/85 1905/86 1906/97 1907/68 1930/89 1989/90 1990/91 1991/92 1992/93 1993/94 b/
Revenue 0.4 8.7 0.8 9.2 10.1 10.7 10.0 10.2 10.3 10.7 10.S 11.4
tx Revenue 7.2 6.9 7.1 7.3 7.4 8.3 0.1 0.0 7.9 7.9 0.1 8.9
Soa-fia Rvemo 1.2 1.7 1.7 2.0 2.7 2.3 1.9 2.2 2.5 2.9 2.4 2.4
anpead4ture3 Zd a X¢e tlsa 20.7 18.9 18.9 19.4 19.4 20.5 23.2 21.6 22.7 20.9 21.0 22.3
aWUlaz 5.9 5.0 6.S 7.1 7.0 6.8 7.3 7.3 7.3 7.8 9.4 8.1
vowo1qant 14.8 13.1 12.4 12.3 12.5 13.7 1S.9 14.3 15.4 13.1 13.4 14.2
Oveoall Dfcfict 12.3 10.2 10.1 10.2 9.3 9.0 13.2 11.4 12.3 10.2 11.3 11.0
diane by:
ftttigu4 evants 3.2 2.2 2.1 2.3 2.2 3.0 2.2 2.2 2.1 1.3 2.3 2.7
eoaNs FEoeign crgzoqeln 2.9 4.2 4.0 5.0 4.6 5.5 7.3 6.5 6.0 S.4 6.4 7.1
gross Dmmuiatic 3sorrclv A/ 6.1 3.8 4.1 2.9 2.6 1.2 3.7 2.7 4.2 3.S 2.6 1.1
a1 Zacluden lse of cash balances. 1990/91 figure irlaudge an aemt of U8J. 3,273 lioUnA few fincial sector reforn.
b/ Bat3mted.souree: Statistoal fypeadix tables 2.1 and 5.1.
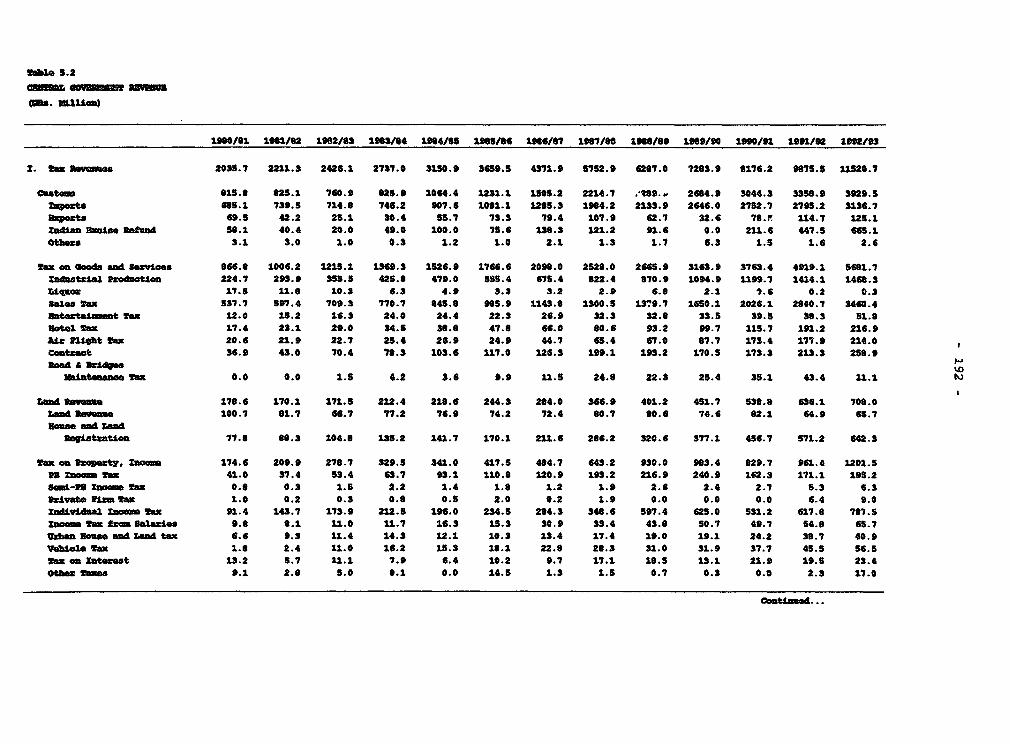
Id".Q 5.2
1990/01 1001/*2 1902/03 198S0/4 1904/05 1905/06 196/07 1987/80 1900/09 109/90 /91 11/92 1om/n
1. Warno.eoa 2035.7 2211.3 2426.1 2737.0 3150.9 3659.5 4371.9 S752.9 6207.0 7203.9 8176.2 9075.5 U520.7
Q"ua= 01S.0 025.1 760.9 025.9 1064.4 1231.1 1505.2 2214.7 .7t9. 2684.9 3044.3 3S35.9 3929.5
mapota 6S.1 739.5 714.0 746.2 907.6 1091.1 1265.3 1904.2 21".9 2646.0 2752.7 279S.2 3136.7
poz+t 69.5 42.2 25.1 30.4 55.7 73.3 79.4 107.9 62.7 32.6 78.." 114.7 12S.1
Znd.n 21" Ram ftASo 50.1 40.4 20.0 49.0 100.0 75.6 130.3 121.2 91.6 0.0 211.6 447.5 665.1
Others 3.1 3.0 1.0 0.3 1.2 1.0 2.1 1.3 1.7 6.3 1.S 1.6 2.6
az on goods an Seioes * 66.8 1006.2 1215.1 1369.3 1526.9 1766.6 2090.0 2529.0 2665.9 3163.9 3763.4 4919.1 5601.7
Za4tat3al Produaticn 224.7 293.9 355.S 425.0 479.0 5SS.4 675.4 822.4 070.9 1094.9 1199.1 1414.1 1460.3
r.iuog 17.5 11.8 10.3 6.3 4.9 3.3 3.2 2.9 6.0 2.1 7.6 0.2 0.3
sales Tax 537.7 S97.4 709.3 770.7 045.0 98S.9 1143.0 1300.5 13.9.7 1650.1 2026.1 2040.7 3460.4
3atertai._nt Tax 12.0 15.2 16.3 24.0 24.4 22.3 26.9 32.3 32.0 33.5 39.5 30.3 S1.0
motel Tao 17.4 23.1 29.0 34.5 30.8 47.0 66.0 00.6 93.2 99.7 115.7 191.2 216.9
Aix Plight fax 20.6 21.9 22.7 25.4 26.9 24.9 44.7 65.4 67.0 07.7 173.4 177.9 214.0
cOtaaot 36.9 43.0 70.4 70.3 103.6 117.0 126.3 199.1 193.2 170.5 173.3 213.3 250.9
adS a Bid_ esbintenama Tax 0.0 0.0 1.5 4.2 3.6 9.9 11.5 24.0 22.3 25.4 35.1 43.4 11.1 t
Land m VM_ 179.6 170.1 171.5 212.4 210.6 244.3 284.0 366.9 401.2 451.7 S30.0 636.1 700.0
rakad Ruaveuma 100.7 01.7 66.7 77.2 76.9 74.2 72.4 90.7 00.6 74.6 02.1 64.9 65.7
Baws. and LandRogiatratio 77.0 00.3 104.0 135.2 141.7 170.1 211.6 206.2 320.6 377.1 456.7 S71.2 642.3
"axouftoperty, 3.0cm 174.6 209.9 278.7 329.5 341.0 417.5 484.7 643.2 930.0 903.4 929.7 961.4 1201.5
U mom Max 41.0 37.4 S3.4 63.7 93.1 110.9 120.9 193.2 216.9 240.9 162.3 171.1 19S.2
S4i-g Inoam tax 0.9 0.3 1.S 2.2 1.4 1.9 1.2 1.9 2.6 2.4 2.7 5.3 6.3
Private ViM Wax 1.0 0.2 0.3 0.0 0.5 2.0 0.2 1.9 0.0 0.0 0.0 6.4 9.0
Zndividual Xnocm Wax 91.4 143.7 173.9 212.5 196.0 234.5 204.3 349.6 597.4 625.0 531.2 617.0 797.5
Inom Wax bxe Salaries 9.9 0.1 11.0 11.7 16.3 13.3 30.9 33.4 43.0 50.7 49.7 S4.9 65.7
rxbhn5 Bua and Land tax 6.6 9.3 11.4 14.3 12.1 10.3 13.4 17.4 19.0 19.1 24.2 39.7 40.9
Vehiole ax 1.9 2.4 11.0 16.2 15.3 18.1 22.0 20.3 31.0 31.9 37.7 45.5 56.5
Wnx an Interest 13.2 5.7 11.1 7.9 6.4 10.2 9.7 17.1 19.S 13.1 21.9 19.5 23.4
Other Waxes 9.1 2.0 5.0 0.1 0.0 14.5 1.3 1.5 0.7 0.3 0.0 2.3 17.0
Couttd. . .

fez.. o.a
--e. mLSO
1980/el 19#81/2 IMis 1#e3/s4 1a04/es 19SB06 1989W 1987/o 1968/09 1500/90 lfm./9 I1/ # imi/9u
II. gb5m-h3 faz oge"ze 834.4 460.2 420.9 612.) 168.a 9g5.1 1N2.7 1597.6 1499.5 2003.6 M5S.6 3637.2 3342.0
C1amgw, Ves asd Othozo 48.7 S6.9 71.S 120.6 203.3 201.7 052.0 676.1 555.S 776.6 1012.6 1106.4 329.5
VIm PAVIOtaUeM 2.7 3.4 S.2 7.4 7.0 0.2 11.7 12.9 13.9 18.4 19.6 26.1 27.7
ArM UmgatzatlLa 0.7 0.0 0.0 0.8 0.9 0.9 1.0 1.0 0.9 0.9 1.0 1.0 1.3
dbd3.le 4GGnIMSe 2.9 3.1 3.1 6.3 6.2 7.1 7.7 9.1 11.0 11.1 1S.1 19.4 46.9
JiIstdUUaa 7.6 0.6 10.1 11.3 11.7 19.S 15.8 27.3 20.8 27.9 30.4 27.6 26.6
'Am18st"at1m 84.9 41.1 52.3 144.7 256.6 172.1 018.9 626.2 500 7 717.9 946.5 1032.1 225.0
Sales1 oa cm-dltiea a 5axvisee 171.9 189.4 162.9 225.7 253.1 S05.6 31S.4 348.2 340.1 396.5 513.4 76S.0 065.1
Sa1*5aLez batex 0.6 0.5 0.6 0.0 1.2 1.4 1.6 1.8 1.9 2.1 2.4 2.6 3.4
laglgatle §0.5 0.6 0.9 1.0 1.0 0.5 1.2 3.6 3.5 1.9 1.0 3.1 1.6
AUIOOt@LeitV 8.2 4.1 4.1 24.4 25.9 5.7 1.2 2.2 0.5 0.6 0.3 1.1 1.9
Postal 8exvIoa 20.9 23.9 22.7 32.4 37.3 36.4 44.3 60.6 57.6 59.0 S0.0 74.1 96.7
1.6W and ataultue 7.4 7.0 10.6 11.7 13.4 31.9 17.6 23.2 22.0 23.7 25.6 20.1 20.0
iameauan 3.2 S.S 3.6 6.3 6.7 6.9 9.8 10.6 12.9 13.0 16.2 17.7 27.6
90.5 113.6 5S3.9 60.6 90.5 115.6 129.3 101.1 75.5 1S12.7 136.3 197.0 158.3
n spozt 25.3 19.2 35.2 41.2 32.4 46.0 37.5 44.6 66.3 63.4 78.7 150.3 170.1
Otbhz 15.1 16.3 31.3 47.3 44.7 61.2 69.0 10O.S 99.0 119.3 194.7 296.0 405.5
D*vidv4a 67.3 106.4 119.0 109.0 66.2 110.1 106.6 117.2 196.5 233.8 459.5 644.4 782.6
a a titutele 63.9 101.1 114.4 103.S 01.1 97.5 101.0 115.1 179.6 227.4 455.6 627.1 754.6
_ozoma 0.1 0.0 0.1 0.1 2.0 0.3 1.1 0.2 11.6 0.4 0.9 5.1 0.0
T-dmBtZialaitdakla 3.2 5.3 4.5 2.4 3.1 11.6 4.5 1.9 6.9 6.0 0.0 14.2 26.7
asyl.es Sect. 0.1 0.1 0.1 S.0 0.0 0.4 0.0 0.0 0.0 0.0 3.0 0.0 1.3
oralty an Salm of txed meets 29.3 22.1 16.1 44.3 31.7 32.6 25.4 25.7 30.6 40.1 29.1 137.8 ?J.0
loyalty f£m l-4 1.3 1.9 1.4 1.7 2.6 2.6 4.1 5.9 3.2 1.4 1.3 2.6 2.1
Royalty im 31eotu ty 0.2 0.0 0.2 0.0 0.0 0.0 0.0 0.0 90.0 0.0
Oth.: ROalties 1.6 2.5 2.6 2.6 15.1 5.3 11.6 5.9 10.1 25.6 14.1 27.3 52.9
Otbaus 5.0 12.5 5 .1 S6.1 1s.9 24.7 9.6 13.9 25.3 13.1 0.0 14.6 12.0
MInt 21.3 5.5 6.9 3.7 0.0 0.0 0.0 0.0 0.0 0.0 12.7 3.1 3.0
P.naiple and Zat:ezst R,ap_ nt 30.1 29.2 47.7 117.4 101.6 324.6 300.S 355.6 343.0 529.0 496.2 971.4 1253 7
Lom eapnat 16.5 11.5 34.0 67.1 67.5 136.7 1S0.9 150.4 170.9 250.0 261.4 427.2 602.5
latest 12.5 16.2 12.6 49.2 33.2 106.1 140.3 207.4 163.4 276.4 236.5 543.6 656.0
Oth.: 1.1 1.4 1.2 1.1 0.9 1.7 1.1 0.0 0.7 0.6 0.3 0.4 0.7
MIsoellanes C16.1 64.2 S.3 5.3 9.9 10.5 7.1 71.4 14.0 26.0 43.0 12.2 21.6
Total wene (S II )1 2419.2 2679.5 2646.6 3409.3 3916.6 4644.6 5974.6 73S0.4 7776.4 9207.5 10731.8 13512.7 1406.5
Seew.: llaenia optz.11e Genmls 0351..; an 2UaIstay of zItsz e.

fable 5.3 8uz, 0?e a2M3XOv_s0n
am*. KlIlio}
1990/al 1901/82 192/093 1903/94 1904/05 19s/6s 1296/0 .1997/0 1"90/09 1909/90 1990/91 19W912 1992/93
2. Regla- apedtuat 1361.0 1634.4 1997.1 2273.5 2906.2 354.0 4123.0 4622.1 5676.4 6671.9 7374.6 S905.4 1l094.1
CoatitutIiona Cagana 61.9 60.4 54.4 8o.0 60.9 113.2 132.2 106.2 91.2 103.7 191.1 202.0 197.5
Mt S pAgal 1ly 0.7 12.3 15.9 17.2 17.3 25.5 25.5 20.2 29.6 42.4 42.3 48.6 53.9
State Council 0.6 0.9 1.2 1.7 2.0 1.9 2.6 2.4 2.5 2.4 2.1 2.7 4.1
Paalaot 4.2 S.3 6.7 7.9 7.7 9.5 11. 11.2 15.0 13.3 10.2 44.7 47.1
Dept of Anadto Ganaral 4.3 4.7 6.5 7.1 0.9 0.1 10.1 11.0 13.6 13.9 14.0 19.7 23.5
lupam Cocat 1.5 2.S 3.9 3.6 3.4 3.7 S.1 5.1 6.3 6.0 5.9 S.9 22.2
PublI gewice cS nasLo 3.5 4.7 7.6 0.5 0. 0.9 12.S 15.4 13.6 14.3 12.0 17.1 18.7
O1leatie Coaa1oa 36.0 20.3 4.2 3.7 4.8 46.3 41.9 3.2 6.0 6.S 99.3 .135.6 19.8
Comm lon for preventionof NSoe oi autboalty 0.7 0.9 0.9 1.4 1.1 1.1 1.9 1.0 2.0 2.2 1.9 2.1 3.7
AttOrneY 0eneral 0.6 0.7 3.0 1.S 1.5 1.5 2.2 2.3 2.6 2.7 2.7 3.4 4.3
tanabapt Policy asd
Iaetlgatia. cttee 0.0 0.0 4.6 5.4 5.3 6.5 10.7 25.6 - - -
Otber 0.1 0.0 0.0 0.0 0.0 0.0 0.0 0.0 - 0.0 0.0 0.0 1.2
eneral .Aain atritc 210.0 25S.1 323.7 351.0 411.2 516.1 596.7 675.7 045.0 963.4 1100.4 1S34.3 1014.6 3-'
Council of Minjatern 2.6 3.0 4.7 3.6 4.0 4.2 4.1 5.3 7.0 7.0 6.7 9.0 12.3 w
mm Seartariat 25.9 31.2 39.0 41.5 43.3 51.7 91.0 70.5 1S3.7 136.8 117.2 166.1 241.9
District ).m.xdattatioa 24.0 2a.0 37.4 34.7 40.3 43.0 49.9 56.7 63.5 66.. 51.7 67.6 07.1
plIce 145.7 162.9 210.2 237.4 280.0 377.5 409.1 462.3 543.4 654.9 002.2 1151.9 1309.5
Jel 14.3 17.7 21.9 23.5 25.0 26.0 25.0 32.0 39.6 37.3 55.2 59.5 71.7
mlacelanoua 6.2 0.3 10.3 10.2 10.3 12.4 34.4 39.5 52.6 50.1 57.4 00.2 02.5
atiatratIve form 0.1 o.S 0.0 0.2 0.2 O.S 0.4 1.S 2.4 2.4 0.0 - -
Nationel electilon caiion 0.0 0.0 0.0 0.0 0.0 0.0 0.0 0.0 0.0 0.0 - -
otbes 0.2 0.0 0.0 0.0 0.0 0.0 0.0 0.0 0.0 0.0 - -
Revenue ai.niatxation 35.9 43.9 54.6 50.6 62.9 75.3 9S.6 101.0 111.2 124.4 124.7 173.5 214.2
LUan Revenne 16.6 21.1 26.0 26.0 29.1 34.0 42.2 42.5 50.1 55.7 57.3 01.9 97.0
Cueat 9.9 11.4 15.4 17.1 10.3 23.4 29.S 31.0 30.6 3S.1 3S.S 52.7 61.s
ExIose 5.1 6.3 6.7 7.1 *.0 8.1 10.4 11.3 23.1 12.4 12.4 24.1 21..
Tax 4.0 4.9 6.4 7.4 7.3 9.5 13.0 15.0 16.9 20.7 19.0 24.2 3S.3
Rpvenue & ga Court 0.2 0.2 0.2 0.3 0.3 0.4 0.4 0.5 0.5 0.5 O.S 0.6 0.0
_ceaa Ad and lanIng 13.5 19.3 32.1 25.1 20.0 31.5 30.3 30.2 41.7 47.0 40.4 S9.4 76.9
plani. 0.7 0.9 0.9 1.1 1.2 1.4 2.0 2.1 2.4 2.7 2.4 3.1 4.3
Statistics 0.7 0.7 0.9 1.0 1.1 1.S 1.0 2.1 2.7 3.1 2.9 3.7 4.9
mm 4.2 0.9 20.4 20.9 23.6 26.2 31.S 34.0 36.6 42.0 43.1 52.6 67.7
Metria 2asur_t 1.1 1.6 2.0 2.0 2.1 2.4 2.9 0.0 0.0 0.0 0.0 0.0 0.0
mint 6.9 7.3 7.9 0.0 0.0 0.0 0.0 0.0 0.0 0.0 0.0 0.0 0.0
Oont1nnw.
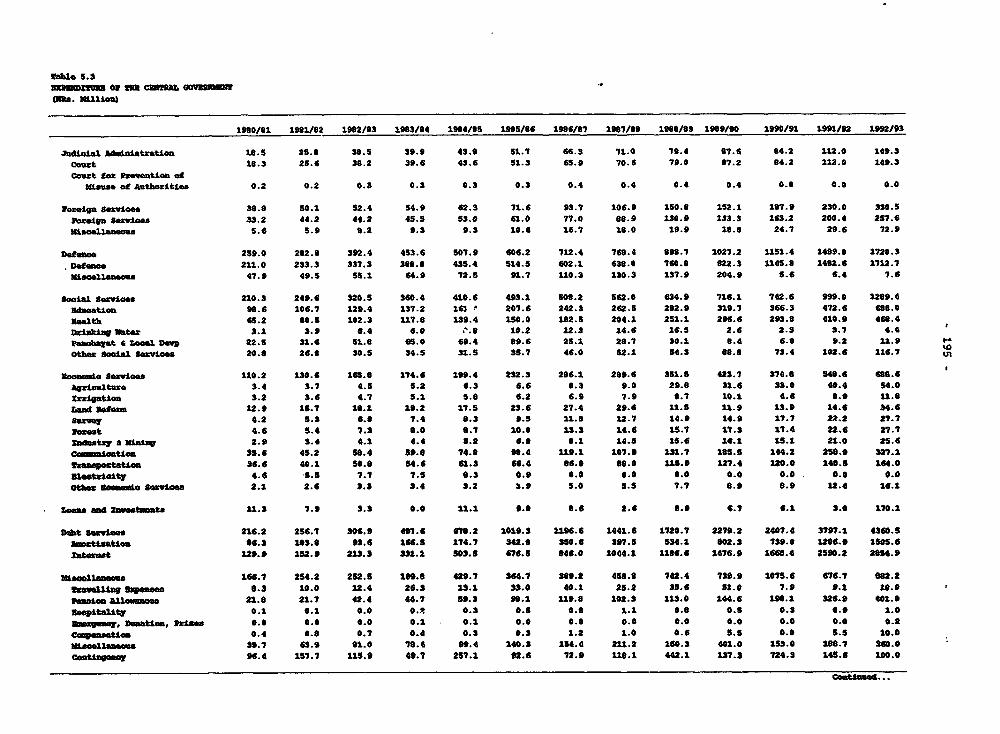
fabe 5.3
,IS. 31Ut
1900/81 19V1/82 1902/3 1S3/S4 1984/0S 1N5/S6 1996/07 19S7/88 1908/89 109/90 1990/31 1991/92 192/93
Sdolal Al\inizatr&ot 18.5 25.8 30.5 39.9 43.9 51.7 66.3 71.0 10.4 87.4 04.2 112.0 149.3
Ce.t 18.3 2S.6 38.2 39.6 43.6 51.3 65.9 70.6 79.0 87.2 84.2 112.0 149.3
Couzt got 9.voat±c OfMisus of Authboitl.a 0.2 0.2 0.3 0.3 8.3 0.3 0.4 0.4 0.4 0.4 0.0 0.8 0.0
woseiga Service. 30.9 S0.1 52.4 S4.9 62.3 71.6 93.7 106.9 1S0.0 152.1 107.9 230.0 330.5
Porelgi service 33.2 44.2 44.2 45.S 53.0 61.0 77.0 88.9 130.9 133.3 163.2 200.4 2S7.6
mi.oellab*@ua S. 5.9 0.2 9.3 9.3 10.6 16.7 10.0 19.9 16.8 24.7 29.6 72.9
Df.Oe 259.0 282.8 392.4 453.6 507.9 606.2 712.4 768.4 090.7 1021.2 1151.4 1409.0 1720.3
Df CWO 211.0 233.3 337.3 388.8 43S.4 514.5 602.1 638.0 760.0 022.3 1145.8 1402.6 1712.7
miaoellaaea 47.9 49.S 55.1 64.9 72.5 91.7 110. 3 130.3 137.9 204.9 S.6 6.4 7.6
Social Se_vice 210.3 249.6 328.s $60.4 410.6 493.1 50.2 562.0 634.9 716.1 742.6 999.0 1209.4
3daoat1o 90.6 106.7 129.4 137.2 1l3 e 207.6 242.3 262.S 282.9 319.7 366.3 472.6 606.0
3elt.bk 45.2 00.5 102.3 117.0 139.4 150.0 102.5 204.1 251.1 296.6 293.8 418.9 468.4
Dr water 3.1 3.9 6.4 6.0 1.8 10.2 12.3 14.6 16.5 2.6 2.3 3.7 4.4
tahqat & Zam Do 22.5 31.4 51.0 6S.0 69.4 09.6 25.1 28.7 30.1 8.4 6.0 9.2 lS.9
Oth: ScI"al SevIce 20.8 26.0 30.5 34.5 31.5 35.7 46.0 52.1 54.3 08.8 73.4 102.6 116.7
3ooeagc Sgvioen 110.2 130.6 165.8 174.6 199.4 2S2.3 286.1 289.6 351.S 423.7 374.0 54.6 6S0.6
Ag4ra1tue 3.4 3.7 4.5 S.2 6.3 6.6 8.3 9.0 29.0 31.6 33.0 40.4 54.0
Xniqatio 3.2 3.6 4.7 5.1 5.8 6.2 6.9 7.9 0.7 10.1 4.6 0.0 11.8
Land R.6cm 12.9 15.7 18.1 19.2 17.S 23.6 27.4 29.6 1.S 11.9 .9 14.6 34.6
Survey 4.2 5.3 6.8 7.4 0.3 9.5 11.8 12.7 14.9 14.0 17.7 22.2 27.7
Wobet 4.6 5.4 7.3 8.0 0.1 10.0 13.3 14.6 15.7 17.3 17.4 22.6 27.
In"Usr a gI 2.9 3.4 4.1 4.4 5.2 6.0 8.1 14.5 15.6 16.1 15.1 21.0 25.6
m eom 35.6 45.2 5 .4 59.0 74.8 98.4 119.1 107.9 131.7 185.5 144.2 250.0 327.1
s _aaqestti 36.6 40.1 50.0 S4.6 61.3 66.4 06.0 0.0 115.9 127.4 120.0 14S.S 14.O
31eatalaI 4.6 5.5 7.7 7.5 8.3 0.0 0.0 0.0 0.0 0.0 0.0 0.0 0.0
0th.: Uoom.o servie" 2.1 2.6 3.3 2.4 3.2 *.9 5.0 5.5 7.7 e.0 8.s 12.4 16.1
_ean and zave.bmota 11.3 7.9 3.3 8.0 11.1 9.0 0.6 2.4 8.0 6.7 6.1 3.0 170.1
Debt Bsvueea 216.2 2S6.7 306.0 497.6 670.2 101.s3 3196.6 1441.6 1720.7 2279.2 2487.4 797.1 4360.5
ntisat1ue 06.3 103.8 93.6 166.5 174.7 342.0 SS0.6 307.5 534.1 802.3 7S9.8 1206.9 lSS.6
int. et 129.9 152.9 213.3 331.1 503.5 476.5 046.0 1044.1 1186.6 1476.9 1660.4 2590.2 2054.9
liseoelno 166.7 254.2 252.s 199.8 429.7 364.7 309.2 450.0 742.4 739.9 1075.6 676.7 e62.2
!gwella 2*aon 8.3 10.0 12.4 26.3 13.1 53.0 40.1 25.2 35.6 51.0 7.9 9.1 10.0
Veuu allowm" 21.6 21.7 42.4 44.7 59.3 S3.1 319.8 102.3 13.0 144.6 190.1 226.9 401.a
sobpltality 0.1 0.1 0.0 O.t 0.3 0.S 0.0 1.1 0.0 0.5 0.3 0.9 1.0
Sginy, Somtti., Puls 0.0 0.0 0.0 0.1 0.1 0.0 0.0 0.0 0.0 0.0 0.0 0.0 0.2
C _en.atic 0.4 0.0 0.7 0.4 0.3 0.3 1.2 1.0 0.6 5.5 0.0 5.5 10.0
vtaoe11acaeS 30.7 63.9 01.0 18.4 09.4 140.3 154.4 211.2 150.3 401.0 15.0 180.7 340.0
Coathagoac 96.4 157.7 115.9 49.7 257.1 02.6 72.9 118.1 442.1 137.3 724.3 145.6 190.0
CQ_.

ff ia S.S _WIRBU 0113 a1131 _Ui(8. Million)
1900/81 1901/82 1902/93 1903/04 1904/85 1905/86 1"6/87 1097/00 1908/89 1909/90 1990/91 1991/92 190/3
U1. Delopant _ enditer 2731.1 3726.9 4902.1 5163.8 5400.9 6213.1 7371.9 9420.1 12329.7 12997.6 15980.1 16512.6 19002.9
1anega )duAiat aatcp 0.7 2.9 7.9 13.0 11.9 10.3 19.3 24.4 3S.0 14.3 11.3 13.8 36.7teiiatgative a4fcn 0.7 2.9 7.9 13.0 11.9 10.3 18.3 24.4 3S.0 14.3 11.3 13.0 36.7
Economic Icstr eation so 0 14.4 20.2 15.4 5.2 4.0 4.0 5.9 10.1 10.8 83.3 39.3 29.7P1!in 8.9 6.1 9.6 10.8 2.7 1.9 1.2 1.6 4.1 3.4 5.2 S.9 11.0Statistic 21.2 0.2 10.6 4.6 2.5 2.1 2.0 4.3 6.0 7.4 79.1 33.4 11.9
Social SegVice 872.6 1059.6 1540.2 1493.5 1501.2 1690.0 . 2036.3 2433.3 3309.2 3973.2 3570.2 5040.3 6695.5Uducatio 205.6 412.3 S04.6 670.6 644.2 079.4 1036.5 1226.0 1450.9 1479.0 1116.9 2395.2 3470.3
Esath 97.0 152.8 216.3 199.0 254.8 255.9 309.2 385.2 616.0 393.8 366.8 507.2 603.0Drliking lateg 73.2 107.5 241.9 220.9 201.6 228.3 274.2 236.3 469.3 617.4 530.5 1334.4 1200.0nchayat & local Deup 90.0 270.3 33S.1 334.5 33M.3 200.8 317.0 442.7 4S5.6 454.1 321.3 406.5 615.6
Otbor Social SeVtoa 26.0 116.7 142.2 59.7 61.3 55.5 "9.5 142.4 306.5 1029.1 626.7 397.0 711.0
3caao Oe SZwiOa 2101.0 2556.1 3207.1 3502.5 3617.1 4414.5 5169.5 6751.09 241.6 0200.6 11893.1 11063.2 22125.94rian1t- 257.0 468.0 668.6 547.1 703.6 856.2 601.7 920.9 1016.2 l1t3.5 1534.6 1276.1 1963.3
l=igation 290.2 359.4 407.4 545.2 632.2 846.7 946.0 854.7 1623.2 1204.0 1110.7 2212.2 1816.8 a%akn vefom 12.2 16.3 20.6 21.4 17.9 18.9 26.7 19.6 29.3 39.0 40.4 31.3 8.0
sUXVaY 30.2 37.7 45.6 45.9 40.7 46.7 67.5 72.1 80.8 64.S 60.9 87.6 112.0
lorzet 99.3 195.4 220.1 234.5 290.4 365.0 308.4 449.5 SS6.7 541.2 460.1 004.? 600.9
Indntzy & mining 123.2 266.S 373.0 651.3 341.0 397.S $77.0 604.0 554.3 1049.0 1751.5 2427.2 3293.7
Com.mication 30.9 49.2 74.3 97.2 90.4 09.S 139.8 519.0 374.7 129.4 56.7 116.C 675.9
Pout Office 3.2 4.0 4.1 2.1 . 5.2 2.9 1.9 3.2 8.0 1.0 2.1 2.5 6.9
!alet-ooinicatiou 27.7 44.3 70.2 95.1 85.1 06.6 137.9 S1S.8 366.7 126.6 54.6 113.5 669.0
Saaapotation 601.3 744.0 002.2 746.8 923.0 717.0 906.0 1214.8 1957.2 1S90.1 197S.S 2301.0 2717.6
aadi 472.2 543.4 623.9 615.7 519.5 566.1 792.k 959.4 1S92.0 1090.6 1375.6 2059.3 2270.7
Dlidga 54.9 S6.6 43.6 41.4 53.S 49.9 42.0 112.4 114.3 01.4 202.0 05.1 53.0
Civil Aiation 74.2 144.1 134.7 89.7 347.1 100.3 150.4 143.0 316.4 410.3 394.2 221.1 393.8
Otboae 0.0 0.0 0.0 0.0 2.9 0.8 0.6 0.0 34.5 7.9 7.7 1S.5 0.0
8lctricity 653.2 382.2 443.3 653.0 504.9 1OSS.4 1239.2 1924.7 2003.4 2007.6 1363.1 1414.4 2666.3
Other Eoonomic SerVICe. 15.6 47.2 t43.* 40.0 46.9 41.6 41S.5 164.6 145.0 306.7 3519.6 233.2 363.4
Miscllanoum 26.9 93.9 126.7 59.4 353.3 84.6 150.7 212.6 732.0 790.7 422.2 356.0 115.0
umlot13anaoa 6.4 59.2 90.4 20.6 54.3 20.1 76.3 0O.3 212.9 510.0 0.0 9.0 0.0
CoMtU1eNOY 20.5 34.7 36.3 3S.0 299.0 63.8 74.4 132.3 519.9 280.7 422.2 356.0 115.0
Total 8Uanitu (I + lS) 4092.1 5361.3 6979.2 7437.3 0394.9 9797.1 11501.0 14050.1 10005.1 19669.5 23554.7 26418.0 30896.9
Note: 1991 d6_we1opt engntezQ data Laclede PA. 3272.7 million r A finania Otr zefom.
Sorca: ?in*ncial coItr011* Omezl' Offc.
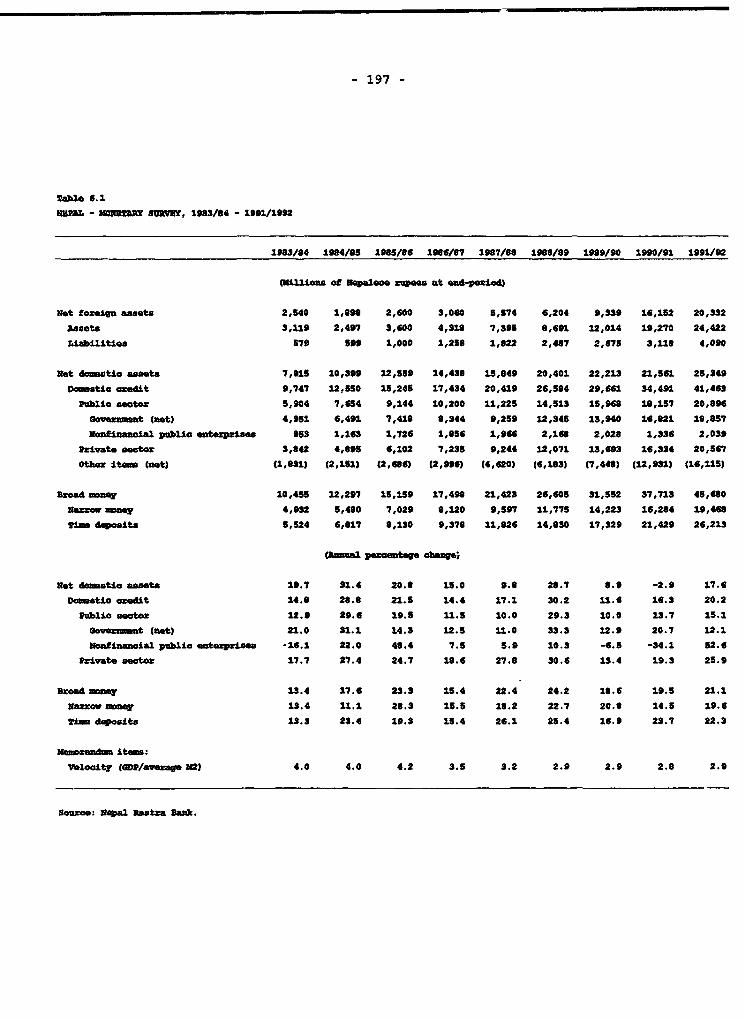
- 197 -
Xalblo 6.1
LPX - n Y5 S=Y, 1983/94 - 1991/1992
1983/84 1984/85 18f5/86 186/87 1927/68 19/99 19 9lN/ 1990/91 1991/92
of11cn @6 epaoc epoo at end-posiod)
Not foreign asset 2,540 1,998 2,600 3,060 5,574 6,204 9,339 16,152 20,332
assets 3,119 2,497 3,600 4,310 7,395 9,691 12,014 19,270 24,422
.iabilties 579 599 1,000 1,259 1,822 2,487 2,675 3,118 4,090
not dzatic assets 7,915 10,399 12,559 14,438 15,849 20,401 22,213 21,561 25,349
Doinstc credit 9,747 12,550 15,245 17,434 20,419 26,584 29,66 34,491 41,463
PLblic sector 5,904 7,654 9,144 10,200 11,225 14,513 15,960 18,157 20,69
Go _Gat (net) 4,951 6,491 7,418 0,344 9,259 12,345 13,940 16,621 10,857
Nofinancial publi entexrcises 953 1,163 1,726 1,056 1,966 2,160 2,028 1,336 2,039
private sector 3,042 4,895 6,102 7,235 9,244 12,071 13,693 16,334 20,567
Other itm (net) (1,831) (2,151) (2,686) (2,996) (4,620) (6,183) (7,440) (12,931) (16,115)
Broa mmy 10,455 12,297 15,159 17,498 21,423 26,605 31,552 37,71S 45,600
Narrow na 4,932 5,480 7,029 6,120 9,597 11,77S 14,223 16,284 19,460
vi deoits 5,524 6,617 8,130 9,376 11,626 14,630 17,329 21,429 26,213
(Arma1 -acns -hnw
Not domstic assets 19.7 31.4 20.8 15.0 9.8 20.7 8.9 -2.9 17.6
DOWtic redit 14.0 20.0 21.5 14.4 17.1 30.2 11.6 16.3 20.2
Publie sector 12.9 29.6 19.5 11.5 10.0 29.3 10.0 13.7 15.1
Gcvezint (nat) 21.0 31.1 14.3 12.5 11.0 33.3 12.9 20.7 12.1
Nonfinancial public nt ezise -16.1 22.0 46.4 7.5 5.9 10.3 -6.5 -34.1 52.6
Private seator 17.7 27.4 24.7 10.6 27.6 30.6 13.4 19.3 25.9
Broad mney 13.4 17.6 23.3 15.4 22.4 24.2 10.6 19.5 21.1
NMrrzv vney 13.4 11.1 20.3 15.5 10.2 22.7 20.8 14.5 19.6
TWr deposits 1l.3 23.4 19.3 15.4 26.1 25.4 16.9 23.7 22.3
It_rnnd item:
Velocity (MP/averaqe 20) 4.0 4.0 4.2 3.5 3.2 2.9 2.9 2.6 2.9
Source: Npal Rasta Bark.
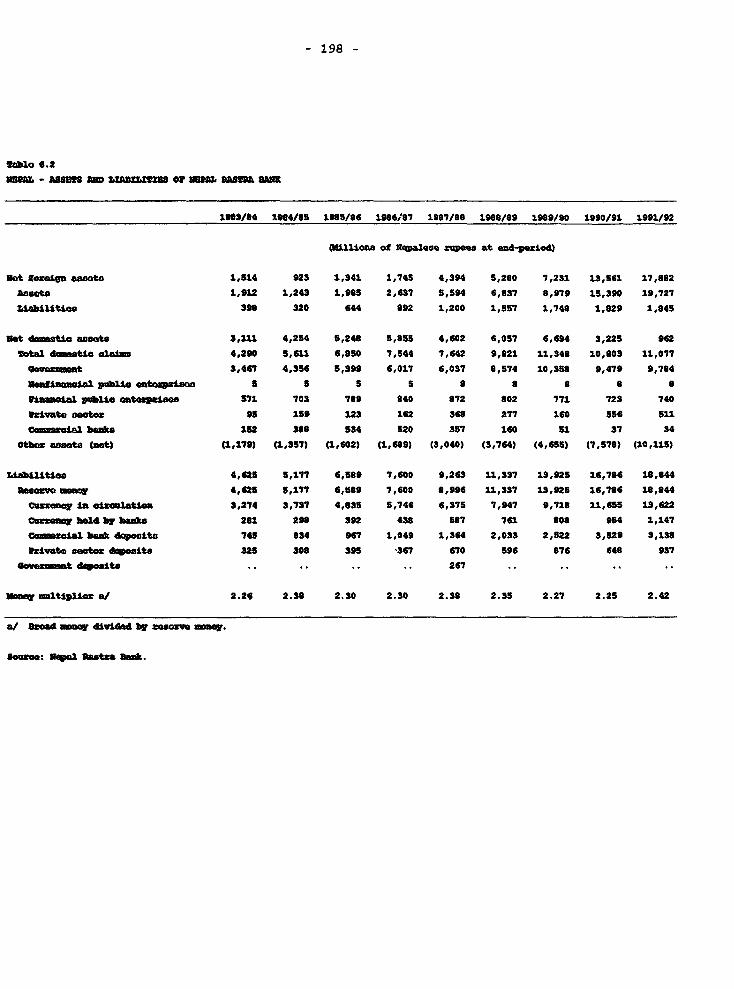
- 198 -
Yabo 6.2
mu - asoS am WAM M or sHaEL aMA
198304 1984/85 198S/86 1986/87 1987/a8 1988/89 1989/90 1990/91 1991/92
01111.a of Ed palese raeea at end-pez±d}
not fo4 ast 1,514 923 1,341 1,745 4,394 5,280 7,231 13,S61 17,802
3naots 1,912 1,243 1,995 2,637 5,594 6,037 8,979 15,390 19,727
itabletlac 398 320 644 992 1,200 1,557 1,740 1,829 1,845
Net d tt1 assets 3,111 4,254 5,248 5,855 4,602 6,057 6,694 3,225 962
Total dometic 1ali 4,290 5,611 6,050 7,544 7,642 9,821 11,348 10,003 11,077
.vozm.t 3,467 4,356 5,399 6,017 6,037 8,574 10,3S8 9,479 9,704
seafleeaal pbibleatospal 5 5 5 S 9 8 a 0 a
imha pblie aateupgjae 571 703 789 940 872 802 771 723 740
UVlvate neat.: 95 159 123 162 368 277 160 556 511
I bsLal heal 152 399 534 520 357 160 51 37 34
0tbh. assets (not) (1,179) (1,357) (1,602) (1,689) (3,040) (3,764) (4,655) (7,578) (10,115)
Liahlljt"o 4,625 5,177 6,599 7,600 9,263 11,337 13,925 16,786 18,044
Reseo meseY 4,625 5,177 6,589 7,600 8,996 11,337 13,925 16,796 10,944
_eaay in altbautloe 3,274 3,737 4,835 5,746 6,375 7,947 9,718 11,655 13,622
C-e3a h"e by hal. 281 290 392 438 587 761 8 08 954 1,147
_al4l bag& dk"Lto 745 834 967 1,049 1,364 2,033 2,S22 3,529 3,139
Ptvzto coat.r daeedt. 325 300 395 '367 670 596 076 640 937
G=-_int d lt .. .. .. .. 267 ..
1a Multiplie a/ 2.26 2.39 2.30 2.30 2.30 2.35 2.27 2.25 2.42
a/ broad may diidad by osesv may.
8oa: sepal betne Dek.

- 199 -
Table 6. 3
UffAL - ASS8M AD LXMhXU8U OP 500KM
1980/04 1904/S5 19"5/06 1906/07 1007/00 1900/09 1909/90 1990/91 1991/92
1KtiU of @ %Ual -ues at ed-peiod)
Net foreign assets 1,026 975 1,259 1,315 1,179 923 2,107 2,S90 2,449
ABsets 1,207 1,254 1,615 1,601 1,S01 1,S54 3,03s 3,000 4,694
Liabilities l0 279 3S6 36C 622 931 928 1,290 2,245
Net domestic assets 6,007 7,689 9,336 10,670 13,505 17,366 10,901 22,856 28,706
esOerve 732 924 1,209 1,376 1,066 2,264 3,360 4,119 4,555
Interbank deposits 44 So 62 43 29 67 U.n. n. Un.a
Tetal domestic caA- 5,600 7,327 0,930 10,410 13,196 16,923 10,364 23,727 30,421
sovezurmt 1,404 2,135 2,019 2,326 3,222 3,771 3,502 7,343 9,072
Nonfinancial pblic enterpises 940 1,150 1,721 1,051 1,959 2,160 2,021 1,320 2,0)2
Vinancial publie enterprises 97 136 144 l1S 64 20 20 29 29
Private aector 3,079 3,077 5,046 6,110 7,941 10,964 12,733 15,027 19,200
other assets (net) (377) (619) (065) (1,151) (1,496) (1,000) (2,023) (4,990) (6,270)
Liabilities 7,033 0,664 10,595 11,993 14,73S 10,277 21,009 25,446 31,155
Potal depoits &S 6,001 0,276 10,061 11,473 14,370 10,117 20,950 25,409 31,121
Demand deposits 1,357 1,459 1,931 2,095 2,553 3,207 3,620 3,900 4,900
Savinag deposits 1,320 1,756 2,236 2,647 3,302 4,277 5,160 6,602 0,493
rized deposits 3,090 4,663 5,57 6,331 7,934 9,S09 11,550 13,976 16,004
Margin deposits 314 398 297 400 591 644 612 051 916
Sorroving frcn the MM3 152 SS3 534 520 357 160 51 37 34
(Anual pentag cbane; nless othOewise specfiedf
Not foreign asts 30.7 -5.0 29.1 4.4 -10.3 -21.7 120.3 22.9 -5.4
Net dostic assets 9.5 20.0 21.4 14.4 27.2 27.0 0.0 20.9 25.6
Total damatic alcs 12.0 30.7 21.9 16.6 26.7 20.3 S.5 29.2 20.2
Total deposits a/ 11.9 20.3 21.6 14.0 25.3 26.0 15.7 21.2 22.5
Prioit sector leag as erWe-t
Of total deosetic crOit 5.2 6.0 6.4 5.4 4.9 5.3 7.1 5.5 5.5
a, Bacluding foreign dapoits.
Source: Nepal Rastra Ban.
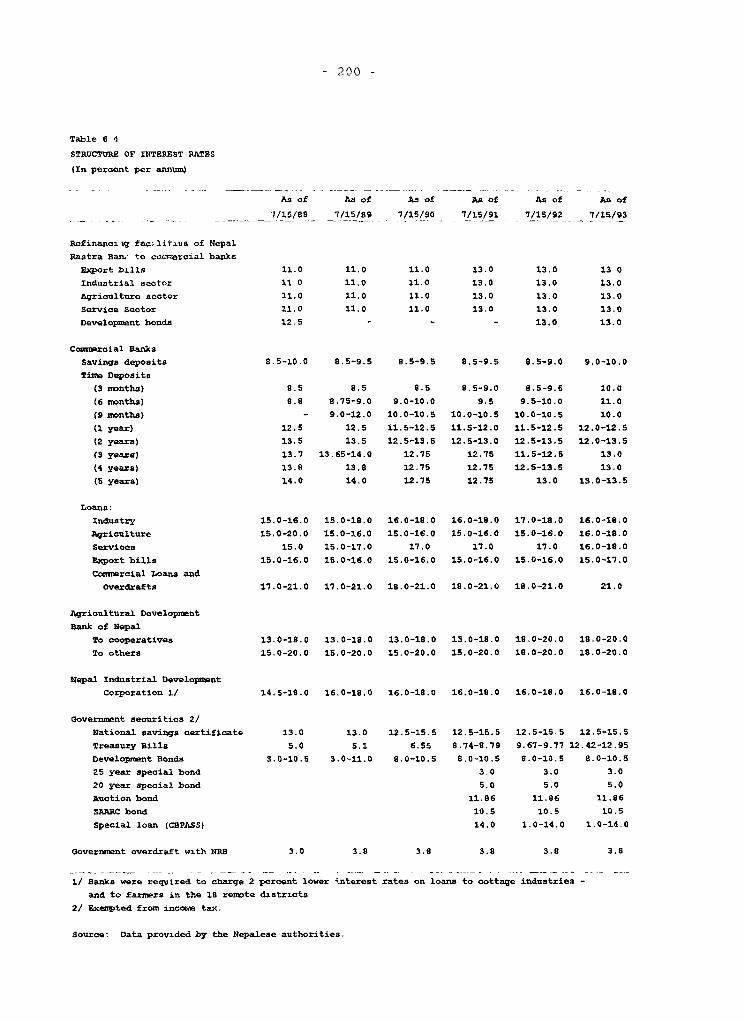
200 -
Table 6 4
STRUCTVUR OF NTgREST R&TES
(In peroent per annun9
As of As of As of As of As of As of
7/15/88 7/15/89 _7/15/90 7/15/91 7/15/92 7/15/93
Refinanc.ig fac:lit:us of Nepal
Rastra Ban, to ccv.amrcial banks
Export bills 11.0 11.0 11.0 13.0 13.0 13 0
Industrial sector 11 0 11,0 11.0 13.0 13.0 13.0
Agriculture sector 11.0 11.0 11.0 13.0 13.0 13.0
Service Sector 11.0 11.0 11.0 13.0 13.0 13.0
Deve1opment bonds 12.5 - - - 13.0 13.0
Cocmrcial Banks
Savings deposits 8.5-10.0 8.5-9.5 8.5-9.5 8.5-9.5 8.5-9.0 9.0-10.0
Tinm Deposits
(3 nonths) 8.5 8.5 8.5 8.5-9.0 8.5-9.5 10.0
(6 months) 8.8 8.75-9.0 9.0-10.0 9.5 9.5-10.0 11.0
(9 months) - 9.0-12.0 10.0-10.5 10.0-10.5 10.0-10.5 10.0
(1 year) 12.5 12.5 11.5-12.5 11.5-12.0 11.5-12.S 12.0-12.5
(2 years) 13.5 13.5 12.5-13.5 12.5-13.0 12.5-13.5 12.0-13.5
(3 years) 13.7 13.65-14.0 12.75 12.75 11.5-12.5 13.0
(4 years) 13.8 13.8 12.75 12.75 12.5-13.5 13.0
(5 years) 14.0 14.0 12.75 12.75 13.0 13.0-13.5
Loans:
Industry 15.0-16.0 15.0-18.0 16.0-18.0 16.0-18.0 17.0-18.0 16.0-18.0
Agriculture 15.0-20.0 15.0-16.0 15.0-16.0 15.0-16.0 15.0-16.0 16.0-18.0
Services 15.0 15.0-17.0 17.0 17.0 17.0 16.0-18.0
Export bills 15.0-16.0 15.0-16.0 15.0-16.0 15.0-16.0 15.0-16.0 15.0-17.0
Commeroial Loans and
Overdrafts 17.0-21.0 17.0-21.0 18.0-21.0 18.0-21.0 18.0-21.0 21.0
Agricultural Develop1mnt
Bank of Nepal
To cooperatives 13.0-18.0 13.0-18.0 13.0-18.0 13.0-18.0 18.0-20.0 18.0-20.0
To others 15.0-20.0 15.0-20.0 15.0-20.0 15.0-20.0 18.0-20.0 18.0-20.0
Nepal Industrial Development
Corporation 1/ 14.5-18.0 16.0-18.0 16.0-18.0 16.0-18.0 16.0-18.0 16.0-18.0
Government securities 2/
National savings certificate 13.0 13.0 12.5-15.5 12,5-15.5 12.5-15.5 12.5-15.5
Treasury Bills 5.0 5.1 6.55 8.74-8.79 9.67-9.77 12.42-12.95
Development Bonds 3.0-10.5 3.0-11.0 8.0-10.5 8.0-10,5 8.0-10.5 8.0-10.5
25 year special bond 3.0 3.0 3.0
20 year special bond 5.0 5.0 5.0
Auction bond 11.86 11.86 11.86
SAARC bond 10.5 10.5 10.5
Special loan (CBPASS) 14.0 1.0-14.0 1.0-14.0
Governmnot overdraft with NRi 3.0 3.8 3.8 3.8 3.8 3.8
1/ Banks were required to charge 2 percent lower interest rates on loans to cottage industries -
and to farmers in the 18 remete districts
2/ Fxempted from inco tax.
Source: Data provided by the Nepalese authorities.
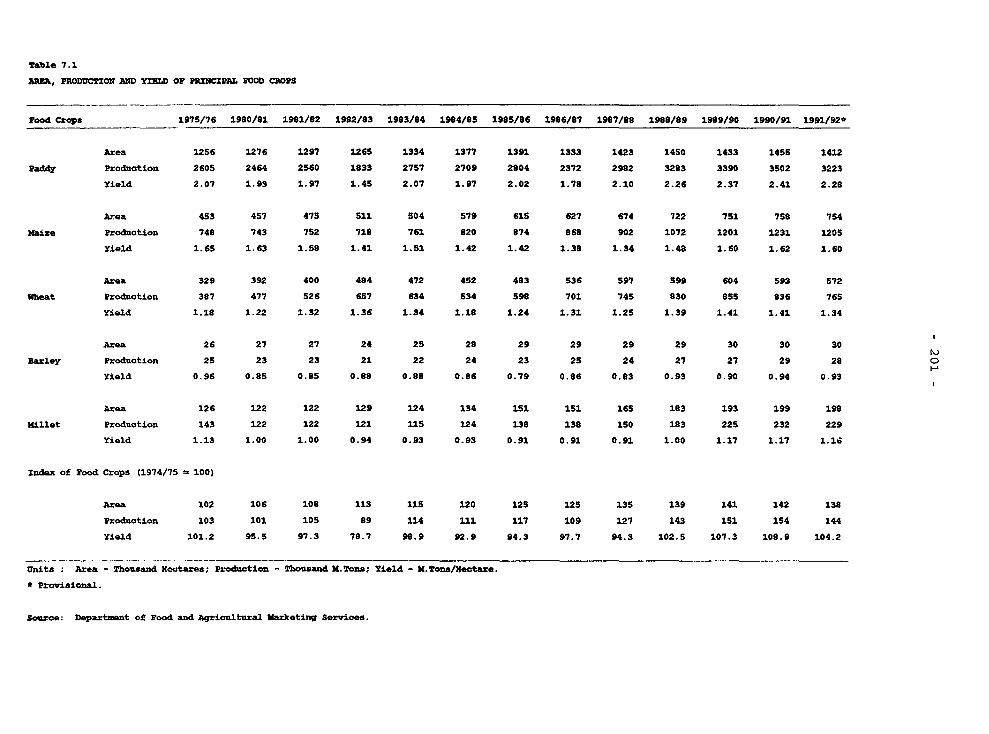
Table 7.1
AR, PRoDuCTXoN mmD YIBID Or PRINCIPAB FO#D CROPS
road Crops 1975/76 1980/81 1901/82 1982/83 1983/84 1904/85 1995/86 1996/87 1987/88 1988/89 1989/90 1990/91 1991/92*
Area 1256 1276 1297 1265 1334 1377 1391 1333 1423 14S0 1433 1455 1412
Paddy Production 2605 2464 2560 1933 2757 2709 2004 2372 2982 3283 3390 3502 3223
Yield 2.07 1.93 1.97 1.45 2.07 1.97 2.02 1.79 2.10 2.26 2.37 2.41 2.28
Area 453 457 475 511 504 579 615 627 674 722 751 758 754
Mfaiz- Production 748 743 752 718 761 820 874 868 902 1072 1201 1231 1205
Yield 1.65 1.63 1.58 1.41 1.51 1.42 1.42 1.38 1.34 1.48 1.60 1.62 1.60
Area 329 392 400 484 472 452 483 536 597 S99 604 593 572
1Nheat Production 387 477 526 657 634 534 598 701 745 830 855 836 765
Yield 1.18 1.22 1.32 1.36 1.34 1.18 1.24 1.31 1.25 1.39 1.41 1.41 1.34
Area 26 27 27 24 25 28 29 29 29 29 30 30 30
Barley Produotion 25 23 23 21 22 24 23 25 24 27 27 29 28 0
Yield 0.96 0.85 0.85 0.88 0.88 0.86 0.79 0.86 0.83 0.93 0.90 0.94 0.93
Area 126 122 122 129 124 134 151 151 165 183 193 199 198
Millet Production 143 122 122 121 115 124 138 138 150 183 225 232 229
Yield 1.13 1.00 1.00 0.94 0.93 0.93 0.91 0.91 0.91 1.00 1.17 1.17 1.16
index of Pood Crops (1974/75 = 100)
Area 102 106 108 113 115 120 125 125 135 139 141 142 130
Production 103 101 105 89 114 111 117 109 127 143 151 154 144
Yield 101.2 9S.S 97.3 78.7 98.9 92.9 94.3 97.7 94.3 102.5 107.3 108.9 104.2
Units : Area - Thousand Hectares; Production - thousand M.lons; Yield - M.Tons/Bectare.
* Provisional.
Source: Departnent of Food and Agricultural Marketing Services.

Table 7.2
AM, PRODJCIION AND Y2FLD OF PRXSC2PAL CASH CROPS
Cash Crops 1975/76 1980/81 1981/82 1982/83 1983/84 1994/85 1985/86 1986/87 1987/88 1988/89 1989/90 1990/91 1991/92*
Area 15 24 25 25 23 17 23 25 30 30 32 33 37
Sugarcane Production 253 480 590 616 509 408 558 617 814 903 988 1106 1291
Yield 16.9 20.0 23.6 24.6 22.1 24.0 24.3 24.7 27.1 30.1 31.0 33.4 34.9
rea 113 122 114 110 111 128 138 143 151 155 154 156 155
oil seeds Production 68 77 79 70 73 84 79 83 94 99 98 92 88
Yield 0.6 0.6 0.7 0.6 0.7 0.7 0.6 0.6 0.6 0.6 0.6 0.6 0.6
Area 7 7 7 9 9 9 9 9 6 7 8 7 7
Tobacco Production 5 5 5 7 7 6 5 5 4 5 7 7 6
Yield 0.7 0.7 0.7 0.8 0.8 0.7 0.6 0.6 0.7 0.7 0.9 1.0 0.9
A%ea 34 52 35 30 24 27 47 20 14 14 13 14 15
Jute Production 41 59 43 39 25 33 61 23 15 18 16 16 19 o
Yield 1.2 1.1 1.2 1.3 1.0 1.2 1.3 1.2 1.1 1.3 1.2 1.1 1.3
Area 53 50 52 59 59 66 70 74 80 82 83 84 85
Potato Production 314 281 321 373 383 420 357 395 567 641 671 738 733
Yield 5.9 5.6 6.2 6.3 6.5 6.4 5.1 5.3 7.1 7.8 8.1 8.8 8.6
Index of Cash Crops (1974/75 - 100)
Area 100 115 105 105 102 112 130 144 127 130 131 133 135
Production 102 135 115 165 149 142 158 179 223 249 266 292 319
Yiele 101.9 116.7 109.1 156.4 145.5 127.0 121.8 123.6 175.6 190.8 202.5 219.8 235.8
Units : Area - Thousand Hectares; Production - Thousand M.Tons; Yield - K.Tons/Nectare.
* Prelininary
Source: Depart=nut of rood and Agricultural Marketing Services.

Table 7.3
PR0DCCTION OF MAJOR ASRIC0LT0L CROPS
Value
Agri. Crops Weights 1974/75 1979/80 1980/81 1981/82 1982/83 1983/84 1984/85 1985/86 1986/87 1987/88 1988/89 1989/90 1990/91 1991/92
_(percent)
Poodg?ains ('000 NT) 41.04 3775 3196 3829 3983 3350 4289 4211 4438 4104 4803 5395 5698 5930 5464
Paddy 21.09 2452 2060 2464 2560 1833 2757 2709 2804 2372 2982 3283 3390 3502 3223
Maize 10.26 827 554 743 752 718 761 820 874 868 902 1072 1201 1231 1205
Wheat 5.70 331 440 477 S26 657 634 534 598 701 745 830 855 836 779
Millet 3.42 140 119 122 122 121 115 124 138 138 1S0 183 225 232 229
Barley 0.57 26 23 23 23 21 22 24 23 25 25 27 27 29 28
Cash Crops t'000 MT) 7.98 671 798 900 1036 1105 997 952 1060 1123 1494 1665 1780 1955 2137
sugarcane 0.57 251 384 483 590 617 S09 408 558 617 814 903 988 1106 1291
Oilseeds 2.28 66 62 77 79 69 73 84 79 83 94 99 98 92 88
Tobacco 0.57 5 6 5 5 7 7 6 5 S 4 5 7 7 6
Jute 1.14 41 68 59 43 39 25 33 61 23 15 18 16 16 19
Potato 3.42 307 278 275 320 373 383 420 357 395 567 641 671 738 733
N)Other Crops ('000 MT) 7.98 769 882 914 971 1119 1165 1231 1303 1380 1411 1483 1620 1633 1785 Z
pulses 2.58 108 123 132 135 129 129 146 146 166 139 157 163 161 155
Fruits 3.71 254 274 271 316 318 336 343 373 390 398 404 463 502 502
Vegetables 1.69 407 485 511 520 672 700 742 774 875 874 922 994 970 1128
Livestock 27.00 - - - - - - 29 30 30 31 31 0 0 0
Meat (O000 MT) 7.25 97 104 105 112 117 122 127 131 132 137 143 145 146 148
Buffalo 0.97 65 71 71 77 80 83 86 87 89 92 95 94 95 96
Sheep 1.46 2 2 2 2 2 2 3 3 3 3 3 3 3 3
Goat 1.45 21 21 21 22 24 25 25 21/ 26 28 28 29 29 3C
Pig 0.46 5 6 6 6 6 7 7 7 8 9 9 10 10 10
Poultry 2.91 4 4 5 5 5 5 5 6 6 6 6 9 9 9
Milk a Milk Products 14.53 621.79 631.69 557.27 667.02 711.54 741.61 745.16 755.36 767.88 808.60 834.41 859.36 865.42 871 82
('000 MT)
Milk 14.47 621.70 631.50 557.10 666.90 711.40 741.40 745.00 755.00 767.53 808.08 834.00 85a.77 864.83 871.23
Milk Products 0.06 0.09 0.19 0.17 0.12 0.14 0.21 0.16 0.36 0.35 0.52 0.41 0.59 0.59 0.59
Eggs ('000 MT) 5.22 133 151 199 207 220 233 250 278 272 278 298 342 370 366
Pishery t*°°° MT) 1.00 2.60 3.70 3.70 3.90 4.30 5.30 6.10 6.40 10.72 12.10 12.52 13.30 14.50 16.50
Source: Central Bureau of Statistics.
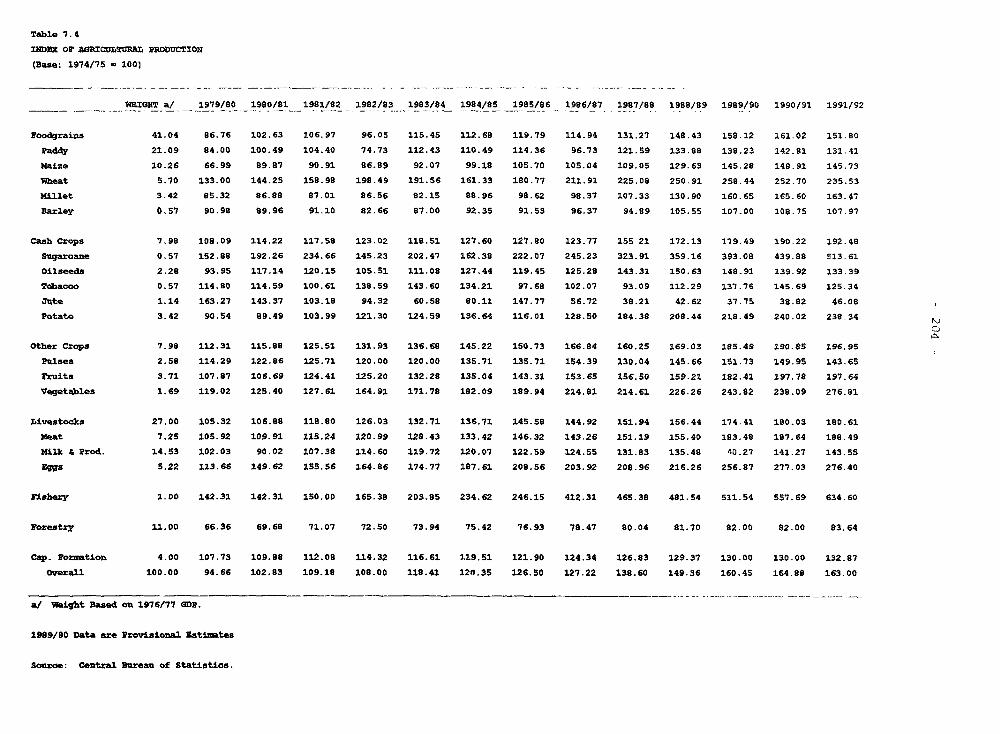
Table 7. 4
nEDEX OF AGMICtJLTUBAX. PRODUCTION
(Base: 1974/75 100)
NEIGXT a/ 1919/90 1980/81 1981/82 1982/83 1983/84 1984/85 1985/86 _1986/87 1987/88 1988/89 1989/90 1990/91 1991/92
Poodgrains 41.04 86.76 102.63 106.97 96.05 115.45 112.68 119.79 114.94 131.27 148.43 158.12 161.02 151.80
Paddy 21.09 84.00 100.49 104.40 74.73 112.43 110.49 114.36 96.73 121.59 133.88 138.23 142.81 131,41
Maize 10.26 66.99 89.817 90o.91 86.89 92.07 99.18 105.70 105.04 109.05 129.63 145.28 148.91 145.73
Wh2eat 5.170 133.00 144.25 158.98 198.49 191.56 161.33 180.77 211.91 225.08 250.91 258.44 2S2.70 235.53
millet 3.42 85.32 86.88 87.01 86.56 92.15 88.96 98.62 98.37 107.33 130.90 160.65 165.60 163.47
Barley 0.57 90.98 89.96 91.10 82.66 87.00 92.35 91.53 96.37 94.89 105.55 107.00 108.75 107.97
Cash crops 7.98 108.09 114.22 117.58 123.02 118.51 127.60 127.80 123.77 155 21 172.13 179.49 190.22 192.48
Seqarcane 0.57 152.88 192.26 234.66 145.23 202.47 162.38 222.07 245.23 323.91 359.16 393.08 439.88 5,13.61
Oilseeds 2.28 93.95 117.14 120.15 105.51 111.08 127.44 119.45 125.28 143.31 150.63 148.91 139.92 133.39
Tobacco 0.57I 114.80 114.59 100.61 138.59 143.60 134.21 97.68 102.07 93.09 112.29 137.76 145.69 125.34
jute 1.14 163.27 143.37 103.18 94.32 60.58 80.11 147.77 56.72 38.21 42.62 37.75 38.82 46.08
potato 3.42 90.54 89.49 103.99 121.30 124.59 136.64 116.01 128.50 184.38 208.44 218.49 240.02 238.34
Other Crops 7.98 112.31 115.88 125.51 131.93 136.68 145.22 150.73 166.84 160.25 169.03 185.49 190.85 196.95
Pulses 2.58 114.29 122.86 125.71 120.00 120.00 135.71 135.71 154.39 130.04 145.66 151.73 149.95 143.65
Fruits 3.71 107.87 106.69 124.41 125.20 132.28 135.04 143.31 153.65 156.50 159.21 182.41 197.78 197.64
Vegetables 1.69 119.02 125.40 127.61 164.91 171.78 182.09 189.94 214.81 214.61 226.26 243.82 238.09 27 6. 81
Livestocks 27.00 105.32 106.88 118.80 126.03 132.71 136.71 145.58 144.92 151.94 156.44 174.41 180.03 180.61
Meat 7.25 105.92 109.91 115.24 120.99 128.43 133.42 146.32 143.26 151.19 155.40 183.48 187.64 188.49
Milk & Prod. 14.53 102.03 90.02 107.38 114.60 119.72 1.20.07 122.59 124.55 131.83 135.48 40.27 141.217 143.55
Egg 5.22 113.66 149.62 155.56 164.86 174.77 187.61 208.56 203.92 208.96 216.26 256.87 277.03 276.40
Wisbery 1.00 142.31 142.31 150.00 165.38 203.85 234.62 246.15 412.31 465.38 481.54 511.54 557.69 634.60
Forestry' 11.00 66.36 69.68 71.07 72.50 73.94 75.42 76.93 78.47 80.04 81.70 82.00 82.00 83.64
cap. Foimation, 4.00 107.73 109.88 112.08 114.32 116.61 1.19.51 121.90 124.34 126.83 129.37 130.00 130.00 132.87
overall 100.00 94.66 102.83 109.18 108.00 118.41 120.35 126.50 127.22 138.60 149.36 160.45 164.88 163.00
a/ Weight Based on 1976/77 GD?P.
1989/90 Data are Provisional Estinates
Source: Central Buareau of Statistics.

- 205 -
Table S.1
PRODUCTXION OF IWU)?CTU=RfG fIDUSTRXZS
S.No. Code No. Major Industry Groups Unit 1986/87 1987/88 1988/99 1989/90 1990/91 1991/92
1 311-312 Food Manufacturing
42.30 1 Noodles M.T. 1169 1532 1620 1647 1774 2176
48.42 XI Biscuits MT.. 4536 4674 4459 4430 5538 5534
54.5 UI! Squash Th. Litre 1003 773 421 565 90S 848
61.20 1V Sugar M.2. 24565 30040 24197 31927 44548 55265
74.11 V Tea M.T. 1112 1290 1194 1393 1249 1476
91.98 V1 Asdanl reads K.T. 9250 12329 11972 11543 10574 21682
91.40 V7x Vegetable Ghoe M.T. 5273 5365 4483 7962 12639 12242
2 313 Beverage Industries
111.02 I Saftdrinks Th. Litre 13434 15996 12270 11520 12042 13410
112.30 XI Beer Th. Litre 3699 5276 6291 6939 10396 12329
112.40 XII Liquor Th. Litre 1283 2119 2092 2460 2626 3022
3 314 Tobacco Manufac uring
122.20 X Cigarette il1.Sticks 5600 6046 5665 6317 6691 6963
112.30 11 Bidi Nil.Sticks 709 635 5S1 369 224 245
4 321 Manufacture of Textile
6S2.10 I Cotton Clothes Th. Metre 17922 9914 7057 5286 5421 7207
653.50 II Synthetic Clothes Th. Metre 11561 13363 11848 13631 16494 11445
III Jhte Gooda Y-P. 18289 17198 16950 7473 11170 17639
5 323 Leather & Leather Prod=uts
611.20 I Processed Leather Ph.Sq.Wt. 12429 6274 7117 12035 14174 6092
6 324 Pootwear Manufacturing
951 x Shoe Th. Pairs 121 214 332 744 1009 1530
7 331 Wood a Wood Products
634.20 I Plywood Th.Sq.Ft. 2489 1314 1315 0 269 645
tX Straw Board M.2. 469 791 334 494 402 336
S 341 Paper & Paper Products
641.90 I Paper M.P. 2723 4919 5904 5321 6341 6417
9 352 Manufacture of Other
Cboi4a Product
554.10 I Soap Ml.T. 11460 12303 14856 11943 20057 20903
554.30 II Deteret Powder M.T. 57 184 250 499 490 723
99.32 I1I Matchs Th. Gross 1314 1215 1272 1223 1091 942
10 355 Manufacture of Rubber Products
951.01 S Sliper Th. pairs 4404 5769 7247 7689 9752 9353
11 356 Manufacture of Plastic Products
591 I Plastic Goods M.T. 1324 1579 2070 2929 5604 4995
12 369 Other Son Metallic Minexal
Products
661.2 X Cement X.T. 151631 215010 217666 101179 135897 237327
662.41 IX Bricks & Tiles (Goyv Th. Piece 33076 34629 33440 16291 32625 33969
13 371 Iron a Steel Based Indutries
673 I Iron Rod Anles, etc M.2. 3454S 25625 34834 36339 45631 61530
Continued...
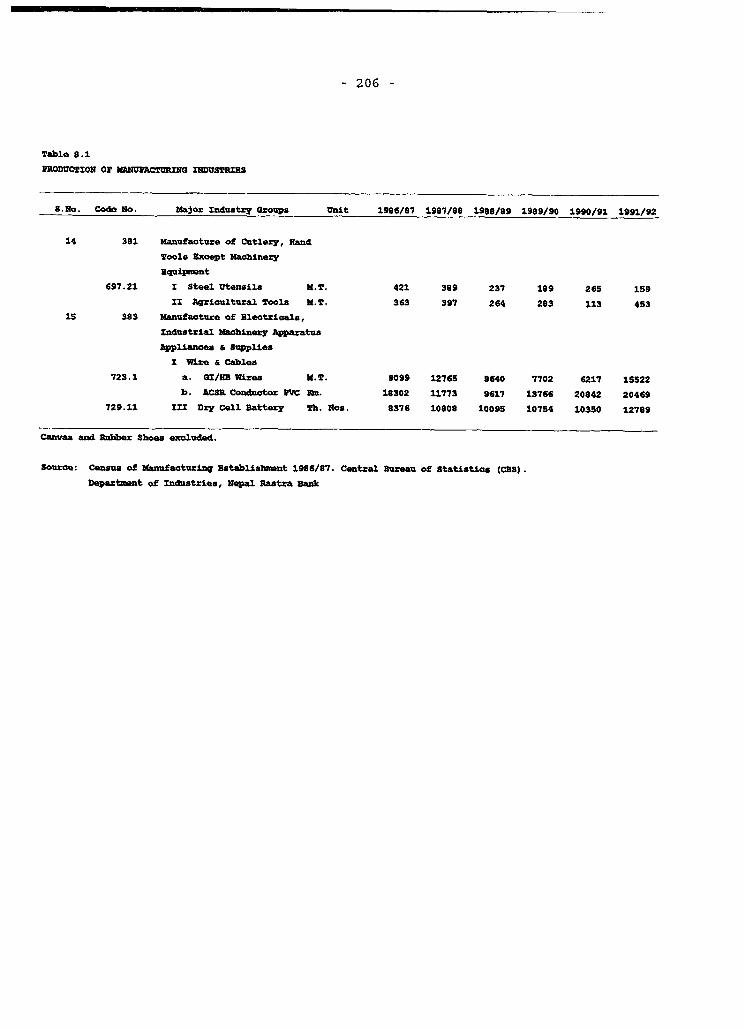
- 206 -
Table 9.1
PRODUCTIoN or 1Amu1 sac N XINDVSTraS
S.No. Code No. Major Induatzy Grovpa unit 1986/87 1987/89 1998/99 1909/90 1990/91 1991/92
14 381 Manufacture of Cutlery, Hand
Tools Except Machinery
ZquipV-nt
697.21 I Steel Utensila M.T. 421 399 237 1S9 265 159
XI Agriaultural Tools M.T. 363 397 264 203 113 453
15 393 Manufacture of Ulectricals,
Industrial Machinexy Apparatus
Appliancesa & Supplies
I Wize a Cables
723.1 a. SI/EB Wirea M.T. 9099 12765 9640 7702 6217 15522
b. ACSR Conductor P¶VC E. 19302 11773 9617 13766 20842 20469
729.11 xII Dry Call Battery Th. Nos. 8376 10809 10095 10754 10350 12789
Canvs and abber Shoes excluded.
Source: Census of Manufacturing Establiahment 1986/87. Central Bureau of Statistics (CUS).
Departmet of Industries, Nepal Pastra Eank
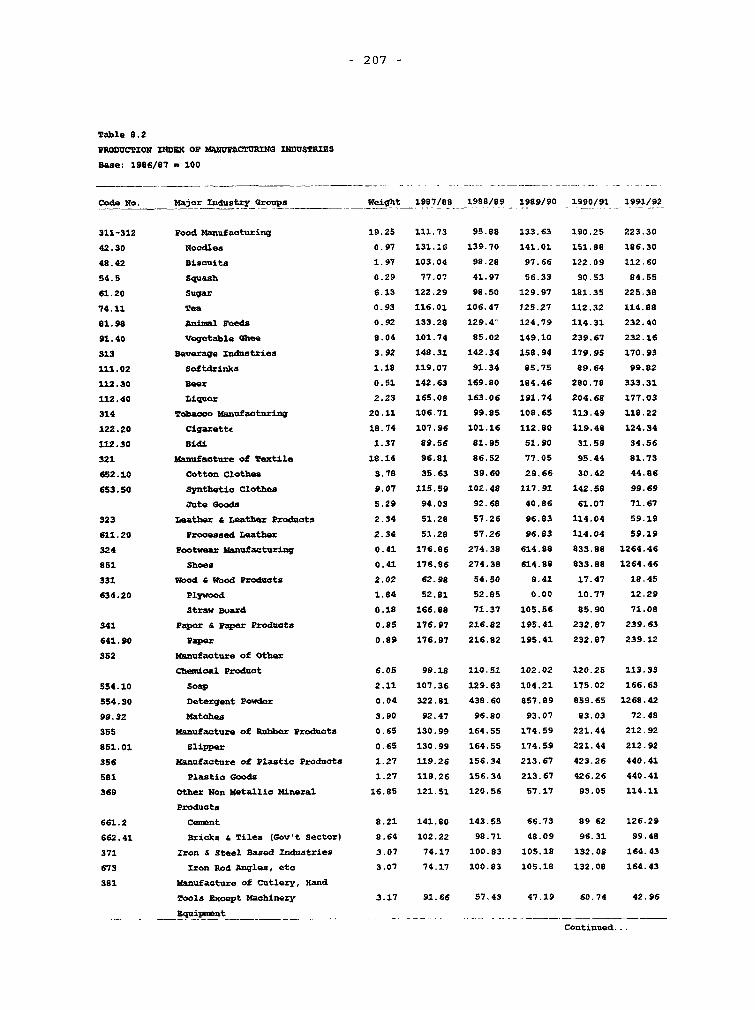
- 207 -
Table S.2
PRODCCTZON nOSDx OF Wi8WWACTDuXNG INDUSTIXzs
Base: 1986/87 = 100
Code No. Major Ildustry Groups Weight 1987/88 1988/89 1989/90 1990/91 1991/92
311-312 Food Manufacturing 19.25 111.73 95.88 133.63 190.25 223.30
42.30 Noodles 0.97 131.16 139-70 141.01 151.8B 186.30
48.42 8iscuits 1.97 103.04 98.28 97.66 122.09 112.60
54.5 Squash 0.29 77.07 41.97 56.33 90.53 84.55
61.20 sugar 6.13 122.29 98.50 129.97 181.35 225,39
74.11 Tea 0.93 116.01 106.47 125.27 112.32 114.88
81.98 Aninal Feeds 0.92 133.28 129.4- 124.79 114.31 232.40
91.40 Vegetable Chee 8.04 101.74 85.02 149,10 239.67 232.16
313 Beverage Iduastries 3.92 148.31 142.34 158.94 179.95 170.93
111.02 Softdrilnks 1.18 119.07 91.34 85.75 89.64 99.82
112.30 Beer 0.51 142.63 169.80 184.46 280.78 333.31
112.40 Liquor 2.23 165.08 163.06 191.74 204.68 177.03
314 Tobacco Manufacturing 20.11 106.71 99.85 108.65 113,49 118.22
122.20 Cigarette 18.74 107.96 101.16 112.80 119.48 124.34
112.30 'idi 1.37 89.56 81.95 51.90 31.59 34.56
321 Manufacture of Textile 18.14 96.81 86.52 77.05 95.44 81.73
652.10 Cotton Clothes 3.78 35.63 39.60 29.66 30.42 44.86
653.50 Synthetic Clothes 9.07 115.59 102.48 117.91 142.58 99.69
Jute Goods 5.29 94.03 92.68 40.86 61.07 71.67
323 Leather & Leather Products 2.34 51.28 57.26 96.83 114.04 59.19
611.20 Processed Leather 2.34 51.28 57.26 96.83 114.04 59.19
324 Footwear Manufacturing 0.41 176.86 274.38 614.88 833.88 1264.46
851 Shoes 0.41 176.86 274.38 614.88 933.88 1264.46
331 Wood & Wood Products 2.02 62.98 54.50 9.41 17.47 18.45
634.20 Plywood 1.84 52.81 52.85 0.00 10.77 12.29
Straw Board 0.18 166.88 71.37 105.56 85.90 71.08
341 Paper & Paper Products 0.85 176.97 216.82 195.41 232.87 239.63
641.90 Paper 0.89 176.97 216.82 195.41 232,87 239.12
352 Manufacture of Other
Chemical Product 6.05 99.18 110.51 102.02 120.25 113.33
554.10 Soap 2.11 107.36 129.63 104.21 175.02 166.63
554.30 Detergent Powder 0.04 322.81 438.60 857.89 859.65 1268.42
99.32 Matches 3.90 92.47 96.80 93.07 83.03 72.48
355 Manufacture of Rubber Products 0.65 130.99 164.55 174.59 221.44 212.92
851.01 Slipper 0.65 130.99 164.55 174.59 221.44 212.92
356 Manufacture of Plastic Products 1.27 119.26 156.34 213,67 423.26 440.41
581 Plastic Goods 1.27 119.26 156.34 213.67 426.26 440.41
369 Other Non Metallic Mineral 16.85 121.51 120.56 57.17 93.05 114.11
Products
661.2 Cenant 8.21 141.80 143.55 66.73 89 62 126.29
662.41 Bricka & Tiles (Gov't sector) 8.64 102.22 98.71 48.09 96.31 99.48
371 Iron & Steel Based Industries 3.07 74.17 100.83 105.18 132.08 164.43
673 Tron Rod Anglea, etc 3.07 74.17 100.83 105.18 132.08 164.43
381 Manufacture of Cutlery, Hand
Tools Except Machinery 3.17 91.66 57.43 47.19 60.74 42.96
_ Equipnent _______C_n _u_ _-
Continued...

- 208
Table S.2
PRQDU0CON INDEXC OP MAIMrA1C MSa XND S5FgS
Base: 1986/S7 = 100
Code No. Major Snaustry Groups Weight 1987/eS 19SS/09 1999/90 1990/91 1991/92
697.21 Steel Utensils 2,95 92.40 56.29 44.89 62.95 37.77
Agricultural Toole 0.22 S1.02 72.73 77.9S 31.13 40.85
303 Manufacture of Blectricals,
Induatrial Macbinery Apparatus 1.90 122.19 99.03 94.04 91.60 154.22
Applianceas & upplies 1.41 119.92 91.55 82.11 80.60 154.76
Wire Cables
723.1 a. GI/BB wires 1.03 140.92 105.95 84.65 69.33 170.59
b. jiCSR Conductor PVC Cable 0.38 64.33 52.55 75.22 113.98 111.84
729.11 Dry Cell Battery 0.49 129.04 120.52 128.39 123.57 152.69
Overall Iadex 100.00 107.39 102.07 100.58 129.72 135.09
* Based on ir. Montha data.
Scarce: Central Bureau of statiatica

Table S. 3
cataicrr uzAx nT 8suw ISC S11WSSD
(Zn Percentages)
1975/76 1990/81 1901/02 1982/03 1903/84 1984/85 1985/06 1986/87 1987/99 1988/89 1989/90 1990/91 &/
Sugax 43 S3 92 99 72 49 36 S8 73 59 52 72
Cigarettes 60 S0 60 77 103 118 53 62 67 60 63 65
Beer 30 122 106 74 74 N.A. 72 o8 a1 96 76 72
Matcbes 41 46 56 64 83 91 60 69 70 53 19 13
Ss 46 90 60 97 79 91 69 74 11 13 31 39
Cemnt 56 65 63 77 01 N.A. 25 47 67 68 26 34
Jute Products 75 82 78 72 107 101 60 67 73 54 24 35
Brick & Tile 73 63 52 77 74 45 6 74 63 74 36 A.
a/ Capacity increases das to establishnt of nre unit.
Souce: ministry of Zndustry.
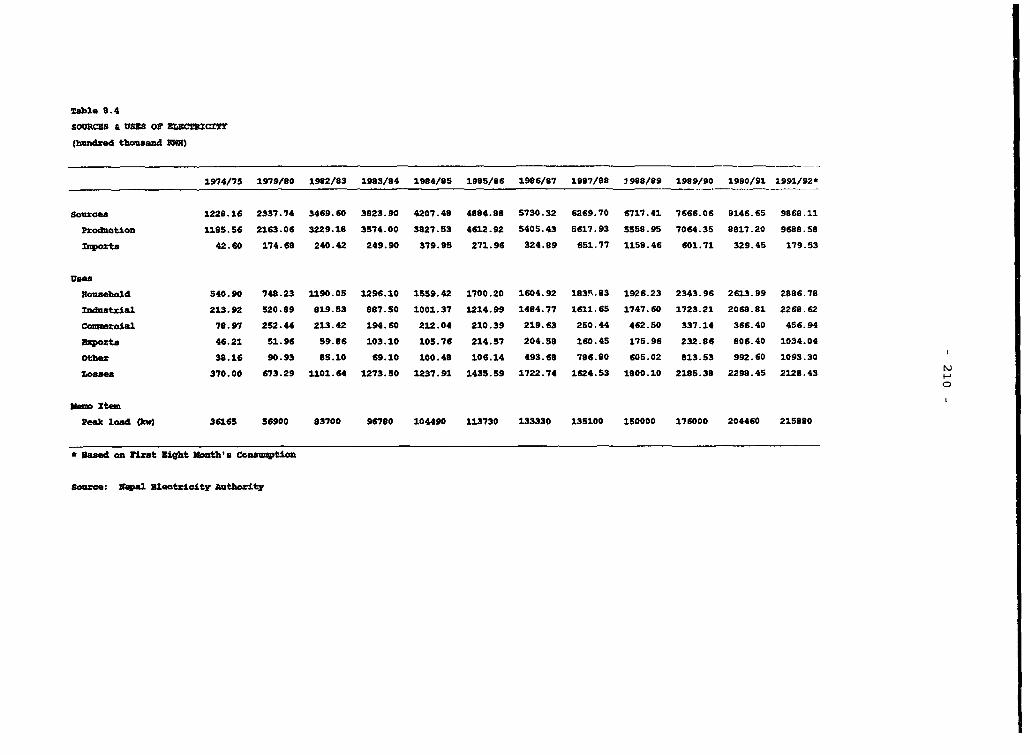
Table 8.4
SoURC3S & USES Or ILNCWXcITr
(hundred thusand NM
1974/75 1979/80 1982/93 1983/84 1994/85 1985/86 1986/87 1987/88 19 8/89 1989/90 1990/91 1991/92*
Sources 1228.16 2337.74 3469.60 3823.90 4207.48 4084.88 5730.32 6269.70 6717.41 7666.06 9146.65 9968.11Production 1185.56 2163.06 3229.18 3574.00 3827.53 4612.92 5405.43 5617.93 5558.95 7064.35 8817.20 9688.50!upozts 42.60 174.68 240.42 249.90 379.95 271.96 324.99 651.77 1158.46 601.71 329.45 179.53
Us"S
Nousoold 540.90 749.23 1190.05 1296.10 1559.42 1700.20 1604.92 183R.93 1926.23 2343.96 2613.99 2886.78Zudustrial 213.92 520.89 B19.53 887.50 1001.37 1214.99 1484.77 1611.65 1747.60 1723.21 2068.81 2268.62Couaaz:ial 78.91 252.44 213.42 194.60 212.04 210.39 219.63 250.44 462.50 337.14 366.40 4S6.94Exports 46.21 51.96 S9.86 103.10 105.76 214.57 204.58 160.45 175.96 232.86 806.40 1034.04Other 38.16 90.93 85.10 69.10 100.48 106.14 493.68 786.80 605.02 813.53 992.60 1093.30losses 370.00 673.29 1101.64 1273.50 1237.91 1435.59 1722.74 1624.53 1800.10 2185.38 2299.45 2128.43
mo Ite
Peak load (kw) 36165 56900 83700 96780 104490 113730 133330 135100 150000 176000 204460 215890
B Eased on Firat Eight Month's Conuption
Source: irepal Electricdty Authority

Table 8.5
IPORTS OF PE5ReLUMI PROD0CTS BY WIPMS
(Quantity in MT)
1974/75 1980/81 1984/85 1985/86 19S6/S7 1987/88 1980/89 19S9/90 1990/91 1991/92*
motor Spirit 7,251 8,130 12,620 13,111 14,197 15,609 17,340 14,703 17,241 13,674
High Speed Diesel 22,406 47,359 59,284 63,140 72,098 73,321 75,356 103,273 106,430 92,151
Kerosene Oil 25,S68 29,393 37,98S 46,304 55,445 51,835 63,246 95,672 75,939 67,610
Light Diesel Oil 8,049 8,813 6,538 6,741 6,430 5,719 6,074 - 2,476 1,932
ftrance Oil 474 2,863 3,680 12,033 13,315 7,435 6,336 - 6,209 6,931
Aircraft Turbine Oil 7,172 13,011 17,682 17,872 19,345 19,698 ;6,244 9,327 16,541 14,109
Lubricants 1,197 557 1,092 517 250 238 1,170 - 26 127
Jute Bleacbing Oil 822 651 544 468 614 422 443 - 253 122
Liquified Petrolemn Gas 215 352 1,107 1,021 1,399 2,304 2,548 - 3,816 4,188
Biturin 1,565 36 2,373 399 1,401 1,195 946 - 2,643 1,629
Methanol - 43 40 33 54 30 33 - 28 11
Roman Oil - 96 255 235 261 1 5S8 - 165 66
M.T.O. - - 16 20 34 - 52 - 72 47
Base Oil - - - - - 604 423 - - 3S0
A.V. Gas - - - - - - 4 - - I
Total 75,019 111,304 149,716 161,894 1S5,343 178,410 190,873 222,980 231,847 202,978
Value (as in Million) 19.39 47.60 30.00 101.51 86.00 97.23 84.08 217.82 302.56 226.00
POL moprts as e of
Merchandise Pxport 21.8 29.6 29.2 32.9 28.7 23.6 20.0 41.6 39.8 22.9
* Provisional (first nine months)
Source: Nepal Oil Corporation

Table . 6
32MNSI0N Or UANSPOR! lC)LX!ZZS ASD uSES
unit 1980/B1 1984/95 1905/86 1986/87 1987/88 1998/89 1999/90 1990/91 1991/92*
Aizwaya
Passenger in Doatic Flight No 000 214 264 239 266 339 296 291 308 216
Passenger in External Flight No 000 161 174 196 219 259 299 317 325 214
Cargo in Dome tic Flight Ton 676 700 771 736 822 791 853 743 545
Cargo in External Flight Ton 1490 3082 3139 3365 5204 6598 6308 4111 2826
Railways
Available Facilities Sl 52 52 52 52 52 52 52 52 52
Nmer of Passenger 000 No 1271 1460 1500 1673 1365 1387 1760 1100 577
tOOC. Transported 000 Ton 21 19 17 19 1B 18 22 .5 a
RopeWs
Arailable Facilities m 42 42 42 42 42 42 42 42 42
Goods Transported DOO Ton 1 7 25 20 11 21 29 12 a
Trolley Bus
Available facilities Im 13 13 13 13 13 13 13 13 13
Nbar of fassnger No 000 2468 4023 4966 3668 4222 5434 5435 5300 3372
Roads 5021 5925 6039 6306 6611 6611 7036 7401 7616
fllac topped KS 2167 2724 2757 2794 2822 2837 2999 3016 3072
Gravelled 1 703 918 946 1180 1348 1477 1621 l655 1678
lair veat;r E 2t 2151 2283 2336 2332 2441 2297 2516 2730 2865
Number of Vlnhic1es RegiPsteed
3us/Minibns No 233 511 314 190 165 98S 723 822 292
Truck No 409 569 531 460 525 449 240 772 1198
Jeep/C-r Nc 934 1822 1276 1229 153B 1933 lB31 2B9S 1292
* FiZ8t might months.
Souro: Departannt of Roads, Nepal Tranaport Corp., Civil Aviation and
RPal Nepal Airlines Corporation and Police teadqusrters.
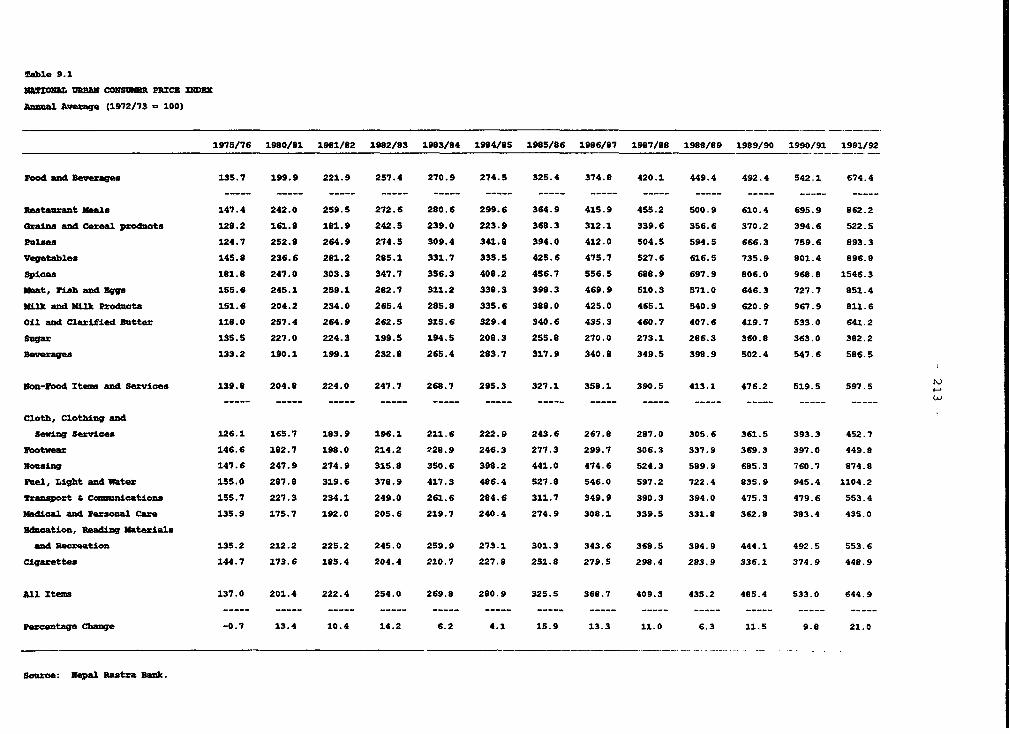
Table 9.1
NmWZOShL UPBI= consimR Pxcz INDX
Annual Average (1972/73 - 100)
1975/76 1980/81 1981/82 1982/83 1983/84 1904/85 1985/86 1986/87 1987/88 1988/89 1989/90 1990/91 1991/92
rood and Beverages 135.7 199.9 221.9 257.4 270.9 274.5 325.4 374.8 420.1 449.4 492.4 542.1 674.4
Restaurant beals 147.4 242.0 259.5 272.6 280.6 299.6 364.9 415.9 455.2 500.9 610.4 695.9 862.2
Graina and Cereal products 128.2 161.8 181.9 242.5 239.0 223.9 368.3 312.1 339.6 356.6 370.2 394.6 522.5
Pulses 124.7 252.8 264.9 274.5 309.4 341.8 394.0 412.0 504.5 594.5 666.3 759.6 893.3
Vegetables 145.8 236.6 281.2 285.1 331.7 33S.5 425.6 475.7 527.6 616.5 735.9 801.4 896.9
Spices 181.8 247.0 303.3 347.7 356.3 408.2 456.7 556.5 688.9 697.9 806.0 968.8 1S46.3
Meat, Wish an4d ggs 155.6 245.1 259.1 282.7 311.2 338.3 398.3 469.9 510.3 571.0 646.3 727.7 851.4
Milk and Milk Products 151.6 204.2 234.0 265.4 285.8 335.6 388.0 425.0 465.1 540.9 620.9 967.9 811.6
Oil and Clarified Butter 118.0 257.4 264.9 262.5 31S.6 329.4 340.6 435.3 460.7 407.6 419.7 533.0 641.2
Scger 135.5 227.0 224.3 199.5 194.5 208.3 255.8 270.0 273.1 286.3 360.8 363.0 382.2
8everages 133.2 190.1 199.1 232.8 265.4 283.7 317.9 340.8 349.5 398.9 502.4 547.6 586.5
Non-rood Ites and Services 139.8 204.8 224.0 247.7 268.7 295.3 327.1 358.1 390.5 413.1 476.2 519.5 597.5
Cloth, Clothing and
Sewing Services 126.1 165.7 183.9 196.1 211.6 222.9 243.6 267.8 287.0 305.6 361.5 393.3 4S2.7
Wootwear 146.6 182.7 198.0 214.2 228.9 246.3 277.3 299.7 306.3 337.9 369.3 397.0 449.8
Sousing 147.6 247.9 274.9 315.8 350.6 390.2 441.0 474.6 524.3 589.9 685.3 760.7 874.8
Wuel, Light and Water 155.0 287.8 319.6 378.9 417.3 486.4 527.8 546.0 597.2 722.4 835.9 945.4 1104.2
Pransport a Comunicatics 155.7 227.3 234.1 249.0 261.6 284.6 311.7 349.9 390.3 394.0 475.3 479.6 553.4
Medical and Personal Care 135.9 175.7 192.0 205.6 219.7 240.4 274.9 308.1 339.5 331.8 362.8 383.4 435.0
Zducation, Reading Materials
and Recreation 135.2 212.2 225.2 245.0 259.9 273.1 301.3 343.6 368.5 394.9 444.1 492.5 553.6
Cigarettes 144.7 173.6 185.4 204.4 210.7 227.8 251.8 279.5 298.4 283.9 336.1 374.9 448.9
All Iteza 137.0 201.4 222.4 254.0 269.8 280.9 325.5 368.7 409.3 435.2 485.4 533.0 644.9
Percentage Change -0.7 13.4 10.4 14.2 6.2 4.1 15.9 13.3 11.0 6.3 11.5 9.8 21.0
source: Nepal astra Bank.

- 214 -
Table 9.2MONTHLY WAGES IN MAJOR SECTORS
(Nrs)
1987/88 1988/89 1989/90 1990/91 1991/92 1992/93
Agriculture 1/Katbmandu 1050 1200 1250 1697 1800 2100
Birgunj 600 737 750 875 900 1050
Biratnagar 652 750 838 925 1050 1320
Industry 2/
Skilled
Kathmandu 552 690 690 958 958 1310
Birgunj 552 690 690 958 958 1310
Biratnagar 552 690 690 958 958 1310
Unskilled.
Kathmandu 425 532 532 800 800 1150
Birgunj 425 532 532 800 800 1150
Biratnagar 425 532 532 800 800 1150
Construction 3/
Ski1lled
Katbmandu 2050 2352 2460 2769 4000 4350
Birgunj 1425 1494 1594 1875 1892 2250
Biratnagar 1650 1812 2062 2275 2400 2700
SemiskilledKathmandu 1900 2200 2338 2756 3550 3900
Biratnagar 1500 1662 1912 2125 2250 2400
Laborer
Katbhandu 1050 1125 1201 1606 1800 1800
Biratnagar 652 750 838 1022 1200 1380
1/ Data on agriculture and construction pertain to unorganized
private sectors
2/ Miniimm monthly wage, which excludes allowances.
3/ Carpenters and massons.
Source: Nepal Rastra Bank, Price Division

- 215 -
Table 10.1
NUMBER OF STUDENTS IN PRIMARY,
LOWER SECONDARY & SECONDARY SCHOOLS
(In Thousands)
Year Lower
Septenber) Primary Secondary Secondary Total
1975 459 174 67 700
1976 644 189 74 907
1977 769 227 82 1078
1978 875 277 94 1246
1979 1013 343 106 1462
1980 1068 391 121 1580
1981 1388 170 144 1702
1982 1475 199 170 1844
1983 1626 220 198 2044
1984 1748 239 216 2203
1985 1812 254 242 2308
1986 1858 271 269 2398
1987 1953 290 290 2533
1988 2109 305 307 2721
1989 2526 325 339 3190
1990 a/ 2789 344 365 3498
1991 a/ 2926 381 386 3693
a/ Esti-ates as of May.
Source: Ministry of Education and Culture
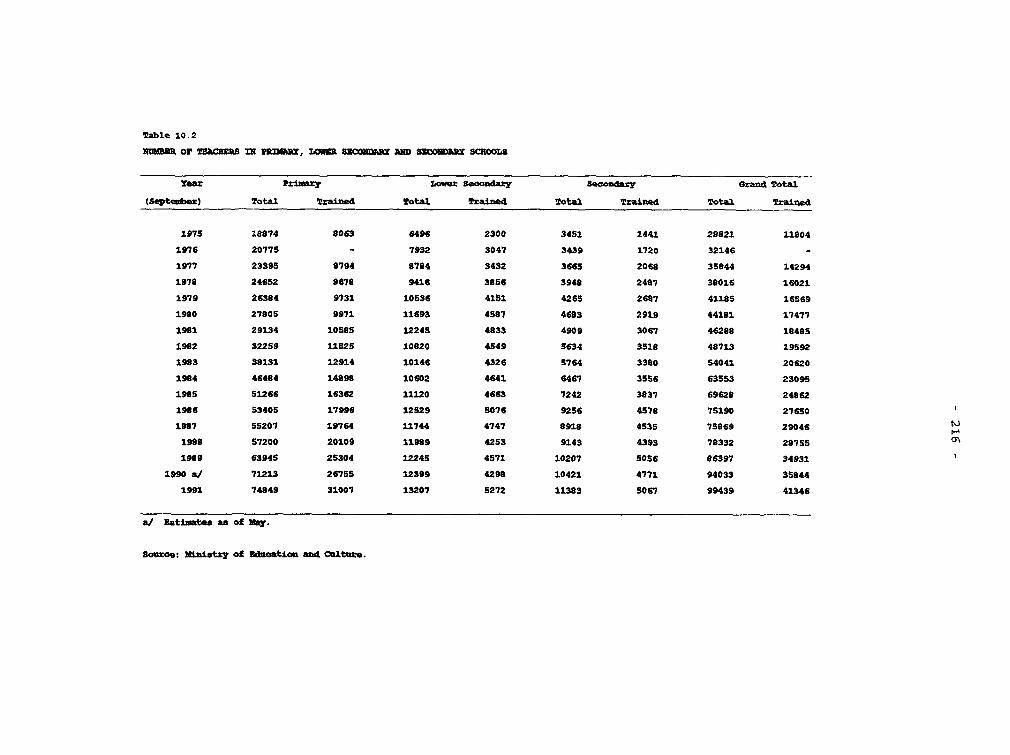
Table 10.2
muwm or OF 7!s nS PDngwx, Lam scmma MD m S S=mn SChOOLS
year Prinrruyo Secondary Seoondaxy Grand Total
(Septrer) Total Trained Total Trained Total Trained Total Trained
197S 18874 8063 6496 2300 3451 1441 29821 11804
1976 20775 - 7932 3047 3439 1720 32146 -
1977 23395 8794 9784 3432 366S 2068 35844 14294
2978 24652 9678 9416 3856 3948 2407 38016 16021
1979 26384 9731 10536 4151 4265 2607 41185 16569
1980 27805 9971 11693 4S87 4683 2919 44181 17477
1981 29134 lOS85 12245 4833 4909 3067 46289 18495
1982 32259 11S25 10820 4549 5634 3518 48713 19592
1983 39131 12914 10146 4326 5764 3380 54041 20620
1984 46484 14898 10602 4641 6467 35S6 63553 23095
1985 51266 16362 11120 4663 7242 3837 69628 24962
1986 53405 17996 12529 5076 9256 4578 75190 27650
1987 55207 19764 11744 4747 8918 4535 75969 29046
1908 57200 20109 11989 4253 9143 4393 78332 2975S
1989 63945 25304 12245 4571 10207 5056 86397 34931
1990 a/ 71213 26755 12399 4290 10421 4771 94033 35844
1991 74849 31007 13207 5272 11383 5067 99439 41346
a/ Ratiites an of May.
Source Minstry of Zduatlo and Culture.
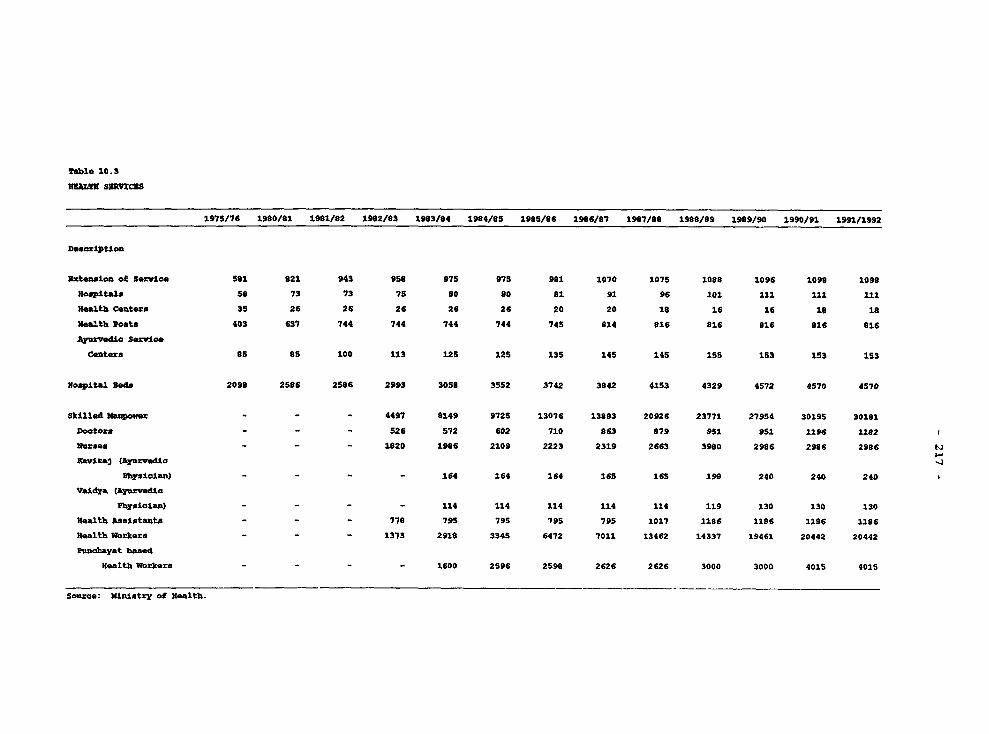
Table 10.3
HUL!M SUVCRSS
1975/76 1980/91 19,1/92 1992/03 1993/04 1984/8S 1985/86 1996/97 19S7/0S 19S8/09 1989/90 1990/91 1991/1992
Desoription
Rxtenslon of Servico S81 921 943 95e 975 975 991 1070 1075 1080 1096 1099 1098
3oapitals 3S 73 73 73 s0 90 e1 91 96 101 111 111 l11
Health Centers 35 26 26 26 26 26 20 20 1S 16 16 1S 1s
Ucalth Posts 403 637 744 744 744 744 745 814 816 016 016 916 916
Ayurv.dio Service
Centers S5 85 100 113 125 125 135 145 145 155 153 153 15S
Hospital Beds 2099 2586 25S6 2993 B05S 3552 3742 3842 4153 4329 4572 4570 4570
Skilled Manpower - - 4497 8149 9725 13076 13893 20926 23771 27954 30195 30181
Dootor - - - 526 572 602 710 063 879 951 951 1196 1182 1
Worsea - - 1- 120 1986 2109 2223 2319 2663 3900 2986 2996 2986 N
Faviraq (Ayurvedio
Physician) - - - - 164 164 164 163 16S 199 240 240 240
vaidya (Arurvedic
Physician) - - - - 114 114 114 114 114 119 130 130 130
Health Asaistants - - - 778 79S 795 79S 795 1017 1186 1186 1106 1186
Health Workers - - - 1373 2918 3345 6472 7011 13462 14337 19461 20442 20442
Punchyat based
Nelth Workers - - - - 1600 2596 2S98 2626 2626 3000 3000 4015 4015
Source: Ministry of Healtb.