nepal fiscal restructuring and public resource...
TRANSCRIPT
Report No. 12281-NEP
NepalFiscal Restructuring and PublicResource Management in the Nir.eties(In Two Volumes)Volume I Executive Summary, and Economic Liberalization and Fiscal Restructuring
March 17, 1994
South Asia Country Department ICountry Operations, Industry and Finance Division
FOR OFFICIAL USE ONLY
H
cpr tUL. .i.:''C i 2::-'1 3c'}RU: EA1- I I
Document of the World Bank
This document has a restricted distribution and may be used by recipientsonly in the performance of their official duties. Its contents may not otherwisebe disclosed without World Bank authorization
Pub
lic D
iscl
osur
e A
utho
rized
Pub
lic D
iscl
osur
e A
utho
rized
Pub
lic D
iscl
osur
e A
utho
rized
Pub
lic D
iscl
osur
e A
utho
rized
Pub
lic D
iscl
osur
e A
utho
rized
Pub
lic D
iscl
osur
e A
utho
rized
Pub
lic D
iscl
osur
e A
utho
rized
Pub
lic D
iscl
osur
e A
utho
rized
CORmICM 3OUXVAL33TS
Starting in November 30, 1985, the Nepali Rupee began floating with respect toa basket of currencies in which the Indian Rupee has high weight. A two-tierexchange rate with partial convertibility was introd,.-ed in early 19592. InFebruary 1993, a unified market determined exchange rate system was adoptedand de facto convertibility of all current account transactions was achievedin July 1993. The exchange rate in February 1994 was:
US$1 = Rs.49.0
FISCAL YE3R (VY)
July 16 - July 15
For example, FY90 covers:July 16, 1989 to July 15, 1990
FOR OFFICIAL USE ONLY
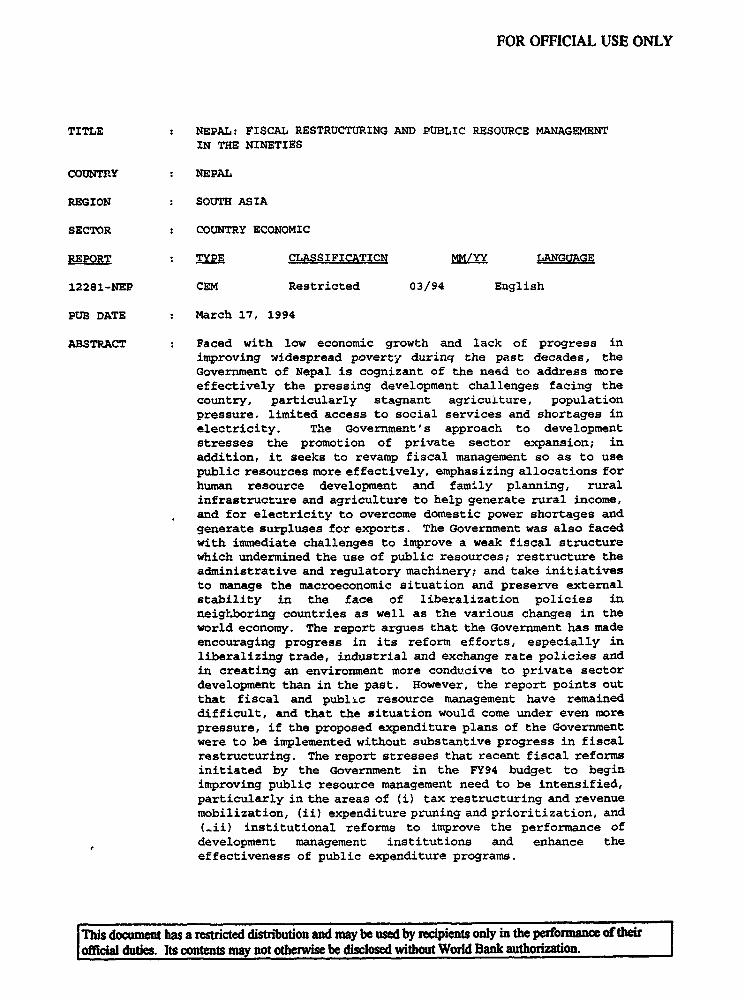
TITLE : NEPAL: FISCAL RESTRUCTURING AND PUBLIC RESOURCE MANAGEMENTIN THE NINETIES
COUNTRlY NEPAL
REGION SOUTH ASIA
SECTOR : COUNTRY ECONOMIC
REPORT : TYPE CLASSIFICATICN MM/YY LANGUAGE
12281-NEP CEM Restricted 03/94 English
PUB DATE : March 17, 1994
ABSTRACT Faced with low economic growth and lack of progress inimproving widespread poverty durinq the past decades, the
Government of Nepal is cognizant of the need to address more
effectively the pressing development challenges facing the
country, particularly stagnant agriculture, population
pressure. limited access to social services and shortages in
electricity. The Government's approach to development
stresses the promotion of private sector expansion; in
addition, it seeks to revamp fiscal management so as to use
public resources more effectively, emphasizing allocations for
human resource development and family planning, rural
infrastructure and agriculture to help generate rural income,
and for electricity to overcome domestic power shortages and
generate surpluses for exports. The Government was also faced
with immediate challenges to improve a weak fiscal structure
which undermined the use of public resources; restructure the
administrative and regulatory machinery; and take initiatives
to manage the macroeconomic situation and preserve external
stability in the face of liberalization policies in
neighboring countries as well as the various changes in the
world economy. The report argues that the Government has made
encouraging progress in its reform efforts, especially in
liberalizing trade, industrial and exchange rate policies and
in creating an environment more conducive to private sector
development than in the past. However, the report points out
that fiscal and public resource management have remained
difficult, and that the situation would come under even more
pressure, if the proposed expenditure plans of the Government
were to be implemented without substantive progress in fiscal
restructuring. The report stresses that recent fiscal reforms
initiated by the Government in the FY94 budget to begin
improving public resource management need to be intensified,
particularly in the areas of (i) tax restructuring and revenue
mobilization, (ii) expenditure pruning and prioritization, and
(-ii) institutional reforms to improve the performance of
development management institutions and enhance the
effectiveness of public expenditure programs.
This docment has a resticted distnbWon and may be used by recipients only in the perfomance of theirIoficial duties. Its contents may not othewise be disclosed without World Bank authonzation.
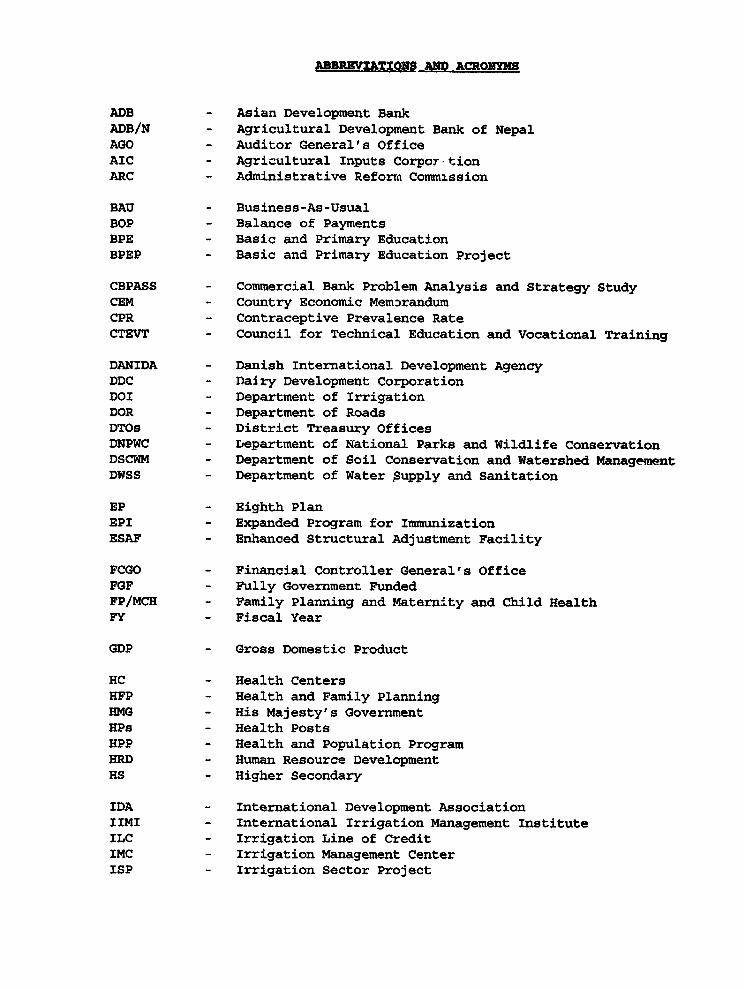
ABBRNVZATIONS _AD ACRONYMS
ADB - Asian Development BankADB/N - Agricultural Development Bank of NepalAGO - Auditor General's OfficeAIC - Agricultural Inputs Corpor-tionARC - Administrative Reforra Comnission
BAU - Business-As-UsualBOP - Balance of PaymentsBPE - Basic and Primary EducationBPEP - Basic and Primary Education Project
CBPASS - Commercial Bank Problem Analysis and Strategy StudyCEM - Country Economic MemarandumCPR - Contraceptive Prevalence Rate
CTEVT - Council for Technical Education and Vocational Training
DANIDA - Danish International Development AgencyDDC - Dairy Development CorporationDOI - Department of IrrigationDOR - Department of RoadsDTOs - District Treasury OfficesDNPWC - Department of National Parks and Wildlife ConservationDSCWM - Department of Soil Conservation and Watershed ManagementDWSS - Department of Water ,Supply and Sanitation
EP - Eighth PlanBPI - Expanded Program for ImmunizationESAF - Enhanced Structural Adjustment Facility
FCGO - Financial Controller General's OfficeFGF - Fully Government FundedFP/MCH - Family Planning and Maternity and Child HealthFY - Fiscal Year
GDP - Gross Domestic Product
HC - Health CentersHFP - Health and Family PlanningHMG - His Majesty's GovernmentHPs - Health PostsHPP - Health and Population ProgramHRD - Human Resource DevelopmentHS - Higher Secondary
IDA - International Development AssociationIIMI - International Irrigation Management InstituteILC - Irrigation Line of CreditIMC - Irrigation Management CenterISP - Irrigation Sector Project
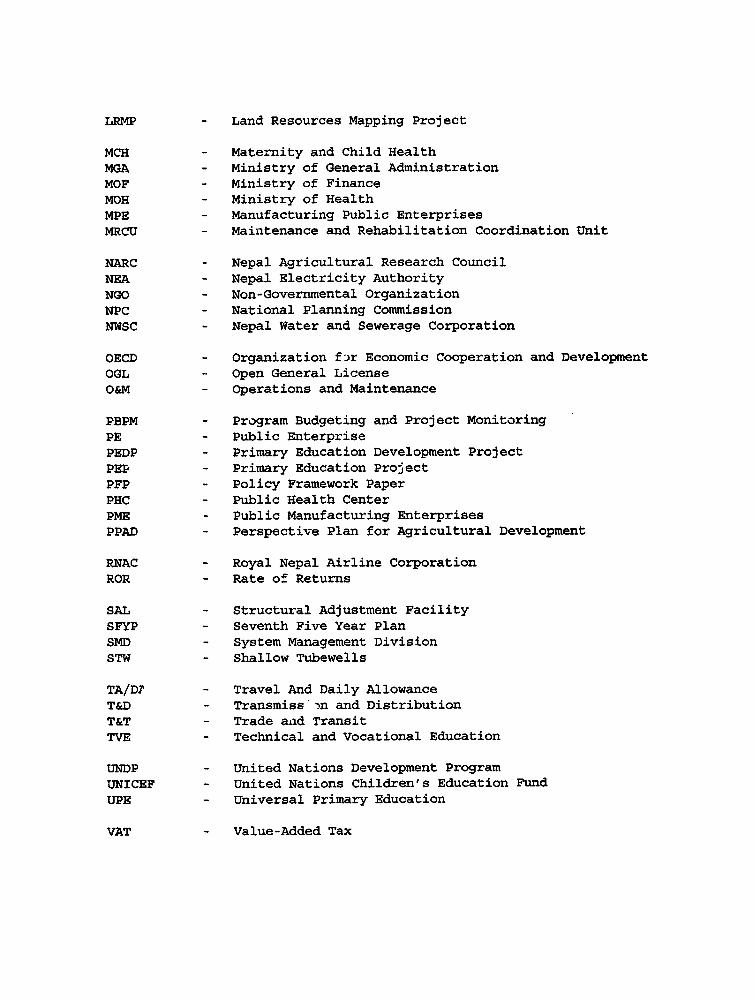
LRMP - Land Resources Mapping Project
MCH - Maternity and Child Health
MGA - Ministry of General Administration
MOF - Ministry of Finance
MOH - Ministry of Health
MPE - Manufacturing Public Enterprises
MRCU - Maintenance and Rehabilitation Coordination Unit
NARC - Nepal Agricultural Research Council
NEA - Nepal Electricity Authority
NGO - Non-Governmental Organization
NPC - National Planning Commission
NWSC - Nepal Water and Sewerage Corporation
OECD - Organization f-ur Economic Cooperation and Development
OGL - Open General License
O&M - Operations and Maintenance
PBPM - Program Budgeting and Project Monitoring
pH - Public Enterprise
PEDP - Primary Education Development Project
PEE - Primary Education Project
PFP - Policy Framework Paper
PHC - Public Health Center
PME - Public Manufacturing Enterprises
PPAD - Perspective Plan for Agricultural Development
RNAC - Royal Nepal Airline Corporation
ROR - Rate of Returns
SAL - Structural Adjustment Facility
SFYP - Seventh Five Year Plan
SMD - System Management Division
STW - Shallow Tubewells
TA/D2 - Travel And Daily Allowance
T&D - Transmiss 'n and DistributionT&T - Trade and Transit
TVE - Technical and Vocational Education
UNDP - United Nations Development Program
UNICEF - United Nations Children's Education Fund
UPE - Universal Primary Education
VAT - Value-Added Tax
NXP-AL
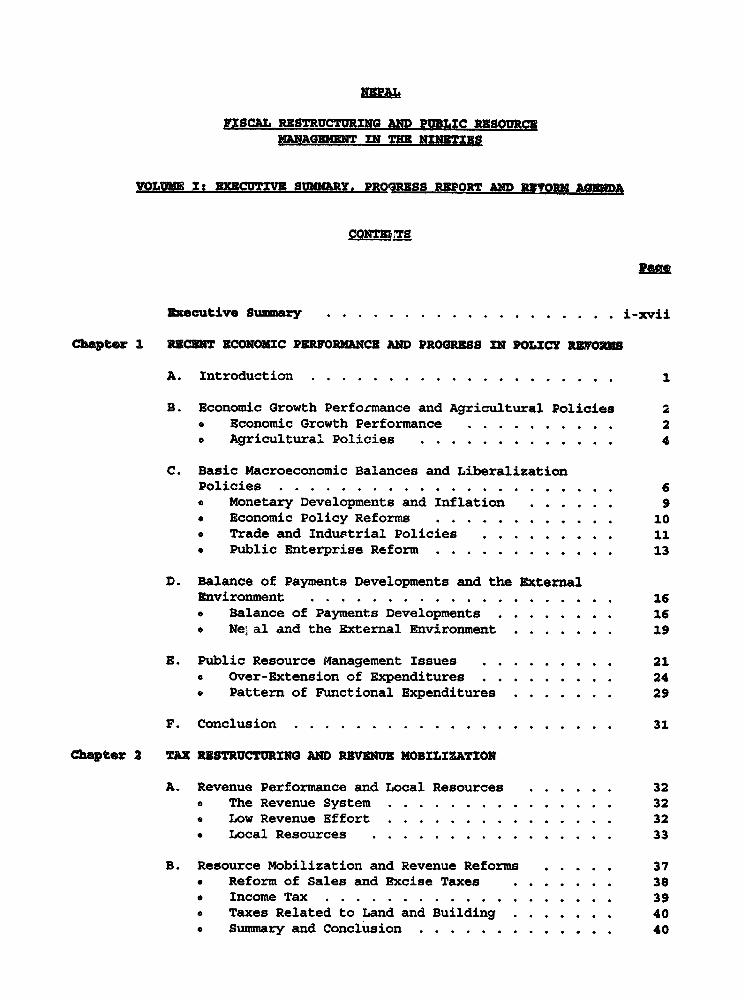
FISCAL RBSTRUCTURING AND PUBLIC RESOURCEMANAGEMENT IN TEE NINBTIBS
VOL= U: EXECUTIVE SWMOARY, PROqSRhS REPORT AND RIVOI AGENDA
CONTHEITS
Rum
Executive Summary . . . . . . . . . . . . . . . . . . . i-xvii
Chapter 1 RECENT ECONOMIC PERFORMANCE AND PROGRESS IN POLICY REWORKS
A. Introduction . . . . . . . . . . . . . . . . . . . . 1
B. Economic Growth Performance and Agricultural Policies 2e Economic Growth Performance . . . . . . . . . . 2• Agricultural Policies . . . . . . . . . . . . . 4
C. Basic Macroeconomic Balances and LiberalizationPolicies ......... ... . . . .. . 6* Monetary Developments and Inflation . . . . . . 9* Economic Policy Reforms . . . . . . . . . . . . 10* Trade and Industrial Policies . . . . . . . . . 11e Public Enterprise Reform . . . . . . . . . . . . 13
D. Balance of Payments Developments and the ExternalEnvironment ....... . . ..... . ..... 16• Balance of Payments Developments ... . . . . . 16o Nelal and the External Environment . . . . . . . 19
S. Public Resource Management Issues . . . . . . . . . 21* Over-Extension of Expenditures . . . . . . . . . 24* Pattern of Functional Expenditures . . . . . . . 29
F. Conclusion .... . . . . . . . . . . . . . . . . . 31
Chapter 2 TAX RESTRUCTURING AND REVENUE MOBILIZATION
A. Revenue Performance and Local Resources . . . . . . 32* The Revenue System . . . . . . . . . . . . . . . 32* Low Revenue Effort . . . . . . . . . . . . . . . 32* Local Resources . . . . . . . . . . . . . . . . 33
B. Resource Mobilization and Revenue Reforms . . . . . 37* Reform of Sales and Excise Taxes . . . . . . . 36* Income Tax .... . . . . . . . . . . . . . . . 39o Taxes Related to Land and Building . . . . . . . 40e Summary and Conclusion . . . . . . . . . . . . . 40
Pave
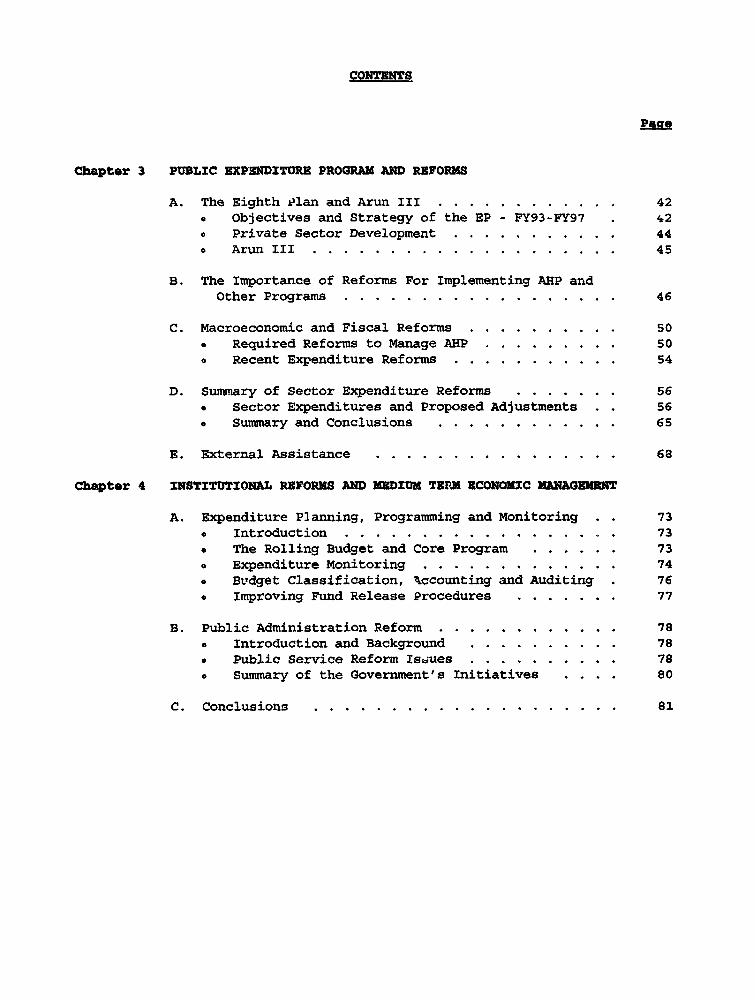
Chapter 3 PUBLIC EXPENDITURE PROGRAM AND REFORMS
A. The Eighth elan and Arun III . . . . . . . . . . . . 42* Objectives and Strategy of the EP - FY93-FY97 42• Private Sector Development . . . . . . . . . . . 44
e Arun III ... . . . . . . ... . . . . . . . . 45
B. The Importance of Reforms For Implementing AHP andOther Programs ... . . . . . . . . . . . . . . . 46
C. Macroeconomic and Fiscal Reforms . . . . . . . . . . 50* Required Reforms to Manage AHP . . . . . . . . . 50* Recent Expenditure Reforms ... . . . . . . . . 54
D. Summary of Sector Expenditure Reforms . . . . . . . 56* Sector Expenditures and Proposed Adjustments . . 56e Summary and Conclusions . . . . . . . . . . . . 65
E. External Assistance ... . . . . . . . . . . . . . 68
Chapter 4 INSTITUTIONAL REFORMS AND MEDIUM TERM ECONOMIC MANAGEMENT
A. Expenditure Planning, Programming and Monitoring . . 73
- Introduction .733 The Rolling Budget and Core Program .733 Expenditure Monitoring . . . . . . . . . . . . . 74
9 Budget Classification, bccounting and Auditing . 76
3 Improving Fund Release Procedures . . . . . . . 77
B. Public Administration Reform . . . . . . . . . . . . 78
* Introduction and Background . . . . . . . . . . 78• Public Service Reform Ist;ues ... . . . . . . . 78
o Summary of the Government's Initiatives . . . 80
C. Conclusions .................. .. . 81
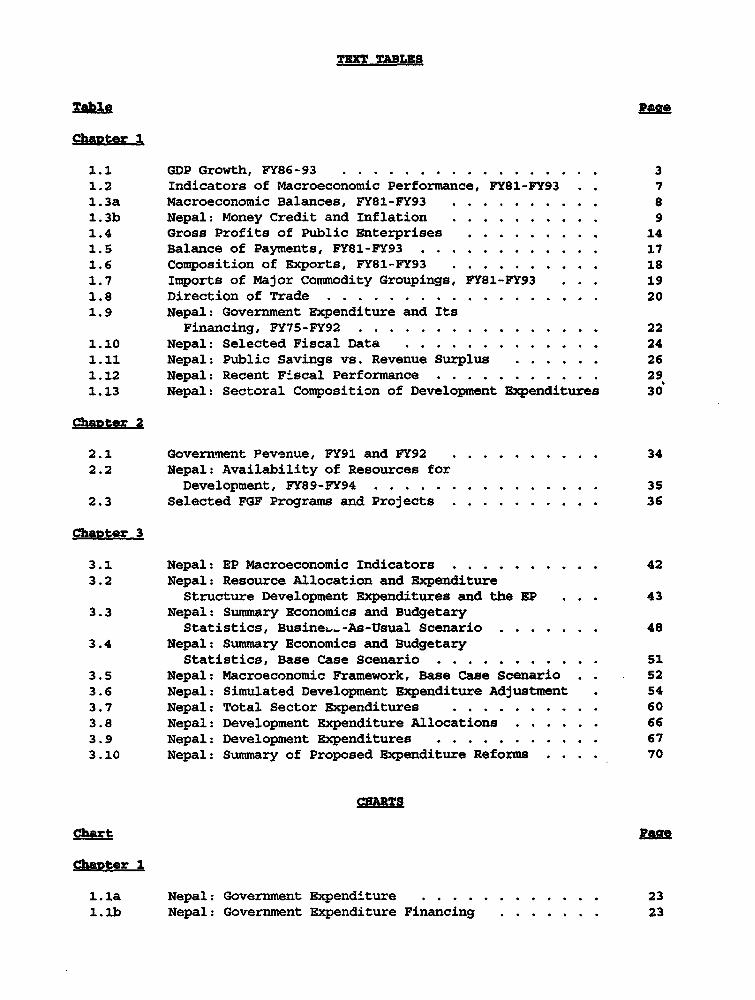
TEXT TABLES
Tablo I
Chapter 1
1.1 GDP Growth, FY86-93 . . . . . . . . . . . . . . . . . 31.2 Indicators of Macroeconomic Performance, FY81-FY93 . . 71.3a Macroeconomic Balances, FY81-FY93 . . . . . . . . . . 8
1.3b Nepal: Money Credit and Inflation . . . . . . . . . . 91.4 Gross Profits of Public Enterprises . . . . . . . . . 141.5 Balance of Payments, FY81-FY93 . . . . . . . . . . . . 17
1.6 Composition of Exports, FY81-FY93 . . . . . . . . . . 18
1.7 Imports of Major Commodity Groupings, FY81-FY93 . . . 19
1.8 Direction of Trade . . . . . . . . . . . . . . . . . . 201.9 Nepal: Government Expenditure and Its
Financing, FY75-FY92 .22
1.10 Nepal: Selected Fiscal Data . . . . . . . . . . . . . 24
1.11 Nepal: Public Savings vs. Revenue Surplus . . . . . . 26
1.12 Nepal: Recent Fiscal Performance . . . . . . . . . . . 291.13 Nepal: Sectoral Composition of Development Expenditures 30
g_a62t*r 2
2.1 Government Pevenue, FY91 and FY92 . . . . . . . . . . 342.2 Nepal: Availability of Resources for
Development, FY89-FY94 . . . . . . . . . . . . . . . 352.3 Selected FGF Programs and Projects . . . . . . . . . . 36
Chapter 3
3.1 Nepal: EP Macroeconomic Indicators . . . . . . . . . . 42
3.2 Nepal: Resource Allocation and ExpenditureStructure Development Expenditures and the EP . . . 43
3.3 Nepal: Summary Economics and BudgetaryStatistics, Busine&._-As-Usual Scenario . . . . . . . 48
3.4 Nepal: Summary Economics and Budgetary
Statistics, Base Case Scenario . . . . . . . . . . . 513.5 Nepal: Macroeconomic Framework, Base Case Scenario . 523.6 Nepal: Simulated Development Expenditure Adjustment 543.7 Nepal: Total Sector Expenditures . . . . . . . . . . 60
3.8 Nepal: Development Expenditure Allocations . . . . . . 663.9 Nepal: Development Expenditures . . . . . . . . . . . 67
3.10 Nepal: Summary of Proposed Expenditure Reforms . . 70
Chart Pae
Chauter 1
1.la Nepal: Government Expenditure . . . . . . . . . . . . 23
l.lb Nepal: Government Expenditure Financing . . . . . . . 23
Chart Paao
1.2a Nepal: Regular Expenditures vs. Revenues . . . . . . . 271.2b Nepal: Recurrent Expenditures vs. Revenues . . . . . . 27
ChaDter 3
3.1 Nepal: Arun III Projected Expenditure Ratios (FY94-PY0O) 473.2 Nepal: Power Projected Expenditure Ratios (PY94-FYOO) 47
Chanter 4
4.1 Civil Service Growth. . . . . . . . . . . . . . . . 79
Page
ChFater 3
A Sectoral Expenditure Allocation and Economic Growth . 58
The report is based on the results of economic and public expenditurereview missions, consisting of Albert Agbonyitor (Task Manager), ParaSuriyaarachchi and Vidya Shetty, which visited Nepal in February and June1993, and on the work of various missions of che sector divisions. Backgroundpapers and written contributions were provided by: ack Duloy, Consultant,(Agriculture); Badrud Duza, Maria MacDonald and Warren Robinson, Consultant,(Health and Family Planning); Juan Gaviria (Transport); Ana Maria Jeria andThomas Schmidt (Education); Xavier Legrain (Water Supply and Sanitation);Donal O'Leary and Fomin Mukherji (Power); Vidya Shetty (Statistical Appendix);Para Suriyaarachchi and Vidya Shetty (Recent Economic Performance and Progressin Liberalization Reforms); Para Suriyaarachchi and Tom Tsui (InstitutionalReforms); Ai-Chin Wee and Orhan Baykal (Forestry); Fund Staff and AmareshBagchi, Consultant, (Tax Reform). Hera Sutrisna provided administrative aswell as secretarial and statistical support for the production of the report.Jennifer Feliciano and Anthony Stanley also assisted with secretarial andstatistical work. The mission appreciates the assistance provided by thestaff of the Resident Mission. A draft of the report was discussed with theGovernment of Nepal in February 1994. The mission appreciates the cooperationreceived from the Nepalese authorities and from the team of local consultants.
Per I of 2
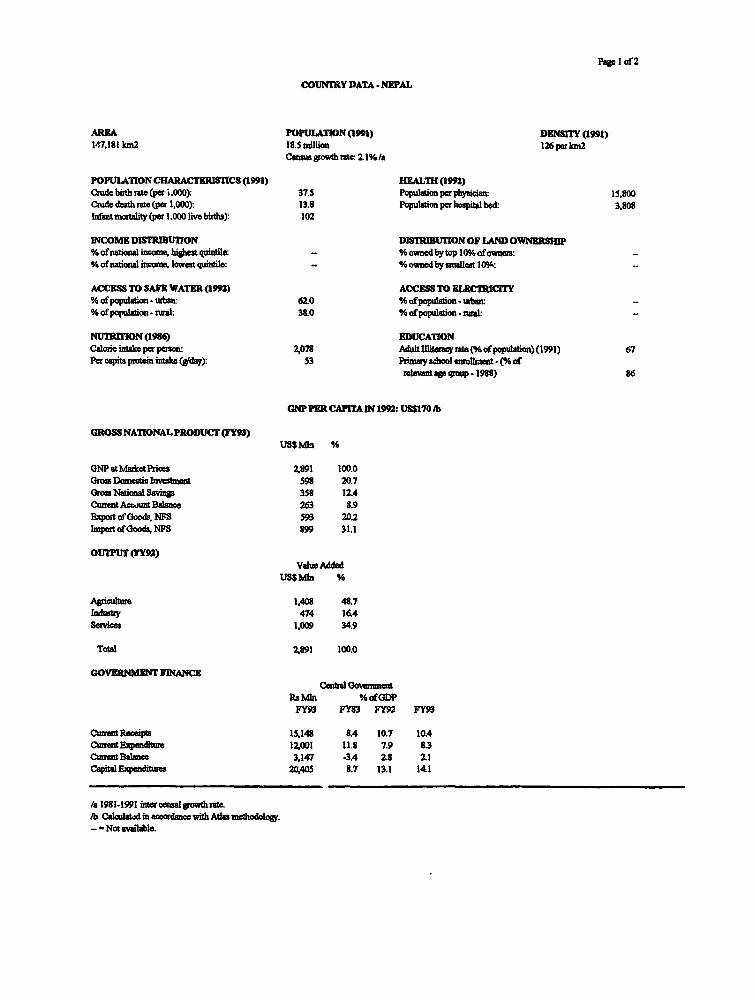
COUNTRY DATA -NPAL
ARIA POPULATION (1991) DENSITY (1991)147,181 km2 18.Snillion 126 perkmn2
Consagrowthatc: 2.1%/a
POPULATION CHARACTRISTICS (1991) HEALTH (1992)Cmebibathmte(per i.000): 37.5 PopulMgnperphysician: 15,800Cond* death ate (per 1,000): 13.8 population per hospit bed: 3,808InfAnt mortality (per 1.000 Iwe births): 102
INCOME DISTRIDUTION OF LAND OWNERSHIP% of national income, highae qUinti1e: - % ownedby top 10% of owmers: -% of national income, lowes qitirle;: - % owned by smallest 10%: -
ACCESS TO SAFE WATER (1992) ACCESS TO ELECTRIClTY% of populaton. uearn 62.0 % of popation -uba n%cfpopuation-rural: 38.0 %ofpopul -ion uraw: _
NUlWTION (1986) EDUCATIONCalone inta per peso 2,078 Auhllteracyate(%of po ation)(1991) 67Per apitapoten intke (gfday): 53 Prmy school enoll(ent %cof
relavatqs e oup. 1988) 86
GNP PER CAPITA IN 1992: USS170 lb
GROSS NATIONALPRODUCT (FY)USSMIn %
GNPatMaxketPrices 2,891 100.0Grss Domestic nastment 598 20.7Gs Naonal Si 358 12.4Cuet Accurl Balace 263 8.9Teport of Goods. NPS 593 20.2IVortofGoods,NFS 899 31.1
OUTPUT (FY92)Va luAdded
US$MIl %
Agicture 1,408 48.7bdby 474 16.4Sevices 1,009 34.9
Tota 2,891 100.0
GOVERNMENT FIMANCECental Govermt
RaMIn %ofDnPFY93 FY83 FY92 FY93
CurventReceipta 15.148 SA 10.7 10ACmrentresn 12,001 11.8 7.9 8.3CurrentBalance 3,147 -3A 2.8 2.1Capital Epndire 20,405 8.7 13.1 14.1
/a 1981-1991 intrcealgrwthrt.fh Cacula in acordce with Ago mebodolqo.- =Not available.
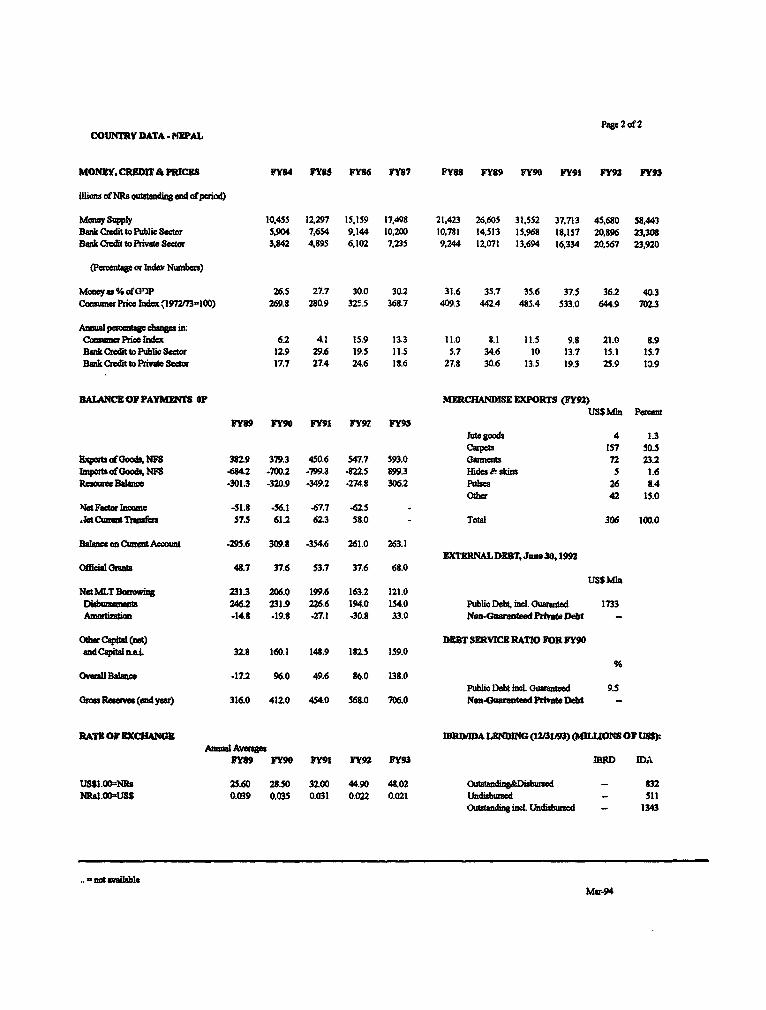
Pag 2 of2COUNTRY DATA - NPAL
MONRY, CREDIT PRICES FY84 FYS5 FY86 FY87 FY88 FY89 FY90 FY91 FY92 FY90
illioth oflNRs tnnendaofpanod)
Mone Supply 10,455 12,297 IS.159 17,498 21,423 26,605 31,S52 37,713 45,680 58,443BankCredittoPbl ic Saor 5,904 7,654 9,144 10,200 10.781 14.513 15,968 18,157 20,896 23,308Bak Ciedit to PrioSector 3,842 4.895 6,102 7,235 9,244 12,07: 13,694 16,334 20,567 23,920
(Parcentae or Inder Numbau)
Moey as % ofG')P 26.5 27.7 30.0 30.2 31.6 35.7 35.6 37.5 36.2 40.3catmri er Prite Indcx1i9n72/73=100) 269.8 280.9 32'.5 368.7 409.3 442.4 485.4 533.0 644.9 702.3
Aruaral paecnte chanes in:Couma PriceIndex 6.2 4.1 15.9 13.3 11.0 8.1 11.5 9.8 21.0 8.9BonkCredittoPulic Sector 12.9 29.6 19.5 11.5 5.7 34.6 10 13.7 15.1 15.7Bank C'dttoPAvteSect 17.7 27.4 24.6 18.6 27.8 30.6 13.5 19.3 25.9 13.9
BALANCE OF PAYMENTS OP ERCHANDISE EXPORTS (FY92)USSMIn Pecn
FY89 FY90 FY91 FY92 FY93Jute goods 4 1.3Cape" 157 50.5
Erwa ofGoods. NFS 382.9 379.3 450.6 547.7 593.0 amens 72 23.2eotm ofGoods. NFS 484.2 -700.2 -799.8 4225 899.3 Hides b skins 5 1.6ResourceBalance -301.3 -3209 -349.2 -274.8 306.2 Pulses 26 8.4
Other 42 15.0N;etFactrlioonc -51.8 -56.1 -67.7 2.5 -
-let Cirui TTUs 57.5 61.2 62.3 58.0 - ToWal 306 100.0
Batlnco CwxfentAecn .295.6 309.8 -354.6 261.0 263.1EXTERNAL DEBT, Jue 30,1992
Om" GaInts 48.7 37.6 53.7 37.6 68.0USSMln
SctMLTBowing 231.3 206.0 199.6 163.2 121.0Diobursamnuts 246.2 231.9 226.6 194.0 154.0 Pub Debt, incl. Guataned 1733Am. tzatin -14.8 -19.8 -27.1 -30.8 33.0 Nms.uarnmteedPdaut Deht -
Olbr Cat (net) DEBT SERVICE RATIO FOR FY90andCapitlln.e&. 32.8 160.1 148.9 182.5 159.0
Oveal Balare -17.2 96.0 49.6 860 138.0Public Debt ijoL Guarnteed 9.5
Grs Resae (dnd yea) 316.0 412.0 454.0 568.0 706.0 Non-GuamneedPrivateDe -
RATEI OF EXCHANGE IBRDIIDA LENING (12/3193) IUON8 OF US*Annur Av _ags
FY89 FY90 FY91 FY92 FY93 IBRD DA
USS1.00-NRs 25.60 28.50 3200 44.90 48.02 - 832NRsI.O04USS 0.039 0.035 0.031 0.022 0.021 Undisbursed - 511
Ousding l. Undisbursed - 1343
Mar-94
A Guide to the Report
This report is presented in two volumes. Volume I consists of the ExecutiveSummary and Chapters 1 to 4. Chapter 1 discusses progress made so far inmacroeconomic liberalization and in fiscal management and argues that whileencouraging actions have been taken to liberalize trade, industrial andexchange rate policies and to create an environment more conducive to privatesector developmei.t than in the past, fiscal and public resource managemu-it hasremained difficult. Consequently, the Government intensified its effortsduring the FY94 budget period to begin to improve the public resourcemanagement situation. The preliminary results of the mid-FY94 budget reviewindicate initial progress in revenue mobilization; however, more substantiveactions are required to begin to turn around the situation. The chapterstresses the need for reforms to address major public resource managementdifficulties, including (i) low revenue effort and severe constraints on localfunds; (ii) an over-extended expenditure program with too many projects andunder-funding of recurrent costs; and (iii) weak institutional performance inmanaging development programs. Chapter 2 articulates measures to restructurethe tax system and enhance revenue mobilization. Chapter 3 discussesexpenditure plans for the nineties, including the Arun III hydropower projectand argues that even with enhanced revenue performance, a strong expenditureprioritization effort would be needed to obtain significant improvements infiscal management. It summarizes the main options to reforr.. the expenditureprogram, focus resources on a tight set of priority activities and phase outthe low rate of return projects and programs. Chapter 4 stressesinstitutional restructuring and strengthening to improve fiscal management aswell as raise the performance of expenditure programs. Volume II of thereport includes Chapter 5 and Statistical Appendices. Chapter 5 presentsdetailed sector by Sector reviews of expenditure objectives, strategy andperformance, including proposals for reform. It concludes with a discussionof the consistency of expenditure reforms relative to environmental policy.
EXECUTIVE SUMARY
OVERVIEW OF DEVELOPMENT POLICY AND OBJECTIVS
1. Faced with a low economic growth, averaging about 3.5 percent inthe long tern and with lack of progress in improving widespread poverty duringthe past dcoades, the Government of Nepal is cognizant of the need to addressmore effectively pressing development challenges, particularly stagnantagriculture, population pressure, low levels of social indicators and limitedaccess to social services, and shortages in electricity. The Government'sobjectives recognize the need for actions which stress (i) broadbasedagricultural expansion with emphasis on cereals and supported by irrigation,and diversification towards selected cash crops and livestock, (ii) buildingon the existing fast export growth for carpets and ready-made-garments todevelop more export niches, including tourism, (iii) improving the skills andhealth status of the population and (iv) relaxing the persistent power supplyshortages. Under the Eighth Plan FY93-FY97 (EP), which enunciates theGovernment's development objectives and policies, accelerated and broadbasedeconomic growth is critical for improving widespread low income levels. Theexpected growth rate is 5.1 percent, based on a growth rate of 3.7 percent foragriculture and 6.1 percent for non-agriculture, mainly tourism and industry.The Government's goals also involve measures to redress poverty directlythrough small farmer development programs, community forestry, labor intensiveconstruction works and improved access to health services and education,especially for women and girls. The Government expects to reduce thepercentage of the population living in poverty by about 7 percentage points toapproximately 40 percent in the later part of the nineties.
2. The Government's approach to development stresses the promotion ofprivate sector expansion. In addition, it aims at revamping fiscal managementto use public resources more effectively, while restructuring sectoralexpenditure allocations to emphasize human resource development and familyplanning and to curb population growth; invest more in rural infrastructure tohelp generate rural income; and expand expenditures on power both to overcomedomestic power shortages hamnpering industrial growth as well as to develophydropower resource endowments for exports. The Government is, however, facedwith immediate challenges to improve a weak fiscal structure with less thaneffective public resource utilization; restructure the inadequateadministrative and regulatory machinery; and manage the changing externaleconomic situation resulting from trade and industrial liberalization inneighboring countries.
3. Progress in managing these policy changes so far has been mixed.Advances have been made in the effort to adopt liberal policies, promoteprivate sector development and to cut back on the involvement of the state invarious sectors. For example, with changes in the external environmenttowards liberalization, the Government took the initiative to adopt strongproactive measures to adjust its foreign exchange, trade and industrialpolicies. A unified exchange rate was instituted in 1993 with fullconvertibility on the current account to encourage exports; restrictions onimports were removed to provide easiar access to intermediate and capitalgoods, and tariff rates were lowered and simplified. Export performance hasimproved significantly, and the balan^e of payments was strengthened with
- ii -
reserves rising to about 9 months of imports (6 months in FY90), whileinflation declined. Industrial and public enterprise policies have beenreviewed; for example, private investment licensing requirements have beenrelaxed substantially, and progress is being made in implementingprivatization program for the public enterprises. State monopoly control hasbeen relaxed to foster private role in various areas, such as aviation, powerand import of fertilizers. Price adjustments were implemented for chemicalfertilizers and "sensitive" utilities, including water supply, electricity andpetroleum products to reduce subsidies, strengthen the financial base of therespective corporations and foster a greater private sector role. TheGovernment is aware of the need for more actions to support private sectordevelopment; thus, for example, a stock market was established in FY93;commercial banking was deregulated and official controls on interest ratesremoved. This encouraged the growth of joint venture and private banks. Fivejoint venture banks are already in operation; three private banks opened inFY93, and three other licensing requests are being processed. The Governmentalso recognized the need to turn around the performance of the two state-ownedbanks, which account for over 70 percent of domestic credit. These banksreceived capital infusion recently at the cost of over Rs.3.72 billion, andthey are taking steps to recover unpaid loans and reduce over-staffing;however, only one has shown some improvement. Continued poor performance ofthe state-owned banks will undermine lending to the private sector andeventually result in tax increases to cover the portfolio write-offs. Thus,options for enhancing their efficiency need to be assessed. The Government isnow planning to intensify efforts to raise loan recovery, conduct thoroughaudits and improve lending practices, and subsequently a process to privatizethe banks will be initiated during the second half of the nineties.
4. Overall, the Government has made encouraging progress in creatingan environment more conducive to private sector development since the lastEconomic Report was written in March 1992. However, the difficulties offiscal and public resource management have persisted, undermining the scope tofinance p-iblic expenditures ne.cessary to complement private investments. TheGovernment is cognizant of the fiscal difficulties, and it has recentlyintensified its efforts to address them starting with the FY94 budget period.The rest of this summary, reflecting the thrust of this report, will focus onthe fiscal and public resource management issues and reforms.
THB FISCAL AND PUBLXC RESOURCE MACAGMEN CHALLENGe
5. The enormity of the fiscal challenge facing the Government is bestappreciated by highlighting the three main features of public resourcemanagement in Nepal. First, the revenue effort of 10.4 percent of GDP in FY93is low, compared to the LDC average of 17-22 percent of GDP. During theeighties (FY81-FY90), expenditures rose by an average of 0.73 percent of GDP ayear, compared to 0.14 percent for revenues. More recently, revenues rose bya total of 0.1 percent of GDP during FY91-FY93, while regular expendituresalone rose by 1.0 percent of GDP, eroding surpluses to finance development.
6. Second, expenditures are overextended. Regular expenditures,reflecting mainly (i) increased debt service; and (ii) employee compensation,
- iii -
have expanded rapidly. While external debt service is manageable ii relation. ^Vc,rt performance, total debt servicing is now 38.3 percent of regularspending compared to 17.5 percent in the early eighties, due to risingdomestic debt and the effects of devaluation on the local currency cost ofexternal debt servicing. Debt servicing is claiming an increasing share ofrevenues, for example, rising from 17 pe.cent in FY85 to 29.4 percent in FY93.Employee compensation accounts for about 40 percent of regular expenditures.Recurrent expenditures, once properly accounted for, have exceeded revenuessince the early eighties by roughly an average 3 percent of GDP, making itdifficult to finance O&M and sustain the operation and productivity ofcompleted projects. Third, the institutional capacity to screen projects,program expenditures appropriately relative to financing, and implement andmonitor them effectively is weak.
7. An important implication of the low tax effort and rising regularexpenditures is that local resource generation for development financing hasbeen inadequate. Most sectors, especially health and population, watersupply, transport and irrigation are starved of funds for important O&Mactivities required to generate output from investments. The allocation ofthe bulk, about 80 percent, of local funds to fully Government funded programsin the eighties compotnded the local resource problem, limiting domesticresource support for aided projects. This is a major contributing factor tothe unusual delays in completing projects in Nepal. In turn, delayedimplementation has affected aid utilization, which has fallen from 8.2 percentin FY86-FY90 to 7.7 percent of GDP during FY91-FY93.
8. It is against this fiscal background that the developmentobjectives of the Government and the expenditure agenda for the nineties tpara2] must be viewed. In particular, Nepal is on the verge of making its largestever power sector investment, the Arun III hydropower project (AHP), which hastremendous strategic importance. The 402 MW Arun III hydropower project,which is a first step towards developing Nepal's hydropower resources toovercome persistent domestic power shortages and to generate surpluses forexports from other potential power projects in the Arun Valley, is the largestpublic investment presently under consideration in the country. Givenwidespread low income levels noted earlier, accelerated and broadbased growthis considered important for improving living conditions. While agriculturalexpansion is important in that regard, its scope is limited by variousfactors, including farm sizes and population pressure. Thus, AHP is part ofthe strategy for accelerating the growth process. Such accelerated economicgrowth requires a sustained high rate of industrial expansion, which would bedifficult in the face of persistent shortages in electricity. Industry hasbeen a leading source of growth -- about 6-7 percert -- in recent years. Inaddition, expansion of tourism, which is a major potential source of growth,requires reliable and increased supply of power to deliver urban services.Power shorta5es and periodic load shedding stand to impede the desired effectsof liberalization policies on private investments. Also, if AHP is managedsuccessfully, the increased supply of power, coupled with life line tariffrates for low income groups, would relieve pressure on fuelwood and on forestresources, for the benefit of other activities, especially cropping andlivestock. The total estimated cost of AHP, which is divided into two phases
- iv -
of 201 MW each, is $1466 million, with the first phase costing $760 million;and its financing and expenditure claims will dominate the public investmentprogram in the nineties. The power sector as a whole is expected to absorb 15percent of local resources and 40 percent of foreign resources, and AHP alonewill absorb close to 20 percent of total development resources during the peakimplementation phase in FY97-FY99.
9. Currently, substantive reforms are needed to improve fiscal andpublic resource management to (i) finance and manage development expenditureswhile preserving an overall stable fiscal situation and (ii) ensure adequateresources to finance critical recurrent costs and important investments. Theconclusion of the report is that the principal expenditure programs of che EPinvolving AHP, together with required investments in nigh priority activitiesin the social sectors, agriculture and rural infrastructure are feasible,provided the Government takes strong actions to (i) change the existing lowand stagnant revenue effort to enhance domestic resource mobilization;(ii) improve the quality of expenditure programs by adopting a priority publicinvestment portfolio and pruning low rate of return activities; and(iii) strengthen the capacity to monitor and implement programs effectively,focussing especially on the Ministry of Finance and the National nlanningCommission. In addition, (iv) for the power sector, NEA's performance has tobe improved significantly so that it can generate internal funds to supplementbudgetary allocations and also enable the country to earn the full benefits ofthe project. These reforms are warranted by the current weak fiscal structurenoted earlier, and the power sector program adds urgency to the need foraction. As highlighted below, Nepal has achieved modest progress in theseareas, and a difficult policy reform agenda lies ahead.
THE REFORM AGENDA
10. The weaknesses of the fiscal system noted earlier define themeasures in the areas of tax reform, expenditure rationalization andinstitutional strengthening necessary to get control over public resourcemanagement and to manage the budgetary risks posed by Arun, for example, risksregarding revenue shortfalls. First, revenue mobilization needs to beenhanced through measures directed at simplifying sales taxes, introducing aVAT, expanding the income tax net and revamping tax administration. Thesemeasures would raise revenues by an average 0.5-0.6 percent of GDP a yearduring FY94-FY96 and by 0.3 percent for the rest of the nineties, raising therevenue-to-GDP ratio from 10.4 percent in PY93 to 13.5 percent in FY2000.Second, domestic borrowing needs to be prudent in line with the PFP frameworkand will be restricted to an average of 1.1 percent of GDP in gross terms overthe period FY94 to FY2000, a policy which in conjunction with the first wouldlimit the ratio of debt servicing to revenue to less than 25 percent byFY2000. Third, a priority expenditure program needs to be adopted. Thiswould comprise (a) limiting public sector wage increases and hiringselectively to contain regular expenditure growth, while allowing non-wagerecurrent expenditure financing for completed investments to grow in line withpriority O&M requirements; and (b) implementing a tighter developmentexpenditure portfolio, allowing new construction project starts only indemonstrated high-return areas, phasing out low quality projects and adopting
v -
a multi-year rolling budget with core activities which will have first claimon resources. The prioritization would allow total development sxpendituresto grow by over 7 percent a year and ensure that social sector expendituresgrow by about 8 percent a year in real terms. The implications of thisscenario for sectoral expenditure reform are outlined below (paras 14-17].Fourth, the main institutions responsible for development management wouldneed to be restructured and strengthened to improve the screening, monitoringand evaluation of projects so as to raise their productivity. These measuresconstitute the principal elements of fiscal reforms, and they are consistentwith the PFP reform agenda and macroeconomic framework for FY94-FY96, which isextended to the year 2000. The measures are estimated to allow an average4.2-4.5 percent growth in GDP over the period FY94-FY2000, while furtheringthe development of the three sectors - hydropower, social sectors and ruralinfrastructure - emphasized by the Governmenc as important for broad-based andaccelerated economic growth. Finally, actions need to be taken to improve theperformance of the power sector to reduce its claims on the budget byrestructuring the management of the Nepal Electricity Authority (NEA) toreduce power supply losses, reform the tariff structure, improve collectionsand internal financial controls, reduce over-staffing and implement the AHPwith minimal cost overruns. The Government has taken a number of significantinitial steps in each of these areai to help furt:er this reform agenda.
TAX REFORMS
Recent Initiatives
11. A number of preliminary actions were taken in the FY94 budget tobegin a restructuring of the tax system. The thrust of the proposed reformsis to (i) move from the multi-rate sales tax to a limited value added tax(VAT) in order to simplify the taxation of consumption; (ii) limit excises toa few products to simplify the system and free administrative resources toenforce other taxes; (iii) reform the income tax system to broaden the base bytre.ting income from various sources similarly; and (iv) strengthen taxadministration. Tariffs were rationalized, sales taxes were simplified andthe number of commodities covered was reduced to facilitate taxadministration; some 22 items were removed from the excise tax umbrella, andthe rates were raised on a few commodities to compensate for the revenue lossfrom the simplification. In the income tax area, measures were adopted towiden the income tax net to include, for example, interest earnings, urbanhouse rents and increased service charge on exports as a proxy for taxes onexport income. Other measures cover commercial importers, small traders andcontractors, forestry receipts and land revenues. A revenue service has beenestablished, with qualification and training requirements to raise the qualityof the staff. The total increase in revenues envisaged in FY94 is Rs.3.2billion, an increase of 22 percent; and the new measures alone are expected toraise Rs.1.7 billion, which is a major effort. The Government undertook amid-year review of the impact of the FY94 budget measures in order to takeappropriate action to guard against revenue shortfalls and to ensure a stablemacroeconomic situation. The preliminary results of the review indicateimproved fiscal performance. Strong performance was recorded in income taxrevenues which rose by 81 percent during the first half of the year compared
- vi -
to same period in FY93, as 3,000 new tax payers were added in Kathmandudistrict alone. Sales tax revenues rose by 35 percent during the same period;import tax revenues rose by 43 percent, helped by increased imports as tradepolicies were liberalized; and expor.. tax revenues rose by over 200 percent,due to an increase in the service charge on exports as a proxy for taxingexport income. But other tax sources performed poorly; for example, exciserevenues fell by 13 percent mainly because of a decline in cement production.Nevertheless, the total revenue increase for the six month period was about 15percent, compared to the same period last year, with tax revenues rising by 28percent. While the initial measures are in the right direction, efforts toenhance domestic resource mobilization need to be intensified. For example,despite the improved revenue performance, the local resource situation is eventighter because of shortfalls (estimated at Rs. 1.2 billion) in counterpartlocal funds from program aid. With an estimated overall resource shortfall ofRs. 500 million, expenditures would need to be even more tightly prioritized;and the Government will manage the situation by mobilizing additional revenuesand curbing spending by approximately equal amounts.
The Task Ahead
12. Irrespective of the outcome of the mid-year budget review, theactions taken in the FY94 budget are only initial steps. For example, someimportant revenue sources, including excises as well as land and propertytaxes continue to perform poorly and have to be turned around. Thus, it isimportant that a structural tax reform be undertaken and that a prioritizedmulti-year expenditure program [paras 14-151 be developed and integrated withthe budget to be able to turn around the weak fiscal and public resourcemanagement situation, manage the macroeconomic risks posed by AHP and supportthe other top priority expenditure programs adequately so that the economy canmake progress in the right direction towards the Government's overall growthand development objectives.
13. Given the low tax effort noted earlier, a main objective of theGovernment in the medium term is to make revenues more elastic byrestructuring the tax system through the introduction of a VAT, starting withpreparatory steps during FY94 and to aim at full implementation by FY96; andwork is under way in revenue reform committees to support the implementationof the reforms. The restructuring is necessary if domestic consumption is toemerge ultimately as the dominant source of revenues. Proposals to extend thesales tax base to, for example, more services, abolish the use of taxexemptions as an incentive measure, and adjust specific excises are initialsteps to introduce the VAT; and measures are expected to be taken in thatdirection in the FY95 budget. Bringing a wide range of products under the VATwould require considerable preparation. For example, training has to beprovided to tax payers, tax administrators and accountants; and a start hasbeen made in re-organizing the tax administrative service and in improving thequality of staff. The Government needs to expand resources for taxadministration as it adopts a phased program to start implementing the resultsof the ongoing work on the VAT. Also, further measures are required to widenthe income tax net, strengthen the collection of income tax as well as landand property taxes, and raise the yield from imports by improving import
- vii -
valuation procedures. Action in these areas is expected to raise revenues byan average 0.5-0.6 percent of GDP a year during the next 2-3 years.
EXPENDITURB RATIONALIZATXON
Recent Initiatives
14. Initial actions were also taken in the FY94 budget to implementthe preliminary findings of the Government's ongoing public expenditurereview. The Government (i) has adopted a core program of high priorityactivities (principally in power, the social sectors and rural infrastructure.accounting for 44 percent of the FY94 budget), which will have first claim onresources; (ii) is reforming the procedures for fund release to ensureresource availability for the core activities, for example, the release offunds for the noncore program was cut by Rs 125 million in November 1993 inanticipation of possible resource shortfalls; (iii) is reallocating localresources to limit claims by the low priority fully Government fundedactivities and to provide more local resources to support foreign aidedprojects; and (iv) is consi.dering adopting a policy on limiting new projectstarts to begin to reduce over-commitment. Some expenditures are beingreduced to curb the role of the state in various activities. For example, theallocation to the industry sector, mainly for the public manufacturingenterprises, was reduced by over 50 percent. Also, in agriculture, fertilizersubsidies were reduced by over 40 percent, with the relaxation of variousrestrictions to eliminate supply shortages by promoting a greater role for theprivate sector in importing and distributing chemical fertilizers. The totalexpenditure reduction is about Rs. 1.0 billion or 5 percent of FY93development expenditures, and the FY94 development budget is about the same inconstant value terms as in FY93. The preliminary results of the mid-yearbudget review mentioned earlier indicate a tight resource situation even withthe improved revenue performance, and the Government plans to reduce noncoreexpenditures by about Rs 200-250 million as part of managing the resourceshortfall.
The Task Ahead
15. Substantive measures remain to be taken to implement work inprogress to re-orient the expenditure program and adopt a multi-year budget.The Government inherited an over-loaded public investment program as alreadynoted, and in addition, the Government wants to move quickly with power,social sector and regional development. Thus, while the adoption of a revisedcore proCram as part of the FY94 budget represents a good start, it is only aninitial step in the prioritization effort to enhance the effectiveness ofpublic resource management. The projected core program is about 55 percent oflocal resources in FY95-FY96, and allocations for low priority activities arestill large and limit flexibility in emphasizing resources for the core.Thus, the expenditure prioritization work still in progress is critical for asubstantive rationalization of the development expenditure portfolio. Tomaintain the momentum for reforms, the Government's plan to complete theformulation of a three year rolling plan by April 1994 needs to beaccomplished on schedule and the results implemented during the FY9S budget
- viii -
cycle. The rolling plan should emphasize allocations for the high rate ofreturn activities, including priority recurrent cost financing needs, and itshould identify low priority non-core activities to be phased out. With aneffective prioritization, which will include phasing out low rate of returnactivities and reducing the role of the state in the various sectors, totalGovernment expenditures would be around 25 percent of GDP by the end of thedecade, and almost all sectors would have to grow at rates less thanhistorical patterns.
16. The principal inter and intra sectoral expenditure issues are asfollows. Sectors which would get a greater share of development resourcesinclude power, education, health and family planning, and rural transport,while expenditures on industry, other economic services, forestry and othersocial services would stagnate or decline relative to GDP. The decliningactivities are generally in areas where the Government is fostering a greaterprivate sector role and also shifting priorities and allocations amongprograms within the same sector. For example, progress towards effectiveagricultural intensification and the realization of the planned higheragricultural growth requires that the new irrigation uolicv be followedthrough with implementation to (i) limit large scale state-managed irrigationschemes which have done very poorly and expand farmer managed options whichhave shown greater potential and (ii) allocate more to rehabilitateappropriate medium scale irrigation schemes to be turned over to the privatesector. This will improve performance and reduce the budgetary financing forO&M which Government is unable to support adequately; for example, allocationsto support O&M for irrigation currently amount to about US$4 per ha., comparedto a requirement of about US$8-lO. Another area to limit the Government'srole and raise efficiency is to promote community and user groups in managingand delivering services in, for example, rural drinking water and forestry,where preliminary results are encouraging. In forestr , for example, studiessuggest that Government expenditures could be reduced substantially byimplementing existing policies stressing (i) community and user groupmanagement of forest resources especially in the Hills (ii) leaseholds,particularly in the Terai and (iii) the encouragement of the development ofprivate tree nurseries.
17. There are also options for shifting resource allocations withinthe same sector. Lower secondary education expenditures, for example,indicate the highest rate of return, but are currently under-funded and obtainonly about 14 percent of education sector resources, compared to 31 percentfor Asia. While "higher education" gets a disproportionate share equivalentto about 25-28 percent of education secto: resources, over 60 percent of theuniversity students are actually upper secondary students engaged in non-degree level courses, and the implementation of proposals to restructurehiaher education by transferring upper secondary from the university to thesecondary school system has potential to release resources to support lowerlevels of the education system. Also, grades 7 to 10 of Government aidedsecondary school pupils pay fees which are about twice those paid by studentsin public university campuses, and proposals to generate more resources byraising fees and encouraging private sector institutions in higher educationneed to be pursued through open discussion and transparent measures,
- ix -
considering the political sensitivity and potential resistance frombeneficiaries. For health and family planning, allocations would have toincrease to support O&M for existing facilities, emphasizing promotive andpreventive health, including family planning and maternal and child health,immunization and malaria education as priorities relative, for example, tocurative health service. Similarly, for transport, the sector strategyappropriately stresses O&M financing to rehabilitate and maintain thestrategic network; for example, providing maintenance coverage for about sOpercent of the road network together with improvements in the trails, bridgesand ropeways would require approximately US$195 million, about 50 percent ofplamned allocations for the transport sector under the EP. Other importantactivities include selective construction of farm-to-market roads tocomplement investments in agriculture; and upgrading of internal aviation tothe remote areas, while encouraging private investments in aviation equipment.On the other hand, allocations for on-going road construction within theNorth-South links has to be selective and economic. Deciding on these andother inter- and intra-sectoral expenditure trade-offs to re-orient publicresource allocation and raise the productivity of expenditures should be partof formulating the multi-year rolling plan. The less success in pruning theexisting development project portfolio, the more would be the need to limitnew investments in order to promote orderly public resource management.
INSTITUTIONAL ITRBNG-nNING
Recent Znitiatives
18. The nucleus of a monitoring unit has been created in the Ministryof Finance to (i) improve expenditure reporting and provide early warning onfiscal performance and (ii) monitor the financial implementation of the coreprogram. The unit will be provided with budgetary resources to strengthenstaff and facilities. Similarly, the National Planning Commission (NPC) hasset up the nucleus of a project screening and expenditure programming unit tobe able to review the public investment portfolio on a regular basis andimprove the quality of investments. The NPC has also established a projectmonitoring and evaluation system to track portfolio performance. TheGovernment has recognized the need to overhaul the system of publicadministration and strengthen local government institutions. Some initialbold steps were taken in this area to reduce over-staffing by retrenching some3500 higher level civil service staff; restructure the civil service andincentives, and establish processes to enforce accountability for the use ofpublic resources and raise the performance of projects. Subsequently, withthe completion of the census of the civil service staff and passing of theCivil Service Act, the Government has shifted its focus from over-staffing andretrenchment to addressing systemic factors affecting incentives andefficiency. Various ministries, excluding defence, have been restructured;the incentive system is being reformed by developing more objective guidelinesfor performance evaluation and more transparent processes for recruitment,promotion and compensation. Also, while no real increase is planned in thetotal wage bill, staff in unsuitable positions will be reduced, vacancies inareas of staff shortages will be filled and wage compression corrected.
x
The Task Ahead
19. There is a need to improve the management of development programsin areas, such as expenditure reporting, accounting and auditing, projectscreening and expenditure programming, and financial and physical monitoringof projects. Greater attention should be given to strengtheniing the (i)nucleus of expenditure reporting unit to provide early warning on the fiscaloutlook during the fiscal year and to support mid-year budget reviews; (ii)monitoring of the core program to ensure it has adequate resources; and (iii)the expenditure screening unit to help review programs periodically anc focusresources to fulfil key expenditure objectives. For the near term, there isneed to follow through with the initiatives relating directly to managing theexpenditure p.-ogram and the budget. In the case of expenditure and financialand expenditure reporting for projects, for eicample, improvements requireaccounting training for project managers, and more consistent enforcement ofthe existing rules and sanctions concerning financial irregularities. Also,the current focus of the administrative reform program on improvingperformance by addressing systemic issues, such as recruitment, performanceevaluation, promotion and compensation need to be followed through. Theexpected hiring based on organizational restructuring studies needs tocorrespond to sector expenditure priorities in order to ensure that adequatestaff is provided to support the delivery of the priority programs. Lastlyand importantly, given the general difficulties and long term nature of publicadministrative reforms in other LDCs, success requires sustained commitment.The Government needs to move more quickly to set out a clearer vision of therole of the public sector and the respective roles of the central and locallevel agencies, and to establish a feasible time table for implementing muchneeded reforms.
POWER SECTOR AND NEA REFORMS
Recent Initiatives
20. A number of initial measures have also been taken to improve theperformance of NEA in order to help reap the full benefits of power sectorinvestments for the country. Also, improved NEA performance to generateinternal resources to complement budgetary allocations will help to relievethe pressure on local resources. Measures taken include (i) raising low anduneconomic tariffs, which were equivalent to about 50 percent of long-runmarginal costs, by 60 percent in November 1991, 24 percent in March 1993 andagain by 38 percent in February 1994; (ii) restructuring NEA's Board andmanagement; (iii) improving collections to reduce accounts receivables from 6to about 3 months; and (iv) a technical assistance program to reduce powersupply losses currently estimated at about 25 percent, due to inefficienttechnology in transmission and distribution, illegal connections and weakfinancial monitoring. While these actions are encouraging, the impact onimproving sector performance, so far, remains to be seen.
J
- xi -
The Task Ahead
21. More actions need to be taken to improve power sector performance:strengthen NEA in various areas, raising productivity by implementing theprogram to retrench excess staff currently estimated at over 1000,following through with the various TA programs to raise technical efficiencyand instituting a more flexible approach to adjusting tariffs. Since the AHPwill not be completed before the end of the decade, intermediate power supplyshortages have to be addressed by other projects. It is important for fiscalmanagement that a prioritized power sector investment program be employed andthat options adopted to provide for the interim power shortages not over-burden the budget. Some of the options include power imports; reactivatingidle thermal and diesel power plants; promoting private sector investments insmall power plants which can be completed quickly by adopting a realisticframework, including flexible and predictable pricing; rehabilitating existingpower plants to recover capacity lost through poor maintenance; and investingselectively in new thermal power plants to support peak load management.These efforts need to be complemented by load management, for example, makingnew connections on selective basis and negotiating with major users on powerconsumption during peak demand.
THE IMPORTANCE OF REFORMS FOR AHP AND OTHER IMPORTANT DEVELOPMENT ACTImITIES
22. While the earlier discussion [para 10] shows that the principalexpenditure programs of the EP are feasible under the PFP assumptions andreform agenda, it is relevant to enquire what the likely fiscal outlook andthe public resource management situation would be under business-a3-usual(BAU) conditions or if reforms were to fizzle out after the implementation ofAHP is started. The issue was examined over the period FY94-FY2000 using amacroeconomic framework with the following main features: (i) an average GDPgrowth of 3.8 percent, which is higher than the long-term growth rate of 3.5percent achieved before the Trade and Transit impasse and the transition todemocracy, but not as good as the growth rate adopted in the macroeconomicscenario underlying the PFP; and (ii) an average revenue increase of 0.2percent of GDP a year, a little better than the rate of 0.1-0.15 percent ofGDP achieved in the late eighties; and (iii) an average domestic borrowing ofaround 2.6 percent of GDP, which is the average level obtaining during FY90-FY93; and (iv) an increase in regular expenditures, of 0.2 percent of GDP ayear, comparable to that achieved during the eighties.
23. The simulation shows that the availability of local resourceswould come under severe pressure. The overall local financing gap would beequivalent to 3.1 percent of GDP, or approximately US$125 million a year.Given that the scenario already assumes domestic borrowing equivalent to 2.6percent of GDP, a figure deemed too high to be prudent, the 3.1 percent localfinancing gap cannot be filled by additional domestic borrowing. Thus,expenditures would have to contract. It is difficult to map out the exactnature of such a contraction without an expenditure prioritization strategy,but based on past experience, non-wage O&M activities and capital intensiveprograms would be the most vulnerable initially. The ad hoc adjustment ofdevelopment spending and the vulnerability of O&M financing in sectors such as
- xii -
irrigation, agricultural services, transport and drinking water, in the eventof unprioritized expenditure contraction, would imply that capacityutilization and productivity of existing investments and growth would beadversely affected. Moreover, since the social sectors are the most intensiveusers of local resources (for example, a unit percent real increase i:expenditures results in local currency use at the margin of Rs. 110 millionsocial services, compared to Rs. 48 million for infrastructure), a cut back insocial prog.ams would be unavoidable. It is calculated that a reduction inthe growth of social sector expenditures to around 5-6 percent a year,compared to the 8 percent annual growth which the public expenditure analysisof this report shows to be appropriate to meet Nepal's pressing human resourcedevelopment needs, would be required to help eliminate the financing gap.
24. A five percent annual growth rate over a decade would lead tosocial sector --penditures 25 percent less compared to that achieved with 8percent annual growth. This would have grave consequences. For education,the difficulty of cutting teachers' salaries, which account for over 70percent of costs, implies that contraction in the sector would most likelyfall on materials, renovation of school facilities, teacher training, otherquality improvement programs and the expansion of access to new communities.In that event, the current low literacy rates and other indicators of poorschoo' performance would worsen, especially in the rural areas whichconstitute about 90 percent of the population. In health and family planning,the existing shortages of staff, drugs and infrastructure would be aggravated,spelling serious setbacks to service delivery and social conditions.
25. The low productivity of investments and cut back in the socialsector implied by this scenario would compromise the Government's attempts toaccelerate growth and invest more in human resources and alleviate widespreadpoverty in a country which ranks among those with the weakest socialindicators in the world. Only a third of adults are estimated to be literate,net primary school enrollment is about 50 percent and the completion rate is35 percent, and only 39 percent of the teachers are trained. Without aneffective population program, the current population of 19 million is expectedto double in about 25 years. Infant and child mortality rates of 102 and 165per thousand and maternal mortality rate of 8.5 per 100 live births are amongthe highest in the world. While the costs to Nepal's long-term development ofsuch a scenario would therefore be considerable, its macroeconomicconsequences would also be undesirable. In particular, the heavy recourse todomestic borrowing and a modest revenue effort, while consistent withhistorical performance, would lead to a situation where domestic debtservicing as a proportion of revenue would rise from 28.8 percent in FY93 to34 percent in FY2000. Moreover, debt servicing, together with employeecompensation, would account for about 90 percent of regular expenditures inFY2000, exerting further pressure on important non-wage O&M expenditures.
26. The impact of a cost overrun of 15 percent on AHP was alsosimulated, and the analysis shows that this is not likely to be a significantsource of risk. However, it must be stressed that weaker than projectedrevenue generation and lack of expenditure prioritization and control wouldlead to serious problems. The Government is cognizant of the fiscal risks
- xiii -
posed to Nepal's long-term future by a failure to improve a historically poorrecord of public resource management. As already discussed, it has begun totake significant initial steps which, if sustained over the next few years,would signal a break from the BAU assumptions of the downside risk analysispresented above.
THE ROLE OF DONORS
27. Nepal would need strong support from donors to re-orient itspublic expenditure portfolio and enhance the quality of public investmentsover the coming years and to make progress in achieving the objectives ofaccelerated growth with improvement in poverty. First, donor support needs toemphasize assistance to the Government's priority sectors, as this would becritical for the Government to make headway in adopting a priority expenditureprogram and in phasing out low rate of return activities. The willingness ofdonors to support the prioritization effort will be critical for providingscope for new project starts; it would also help to restructure or phase outprojects performing poorly, and to direct new aid to the priority areasindicated by the Government. Second, reforms require greater coordinateddonor effort as the Government makes attempts to restructure its publicinvestment portfolio and to scale back its role in the various sectors. Insome cases, such support has been forthcoming as, for example, in the case oftechnical assistance being provided to reduce the Gorernment's role in theindustrial sector through divestiture and other measures aimed at promotingprivate sector development. In addition, it is important to support statedGovernment policies intended to limit new investments in the sectors, forexample, manufacturing where the role of the state is being curbed. In turn,resources intended for such sectors could be channelled to the currentlystated priority program areas. Third, donor support would help to mitigatethe potential crowding out effects of AHP on other sectors, if support forother priority sectors -- such as education, health and family planning --were to be increased. As the Government makes significant progress in localresource mobilization and in institutional reforms, it would be able to absorbmore external assistance effectively. Currently, though the resourcerequirements to support Nepal's development efforts are considerable, externalaid is not the only serious constraint on the financing of developmentprojects. Thus, wore assistance would have to relate to progress in absorbingthe existing aid pipeline as well as in mobilizing domestic resources tosupport effective use of the available aid.
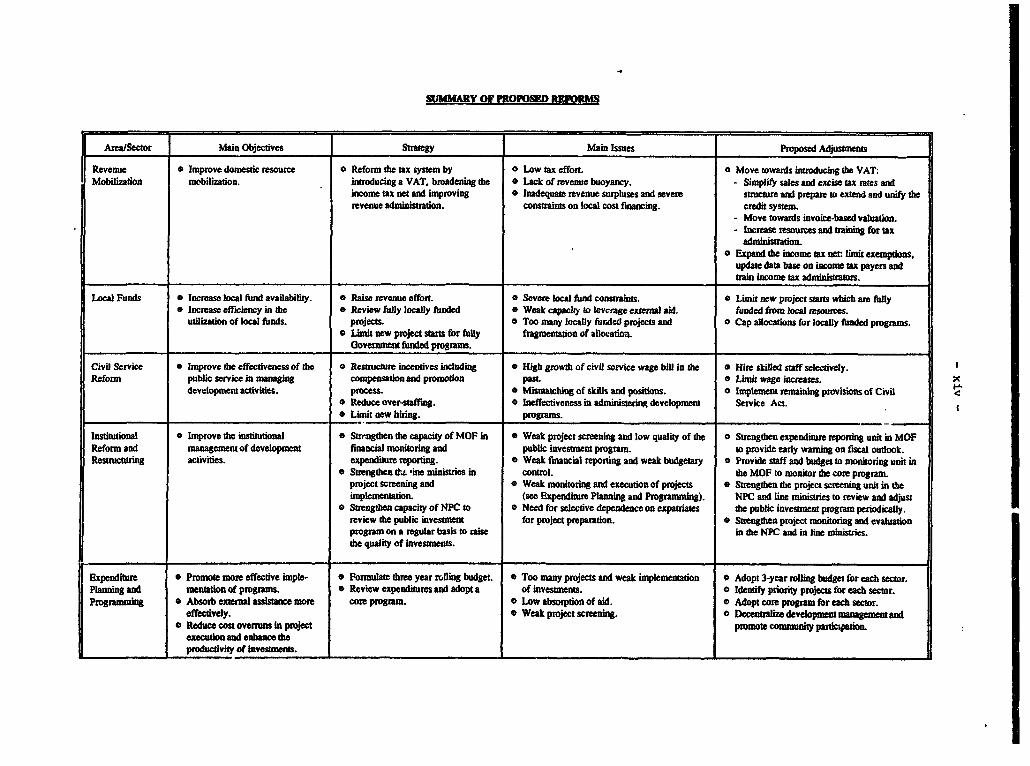
SUMMRY OF FROFSED RO
Area/Sector Main Objectives Strategy Main Issues Pwposed Adjustmients
Revenue e Improve domestic resource 0 Reform the tax system by 0 Low tax effort. o Move towards introducing tbe VAT:Mobilization mobilization. introducing a VAT, broadening the 0 Lack of revenue buoyancy. - Simplify sales and excise tax rates and
income tax net and improving O Inadequate revenue surpluses and severe struture and prepare to extend and unify tberevenue administration. constraints on local cost financing. credit system.
- Move towards invoice-based valuation.- Increase resources and training for tax
0 Expand the income tax net Limit exemptdons.update data base on income tax payers andtrain income tx administrtors.
Local Funds 0 Increase local fund availability. 0 Raise revenue effort. 0 Severe local fund constraints. a Limit new project starts which are fullyo Increase efficiency in the a Review fully locally funded a Weak capacity to levciage external aid. funded from local resources.
utilization of local funds. projects. a Too many locally furAded projects and o Cap allocations for locally funded programs.° Limit new project stwts for fuly fragmetation of allocation.
Goverment &nded programs.
Civil Service * Improve the effectiveness of the 0 Resuucture incentives including * High growth of civil service wage bill in the o Hire skilled staff selecdvely.Reform public service I n unaging compensation and promodon past. a Lmut wage increases.
development activities. process. * Mismaching of skills and positions. a Implement remaiing provisions of Civil° Reduce over-stffing. 0 Ineffectiveness in administering development Service Act.* Limit new bing, programs.
Institutionai 0 Improve the institutional ° Srruagten the capacity of MOF in 0 Weak project screening and low quality of the o Strengdien expenditure reporting unit in MOFReform and managemeent of development financial monitoring and public investment program. to provide early waning on fiscalt oudootk.Resnucatring activities. expenditure reporting. a Weak financial reporfing and weak budgetary o Provide staff and budget to monitoring unit in
* Strengthen dti 'ine ministries in control. the MOF to monitor the core program.project screening and 0 Weak monitoring and execution of projects 0 Strengthen die project screening unit in theimplementation. (see Expenditure Planning and Programming). NPC and line minisuies to review and adjust
e Strengthen capacity of NPC to 0 Need for selective dependence on expatiates the public investment program periodically.review the public investment for project prepatAaion. o Strengthen project montorin and evalutfionprogram on a regular basis to raise in the NPC and in line ministries.the quality of investments.
Expenditure * Promote more effective imple- o Fonnulate tbree year rolling budget. 0 Too many projects and weak impiementation 0 Adopt 3-year roDing budget for esch sector.Planning and mentation of programs. * Review expenditures and adopt a of investmaents. O Ident*i1 priority projects for each sector.Pogratmming 0 Absorb extemal assistance more core program. O Low absorption of aid. O Adopt core program for each Sector.
effectively, a Weak project screening. O Dccalize dereop mentand0 Reduce cost overnins in project promot community pa rc:
execution and enhance theproductivity of investments.
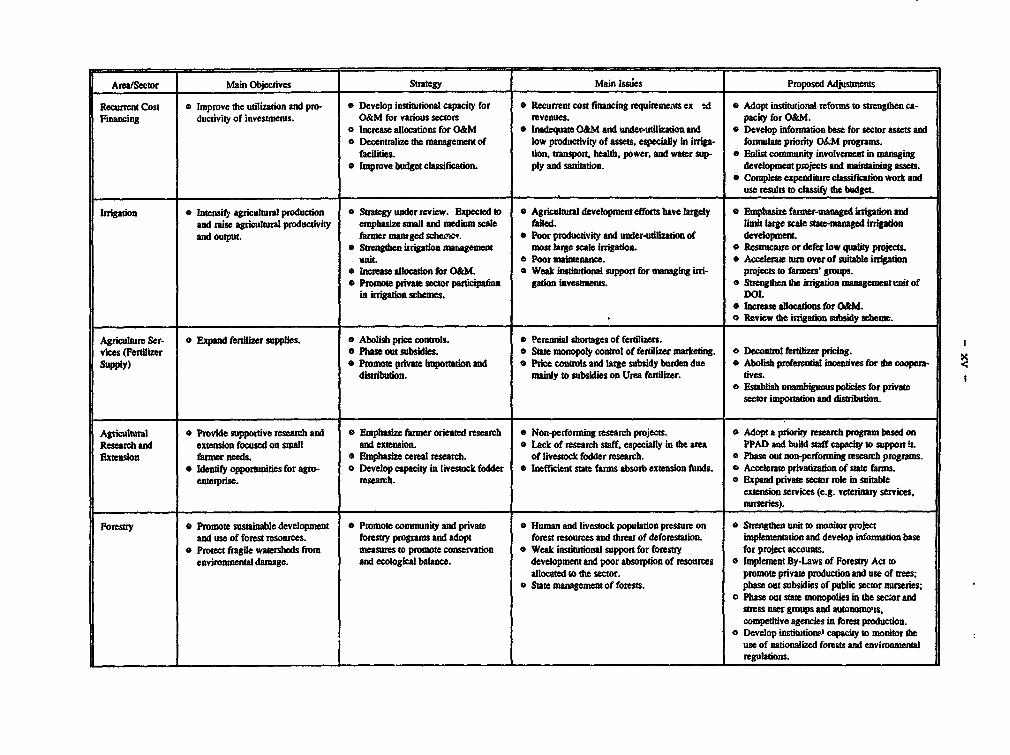
Area/Sector Main Objectives Strategy Main Issues Proposed Adjustments
Recurrent Cost o Improve the utilization and pro- 0 Develop institutional capacity for 0 Recurrent cost financing requirements ex id 0 Adopt institutional reforms to strengthen ca-Financing ductivity of investments. O&M for various sectors revenues. pacity for O&M.
o Inerease allocations for O&M 0 Inadequate O&M and under-utilizaton and e Develop information base for sector assets ando Decentralize the management of low productivity of assets, especiaily in irriga- formulate priority O&M programs.
facilities. tion, transport, healih, power, and water sup- Enlist community involvement in managing* Improve budget classification. ply and sanitation. development psojects and mainuaining assets.
* Complete expenditure classification work anduse results to classify the budget.
Irrigation * Intensif agricultural production e Strategy under review. Expected to 0 Agricultural devdopnment efforts have largey 0 Empsize farmer-managed irigation andand mise agricultual productivity emphasize snm and mediun scale failed. limit large scale statenaed inrigationand output. fanner mnamged schercin. 0 Poor productiviy and under-utilizadon of development.
a Strengten irrigation management nmst large scale irrigatn. 0 Reatnicture or defer low quality proiects.unit. a Poor maintenance. 0 Acceerate tum over of suitabie irrigation
* Increase allocation for O&M. o Weak instituional suppott for managing irr- projects to famers' groups.o Prmote pivate sector participation gation investments. 0 Strengthen the irrigation managemen it of
in irrigation shMes. DOLa bmease allocations for O&M.o Review the irrigation subsidy scheme.
Agriculture Ser- 0 Expand fertilizer supplies. o Abolish prie controls. * Perennial shortages of fertilizers.vices (Pertilizer e Phase out subsidies. 0 State monopoly control of fertilizer marketing. O Decontrol fertilizer pricing.Supply) 0 Promote private importation and a Price conrls and lage subsidy burden due * Abolish preferential incentives for the coopem-
distdbution. mainly to subsidies on Urea ferdizer. tives.* Establish unambiguous policies for private
sector importation and distrbution.
Agricultural a Provide suporve research and 0 Emphasize farmer oriented research 0 Non-perfonning research projects. o Adopt a priority research program based onResearch and extension focused on small and extension. 0 Lack of research staff, especially in the area PPAD and build staff capacity to suppon .Extension farner needs. 0 Emphasize cereal research. of livestock fodder resebch. o Pbase out non-performing research programs.
* Identify opportunities for agro- o Develop capacity in livestock fodder e Ine{ficient state fanrs absorb extension funds. 0 Acoderate pfivatization of stare farms.enterprise. research. a Expand pivate sector role in suitable
extension services (e.g. veterlnaty services.___ _ _ _ _ _ _ _ _ _ _ _ _ _ _ _ _ _ _ _ _ _ _ _ _ _ _ _ _ _ _ _ _ _ _ _ _ _ _ _ _ _ _ nurseries).
Forestry o Promote sustainable development 0 Promote comunnity and private 0 Human and livestock population pressure on e Strengthen unit to monitor projectand use of forest resources. forestry programs and adopt forest resources and threat of deforesmtion. implenentation and develop infomration base
* Protect fragie watersheds from measures to promote conservation 0 Weak institutional support for forestry for project accounts.environmental damage. and ecological balance. development and poor absorption of resources 0 Implement By-Laws of Forestry Act to
allocated to dte sector. promote private production and use of trees:* State management of forests. phase out subsidies of public sector nursedes:
o Phase out state monopolies in the sec:or andstress user groups and autonomons,competitie agencies in forest production.
o Develop insttions' capacity to monitor theuse of nationalized forests and environmentalregulations.
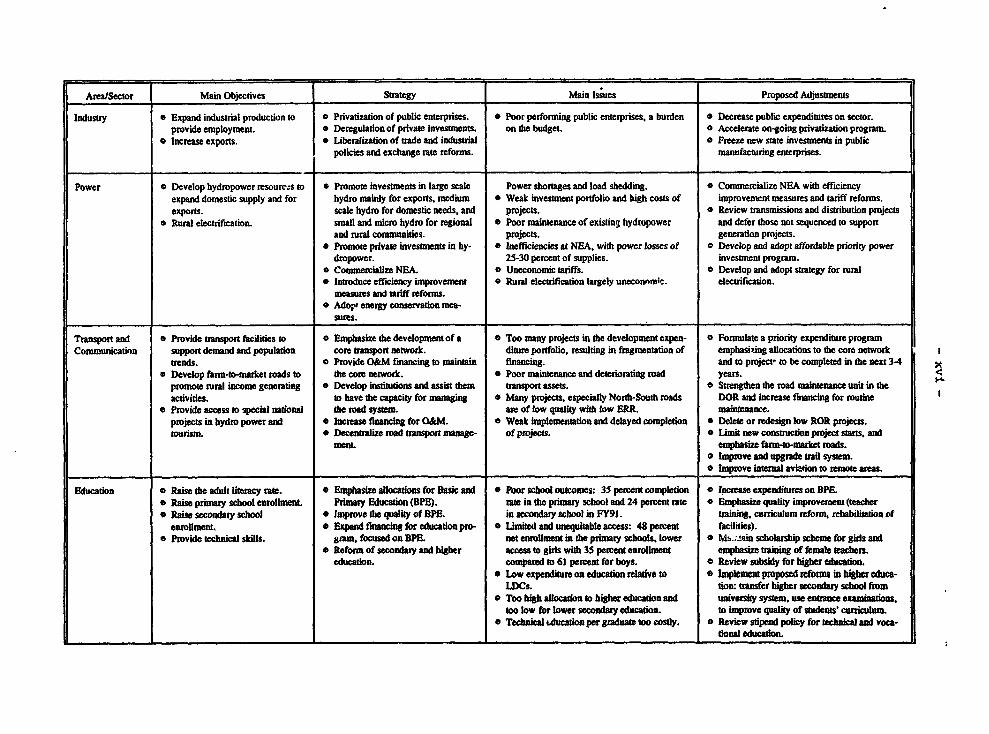
AreatSector Main Objectives Strategy Main Issues Proposed Adjustments
Industry * Expand industrial production to o Privatization of public enterprises. 0 Poor performing public enterprises, a burden * Decrease public expenditures on sector.provide employment. * Deregulation of private investments. on the budget. a Accelerate on-going privatization program.
o Increase exports. o Liberalization of trade and industrbl 0 Freeze new sate investments in publicpolicies and exchange rate reforms. manufacturing enterprises.
Power a Develop hydropower resourcas to * Promote investments in large scale Power shortages and load shedding. * Commercialize NEA with efficiencyexpand domestic supply and for hydro mainly for exports. medium * Weak investment portfolio and high costs of improvement measures and tariff reforms.exports. scale hydro for domestic needs, and projects. 0 Review transmissions and distnbution projects
o Rural electriftcation. small and micro hydro for regional 0 Poor maintenance of existing hydropower and defer tbose not sequenced to supportand rural comnmunities. projects. generation projects.
* Promote private investments in hy- 0 Inefficiencies at NBA, with power losses of 0 Develop and adopt affordable priority powerdropower. 25-30 percent of supplies. investment program.
a Commercialize NBA. ° Uneconomic tariffs. a Develop and adopt strategy for rural* Introduce efficency improvement a Rural electrification largely uneconnmic. electrification.
measures and tariff reforms.* Adopt energy conservation mea-
sures.
Transport and o Provide transport facilites to 0 Emphasize the development of a 0 Too many projects in the development expen- 0 Pormulate a priority expenditure programCommunkation support demand and population core transport network. diture portfolio, resulting in fragmentation of emphasizing allocations to the core network
trends. 0 Provide O&M fimancing to maintain financing. and to projectw to be completed in the next 34 X* Develop farm-to-market roads to tde core netwotk. 0 Poor mnaintenance and deteriorating road years.
promote rural income generating 0 Develop institutions and assist them ttansport assets. a Strengthen the road maintenance unit in theactivities. to have die capacity for managing 0 Many projects, especialy North-South roads DOR and increase financing for routine
* Provide access to special national tde road system. are of low quality with low ERR. maintenance.projects in hydro power and e Increase financing for O&M. 0 Weak implementation and delayed completion * Delete or redesign low ROR projects.tourism. * Decentralize road transport manage- of projects. ° Limit new construction project starts, and
mene. emphasize farm-to-market roads° bIprove and upgrade trail system.* Improve internal aviation to remote areas.
Education 0 Raise the adult litacy rate. 0 Emphasize allcaons for Basic and 0 Poor school outcomes: 35 percent completion 0 Increase expenditures on SPE.* Raise primary school enrolLment. Primary Educadon (BPE). rate in the primary school and 24 percent rate 0 Emphasie quality improvement (teache* Raise secondary school * Improve the quality of BPE. in secondary school in FY91. traiing, curiculum reform, rehabilitation of
enrollment. * Expand financing for education pro- 0 Limited and unequitable access: 48 percent facilities).* Provide technical skills. ramn, focused on BPE. net enrollment in the primary schools, lower 0 Ma.-jain scholarship scheme for gids and
* Refbrm of secondary and higher access to girls with 35 percent enrollment emphasize training of female teachers.education. compated to 61 percent for boys. 0 Review subsdy for higher education.
* Low expendite on education reative to 0 Implemnt proposed reforms in higher eduat-LDCs. tion: transfer higher secondary school from
* Too high alloction to higher education and universty systm, use entrance exantirons,too low for lwer secondary education. to improve quality of sudents' curricum
0 Tecbnical uucatdon per graduate too costly. 0 Review stipend policy for tenical and YoCa-tional education.
Area/Sector Main Objectives Strategy Main Issues Proposed Adjustments
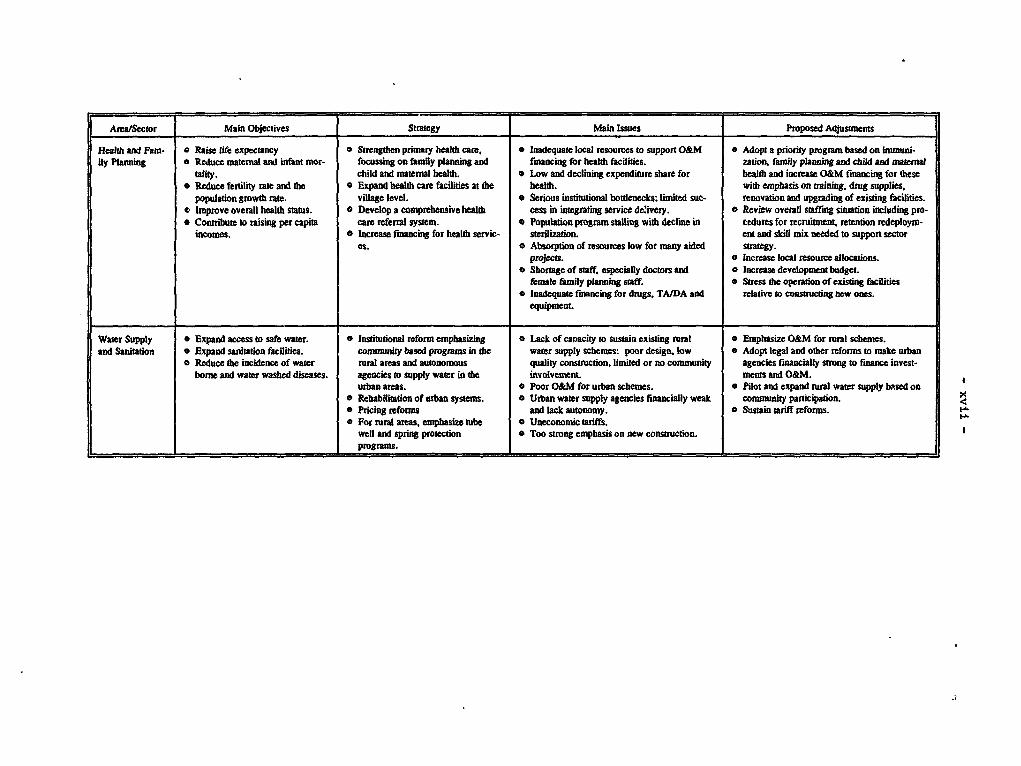
Health and Fam- 0 Raise life cxpectancy o Strengthen primay health care, 0 Inadequate local resources to support O&M * Adopt a priorty program based on imrnuni-ily Plaing o Reduce maternal and infant mor- focussing on family planning and ftnancing for health facilties. zation, family planning and child and maternal
tality. child and maternal health. e Low and declining expenditure share for healdt and increase O&M fitnancing for these* Reduce fertility tate and the 0 Expand bealth care facilities at the health. with emphasis on training, drug supplies.
population growth rate. village level. e Serious institutional bottlenecks: lnimted suc- renovation and upgrading of existng facilides.* Improve overall health status. 0 Develop a comprehensive health cess in btegating service ddivery. 0 Review ovetaDl staffmg situation including pro-* Contribute to raising per capita care referral system. * Population progam stalling with decline in cedures for recruitment, retendon redeploym-
incomes. 0 Increase financing for health servic- sterilizaton. ent and skill mix needed to support sectores. 0 Absorption of resoures low for many aided strategy-
projects. o Increase local resource allocations.e Shortage of staff, especially doctors and o Increase development budget.
female family panning staff. 0 Stress the operation of existing facilities* Inadequate financing for drugs, TA/DA and relative to constucting new ones.
equipment.
Water Supply * Expand access to safe water. ° Instituonal reform emphasizing * Lack of canacity to sustain existing rural 0 Emphasize O&M for rural schemes.and Sanitation e Expand sanitation facilities. community based prog8ms in the water supply schemes: poor design. low o Adopt legal and other refonns to make urban
o Reduce the incidence of water rural areas and autonomous quality construetion, limited or no community agencies fiancially srung to finance invest-borne and water washed diseases. agencies to supply water in the involvemnent. ments and O&M.
urban areas. 0 Poor O&M for urban schemes. 0 Pilot and expand rura water supply based ono Rehtbilitation of urban systems. 0 Urban water supply agencies financially weak community participation.* Pricing reforms and lack autonomy. e Sustain tariff reforms.* For rural areas, emphasize tube 0 Uneconomic tariffs.
well and spring protection ° Too strong emphasis on new consruction.programs.
CHAPTER ONE
RECENT ECONOMIC PERFORMANCE AND PROGRESS IN POLICY REFORMS
A. Introduction
1.1 Nepal is a low income country with a per-capita income of aboutUS$170 and is facing difficult development challenges. Agriculture, themainstay of the economy, has mora or less stagnated. The population of about19 million is expected to double in 25 years, while social indicators are wellbelow the average for the South Asia region.i/ The country has abundanthydropower resources, but is facing shortages of electricity, with impli-cations for industrial expansion. While the long and open border with Indiahas benefits, it also circumscribes Nepal's economic policies in such keyareas as trade, exchange rates, interest rates and pricing.2/ These con-straints have been exacerbated by poor public administration, weak institu-tions and ineffective development management. Overall, not much progress hasbeen made in improving the widespread poverty situation over the last decades.
1.2 Over the past two years, the emergence of a democraticallyelected Government in Nepal and a shift towards economic liberalizationelsewhere in the region created an environment more conducive to economicreform than in the recent past. As a result, a number of important initia-tives have been taken by the Government to improve economic management, sincethe last Economic Report was written in March 1992. The Government has adopt-ed a new Eighth Plan (EP) - 1993-97, committed to relaxing the serious con-straints on development and accelerating growth and alleviating poverty by:promoting private sector expansion; improving the efficient use of publicresources; and expanding expenditures to invest more in power, human resourcesand rural infrastructure. But the Government was faced with immediatechallenges to (i) manage the changing external economic situation resultingfrom trade and industrial liberalization in neighboring countries; (ii)restructure the administrative and regulatory machinery; and (iii) improve thecapacity to manage public resources and enhance the effectiveness of develop-ment activities.
1.3 This chapter reviews the progress that has been made by theGovernment in managing these challenges in the last two years FY92 and FY93,since the last Economic Report was written in March 1992. The review showsthat economic performance has been mixed. Strong actions were taken toliberalize trade and industrial policies, and to unify the foreign exchangesystem. In addition, progress has been made ir privatizing public enterpris-es, initiating public administration reforms and in, by and large, encouraging
Social indicators remain well below the average for the South Asia region. Life expectancy atbirth is 54 years, and infant mortality is 102 per 1,000 (1991), and adult literacy stands onlyat about 33 percent.
V More recently, however, with India moving rapidly to liberalize its economy and implementstructural reforms, this factor has become an important catalyst, rather than an impediment, foreconomic reform in Nepal (see below).
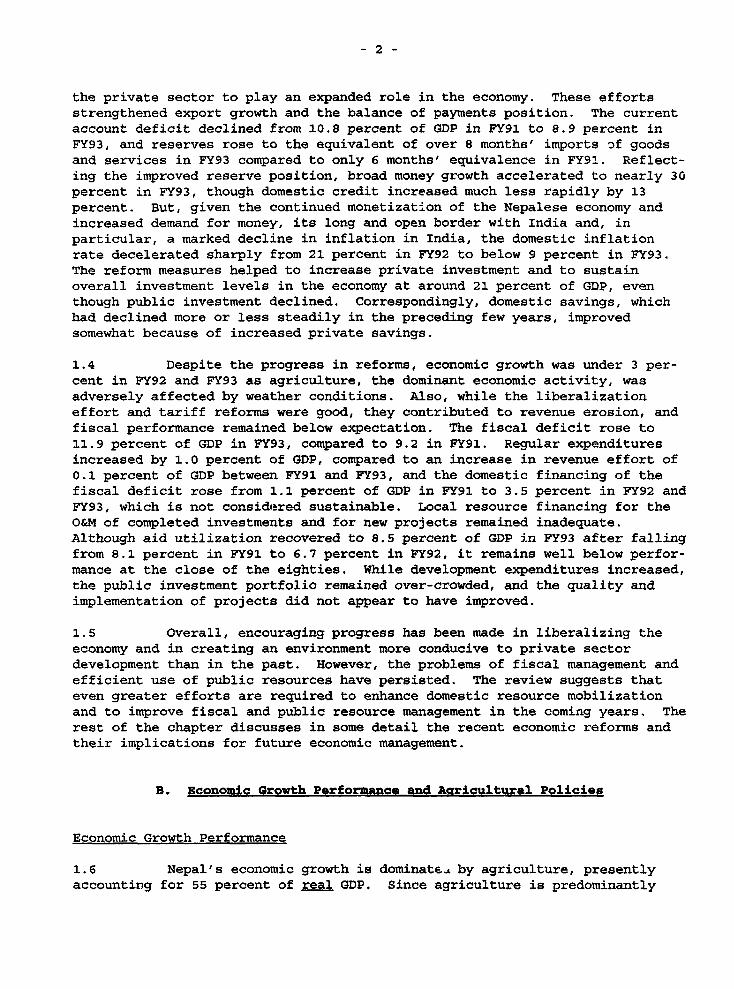
the private sector to play an expanded role in the economy. These effortsstrengthened export growth and the balance of payments position. The currentaccount deficit declined from 10.8 percent of GDP in FY91 to 8.9 percent inFY93, and reserves rose to the equivalent of over 8 months' imports of goodsand services in FY93 compared to only 6 months' equivalence in FY91. Reflect-ing the improved reserve position, broad money growth accelerated to nearly 30percent in FY93, though domestic credit increased much less rapidly by 13percent. But, given the continued monetization of the Nepalese economy andincreased demand for money, its long and open border with India and, inparticular, a marked decline in inflation in India, the domestic inflationrate decelerated sharply from 21 percent in FY92 to below 9 percent in FY93.The reform measures helped to increase private investment and to sustainoverall investment levels in the economy at around 21 percent of GDP, eventhough public investment declined. Correspondingly, domestic savings, whichhad declined more or less steadily in the preceding few years, improvedsomewhat because of increased private savings.
1.4 Despite the progress in reforms, economic growth was under 3 per-cent in FY92 and FY93 as agriculture, the dominant economic activity, wasadversely affected by weather conditions. Also, while the liberalizationeffort and tariff reforms were good, they contributed to revenue erosion, andfiscal performance remained below expectation. The fiscal deficit rose to11.9 percent of GDP in FY93, compared to 9.2 in FY91. Regular expendituresincreased by 1.0 percent of GDP, compared to an increase in revenue effort of0.1 percent of GDP between FY91 and FY93, and the domestic financing of thefiscal deficit rose from 1.1 percent of GDP in FY91 to 3.5 percent in FY92 andFY93, which is not considered sustainable. Local resource financing for theO&M of completed investments and for new projects remained inadequate.Although aid utilization recovered to 8.5 percent of GDP in FY93 after fallingfrom 8.1 percent in FY91 to 6.7 percent in FY92, it remains well below perfor-mance at the close of the eighties. While development expenditures increased,the public investment portfolio remained over-crowded, and the quality andimplementation of projects did not appear to have improved.
1.5 Overall, encouraging progress has been made in liberalizing theeconomy and in creating an environment more conducive to private sectordevelopment than in the past. However, the problems of fiscal management andefficient use of public resources have persisted. The review suggests thateven greater efforts are required to enhance domestic resource mobilizationand to improve fiscal and public resource management in the coming years. Therest of the chapter discusses in some detail the recent economic reforms andtheir implications for future economic management.
B. Economic Growth Performance and Aaricultural Policies
Economic Growth Performance
1.6 Nepal's economic growth is dominate.. by agriculture, presentlyaccounting for 55 percent of real GDP. Since agriculture is predominantly
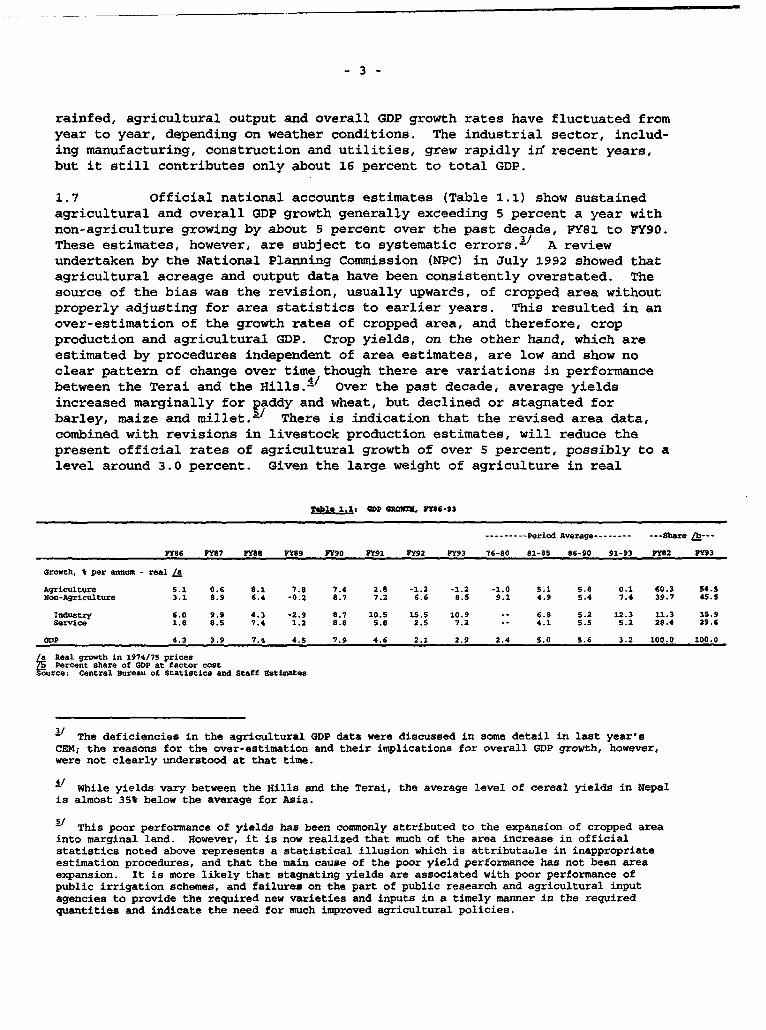
3
rainfed, agricultural output and overall GDP growth rates have fluctuated fromyear to year, depending on weather conditions. The industrial sector, includ-ing manufacturing, construction and utilities, grew rapidly ii' recent years,but it still contributes only about 16 percent to total GDP.
1.7 Official national accounts estimates (Table 1.1) show sustainedagricultural and overall GDP growth generally exceeding 5 percent a year withnon-agriculture growing by about 5 percent over the past decade, FY81 to FY90.These estimates, however, are subject to systematic errors.23/ A reviewundertaken by the National Planning Commission (NPC) in July 1992 showed thatagricultural acreage and output data have been consistently overstated. Thesource of the bias was the revision, usually upwards, of cropped area withoutproperly adjusting for area statistics to earlier years. This resulted in anover-estimation of the growth rates of cropped area, and therefore, cropproduction and agricultural GDP. Crop yields, on the other hand, which areestimated by procedures independent of area estimates, are low and show noclear pattern of change over time though there are variations in performancebetween the Terai and the Hills.4/ Over the past decade, average yieldsincreased marginally for naddy and wheat, but declined or stagnated forbarley, maize and millet.- There is indication that the revised area data,combined with revisions in livestock production estimates, will reduce thepresent official rates of agricultural growth of over S percent, possibly to alevel around 3.0 percent. Given the large weight of agriculture in real
Table 1.1: GOP ORO=T. F8C6-93
----- Period Average-------- --- Sh ---
FY86 FY87 FF88 FF89 FY90 FY91 FY92 FY93 16-80 81-85 86-90 91-93 FF82 FF93
Growth, I per annum - real /a
Agriculture S.1 0.6 8.1 7.8 7.4 2.8 -1.2 -1.2 -1.0 S.1 s.8 0.1 60.3 54.5Non-Agriculture 3.1 8.9 6.4 -0.2 8.7 7.2 6.6 8.5 9.1 4.9 5.4 7.4 39.7 45.5
Industry 6.0 9.9 4.3 -2.9 8.7 10.5 15.5 10.9 6.8 5.2 12.3 11.3 1S.9Service 1.e 8.s 7.4 1.2 8.8 5.8 2.5 7.2 -- 4.1 S.S 5.2 28.4 29.6
GODP 4.3 3.9 7.4 4.5 7.9 4.6 2.1 2.9 2.4 S.0 5.6 3.2 100.0 100.0
La Real growth in 1974/7S pricesT Percent share of GDP at factor costSource: Central Bureau of Statiotics and Staff gatimates
/ The deficiencies in the agricultural GDP data were discussed in some detail in last year'sCEM; the reasons for the over-estimation and their implications for overall GDP growth, however,were not clearly understood at that time.
V While yields vary between the Hills and the Terai, the average level of cereal yields in Nepalis almost 35* below the average for Asia.
/ This poor performance of yields has been commonly attributed to the expansion of cropped areainto marginal land. However, it is now realized that much of the area increase in officialstatistics noted above represents a statistical illusion which is attributavle in inappropriateestimation procedures, and that the main cause of the poor yield performance has not been areaexpansion. It is more likely that stagnating yields are associated with poor performance ofpublic irrigation schemes, and failures on the part of public research and agricultural inputagencies to provide the required new varieties and inputs in a timely manner in the requiredquantities and indicate the need for much improved agricultural policies.
-4-
GDP of around 60 percent for the past decade, this revision of agriculturaloutput and value-added would imply that the average growth rate of total GDPwas in fact less than 4 percent over the past decade.-/
1.8 In the most recent period FY92 and FY93, economic growth wasdisappointing, despite strong efforts by the Government to improve macroeco-nomic policies. Total GDP grew by only 2.1 percent in FY92 and by 2.9 percentin FY93 mainly because of the effects of drought conditions on agriculture,necessitating record food imports of 54000 MT in FY92.7/ With a censuspopulation growth rate of 2.1 percent, there was little improvement in per-capita incomes during this period. However, according to official estimates,in both years non-agriculture continued to grow rapidly by about 7 percent inreal terms in FY92 and about 8 percent in FY93. The industrial sector, inparticular, grew at a rate averaging 6-7 percent a year in real terms, largelyreflecting the rapid growth of exports of carpets and ready made garments, in-creased construction especially in the private sector, and services, such astourism, land and air transport. Though from a small base, this recent rapidgrowth of the industrial sector is still noteworthy, as it suggests that somestructural change in GDP is taking place. The share of manufacturing in GDP,for example, has nearly doubled from about 5 percent in FY89 to nearly 9percent in FY93, as exports of carpets and ready-made garments have grownrapidly.
Agricultural Policies
1.9 There is recognition that agricultural expansion would offersubstantial scope for broad-based growth and poverty reduction in Nepal.Accordingly, the Government in the late eighties pursued a strategy whichsought to increase the effectiveness of public sector institutions in supply-ing support services, including agricultural research and extension, provideadequate price incentives to farmers, increase the role of the private sectorin the distribution of inputs, increase water availability to complement otherinputs and improve the management of the irrigation system by involving farmergroups in the design, operation and management of public irrigation schemes.
1.10 Since the late eighties, some progress was made in implementingthese policies. For example, fertilizer prices were raised to be compatiblewith Indian border prices to prevent smuggling, and the distribution ofchemical fertilizer was liberalized to allow the private sector to competewith the co-operatives at retail level. However, fertilizer shortagespersisted. The Agricultural Inputs Corporation (AIC) had the sole monopolyover fertilizer imports; fertilizer prices were subsidized in relation tosimilar subsidies in India, so the budgetary allocations for financing the
/ The NPC is also conducting a study to update non-agricultural GDP, which is believed to havebeen understated in the past. The study will help provide a more accurate picture of overalleconomic activity.
/ Nepal has traditionally been a net exporter of foodgrains. Between FY81 and FY87 for example,recorded net exports of foodgrains to India was estimated at 25,000 MT per year. Since FY88,however, recorded food exports have been negligible.
subsidies constrained supplies. In FY92, the Government announced measures toimprove fertilizer availability by allowing private sector imports; but noprivate sector imports took place until June 1993 for a variety of reasons.For example, the foreign exchange allocated for each order of fertilizerimports was initially Rs.30 million equivalent to $700,000, which was notadequate to allow bulk imports. Given the economies of scale in shipment offertilizer, the minimum amount required for a successful bid was Rs.S0 millionper order. Also, the Government had not clearly established that privateimporters could also sell fertilizer at the retail level. In early February1993, a number of steps were taken to address tl-s constraints on privatesector import and distribution. The foreign ex hange allocation system forfertilizer was eliminated; and following the decision to make the Rupee fullyconvertible, fertilizer prices were raised and subsidies eliminated, exceptfor urea. Additional steps are needed to ensure greater private participationin import and retail distribution, for example, by (i) making clear policystatements on the private sector's role in imports as well as in wholesale andretail distribution, and issuing guidelines to implement them; (ii) removingquantitative restrictions still being imposed by AIC to favor co-operativesrelative to the private sector in fertilizer distribution; and (iii) limitingAIC's role to less accessible areas, where the private sector may not havemuch incentive to operate. In the case of urea, eliminating shortages requireprice increases to encourage private sector role and also reduce the subsidyburden on the budget.
1.11 In irriaation, the Government has annournced a new strategy underthe 1992 Irrigation Policy based on the findings of various studies undertakenrecently.-/ The elements of the new policy are to emphasize small andmedium size farmer-managed schemes rather than large scale state-managedschemes; focus the Governments's role on irrigation management rather thanphysical investment expansion; support private sector participation in irriga-tion schemes, including turnover of suitable existing schemes to farmers,groups; and provide institutional support for irrigation management, includinggreater emphasis on O&M for irrigation schemes and on improving cost recovery.A start in implementing these policies has been made, though progress has beenslow. For example, the establishment of the Irrigation Management and WaterUtilization Division provides the Department of Irrigation (DOI) with thecapacity to address the major issues concerning irrigation development, suchas expenditure reforms, user fees, financing and monitoring O&M activities,training farmers and expanding farmer-managed schemes. The budgetary alloca-tions for O&M however still remain far below the required level. HMG wouldneed to adopt an appropriate strategy and programs to support the priority O&Mneeds of the sector and expand private sector role in irrigation management.In addition, government investment policies in irrigation need to encourageschemes that would provide water throughout the year to support intensivecultivation.
" 'Irrigation Policy", 1992, Ministry of Water Resources. There were several other studieswhich were done in the recent past and which provided inputs to this new policy. These include"Irrigation Management Project" USAID 1991. "Topics Paper on O&M Status of Selected Large ScaleIrrigation Projects" HMG, 1991. "Action Plan for Participatory Management Program" HMG, 1989."The Role of Program Budgeting in the Development of FY89 Irrigation Budget", HMG 1988.
- 6 -
1.12 Agricultural Research and Extension had been weak in the areas ofresearch planning and management, budget and financial management, personnelmanagement, and in monitoring and evaluating outreach programs. This resultedin duplication of activities and poor control over research programs. In 1992HMG adopted a project, the main thrust of which is to (i) reconstitute theNepal Agricultural Research Council (NARC) into an autonomous organizationwith a mandate to strengthen agricultural research activities; (ii) decentral-ize research programs to give more responsibilities to the regional researchstations; (iii) give more responsibilities to the regional research stationsto set research priorities in response to farmers' needs; (iv) strengthenNARC's capacity to evaluate, monitor and co-ordinate research programs; and(v) restructure and unify extension services to complement reforms in agricul-tural research. Some progress has been made im implementing measures torestructure NARC; but NARC now needs to take full advantage of the increasedautonomy to develop effective and well justified programs to achieve itsobjectives. There is also need for improving donor co-ordination, providingadequate funding and redirecting the focus of research programs to developcrop varieties that would generate high yields in combination with controlledwater supplies and adequate fertilizer. In the case of extension, efforts arebeing made to rationalize the use of existing facilities. The management anddelivery of extension services have been reorganized, and a start has beenmade in privatizing state farms and phasing out redundant field centers.However, there is scope for more private sector expansion, for example inareas, such as veterinary service delivery and in production and distributionof inputs for cereal, fisheries and horticulture.
C. Basic Macroeconomic Balances and Liberalization Policies
1.13 The evolution of Nepal's key macroeconomic balances are summarizedin Tables 1.2 and 1.3a. Caution is warranted in interpreting the officiallyestimated macroeconomic indicators. For example, the issue of the over-estimation of agricultural and overall GDP growth rates has been discussed.Other macroeconomic indicators have been similarly affected by inappropriateclassification of fiscal accounts (discussed in detail in section E). Forexample, public savings and public investment show marked deterioration whenthe official data are appropriately adjusted as indicated in the last two rowsof Table 1.2.9/ In turn, the deterioration of public savings has been accom-panied by inadequate financing for O&M activities with implications for theproductivity of investments and for growth. Notwithstanding the weaknesses ofthe national accounts estimates, they are still indicative of broad trends.Table 1.3a indicates that total resource availability for the economy declinedin the last two fiscal years. Against the background of decline in agricul-ture, exchange rate adjustments and improved pricing policies for publiclyprovided goods and services, public absorption fell by 3.5 percent of GDP.
e For example, if the data on public savings and public investments are adjusted for debtservicing, they reveal much lower investment figures shown as memo item in Table 1.2.
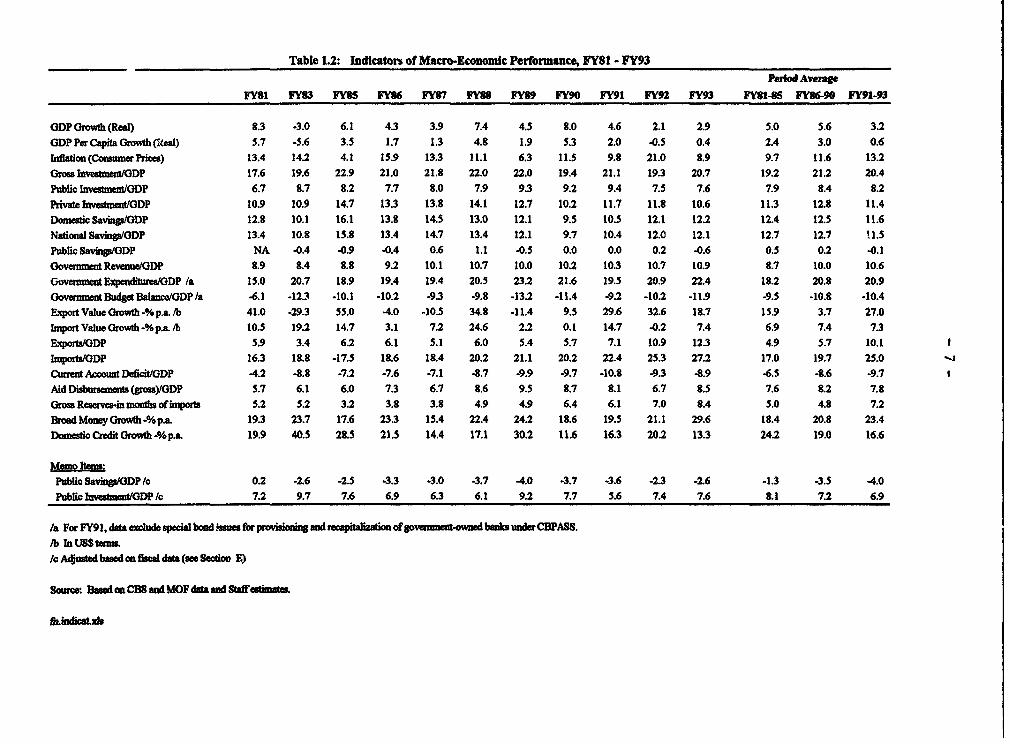
Table 1.2: Indicators of Macro-Economic Performance, FY81 - FY93Period Avrage
FY81 FY83 FY8s FY36 FY87 FY88 FY89 FY90 FY91 FY92 FY93 FYS185 FYK&90 FY91-93
GDPGrowth(Real) 8.3 .3.0 6.1 4.3 3.9 7.4 4.5 8.0 4.6 2.1 2.9 5.0 5.6 3.2GDP Per Capilt Growth (Rea1) 5.7 -5.6 3.5 1.7 1.3 4.8 1.9 5.3 2.0 .0.5 0.4 2.4 3.0 0.6hnlon(CoKmuer Pries) 13.4 14.2 4.1 15.9 13.3 11.1 6.3 11.5 9.8 21.0 8.9 9.7 11.6 13.2Gross InveltmerG/ODP 17.6 19.6 22.9 21.0 21.8 22.0 22.0 19.4 21.1 19.3 20.7 19.2 21.2 20.4Public biestmentlGDP 6.7 8.7 8.2 7.7 8.0 7.9 9.3 9.2 9.4 7.5 7.6 7.9 8.4 8.2PrivatelnvmUneut/GDP 10.9 10.9 14.7 13.3 13.8 14.1 12.7 10.2 11.7 11.8 10.6 11.3 12.8 11.4DometicSavinsGDP 12.8 10.1 16.1 13.8 14.5 13.0 12.1 9.5 10.5 12.1 12.2 12.4 12.5 11.6National Savins/GDP 13.4 10.8 15.8 13.4 14.7 13.4 12.1 9.7 10.4 12.0 12.1 12.7 12.7 11.5
Public SavinpIGDP NA -0.4 -0.9 -0.4 0.6 1.1 .0.5 0.0 0.0 0.2 -0.6 0.5 0.2 -0.1GovemmentRevenue/GDP 8.9 8.4 8.8 9.2 10.1 10.7 10.0 10.2 10.3 10.7 10.9 8.7 10.0 10.6GovernmentExpeditufe/GDP /a 15.0 20.7 18.9 19.4 19.4 20.5 23.2 21.6 19.5 20.9 22.4 18.2 20.8 20.9Governe Budget Bdan/GDP /a -6.1 -123 -10.1 -10.2 -9.3 -9.8 -13.2 -11.4 -9.2 -10.2 -11.9 -9.5 -10.8 .10.4Export ValueGrowti-%p.a. /b 41.0 -29.3 55.0 -4.0 -10.5 34.8 -11.4 9.5 29.6 32.6 18.7 15.9 3.7 27.0hnportValueGrowtb-%p.a. /b 10.5 19.2 14.7 3.1 7.2 24.6 2.2 0.1 14.7 -0.2 7.4 6.9 7.4 7.3ExpoisGDP 5.9 3.4 6.2 6.1 5.1 6.0 5.4 5.7 7.1 10.9 12.3 4.9 5.7 10.1ImportsGDP 16.3 18.8 -17.5 18.6 18.4 20.2 21.1 20.2 22.4 25.3 27.2 17.0 19.7 25.0 -aCurrent Acount Dficit/GDP -4.2 -8.8 -7.2 -7.6 -7.1 -8.7 .9.9 -9.7 -10.8 -9.3 .8.9 -6.5 -8.6 .9.7Aid Disbsenents (rYGDP 5.7 6.1 6.0 7.3 6.7 8.6 9.5 8.7 8.1 6.7 8.5 7.6 8.2 7.8Gross Reservesimontm is of impot 5.2 5.2 3.2 3.8 3.8 4.9 4.9 6.4 6.1 7.0 8.4 5.0 4.8 7.2Broad Money Growth -%p.a. 19.3 23.7 17.6 23.3 15.4 22.4 24.2 18.6 19.5 21.1 29.6 18.4 20.8 23.4Domestic Credit Growth -%p.a. 19.9 40.5 28.5 21.5 14.4 17.1 30.2 11.6 16.3 20.2 13.3 24.2 19.0 16.6
Meno Item:Public Savins/DP /c 0.2 -2.6 -2.5 -3.3 -3.0 -3.7 -4.0 -3.7 -3.6 -2.3 -2.6 .1.3 *3.5 -4.0Public IGnstme/GDPl c 7.2 9.7 7.6 6.9 6.3 6.1 9.2 7.7 5.6 7.4 7.6 8.1 7.2 6.9
/a For FY91, data exclude specid bod issues for prining nd reaiaizin f government-owned banis uner CBPASS./b InUSStem/c Adjused based on fisca dda (we Scio F.)
Source. Baeda CBS and MOF dat and Staffaestm
fiLbAdax
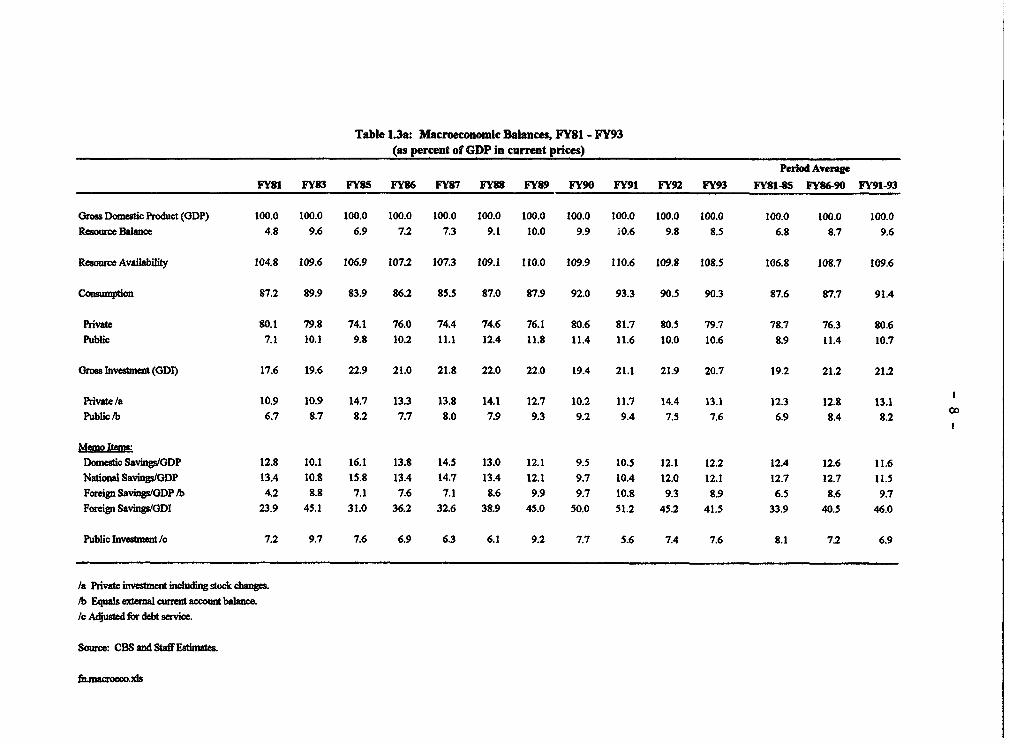
Table 1.3a: Macroeconomic Balances, FY81 - FY93(as percent of GDP in current prices)
Period AvengeFY81 FY83 FYS5 FY86 FY87 FY88 FY89 FY90 FY91 FY92 FY93 FY81 85 FYS-0 FY91-93
Gross Dmeic Product (GDP) 100.0 100.0 100.0 100.0 100.0 100.0 100.0 100.0 100.0 100.0 100.0 100.0 100.0 100.0Resource Balance 4.8 9.6 6.9 7.2 7.3 9.1 10.0 9.9 10.6 9.8 8.5 6.8 8.7 9.6
ResourceAvailability 104.8 109.6 106.9 107.2 107.3 109.1 110.0 109.9 110.6 109.8 108.5 106.8 108.7 109.6
Consumption 87.2 89.9 83.9 86.2 85.5 87.0 87.9 92.0 93.3 90.5 90.3 87.6 87.7 91.4
Private 80.1 79.8 74.1 76.0 74.4 74.6 76.1 80.6 81.7 80.5 79.7 78.7 76.3 80.6Public 7.1 10.1 9.8 10.2 11.1 12.4 11.8 11.4 11.6 10.0 10.6 8.9 11.4 10.7
Gross Inveenat (GDI) 17.6 19.6 22.9 21.0 21.8 22.0 22.0 19.4 21.1 21.9 20.7 19.2 21.2 21.2
Private/a 10.9 10.9 14.7 13.3 13.8 14.1 12.7 10.2 11.7 14.4 13.1 12.3 12.8 13.1Public Jb 6.7 8.7 8.2 7.7 8.0 7.9 9.3 9.2 9.4 7.5 7.6 6.9 8.4 8.2
Memo Items:Dotmeic SavXinsfGDP 12.8 10.1 16.1 13.8 14.5 13.0 12.1 9.5 10.5 12.1 12.2 12.4 12.6 11.6National Savings/GDP 13.4 10.8 15.8 13.4 14.7 13.4 12.1 9.7 10.4 12.0 12.1 12.7 12.7 11.5Foreign Savinp/GDP hb 4.2 8.8 7.1 7.6 7.1 8.6 9.9 9.7 10.8 9.3 8.9 6.5 8.6 9.7Foreign Savigs/ODI 23.9 45.1 31.0 36.2 32.6 38.9 45.0 50.0 51.2 45.2 41.5 33.9 40.5 46.0
Public Investment /c 7.2 9.7 7.6 6.9 6.3 6.1 9.2 7.7 5.6 7.4 7.6 8.1 7.2 6.9
/a Private i _vest including stock changes.hb Equals eamal cufent account balance./c Adjused for debt service.
Soure: CBS and StaffEstimates.
fiimacroeo0.xs
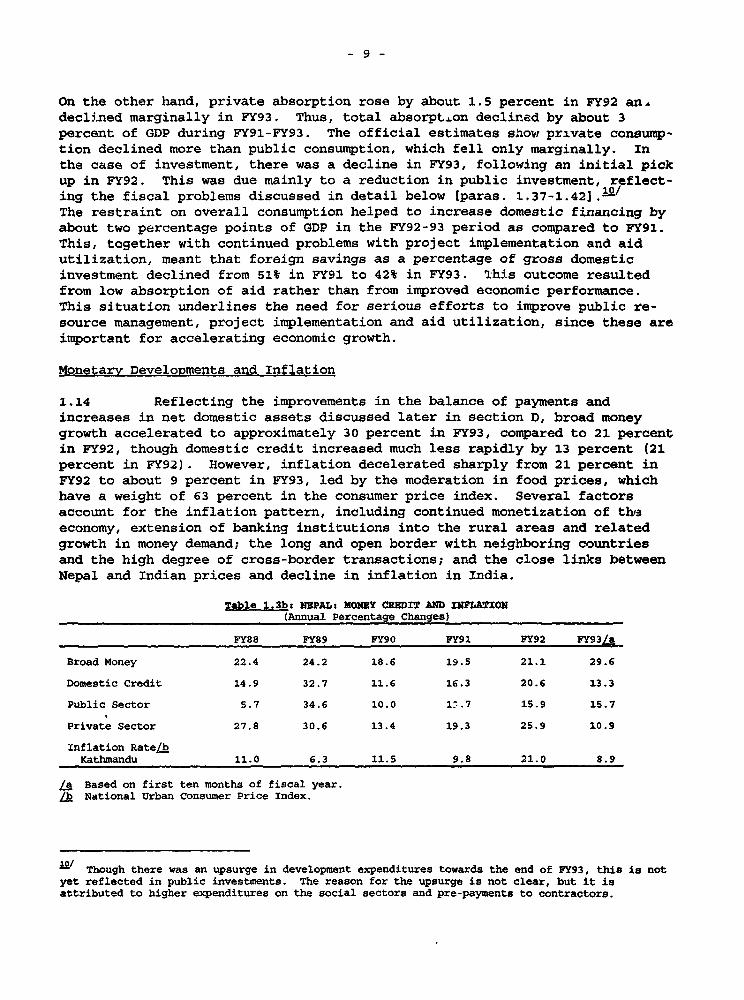
- 9 -
On the other hand, private absorption rose by about 1.5 percent in FY92 an.declined marginally in FY93. Thus, total absorpt.on declined by about 3percent of GDP during FY91-FY93. The official estimates shovw private consump-tion declined more than public consumption, which fell only marginally. Inthe case of investment, there was a decline in FY93, following an initial pickup in FY92. This was due mainly to a reduction in public investment, reflect-ing the fiscal problems discussed in detail below [paras. 1.37-1.42].1°1
The restraint on overall consumption helped to increase domestic financing byabout two percentage points of GDP in the FY92-93 period as compared to FY91.This, together with continued problems with project implementation and aidutilization, meant that foreign savings as a percentage of gross domesticinvestment declined from 51% in FY91 to 42% in FY93. This outcome resultedfrom low absorption of aid rather than from improved economic performance.This situation underlines the need for serious efforts to improve public re-source management, project implementation and aid utilization, since these areimportant for accelerating economic growth.
Monetary Developments and Inflation
1.14 Reflecting the improvements in the balance of payments andincreases in net domestic assets discussed later in section D, broad moneygrowth accelerated to approximately 30 percent in FY93, compared to 21 percentin FY92, though domestic credit increased much less rapidly by 13 percent (21percent in FY92). However, inflation decelerated sharply from 21 percent inFY92 to about 9 percent in FY93, led by the moderation in food prices, whichhave a weight of 63 percent in the consumer price index. Several factorsaccount for the inflation pattern, including continued monetization of the3economy, extension of banking institutions into the rural areas and relatedgrowth in money demand; the long and open border with neighboring countriesand the high degree of cross-border transactions; and the close links betweenNepal and Indian prices and decline in inflation in India.
Table 1.3b: NBPAL: MONEY CRBDWT AND IN1MATION(Annual Percentage Changes)
FY88 PY89 FY90 FY91 FY92 FY93/a
Broad Money 22.4 24.2 18.6 19.5 21.1 29.6
Domestic Credit 14.9 32.7 11.6 16.3 20.6 13.3
Public Sector 5.7 34.6 10.0 1^.7 1S.9 15.7
Private Sector 27.8 30.6 13.4 19.3 25.9 10.9
Inflation Rate/bKathmandu 11.0 6.3 11.5 9.8 21.0 8.9
la Based on first ten months of fiscal year./b National Urban Consumer Price Index.
I Though there was an upsurge in development expenditures towards the end of FY93, this is notyet reflected in public investments. The reason for the upsurge is not clear, but it isattributed to higher expenditures on the social sectors and pre-payments to contractors.
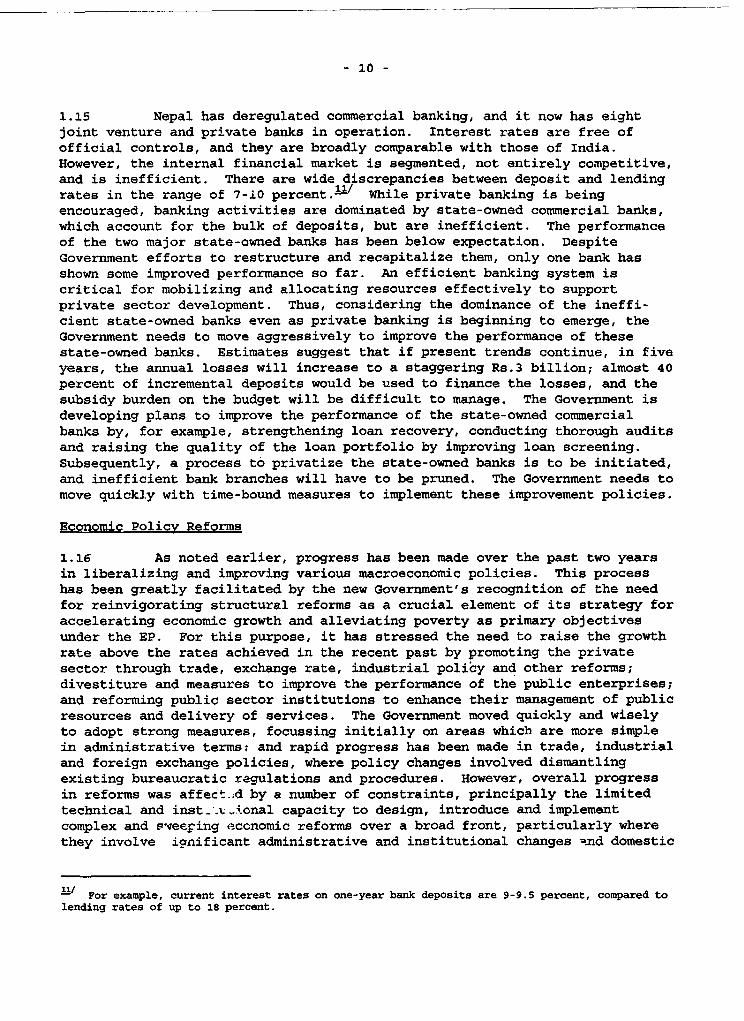
- 10 -
1.15 Nepal has deregulated commercial banking, and it now has eightjoint venture and private banks in operation. Interest rates are free ofofficial controls, and they are broadly comparable with those of India.However, the internal financial market is segmented, not entirely competitive,and is inefficient. There are wide discrepancies between deposit and lendingrates in the range of 7-10 percent.1- While private banking is beingencouraged, banking activities are dominated by state-owned commercial banks,which account for the bulk of deposits, but are inefficient. The performanceof the two major state-owned banks has been below expectation. DespiteGovernment efforts to restructure and recapitalize them, only one bank hasshown some improved performance so far. An efficient banking system iscritical for mobilizing and allocating resources effectively to supportprivate sector development. Thus, considering the dominance of the ineffi-cient state-owned banks even as private banking is beginning to emerge, theGovernment needs to move aggressively to improve the performance of thesestate-owned banks. Estimates suggest that if present trends continue, in fiveyears, the annual losses will increase to a staggering Rs.3 billion; almost 40percent of incremental deposits would be used to finance the losses, and thesubsidy burden on the budget will be difficult to manage. The Government isdeveloping plans to improve the performance of the state-owned commercialbanks by, for example, strengthening loan recovery, conducting thorough auditsand raising the quality of the loan portfolio by improving loan screening.Subsequently, a process to privatize the state-owned banks is to be initiated,and inefficient bank branches will have to be pruned. The Government needs tomove quickly with time-bound measures to implement these improvement policies.
Economic Policy Reforms
1.16 As noted earlier, progress has been made over the past two yearsin liberalizing and improving various macroeconomic policies. This processhas been greatly facilitated by the new Government's recognition of the needfor reinvigorating structural reforms as a crucial element of its strategy foraccelerating economic growth and alleviating poverty as primary objectivesunder the EP. For this purpose, it has stressed the need to raise the growthrate above the rates achieved in the recent past by promoting the privatesector through trade, exchange rate, industrial policy and other reforms;divestiture and measures to improve the performance of the public enterprises;and reforming public sector institutions to enhance their management of publicresources and delivery of services. The Government moved quickly and wiselyto adopt strong measures, focussing initially on areas whicb are more simplein administrative terms; and rapid progress has been made in trade, industrialand foreign exchange policies, where policy changes involved dismantlingexisting bureaucratic regulations and procedures. However, overall progressin reforms was affect.d by a number of constraints, principally the limitedtechnical and inst_.i..onal capacity to design, introduce and implementcomplex and s'eeping economic reforms over a broad front, particularly wherethey involve ionificant administrative and institutional changes -nd domestic
-/ For example, current interest rates on one-year bank deposits are 9-9.5 percent, compared tolending rates of up to 18 percent.
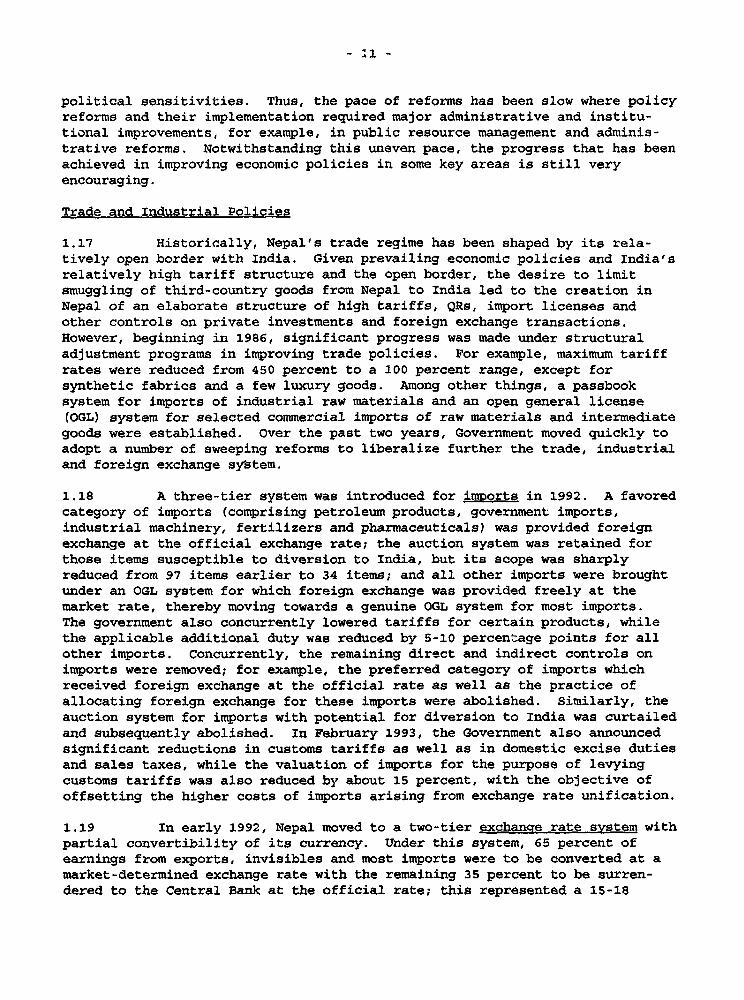
- :i. -
political sensitivities. Thus, the pace of reforms has been slow where policyreforms and their implementation required major administrative and institu-tional improvements, for example, in public resource management and adminis-trative reforms. Notwithstanding this uneven pace, the progress that has beenachieved in improving economic policies in some key areas is still veryencouraging.
Trade and Industrial Policies
1.17 Historically, Nepal's trade regime has been shaped by its rela-tively open border with India. Given prevailing economic policies and India'srelatively high tariff structure and the open border, the desire to limitsmuggling of third-country goods from Nepal to India led to the creation inNepal of an elaborate structure of high tariffs, QRs, import licenses andother controls on private investments and foreign exchange transactions.However, beginning in 1986, significant progress was made under structuraladjustment programs in improving trade policies. For example, maximum tariffrates were reduced from 450 percent to a 100 percent range, except forsynthetic fabrics and a few luxury goods. Among other things, a passbooksystem for imports of industrial raw materials and an open general license(OGL) system for selected commercial imports of raw materials and intermediategoods were established. Over the past two years, Government moved quickly toadopt a number of sweeping reforms to liberalize further the trade, industrialand foreign exchange system.
1.18 A three-tier system was introduced for imports in 1992. A favoredcategory of imports (comprising petroleum products, government imports,industrial machinery, fertilizers and pharmaceuticals) was provided foreignexchange at the official exchange rate; the auction system was retained forthose items susceptible to diversion to India, but its scope was sharplyreduced from 97 items earlier to 34 items; and all other imports were broughtunder an OGL system for which foreign exchange was provided freely at themarket rate, thereby moving towards a genuine OGL system for most imports.The government also concurrently lowered tariffs for certain products, whilethe applicable additional duty was reduced by 5-10 percentage points for allother imports. Concurrently, the remaining direct and indirect controls onimports were removed; for example, the preferred category of imports whichreceived foreign exchange at the official rate as well as the practice ofallocating foreign exchange for these imports were abolished. Similarly, theauction system for imports with potential for diversion to India was curtailedand subsequently abolished. In February 1993, the Government also announcedsignificant reductions in customs tariffs as well as in domestic excise dutiesand sales taxes, while the valuation of imports for the purpose of levyingcustoms tariffs was also reduced by about 15 percent, with the objective ofoffsetting the higher costs of imports arising from exchange rate unification.
1.19 In early 1992, Nepal moved to a two-tier exchange rate system withpartial convertibility of its currency. Under this system, 65 percent ofearnings from exports, invisibles and most imports were to be converted at amarket-determined exchange rate with the remaining 35 percent to be surren-dered to the Central Bank at the official rate; this represented a 1S-18
- 12 -
percent depreciation vis-a-vis the official exchange rate. In February 1993,Nepal introduced further reforms in its exchange rate policies and moved tofull convertibility for all current account transactions. The exchange ratewas unified by abolishing the dual exchange rate system; it became fullymarket-determined and became the basis for all current account transactions.
1.20 As a result of these changes, Nepal progressed rapidly fromhighly distorted external trade and payments system to a liberal import regimewith full convertibility of its currency on the current account in a relative-ly short period. During this period (end-1989 to mid-1993) the real effectiveexchange rate was depreciated by about 20 percent vis-a-vis the US dollar,providing a strong incentive for exports. Commendable as this performancewas, it entailed some fiscal costs. The abolition of the auction and theaccompanying tariff reforms had adverse fiscal consequences in terms ofrevenue losses in an already weak fiscal structure with more or less stagnantrevenue to GDP ratio. Moreover, given the weak tax administration capacity,the effective incidence of customs duties as a proportion of dutiable importsdeclined from about 20 percent in late eighties to below 10 percent in FY93;and this has been an important factor contributing to Nepal's poor revenueperformance in the recent past. While continued tariff reductions areimportant, this has be to viewed in the context of the administrative capacityto overhaul the tax system to compensate for revenue losses related to tradeand industrial policy reforms. Thus, a restructuring of the tax system isimportant for recovering revenue erosion.
1.21 In regard to indr.trial Policies, a number of steps have beentaken recently to (i) deregulate controls crer industrial investment licens-ing, (ii) encourage foreign investment and technology transfer and (iii)privatize selected public enterprises and enhance the efficiency of theremaining PEs through improved pricing policies and abolition of Governmentguaranteed credit. In early 1992, a new industrial policy was announced. Thenew policy relaxed investment licensing requirements, which were eliminatedexcept for a list of industries which will continue to require licensing for"security, health and environment" reasons. It seeks to promote industrieswhich use domestic resources, create employment opportunities in the rural ar-eas, contribute to regional balance and remote area development and which areconsidered national priorities. A detailed list of 31 national priorityindustries which would be accorded special promotional support was identified,together with a complex system of incentives to promote these industries,particularly through tax holidays. / New institutional arrangements forpromoting industrial development were also announced, most notably the estab-lishment of a "one window" system to provide all government services todomestic and foreign investors through a single institution. In addition, anumber of other government agencies, including an Industrial Promotion Board,
IV Thus, all exports were to be exempt from all sales, excise and income taxes without any timelimitation; while cottage industries and industries using 90r or more of domestic raw materialswere to be exempt from all sales and excise taxes and from income taxes for 5 years. Similarly,tax exemptions and investment allowances in varying degrees were to be provided for varying timeperiods to other industries, depending on their regional location, extent of employmentgeneration, reinvestment policies, and whether they are national priority industries etc.
- 13 -
Industrial Policy and Research Unit and an Industrial Manpower and Produc-tivity Council were set up to facilitate industrial development. To encourageforeiQn investment and technology transfer, the Government subsequentlyenacted a Foreign Investment and Technology Transfer Act, which (i) effective-ly opened up for foreign investment all industries with a fixed investment ofmore than Rs.20 million, except those related to defence, tobacco and alcoholand all cottage industries; (ii) clearly specified terms and conditions forrepatriation of profits by foreign investors; (iii) provided assurancesagainst expropriation of foreign investments by the state; and (iv) opened uphydropower development for both domestic and foreign investors.
1.22 These reforms represent a significant improvement over therestrictive industrial policies which were in force until recently. Official-ly, most industries now require simple registration, rather than approval,which is supposed to be provided within 30 days of application. However, theGovernment still seeks to guide investments into preferred areas and indus-tries through a complicated system of fiscal incentives, such as tax holidaysand investment allowances, which stand to create major disparities in theincentive regime for various industries. The relative ineffectiveness ofpublic sector institutions raises questions about the desirability of theapproach. Future reforms need to be directed at further reducing governmentinterventions in investment choices. This is specially important since, giventhe small size of the Nepalese market and continued opening up of neighboringeconomies, Neralese industry needs to be able to take advantage of emergingmarket opportunities. Moreover, this approach is not fiscally sustainable, asNepal cannot continue to provide wide-ranging fiscal incentives to promoteindustrial development without severely eroding its limited revenue base.Experience in many countries has shown that fiscal incentives have had verylittle impact on guiding industrial activity into preferred areas to achievespatial balance in development. Finally, while the new policy provideswelcome signals to foreign investors, especially with regard to foreignownership and guidelines for foreign participation, the extent to which thesewill succeed in attracting foreign investment will depend on its ability toprovide a competitive and stable environment over the longer term. For thispurpose, Nepal needs to invest in (i) human resources to develop an educatedand skilled labor force; (ii) adequate power and transport facilities; and(iii) in maintaining a policy environment free of bureaucratic and admin-istrative impediments.
Public Enterprise Reform
1.23 Until the late eighties, development strategy accorded highpriority to Public Enterprises (PEs) as instruments for production and forcarrying out socio-economic policies in Nepal. Sixty two PEs were set up bythe state over the past two decades in utilities, transport, manufacturing,trading and the financial institutions. Many of these enterprises havesuffered from a variety of problems and handicaps: their output pricing andinternal management decisions have been generally controlled by the govern-ment. Some suffer from over-staffing, poor financial management, operationalinefficiencies and interventionist policies. Moreover, in recent years theproblems of the PEs were exLcerbated by pressures to generate employment and
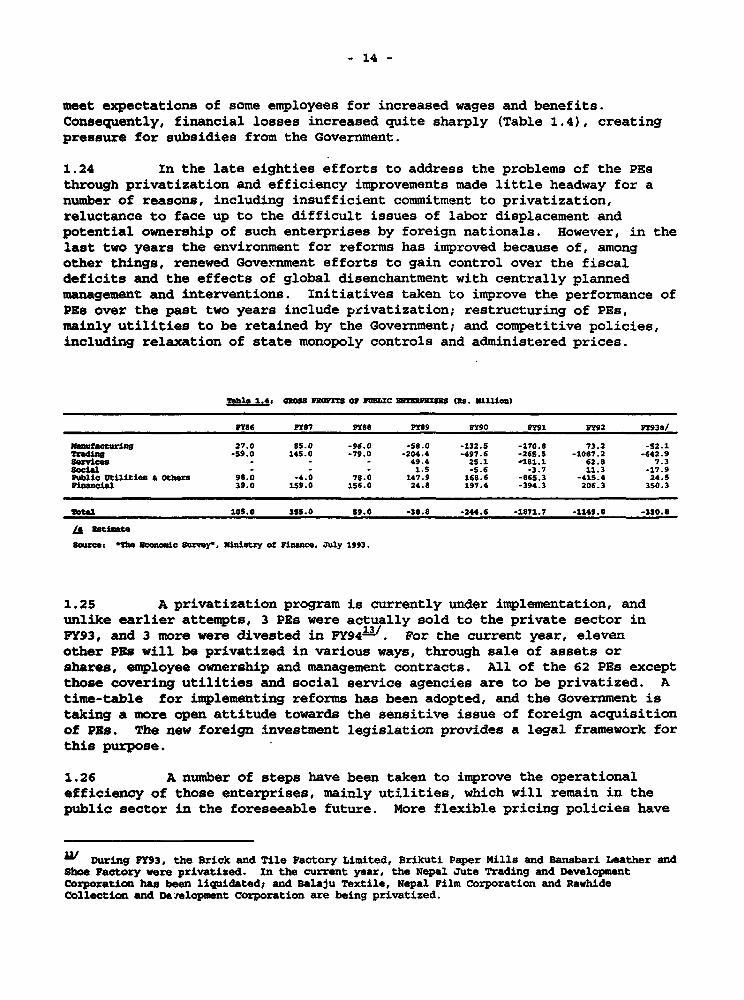
- 14 -
meet expectations of some employees for increased wages and benefits.Consequently, financial losses increased quite sharply (Table 1.4), creatingpressure for subsidies from the Government.
1.24 In the late eighties efforts to address the problems of the PEsthrough privatization and efficiency improvements made little headway for anumber of reasons, including insufficient commitment to privatization,reluctance to face up to the difficult issues of labor displacement andpotential ownership of such enterprises by foreign nationals. However, in thelast two years the environment for reforms has improved because of, amongother things, renewed Government efforts to gain control over the fiscaldeficits and the effects of global disenchantment with centrally plannedmanagement and interventions. Initiatives taken to improve the performance ofPEs over the past two years include privatization; restructuring of PEs,mainly utilities to be retained by the Government; and competitive policies,including relaxation of state monopoly controls and administered prices.
Table 1.41 GlOS Map=1 3Or 12C MERFTUMSI (Re. hUbs)
n6s FY87 FY88 Fm9 PfY90 PY1 FY92 FY93M /
Manntscturing 27.0 55.0 -9C.0 -58.0 -132.5 -170.8 73.2 -52.1trading -59.0 145.0 -79.0 -204 .4 -497 .6 -265.5 -1087 .2 -642.9SVi - - - 49.4 25.1 '181.1 62.8 7.3social - - - 1.5 -S.6 -3.7 11.3 -17.9Public utilitie Others 98.0 -4.0 78.0 147.9 168.C -865.3 -415.4 24.5Financial 39.0 159.0 156.0 24.8 197.4 -394.3 206.3 350.3
tot_ 105.0 359.0 59.0 -38.8 -244.6 -1871.7 -1149.0 -330.8
LA IstimbaSouxce: T1ha Zccnomic Survey' Ministry Of Finace, Jily 1993.
1.25 A privatization program is currently under implementation, andunlike earlier attempts, 3 PEs were actually sold to the private sector inFY93, and 3 more were divested in FY94 -3. For the current year, elevenother PBs will be privatized in various ways, through sale of assets orshares, employee ownership and management contracts. All of the 62 PEs exceptthose covering utilities and social service agencies are to be privatized. Atime-table for implementing reforms has been adopted, and the Government istaking a more open attitude towards the sensitive issue of foreign acquisitionof PBs. The new foreign investment legislation provides a legal framework forthis purpose.
1.26 A number of steps have been taken to improve the operationalefficiency of those enterprises, mainly utilities, which will remain in thepublic sector in the foreseeable future. More flexible pricing policies have
a/ During FY93, the Brick and Tile Factory Limited, Brikuti Paper Mills and Bansbari Leather andShoe Factory were privatized. In the current year, the Nepal Jute Trading and DevelopmentCorporation has been liquidated; and Balaju Textile, Nepal Film corporation and Rawhidecollection and De7elopment Corporation are being privatized.
- 15 -
been introduced and prices adjusted. For example, electricity tariffs wereraised by an average of 60 percent in 1991, 24 percent in March 1993 and by 38percent effective in March 1994; water tariffs were raised by 100 percent ineach of 1991 and 1993; petroleum prices were raised by 13 percent in August1992 and by 2-5 percent in early 1993, and subsidies were virtually eliminatedfor all types of fertilizers other than urea. Urea policy is currently in astate of flux with Indian prices, which influence Nepal prices, still belowcost prices and subject to varying policies being pursued by the central andstate Governments in India. Ultimately, Nepal has to raise the urea price toimprove supplies and foster private sector role in Import and distribution.In a number of cases, a process of restructuring and shedding of surplus staffhas commenced, for example in the Oil Corporation, Agricultural DevelopmentBank and NEA. Finally, to encourage greater financial discipline and commer-cial orientation, the Government has terminated the practice of guaranteedcommercial credit which had helped PEs cover their operational losses, andlending to PBs actually declined by some Rs.400 million in FY93.
1.27 These measures have helped to bring about some improvements in thefinancial position of PEs. As indicated in Table 1.4, the financial positionof P8s had deteriorated particularly sharply in FY91, due to large lossesincurred by NEA, NOC, AIC (on fertilizer subsidies) and NFC (on food opera-tions). Recent price adjustments have helped NEA and NOC to cover theiroperating losses in FY93, while the fertilizer and food subsidies were alsoreduced. Yet, PBs barely break even or still remain unprofitable. Many PEsstill suffer from over-staffing, government supervision in operational andmanagement decisions, and a management culture which continues to look to thegovernment for guidance. There is, however, evidence that this dependence ischanging and needs to be encouraged by reducing government interventions inpricing and management decisions even further. The creation of a publicutilities commission was expected to contribute to this end by delinkingpricing decisions from political considerations, but this has not happened sofar. Serious commitment, through technical preparation and careful balancingof concerns of potential labor displacement with the need for operationalflexibility on the part of new private owners will be essential for thesuccessful implementation of the PB reform program.
1.28 Apart from the policy reforms mentioned above, the Government hastaken a number of steps to encourage private investment in sectors which havebeen public monopolies until recently. These include air transport, electric-ity generation and distribution, and fertilizer import and distribution. Inaddition, the Government's recently formulated BP places considerable emphasison increased private participation to expand and improve the quality andcoverage of services presently provided by public sector agencies in suchareas as health, education, agriculture and irrigation management, etc. Theprivate sector's response to these initiatives has been very encouraging insome areas. For example, the opening up of domestic air transport to privateinvestment has been a major success; a number of smaller private operators arenow competing vigorously with the publicly-owned Royal Nepal Airlines, and thequality and frequency of domestic air services have improved. Similarly,there is considerable private investment interest in smaller power generationplants as well as in power distribution. Also, in other areas, such as
- 16 -
fertilizer imports, irrigation management, educational and health services,private sector involvement is emerging gradually. Government practices and,regulations in these areas need to be improved significantly in order toensure that the private sector can play an important role.
D. Balance of Paymento Develo=ments and the External Environment
Balance of Payments Develonments
1.29 Historically, Nepal's balance of payments has been an area ofmajor structural weakness with exports financing only a small fraction ofimports, resulting in heavy dependence on external assistance to financeessential imports. Moreover, given the country's land-locked location,Nepal's trade with countries other than India was limited.14/ The vulnera-bility of the economy to the vagaries of the weather further accentuated thefragility of the external payments position. In the late eighties, therefore,considerable efforts were made to improve external trade and exchange ratepolicies to increase exports and diversify the geographical pattern of tradewith limited success.
1.30 Over the past two to three years, major progress has been made inthis regard in a number of areas. Exports have grown rapidly in dollar terms;and this, combined with sluggish imports and large unrequited capital inflows,contributed to a strong balance of payments position (Table 1.5). Nepal'scurrent account deficit declined by $91 million to $263 million over the pasttwo years. The current account deficit as a percentage of GDP declined fromnearly 10.8 percent in FY91 to 8.9 percent in FY93. Aid inflows covered alarge part of this deficit, although gross aid disbursements have remainedbelow the peak levels achieved in the FY89-91 period, because of continuingproblems with fiscal management and project implementation. In addition, thebalance of payments benefitted over the past few years by approximately $160million a year of miscellaneous capital inflows. While there is no adequatedata to explain these inflows, they are generally believed to reflect under-recording of cross-border trFC nd, perhaps, aid inflows which do not passthrough the fiscal accounts. consequently, Nepal's gross foreign exchangereserves have continued to rise rapidly to the rather comfortable level of$706 million, equivalent to over 8 months' imports of goods and services.
W In the early eighties, trade with India accounted for more than half of Nepal's trade flows(Table 1.8).
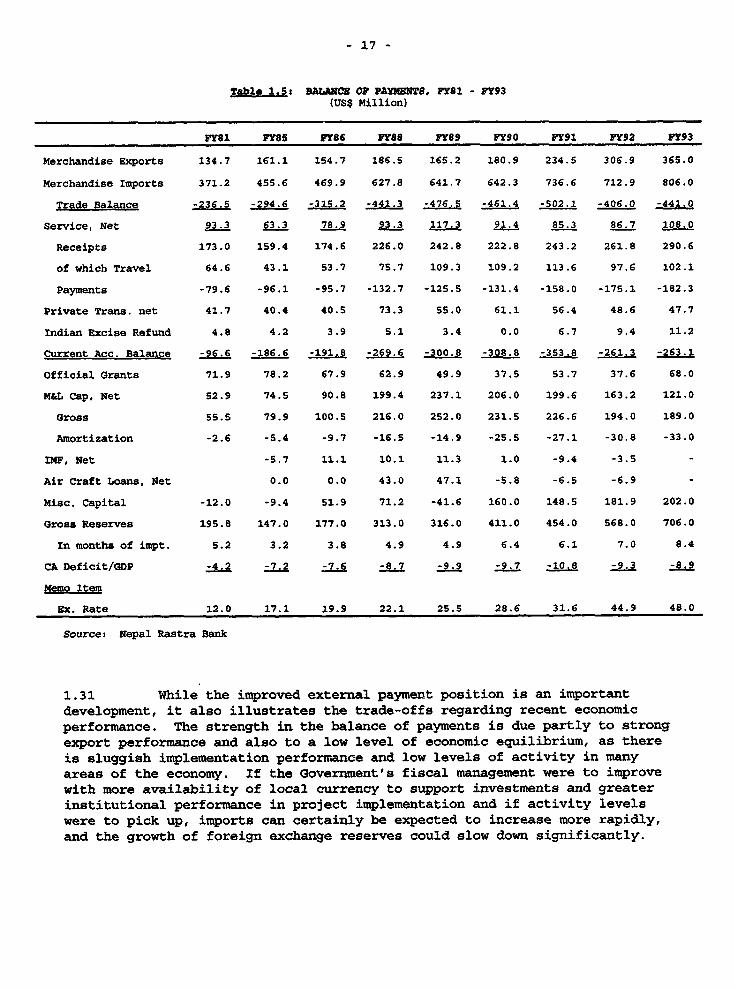
- 17 -
Table 1.5: DAUANCB OF PAYMTS, FY81 - FY93(US$ Million)
FY81 PY8S FY86 FY88 FY89 FY90 FY91 FY92 FY93
Merchandise Exports 134.7 161.1 154.7 186.5 165.2 180.9 234.5 306.9 365.0
Merchandise Imports 371.2 455.6 469.9 627.8 641.7 642.3 736.6 712.9 806.0
Trade Balance -236.5 -294.6 -315.2 -441.3 -476.5 -461.4 -S02.l -406.0 -441.0
Service, Net 93.3 63.3 78.9 93.3 117.3 91.4 85.3 86.7 108.0
Receipts 173.0 159.4 174.6 226.0 242.8 222.8 243.2 261.8 290.6
of which Travel 64.6 43.1 53.7 75.7 109.3 109.2 113.6 97.6 102.1
Payments -79.6 -96.1 -95.7 -132.7 -125.5 -131.4 -158.0 -175.1 -182.3
Private Trans. net 41.7 40.4 40.5 73.3 55.0 61.1 56.4 48.6 47.7
Indian Excise Refund 4.8 4.2 3.9 S.1 3.4 0.0 6.7 9.4 11.2
Current Acc. Balance -96.6 -186.6 -191.8 -269.6 -300.8 -308.8 -353.8 -261.3 -263.1
Official Grants 71.9 78.2 67.9 62.9 49.9 37.5 53.7 37.6 68.0
M&L Cap, Net 52.9 74.5 90.8 199.4 237.1 206.0 199.6 163.2 121.0
Gross 55.S 79.9 100.5 216.0 252.0 231.5 226.6 194.0 189.0
Amortization -2.6 -5.4 -9.7 -16.5 -14.9 -25.5 -27.1 -30.8 -33.0
IMF, Net -5.7 11.1 10.1 11.3 1.0 -9.4 -3.5 -
Air Craft Loans, Net 0.0 0.0 43.0 47.1 -5.8 -6.5 -6.9 -
Misc. Capital -12.0 -9.4 51.9 71.2 -41.6 160.0 148.5 181.9 202.0
Gross Reserves 195.8 147.0 177.0 313.0 316.0 411.0 454.0 568.0 706.0
In months of impt. 5.2 3.2 3.8 4.9 4.9 6.4 6.1 7.0 8.4
CA Deficit/GDP -4.2 -7.2 -7.6 -8.7 -9.9 -9.7 -10.8 -9.3 -8.9
Memo ltem
Ex. Rate 12.0 17.1 19.9 22.1 25.5 28.6 31.6 44.9 48.0
Source: Nepal Rastra Bank
1.31 While the improved external payment position is an importantdevelopment, it also illustrates the trade-offs regarding recent economicperformance. The strength in the balance of payments is due partly to strongexport performance and also to a low level of economic equilibrium, as thereis sluggish implementation performance and low levels of activity in manyareas of the economy. If the Government's fiscal management were to improvewith more availability of local currency to support investments and greaterinstitutional performance in project implementation and if activity levelswere to pick up, imports can certainly be expected to increase more rapidly,and the growth of foreign exchange reserves could slow down significantly.
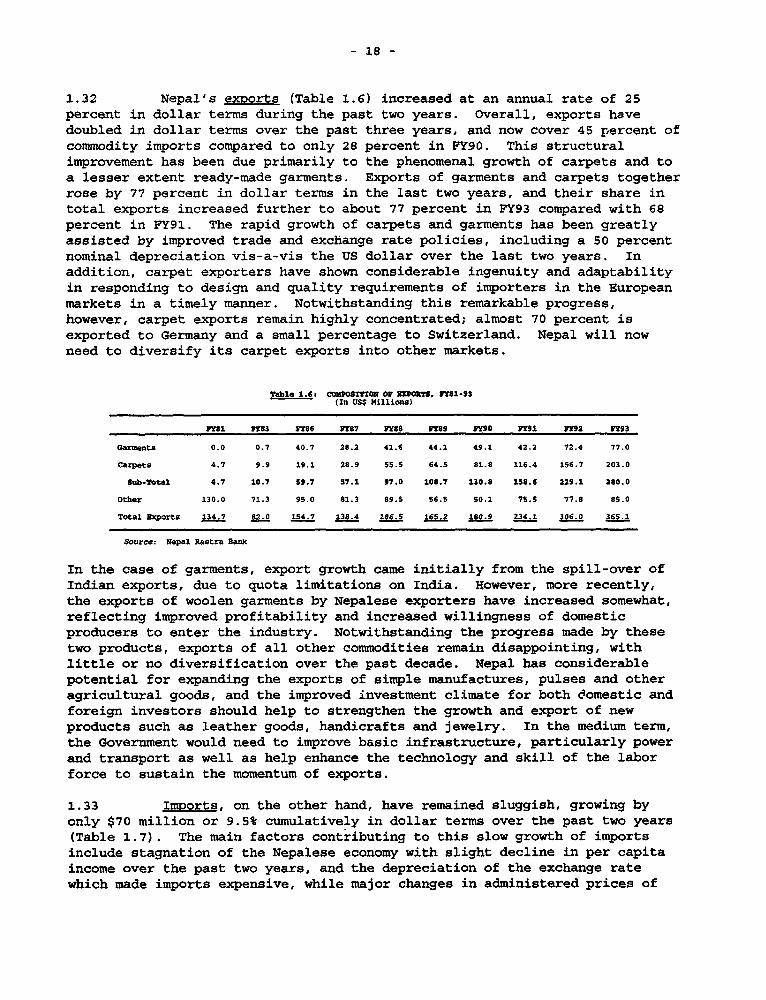
- 18 -
1.32 Nepal's exrorts (Table 1.6) increased at an annual rate of 25percent in dollar terms during the past two years. Overall, exports havedoubled in dollar terms over the past three years, and now cover 45 percent ofcommodity imports compared to only 28 percent in FY90. This structuralimprovement has been due primarily to the phenomenal growth of carpets and toa lesser extent ready-made garments. Exports of garments and carpets togetherrose by 77 percent in dollar terms in the last two years, and their share intotal exports increased further to about 77 percent in FY93 compared with 68percent in FY91. The rapid growth of carpets and garments has been greatlyassisted by improved trade and exchange rate policies, including a 50 percentnominal depreciation vis-a-vis the US dollar over the last two years. Inaddition, carpet exporters have shown considerable ingenuity and adaptabilityin responding to design and quality requirements of importers in the Europeanmarkets in a timely manner. Notwithstanding this remarkable progress,however, carpet exports remain highly concentrated; almost 70 percent isexported to Germany and a small percentage to Switzerland. Nepal will nowneed to diversify its carpet exports into other markets.
Table 1.6s 0081O?SIN OF IPOITS, ml-S3(In uSs millions)
FY81 F83 FY86 M7 me8 mg M0 Y91 F2 M3
Garments 0.0 0.7 40.7 28.2 41.6 44.1 49.1 42.2 72.4 77.0
Carpets 4.7 9.9 19.1 28.9 SS.S 64.5 81.8 116.4 156.7 203.0
s-ubYtosi 4.7 10.7 59.7 57.1 97.0 108.7 130.8 158.6 229.1 280.0
Other 130.0 71.3 95.0 81.3 89.5 56.5 50.1 75.5 77.8 85.0
Total Exports 134.7 82.0 154.7 1238.4 186.5 165.2 180.9 234.1 306.0 365.1
Source: Nepal Rastra Bank
In the case of garments, export growth came initially from the spill-over ofIndian exports, due to quota limitations on India. However, more recently,the exports of woolen garments by Nepalese exporters have increased somewhat,reflecting improved profitability and increased willingness of domesticproducers to enter the industry. Notwithstanding the progress made by thesetwo products, exports of all other commodities remain disappointing, withlittle or no diversification over the past decade. Nepal has considerablepotential for expanding the exports of simple manufactures, pulses and otheragricultural goods, and the improved investment climate for both domestic andforeign investors should help to strengthen the growth and export of newproducts such as leather goods, handicrafts and jewelry. In the medium term,the Government would need to improve basic infrastructure, particularly powerand transport as well as help enhance the technology and skill of the laborforce to sustain the momentum of exports.
1.33 Import , on the other hand, have remained sluggish, growing byonly $70 million or 9.5* cumulatively in dollar terms over the past two years(Table 1.7). The main factors contributing to this slow growth of importsinclude stagnation of the Nepalese economy with slight decline in per capitaincome over the past two years, and the depreciation of the exchange ratewhich made imports expensive, while major changes in administered prices of
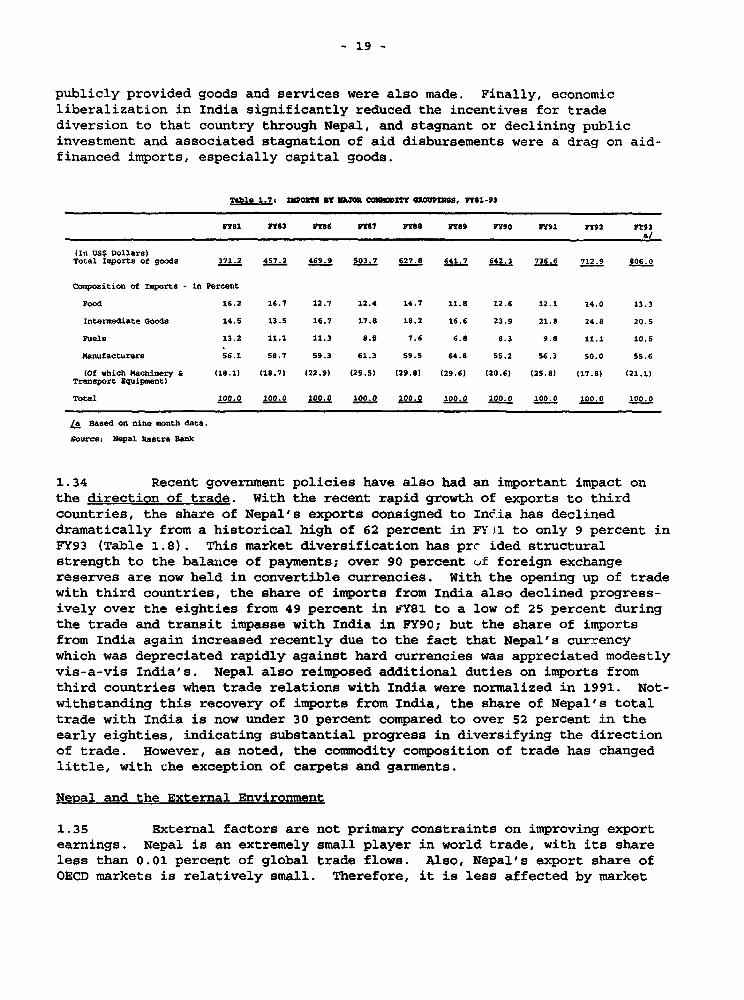
- 19 -
publicly provided goods and services were also made. Finally, economicliberalization in India significantly reduced the incentives for tradediversion to that country through Nepal, and stagnant or declining publicinvestment and associated stagnation of aid disbursements were a drag on aid-financed imports, especially capital goods.
Table 1.7? 130 IIY ?JOa coMoTm GIOUIWS, Y318-93
18l 11Y83 pu8 87 Ms88 Ms 190 m19l FY92 MY3
(In US$ Dollars)Total Imports of goods 371.2 457.2 469.9 503.7 627 8 641.7 642.3 736.6 712.9 806.0
Composition of Imports - in Percent
Food 16.2 16.7 12.7 12.4 14.7 11.8 12.6 12.1 14.0 13.3
Intermediate Goods 14.5 13.5 16.7 17.8 18.2 16.6 23.9 21.8 24.8 20.5
Fuels 13.2 11.1 11.3 8.5 7.6 6.8 8.3 9.8 11.1 10.5
Manufacturers 56.1 50.7 59.3 61.3 59.5 64.8 55.2 56.3 SO.0 55.6
(Of which Machinery & (18.1) (18.7) (22.9) (25.5) (29.8) (29.6) (20.6) (25.8) (17.8) (21.1)Transport Equipment)
Total 100.0 100.0 100.0 100.0 100.0 100.0 100.0 100.0 100.0 100.0
/a Based on nine month data.
Source. Nepal kastra Bank
1.34 Recent government policies have also had an important impact onthe direction of trade. With the recent rapid growth of exports to thirdcountries, the share of Nepal's exports consigned to Incia has declineddramatically from a historical high of 62 percent in FYJ1 to only 9 percent inFY93 (Table 1.8). This market diversification has prc ided structuralstrength to the balance of payments; over 90 percent of foreign exchangereserves are now held in convertible currencies. With the opening up of tradewith third countries, the share of imports from India also declined progress-ively over the eighties from 49 percent in FY8 to a low of 25 percent duringthe trade and transit impasse with India in FY90; but the share of importsfrom India again increased recently due to the fact that Nepal's currencywhich was depreciated rapidly against hard currencies was appreciated modestlyvis-a-vis India's. Nepal also reimposed additional duties on imports fromthird countries when trade relations with India were normalized in 1991. Not-withstanding this recovery of imports from India, the share of Nepal's totaltrade with India is now under 30 percent compared to over 52 percent in theearly eighties, indicating substantial progress in diversifying the directionof trade. However, as noted, the commodity composition of trade has changedlittle, with che exception of carpets and garments.
Nenal and the External Environment
1.35 External factors are not primary constraints on improving exportearnings. Nepal is an extremely small player in world trade, with its shareless than 0.01 percent of global trade flows. Also, Nepal's export share ofOECD markets is relatively small. Therefore, it is less affected by market
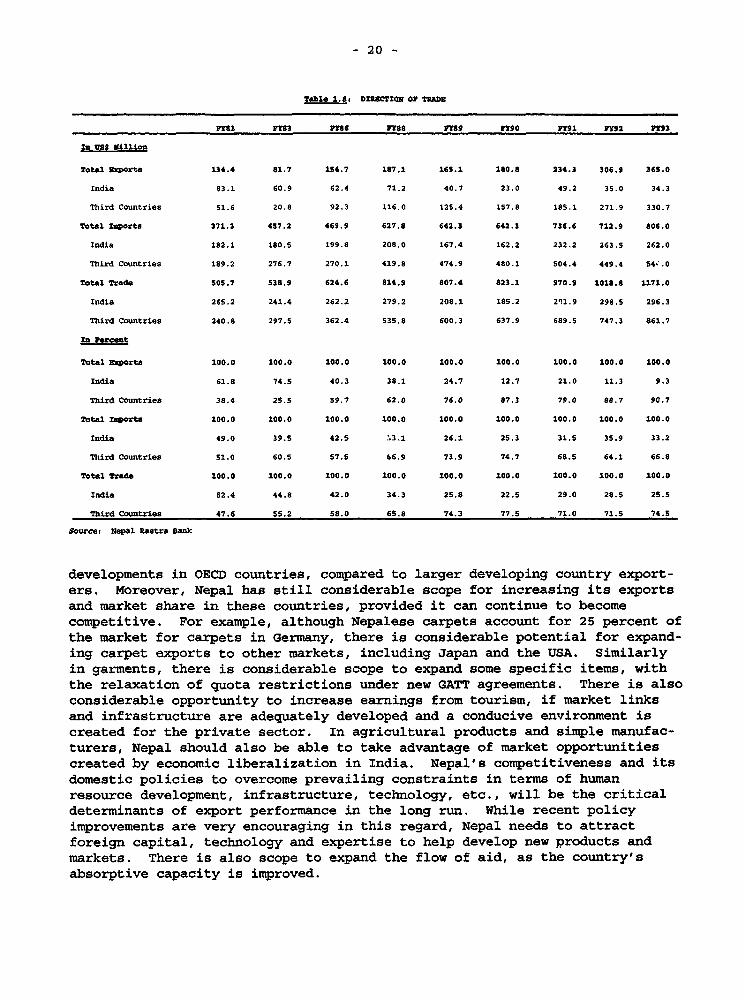
- 20 -
Table 1.8t DZIECTION OF TRADE
rr81 FY83 FT86 FY88 FY9 mo FPY91 m2 m3
In IJ8S Million
Total Xcports 134.4 81.7 154.7 187.1 165.1 180.8 234.3 306.9 365.0
India 83.1 60.9 62.4 71.2 40.7 23.0 49.2 35.0 34.3
Third Countries 51.6 20.8 92.3 116.0 125.4 157.8 185.1 271.9 330.7
Total Imports 371.3 457.2 469.9 627.8 642.3 642.3 736.6 712.9 806.0
India 182.1 180.5 199.8 208.0 167.4 162.2 232.2 263.5 262.0
Third Countries 189.2 276.7 270.1 419.8 474.9 480.1 504.4 449.4 s4;.0
Total Trade 505.7 538.9 624.6 814.9 807.4 823.1 970.9 1018.8 1171.0
India 265.2 241.4 262.2 279.2 208.1 185.2 2q1.9 298.5 296.3
Third Countries 240.8 297.5 362.4 535.8 600.3 637.9 689.5 747.3 861.7
in Percent
Total Exports 100.0 100.0 100.0 100.0 100.0 100.0 100.0 100.0 100.0
India 61.8 74.5 40.3 38.1 24.7 12.7 21.0 11.3 9.3
Third Countries 38.4 25.5 59.7 62,0 76.0 87.3 79.0 88.7 90.7
Total Mort 100.0 100.0 100.0 100.0 100.0 100.0 100.0 100.0 100.0
India 49.0 39.5 42.5 ;3.1 26.1 25.3 31.5 35.9 33.2
Third Countries S1.0 60.5 57.5 66.9 73.9 74.7 68.5 64.1 66.8
Total Trade 100.0 100.0 100.0 100.0 100.0 100.0 100.0 100.0 100.0
India 52.4 44.8 42.0 34.3 25.8 22.5 29.0 28.5 25.5
Third Countries 47.6 55.2 58.0 65.8 74.3 77.5 71.0 71.5 74.5
Source: Nepal Rastra Bank
developments in OECD countries, compared to larger developing country export-ers. Moreover, Nepal has still considerable scope for increasing its exportsand market share in these countries, provided it can continue to becomecompetitive. For example, although Nepalese carpets account for 25 percent ofthe market for carpets in Germany, there is considerable potential for expand-ing carpet exports to other markets, including Japan and the USA. Similarlyin garments, there is considerable scope to expand some specific items, withthe relaxation of quota restrictions under new GATT agreements. There is alsoconsiderable opportunity to increase earnings from tourism, if market linksand infrastructure are adequately developed and a conducive environment iscreated for the private sector. In agricultural products and simple manufac-turers, Nepal should also be able to take advantage of market opportunitiescreated by economic liberalization in India. Nepal's competitiveness and itsdomestic policies to overcome prevailing constraints in terms of humanresource development, infrastructure, technology, etc., will be the criticaldeterminants of export performance in the long run. While recent policyimprovements are very encouraging in this regard, Nepal needs to attractforeign capital, technology and expertise to help develop new products andmarkets. There is also scope to expand the flow of aid, as the country'sabsorptive capacity is improved.
- 21 -
1.36 There are, however, some external risks which could affect theeconomy adversely. For example, continued slow growth in Germany over asignificant period could affect carpet exports; and since private investmentin carpet industry in Nepal is expanding rapidly this could lead to losses andcrises of private sector confidence. Third, slow growth in OECD countries andin India would affect tourist earnings. Fourth, if the price of petroleumproducts were to increase sharply, the country's import costs would increase,though the immediate impact of such an increase would be delayed and temperedsomewhat by the special trading arrangements with India. Finally and moreimportantly, reduction in aid donors' budgets and new demands from newborrowers, such as the former states of the Soviet Republic, could limit theflow of concessional funds. Given Nepal's heavy dependence on externalassistance, this would seriously undermine fiscal management, the externalpayments position and the overall momentum of development. However, thelikelihood of these events and their impact cannot be determined exactly.
E. Public Resource Manaaement Issues
1.37 Unlike the Government's performance in economic liberalization andthe promotion of private sector devel pment, fiscal and public resourcemanagement has remained difficult and needs to be addressed with urgency inorder to provide the public investments necessary to complement private sectoractivities being fostered by the liberalization efforts. The Government'sefforts to improve fiscal management and enhance the efficiency of publicresources are yet to show desired results; the fiscal structure has remainedweak, and the situation deteriorated in FY92 and FY93>/. Expenditures a;-*over-extended, and tax effort is low relative to potential as well as tocomparable developing countries. For example, in the past decade, FY81-FY90,expenditures rose by an average 0.73 percent of GDP a year, compared to 0.14for revenues; and revenues were equivalent to 10.4 percent of GDP in FY93, adeclined from 10.7 in FY88. Table 1.9 and Charts l.la and l.lb show thegeneral pattern of expanding expenditures relative to stagnant revenues.Historically, the expenditure growth evolved from the sixties under variousplans aimed at promoting economic growth and development. While some of theseexpenditures contributed to development, including improved school enrollmentsand other social services as well as road transport investments, most programsgenerated meager results and had limited impact on growth or internal resourcemobilization. Thus, the fiscal situation has become characterized by variousdifficulties. The low revenue effort and rising expenditures have erodedpublic savings; there has been no savings on revenues to support new projectsand sustain completed investments since the early eighties. The growingdependence on external aid as a major source of development financing reflectsthe inability of the Government to raise local resources, but the constraints
s/ Some of the public resource management issues were discussed in the previous EconomicReports. See, for example, the 1992 Country Economic Memorandum entitled "Nepal: Public ResourceManagement in A Resource-Scarce Economyu. Report No 10324-NEP. The situation has not improved,however, and is being exacerbated by revenue erosion from tariff reforms and the EFYP expenditureobjectives.
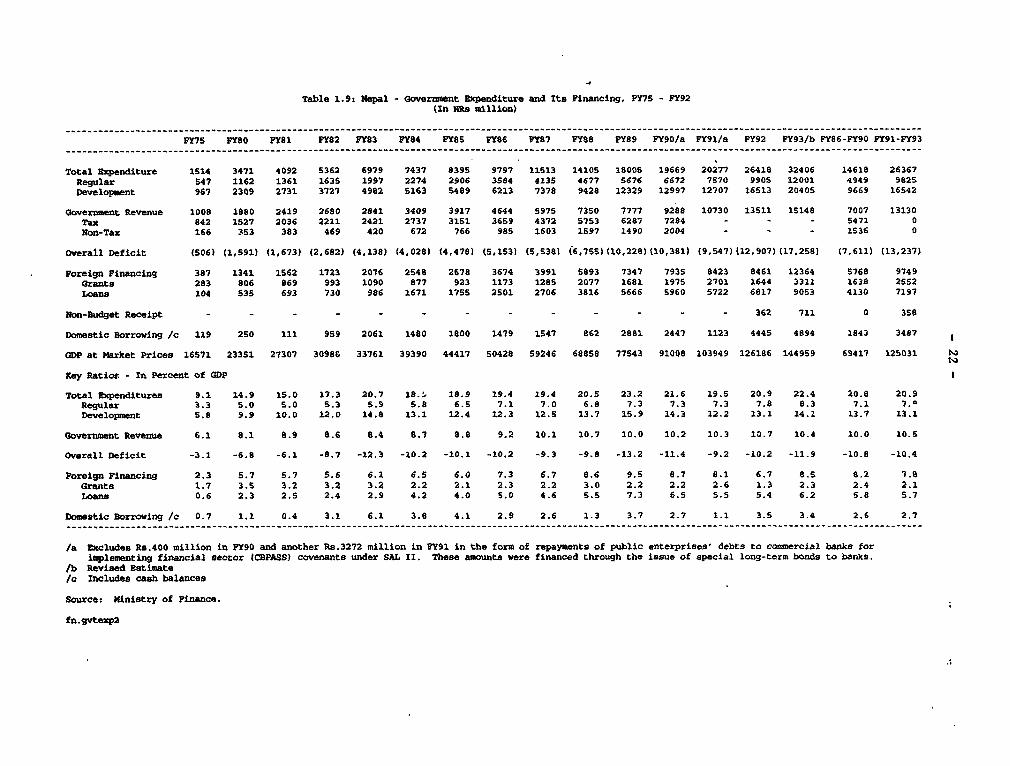
Table 1.9: Nepal - Government Expenditure and Its Financing, FY75 - FY92(In NRs million)
FY75 PY80 FY81 FY82 FY83 PY84 FY85 FY86 FY87 FYS8 FY89 FY90/a FY91Ja FY92 PY93/b FY86-FY90 FY91-FY93
Total Expenditure 1514 3471 4092 S362 6979 7437 839S 9797 11513 1410S 1800S 19669 20277 26418 32406 14618 26367
Regular 547 1162 1361 163S 1997 2274 2906 3584 4135 4677 5676 6672 7S70 990S 12001 4949 9825Development 967 2309 2731 3727 4982 S163 5489 6213 7378 9428 12329 12997 12707 16513 20405 9669 16542
Government Revenue 1008 l880 2419 2680 2841 3409 3917 4644 5975 7350 7777 9288 10730 13511 15148 7007 13130Tax 842 1527 2036 2211 2421 2737 3151 36S9 4372 S753 6287 7284 - - - 5471 0Non-Tax 166 353 383 469 420 672 766 985 1603 1597 1490 2004 _ - 1536 0
Overall Deficit (506) (1,591) (1,673) (2,682) (4,138) (4,028) (4,478) (S,153) (5538) (6,755)(10,228)(10,381) (9,547)(12,907)(17.258) (7,611) (13,237)
Foreign Financing 387 1341 1562 1723 2076 2548 2678 3674 3991 5893 7347 793S 8423 8461 12364 5768 9749Grants 283 806 869 993 1090 877 923 1173 1285 2077 1681 1975 2701 1644 3311 1638 2552Loans 104 535 693 730 986 1671 1755 2S01 2706 3816 5666 5960 S722 6817 9053 4130 7197
Non-Budget Receipt - - - - - - - - - - - - - 362 711 0 358
Domestic Borrowing /c 119 250 111 959 2061 1480 1800 1479 1547 862 2881 2447 1123 4445 4894 1843 3487 1
GDP at Market Prices 16571 23351 27307 30988 33761 39390 44417 50428 59246 68858 77543 91008 103949 126186 144959 69417 125031 ts
Key Ratios - In Percent of GDP
Total Expenditures 9.1 14.9 15.0 17.3 20.7 18i. 19.9 19.4 19.4 20.5 23.2 21.6 19.5 20.9 22.4 20.8 20.9Regular 3.3 S.0 S.0 S.3 S.9 5.8 6.5 7.1 7.0 6.8 7.3 7.3 7.3 7.8 8.3 7.1 7.*Development 5.8 9.9 10.0 12.0 14.8 13.1 12.4 12.3 12.5 13.7 15.9 14.3 12.2 13.1 14.1 13.7 13.1
Government Revenue 6.1 8.1 8.9 8.6 8.4 8.7 8.8 9.2 10.1 10.7 10.0 10.2 10.3 10.7 10.4 10.0 10.5
Overall Deficit -3.1 -6.8 -6.1 -8.7 -12.3 -10.2 -10.1 -10.2 -9.3 -9.8 -13.2 -11.4 -9.2 -10.2 -11.9 -10.8 -10.4
Foreign Financing 2.3 5.7 5.7 5.6 6.1 6.5 6.0 7.3 6.7 8.6 9.5 8.7 8.1 6.7 8.5 8.2 7.8Grants 1.7 3.5 3.2 3.2 3.2 2.2 2.1 2.3 2.2 3.0 2.2 2.2 2.6 1.3 2.3 2.4 2.1Loans 0.6 2.3 2.5 2.4 2.9 4.2 4.0 S.0 4.6 5.5 7.3 6.5 5.5 5.4 6.2 5.8 5.7
Domestic 19orrowing /c 0.7 1.1 0.4 3.1 6.1 3.8 4.1 2.9 2.6 1.3 3.7 2.7 1.1 3.5 3.4 2.6 2.7
/a Excludes Rs.400 million in FY90 and another Rs.3272 million in FY91 in the form of repayments of public enterprises' debts to commercial banks foriqplementing financial sector (CBPASS) covenants under SAL II. These amounts were financed through the issue of special long-term bonds to banks.
Jb Revised EstimateJc Includes cash balances
Source: Ministry of Pinance.
fn.gvtexp2
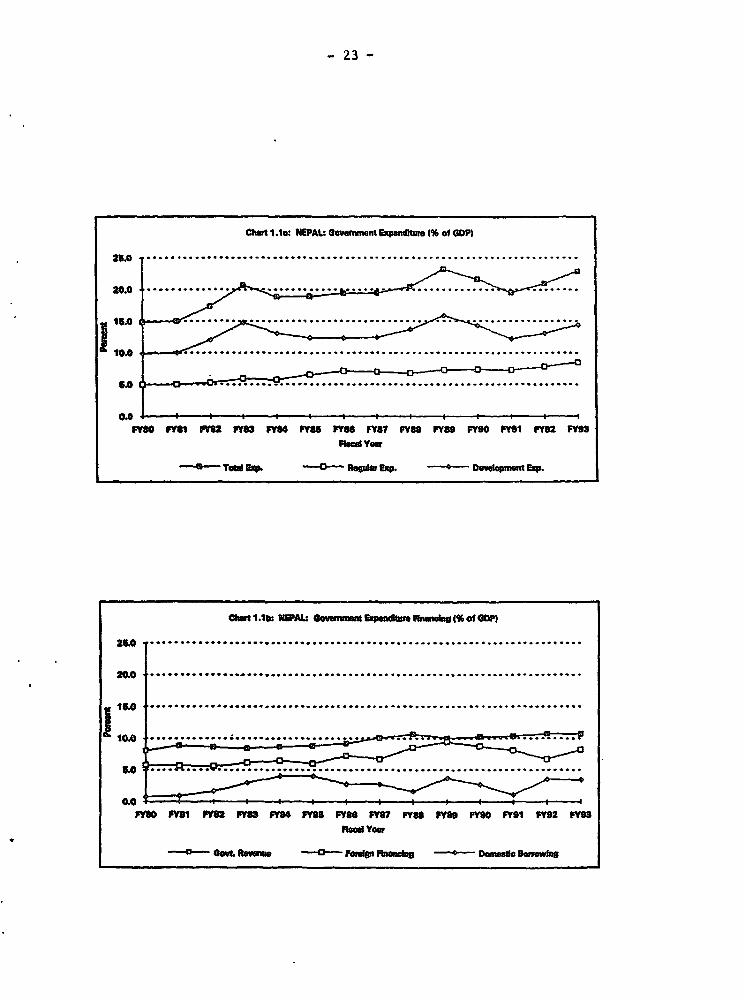
- 23 -
Chtait 1.1: NPAU SOVeMnt ExPandnwts of GDP)
2|. ......................................................... I...............
20.0 . .
51.0 I ...... ...
tOO. __ .................................................................
5.0 ... .............................................
0.0.FM FM FM FY FY84 F Y F M Y69 FMY0 F9 FY9 FY93
Flind Yewr
3 Told SXP. --'-- ep39 Eov Dshpmnt f
ahMa I.I1b OWAIJ Gvuunat EPapmdtum "numeln 1% Of MMP
2.0 .........................................................................
20.0 _
tlO .........................................................................
to ... .. .............................................................
0.0fY8D FY F1 FY53 FY33 F5 FY FY86 FY87 FY33 FY39 FY80 FY91 FV92 FY9
Need Yew
_ G*t Reno -- Fen*p _nema DCmes kuwad|
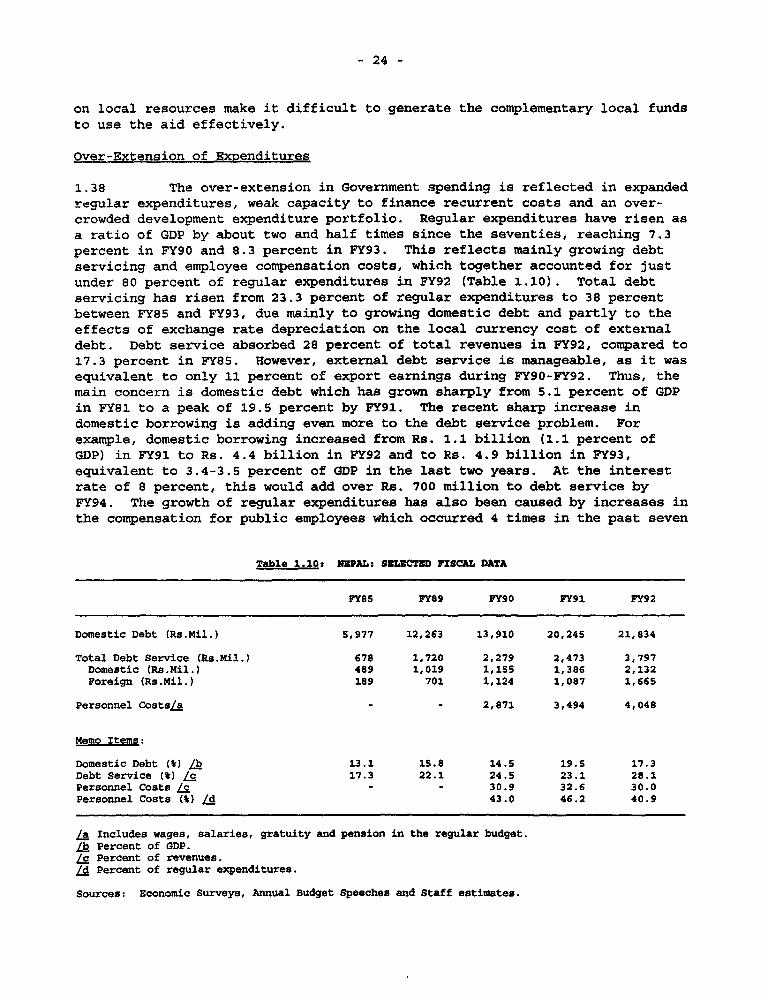
- 24 -
on local resources make it difficult to generate the complementary local fundsto use the aid effectively.
Over-Extension of Expenditures
1.38 The over-extension in Government spending is reflected in expandedregular expenditures, weak capacity to finance recurrent costs and an over-crowded development expenditure portfolio. Regular expenditures have risen asa ratio of GDP by about two and half times since the seventies, reaching 7.3percent in FY90 and 8.3 percent in FY93. This reflects mainly growing debtservicing and employee compensation costs, which together accounted for justunder 80 percent of regular expenditures in FY92 (Table 1.10). Total debtservicing has risen from 23.3 percent of regular expenditures to 38 percentbetween FY85 and FY93, due mainly to growing domestic debt and partly to theeffects of exchange rate depreciation on the local currency cost of extermaldebt. Debt service absorbed 28 percent of total revenues in FY92, compared to17.3 percent in FY85. However, external debt service is manageable, as it wasequivalent to only 11 percent of export earnings during FY90-FY92. Thus, themain concern is domestic debt which has grown sharply from 5.1 percent of GDPin FY81 to a peak of 19.5 percent by FY91. The recent sharp increase indomestic borrowing is adding even more to the debt service problem. Forexample, domestic borrowing increased from Rs. 1.1 billion (1.1 percent ofGDP) in FY91 to Rs. 4.4 billion in FY92 and to Rs. 4.9 billion in FY93,equivalent to 3.4-3.5 percent of GDP in the last two years. At the interestrate of 8 percent, this would add over Rs. 700 million to debt service byFY94. The growth of regular expenditures has also been caused by increases inthe compensation for public employees which occurred 4 times in the past seven
Table 1.10s mPAL: SELECTBD FISCAL DATA
FY85 FY89 FY90 FY91 FY92
Domestic Debt (Rs.Mil.) S,977 12,263 13,910 20,245 21,834
Total Debt Service (Rs.Mil.) 678 1,720 2,279 2,473 3,797Domestic (Rs.Mil.) 489 1,019 1,155 1,386 2,132Foreign (Rs.Mil.) 189 701 1,124 1,087 1,665
Personnel CostsaL - - 2,871 3,494 4,048
Memo Items:
Domestic Debt () Lb 13.1 15.8 14.5 19.5 17.3Debt Service (t) /c 17.3 22.1 24.5 23.1 28.1Personnel Costs a - - 30.9 32.6 30.0Personnel Costs (t) Ld 43.0 46.2 40.9
/a Includes wages, salaries, gratuity and pension in the regular budget./b Percent of GDP./c Percent of revenues.Ed Percent of regular expenditures.
Sources: Economic Surveys, Annual Budget Speeches and Staff estimates.
- 25 -
years13. By the end of the eighties, total employee compensation costs,including pension and gratuity accounted for over 40 percent of regularexpenditures. Including development expenditures, employee costs accountedfor about 35 percent of total Government spending, putting Nepal in the upperrange relative to other developing countries. 4/ While pay levels forpublic employees are low, low tax effort makes support for pay increasesdifficult.
1.39 Moreover, Nepal's capacity to finance the recurrent costs ofexisting investments is inadequate, and this has undermined the productivityof investments; but the problem has been obscured by the lack of a transparentsystem for classifying expenditures. The classification system obscures thetrue size of recurrent cost commitments on the budget and the scope for newinvestments. While in principle the "regular" budget is to reflect recurrentcosts and the "development" budget capital costs, not all expenditures areclassified consistently in this fashion. For example, the O&M for secondaryschools is in the regular budget, while the O&M for primary schools is in thedevelopment budget. Similarly, more than half of health sector expendituresis classified as development, while close to 70 percent of it actually coversrecurrent administrative costs, and should be appropriately covered in theregular budget. Also, many routine Government functions, including somemilitary purchases, forest security guards services, district administrativeoffices and regional directorates are financed under the "development" budget.Based on the official classification, the ratio of regular expenditures to GDPratio rose from 5 to 8.5 percent during FY81-FY93 and was lower than therevenue to GDP ratio which rose from 8.9 to 10.7 percent during the sameperiod. Thus, officially, Nepal generated revenue surpluses on regularexpenditures consistently to support investments through the eighties.However, when expenditures are properly classified, it shows that recurrentcosts have exceeded revenues consistently since the early eighties (see Charts1.2a and 1.2b) A 'Similarly, as shown in Table 1.11 below, if the revenuesurplus is adjusted taking recurrent costs into consideration, it shows anaverage public saving ratio of minus 3.4 percent of GDP compared to an
For example, compensation for public employees rose by 60-90 percent in July 1985 based onthe recommendations of the 1983 pay commission; there was a 20 percent increase for lower levelstaff in July 1988 and another 25 percent rise in July 1989. There was a further increases inApril 1991 and another in financial year 1991-92. Retrenchment and administrative reformsfurther added an estimated Rs.300-350 million in FY92.
1/ Estimates by the Central Bureau of statistics show 33-36 percent of total Government spendinggoing to employee compensation during FY89-FY9l, evf-n before recent retrenchments and payincreases which helped to raise regular expenditures by 1.2 percent of GDP during FY91-FY93.Comparable shares of employee compensation from Government expenditures are 26 percent forPhilippines, 31 percent for Malaysia, 33 percent for Papua New Guinea and 15 percent forIndonesia.
/ Currently, at least two estimates of recurrent expenditures can be obtained. one series maybe generated by adding debt servicing to estimates of public consumption available from thecentral Bureau of statistics (cBS). 7-lother series is obtained from studies done by MOP. Bothseries show that recurrent costs have exceeded revenues since the early eighties; however, thegap is slightly higher for the NOr series. See "Public Expenditure Management in Nepal". MOP,February 1991 and "Financing Public Sector Expenditure in Nepal". Integrated DevelopmentStudies, May 1987.
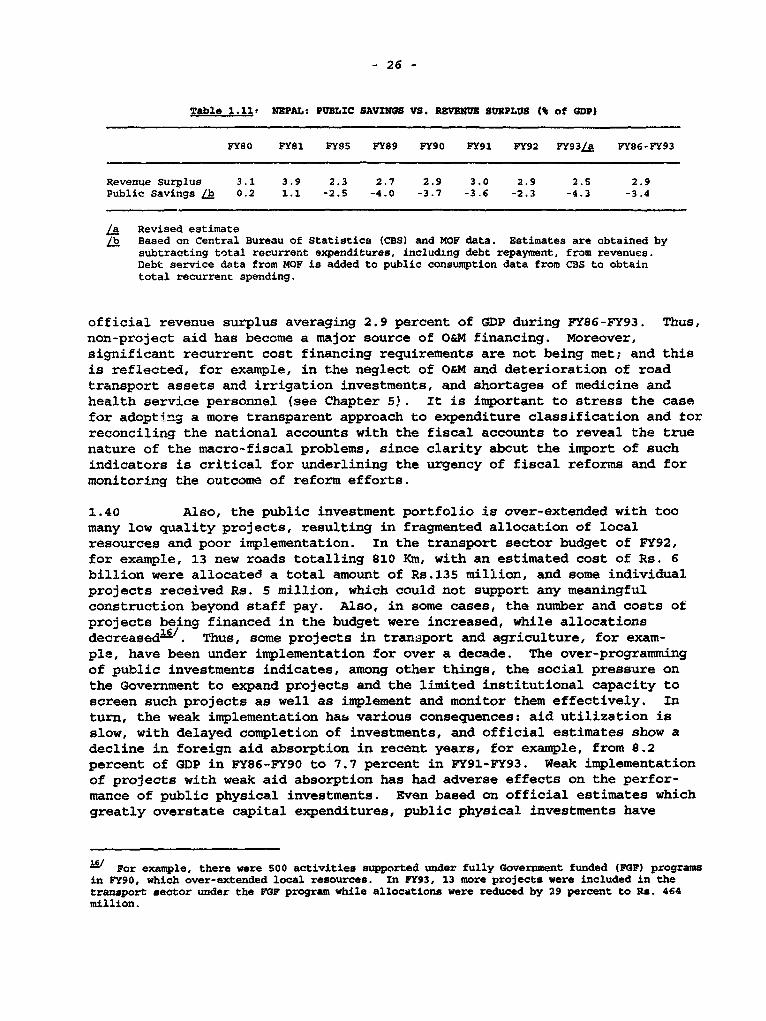
- 26 -
Table 1.11' NEPALt PUBLIC SAVINGS VS. REVfhVE SURPLUS (% of GDP)
FY80 FY81 FY85 FY89 FY90 FY91 FY92 PY93/a FY86-FY93
Revenue Surplus 3.1 3.9 2.3 2.7 2.9 3.0 2.9 2.5 2.9Public Savings lb 0.2 1.1 -2.5 -4.0 -3.7 -3.6 -2.3 -4.3 -3.4
/a Revised estimate/b Based on Central Bureau of Statistics (CBS) and M4OF data. Estimates are obtained by
subtracting total recurrent expenditures, includtng debt repayment, from revenues.Debt service data from MOF is added to public consumption data from CBS to obtaintotal recurrent spending.
official revenue surplus averaging 2.9 percent of GDP during FY86-FY93. Thus,non-project aid has become a major source of O&M financing. Moreover,significant recurrent cost financing requirements are not being met; and thisis reflected, for example, in the neglect of O&M and deterioration of roadtransport assets and irrigation investments, and shortages of medicine andhealth service personnel (see Chapter 5!. It is important to stress the casefor adopting a more transparent approach to expenditure classification and torreconciling the national accounts with the fiscal accounts to reveal the truenature of the macro-fiscal problems, since clarity abcut the import of suchindicators is critical for underlining the urgency of fiscal reforms and formonitoring the outcome of reform efforts.
1.40 Also, the public investment portfolio is over-extended with toomany low quality projects, resulting in fragmented allocation of localresources and poor implementation. In the transport sector budget of FY92,for example, 13 new roads totalling 810 Km, with an estimated cost of Rs. 6billion were allocated a total amount of Rs.135 million, and some individualprojects received Rs. S million, which could not support any meaningfulconstruction beyond staff pay. Also, in some cases, the number and costs ofprojects being financed in the budget were increased, while allocationsdecreased- . Thus, some projects in transport and agriculture, for exam-ple, have been under implementation for over a decade. The over-programmingof public investments indicates, among other things, the social pressure onthe Government to expand projects and the limited institutional capacity toscreen such projects as well as implement and monitor them effectively. Inturn, the weak implementation hats various consequences: aid utilization isslow, with delayed completion of investments, and official estimates show adecline in foreign aid absorption in recent years, for example, from 8.2percent of GDP in FY86-FY90 to 7.7 percent in FY91-FY93. Weak implementationof projects with weak aid absorption has had adverse effects on the perfor-mance of public physical investments. Even based on official estimates whichgreatly overstate capital expenditures, public physical investments have
M/ For example, there were 500 activities supported under fully Government funded (FGF) programsin FY90, which over-extended local resources. In FY93, 13 more projects were included in thetranaport sector under the FGF program while allocations were reduced by 29 percent to Rs. 464million.
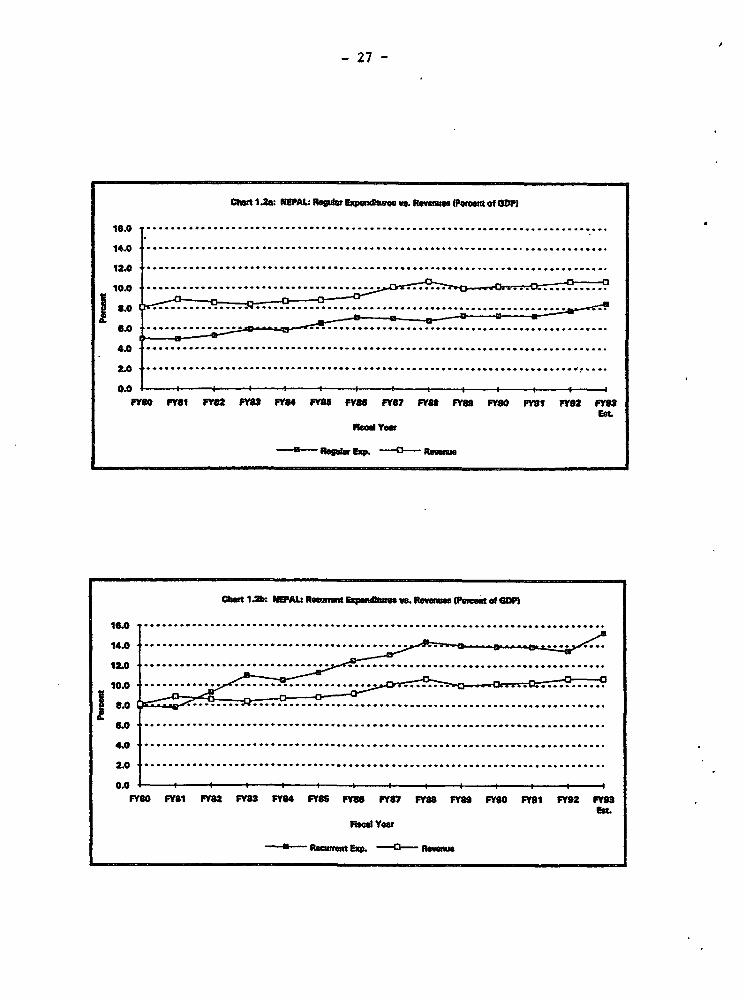
- 27 -
Chth 1.2at NEPAL: RspiW E _pudtwe vRevs. ue. (aPWcnt of QP)
16.0 ..... Y8. _ Y82 FY8_8..Y8..FY8....8..FY.8.... 0.. Y.0........ 02.....
14.0 .............................................................................
*2.0 .............................................................................
10A.,, .....................
1 8.0 =,: ...................... m...... ..... e......
¢0 ........... ...............................................40 ...............................................................................
2.0 .......................................
; 0.0I i t I t , , , , , , IFY80 iFY8 FY82 FY8M FY84 FY8S FY88 FY87 FY88 FY80 FY8O FY0S F2 FY0s
ESt
Isea Yew
Chr -Z WU- Reamar exp aw-O m gm p fGP
1ie.0 ..............................................................................
14.0 ........................................
12.0 ..................................
lo ''**-s0 .... ............. - .. ........ o
8.0 ...........................................
8.0 ..............................................................................
4.0 ..............................................................................
2.0 ..............................................................................
0.0 I t z -I I t t---
iFY80 mYS FMY FYU3 FY84 FM8 FY8B FV87 FY88 FY89 FY90 FY91 FY92 FM9
R Yewt
Reno Exp -O R
- 28 -
fallen in recent years from over 9 percent of GDP in the late eighties to 7.5percent in FY92 and 7.6 percent in FY93171. Also, the performance of in-vestments has been below expectation, with delayed completion and low rates ofreturn- .
1.41 Fiscal performance remained difficult in the past twoyears, though the preliminary result of the mid-FY94 budget review shows somesigns of improvement. The fiscal deficit rose from 9.2 percent of GDP in FY91to 10.2 percent in FY92 and to 11.9 percent in FY93 (Table 1.12). Revenuesrose from 10.3 percent of GDP in FY91 to 10.7 in FY92, declining to 10.5percent in FY93, while regular expenditures jumped from 7.3 percent of GDP inFY91 to 8.0 in FY93. While the increase in regular expenditure is due in partto short-term factors, such as the costs of retrenchment and administrativereforms, it also reflects deep rooted problems related to employee compensa-tion and domestic debt financing discussed earlier, which would have to beaddressed. More importantly, the poor revenue performance relative to repularexpenditure growth further eroded surplus generation and public savings tosupport aid utilization for development activity. Domestic borrowing rosefrom 1.1 percent of GDP in FY91 to 3.4 percent in each of FY92 and FY93, whichis not considered sustainable, given the past experience with the impact ofsuch domestic borrowing on macroeconomic stability, and the rising claims ofdomestic debt service on regular expenditures and on revenues. Aid utiliza-tion declined to 6.7 percent of GDP in FY92 from 8.1 in FY91; it recovered inFY93, but reached no more than levels attained at the close of the eighties.While development expenditures rose from 12.2 percent of GDP to 14.4 percentbetween FY91 and FY93, this is also not sustainable in view of the size ofdomestic borrowing it entails. In addition, the estimated rise in publicinvestments relative to the increase in development spending was negligible at0.1 percent of GDP. The public investment portfolio remained over-crowdedwith too many projects, many of low quality and poorly prepared, and themonitoring of programs and projects remains weak. Because of the weakmonitoring, the reason for the rise in development spending is unclear, thoughit is attributed to a sharp rise in social expenditures to 35 percent ofdevelopment expenditures in FY93 and to prepayment to contractors.
1.42 The Government has intensified its efforts to improve fiscalmanagement. While it is too early to assess the impact of recent fiscalreform efforts, there is preliminary indication from the mid-year review ofthe FY94 budget that the situation is beginning to improve, as the Governmenthas taken steps to begin addressing it through revenue measures, limits onexpenditures and inse-itutional reforms. For example, revenue growth in mid-FY94 is estimated at 16 percent over the same 6 month period of FY93, and the
- The National Accounts are weak. If official estimates of public consumption (personnelcosts, material purchases and transfers to households) plus debt service are used to derivepublic investments from total Government spending, the resulting estimates are about I.S-2percent of GDP lower than official estimates of public investments since the late eighties.
LS Nepal's special features, including rugged and landlocked terrain and short constructionperiod exacerbate the financing problems, as discussed in a recent Division Report: "Nepal, TheEfficiency of Public Investments, Project Implementation and Expenditure Issues. June 1991.
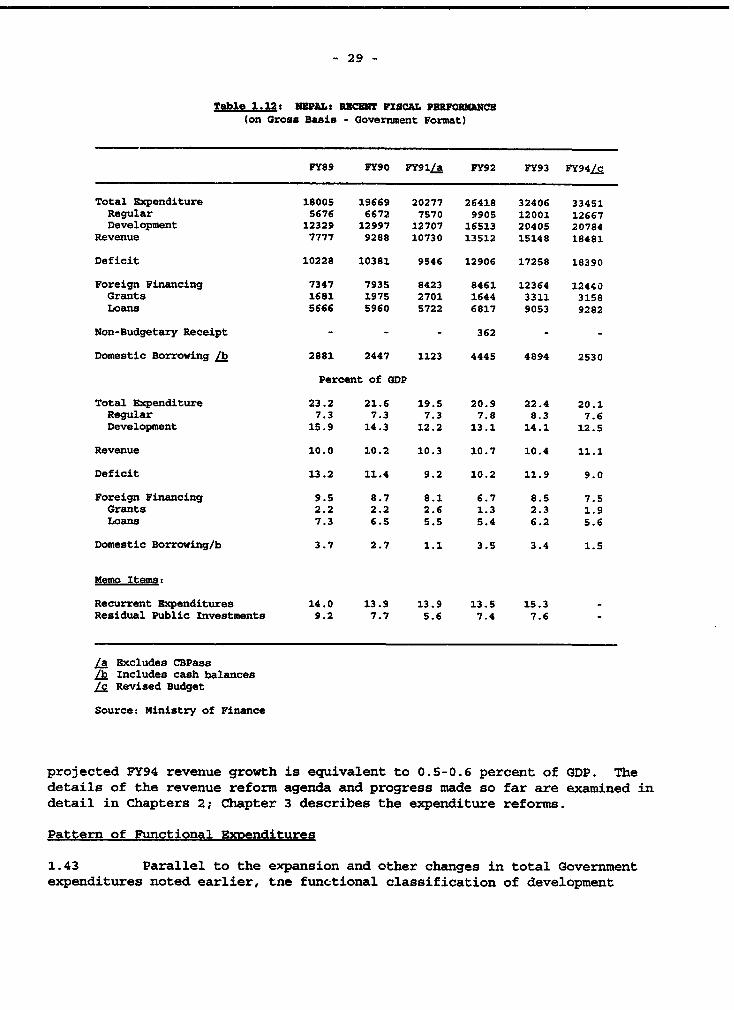
- 29 -
Table 1.12: NBPAL: RECENT FISCAL PERFORMANCB(on Gross Basis - Government Format)
FY89 FY90 FY91La FY92 FY93 FY94/c
Total Expenditure 1SOOS 19669 20277 26418 32406 33451Regular 5676 6672 7570 9905 12001 12667Development 12329 12997 12707 16513 20405 20784
Revenue 7777 9288 10730 13512 15148 18481
Deficit 10228 10381 9546 12906 17258 18390
Foreign Financing 7347 7935 8423 8461 12364 12440Grants 1681 1975 2701 1644 3311 3158Loans 5666 5960 5722 6817 9053 9282
Non-Budgetary Receipt - - - 362 - -
Domestic Borrowing lb 2881 2447 1123 4445 4894 2530
Percent of GDP
Total Expenditure 23.2 21.6 19.5 20.9 22.4 20.1Regular 7.3 7.3 7.3 7.8 8.3 7.6Development 15.9 14.3 12.2 13.1 14.1 12.5
Revenue 10.0 10.2 10.3 10.7 10.4 11.1
Deficit 13.2 11.4 9.2 10.2 11.9 9.0
Foreign Financing 9.5 8.7 8.1 6.7 8.5 7.5Grants 2.2 2.2 2.6 1.3 2.3 1.9Loans 7.3 6.5 5.5 5.4 6.2 5.6
Domestic Borrowing/b 3.7 2.7 1.1 3.5 3.4 1.5
Memo Items:
Recurrent Expenditures 14.0 13.9 13.9 13.5 15.3 -Residual Public Investments 9.2 7.7 5.6 7.4 7.6
/a Excludes CBPass/b Includes cash balances/c Revised Budget
Source: Ministry of Finance
projected FY94 revenue growth is equivalent to 0.5-0.6 percent of GDP. Thedetails of the revenue reform agenda and progress made so far are examined indetail in Chapters 2; Chapter 3 describes the expenditure reforms.
Pattern of Functional ExDenditures
1.43 Parallel to the expansion and other changes in total Governmentexpenditures noted earlier, tne func.tional classification of development
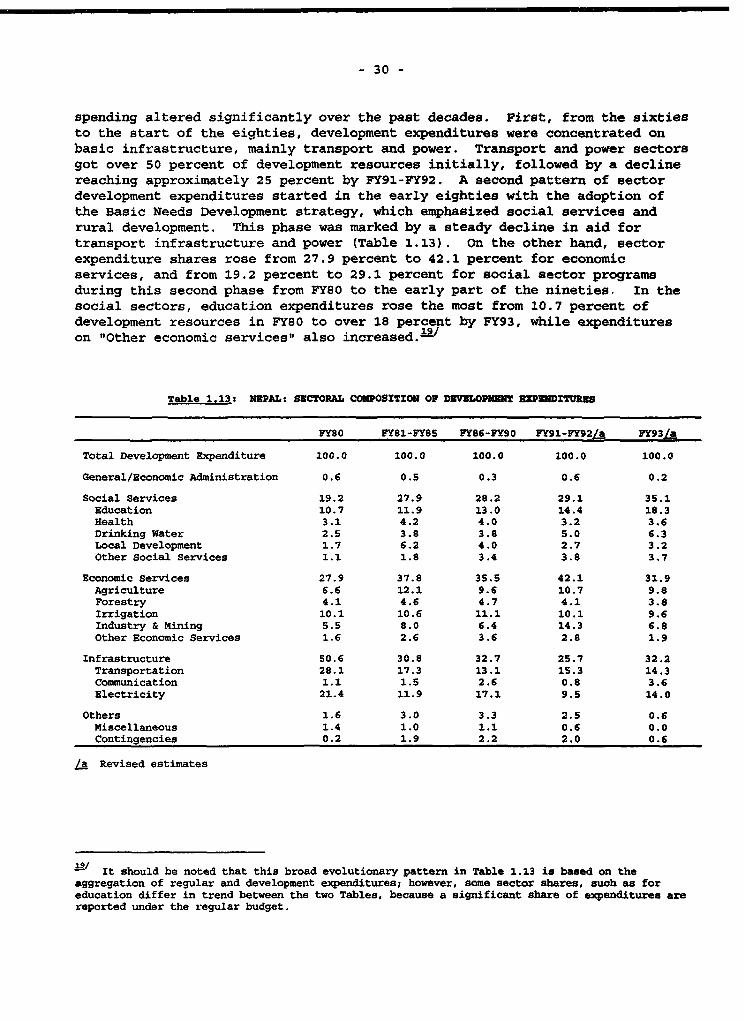
- 30 -
spending altered significantly over the past decades. First, from the sixtiesto the start of the eighties, development expenditures were concentrated onbasic infrastructure, mainly transport and power. Transport and power sectorsgot over 50 percent of development resources initially, followed by a declinereaching approximately 25 percent by FY91-FY92. A second pattern of sectordevelopment expenditures started in the early eighties with the adoption ofthe Basic Needs Development strategy, which emphasized social services andrural development. This phase was marked by a steady decline in aid fortransport infrastructure and power (Table 1.13). On the other hand, sectorexpenditure shares rose from 27.9 percent to 42.1 percent for economicservices, and from 19.2 percent to 29.1 percent for social sector programsduring this second phase from FY80 to the early part of the nineties. In thesocial sectors, education expenditures rose the most from 10.7 percent ofdevelopment resources in FY80 to over 18 percent by FY93, while expenditureson "Other economic services" also increased.-/
Table 1.13:S NPAL: 8ECTORAL COMPOSISION OF DZVBLOPMINS ZZPUDITUR3S
WY80 FYSI-FYSS 1Y86-FY90 FY91-FY92/a FY93Lsa
Total Development Expenditure 100.0 100.0 100.0 100.0 100.0
General/Economic Administration 0.6 0.5 0.3 0.6 0.2
Social Services 19.2 27.9 28.2 29.1 35.1Education 10.7 11.9 13.0 14.4 18.3Health 3.1 4.2 4.0 3.2 3.6Drinking Water 2.5 3.8 3.8 5.0 6.3Local Development 1.7 6.2 4.0 2.7 3.2Other Social Services 1.l 1.8 3.4 3.8 3.7
Economic Services 27.9 37.8 35.5 42.1 31.9Agriculture 6.6 12.1 9.6 10.7 9.8Forestry 4.1 4.6 4.7 4.1 3.8Irrigation 10.1 10.6 11.1 10.1 9.6Industry & Mining 5.5 8.0 6.4 14.3 6.8Other Economic Services 1.6 2.6 3.6 2.8 1.9
Infrastructure SO.6 30.8 32.7 25.7 32.2Transportation 28.1 17.3 13.1 15.3 14.3Communication 1.1 1.5 2.6 0.8 3.6Electricity 21.4 11.9 17.1 9.5 14.0
Others 1.6 3.0 3.3 2.5 0.6Miscellaneous 1.4 1.0 1.1 0.6 0.0Contingencies 0.2 1.9 2.2 2.0 0.6
/ Revised estimates
/ It should be noted that this broad evolutionary pattern in Table 1.13 is based on theaggregation of regular and development expenditures; however, some sector shares, such as foreducation differ in trend between the two Tables, because a significant share of expenditures arereported under the regular budget.
- 31 -
1.44 Currently, the sector structure of development expenditures isentering a transition to another phase under the EP and for the rest of thenineties. This would involve selective expansion of some sectors and adiminished role for the Government in many activities. It would involve(i) shifting resources to expand allocations for the power sector to redresspersistent shortages in electricity; (ii) emphasizing rural infrastructuredevelopment to foster rural income generating activities; and (iii) continuingsupport for human resource development to improve the quality of and access tosocial services, advance the gains made in social sector development over thepast decades and curb population growth. Managing the overall fiscal andsector expenditure transition to this third phase to make progress in attain-ing the objectives of accelerated economic growth and poverty alleviation inthe nineties is the central theme of this report.
P. Conclusion
1.45 Substantive measures are needed to gain control of Nepal's weakfiscal and public resource management situation, which has persisted over thepast years. While the Government has been proactive in trade, industrialpolicy and exchange rate liberalization and has made progress in reforms topromote private sector development since the last Economic Report was writtenin March 1992, not much has been achieved in the area of improving fiscalmanagement and the efficient use of public resources during that period. Morerecently, as the Government has intensified its efforts to improve thesituation, the preliminary results of the mid-Y94 buget review discussed inthe succeeding chapters indicate some initial progress, especially in the areaof revenue mobilization. While this is encouraging, it represents an initialstep. Substantive progress in attaining efficient use of public resources isessential for the outcome of the liberalization effort because of the need toprovide the infrastructure to complement private investments. It is againstthis fiscal background that the expanded expenditures of the EP and, inparticular Arun III, must be viewed. Undoubtedly, the financing requirementsof Arun, which is discussed in detail in chapter three will exert even morepressure on fiscal management for the rest of the nineties and beyond. Underthese circumstances, more efforts than normal are required to undertakesubstantive reforms to improve fiscal management. The rest of the report willfocus on the critical elements of any credible effort to improve publicresource management in Nepal. The report argues that substantive reforms haveto emphasize tax restructuring and revenue mobilization (Chapter 2); priori-tization of expenditures (Chapters 3 and 5) and institutional reforms (Chap-ter 4). These chapters will discuss an agenda for reform in more detail,including examining actions currently being taken as part of the FY94 budget.
CHAPTER TWO
TAX RESTRUCTURING AND REVE=UE MOBILIZATION
A. Revenue Performance and Local Resources
The Revenue System
2.1 Like most developing countries, Nepal's tax system is focussed onindirect taxation, which accounts for over 80 percent of tax revenues. Themost important sources are taxes on (i) consumption and production, about 50percent of total tax revenues in FY92-FY93; and (ii) custom duties whichaccount for about 35 percent. Nepal's system of indirect taxation has somecharacteristics which have implications for revenue mobilization, and thesehave to be taken into account in formulating a feasible tax reform program.First, while the system has progressed beyond total reliance on custom dutiesand specific excises, it has not advanced to the stage of a VAT. Second, thesystem of indirect taxation has been circumscribed to some extent by tradetreaty commitments with India. While the system has acquired more flexibilityin recent years with the adoption of liberalization policies, Nepal still hasto set the level of tariffs against third countries in relation to the levelof India's in order to limit trade deflection across the open border; thus,until recently, Nepal has had to implement additional duties on third countryimports to match Indian excises on various products. Third, the long and openborder with neighboring countries creates general problem with smuggling incases where Nepal's taxes result in wide discrepancies relative to crossborder prices.
2.2 Land revenues and registration account for about 6 percent andtaxes on property, profits and income about 10 percent of total revenues. Netincome and profits for public limited liability companies and for partly orwholly state-owned enterprises have been taxed at a flat rate of 35 percent.However, income from all sources has not been treated similarly. In the caseof individuals, for example, house and land rental incomes are taxed at lowerrates relative to other sources of income. Also, the system of revenueadministration is weak. Income tax administration, in particular, isperceived by businesses to have elements of arbitrariness. The tendency oftax administrators to depend on "best judgement" rather than available recordsoften results in protracted negotiation, which exerts pressure on tax payers.Until recently, Nepal did not have a revenue service with specificqualification and training requirements, and staff could be transferred fromany section of the civil service to serve in tax assessment and taxadministration. Also, the administrative infrastructure, including officeequipment, is grossly inadequate. These inadequacies have affected taxcompliance and contributed to the poor outcome of the revenue system and to alow tax effort.
Low Revenue Effort
2.3 Nepal's low revenue effort has to be turned around to preservefiscal stability and also finance critical development projects adequately.
- 33 -
Revenue effort was 8.9 percent of GDP in FY81 and rose only slightly throughthe decade reaching 10.4 percent of GDP in FY93 and does not compare favorablywith the LDC average of 17-22 percent of GDP. Most South Asian neighbors havesignificantly higher revenue ratios.2-0/ The low revenue effort has beencaused by the narrow revenue base and poor tax administration. Taxes have lowincome elasticity, estimated at no more than 0.7, and while recent reformsliberalizing imports and tariffs were necessary, they contributed to erodingtax revenues. For example, in FY93 the bottom rate of additional tariffs onthird country imports was reduced from 5 to 3 percent, and the top rate from20 to 12 percent; the scope of the auction system was reduced and subsequentlyphased out. In the event, the average custom duty on imports was estimated atabout 10 percent, compared to 14 percent in FY90. Shifts in the tax structurehave reduced the contribution of the broad-based land tax, which used to bethe dominant revenue source. The base for revenues obtained from industrialproduction is also narrow and stagnant with a multiplicity of exemptions.Similarly, the sales tax base is narrow, and though it accounted for 29percent of revenues (in FY92), only 6 products generate 71 percent of revenuesobtained from this source, about half from cigarette and liquor alone.Property and income taxes are relatively insignificant, accounting for 9.7percent of tax revenues in FY92 (Table 2.1). Many sources of income areexcluded from the income tax net through tax holidays, exemptions on exportincome and special tax incentives. Income tax administration needs to beimproved to enlist compliance, which has been affected by a perception ofarbitrariness in assessing income taxes; for example, a decline in profits isoften not accepted. Proposals for tax reform are discussed in detail insection B.
Local Resources
2.4 Low revenue effort is a major contributing factor to the growinglocal fund constraint on development financing. Local funds comprisesurpluses on the regular budget, domestic borrowing and local currencygenerated from non-project aid (Table 2.2). These funds are necessary toprovide counterpart funds to leverage external aid, implement projects andalso finance recurrent costs of social sector programs and other completedinvestments. The local fund problem is getting more acute at the margin. Theaverage increase in the revenue surplus was Rs.481 million a year duringFY90-FY92, which was equivalent to 27 percent of the increase in developmentexpenditures; and including domestic borrowing, local funds account for 34percent of development expenditures at the margin, compared to 50 percent inthe eighties. With diminishing domestic resources, local currency resourcesobtained from non-project aid have emerged as an important source of localfunds. They accounted for 38 percent of local resources during FY89-FY92,with a peak of 48 percent in FY91. While the growing dependence on aid isnot inappropriate, and virtually all the aid consists of grants and softloans, a balance between project and non-project aid is, nevertheless,
20/ Sri Lanka, for example, has a revenu.e effort of 21 percent of GDP, Pakistan 1S percent and India15 percent.
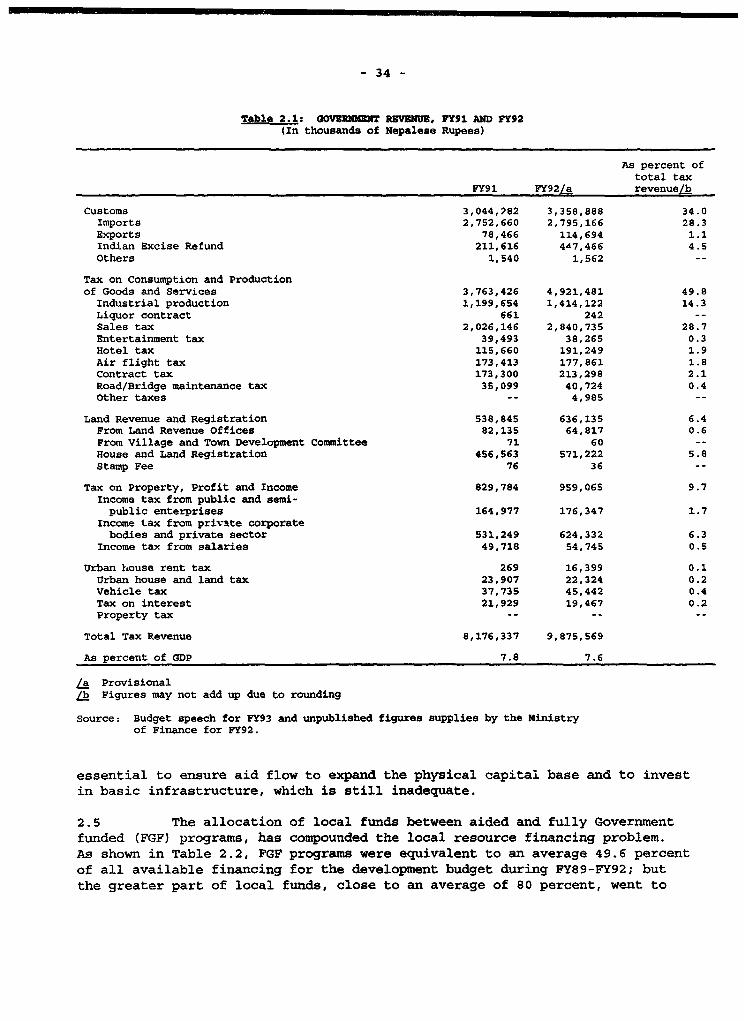
- 34 -
Table 2.1: GOVERNMENT REVBNUB, FY91 AND FY92(In thousands of Nepalese Rupees)
As percent oftotal tax
FY91 FY92/a revenue/b
Customs 3,044,282 3,358,888 34.0Imports 2,752,660 2,795,166 28.3Exports 78,466 114,694 1.1Indian Excise Refund 211,616 447,466 4.5Others 1,540 1,562 --
Tax on Consumption and Productionof Goods and Services 3,763,426 4,921,481 49.8
Industrial production 1,199,654 1,414,122 14.3Liquor contract 661 242 --Sales tax 2,026,146 2,840,735 28.7Entertainment tax 39,493 38,265 0.3Hotel tax 115,660 191,249 1.9Air flight tax 173,413 177,861 1.8Contract tax 173,300 213,298 2.1Road/Bridge maintenance tax 35,099 40,724 0.4Other taxes -- 4,985 --
Land Revenue and Registration 538,845 636,135 6.4From Land Revenue Offices 82,135 64,817 0.6From Village and Town Development Committee 71 60 --
House and Land Registration 456,563 571,222 5.8Stamp Fee 76 36 --
Tax on Property, Profit and Income 829,784 959,065 9.7Income tax from public and semi-public enterprises 164,977 176,347 1.7
Income tax from private corporatebodies and private sector 531,249 624,332 6.3
Income tax from salaries 49,718 54,745 0.5
Urban house rent tax 269 16,399 0.1Urban house and land tax 23,907 22,324 0.2Vehicle tax 37,735 45,442 0.4Tax on interest 21,929 19,467 0.2Property tax
Total Tax Revenue 8,176,337 9,875,569
As percent of GDP 7.8 7.6
/a Provisional/b Figures may not add up due to rounding
Source: Budget speech for FY93 and unpublished figures supplies by the Ministryof Finance for FY92.
essential to ensure aid flow to expand the physical capital base and to investin basic infrastructure, which is still inadequate.
2.5 The allocation of local funds between aided and fully Governmentfunded (FGF) programs, has compounded the local resource financing problem.As shown in Table 2.2, PGF programs were equivalent to an average 49.6 percentof all available financing for the development budget during FY89-FY92; butthe greater part of local funds, close to an average of 80 percent, went to
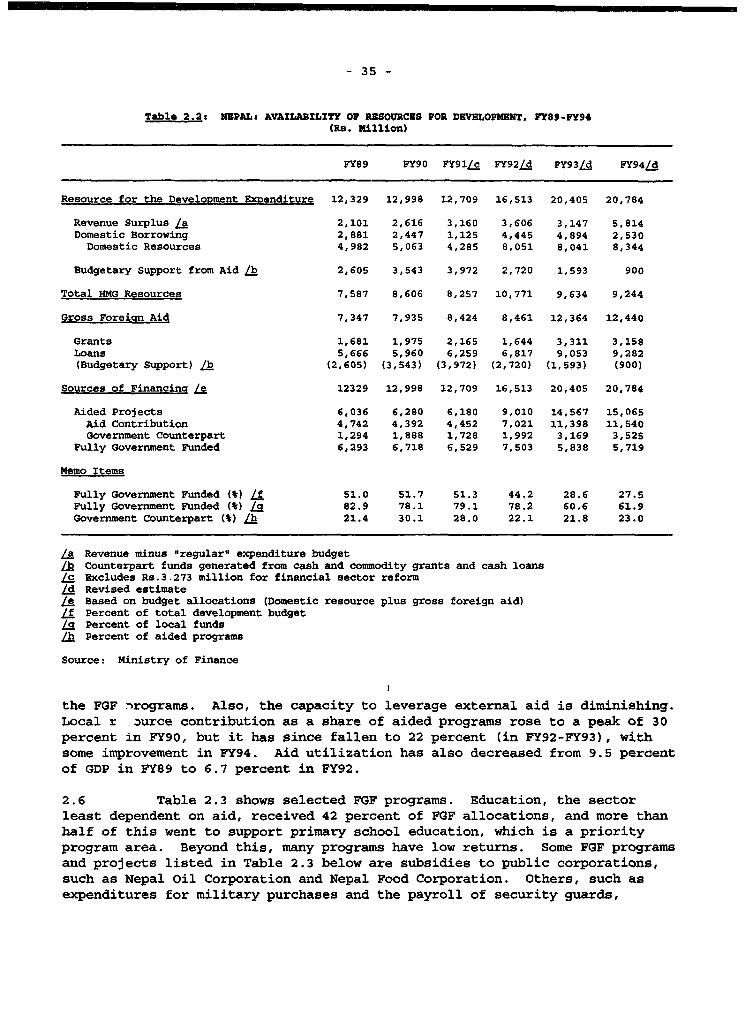
- 35 -
Table 2.2: NEPAL: AVAILABILITY OF RESOURCES POR DEVELOPMENT, FY89-FY94(Re. Killion)
PY89 FY90 FY91/c FY92/d FY93/d FY94/d
Resource for the Development Extenditure 12,329 12,998 12,709 16,513 20,405 20,784
Revenue Surplus /a 2,101 2,616 3,160 3,606 3,147 5,814Domestic Borrowing 2,881 2,447 1,125 4,445 4,894 2,530
Domestic Resources 4,982 5,063 4,285 8,051 8,041 8,344
Budgetary Support from Aid /b 2,605 3,543 3,972 2,720 1,593 900
Total HMG Resources 7,587 8,606 8,2S7 10,771 9,634 9,244
Gross Foreicn Aid 7,347 7,935 8,424 8,461 12,364 12,440
Grants 1,681 1,975 2,165 1,644 3,311 3,158Loans 5,666 5,960 6,259 6,817 9,053 9,282(Budgetary Support) /b (2,605) (3,543) (3,972) (2,720) (1,593) (900)
Sources of Financinq /e 12329 12,998 12,709 16,513 20,405 20,784
Aided Projects 6,036 6,280 6,180 9,010 14,567 15,065Aid Contribution 4,742 4,392 4,452 7,021 11,398 11,540Government Counterpart 1,294 1,888 1,728 1,992 3,169 3,525
Fully Government Funded 6,293 6,718 6,529 7,503 5,838 5,719
Memo Items
Fully Government Funded (%) /f 51.0 51.7 51.3 44.2 28.6 27.5Fully Government Funded (4) LS 82.9 78.1 79.1 78.2 60.6 61.9Government Counterpart (%) /h 21.4 30.1 28.0 22.1 21.8 23.0
/a Revenue minus "regular" expenditure budget/b Counterpart funds generated from cash and commodity grants and cash loansLc Excludes Rs.3.273 million for financial sector reform/d Revised estimate/e Based on budget allocations (Domestic resource plus gross foreign aid)Lf Percent of total development budgetLS Percent of local funds/h Percent of aided programs
Source: Ministry of Finance
the FGF nrograms. Also, the capacity to leverage external aid is diminishing.Local r -urce contribution as a share of aided programs rose to a peak of 30percent in FY90, but it has since fallen to 22 percent (in FY92-FY93), withsome improvement in FY94. Aid utilization has also decreased from 9.5 percentof GDP in FY89 to 6.7 percent in FY92.
2.6 Table 2.3 shows selected FGF programs. Education, the sectorleast dependent on aid, received 42 percent of FGF allocations, and more thanhalf of this went to support primary school education, which is a priorityprogram area. Beyond this, many programs have low returns. Some FGF programsand projects listed in Table 2.3 below are subsidies to public corporations,such as Nepal Oil Corporation and Nepal Food Corporation. Others, such asexpenditures for military purchases and the payroll of security guards,
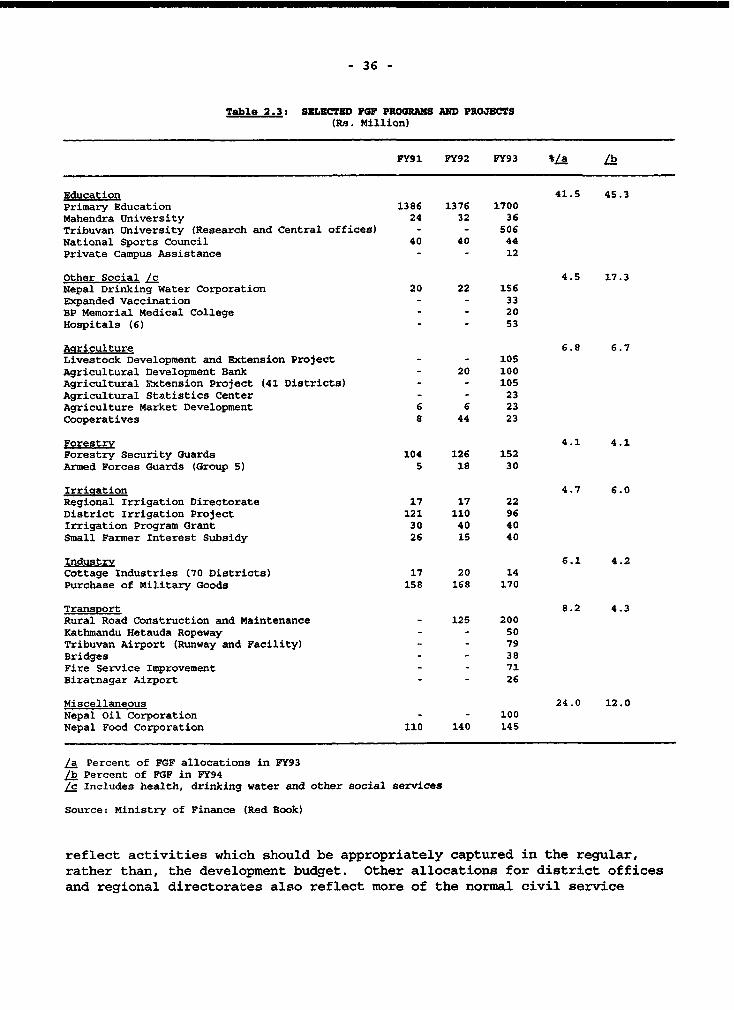
- 36 -
Table 2.3: SELECTED PFO PROGRAMS AMD PROJECTS(Rs. Million)
FY91 FY92 FY93 */a /b
Education 41.5 45.3Primary Education 1386 1376 1700
Mahendra University 24 32 36
Tribuvan University (Research and Central offices) - - 506National Sports Council 40 40 44Private Campus Assistance - - 12
Other Social /c 4.S 17.3Nepal Drinking Water Corporation 20 22 156Expanded Vaccination - - 33BP Memorial Medical College - - 20
Hospitals (6) - - 53
Agriculture 6.8 6.7
Livestock Development and Extension Project - - 105
Agricultural Development Bank - 20 100Agricultural Extension Project (41 Districts) - - 105
Agricultural Statistics Center - - 23Agriculture Market Development 6 6 23
Cooperatives 8 44 23
Forestry 4.1 4.1Forestry Security Guards 104 126 152
Armed Forces Guards (Group 5) 5 18 30
Irrigation 4.7 6.0Regional Irrigation Directorate 17 17 22
District Irrigation Project 121 110 96Irrigation Program Grant 30 40 40
Small Farmer Interest Subsidy 26 15 40
Industry 6.1 4.2Cottage Industries (70 Districts) 17 20 14
Purchase of Military Goods 158 168 170
Transport 8.2 4.3
Rural Road Construction and Maintenance - 125 200Kathmandu Hetauda Ropeway - - 50Tribuvan Airport (Runway and Facility) - - 79Bridges - - 38Fire Service Improvement - - 71Biratnagar Airport - - 26
Miscellaneous 24.0 12.0
Nepal Oil Corporation - - 100
Nepal Food Corporation 110 140 145
/a Percent of FGF allocations in FY93/b Percent of FGF in FY94/c Includes health, drinking water and other social services
Source: Ministry of Finance (Red Book)
reflect activities which should be appropriately captured in the regular,rather than, the development budget. Other allocations for district officesand regional directorates also reflect more of the normal civil service
- 37
activity rather than development activity. Some projects, such as in
transport and agriculture, are difficult to review because of no or incomplete
appraisal and limited documentation of performance. FGF programs have less
cumbersome fund release procedures, compared to aided programs; and tllimited documentation of supervision and monitoring make it more difficult toenforce accountability for expenditures on these activities. As theGovernment has become more aware of these issues, it is beginning to adopt
various measures to relieve the constraints on local resources through various
actions, including revenue reforms, which are discussed next.
B. Resource Mobilization and Revenue Reforms
2.7 Nepal's low tax effort (Table 2.3) and its consequences for the
fiscal deficit and the availability of local funds for development financing
have already been noted. The Government has sponsored IMF and Bankreports 2/ to assess the major domestic taxe3 and propose reforms torestructure the system to make revenues more responsive and to relax the local
fund constraint. Reports on reforming the tax system have been completed, the
Government has set a Task Force to review and prepare to implement them, andsome preliminary measures were adopted in oie FY94 budget. This sectiondiscusses the main revenue measures taken in the FY94 budget and indicatesoutstanding areas for more action.
2.8 Although the various reviews of the tax system containrecommendations to raise revenues in the short-term, the main issue is to
pursue a basic reform of the tax system, balancing the objectives of revenuemobilization, equity, efficiency and simplicity, while keeping in view theadministrative and political constraints. Revenue mobilization and simplicity
are, however, the main concerns. The key elements of recommendations now
under consideration by the Government and some of which were adopted in the
FY94 budget are to:
e move from the current multi-rate sales tax to a limitedvalue-added tax (VAT) to simplify the basic tax on consumption and
improve tax compliance;
e limit excises to a few products to simplify the system and freetax administration resources to enforce other taxes;
o reform the income tax system to broaden the tax base by treatingincome from different sources similarly;
a replace the wealth tax with an urban property tax by building onthe existing foundation, making use of the land register,
W The most recent studies include "Nepal Diagnostic Tax Policy, 1992" and "Tax Reform for Nepal,1993".
- 38 -
strengthening the registration tax by raising the minimum valuesand reducing the rates, and increasing rural land revenues.
2.9 Because the VAT and the new urban property tax will requirefurther work and time for preparation and design, tax reform efforts wouldhave to give top priority to sales and excise taxes and to strengtheningproperty taxes. Nevertheless, estimates of the new measures suggest that ifimplemented, they would raise tax revenues by an equivalent of 1.5 percent ofGDP in the next three years, six times the performance during FY90-FY92.
Reform of Sales and Excise Taxes
2.10 The centerpiece of proposed sales tax and excise tax reforms is tomove towards a regime of partial VAT combined with excises on a limited numberof products. The overriding principles in these reforms are to: (i) make thesales tax (or, eventually, the VAT) as uniform as possible by limitingexemptions; and (ii) orient the excise tax towards a narrower set of goods forreasons of economic efficiency and revenue capacity. In this regard, the toppriority reforms include the following.
(i) Redefininig the sales tax coverage (the only services currentlycovered by the sales tax are telecommunication and lifeinsurance);
(ii) Simplification of the rate structure (for example, reduce themultiple sales structure and various complex exemptions);
(iii) Reducing the range of taxes
2.11 The Government took steps in the FY94 budget to begin simplifyingexcises and sales taxes to help tax administration and, thereby, revenues.Twenty-two items were removed from the excise tax umbrella; 11 were retained,and the rates were adjusted to offset revenuie losses.ZV The FY94 budgetalso contains measures to simplify sales taxes, remove ambiguities and limitthe scope for evasion through misclassification. The multiple rate structureof sales taxes with rates of 5 to 40 percent was simplified to two rates of 10and 20 percent, and items previously taxed at 5 and 15 percent were raised to10 and 20 percent to avoid revenue losses from the simplification. AGovernment task force is preparing for the introduction of a value added tax.These include (i) extension and unification of the credit system, (ii)increasing administrative resources and (iii) basing valuation on invoices.The most significant structural reform issue is the extension and unificationof the credit system and a move towards the adoption of invoice-basedvaluation. In fact, it is these that will transform the system into a partialVAT.
/ Items retained include sugar, whiskey, wine, soft drinks, beer, cigarettes, TVs, radios, cement,foam and sponges.
- 39 -
Income Tax
2.12 Currently, taxes on property income and profits account for under10 percent of total tax revenues. The thrust of the main proposals for incometax reforms is to broaden the base, raise some rates as considered appropriatefor increased revenues, and strengthen tax administration.
2.13 The main income tax related reforms adopted in the FY94 budgetinclude the following:
(i) A levy of 35 percent flat tax rate on all limited companies andpartnerships compared to previous rates of 15, 25 and 40 percent;
(ii) A presumptive tax of Rs.1,500 per shopkeeper and Rs.600-1,000 pervehicle for providers of transport service, based on size;
(iii) An increase from 0.5 to 2 percent in the export service charge;(iv) Elimination of interest withholding exemption for deposits of
Rs. 5,000 or less;(v) Fourfold increases in logging royalty rates;(vi) Payment of commercial interest on income tax arrears;(vii) A 100 percent increase in visa charges;
2.14 The new corporate rate structure would greatly simplify corporateincome taxation. The special incentives and exemptions, which eroded therevenue base in recent years need to be eliminated. Despite the argumentsthat special incentives would motivate investment in priority areas, attractforeign private investment and match incentives in neighboring countries, thecase against these special incentives is compelling. The incentives by theirnature distort the effective tax rate between and within sectors and result inthe mis-allocation of resources, and they lead to revenue losses. The specialincentives involve arbitrary and ambiguous instructions which are difficult toadminister. For example, the new Industrial Entrepreneurship Act, 1992,provides that 10 percent of gross profit can be deducted for expenses onproduct development, new technology and efficiency improvement. However, in amodernizing industrial sector, new industrial assets plausibly contribute toimproving "efficiency". Thus, the ambiguities create conflicts between taxadministration and tax payers. The incentives, while important, are not themost important factor in investment decisions, compared to predictable andsimple administration of the tax system, economic stability, adequateinfrastructure, trained labor force and a peaceful labor relationsenvironment, among others. Also the incentives may not attract foreigninvestments, where the home country tax operates such that it only offsets theNepal tax, resulting in a transfer from the Nepal treasury to the home countrytreasury.
2.15 Also, reform of tax administration, especially income taxadministration, needs to receive greater attention. Though a revenue servicehas been created with qualification and training requirements to bolsterrevenue performance, ti.e strengthening of income tax administration needs tobe emphasized as it is necessary to enforce compliance. A striking thingabout discussions with a cross-section of the taxpayers in Kathmandu is thelack of trust about the fairness of the system, and the arbitrariness with
- 40 -
which assessments are made. About 2,000 companies, accounting for about 70percent of income tax receipts are assessed, based on books and records. Manyare assessed based on "best judgement". For these companies, the income taxis economically similar to the turnover tax. Even companies with books andrecords often pay either the tax calculated on books or the tax determined by"best judgement", whichever is higher. Losses are seldom a'lowed. Thesystem often results in protracted negotiations and pressures on tax payers.For individuals, the largest share of the income tax comes from withholding aswould be expected; but there is no reliable information on how many employeesare subject to withholding or how many who had income tax withheld during theyear failed to file a declaration of income. Restoring confidence and trustwould require a more transparent system with a unified code incorporating alllegal provisions and rules, and close supervision from higher levels. It isalso necessary that the appellate machinery function efficiently.
Taxes Related to Land and BuildincT
2.16 Three kinds of property taxes have been imposed by the centralGovernment. Registration tax is imposed on transfers of land and building;wealth tax is imposed progressively on tangible and intangible assets; andland revenue is determined annually, based on the size of land and itsproductivity. In FY92, the total property tax revenue accounted for 6.8percent of revenues, and the most important component is the registration tax,which raised 85 percent of the total. Land revenues, which raised 10.4percent of tax revenues as recently as FY76, now raise only 0.8 percent oftotal revenues because the tax rates have not kept pace with inflation. Thewealth tax which was proposed in FY91 provoked much resistance and complianceis poor. The main flaws of the registration tax are: the rate is high and isa distortior., and the minimum values are out of date. Nevertheless, Nepal hasa sound foundation for collecting property taxes on land and buildings. Thepositive elements include the existence of an updated land register,collection of the land revenue is based on a land register and 90 percent ofowners are paying currently, and valuation of land revenue is done objectivelyusing standard tables. The main reform adopted under the FY94 budget is toincrease the land tax rates for the first time in 25 years, by wide margins ofover 87 percent.
Summary and Conclusion
2.17 The Government has taken initial steps under the FY94 budget toimprove revenue mobilization, and some specific measures have been adopted to(i) broaden the income tax as well as property and land tax nets, (ii)simplify sales and excise taxes and (iii) adjust custom duties. The mainincome tax measures include raising the surcharge on exports as a proxy for atax on export income, taxes on interest earnings and on house rent, andcommercial interest on income tax arrears. The structure of excise tax wassimplified, and over twenty items removed from the list to facilitate itsadministration. For sales taxes, the multi-rate structure was simplified to atwo rate structure. The auction system was abolished, the affected goods werebrought under the OGL, and duty rates increased. The total increase inrevenues envisaged is Rs.3.2 billion, 21.1 percent over FY93 and is a major
- 41 -
effort relative to the increase of 9.2 percent in FY92; and the new measuresalone are expected to raise Rs.1.7 billion.
2.18 While it is too early to assess the outcome of these measures,the preliminary result of the mid-year budget review is encouraging. Strongperformance was recorded in income taxes which rose by 81 percent during thefirst half of the year compared to the same period in FY93, as 3000 new taxpayers were added in the Kathmandu district alone. Sales tax revenues rose by35 percent during the same period; import tax revenues rose by 43 percent,helped by import increases from the liberalization measures; and export taxesrose by 200 percent, due to an increase in the service charge on exports as aproxy for taxing export income. But other tax sources performed poorly; forexample, excise revenues fell by 13 percent, due mainly to a fall in cementproduction. The total revenue increase for the first 6 month period of FY94is 16 percent, and tax (excluding nontax) revenues alone rose by 28 percent.
2.19 More work remains to be done in some critical areas to redressthe basic wealnesses of the revenue system. The need to improve income taxadministration and consolidate the structure of personal income taxes hasalready been noted tpara 2.15]. In addition, progress towards the VAT is themain instt-ument proposed by various studies to restructure the tax system tomake it more responsive. Proposals to extend the sales tax base (to, forexample, large retailers and professionals), abolish the use of tax exemptionsas an incentive measure and adjust specific excise rates are initial steps tointroduce a partial VAT, and they are necessary if domestic consumption is toemerge as the dominant source of revenues. To make progress towards the VAT,it would be meaningful if the credit system is extended and unified orinvoice-based valuation is applied universally, and if the tax is extended tothe wholesale stage (and to other dealers depending on the size of turnover)at the same time. Alternatively, the present rudimentary system of providingrelief for input tax could be upgraded into a regular invoice-based creditmechanism in the first instance and then the tax extended to a wider range ofproducts and dealers, that is, wholesalers and large retailers. Bringing awider ra-ge of wholesale products and retailers would require time for
23/preparation- , including training tax officials as well as tax payers andaccountants, which is necessary to administer the VAT. The sales taxdepartment was separated from the Tax department only a year or so now. Itcurrently handles only simple tasks as the tax applies mainly to imports andexcisable commodities, and once the customs and excise valuations areestablished, they are accepted for sales taxation. Preparation would also berequired to introduce the credit and invoice mechanism. Increasing theadministrative resources for the sales tax department has to be treated withurgency in order to equip the department, which is only about a year old, tohandle the task of implementing an invoice-operated sales tax.
W Milkha Casanegra de Jantscher and Carlos Silvani, "Guidelines for Administering VAT" in Alan Tait(edstr) "Value-Added Tax: Administrative and Policy Issues", 1991.
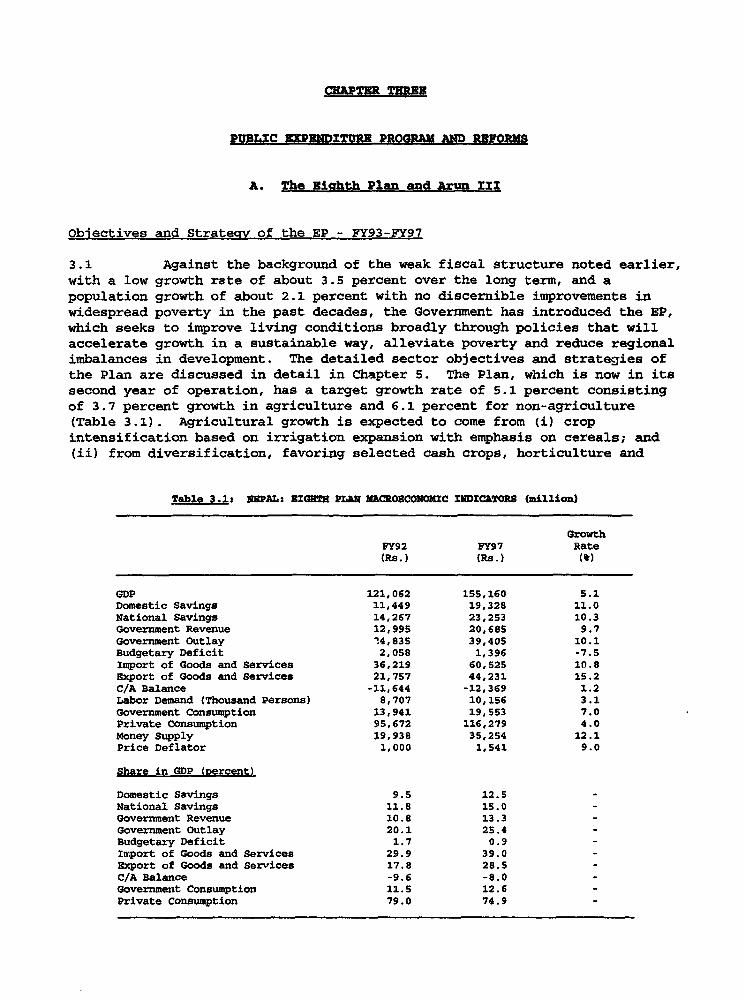
CHAPTBR THREU
PUBLIC EXP D ITURU PROGRAM AND REVORMS
A. The Nl±hth Plan and Arun IXI
Obiectives and Strategv of the EP - FY93-FY97
3.1 Against the background of the weak fiscal structure noted earlier,with a low growth rate of about 3.5 percent over the long term, and apopulation growth of about 2.1 percent with no discernible improvements inwidespread poverty in the past decades, the Government has introduced the EP,which seeks to improve living conditions broadly through policies that willaccelerate growth in a sustainable way, alleviate poverty and reduce regionalimbalances in development. The detailed sector objectives and strategies ofthe Plan are discussed in detail in Chapter 5. The Plan, which is now in itssecond year of operation, has a target growth rate of 5.1 percent consistingof 3.7 percent growth in agriculture and 6.1 percent for non-agriculture(Table 3.1). Agricultural growth is expected to come from (i) cropintensification based on irrigation expansion with emphasis on cereals; and(ii) from diversification, favoring selected cash crops, horticulture and
Table 3.1: NEPAL: BIoHTH PLAN MACROECONOMIC XNDICATORS (million)
GrowthFY92 FY97 Rate(RS.) (Rs.) (W)
GDP 121,062 155,160 5.1Domestic Savings 11,449 19,328 11.0National Savings 14,267 23,253 10.3Government Revenue 12,995 20,685 9.7Government Outlay 24,835 39,405 10.1Budgetary Deficit 2,058 1,396 -7.5Import of Goods and Services 36,219 60,525 10.8Export of Goods and Services 21,757 44,231 15.2C/A Balance -11,644 -12,369 1.2Labor Demand (Thousand Persons) 8,707 10,156 3.1Government Consumption 13,941 19,553 7.0Private Consumption 95,672 116,279 4.0Money Supply 19,938 35,254 12.1Price Deflator 1,000 1,541 9.0
Share in GDP (yercent)
Domestic Savings 9.S 12.5National Savings 11.8 15.0Government Revenue 10.8 13.3Government Outlay 20.1 25.4Budgetary Deficit 1.7 0.9Import of Goods and Services 29.9 39.0Export of Goods and Services 17.8 28.5C/A Balance -9.6 -8.0Government Consumption 11.5 12.6Private Consumption 79.0 74.9
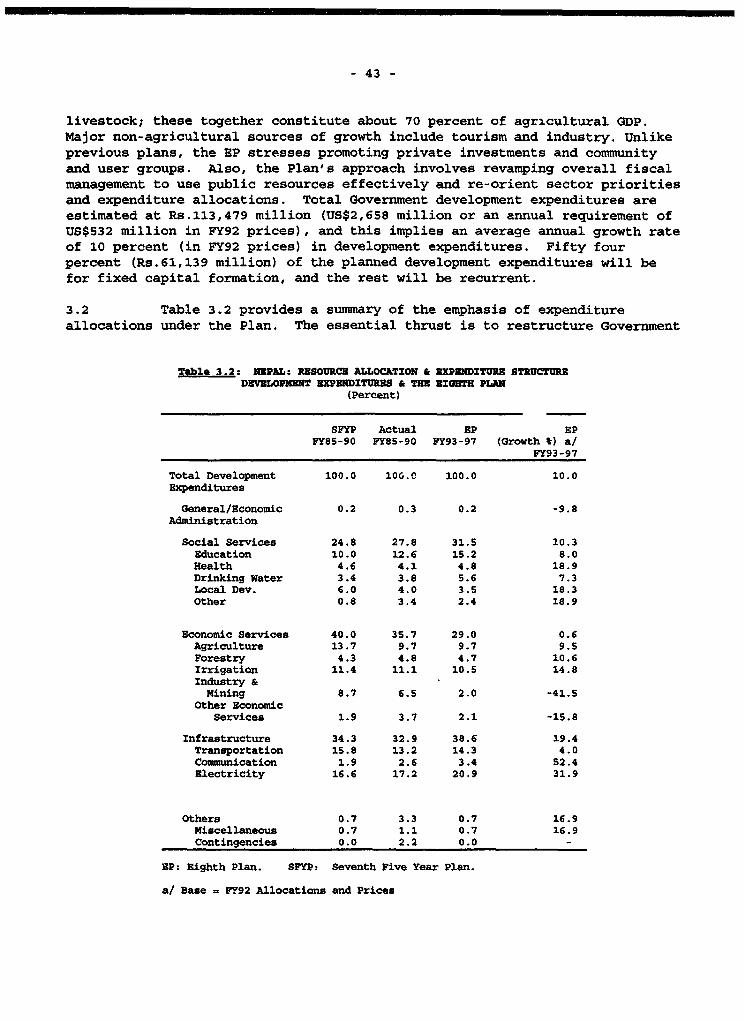
- 43 -
livestock; these together constitute about 70 percent of agricultural GDP.Major non-agricultural sources of growth include tourism and industry. Unlikeprevious plans, the EP stresses promoting private investments and communityand user groups. Also, the Plan's approach involves revamping overall fiscalmanagement to use public resources effectively and re-orient sector prioritiesand expenditure allocations. Total Government development expenditures areestimated at Rs.113,479 million (US$2,658 million or an annual requirement ofUS$532 million in FY92 prices), and this implies an average annual growth rateof 10 percent (in FY92 prices) in development expenditures. Fifty fourpercent (Rs.61,139 million) of the planned development expenditures will befor fixed capital formation, and the rest will be recurrent.
3.2 Table 3.2 provides a summary of the emphasis of expenditureallocations under the Plan. The essential thrust is to restructure Government
Table 3.2: NEPAL: RESOURCE ALLOCATION & NXPENDITURE STRUCTUREDBVBLOPMUES BXPNNDISTURS & THE NIGHTS PLAN
(Percent)
SFYP Actual BP BPFY8S-90 FY85-90 FY93-97 (Growth %) a/
FY93-97
Total Development 100.0 10G.C 100.0 10.0Expenditures
General/Economic 0.2 0.3 0.2 -9.8Administration
Social Services 24.8 27.8 31.5 10.3Education 10.0 12.6 15.2 8.0Health 4.6 4.1 4.8 18.9Drinking Water 3.4 3.8 5.6 7.3Local Dev. 6.0 4.0 3.5 18.3Other 0.8 3.4 2.4 18.9
Economic Services 40.0 35.7 29.0 0.6Agriculture 13.7 9.7 9.7 9.5Forestry 4.3 4.8 4.7 10.6Irrigation 11.4 11.1 10.5 14.8Industry &Mining 8.7 6.5 2.0 -41.5
Other EconomicServices 1.9 3.7 2.1 -15.8
Infrastructure 34.3 32.9 38.6 19.4Transportation 15.8 13.2 14.3 4.0Communication 1.9 2.6 3.4 52.4Electricity 16.6 17.2 20.9 31.9
Others 0.7 3.3 0.7 16.9Miscellaneous 0.7 1.1 0.7 16.9Contingencies 0.0 2.2 0.0 -
NP: Eighth Plan. SFYP: Seventh Five Year Plan.
a/ Base = FY92 Allocations and Prices
- 44 -
development expenditure allocations to (i) expand investments in the power
sector; (ii) spend more to maintain and improve the gains made in education,
family planning, health and other human resource development activities and tocurb population growth; and (iii) expand investments in rural infrastructureto promote agriculture and raise rural income. In addition to power, which is
discussed below, the social sectors are to get p_eferred access to resources;they would grow at 10.3 percent, and their share of the Plan budget will riseto 31.5 percent from 24.8 percent under the Seventh Five Year Plan (SFYP).Education will gain the most among social sector activities, with 15.2 percent
(10 percent under the SPYP). Similarly, the relative allocations to othersocial programs including health and drinking water will increase. Transportand communication infrastructure will grow at about 5 percent and will absorb17.7 percent of estimated EP resources. On the other hand, the growth of
economic services will be negligible at 0.9 percent, and the sector share willdecline from 40 percent in the SFYP to 29.0 percent with the EP. Expenditures
on industry will decline by 41.5 percent, with a share of 2.0 percent, whichis very low relative to 8.7 percent under the SFY1-.
Private Sector Development
3.3 The EP puts strong emphasis on private sector expansion.Accordingly, the Plan is considered "indicative", and 64.1 percent of thetotal fixed capital investment of Rs.170,332 million is expected to come from
the private sector. Clearly, expanding Government financing support forpriority development expenditure programs will be difficult without privatesector growth and Government withdrawal from various sectors. For example,promoting private sector development in the economic services sectors, such as
industry and agriculture, will reduce inefficient subsidies while improvingthe productivity of these activities. Already, various privatization and
private sector development programs are being implemented. These include thedivestiture of public manufacturing enterprises, leasing of state farms to the
private sector, private importation and distribution of chemical fertilizers,the phasing out of state monopoly control in domestic aviation andliberalization of private investment licensing requirements in power and other
sectors. Other measures, such as limiting direct Government investment andmanagement in irrigation, rehabilitating small and medium scale irrigationschemes and turning them over to the private sector, reviewing irrigationsubsidies, limiting the role of the central Government in implementing anddelivering rural water supply services, and promoting user group and community
forest programs require to be implemented in a sustained manner. Thecomprehensive program formulated to restructure retained public corporationsand commercialize them needs to be followed through with implementation byliquidating the uneconomic units and restructuring the potentially viablecorporations including, utilities and social services, which will remain inthe public domain in the foreseeable future. Promoting private sectordevelopment and fostering commercialization in these areas require greatercommitment to implementing existing policies rather than formulating new ones.
3.4 The Government is aware that changes in the overall policyenvironment are needed to complement divestiture policies to give consistentsignals for private sector development. This awareness has been shown by the
- 45 -
strong proactive measures adopted to liberalize trade and exchange ratepolicies as discussed earlier. Also, price controls on major products,including petroleum products, power and water have been relaxed. However,fundamental changes in the pricing regime, such as introducing an independentpricing commission for monopoly goods and abolishing existing price controlstatutes for competitive goods need to be implemented. Predictable pricingpolicy is critical for promoting private sector investments. Finally, strongactions are needed in the financial policy area to expand private sectordevelopment. For example, the poor performance of the two large state-ownedcommercial banks which account for over 70 percent of deposits has to beturned around. The Government strengthened the capital base of the statebanks recently at the cost of about Rs. 3.27 billion, and the banks are takingsteps to recover unpaid loans and reduce costs by laying off staff. But onlyone is beginning to improve its financial performance, while the other isstill making substantial losses. Since continuing poor performance of thestate-owned banks will undermine lending for the private sector and imposesubsidy burdens on the Government through further recapitalization, proposalsbeing considered to strengthen loan recovery, improve loan screening and worktowards privatizing the banks need to be followed through with a time boundreform program. Nepal already has successful joint venture and privatelymanaged banks; three new private banks started operating in FY93, and threeother requests for licensing are being processed.
Arun III
3.5 On the public sector side, the Arun III (402 MW) hydropowerproject (AHP) is the main and largest physical investment being consideredunder the Government's EP as an essential part of efforts to accelerateeconomic growth and development. Accelerated and broadbased economic growthis considered important for improving widespread low income levels. Whileagricultural expansion is important in that regard, its scope is limited byvarious factors. Accelerated economic growth requires sustained high rate ofindustrial expansion, which would be difficult in the face of persistent powershortages. Industry has been a leading source of growth -- about 6-7 percent-- in recent years. Also, expansion of tourism, a major potential source ofgrowth, requires reliable and increased supply of power to deliver urbanservices. In addition, if AHP is managed successfully the increased supply ofpower, coupled with life line tariff rates for low income groups, wouldrelieve pressure on fuelwood and on forest resources, for the benefit of otheractivities, especially cropping and livestock. Power shortages and periodicload shedding stand to impede the desired effects of liberalization policieson private investments, and AHP is considered of strategic importance as afirst step towards developing the abundant hydropower resource endowments to(i) overcome persistent domestic power shortages, which undermine industrialgrowth as well as to (ii) generate surpluses for exports. AHP would open easyaccess to other potential hydropower projects in the Arun Valley which couldbe developed to enhance export earnings. Because of size and site conditions,AHP will be implemented in two phases, and the first phase (201Mw) is to becompleted by the year 2002; therefore, additional measures and resources arerequired to accommodate power shortages in the interim. The total estimatedcost of AHP is $1466 million; the first phase will cost US$760 million, and
- 46 -
its financing and expenditure claims will dominate the public investmentprogram in the nineties. Under the original EP resource envelope, the powersector expenditures would grow at 32 percent in real terms and absorb 20.9percent of resources during the Plan period. However, under the revisedresource envelope of the Base Case extending to the end of the decade, whichis adopted in this report, power will absorb 30 percent (15 percent of localresources and 40 percent of foreign resources) during FY1994-FY2000, more thandouble the level of the eighties; and AHP alone will account for 50 percent ofthe power sector resource claims. Charts 3.1 and 3.2 illustrate the profilesof financing for total power sector expenditures and for AHP. Financing forpower will be most needed during the peak implementation phase (FY96-FY99)when the sector will absorb an average of 36 percent and AHP close to 20percent of projected development resources.
S. The Imortance of Reforms For Imilement±na AHP and Other Proarama
3.6 Given the already weak fiscal situation discussed earlier inChapter 1, the high costs and financing requirements of AHP pose risks to theorderly management of the Nepal's overall development program, includinginvestments in human resources and rural infrastructure. What would be alikely fiscal outlook and the public resource management situation if AHP wereinserted into the existing development expenditure program without any fiscaladjustments and improvements? This issue was examined using a macroeconomicframework with various scenarios, including a Business-As-Usual (BAU) and BaseCase scenarios. The BAU scenario is discussed here, and the Base Case whichis based on the PFP is discussed in the next section. BAU represents nofiscal reforms or what might occur if reforms already initiated were to fizzleout after the implementation of Arun is started. Its main features are: (i)an average GDP growth of 3.8 percent, which is within the range of the long-term growth of 3.5 percent achieved prior to the Trade and Transit Impasse andthe political revolution; (ii) average revenue increase of 0.2 percent of GDPa year, a little better than 0.1-0.15 percent of GDP in the late eighties;(iii) an average domestic borrowing of around 2.6 percent of GDP, which isconsistent with the long-run average of over 2.0 percent attained in theeighties and 2.6 percent attained more recently in FY90-FY93; also, (iv) thedomestic borrowing pattern will influence domestic debt repayment and regularexpenditures which will reach 9.1 percent of GDP by FY2000, increasing by 0.2percent of GDP a year from a base of 7.8 percent in FY92; this increase has tobe compared to the average of 0.23 percent of GDP obtained during the decadeending in FY91. Table 3.3 provides a summary of the macroeconomic assumptionsand the fiscal outlook of the BAU scenario.
3.7 The simulation shows local resource availability coming undersevere pressure. There will also be a local financing gap resulting from thedifference between the resource envelope of the BAU Case and projectedexpenditures based on the EP. The local financing gap would be equivalent to3.1 percent of GDP or approximately US$125 million a year, which would be toolarge to be filled by reasonable revenue effort and additional domesticborrowing, and steps would have to be taken to redress the imbalance.Inevitably, expenditures other than Arun would have to contract. It isdifficult to map out the exact nature of the expenditure contraction in
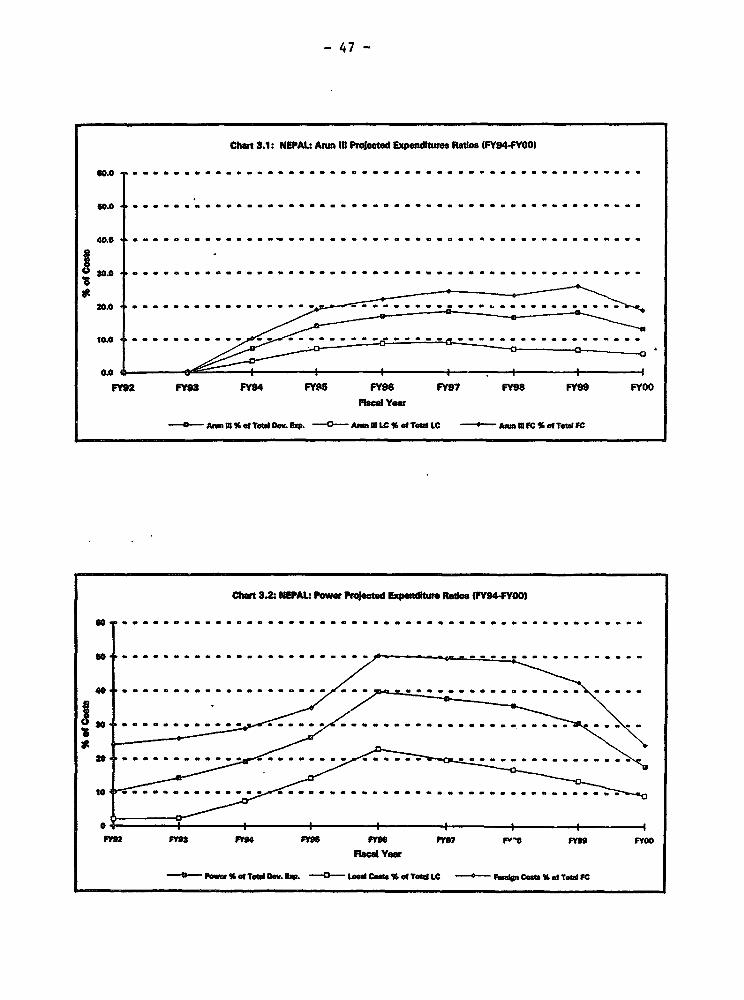
- 47 -
Cat 3.1: NEPAL Am Il Projece Expenditues Ratis IFY94FYOO)
40.0 .. ... _ .
50.0 .................
40.0 * ......
0.0
FM9 F3 FY94 FY95 F"6 FY7 FY98 FY99 FY00
Fisc Yer
-4-Amn L % of TOW Oem. EXP. -0--Am. U LC % ofrTea LC --- AmI M FC % of Tota FC
et 3.2 MAwEP Pwer Pojected Exwpnitr Ra Y""M lY
60 . . *---------
40 w""***oZ@"""s~~~~~~~~~. . . . . . . . . . . . . . .
FYM3 rft3 Y4 F9 FM9 FM7 F'8 Fms FYOO
Flsc Yea
a0 fewe V. of Teu O. s. *0 led Cas % of Tead LC + Fp Com % at Teow FC
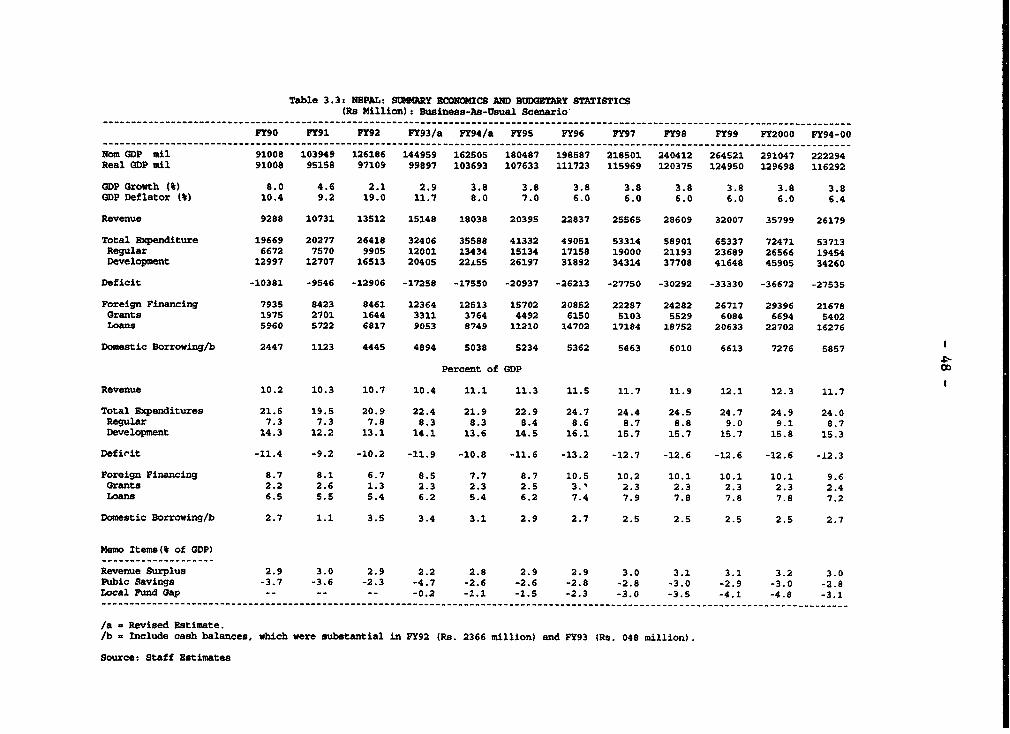
Table 3.3: NEPAL: SUMMARY ECONOMIC8 AD BUDGEIARY STATISTICS(Rs Million): Business-As-Usual Scenario
------- _-------------------------------------_---------------------__--------__-----------------------------------------------------
FY90 FY91 FY92 FY93/a FY94/a FY95 PY96 FY97 FY98 FY99 FY2000 FY94-00----------------------------------------------------- _-----,--__-------------__-----------------------------------------------------
Nom GDP mil 91008 103949 126186 144959 162505 180487 198587 218501 240412 264521 291047 222294Real GDP mil 91008 95158 97109 99897 103693 107633 111723 115969 120375 124950 129698 116292
GDP Growth (%) 8.0 4.6 2.1 2.9 3.8 3.8 3.8 3.8 3.8 3.8 3.8 3.8GDP Deflator (%) 10.4 9.2 19.0 11.7 8.0 7.0 6.0 6.0 6.0 6.0 6.0 6.4
Revenue 9288 10731 13512 15148 18038 2039S 22837 25565 28609 32007 35799 26179
Total Expenditure 19669 20277 26418 32406 35588 41332 49051 53314 58901 65337 72471 53713Regular 6672 7570 9905 12001 13434 15134 17158 19000 21193 23689 26566 19454Development 12997 12707 16513 20405 22±55 26197 31892 34314 37708 41648 45905 34260
Deficit -10381 -9546 -12906 -17258 -17550 -20937 -26213 -27750 -30292 -33330 -36672 -27535
Foreign Financing 7935 8423 8461 12364 12513 15702 20852 22287 24282 26717 29396 21678Grants 1975 2701 1644 3311 3764 4492 6150 5103 5529 6084 6694 5402Loans 5960 5722 6817 9053 8749 11210 14702 17184 18752 20633 22702 16276
Domestic Borrowing/b 2447 1123 4445 4894 5038 5234 5362 5463 6010 6613 7276 5857 1
Percent of GDP X
Revenue 10.2 10.3 10.7 10.4 11.1 11.3 11.5 11.7 11.9 12.1 12.3 11.7
Total Expenditures 21.6 19.S 20.9 22.4 21.9 22.9 24.7 24.4 24.5 24.7 24.9 24.0Regular 7.3 7.3 7.8 8.3 8.3 8.4 8.6 8.7 8.8 9.0 9.1 8.7Development 14.3 12.2 13.1 14.1 13.6 14.5 16.1 15.7 15.7 15.7 1S.8 15.3
Defivit -11.4 -9.2 -10.2 -11.9 -10.8 -11.6 -13.2 -12.7 -12.6 -12.6 -12.6 -12.3
Foreign Financing 8.7 8.1 6.7 8.5 7.7 8.7 10.5 10.2 10.1 10.1 10.1 9.6Grants 2.2 2.6 1.3 2.3 2.3 2.S 3.' 2.3 2.3 2.3 2.3 2.4Loans 6.5 S.S 5.4 6.2 S.4 6.2 7.4 7.9 7.8 7.8 7.8 7.2
Domestic Borrowing/b 2.7 1.1 3.S 3.4 3.1 2.9 2.7 2.5 2.5 2.5 2.5 2.7
Memo Items(* of GDP)
Revenue Surplus 2.9 3.0 2.9 2.2 2.8 2.9 2.9 3.0 3.1 3.1 3.2 3.0Pubic Savings -3.7 -3.6 -2.3 -4.7 -2.6 -2.6 -2.8 -2.8 -3.0 -2.9 -3.0 -2.8Local Fund Gap -- -- -- -0.2 -1.1 -1.5 -2.3 -3.0 -3.5 -4.1 -4.8 -3.1
/a - Revised Estimate.lb - Include cash balances, which were substantial in FY92 (Rs. 2366 million) and PY93 (Rs. 048 million).
Source: Staff Estimates
- 49 -
the absence of a meaningful prioritization, but based on past experience, non-
wage O&M activities and capital intensive programs would be the most
vulnerable, and this would affect the recurrent cost financing for various
sectors, such as transport, irrigation, forestry, agriculture services and
drinking water, thereby limiting the productivity of these activities and the
growth process. Also, with the limits on local resources, aided activities
and on-going programs would have longer implementation delays.
3.8 Eventually, since the social sectors have the highest intensity
of local resource absorption (in recent years on average, a unit percent real
increase in expenditures will result in a local fund use of Rs.ll0 million at
the margin for social services compared to Rs.48 million for infrastructure),a cut back in social programs would be unavoidable for accommodating the local
financing gap. The EP allows an 8 percent annual real growth in social sector
expenditures, a rate which the public sector analysis of this report shows to
be feasible in terms of institutional capacity and appropriateness for meeting
Nepal's human resource development needs. It is calculated that the social
sector will actually grow by 5-6 percent a year under the BAU scenario and
will absorb about 27 percent of the expenditure contraction required to
eliminate the local financing gap. The economic services sector would absorb
45 percent of the contraction and infrastructure 28 percent. A five percent
annual growth rate for social activities over a decade would lead to social
sector expenditures 25 percent less compared to what would be achieved with 8
percent growth. The ad hoc expenditure adjustment and the vulnerability of
O&M financing means that capacity utilization and productivity of existing
investments and growth would be adversely affected. This would have grave
consequences. For education, given that it is more difficult to cut teachers'
salaries which account for over 70 percent of costs, contraction in the sector
would most likely fall on materials, renovation of school facilities, teacher
training, other improvement programs and the expanding of access to new
communities. In the event, the current low literacy rates and poor school
performance would worsen, especially in the rural areas which constitute about
90 percent of the population with limited or no access to private education.
In health, the existing shortages in staff, drugs and infrastructure would
persist, spelling serious setbacks to service delivery and social conditions;
and similarly for economic services, including agriculture services and
irrigation. These developments would represent a serious setback to the
Government's attempts to invest more in human resources and rural
infrastructure to help alleviate Nepal's widespread poverty. Currently,
independent estimates suggest only a third of adults are literate; net primary
school enrollments are about 50 percent and lower for girls, and only 39
percent of teachers are trained. The current population of 19 million is
expected to double in 25 years without an effective population program.Infant and child mortality rates of 102 and 165 per thousand are among the
highest in the world. While progress has been made in various areas, such as
immunization and malaria control, the situation has remained fragile and reeds
constant monitoring and financing support, as indicated, for example, by the
recent resurgence of drug resistant malaria in various parts of the country.
On the whole, implementing AHP without substantive fiscal reforms would
seriously undermine human resource development and broad-based growth and
- so -
development, and it will weaken the fiscal structure even further through theoverhang of more domestic debt servicing on top of stagnant revenues.
C. Macroeconomic and Fiocal Reformx
Recuired Reforms to Manage AHP
3.9 The effective implementation of the principal expenditureprograms of the EP, including the AHP, requires very strong reform measures tomake substantive improvements in fiscal and public resource management. Thesemeasures underpin the analysis in this section, and they are consistent withthe PFP framework (FY93-FY96) extended to the year 2000 to illustrate thepresentation. First, average GDP growth will be about 4.2-4.5 percent, whichis consistent with performance under recent adjustment programs, but betterthan the long-term growth rate of 3.5 percent. Second, on the resource side,the actions expected to be taken to restructure the tax system and enhancerevenue mobilization by revamping tax administration, expanding the income taxnet, simplifying sales taxes and introducing a VAT are discussed in chaptertwo. These tax measures are expected to raise revenues by 0.5-0.6 percent ofGDP annually during the three year perJ.od ending in FY96 and by 0.3 percent -one percent higher than the BAU Case - for the rest of the nineties. Thisrevenue profile is a significant effort compared to actual performance ofO.15-0.2 percent of GDP achieved in the recent past. Third, while domesticborrowing is required to augment revenues, this would have to be prudent inorder to preserve fiscal stability, leave room for private credit and containthe surge in domestic debt and debt service in recent years. Domesticborrowing will average 1.1 percent of GDP, compared to 2.6 for the BAUscenario. Fourth, apart from debt servicing, the pattern of regularexpenditures will depend on the growth of public employment and compensationin the context of on-going civil service reforms. Reduction of staff inunsuitable positions, selective hiring in areas of staff shortages and limitson real wage increases will be expected to contain regular expenditure growthwhile allowing non-wage recurrent expenditure financing for completedinvestments. Regular expenditures are expected to decline initially from over8 percent in FY93 to 7.8 percent of GDP in FY96, and they are expected to risewith the need for recurrent cost financing, especially for expanded socialprogram, reaching 8.6 percent of GDP by FY2000.
3.10 The assumptions and macroeconomic outlook of the Base Case (orPFP-Extended Case) are summarized in Tables 3.4 and 3.5. According to thesimulation results covering the period FY94-FYOO, if the existing expenditurepattern were retained together with proposed BP activities, the aggregateresource envelope would be able to cover an estimated 89 percent ofdevelopment expenditures, and local funds will cover about 72 percent of localcost financing requirements. Even with tax restructuring and an enhancedrevenue effort, the local financing gap between the resource envelope andprojected expenditures without prioritization would be equivalent to 2.4percent of GDP. The resource envelope will support a development expendituregrowth averaging 7.2 percent a year in constant value terms. This will cover
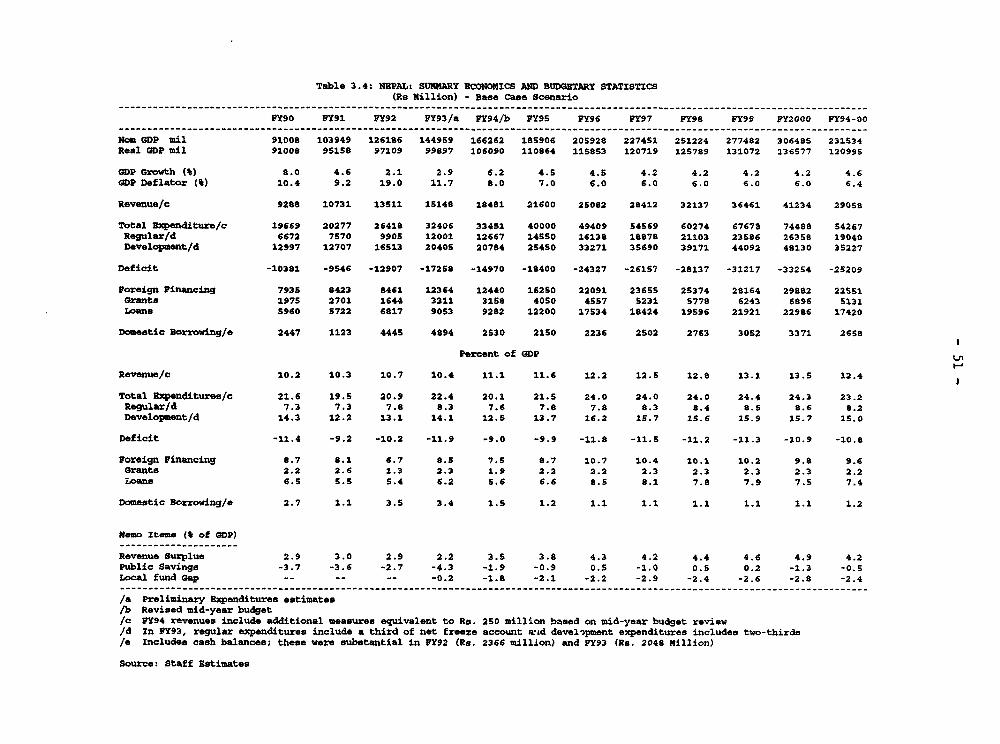
Table 3.4: NEPAL: SUMURTY BCOUNWICS AND BUDGBTARY STATISTICS(Re Million) - Base Case scenario
---------------------------- _----------------------------------__----_-------__-----_-----------------------------------------------
FY90 FY91 FY92 PY93/a PY94/b FY95 PY96 FY97 FY98 FY99 FY2000 PY94-00------------------------------------------ _-------------------___------------__-----------------------------------------------------
NWO GDP mil 91008 103949 126186 144959 166262 185906 205928 2274S1 251224 277482 306485 231534Real GDP ail 91008 951S8 97109 99897 106090 110064 115853 120719 125789 131072 1236577 12099S
GDP Growth (t) a.0 4.6 2.1 2.9 6.2 4.5 4.5 4.2 4.2 4.2 4.2 4.6GDP Deflator (1) 10.4 9.2 19.0 11.7 8.0 7.0 6.0 6.0 6.0 6.0 6.0 6.4
Revenue/c 9288 10731 13511 15148 18481 21600 25082 28412 32137 36461 41234 29058
Total Expen4iture/c 19669 20277 26418 32406 33451 40000 49409 54569 60274 67678 74488 54267Regular/d 6672 7570 990S 12001 12667 14550 16138 18878 21103 23586 26358 19040Development/d 12997 12707 16513 20405 20784 25450 33271 35690 39171 44092 48130 35227
Deficit -10381 -9546 -12907 -1725s -14970 -18400 -24327 .26157 -28137 -31217 -33254 -25209
Foreign Financing 7935 8423 8461 12364 12440 16250 22091 23655 25374 28164 29882 22551Grants 1975 2701 1644 3311 3158 4050 4557 5231 5778 6243 6896 5131Loans 5960 5722 6817 9053 9282 12200 17534 18424 19596 21921 22986 17420
Domestic Borrowing/e 2447 1123 4445 4894 2530 2150 2236 2502 2763 3052 3371 265S
Percent of GDP
Revenue/c 10.2 10.3 10.7 10.4 11.1 11.6 12.2 12.5 12.8 13.1 13.5 12.4
Total Expenditures/c 21.6 19.5 20.9 22.4 20.1 21.5 24.0 24.0 24.0 24.4 24.3 23.2Regular/d 7.3 7.3 7.8 8.3 7.6 7.8 7.8 8.3 8.4 8.S 8.6 8.2Development/d 14.3 12.2 13.1 14.1 12.S 13.7 16.2 15.7 15.6 1S.9 1S.7 1S.0
Deficit -11.4 -9.2 -10.2 -11.9 -9.0 -9.9 -11.8 -11.5 -11.2 -11.3 -10.9 -10.8
Foreign Financing 8.7 8.1 6.7 8.5 7.5 8.7 10.7 10.4 10.1 10.2 9.8 9.6Grants 2.2 2.6 1.3 2.3 1.9 2.2 2.2 2.3 2.3 2.3 2.3 2.2Loans 6.5 5.5 5.4 6.2 5.6 6.6 8.S 8.1 7.8 7.9 7.5 7.4
Domestic Borrowing/e 2.7 1.1 3.5 3.4 1.S 1.2 1.1 1.1 1.1 1.1 1.1 1.2
Nemo Items (4 of GDP)
Revenue Surplus 2.9 3.0 2.9 2.2 3.5 3.8 4.3 4.2 4.4 4.6 4.9 4.2Public Savings -3.7 -3.6 -2.7 -4.3 -1.9 -0.9 O.S -1.0 O.S 0.2 -1.3 -O.SLocal fund Gap -- -- -- -0.2 -1.8 -2.1 -2.2 -2.9 -2.4 -2.6 -2.8 -2.4------------------------------------------------------------------- __--------__-----------------------------------------------------
/a Preliminary Bxpenditures estimates/b Revised mid-year budget/c PY94 revenues include additional measures equivalent to Rs. 250 million based on mid-year budget review/d In PY93, regular expenditures include a third of net freeze account and devealpment expenditures includes two-thirds/e Includes cash balances; these were substantial in FY92 (Re. 2366 million) and FY93 (Rs. 2048 Million)
Source: Staff Bstimates
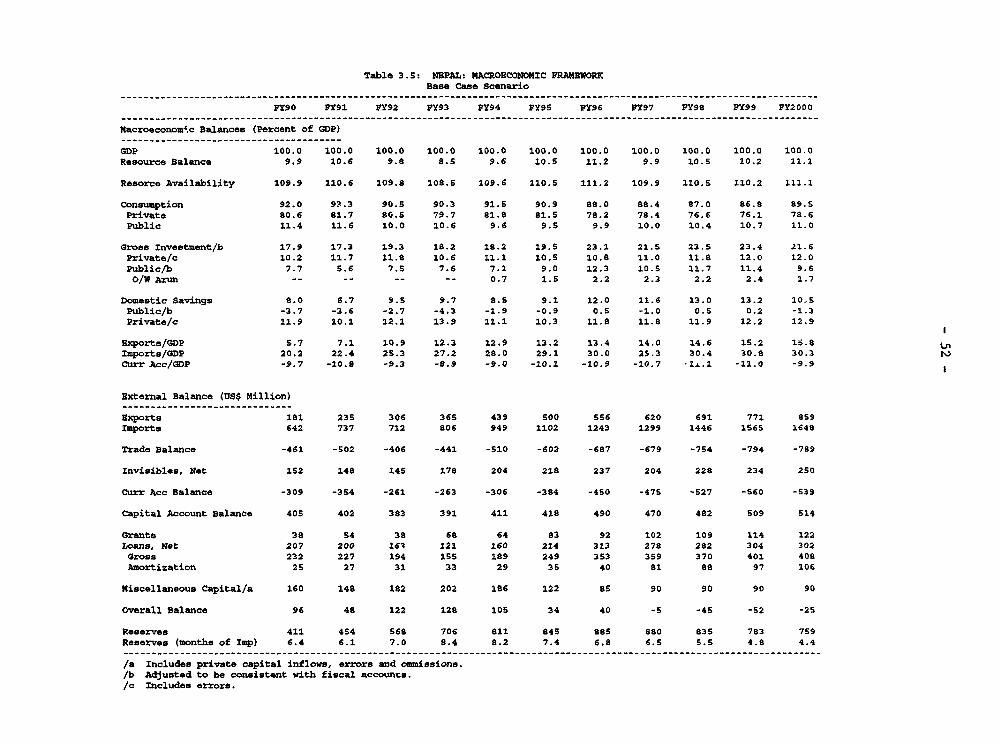
Table 3.5: NBPAL: NACROBCONOMIC FPRAEWORKBase Case Scenario
----------------- _---------------------------------------------__------------__---------_------_-___--------------------_--
Fy9o FY91 FY92 FY93 FY94 PY95 FY96 FY97 FY98 FY99 PY2000----------------------------------------------------------------- __----------__--------_----------__-----__-_------__-___--
Macroeconom4.c Balances (Percent of GDP)---------------------------------------
GDP 100.0 100.0 100.0 100.0 100.0 100.0 100.0 100.0 100.0 100.0 100.0Resource Balance 9.9 10.6 9.8 8.5 9.6 10.s 11.2 9.9 10.5 10.2 11.1
Resorce Availability 109.9 110.6 109.8 108.s 109.6 110.S 111.2 109.9 110.5 110.2 111.1
Consumption 92.0 91.3 90.S 90.3 91.5 90.9 88.0 89.4 87.0 86.8 a9.sPrivate 80.6 81.7 8O.S 79.7 81.8 81.S 78.2 78.4 76.6 76.1 78.6Public 11.4 11.6 10.0 10.6 9.6 9.s 9.9 10.0 10.4 10.7 11.0
Gross Investment/b 17.9 17.3 19.3 19.2 18.2 19.S 23.1 21.S 23.5 23.4 21.6Private/c 10.2 11.7 11.8 10.6 11.1 10.S 10.B 11.0 11.8 12.0 12.0Public/b 7.7 S.6 7.5 7.6 7.1 9.0 12.3 10.5 11.7 11.4 9.6O/W Arun -- -- -- 0.7 l.s 2.2 2.3 2.2 2.4 1.7
Domestic Savings 8.0 6.7 9.s 9.7 8.5 9.1 12.0 11.6 13.0 13.2 20.SPublic/b -3.7 -3.6 -2.7 -4.3 -1.9 -0.9 0.5 -1.0 O.S 0.2 -1.3Private/c 11.9 10.1 12.1 13.9 11.1 10.3 11.8 11.8 11.9 12.2 12.9
Exports/GDP 5.7 7.1 10.9 12.3 12.9 13.2 13.4 14.0 14.6 15.2 S.8nImports/GDP 20.2 22.4 25.3 27.2 28.0 29.1 30.0 25.3 30.4 30.8 30.3Curr Acc/GDP -9.7 -10.8 -9.3 -8.9 -9.0 -10.1 -10.9 -10.7 ,.1- -11.0 -9.9
Bxternal Balance (US$ Million)______________________________
Exports 18 235 306 365 439 S00 556 620 691 771 859Imports 642 737 712 806 949 1102 1243 1299 1446 1565 1648
Trade Balance -461 -S02 -406 -441 -510 -602 -687 -679 -754 -794 -789
Invisibles, Net 152 148 145 178 204 218 237 204 228 234 250
Curr Acc Balance -309 -354 -261 -263 -306 -384 -450 -475 -527 -560 -539
Capital Account Balance 405 402 383 391 411 418 490 470 482 s09 514
Grants 38 54 38 68 64 83 92 102 109 114 122Loans, Net 207 200 164 121 160 214 313 278 282 304 302Gross 232 227 194 155 189 249 353 359 370 401 408Amortization 25 27 31 33 29 35 40 8l as 97 106
Miscellaneous Capital/a 160 148 182 202 186 122 as 90 90 90 90
overall Balance 96 48 122 128 1oS 34 40 -5 -45 -52 -25
Reserves 411 454 s68 706 811 845 885 8ao 835 783 759Reserves (months of imp) 6.4 6.1 7.0 8.4 8.2 7.4 6.8 6.5 5.s 4.8 4.4
/a Includes private capital inflows, errors and ommissions./b Adjusted to be consistent with fiscal accounts./c Includes errors.
- 53 -
the main proposed development activities, including rural programs, AHP andsocial services, but it depends critically on (i) the adoption of a tightdevelopment expenditure program focussing on the priority high rate of returnactivities and on (ii) improved performance of NEA to generate internalresources equivalent to about 0.2-0.3 percent of GDP to support the expandedpower sector expenditures. It is because of the need to eliminate the localgap through meaningful measures that the expenditure prioritization iscritical for orderly public resource management and is a major differencebetween this scena.Lio and the BAU Case. Also, the average fiscal deficitwould be equivalent to 10.8 percent of GDP under this scenario, compared to12.3 percent in the BAU Case. Unlike the BAU Case, which involves a highlevel of domestic borrowing and a more weakened fiscal system with low growthand deteriorating capacit' for debt servicing, the tax reform measuresunderlying the Base Case provide scope for greater revenue mobilization aswell as for sustainable aid utilization and O&M financing with less domesticborrowing and for a strengthened fiscal structure in the end.
3.11 In the case of the external sector, the foreign financingsituation is likely to be manageable, though the current account deficit willwiden from 8.9 percent of GDP in FY93 to 10.7 percent by the end of the EPperiod in FY97 (Table 3.5). The overall BOP surplus will give way to adeficit during the peak implementation phase of AHP, reaching US$ 52 millionby FY99, and declining to US$ 25 million by FY2000 (Table 3.5); and reserveswill fall from the equivalent of over 8 months of impo ts currently to about6.5 months by FY97 or an average of 5-6 months a year during the second halfof the nineties.24/ The initial strong balance of payments and reservesposition and the availability of soft aid is expected to provide adequatecoverage for the foreign costs of AHP.
3.12 Table 3.6 summarizes the overall outlook of the required sectoralexpenditure adjustments under the Base Case relative to sectoral expenditureshares in the light of recent performance. she Table shows the simulatedsector allocations up to FY97 in order to compare with the EP periodallocations, and it indicates higher growth for health only and lower growthrates for almost all other sectors relative to the Plan targets. Economicservices absorb more of the shortfall than the other sectors; there areadequate allocations for priority social activities; and the share for poweris close to the EP target, but much less than recent power investment plansproposing increases of about 50 percent, which will not be feasiblewithout significant turn around in the performance of NEA. Under anyrealistic scenario of improved revenue mobilization, the importance of scalingback development activities through prioritizing and adopting a tighter, morefocussed development expenditure program cannot be over-emphasized.
-/ Based on reduced private capital inflows to under US$100 million a year by FY97; minimal spill-over effects of the expanded expenditures; average export volume growth of about 10 percent whichis about half of recent average performance; increased responsiveness of imports to recent tradeliberalization with import elasticity of 1.3 for non-aided imports, which is higber than 0.9 duringthe pre-liberalization period; and the ratio of aided imports to external financing rising from thehistorical level of about 60 percent to about 70-80 percent average during the peak implementationphase of Arun.
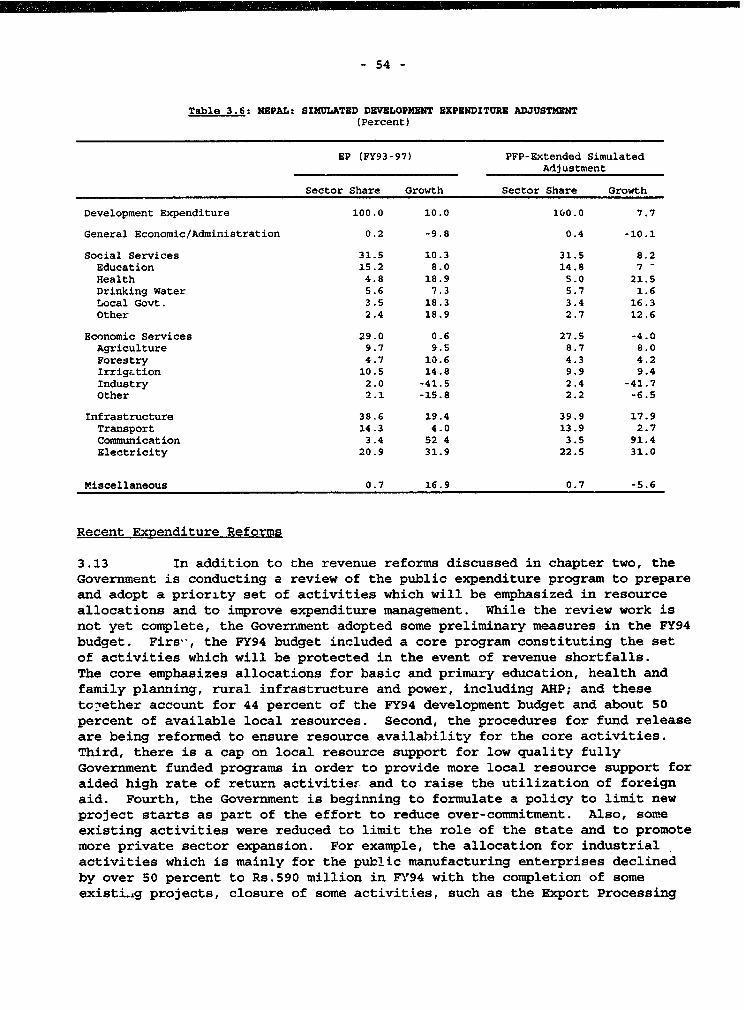
- 54 -
Table 3.6: NEPAL: SIMULATED DEVELOPMENT EXPENDITURE ADJUSTMENT(Percent)
EP (FY93-97) PFP-Extended SimulatedAdjustment
Sector Share Growth Sector Share Growth
Development Expenditure 100.0 10.0 160.0 7.7
General Economic/Administration 0.2 -9.8 0.4 -10.1
Social Services 31.5 10.3 31.5 8.2Education l5.2 8.0 14.8 7Health 4.8 18.9 5.0 21.5Drinking Water 5.6 7.3 5.7 1.6Local Govt. 3.5 18.3 3.4 16.3Other 2.4 18.9 2.7 12.6
Economic Services 29.0 0.6 27.5 -4.0Agriculture 9.7 9.5 8.7 8.0Forestry 4.7 10.6 4.3 4.2IrrigLtion 10.5 14.8 9.9 9.4Industry 2.0 -41.5 2.4 -41.7Other 2.1 -15.8 2.2 -6.5
Infrastructure 38.6 19.4 39.9 17.9Transport 14.3 4.0 13.9 2.7Communication 3.4 52 4 3.5 91.4Electricity 20.9 31.9 22.5 31.0
M.iscellaneous 0.7 16.9 0.7 -5.6
Recent Exnenditure Reforms
3.13 In addition to the revenue reforms discussed in chapter two, theGovernment is conducting a review of the public expenditure program to prepareand adopt a priority set of activities which will be emphasized in resourceallocations and to improve expenditure management. While the review work isnot yet complete, the Government adopted some preliminary measures in the FY94budget. Firs-, the FY94 budget included a core program constituting the setof activities which will be protected in the event of revenue shortfalls.The core emphasizes allocations for basic and primary education, health andfamily planning, rural infrastructure and power, including AHP; and theseto?ether account for 44 percent of the FY94 development budget and about 50percent of available local resources. Second, the procedures for fund releaseare being reformed to ensure resource availability for the core activities.Third, there is a cap on local resource support for low quality fullyGovernment funded programs in order to provide more local resource support foraided high rate of return activitier and to raise the utilization of foreignaid. Fourth, the Government is beginning to formulate a policy to limit newproject starts as part of the effort to reduce over-commitment. Also, someexisting activities were reduced to limit the role of the state and to promotemore private sector expansion. For example, the allocation for industrialactivities which is mainly for the public manufacturing enterprises declinedby over 50 percent to Rs.590 million in FY94 with the completion of someexisti.g projects, closure of some activities, such as the Export Processing
- 55 -
Zone, and with no new public investments in manufacturing. In agriculture,fertilizer subsidies were reduced by over 40 percent to Rs.350 million withrelaxation of various restrictions to encourage private sector import anddistribution of chemical fertilizers, which has been a virtual state monopoly.
3.14 In the area of institutional development, the nucleus of amonitoring unit to (i) improve expenditure reporting and provide early warningon fiscal performance and (ii) monitor the financial implementation of thecore program has already been created in the MOF; and the unit will beprovided with budgetary resources to strengthen staff and facilities.Similarly, the NPC has set up the nucleus of a project screening andexpenditure programming unit to be able to review the public investmentportfolio on a regular basis and improve the quality of irvestments. TheGovernment is also pursuing administrative reforms to reduct over-staffing,provide incentives to the civil service by reviewing the pay structure andother incentives; and establish processes to nforce accountability for theuse of public resources and raise the performance of projects. Initially,bold steps were taken to retrench some 3500 higher level staff and torestructure various ministries. More recently, with the completion of thecivil service census and enactment of the civil ser- z-e bill, the Governmenthas shifted its focus from retrenchment to addressing *he systemic factorsimpeding the efficiency of the civil service. The incentive system is beingre-oriented by moving towards developing more objective criteria forperformance evaluation and a more transparent process for recruitment,posting, promotion and compensation. Also, increases in the total wage billare expected to be limited to the inflation rate as the Government takesaction to reduce staff in unsuitable positions, while hiring selectively tofill vacant posts in areas of skill shortages.
3.15 While it is too early to assess the full impact of the spendingreforms, the FY94 expenditure target is consistent with the PFP-ESAFframework, and the measures adopted have reduced allocations by about Rs.1.0billion or 5 percent of FY93 expenditures. Also, given the uncertainties ofrevenue performance, the Government initially developed a contingency plan toreduce allocations for non-core expenditures by an additional Rs.500 millionin local currency, as warranted for fiscal prudence and to ensure adequatelocal resource support for the core program. For this purpose, fund releasesfor the non-core were to be slowed down by Rs.125 million in each of theremaining four fund release cycles. As discussed earlier [paras 2.17-2.18],however, the results of the Government's mid-FY94 budget review indicate thatprogress is being made especially in revenue mobilization. Nevertheless,local resources remain severely constrained by aid shortfalls. Counterpartfunds from program ioans and commodity assistance are expected to fall shortby Rs. 1.2 billion. Based on an overall expected resource shortfall of Rs.500 million, the Government will now manage the situation by mobilizingadditional revenues and adjusting the non-core expenditures by equal amounts.
3.16 The Government is aware that the measures taken in the FY94 budgetare only initial steps. Significant actions in the area of expenditureprioritization are yet to be taken. While the adoption of a core program isan encouraging start, this needs to be accompanied with a streamlined non-core
- 56 -
which will provide flexibility in protecting the core from resourceshortfalls. To reduce the over-crowded public investment portfolio, lowquality activities need to be identified and phased out or restructured;policies restricting new projects need to be implemented; and the role of thestate needs to be rclled back in the various sectors to foster a greater rolefor the private sector. Accordingly, the Government plans to adopt moreexpenditure reforms after completing the expenditure review and prioritizationwork it is currently undertaking. The work will enable the Government todevelop a 3-year rolling budget of the top priority activities and to identifylow priority activities which will be phased out as part of the FY95 budget.The rest of this chapter will examine sector performance issues and summarizethe sector options and trade-offs involved in the adoption of a prioritydevelopment expenditure program.
D. Summarv of Proposed Sector Expenditure Reforms
3.17 The rest of this section provides a summary of sector expenditureperformance and the potential expenditure trade-offs involved in formulating aprioritized expenditure program, and it discusses areas where expenditureadjustments could be made to focus public resources on the high returnprojects. A summary of the main sector objectives, issues and proposedadjustments is attached to the end of this chapter (Table 3.10), and moredetailed reviews are presented for each sector in Chapter 5. The approach toevaluating the sectoral performance involves mainly comparing Nepal'sexpenditure pattern to that of other LDCs for which relevant data areavailable, and analysis of rates of return (ROR) and institutionalconstraints. The cross-country evidence summarized in BOX A indicates thatgovernment expenditures affect growth, but that the productivity impact variesby sector and the phase of development of the countries studied. There is,however, a general indication of (i) greater impact of education, transportand communication expenditures on growth than of other sectoral expenditures;and (ii) higher ROR on primary school education relative to higher levels ofeducation. The inter-count.y comparison does not imply that Nepal shouldadopt the norms of other countries; however, gross discrepancies relative tothese countries would signal that the situation be assessed to determine ifadjustments are warranted. Even with the normal caveats concerning RORanalysis and the political considerations that influence expenditureallocations, high ROR and high productivity of projects are crucial forachieving the growth rate necessary for making impact on poverty in Nepal.
Sector Expenditures and Proposed Adiustments
3.18 The review of expenditure performance in this section starts withthe social sectors. In education, the main expenditure reform issues relateto (i) increasing allocations to the sector with emphasis on improving thequality of Basic and Primary Education and improving equity by extendingaccess for girls through curriculum reform, teacher training and supervision,rehabilitation of facilities and special programs for girls and selecteddistricts; (ii) reducing imbalances in allocating resources among the
- 57 -
different levels of the education system by generating more internal financingin higher education and providing more support to raise quality for secondaryschools; and (iii) restructuring the current system of higher education bytransferring higher secondary system (which accounts for over 60 percent ofuniversity students) from the university. These reforms which have beenidentified by various Government reports are warranted by the current state ofthe education sector's financing and performance. Based on Table 3.7 whichsummarizes the sector composition of total Government expenditures25 t,Nepal's expenditure share for education was stable at 10.1 percent in theeighties, and this was at the lower end of the LDC average of 10-15 percent.However, the allocation increased to 12.7 percenC and actual expenditures were13.6 percent in FY93, the first year of the EP. If sustained, this increasedspending would rank Nepal among the middle group of LDCs.26/ Also, whilebudget allocations for education were low in the past, there has also beenimbalances in resource use among programs within the sector. For example,higher education has a relatively high share averaging 20-25 percent of sectorresources, while the share of secondary schools is 13 percent, compared to 31percent for Asia. Also, while there are no recent studies of efficiency,studies conducted in the seventies show significant differences in the ROR forthe various levels of the education system. Generally, the social ROR ishigher at the primary school level, declining at the higher levels. Forexample, the social ROR estimates are 29.1 i._.rcent for lower secondary, 8percent for upper secondary and 11.5 percent for a bachelor's degree.-The Government's current emphasis on quality improvement (rather thanexpansion) for Basic and Primary Education and including it in the coreprogram is appropriate, given the current outcomes of the existing system.For example, the prim,ary school completion rate is only 35 percent, half theaverage for Asia, and repetition rates are high. For secondary schools, theaverage pass rate was 46 percent in FY89-FY90 and 24 percent in FY91. About60 percent of students at Tribhuvan University are engaged in higher secondaryeducation programs, which can be provided at much lower cost outside theuniversity setting. Measures currently under implementation to reconstitutehigher secondary as part of the secondary school system should be followedthrough as well as other measures to raise admission standards to theuniversity, reform the university curriculum, raise student contribution to-osts and promote private institutions in higher education.
U/ Table 3.7 is appropriate for cross-country comparison because it aggregates both regular anddevelopment expenditures and avoids problems caused by variations in classification amongcountries.
24 From cross-country data in the World Development Report for 1992, Government expenditureshares on education range from a low of about 9 percent (Zaire, Mali, indonesia, Zambia) tomiddle values of 10-15 percent (Bangladesh, Egypt, Sri Lanka and Malawi) to high values of over16 percent (Thailand, Ghana, Kenya, Myanmar, and Philippines). The average share is in the rangeof 10-15 percent.
W7 Nirmal Prasad Pandey, "Cost Benefit Analysis of Education, A Case Study of Nepal" cited in"Nepal, Education and Human Resource Assessment", May 1988; pp. 2.158-2.162. W. D Haddad et al:"Education and Development, Evidence for New Priorities", World Bank Discussion Paper No 95,1991.
- 58 -
Box A
Sectoral Mx=enditure Allocation and Economic Growth
A brief overview of the literature on the impact of Governmentsectoral expenditures on economic growth and development is instructive.A large segment of this literature dating as far back as Adam Smithassigns importance to human resource development (HRD). In recentstudies, expenditures on education, health and training are shown to havethe highest output elasticities relative to expenditures oninfrastructure. The average output elasticity of HRD is, for example,shown to be at least 3 times that of infrastructure capital, and theproductivity of ERD is estimated to be higher in low income (less than$3,000 per capita) countries, compared to medium and high incomecountries. Recently estimated ROR for education are generally in therange of 20-32 percent; and primary education has higher ROR relative tosecondary and higher education. Another segment of cross-country studiesattaches significance to infrastructure investments, especially transportand communication. These have ROR estimates in a broad range 12.1 to 42.8percent, with significant variations in Asia, Africa and the Americas.Also, the ROR estimates for transport and communication have changed overtime, for example, from 42.8 percent in 1970-79 to 20.8 in FY80-91 forEast Asia; and from 24.4 percent to 36.8 percent for Africa during thesame period. ROR are higher for transport and communication than forwater supply and urban development.
Despite caveats concerning methodology and quantification ofbenefits, the overall evidence on the effects of sectoral expenditures oneconomic growth is very strong. It suggests that (i) greater impact ofeducation, transport and communication expenditures on growth than forother sectoral expenditures, such as defence; (ii) the primary schoollevel has greater ROR than higher levels of education; (iii) ROR arehigher for transport and communication than for water supply and urbandevelopment; (iv) the magnitude of the impact of sector expenditures ongrowth and development varies, depending on the phase of development aswell as the period covered by the study and the countries included in thesample.
Selected 8iblioqra_hv. Adam Smith, Wealth of Nations (Skinner Edo), pp. 77-78; Jo Battes andA. Shah, USectoral Allocation of Investment and Economic Growth". World Bank, 1992; S.Bandyopadhyay and S. Devarajan, "Using Rates of Return to Inform Sectoral AllocationDecisions". World Bank, 1993; W. Easterly and S. Rebelo, "How Do National Policies AffectLong-run Growth?". World Bank, 1993; G. Psacharopoulos, "Return to Education" in ComDarativeEducation, vol. 17 no. 3, 1981.
- 59 -
3.19 In health, some Government efforts are paying off. For example,immunization coverage has grown steadily, exceeding 80 percent in some cases(e.g., DPT3), and malaria eradication has progressed, though there has been a
recent resurgence in some districts. However, the pirformance of some major
programs has remained below expectation. Population programs, for example,
have had little discernible impact. New sterilization procedures have dropped
from a peak of 68,000 in the mid-eighties to under 20,000 a year currently,
and the contraceptive prevalent rate is 24 percent, compared to 40 percent
required to reduce the population growth rate to 2 percent. The sector share
of total Government spending was over 4 percent in the eighties and ranked
Nepal in the middle relative to the low income LDCs during that period.281However, this has slipped to a low of 3.2 percent since the start of the
nineties. In addition, O&M financing is inadequate with shortage of skilled
staff, including doctors and female nurses. Non-wage O&M also requiresincreased financing to deliver services.
3.20 The Government is appropriately providing more resources for
promotive and preventive health care to redress the decline in the past years,
and it has adopted a core program focussed on immunization, maternal and child
health, family planning and malaria eradication. It has also provided more
allocations to finance TA/DA required to deliver outreach programs. The otherexpenditure efficiency issues include restructuring personnel policies to hiremore skilled staff and improving the institutional management with specific
action programs to consolidate the performance of existing facilities. The
Government needs to be selective in expanding new facilities while stressing
improved performance and service delivery from existing facilities.
3.21 Drinking water and sanitation are priority program areas; however,
increased resource allocations to the sector need to be accompanied with a newinstitutional approach to water supply delivery and management. Currently,
ROR estimates for projects are generally low, some at 3 percent. While sector
expenditures have risen and, officially, water supply coverage has been
extended to an estimated 67 percent of the urban and 40 percent of the rural
population, the quality and reliability of delivery needs to be improved. The
performance of rural drinking water projects has been inhibited by
(i) emphasis on physical construction and lack of community organizationalsupport, (ii) low quality of construction - studies indicate that in somecases, 25 percent of the Department of Water Supply and Sanitation (DWSS)
rural water schemes require rehabilitation shortly after completion, and
(iii) inadequate capacity to manage and sustain service delivery at the rural
level. For urban areas (i) an estimated 35-40 percent of water supply is lost
for reasons related to defective pipes, leakage, illegal connections and poor
billing, though work is now under way to reduce these problems; (ii) tariffshave been low and uneconomic until recent increases; and (iii) institutions
have been financially weak and unable to maintain deliveries. There is
Most of LDC allocations for health are in the range of 4-8 percent of total Governmentspending in FY90, and these include countries like Bangladesh, Kenya, Sri Lanka, Zambia, Malawiand Philippines. A few countries like Mali and Bolivia are below 3 percent; and Ecuador is up to11 percent. See World Development Report, 1992.
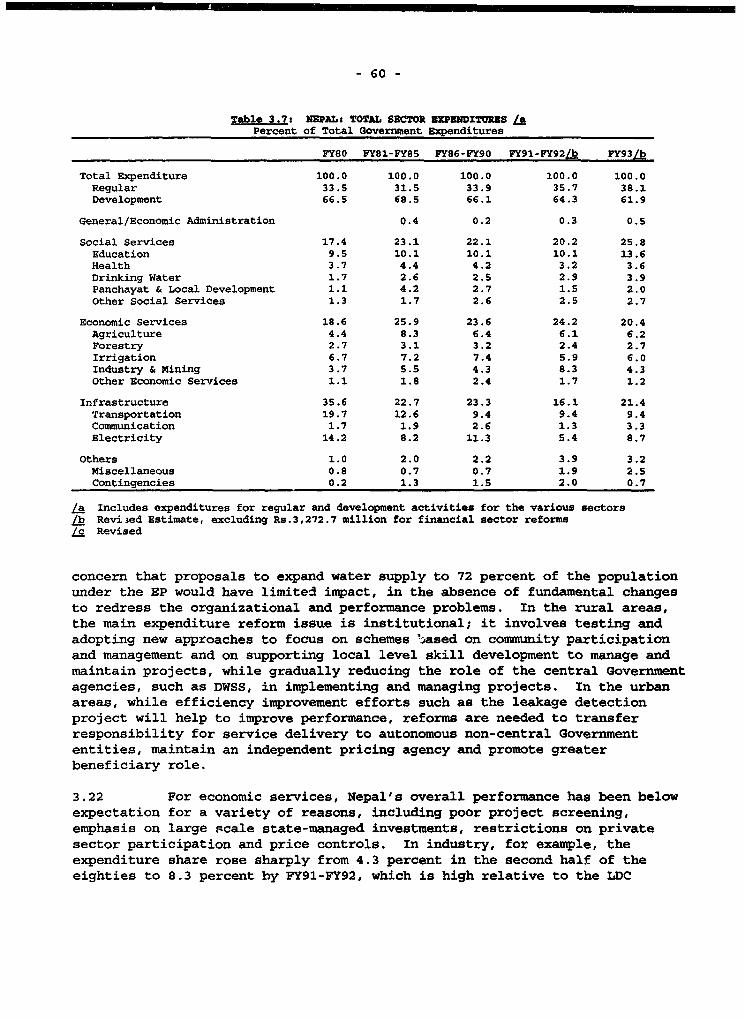
- 60 -
Table 3.7: NEPAL: TOTAL SECTOR EIPENDITURES /iPercent of Total Government Expenditures
FY80 FY81-FY85 FY86-FY90 FY91-VY92jb FY93 L
Total Expenditure 100.0 100.0 100.0 100.0 100.0Regular 33.5 31.5 33.9 35.7 38.1Development 66.5 68.5 66.1 64.3 61.9
General/Economic Administration 0.4 0.2 0.3 0.5
Social Services 17.4 23.1 22.1 20.2 25.8Education 9.5 10.1 10.1 10.1 13.6Health 3.7 4.4 4.2 3.2 3.6Drinking Water 1.7 2.6 2.5 2.9 3.9Panchayat & Local Development 1.1 4.2 2.7 1.5 2.0Other Social Services 1.3 1.7 2.6 2.5 2.7
Economic Services 18.6 25.9 23.6 24.2 20.4Agriculture 4.4 8.3 6.4 6.1 6.2Forestry 2.7 3.1 3.2 2.4 2.7Irrigation 6.7 7.2 7.4 5.9 6.0Industry & Mining 3.7 5.5 4.3 8.3 4.3Other Economic Services 1.1 1.8 2.4 1.7 1.2
Infrastructure 35.6 22.7 23.3 16.1 21.4Transportation 19.7 12.6 9.4 9.4 9.4Communication 1.7 1.9 2.6 1.3 3.3
Electricity 14.2 8.2 11.3 5.4 8.7
Others 1.0 2.0 2.2 3.9 3.2Miscellaneous 0.8 0.7 0.7 1.9 2.5Contingencies 0.2 1.3 1.5 2.0 0.7
la Includes expenditures for regular and development activities for the various sectorsb Revi3ed Estimate, excluding Rs.3,272.7 million for financial sector reforms
/c Revised
concern that proposals to expand water supply to 72 percent of the populationunder the EP would have limited impact, in the absence of fundamental changesto redress the organizational and performance problems. In the rural areas,the main expenditure reform issue is institutional; it involves testing andadopting new approaches to focus on schemes 'ased on community participationand management and on supporting local level skill development to manage andmaintain projects, while gradually reducing the role of the central Governmentagencies, such as DWSS, in implementing and managing projects. In the urbanareas, while efficiency improvement efforts such as the leakage detectionproject will help to improve performance, reforms are needed to transferresponsibility for service delivery to autonomous non-central Governmententities, maintain an independent pricing agency and promote greaterbeneficiary role.
3.22 For economic services, Nepal's overall performance has been belowexpectation for a variety of reasons, including poor project screening,emphasis on large scale state-managed investments, restrictions on privatesector participation and price controls. In industry, for example, theexpenditure share rose sharply from 4.3 percent in the second half of theeighties to 8.3 percent by FY91-FY92, which is high relative to the LDC
- 61 -
average. 29/ The mainly large scale public manufacturing enterprises (PME),which absorb over 70 percent of the industry sector's expenditures, haveperformed poorly. Only 5 of 25 PME generated surpluses during FY86-FY91, andeven these profits reflected high tariffs, especially on tobacco products.Actual ROR (represented by the ratio of profits to total assets) on all thePME has been negative and deteriorated from -3 percent in FY86 to -9 percentin FY91, the most recent data available. The Government is now limiting thesector expenditure share to about 2 percent under the EP, and it reducedallocations to 1.7 percent of the FY94 budget. A program to privatize PME isbeing implemented together with a freeze on new investments in manufacturing.
3.23 In agriculture, the growth rate of production has more or lessstagnated at a level barely above the population growth rate in the past twodecades, and the need for reforms is widely recognized. Sector strategy andexpenditure policies are being reviewed under the Perspective Plan forAgricultural Development currently under formulation. The main elements ofthe evolving approach emphasize (i) farmer-managed irrigation to supportintensive cultivation, (ii) greater farmer participation in designing,constructing and managing irrigation projects, (iii) liberalized input marketsand dominant private sector role in importing and marketinig fertilizers, (iv)decentralized agricultural research and extension support driven by farmers'sneeds, (v) diversification based on comparative advantages in selected cashcrops, horticulture and livestock and (vi) rural infrastructure investments.
3.24 For irrigation, expenditures have been around 5-7 percent ofGovernment spending, and the performance of projects has been mixed. Smallscale farmer-managed schemes have shown promising results with actual ROR inexcess of 25 percent, while large scale state-managed irrigation schemes havegenerally done poorly with low marginal productivity and low ROR as most haveinadequate access to water and have low capacity utilization.-0/ Forexample, twelve large irrigation projects implemented by the Department ofIrrigation had an effective utilization rate of 57 percent. Natural factorshave constrained over 50 percent of command area to monsoon irrigation only,making year round cultivation and crop intensification difficult. WhileGovernment has made efforts to emphasize high ROR investments by canceling andre-designing low quality projects, the impact of these measures onproductivity remains to be seen. The evidence on sector performance points tothe need to promote small scale farmer-managed irrigation schemes, which havebeen more promising and currently account for 71 percent of total irrigatedarea. This approach is expected to make agriculture more productive, withless Government financing. Expenditures on new large scale state-managedinvestments need to be restricted, as they have performed poorly, but they
/ The available cross-country data for industry range from a low of 1.2 to 3 percent of totalGovernment expenditures (Bhutan, Burkina Faso and Pakistan) to a high of 7.8 to 9.6 percent(Senegal and Tanzania).
30/ The average appraisal ROR for large scale pipeline irrigation projects in the IrrigationMaster Plan is 5 percent under existing yield conditions, and only three of the ten have RORhigher than 10 percent. There are also significant gaps between appraisal and actual ROR; forexample, Kankai irrigation had 16 percent ROR at appraisal and 5.2 percent at project completion,and Sunsari Morang similarly had 17 percent and 0.5 percent respectively.
- 62 -
accounted for 50 percent of the sector development budget in the past years,46 percent (Rs.946 million) in FY93. The Government needs to rehabilitatesmall and medium scale investments for transfer to the private sector, shiftits role from implementing investments to building institutional support forirrigation management and maintenance and review the current subsidy schemefor irrigation investments to make it sustainable. The current subsidy variesfrom 40 percent to 90 percent and the funding support for it is inadequate.
3.25 The main expenditures on agriculture services cover chemicalfertilizers and agricultural research and extension. The Government is nowimplementing reforms to eliminate perennial fertilizer supply shortages byreducing subsidies and allowing private sector imports and distribution.Budgeted subsidies have dropped from 24 percent of the total agriculturebudget in FY91 to 11.2 percent (Rs.610 million) in FY93 and to Rs.350 millionin FY94. However, subsidies remain substantial for urea fertilizer, whichaccounts for about 50 percent of fertilizer sales. The s s-4dy on ureareflects the pricing situation in India. Also, the state monopoly control offertilizer marketing has remained strong in Nepal, and private imports areoccurring sluggishly. Though Indian policies circumscribe effectiveliberalization of the marketing of fertilizer in Nepal, efficiency could beimproved to some extent by abolishing domestic restrictions, includingdecontrolling prices and phasing out preferential policies which favor thestate-sponsored cooperatives relative to the private sector in wholesale andretail fertilizer distribution. For research and extension, the share fromtotal expenditures on agriculture has declined sharply in recent years, from17.6 percent in FY91 to 12 percent (Rs.646 million) in FY93. Research andextension activities are currently constrained by institutional and managerialfactors. In the research area, progress has been made in implementing therecommendations of the recent study to restructure the Nepal AgriculturalResearch Council. The Council itself needs to formulate a credible researchagenda and expand research capacity in some critical areas, such as cerealsand livestock fodder. Increased allocations should be based on progress inadopting a research agenda to support sector strategy and objectives. Reformshave been initiated in the extension area also by reorganizing extensionactivities under a new department, consolidating programs, privatizing statefarms and phasing out redundant centers. The Government needs to expand therole of the private sector even more (e.g., in veterinary services, supply ofimproved seeds, tree nurseries, etc.) to help expand access to services.
3.26 In forestry, the main concerns have been to contain growingdeforestation and adopt measures to use resources in a sustainable manner,satisfy environmental goals and raise the productivity of production forests.Sector policies are emphasizing (i) community and user group programsparticularly in the Hills; (ii) private leasehold; (iii) improved managementof production forests under national and leasehold programs mainly in theTerai; and (iv) protection of ecologically fragile areas. While budgetallocations for forestry have increased, resource absorption has been weak.Expenditures were equivalent to 86 percent of allocations in FY90 and 64percent in FY93, and the sector share of total Government spending hasdeclined from over 3 percent in the eighties to an average 2.4 percent duringFY91-FY93. The situation warrants greater attention on capacity building and
6- 3 -
institutional development rather than on increased resource flows alone to thesector. It is estimated that allocations to Community and User Groupprograms, which accounted for 29 percent of sector expenditures in PY90-FY92,could be reduced substantially, if such programs are designed based on localparticipation and with Government emphasis on research, extension service andtraining at the loca' level to develop skills required to sustain Communityand User Group activities. This requires empowering user groups and privateindividuals. The implementation of new policies under the Forestry Act torelax Government regulations on the production and use of trees would help toexpand the role of the private sector. There is also scope for privatization,for example, in the case of tree nurseries. Also, the Government needs tostrengthen the capacity to monitor and ensure adherence to required productionand environmental standards.
3.27 Transport sector development was the largest single activity,absorbing close to 20 percent of total Government expenditures in theseventies up to FY80, declining to under 10 percent currently (Table 3.7), androad transport alone accounts for 80 percent of sector expenditures. The RORon road transport investments are lower than normal for LDCs because Nepal hasrugged terrain with high construction costs and frequent maintenancerequirements, while traffic density is relatively low. The ROR estimates fornew construction on the Terai East-West highway routes, which constitute thebackbone of the transport system, have been in the range of 16-20 percent,lower than the range for other LDCs (see BOX A). The ROR is even lower fornew North-South (N-S) roads which traverse more difficult terrain and arecostly. For example, a sample of 16 new N-S roads evaluated has an averageROR of 7.9 percent, and only four have ROR above 10 percent. Highwayrehabilitation and maintenance projects, on the other hand, have the highestROR estimates with an average over 30 percent in many cases. Road assets aredeteriorating because of inadequate maintenance, and there is pressure toconstruct new roads to promote equitable access to transport facilities. Asystem of trails and suspension bridges and some thirty or so basic air stripsprovide access to remote areas.
3.28 The main sector expenditure trade-offs are (i) between maintenanceand new construction; and (ii) between road construction based on economicconsiderations or on equitable regional distribution. While the EP calls forimproved maintenance and more farm-to-market roads to support areas with highagricultural potential, it also puts more emphasis on N-S axis roads which areexpensive and may not be ecoonomic but deemed necessary for nationalintegration and equity. In the ev-nt, the transport investment portfolio isover-crowded with too many projects, resulting in under-financing and delayedexecution. For example, some projects have been under implementation for overdecade. As discussed in detail in chapter 5, selective investment in N-Sroads will be required to improve the situation of fragmented allocations,delayed execution of projects, cost overruns and inadequate maintenance oftransport assets. The investment portfolio needs too be reviewed in order todefer or restructure the low quality projects. Expenditures policies need toemphasize: strengthening the capacity to maintain transport assets and aprocess for deciding on priority activities; rehabilitation and maintenance ofroutes within the preliminary core network recently defined by the Government;
- 64 -
appropriately selected farm-to-market roads in line with agricultural policiesand access roads to support special projects, for example, in hydropower andtourism; and maintenance and upgrading of the trails, tracks, suspensionbridges and aviation infrastructure providing access to the remote. areas.
3.29 In the power sector, significant improvements in the performanceof the Nepal Electricity Authority (NEA) are needed to limit cost overruns inimplementing AHP, generate internal surpluses to augment the local resourcesavailable to the Government and meet interim power shortages during theimplementation of AHP. For example, a cost overrun of 15 percent in the Arunproject would result in additional foreign financing gap equivalent to 0.4percent of GDP or almost 3 percent of imports a year. NEA has to turn aroundpower supply losses which are equivalent to 25-30 percent of total powersupplies, and it has to improve the current low labor productivity and reducefinancial losses. Some of the performance problems have arisen fromuneconomic pricing, weak management and inefficient technology. Power supplylosses, for example, are attributed to technical inadequacies in transmissionand distribution, illegal connections and weak monitoring of service delivery.Also, rural power deliveries are costly and largely uneconomic. Among themain recent reforms, first, NEA's Board has been restructured, and it now hasa majority non-Governmental representation; also, NEA's top management hasbeen replaced. However, the impact of these managerial changes on improvingperformance has yet to be seen. In other reforms, hundreds of employees havebeen retired in a start to reduce over-staffing. Second, uneconomic pricingpolicies which undermided effective load management and the financial healthof NEA are being changed. The average tariff which was equivalent to about 50percent of long-run marginal costs in the eighties was raised by 60.4 percentin 1991, by 24 percent to Rs.2.88 (US$ 0.059) in March 1993 and again by 38percent effective March 1994. This, together with increased power sales fromMarsyangdi, has helped financial losses to decline from -2.9 percent ofrevalued assets in FY90 to -1.9 percent in FY91 and a prelimi.-ary estimate of-0.46 percent in FY92. These are bold steps; however, the overall impact onthe performance of the power sector and the financial stability of NEA remainsto be seen. The establishment of a tariff commission would provide moreflexibility for tariff adjustments which, together with efficiency improvementin NEA, would enable the country to earn the benefits of its investments.Also, the adoption of prioritized power sector investment program would be animportant part of efforts to develop the sector while limiting any crowdingout impact on other important development activities.
3.30 Third, since Arun III will not be completed until the year 2002,various options have been developed and some are already being implemented tomitigate intermediate power supply shortages. These include power importsfrom India, private sector investments in small scale hydropower projectswhich can be implemented quickly during the construction of Arun, reactivationof existing thermal and diesel plants, selective investment in new thermalpower plants and improved maintenance and efficiency in operating existingcapacity. NEA has adopted a power sector efficiency project with technicalassistance to (i) rehabilitate existing plants and recover the capacity whichwas lost because of inadequate O&M, (ii) replace obsolete equipment and reducepower losses from technical failures, (iii) reduce over-staffing and
- 65 -
(iv) improve financial control and accounting practices, among other things.These measures need to be implemented vigorously to reduce power supplylosses, limit new investments for intermediate power supply and raise thequality of services. In the absence of reliable service delivery, it will bedifficult to obtain consumer compliance to increased tariffs considerednecessary for efficiency pricing and to strengthen the financial base of NEA.With a successful execution of Arun III, and if NEA's performance were toimprove, it would be in a position to generate resources to support theGovernment's overall development efforts in the coming decade.
Summarv and Conclusions
3.31 Nepal's transition from the existing public investment pattern topriority expenditures focussing more resources on human resources, ruralinfrastructure and AHP will be difficult in the absence of substantive sectorexpenditure adjustments. While revenue improvements would help, these alonewill not support the scale of proposed financing requirements without theadoption of a strong prioritization program. An attempt to stretch availablefunds to cover all proposed projects and programs would have adverseconsequences. It would, for example, exacerbate the local cost fundingproblem and reduce the scopG for absorbing external aid effectively; it wouldfragment allocations and delay the execution of projects, with implicationsfor public physical investments; and it would undermine O&M financing andproductivity of completed investments, particularly for such sectors astransport, irrigation, education, health and urban water supply. The less thesuccess in adjusting the existing development expenditures, the more would bethe need to limit new investments in order to have fiscal stability. Table3.10 illustrates proposed expenditure adjustments.
3.32 The magnitude of the average local financing gap of 2.4 percent ofGDP suggests that it would be unrealistic to expect expenditure adjustments tobe borne by any single sector. The simulation results in Table 3.6 illustratethe profile of potential adjustments, and they indicate higher growth forhealth and family planning only and less growth for almost all sectorsrelative to the EP targets. Tables 3.8 and 3.9 illustrate the outcome ofadjustments and the average sector shares based on a simulated prioritization.For example the average annual difference between the historical allocationand the prioritized expenditures is equivalent to 1.2 percent of GDP for theeconomic services sector. The power sector will gain the most relative to thehistorical pattern, rising from 1.5 percent of GDP in FY91 to 4.9 percent inFY96 and FY97 with NEA's contribution to local funds. other sectors whichshow greater shares to GDP relative to their historical patterns includeeducation and health. Expenditures on many sectors, including industry, othereconomic services, forestry and other social services show stagnation ordecline relative to GDP. These are mostly areas where Government is fosteringgreater private sector participation as discussed earlier. Restraining thesesectors would enable the extra resources mobilized from revenue reforms to bechannelled to the priority expenditure programs.
3.33 Shifts in sectoral expenditures affect the need for local fundsand the scope to generate the complementary local resources to use aid
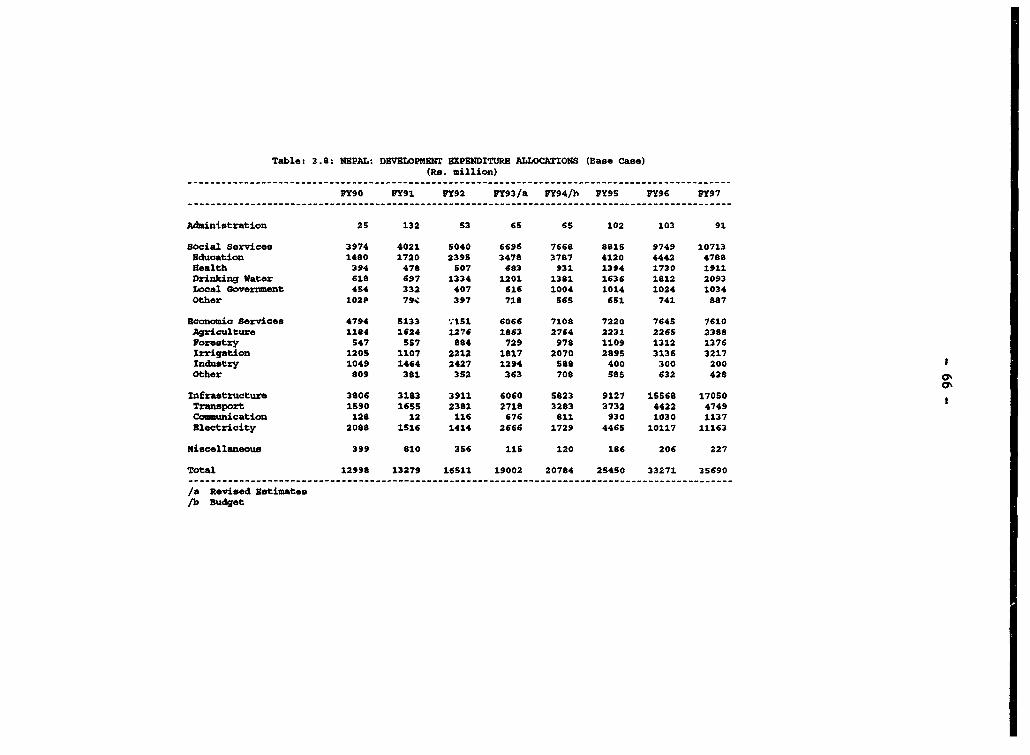
Table: 3.9: lNBAL: D8VBLWPMBT gXPBMDITUR8 ALLOCATIONS (Base Case)(Re. million)
------------.-------------------------------------------------- __------------__-----------------
PY90 PY91 PY92 PY93/a PY94/h FY9S PY96 PY97
Administration 25 132 53 65 65 102 103 91
Social services 3974 4021 5040 6696 7668 8815 9749 10713education 1480 1720 2395 3478 3787 4120 4442 4788Health 394 478 507 683 931 1394 1730 1911Drinking Water 618 697 1334 1201 1381 1636 1812 2093Local Government 4S4 332 407 616 1004 1014 1024 1034Other 102t 79S 397 718 S65 651 741 887
Bconomic Services 4794 5133 t1.51 6066 7108 7220 764S 7610Agriculture 1184 1624 1276 1863 2764 2231 2265 2388Forestry 547 557 884 729 978 1109 1312 1376Irrigation 1205 1107 2212 1817 2070 2895 3136 3217Industry 1049 1464 2427 1294 588 400 300 200 1Other 809 381 352 363 708 585 632 428 0h
Infrastructure 3806 3183 3911 6060 S823 9127 15568 170S0Transport 1590 1655 2381 2718 3283 3732 4422 4749Communication 128 12 116 676 811 930 1030 1137Blectricity 2088 1516 1414 2666 1729 4465 10117 11163
Miscellaneous 399 810 356 11S 120 186 206 227
Total 12998 13279 16511 19002 20784 25450 33271 35690-------------------------- _--------,_ -----------------------------------------------------------
/a Revised 8etimateslb Budget
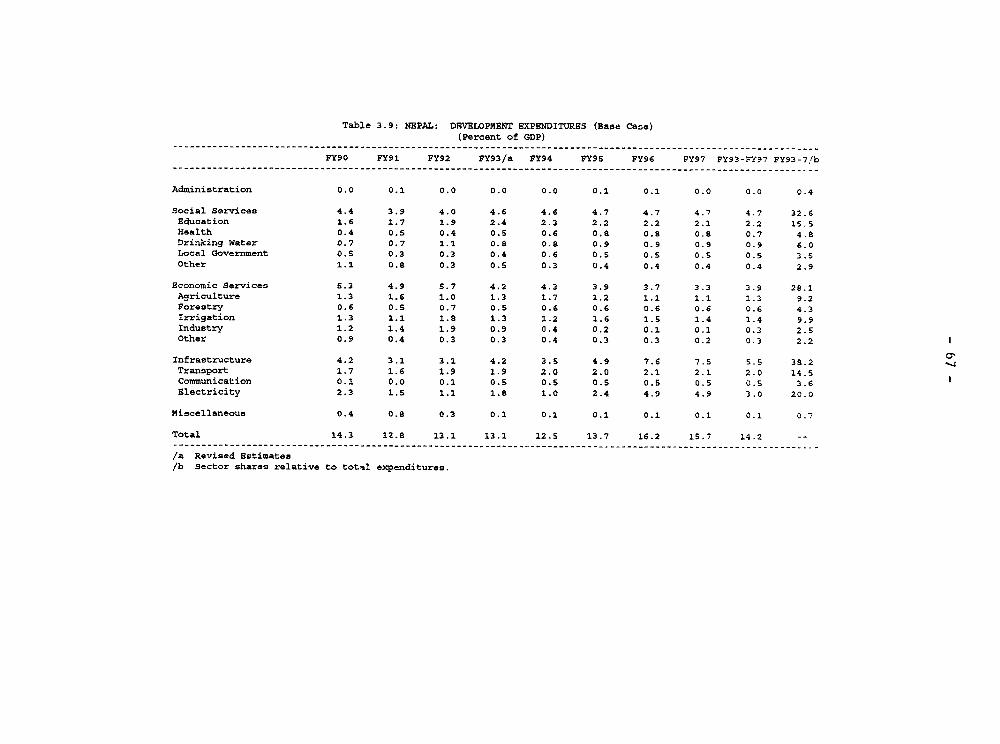
Table 3.9: NEPAL: DRVELOPM8NT EXPENDITURBS (Bast Case)(Percent of GDP)
FY90 FY91 FY92 FY93/a FY94 FY95 FY96 FY97 FY93-FY97 FY93-7/b
Administration 0.0 0.1 0.0 0.0 0.0 0.1 0.1 0.0 0.0 0.4
Social Services 4.4 3.9 4.0 4.6 4.6 4.7 4.7 4.7 4.7 32.6Education 1.6 1.7 1.9 2.4 2.3 2.2 2.2 2.1 2.2 15.5Health 0.4 0.5 0.4 0.5 0.6 0.9 0.8 0.8 0.7 4.8Drinking Water 0.7 0.7 1.1 0.8 0.8 0.9 0.9 0.9 0.9 6.0Local Government 0.5 0.3 0.3 0.4 0.6 0.5 0.5 0.5 0.5 3.5Other 1.1 0.8 0.3 0.5 0.3 0.4 0.4 0.4 0.4 2.9
Economic Services 5.3 4.9 5.7 4.2 4.3 3.9 3.7 3.3 3.9 28.1Agriculture 1.3 1.6 1.0 1.3 1.7 1.2 1.1 1.1 1.3 9.2Forestry 0.6 0.5 0.7 0.5 0.6 0.6 0.6 0.6 0.6 4.3Irrigation 1.3 1.1 1.8 1.3 1.2 1.6 1.5 1.4 1.4 9.9Industry 1.2 1.4 1.9 0.9 0.4 0.2 0.1 0.1 0.3 2.5Other 0.9 0.4 0.3 0.3 0.4 0.3 0.3 0.2 0.3 2.2
Infrastructure 4.2 3.1 3.1 4.2 3.5 4.9 7.6 7.5 5.c 38.2Tranoport 1.7 1.6 1.9 1.9 2.0 2.0 2.1 2.1 2.0 14.5Communication 0.1 0.0 0.1 0.5 0.5 0.5 0.5 0.5 0.5 3.6Electricity 2.3 1.5 1.1 1.8 1.0 2.4 4.9 4.9 3.0 20.0
Miscellaneous 0.4 0.8 0.3 0.1 0.1 0.1 0.1 0.1 0.1 0.7
Total 14.3 12.8 13.1 13.1 12.5 13.7 16.2 15.7 14.2 --
/a Revised Estimates/b Sector shares relative to total expenditures.
- 68 -
resources effectively. For example, while the social sectors are priorityprogram areas, they generally devend the least on aid, and have the mostintense use of local resources. Estimates indicate that a unit percentincrease of expenditures will result in local currency use at the margin foreducation equivalent to about twice that of drinking water, four t:.ies that ofelectricity and over 5 times that of transport. Thus, expanded priorityactivities in the social sectors require enhanced domestic resourcemobilization. Such expansion also limits the ability to generate thecomplementary local funds required by other sectors to absorb aid resources.
3.34 Given that productivity is below expectation in virtually allsectors, improving expenditure performance requires more than changing inter-sectoral allocations. First, the analysis points to the need for adjustmentsamong programs within each sector. Examples include shifts towards Basic andPrimary Education as a top priority and also to secondary education; emphasison family planning, maternity and child care; greater attention for roadmaintenance and to farm-to-market roads relative to other new construction;greater emphasis on farmer-managed irrigation and on rehabilitating suitablesmall and medium scale irrigation projects to be turned over to the privatesector, while limiting large scale state-managed expenditures; and supportinguser groups and leaseholds in forestry programs. Second, there is potentialto promote economic growth while reducing direct Government expenditures onservice delivery in various sectors, mainly through privatization, andmeasures to abolish state monopolies and price controls. Third, institutionaland other systemic factors which inhibit performance in all sectors also needto be addressed. In this regard, capacity needs to be built at the rurallevel to sustain the delivery of services. More immediately, institutionalcapacity in project screening, monitoring and implementation, and skilledstaff, training, facilities and procedures are critical for managing theexpenditure reform program, as discussed in detail in the next chapter.
S. External Assistance
3.35 Nepal requires strong support from the donor community to make thefiscal transition from the existing development expenditure portfolio to thenew policies and priority activities of the EP. Such donor support will becritica_ for the Government to make headway in adopting a priority expenditureprogram and in phasing out the low rate of return activities. This means thatdonors would have to support the Government's expenditure review andprioritization effort and be willing to phase out poor performing projects. Asuccessful prioritization would provide scope for new project starts Also,donor support is required for the Government to scale back its role in thevarious sectors. For example, current donor support for the privatizationprocess with _echnical assistance could be reinforced by a coordinated effortto implement the Government's expressed intention of limiting new publicinvestments in state-manajed projects, especially in manufacturing. In turn,resources intended for such sectors could be channelled to the currentlystated priority program areas. In addition, the potential displacementeffects of power on other sectors could be mitigated, if assistance extended

- 69 -
to Arun III is not at the expense of other important development activities,for example, in rural infrastructure and human resource development. Finally,on-going efforts to support institutional development need to be emphasized,given that there are sectors where institutional weakness rather thanfinancing is inhibiting performance. There is growing need to emphasize theneed for better institutional performance, including issues of implementationand organizational capacity for sustaining the operation of investments.
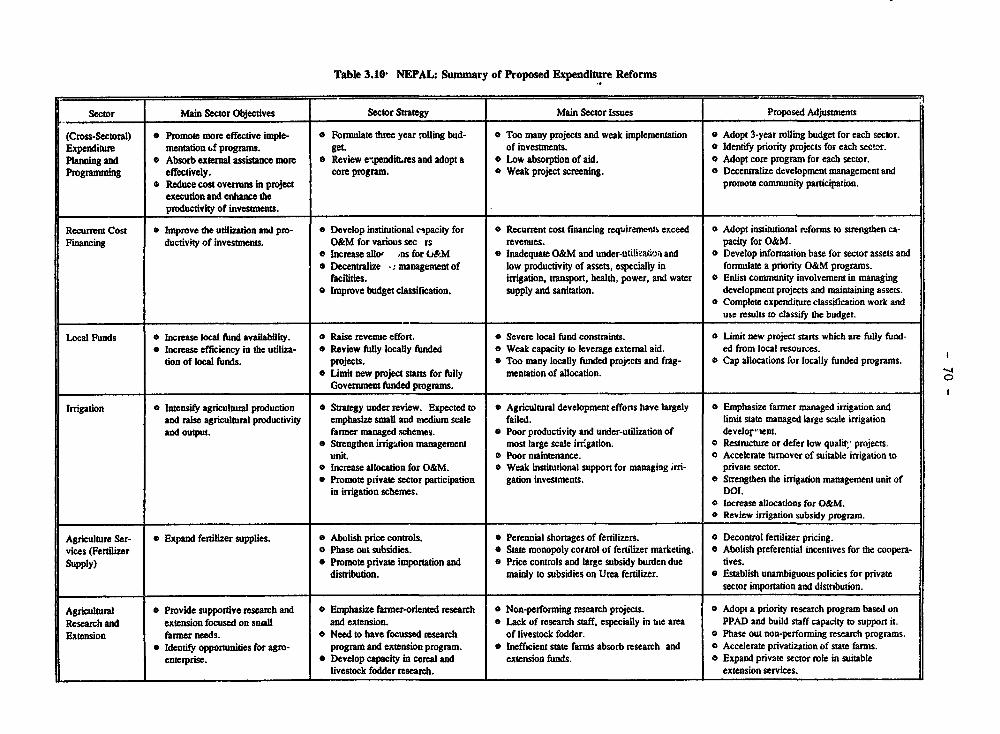
Table 3.10- NEPAL: Sununary of Proposed Expenditure Reforms
Sector Main Sector Objectives Sector Strategy Main Sector Issues Proposed Adjustments
(Cross-Sectoral) 0 Promote more effective imple- 0 Formulate three year rolling bud- 0 Too many projects and weak implementation O Adopt 3-year rolling budget for each sector.Expenditure mentation ef progrms. get. of investments. 0 Identify priority projects for each sect-or.Planning and 0 Absorb external assistance more 0 Review evpendittres and adopt a 0 Low absorption of aid. 0 Adopt core prognm for each sector.Programming effectively. core program. 0 Weak project screening. 0 Decentralize development management and
0 Reduce cost overruns in project promote community participation.execution and enhance theproductivity of investmrents.
Recurent Cost 0 Improve the utilization and pro- * Develop institutional ctpacity for a Recurrent cost financing requirements exceed a Adopt institutional reforns to strengthen ca-Financing ductivfly of investments. O&M for various sec rs revenues. pacity for O&M.
O Increase allor .ns for &M 0 Inadequate O&M and under-utilimakom and 0 Develop inforrmation base for sector assets and* Decentralize . managemnent of low productivity of assets, especially in formulate a priority O&M programs.
facilities. irrigation, transport, health, power, and water 0 Enlist conmunity involvement in managing0 Improve budget classification. supply and sanitation. development projects and maintaining assets.
o Complete expenditure classification work anduse results to classify the budget.
Local Funds 0 Increase local fund availability. O Raise revenue effort. 0 Severe local fund constraints. 0 Limit new project starts which are fully fund-* Incease efficiency in the utiliza- 0 Review fully locally funded * Weak capacity to leverage external aid. ed from local resources.
tion of local funds. projects. 0 Too many locally funded projects and frag- 0 Cap allocations for locally funded programs.* Limit new project starts for fully mentation of allocation.
Government funded programs. _
Irrigation a Intensify agriculturl production * Strategy under review. Expected to * Agricultural development efforts have largely 0 Emphasize farmer managed irrigation andand raise agriculturl productivity emphasize small and medium scale failed. limit state managed large scale irrigationand output. farner managed schemes. * Poor productivity and under-utilization of develor- ient.
* Strengthen irrigtion management most large scale irrigation. 0 Restructure or defer low qualit: projectsunit. 0 Poor maintenance. 0 Accelerate turnover of suitable irrigation to
e Increase allocation for O&M. O Weak institutional support for managing irri- private sector.e Pronmote private sector participadon gation investments. 0 Strengthen the irrigation management unit of
in irrigation schemes. DOL.* Increase allocations for O&M.o Review irrigation subsidy program.
Agriculture Ser- 0 Expand fertilizer supplies. 0 Abolish price controls. O Perennial shortages of fertilizers. 0 Decontrol fertilizer pricing.vices (Fertilizer 0 Phase out subsidies. 0 State monopoly cortrol of fertilizer marketing. 0 Abolish preferential incentives for the coopera-Supply) 0 Promote private importation and 0 Price controls and large subsidy burden due tives.
distribudon. maindy to subsidies on Urea fertilizer. 0 Establish unambiguous policies for privatesector importation and distribution.
Agricultural O Provide supportive research and 0 Emphasize farner-oriented research o Non-performing research projects. 0 Adopt a priority research program based onResearch and extension focused on small and extension. * Lack of research staff, especially in tile area PPAD and build staff capacity to support it.Extension farmer needs. 0 Need to have focussed research of livestock fodder. 0 Phase out non-performing research programs.
* Identifv opportunities for agro- progrm and extension progamn. * Ineffcient state farms absorb research and 0 Accelerte privatization of state farms.enterprise. 0 Develop capacity in cereal and extension funds. 0 Expand private sector role in suitable
livestock fodder research. extension services.
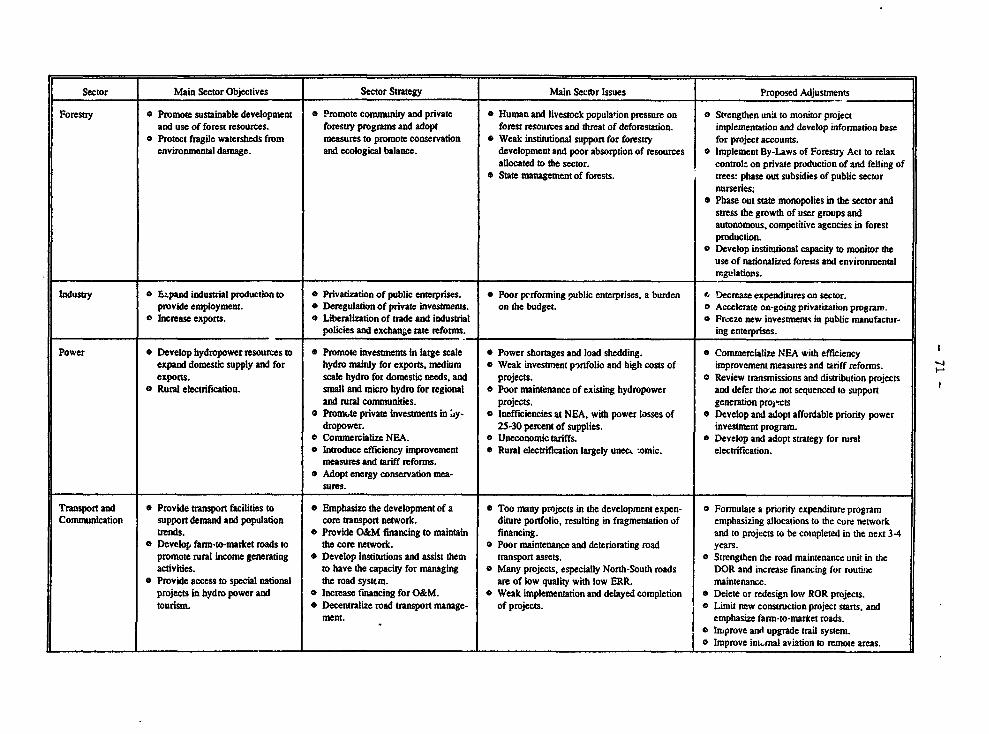
Sector Main Sector Objectives Sector Strategy Main Sect0r Issues Proposed Adjustments
Forestry * Promote sustainable development a Promote community and private 0 Human and livestock population pressure on o Strengthen un,t to mnonitor projectand use of forest resources. forestry programs and adopt forest resources and threat of deforestation. implementation and develop information base
o Protect fragile watersheds from measures to promote conservation * Weak institutional support for forestry for project accounts.environmental damage. and ecological balance. development and poor absorption of resources a Implement By-Laws of Forestry Act to relax
allocated to the sector. control- on private production of and felling of* State management of forests. trees: phase out subsidies of public sector
nurseries;* Pbase out state monopolies in the sector and
stress the growth of user groups andautonomous, competitive agencies in forestproduction.
o Develop institutional capacity to monitor theuse of nationalied forests and environmental
. _______________ ___________________________________ regulations.
Industry 0 Expand industrial production to 0 Privatization of public enterprises. 0 Poor performing public enterprises, a burden 0, Decrease expenditures on sector.provide employment. o Deregulation of private investments. on the budget. 0 Accelerate on-going privatization program.
* Increase exports. 0 Liberalization of trade and industrial 0 Freeze new invesnenst in public rnanufactur-policies and exchange ate reforns. ing enterprises.
Power 0 Develop hydropower resources to 0 Promote investmnents in large scale 0 Power shortages and load shedding. 0 Commercialize NEA with efficiencyexpand domestic supply and for hydro mainly for exports, medium 0 Weak investment p')rtfolio and high costs of improvement measures and tariff reforms. 4exports. scale hydro for domestic needs, and projects. 0 Review tansmissions and distribution projects
o Rural electrification. small and micro hydro for regional 0 Poor maintenance of existing hydropower and defer tho.,e not sequenced to supportand tural comnunities. projects. generation projcts
a Promute private investments in ;y- 0 Ineffteiencies at NEA, with power losses of 0 Develop and adopt affordable priority powerdropower. 25-30 percent of supplies. investment program.
o Commercialize NEA. 0 Uneconomic tariffs. a Develop and adopt strategy for rural* Introduce efficiency improvement 0 Rural electrification largely unec% omic. electriifcation.
measures and tariff reforms.o Adopt energy conservation mea-
sures.
Tansport and 0 Provide tansport facilities to 0 Emphasize the development of a 0 Too many projects in the development expen- o Formulate a priority expenditure programCommunication support demand and population core transport network. diture portfolio, resulting in fagmentation of emphasizing allocations to the core network
trends. 0 Provide O&M financing to maintain financing. and to projects to be completed in the next 3-4o Develop farn-to-market roads to the core network. 0 Poor maintenance and deteriorting road years.
promote rural income generating o Develop institutions and assist them transport assets. 0 Strengthen the road maintenance unit in theactivities. to have the capacity for managing * Many projects, especially North-South roads DOR and increase financing for routine
* Provide access to special national the road system. are of low quality with low ERR. maintenance.projects in hydro power and 0 Increase financing for O&M. 0 Weak implementation and delayed completion 0 Delete or redesign low ROR projects.tourism. 0 Decentalize road tansport manage- of projects. 0 Limit new construction project starts, and
ment. emphasize farm-to-market roads.0 Inprove andt upgrade tril system.| Improve inm4nal aviation to remote areas.
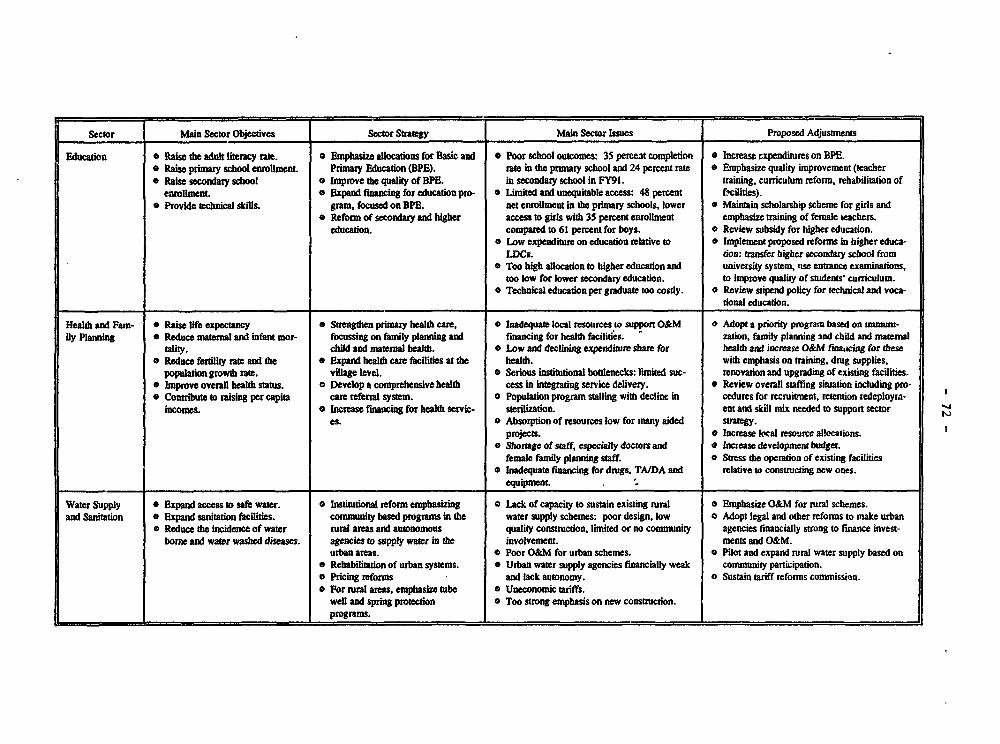
Sector Main Sector Objectives Sector Strategy Main Sector Issues Proposed AdjustmentsEducation a Raise the adult literacy rate. a Emphasize allocations for Basic and 0 Poor school outcomes: 35 percent completion a Increase expenditures on BPE.
* Raise primary school earoliment. Primaiy Education (BPE). rate in the pnnary school and 24 percent rate 0 Emphasize quality improvement (teacher* Raise seconday school 0 Improve the quality of BPE. in secondary school in FY91. training, curriculum reform, rehabilitation of
enrolmnt. 0 Expand financing for education pro- o Limited arid unequitable access: 48 percent facilities).* Provide technical skUlL gram, focused on BPE. net enrollment in the primary schools, lower 0 Maintain scholarship scheme for girls and
0 Reform of secondary and higher access to girls with 35 percent enrollment emphasize training of female leachers.education. conpared to 61 percent for boys. 0 Review subsidy for higher education.
o Low expenditure on education relative to 0 Implement proposed reforms in higher educa-LDCs. don: transfer higher secondary school from
l Too high alocation to higher education and university system, tse entrance examinations,too low for lower secondary education. to improve quality of students' curriculum.
o Technical education per graduate too costly. 0 Review stipend policy for technical and voca-tional education.
Health and Fam- * Raise life expectancy o Strengthen primary heath care, 0 Inadequate local resources to support O&M 0 Adopt a priority program based on amunm-ily Planning * Reduce maternal and infant mor- focussing on family planning and fnancing for health facilities. zation, family planning md child and naternal
tality. child and maternal health. 0 Low and declining expenditure share for hea and increase O&M finaacing for thede* Reduce fertiity rate and the a Expand health care facilities at the health. with emphasis on training, drug supplies.
population gwth rate. village level. * Serious institutional bottlenecks: limited suc- renovation and upgrading of existing facilities.* Improve overall bealth status. a Develop a comprehensive health cess in integrating service delivery. * Review overall staffing situation including pro-* Contribute to raising per capita cae rteferral system. a Population program stling with dectine in cedures for recruitment, retention redeptoyra-
incomes. a Increase financing for health servic- sterilization. ent and skill mix needed to support sectores. 0 Absorption of resources low for many aided strategy.
projects. 0 Increase local resource alloations.* Shortage of stasf especially doctors and a Increase developnent budget.
female family planning staff. o Stress the operation of existing facilities3 Inadequate financing for drugs. TA/DA and relatie to constructing new ones.
_______________-_______________ equipment. . :
Water Supply * Expand access to safe water. 0 Institutional reform emphaizing 0 Lack of capacity to sustain existing rual a Emphasize O&M for rural schenes.and Sanitation 0 Expand sanitation facilities. community based programs in the water supply schemes: poor design, low a Adopt legal and other reforms to nake urban
O Reduce the incidence of water rural areas and autonomous quality construction, limited or no community agencies financially strong to fiuance invest-borne and water washed diseases. agencies to supply water in the involvement. ments and O&M.
urban areas. 0 Poor O&M for urban schemes. a Pilot and expand rural water supply based on* Rehabilitadon of urban systems. 0 Urban waer supply agencies financially weak community participation.
Pricing reforns and lack autonomy. 0 Sustain tariff reforms conunission.O For rural areas, emphasize tube ° Uneconomic tariffs.
well and spring protection a Too strong emphasis on new construction.programs.
INSTITUTIONAL REFORMS & MIEDnIM TERM ECONOMIC MANGEMNT
A. EXDenditure Planning, Pr,..ranmina And Monitorina
Introduction
4.1 A major challenge in addressing Nepal's fiscal problems is toimprove institusional capacity for preparing, programming, implementing andmonitoring development expenditures. Though processes for handling annualbudget preparation and its management exist, they have been less thaneffective in channelling public resources to expenditures in accordance withnational development a;.d sectoral objectives and in ensuring the effective useof such resources. The public investment portfolio has become over-crowdedwith low quality and poor performing projects. As Government became aware ofthe problem, it took a number of initiatives to address it. These effortshelped to improve the technical capacity to begin work which would supportexpenditure reforms. For example, the Government adopted the ProgramBudgeting and Project Monitoring (PBPM) project with technical assistancewhich helped to 4.mprove the data base for program and project expenditures.Also, it set up a Resource Committee to help improve resource estimates andprovide a more reliable basis for expenditure planning. More recently, overthe last two years or so, the NPC has been revitalized, and it is emerging asa much stronger institutiorn playing a vital role in formulating economicreforms and sectoral policies as well as the development budget. With thefiscal pressures noted earlier and expanded expenditure plan of the EP, thereis heightened awareness that improved fiscal performance, includingexpenditure prioritization, pruning of low priority activities and betterexpenditure reporting to provide early warning on fiscal performance, isneeded more now than before. Accordingly, the NPC and the MOF have recentlylaunched a review of expenditures to provide a basis for adopting a morefocussed public investment portfolio.
The Rollinct Budget and Core Procrram
4.2 First, as part of the expenditure prioritization, the Government'srecent interest in adopting a three-year rolling budget framework with coreand non-core activities needs to be emphasized as a main instrument forimplementing the five year plans, as this will provide a bridge between theplans and the annual budgets. The need to implement AHP and other priorityprograms of the EP effectively further underlines the urgency of theseexpenditure reforms. The EP, like other Plans, is over-ambitious relative toresource availabilities, while the annual budgets have had to manage theinherited expenditure programs as well as preserve fiscal stability. Based onthe on-going expenditure review work, steps could be taken to forge strongerlinks between medium term development plans and annual budgets and betweenannual budgets and sectoral strategies. This would enable the Government tolook beyond the one year budget framework in order to ensure that the budgetallocations reflect medium term development priorities and sectoral
- 74 -
objectives. Second, though the Government has adopted an initial core programas part of the FY94 budget, the expenditure review work it is undertakingwould help to establish a process for reviewing and adjusting the expenditureprogram periodically and formulate a multi-year high rate of return projectsand programs, including a core of top priority activities as a subset of therolling budget. This core concept will help the Government to manage risks inresource availabilities, since the core will have first claim on resources andwill be less vulnerable to revenue shortfalls relative to non-core activities.It will enable the government to: formulate a strategy to complete theimplementation of a number of priority projects and programs over the next fewyears; drop marginal projects or reduce allocations for them and, ifnecessary, redesign other projects and components, and generally delineate thenon-core activities; and define the scope for accommodating new projects inthe expenditure program, without undermining fiscal stability. Third, theissue of local resource use has to be addressed, and the Government's initialactions in placing a cap on the amount of local resources allocated to lowquality fully HMG-financed :needs to be enforced diligently.
4.3 The Government needs to establish a process and the capacity toreview the rolling budget and reformulate the core program periodically duringthe plan cycle and in relation to implementation performance and the resourceoutlook. Though the NPC is benefitting from high level recruitment and aStrengthening Project, it has little in-house capacity to review expenditures.Thus, the ongoing public expenditure review is staffed with local consultantswith external aid assis':a.nce. The NPC is now beginning to develop a permanentcapacity, and it has created a nucleus of a project screening unit fo-- thatpurpose. Working with the MOF, the NPC needs to strengthen this unit withstaff, budgetary allocations and facilities to establish an effective andpermanent capacity for undertaking economic analysis, screening new projectsand approving and prioritizing them for inclusion in the development budget.This is essential for expenditure review and prioritization to become anentrenched part of public resource management. Strengthening of institutionalcapacity for budget formulation and planning is required at two other levelsin addition to the NPC. First, MOF's capacity for monitoring the core programand providing early warning on fiscal performance needs to be improved thrcughrecruitment of appropriate staff and training. Second, the quality andstaffing of planning units in line ministries need to be improved withtraining and technical assistance to improve the ability to formulate projectsarl programs and to implement and monitor them.
Expenditure Monitorincr
4.4 Though the MOF has developed a data base on project disbursementsand the NPC has begun to establish a new system and procedures for monitoringthe implementation of projects, these are in early stages. Efforts made inthe past to establish a management information system for disbursements andexpenditures based on FCGO data helped to improve the data base somewhat, butnot adequately enough to impact significantly on fiscal management. First,FCGO data are subject to considerable time lags, so that early warning forbudget management is limited. Second, FCGO data (as well as Nepal RastraBank's data) do not fully capture foreign aid inflows, especially direct
- 75 -
payments and commodity aid. Third, the available aggregate banking data on®overnment finances are on a payment basis and do not include expenditurecommitments already made by spending agencies. While FCGO ass'embles paymentdata, these are not reported on a timely basis to the MOF or reconciled withbanking data. As a result, MOF is not fully aware of the true position ofexpenditures at any point in time. Since cash flow is not forecast regularly,the rapid growth of unanticipated expenditures under the "freeze accounts"(representing checks issued by spending units, but not presented for paymentto the banking system at the end of fiscal year) has been a major problem forbudget management. These unanticipated claims have been of the order ofRs.1.0-1.8 billion in the last two years; and though these have declinedrecently, they stand to undermine the Government's cash management, to in-crease bank-financed deficit and to result in over-shooting of fiscal targets.
4.5 A number of critical steps are being taken in the MOF and NPC toimprove expenditure monitoring and implementation. One step which Governmenttook in mid-FY94 is to establish a mechanism of mid-year corrections to thebudget. Indeed, the core program would be difficult to implement without suchmid-year budget review and corrections. Since budget allocations for the coreshould be released freely, if the resource situation were to deteriorateduring the year, fiscal control can be maintained only if there is informationto adjust non-core projects and programs accordingly. Another step is the newmonitoring unit set up in the NPC to review progress in implementing projects.It is necessary for the NPC to build on the recent initiatives and focus moreon monitoring both the physical implementation of important national projectsas well as evaluating the progress of overall development expenditures so asto support periodic reviews of the budget and the development expenditureprogram. First, while line ministries must be involved directly in expendi-ture monitoring, their capacity to do this is limited, and should bestrengthened. Thus, at present, there is an urgent need to build upmonitoring capacity with staff and skills at the level of NPC and the lineministries. Second, the NPC itself needs to play a more direct role inundertaking implementation audits through, for example, field visits andcross-checks to evaluate implementation performance. This, in turn, would putpressure on line ministries to improve the quality and accuracy of theirreporting. In the meantime, given the staff and skill limitations at NPC,implementation audits will need to be limited to the most important projectsand programs in the core program. Third, NPC's monitoring of physicalimplementation and MOF's financial monitoring need to be better coordinated.This can be achieved through more frequent interactions and exchange ofinformation between respective staffs, participation of MOF staff in NPC'simplementation audits and joint review of implementation evaluations.
4.6 Also, the Government has recognized the need for financial andexpenditure reporting by FCGO to MOF on a more timely basis. One approachbeing introduced to improve the timeliness of FCGO teporting is to focus onthose District Treasury Offices (DTOs) which are located in relatively moreaccessible areas and which are already computerized, (these account for about80* of government expenditures), rather than waiting for all DTOs to submittheir returns. Second, PCGO reports need to provide information on the"float," i.e., checks issued by agencies but not presented yet to banks for
- 76 -
payment. In this regard, a pilot program to limit check writing authority toDTOs only instead of project managers is being undertaken. If successful, itwould help to have more timely reporting of fund releases and of the float andhelp to monitor the freeze account closely. Third, the reporting of foreign-aid disbursements needs to be improved, so that the MOF the NPC can have atrue picture of overall expenditures as well as implementation at the projectand program levels.
Budget Classification. AccountinQ And Auditinct
4.7 Addressing many of the present problems with regard to poorexpenditure monitoring and management require improvements in the budgetclassification and accounting system. A properly functioning accountingsystem is a necessary tool for good financial control and management.However, the budget classification system does not separate between currentand capital transactions, or provide enough details on a number of keyvariables (such as transfers, subsidies) which are necessary for meaningfulfiscal analysis, targeting and monitoring. In addition, when implementingagencies do not conform to reporting formats, it leads to irregularities inthe use of allocated budget funds, frustrating effective accounting for theuse of resources. In order to trevent overspending and leakages, the MOFrelies on a detailed system of line item expenditure controls backed byauthorizationi procedures rather than monitoring expenditures on a broaderbasis. This system hinders the delegation of responsibility andaccountability to Lhe agencies and ministries. It also leads to delays infinancial reporting and in the release of funds for project implementation.
4.8 A revised budget classification system and accounting structureare needed to proviie a framework for improved financial control, bettermanagement and budget transparency. This would require (i) a new budgetclassification which provides a breakdown between recurrent and capitalexpenditures as well as the minimum -ecessary details on various aggregateswhich are presently lumped together under one or two line items (such assubsidies and transfers); and (ii) the accounting structure to be fullyintegrated with the budget requirements so that it reflects the managementinformation relevant for the decision makers in the government. Such astructure should provide detailed information at the line ministry and agencylevels, including budget allocations and their use, based on prescribedaccounting formats and with specific line items to separate O&M expenditures,wages and other recurrent transactions. Such a system would facilitate great-er delegation of expenditure monitoring and control responsibilities to theline ministries, with the 40F monitoring expenditures on a broader basis thanis currently the case. Training needs to be provided to accounting officersto upgrade their skills. This needs to be focused on to a greater extentthrough specially tailored courses and programs in government accounting.With the provision of training, the penalties prescribed for financialirregularities need to be enforced to promote compliance. Also, wider use ofthe electronic data processing system is required to improve expendituremonitoring and reporting systems. However, this step should be taken afterthe basic decisions on the structure of accounts have been made.
- 77 -
4.9 In ragard to auditing, the Auditor General's Office (AGO) is anindependent body that conducts audits of all government offices and theirannual financial statements, and of those agencies or corporate bodies wherethe government owns more than 50% of the shares or assets. It also approvesall government accounting forms and procedures. Currently, the AGO is over-burdened, and efforts are being made to deal with this situation. First,efforts are now underway to strengthen the auditing system. The improvementsneeded are training to (i) update staff skills in auditing methods andtechniques, (ii) focus on operational auditing to ensure efficient use ofresources expended while also continuing to strengthen existing skills incompliance or regulatory auditing and (iii) use of computer auditing tech-niques. Second, in the meantime, until the AGO's capacity improves, it willbe necessary to contract local auditing firms to undertake audits of largerpublic agencies and enterprises.
ImprovinQ Fund Release Procedures
4.10 Given the weaknesses of financial controls, the fund releaseprocess has become a means to control expenditures, to enforce financialdiscipline and police irreaularities in financial reporting, and preventmisappropriation and violation of financial and procurement regulations.Also, various factors, including complex documentation requirements,inadequate accounting skills among project managers and, in particular, anineffective physical monitoring system led to excessive caution in the releaseof funds. These affected aid-funded projects particularly severely, sincethey have more complex documentation requirements. This, in turn, contributedto delays in utilizing aid funds and to slower implementation of aided ascompared to fully HMG-financed expenditures.
4.11 Recognizing these deficiencies, the C-cvernment took some steps toimprove the situation. Measures were adopted In the FY92 budget to liberalizefund release procedures by releasing one-third of the annual budget allocationfor all projects at the beginning of the year, instead of the customaryprocedure of releasing one-- xth. This approach however, became unsustainablebecause (a) revenue estimates were not realized and (b) because no attempt wasmade to prioritize the expenditure program which proved to be too large inrelation to available resources. An important lesson from this experience isthat improving fund release procedures must be part of a comprehensive reformpackage which takes adequate account of the resource situation and expenditurecommitments, especially for priority projects and programs. A more selectiveapproach to reforming fund release procedures has now been adopted for theFY94 budget. The new approach will distinguish between core and non-coreprojects. The system would ensure that the core program has less restrictiveaccess to allocations. Howe-er, to maintain fiscal control, given the risksof resource shortfalls, the Government is taking steps through annual budgetreviews and through newly created monitoring units to monitor and regulatefund releases for non-core activities. For the non-core expenditures, fundreleases are to be made more frequently at two month intervals. This shouldbe made contingent on adequate and timely expenditure reporting by spendingunits. In addition, based on regular cash flow forecasting and resourceassessments, fund allocations for non-core activities would need to be revised
- 78 -
in light of changing resource situation through a mid-year review. Theprocess should enable the Government to implement priority activities withoutinterrupting their momentum, while calibrating fund release for all otherprojects and programs in order to maintain fiscal stability.
B. Public Adm.inistration Reform
Introduction and Backgroune
4.3.2 This section is concerned with reforms in tne publicadministrative service. While the need to reform public administration hasbeen discussed over the years, steps began to be taken to address it onlyafter the election of the new Government in 1991. In formulating developmentpriorities under the EP, the Government concluded that an overhaul of theadministrative system, including the civil service would be instrumental toaid the delivery of the Plan's objectives. Accordingly, the Governmentestablished an Administrative Reform Commission (ARC) in October 1991 underthe Prime Minister to formulate a program of reform. The ARC issued a Reportin April 1992 which, recommended downsizing the civil service; increasing therole of the private sector and the NGOs, local communities and user groups;and streamlining the civil service to make it more effective in the remainingareas of service delivery. The report made more than 100 recommendations toreform the civil service. One of the problems is the excessive number ofrecommendations and lack of ordering to establish priorities. PreviousCommissions similarly issued long lists for reforms, but little, if any,action was ever taken. This time, an ARC Monitoring Committee (ARC-MC) wasformed to work with the Ministry of General Administration (MGA) and the lineministries to implement the recommendations of the ARC Report.
Public Service Reform Issues
4.13 At the risk of over-simplification, the section below discussesonly the main reform issues. Initially, the thrust of the Government's reformefforts was to reduce over-staffing and the wage bill and to improve theefficiency and accountability for the use of public resources. Subsequently,the Government shifted its focus towards -stemic issues involvingorganizational structure of institutions and the incentive system for publicemployees, especially recruitment, posting, promotion and compensation.
4.14 Though there is general indication of over-scaffing, there are noreliable estimates of the size of the public service31 or the civilservice. Some estimates indicate that permanent civil service positions havegrown rapidly from 27,000 to 102,000 between 1961 and 1993 (see Chart 4.1).excluding temporary staff. The ARC estimated a total civil service strength
-1/ The public service includes the civil service, public enteIprises, teachers, army and othersecurity services. Estimates of the size of the public service vary between 330,000 and 500,000.
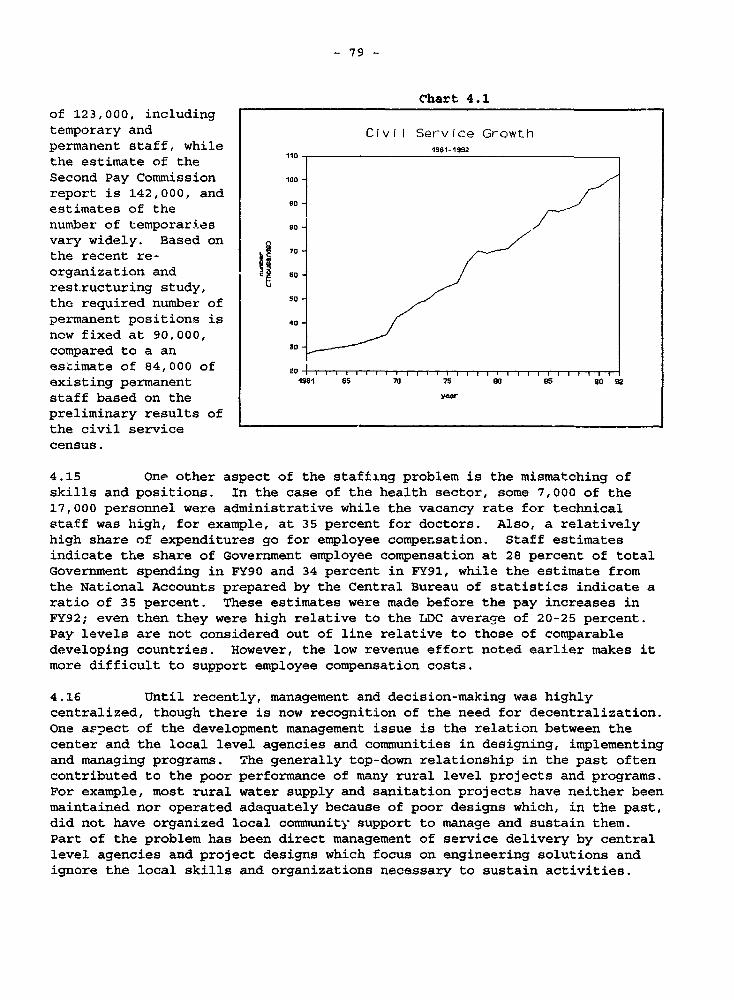
- 79 -
Chart 4.1of 123,000, includingtemporary and Civll Service Growthpermanent staff, whilethe estimate of the 10
Second Pay Commission t00 ireport is 142,000, andestimates of the go 1number of temporaries so -vary widely. Based onthe recent re- § °organization and 60 /restructuring study,the required number of , /
permanent positions is 40
now fixed at 90,000,compared to a an 30-_
estimate of 84,000 of 20-_,_,_, _,,_,_,_, __,_,_,_,, _,_,_,_,_,_,_,, _,_,_,
existing permanent IsS' 65 7 75 GO 96 90 02staff based on the Wpreliminary results ofthe civil servicecensus.
4.15 One other aspect of the staffing problem is the mismatching ofskills and positions. In the case of the health sector, some 7,000 of the17,000 personnel were administrative while the vacancy rate for technicalstaff was high, for example, at 35 percent for doctors. Also, a relativelyhigh share of expenditures go for employee compensation. Staff estimatesindicate the share of Government employee compensation at 28 percent of totalGovernment spending in FY90 and 34 percent in FY91, while the estimate fromthe National Accounts prepared by the Central Bureau of statistics indicate aratio of 35 percent. These estimates were made before the pay increases inFY92; even then they were high relative to the LDC average of 20-25 percent.Pay levels are not considered out of line relative to those of comparabledeveloping countries. However, the low revenue effort noted earlier makes itmore difficult to support employee compensation costs.
4.16 Until recently, management and decision-making was highlycentralized, though there is now recognition of the need for decentralization.One aspect of the development management issue is the relation between thecenter and the local level agencies and communities in designing, implementingand managing programs. The generally top-down relationship in the past oftencontributed to the poor performance of many rural level projects and programs.For example, most rural water supply and sanitation projects have neither beenmaintained nor operated adequately because of poor designs which, in the past,did not have organized local community support to manage and sustain them.Part of the problem has been direct management of service delivery by centrallevel agencies and project designs which focus on engineering solutions andignore the local skills and organizations necessary to sustain activities.
- 80 -
While a policy of decentralization has been proclaimed, progress inimplementation has been slow, in part because of the reluctance of skilledprofessionals co relocate in the rural areas and also because of the timerequired to develop local level skills and organizations which could beaccountable to community and user groups.
4.17 The structure of the incentive framework needs to be changed topromote high performance. Promotions have been based mainly on experience,length of service and remote area 3ervice. The absence of systematic use ofjob descriptions, which exist in some quarters, limited articulation oforganizational goals, and lack of performance guidelines undermined the use ofproductivity oriented criteria in assessing performance and determiningrewards. The pay structure also contcibutes to undermining incentives. Therehas been marked salary compre3sion of recent years, resulting in the ratio ofthe highest to the lowest grade at 6:1 (from 11:1 in 1983).
Summary of The Government's Initiatives
4.18 The main elements of the Government's initiative to begin.restructuring the administrative system include the following:
Restructuring of the ministrie-s and agencies to reduce over-staffing and improve and simplify operating systems. Some 3,500public servants were retired mainly, but not solely, on the basisof age and length of service. This was part of efforts which weemade to identify staff cuts of between 25 to 33 percent in thecentral ministries and agencies, the eventual objective being adownsizing of the permanent civil service. The options forenforcing reduction include incentive redundancy packages as wellas forced retirement with no enhanced compensation package.
* Preparing a new Civil Service Act and its accompanying rules andregulations (with the MGA), aimed at addressing incentiveproblems. The consultation work with line ministries involved indrafting the new Civil Service Act has been completed, and theCivil Service Bill has been passed by Parliament and recentlyreceived Royal Ascent. The detailed guidelines consistent withthe new law, for example, regarding guidelines which will move thesystem towards relatively objective performance evaluation .iavebeen prepared.
* Sanctioning a preliminary civil service census (with the MGA) andpreparing an Action Plan for reforms. The census is essentialbecause of the lack of reliable data on the size and actual costsof the civil service, and it is critical for identifying thelocation of redundant staff within the various GovernmentDepartments. The results of the re-organization and restructuringstudy to determine the appropriate strength of the civil serviceindicate that 90,000 permanent positions are required. However,the preliminary estimate of the numbers of the permanent civilservice based on the civil service census indicates 84,000
- 81 -
permanent positions, implying 6,000 vacant positions which theGovernment intends to fill. The Government plans to reduceexisting st?ff in unsuitable positions and hire more staff to fillvacancies in areas of skill shortages. This is because theorganizational restructuring and freeze in employment resulted inunder-staffing in various agencies.
e Currently, the civil service reform has shifted initial focus fromover-staffing and retrenchment to systemic performance andefficiency issues. There has been greater interest in re-orienting the incentive system to raise morale and motivate higherproductivity through a more transparent process for recruitment,posting, performance evaluation, compensation and promotion.While fiscal considerations require l'.mited increases in the totalwage bill to compensate for inflation, adjustments ar expected tobe made to correct for the compression oL the salary structure,and increases in individual pay will be based more on performanceevaluation results.
C. Conclusion
4.19 Much remains to be done since the initial steps to reform thesystem of development management and public administration in Nepal. Giventhe general difficulties and long term nature of institutional reforms in mostcountries, it is important to stress that success requires sustainedcommitment to a clear vision of the role of the public sector and to a programto implement necessary reforms. Beyond the initial retrenchment, new hiringneeds to be selective and should be consistent with the expenditureprioritization to ensure that adequate staff is provided to support thedelivery of the priority services. More immediately, high priority should begiven to strengthening the capacity to manage the expenditure program and thebudget by building on the work of the newly established units in the MOF andthe NPC noted earlier. Such measures should emphasize strengthening (i) theexpenditure -eporting unit to provide early warning on the fiscal outlook andgenerate appropriate information during the fiscal year to support mid-yearbudget reviews, as deemed necessary; (ii) the monitoring of the core programto ensure it has adequate resources and to determine adjustments in the non-core necessary to reallocate resources app:.opriately for the core in the eventof revenue shortfalls; and (iii) the expenditure screening unit to make itpossible to review programs and projects periodically, to determine thefeasible size of the development expenditure portfolio and to focus resourcesto fulfil the major development expenditure objectives.
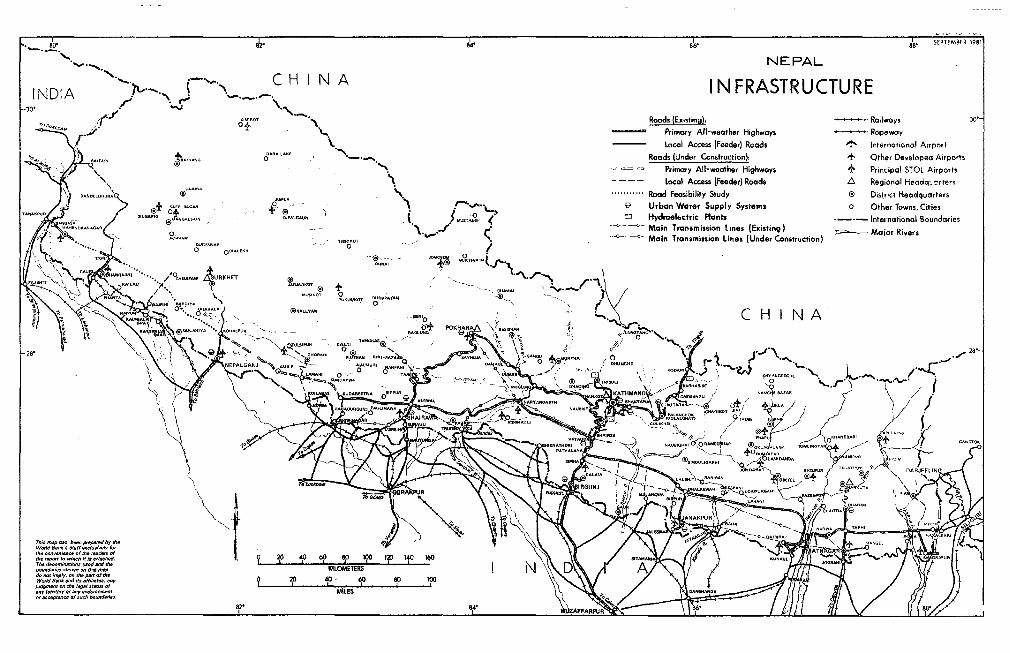
~ 30 l2- 814' ale SEPTEMBEpRee E 981
NE PAL
_I___ C H I N A INFRASTRUCTUREINDiA
Roads (Existing) - Ralwoys 30 -Primary All-weather Highways- RopewayLocal Access (Feeder) Roads " International Airport
oS .50,000t OR^-^rr A. Roads (Under Construction) + Other Developed Airports
/ \ N ' . Primo,y All-weother Highwoys 4 Principal STOL AirportsN N - - ~- - Local Access (Feeder) Roads A Regionol Heodq- = ters
; A.r- Road Feasibility Study ® District Heodquarters0±, 2 <.4 5^ffi></> ° - - ' S..1 9 Urbon Worer Supply Systems 0 Other Towns, Cities
TIq4N I y (lLcl2RMl 0] CLLsI tilPaWh { t g ul5r °- < t3 Hydroelectric Plants International BoundariesCr ^^Rr-- < i -'-4 '- Main Transmission Lines (Existin t)
t '->-- . ODW R .,, T. eRoOT _ / ~ - C - M ain T ra nsm ission Lines (U nders C onstruction) M olar R ivers
KS>~~~~~~~~~~~-a '~ M% W054^ J%
Ki N + >VUWO OHssooAIs -. eSl>- y
'4 ~ ~ ~ ~ ~ '
0005550 nosus no :OHA- NSALLPAh sb ^ ; C H I N A
a z ' °''W \X' ^'""'r'~~
SW 0 N SW~~~~~~~~~~~~~~~~~~~ 8
- .sO~~~~NPALGAN> 0' '. , N *
* 0~~~~~ ¶553 -- \.~~~~~~MA --"'I. soo A-.rA~
dwGrilodBmanpkr~~~ ~ MUOoRsEThA,aehrlun 9 2005005 -0 00055 60' 80 10d+1
< / \ {_ /1
0+~~~~~
O00500000 -# Ž" -% K
judomrCnto ANAKPURpld.. Mof .- A 0.'_
'_ ~~82 81 iF AR iE Ih If Il r -- IT
T~~ -, .0 -d ~~~~ KILOMETERS 5 A9 j O tOC '7-~ryA5400+~S
oroo nroco-f sot. soiSo,
52 ss~~~~LE