nepal electricity authority€¦ · nepal electricity authority social impact assessment of khimti-...
TRANSCRIPT
Nepal Electricity Authority
Social Impact Assessment of
Khimti- Dhalkebar 220 kV Transmission Line Project
Final Report
Submitted to:
Khimti- Dhalkebar 220 kV Transmission Line Project Darbar Marga, Kathmandu
Submitted by:
Environment and Social Studies Department Adwait Marga, Kathmandu

Acronyms Executive Summary I-IV
1 INTRODUCTION ......................................................................................................................... 1
1.1 Background ............................................................................................................................. 1 1.2 Objectives of the Study ........................................................................................................... 1
2 STUDY METHODOLOGY ............................................................................................................... 2
2.0 General ................................................................................................................................... 2 2.1 Literaure Review ..................................................................................................................... 2 2.2 Field Study……………………………………….. ………………………………………….………2 2.3 Data Analysis… ........................ ……………………………………………………………………3 2.4 Public Hearing Program ……………………………… .... ………………………………………...3 2.5 Impact Assessment................................................................................................................. 4 2.6 Study Team ............................................................................................................................. 4
3 PROJECT DESCRIPTION .......................................................................................................... 5
3.1 General………………………………………………………….............……………………………5 3.2 Project Area Delineation…………………………………………………………………………….5 3.3 Technical Features .................................................................................................................. 5
4. EXISTING SOCIOECONOMIC CONDITION OF THE AREA .................................................... 7
4.1 Socioeconomic Condition of the Project Affected Districts ..................................................... 7 4.1.1 Demography ........................................................................................................................... 7 4.1.2 Education ................................................................................................................................ 7 4.1.3 Agriculture………………………………………… ....................... ………………………………..8 4.1.4 Food Balance…………………………………………………… ............. …………………………8 4.2 Socioeconomic Condition of the Project Affected VDCs ........................................................ 9 4.2.1 Demography of Project Area .................................................................................................. 9 4.2.2 Ethnicity ................................................................................................................................ 10 4.2.3 Language ………………………………… ...................................................... ………………..10 4.2.4 Religion and Religious Sites………………………………………………… ...... ………………10 4.2.5 Education and Educational Institution………………………………………… ...... …………….12 4.2.6 Occupation ............................................................................................................................ 13
4.2.7 Land Holding Size and Land Transaction……………………………………………………….13 4.2.8 Agriculture Practice and Producation…………………………………………………………….14 4.2.9 Income Levels ....................................................................................................................... 14 4.2.10 Electrification…………………………………………… .............................................. ………..15 4.2.11 Land Use Pattern .................................................................................................................. 16 4.2.12 Development Activites .......................................................................................................... 17 4.2.13 Institutional Analysis and Infrastructure ................................................................................ 17 4.2.14 Manthali Airport ……………………………………………… ........................................ ………17 4.2.15 Information Descimination in Project Area ......................................................................... ..17 4.2.16 Expectation ......................................................................................................................... ..18 4.2.17 Public Hearing ..................................................................................................................... ..18 4.3. Socioeconomic Condition of the Project Affected Families…………………………………...19 4.3.1 Demography ……………………………………………………………………… ................. …..19 4.3.2 Age Structure ……………………………………………………………………… ............... …..19 4.3.3 Religion ………………………………………………………………… .................................. ...20 4.3.4 Literacy ................................................................................................................................. 20 4.3.5 Migration Pattern ................................................................................................................... 21 4.3.6 Occupation ............................................................................................................................ 21 4.3.7 Skills ...................................................................................................................................... 22 4.3.8 Land Holding Size and Land Transaction ............................................................................. 22
4.3.9 Area Allocation and Productivity ........................................................................................... 22 4.3.10 Live Stock with PAFs ............................................................................................................ 23 4.3.11 Fruit Trees ............................................................................................................................. 23 4.3.12 Health Facilities and Disease ............................................................................................... 24 4.3.13 Energy ................................................................................................................................... 24 4.3.14 Food Sufficency ................................................................................................................... 25 4.3.15 Income & Expenditure ......................................................................................................... 26 4.3.16 Sanitation and Drinking Water ............................................................................................. 26 4.3.17 Use of Forest Resources ...................................................................................................... 27 4.3.18 Gender ................................................................................................................................. 27 4.4 Socioeconomic Condition of the Seriously Project Affected Families (SPAFs) .................... 28 4.4.1 Demography ......................................................................................................................... 28 4.4.2 Migration Pattern ................................................................................................................... 28 4.4.3 Age Structure ........................................................................................................................ 29 4.4.4 Occupation ............................................................................................................................ 29 4.4.5 Educational Status ................................................................................................................ 29 4.4.6 Landholding .......................................................................................................................... 30 4.4.7 Agriculture ............................................................................................................................. 30 4.4.8 Livestock ............................................................................................................................... 31 4.4.9 Food Sufficiency ................................................................................................................... 31 4.4.10 Energy ................................................................................................................................... 31 4.4.11 Affordability ........................................................................................................................... 32 4.4.12 Sources of Drinking Water .................................................................................................... 32 4.4.13 Sources of Firewood collection ............................................................................................. 32 4.4.14 Health and Sanitation ........................................................................................................... 33 4.4.15 Income and Expenditure ....................................................................................................... 34
5 IMPACTS ASSESSMENT ...................................................................................................... 36
5.0 General .................................................................................................................................. 36 5.1 Adverse Impact ..................................................................................................................... 36 5.1.1 Construction Phase…………………………………………………………………… ................ .36 5.1.2 Operation Phase …………………………………………………………………… .................... 44 5.2 Positive Impact ...................................................................................................................... 46 5.2.1 Construction Phase .............................................................................................................. 46 5.2.2 Operation Phase ................................................................................................................... 47
6 MITIGATION MEASURES ........................................................................................................ 48
6.0 General .................................................................................................................................. 48 6.1 Construction Phase ............................................................................................................... 48 6.1.1 Compensation for the Land Loss .......................................................................................... 48 6.1.2 Compensation for Relocation of House………………………………………………………….51
6.1.3 Compensation for Crop Loss……………………………….…………………………………….52 6.1.4 Occupational Safety Measures………………………………………………………….………..52 6.1.5 Infrastructure………………………………………………………………………………………..52 6.1.7 Coordination………………………………………………………………………………….……..52 6.1.8 Awarenes Program ............................................................................................................... 52 6.1.9 Health and Sanitation……………………………………………………………...………………52 6.1.10 Cultural Aspects .................................................................................................................... 53 6.2 Operation Phase ................................................................................................................... 53 6.2.1 Manthali Airport………………………………………… ............... ………………………………53 6.2.2 Agricultural Producation………………………………………… .. ………………………………53 6.2.3 Land Devaluation………………………………………… ............ ………………………………53 6.2.4 Farming Hindrance………………………………………… ......... ………………………………53 6.2.5 Awareness Program………………………………………… ....... ………………………………53 6.2.6 Occupational Health and Safety………………………………… ………………………………53 6.3 Enhancement Measure ......................................................................................................... 54
6.3.1 Construction Phase ............................................................................................................... 54 6.3.2 Operation Phase……………………………………… .................... …………………………….54 6.4 Social Mitigation Cost ............................................................................................................ 55
7 SOCIAL MONITORING ........................................................................................................... 56
7.0 General .................................................................................................................................. 56 7.1 Types of Monitoring .............................................................................................................. 56 7.1.1 Baseline Monitoring ............................................................................................................. 56 7.1.2 Impact Monitoring ................................................................................................................. 56 7.1.3 Compliance Monitoring ......................................................................................................... 56 7.2 Monitoring Parameters Schedule and Agencies to be Consulted …………………………56 7.3 Manpower……………………………………………………………………………… ... ………...59 7.4 Monitoring Cost ..................................................................................................................... 59 7.5 Organizational Setup ............................................................................................................. 59
8 CONCLUSION AND RECOMMENDATIONS .......................................................................... 60
8.1 Conclusion………………………………………………………………………………… ... ……..60 8.1.1 Adverse Impacts………………………………………………………………………… ...... …….60 8.1.2 Positive Impacts .................................................................................................................... 60 8.2 Recommendations ................................................................................................................ 61
REFERENCES
List of Tables List of Annexes

Acronyms SIA : Social Impact Assessment
EIA : Environmental Impact Assessment
EPA : Environment Protection Act (1997)
EPR : Environment Protection Rule (1997)
Including the first Amendment (1999)
HMG/N : His Majesty's Government of Nepal
NEA : Nepal Electricity Authority
ESSD : Environmental and Social Studies Department
EMU : Environment Management Unit
ToR : Terms of Reference
NGO : Non Governmental Organizations
EMP : Environment Management Plan
PRA : Participatory Rural Appraisal
RRA : Rapid Rural Appraisal
FGD : Focussed Group Discussion
VDC : Village Development Committee
DDC : District Development Committee
CBOs : Community Based Organizations
KDTL : Khimti-Dhalkebar 220 kV Transmission Line Project
TL : Transmission Line
RoW : Right of Way
IPP : Independent Power Producers
MW : Mega watt
KW/h : Kilowatt-hours
kV : Kilo volt
CBS : Central Bureau of Statistics
FGD : Focused group discussion
S/S : Substation
0C : Degree centigrade
% : Percentage
HHs : Households
SLC : School leaving certificate

PAFs : Project affected families
SPAFs : Seriously project affected families
Ha : Hectare
Kg : Kilogram
NRs : Neapli rupees
O3 : Ozone
No : Nitric oxide
No2 : Nitrogen dioxide
AN : Corona audible noise
dB : Decibel
AM : Amplitude modulated
FM : Frequency modulated
m3 : Cubic meter
EMF : Electromagnetic field
V/m : Volts per meter
A/m : Ampere per meter
RHDP : Rural Health Development Program
CDS : Community Development Society
INPS : Integrated Nepal Power System
LP : Liquid petroleum
EAC : Environmental awareness for conservation
STD : Sexually transmitted disease
AIDS : Acquired immune deficiency syndrome
NTFP : Non timber forest products
CDO : Chief District Officer
AAPA : Aquatic animal protection act

Executive Summary
1.0 Introduction The total installed capacity of the Integrated Nepal Power System (INPS) is approximately 585 MW. To meet present increasing demand of power generation the existing capacity of the transmission needs to be upgraded or new transmission line should be constructed. The Power Development Projects, of which Khimti-Dhalkebar 220 kV project is a component, financed by World Bank aims to meet the objectives of HMG/N in extending access to electricity supply to a larger percentage of the population by supporting the development of Nepal’s power sector.
In view of future system development plan Nepal Electricity Authority (NEA) proposed Khimti –Dhalkebar 220 kV Transmission Line Project to evacuate the power generated from Tamakoshi and other hydropower projects in the region. This transmission line will also be connected with two existing Independent Power Producer (IPP) plants, Khimti and Bhotekoshi, with a view to exporting power to India as well as to serve the eastern region of the country.
Since the proposed project will be funded under Power Development fund provided by the World Bank the study has to satisfy requirement of "Policy Framework for Environmental Impact Assessment for projects under the Power Development Fund"2002. Considering aforementioned requirement a separate Social Impact Assessment (SIA) report is prepared focusing on social baseline, impacts, mitigation measures and social monitoring of Khimti - Dalkebar 220 kV transmission line project. This report is prepared by the Environmental and Social Studies Department (ESSD) of NEA as per the contract signed between Transmission Line/Substation Construction Department and ESSD.
Public hearing program for this study is planned to be conducted at Manthali of Ramechap district and Dhalkebar of Dhanusha district in order to provide opportunity for the maximum participation of local people and to discuss the findings of the EIA & SIA study and to collect the issues/ concerns of local people. The relevant issues raised by local people and representatives of the VDCs and line agencies will be incorporated in final EIA & SIA report.
2.0 Study Methodology Desk study, field study and impact identification through impact assessment matrix was the main methodology applied for this study. The desk study includes the review of technical reports of the project, topo maps of 1:25,000 scale, district profiles and VDC profiles. Questionnaire & checklist survey focused group discussion and interview of local leaders, VDC representatives and other intellectuals were the other method utilized for SIA study. The field investigation was carried out by a multi-disciplinary team, which comprised of Sociologist Economist, ACRP expert and Surveyor. The fieldwork was conducted in February-March and April-May and lasted for about 40 days. Team traversed in project area to collect information on existing socio-economic & cultural environment of the area.
3.0 Project Description The Khimti Dhalkebar 220 kV transmission line starts from Kirnetar village of Dolakha district

and will cross Ramechap, Sindhuli and Mahottari districts and finally reaches the Dhalkebar substation of Dhanusha district. For the purpose of the SIA study, the study area is defined as the project area consisting of the right of way, substation area as well as the area that will be impacted due to the construction and operation of the project. The proposed project will cover 16 VDCs and one Municipality of the five districts.
The right of way of the proposed project will be 15 meter each side from the centerline and approximately 12.5m x 12.5-m area will be required for tower foundation. In most of the areas span of the tower will be 350 meter and in total 230 towers will be constructed in 73- km alignment. The number of angle points is 53 and tower is steel lattice structure, self supported type. The project component also includes extension of two 132 kV line bays, one each at Khimti and Dhalkebar existing substations. The estimated cost for the proposed project is 22 million US$ which will be jointly funded by World Bank, HMG/N and NEA.
In order to carry out the project works the entire stretch of the line route will be segmented into two work sections and will be controlled from two ends. The working group of each section will be more or less mobile; hence small size temporary camp will be constructed for the implementation of project. Altogether 225 people will be employed in the project which includes 50 skilled, 65 semi skilled and 110 unskilled.
4.0 Existing Social Condition of the Project Area The total population of the project area is 114516 and number of households is 21668. The male and female populations are 56414 (49.26%) and 58102 (50.74%) respectively. Average household size varies in between 4.39 and 6.21 and total average constitutes 5.28 persons per household. Annual population growth rate in the project area is about 2%. Brahmin, Chettri, Tamang, Newar and Magar are the major ethnic groups found in the project area. 56.85 % population of the project area is literate. The literacy rate is high (68.28%) in Gauribas VDC of Mahottari district and lowest (43.40%) in Kathjore of Ramechhap district. Krishna temple, Kalika Devi, Ram temple, Bhimeshwor temple, Dhanaugi temple and Ganesh temples are the religious places found in the project affected VDCs. Health facilities in project area are inadequate and main diseases prevalent are stomachache, diarrhea, fever, tuberculosis, hysteria, skin diseases etc. Firewood, kerosene and electricity are the main source of energy for lighting and cooking. Due to accessibility and low cost most of the households in the project area use firewood for cooking.
The project area includes predominantly rural economy with agriculture as a main source of livelihood and income. The other occupations include business, service, labor work and domestication of livestock. A variety of skills including mason, carpenter, tailor, blacksmith, shoemaker, weaving and driver are found in the project area.
Irrigated, un-irrigated and grassland are the main land type occupied by the local people. Distribution of PAF by size of land holding reveals that most of the families cultivate less than 1 ha of land. Estimated annual income per household in project area is Rs. 72400 in which agriculture and labor/ wages contributes about 36% and 28.5 % respectively. Expenditure pattern of PAF residing along the RoW indicates that the share of expenditure on food is about 69%, which is relatively in higher side. Expenses on energy constitute 9% followed by clothing, education and medicine. About 350 –400 m stretch of the proposed alignment passes in the vicinity of the Manthali airport at a distance about 740 m from the airport. No objection letter from the airport authority was received during the study.
5.0 Potential Social Impact The social impacts likely to occur in construction phase are loss of 1.6 ha private land, relocation of 17 houses (7 double story and 10 single story), relocation of one block and toilet of Tamakoshi Higher Secondary School at Khimti besi, loss of standing crops, occupational safety impacts, likely impact on gender & vulnerable group and life style.
The other impacts include changes in social and cultural practices, health and sanitation and infrastructures (access trail at AP-16). The operation phase impacts include devaluation of land in RoW, electric hazardous and electromagnetic impact, loss of agricultural production, withdrawal of economic opportunity, farming hindrance and loss of aesthetic value.
Employment to 225 people and increase in local economy is the positive impact during construction phase. The operation phase impacts include increase in local skill and national economy.
6.0 Mitigation Measures Mitigation measures suggested during construction phase include compensation for the loss of private land and houses, school block, provision of land registration fee (7% of the compensation amount or actual amount spend in land purchase whichever is low), rental allowances for 4 months, appropriate rent for leased land, temporary camp with adequate facilities for the workers, provision of first aid kits and vaccines against infectious and communicable diseases.
Other mitigation programs include awareness program, availability of safety equipment's and device, strong code of conduct for the outside construction workers; no discrimination to the local people on the basis of gender, cast color or place of origin in Nepal; appropriate coordination with local and district level administration such as local VDCs, NGOs CBOs and construction of access trail to the cultural site at AP-16.
The operation phase mitigation programs include 10% compensation for the deduction of land value and occupational safety measures.
The enhancement measures during construction phase include priority to the local employment, and community support program. The operation phase mitigation program includes local employment and continuation of community support program for 2 years. Due priority shall be given in rural electrification since this is prime expectation of local people from the project. The total social estimated mitigation cost is NRs. 12.36 million NRs. Nepal Electricity Authority will have prime responsibility for the implementation of recommended mitigation measures. The mitigation program will be implemented in coordination with district level line agencies to the extent possible.
7.0 Social Monitoring Baseline, impact & compliance monitoring will be conducted in different phases of the project. Changes in settlement, public health, infrastructure and compliance of the tender clauses are the major areas of monitoring. The schedule of monitoring will be daily, quarterly, half yearly and yearly depending on the parameters and type of monitoring.

NEA will have prime responsibility for the implementation of environmental monitoring. Besides NEA line agencies, will also have responsibility for environmental monitoring of the proposed project The Environmental and Social Studies Department on behalf of the project will conduct the pre- construction monitoring. Khimti-Dhalkebar Environmental Management Unit comprising of staff from ESSD, among others will be the institution responsible for construction phase monitoring. Grid Operation Department, NEA will conduct the operation phase monitoring of the project and ESSD will conduct some of the monitoring works on behalf of the department. The estimated total monitoring cost including social monitoring is 3.92 million NRs. /- for both construction phase and two years operation of the project.
8.0 Conclusion and Recommendations
The study indicates that proposed project would have low to moderate impact on socioeconomic environmental condition of the area. The study concludes that construction of the proposed Khimti-Dhalkebar 220 kV/TL Project is socially feasible if recommended mitigation measures and monitoring plan is implemented.
CHAPTER-1 INTRODUCTION
1.1 Background Transmission lines are linear facilities. About 40% of Nepal's population is served by electricity and the per capita consumption of electricity in Nepal is 64 kW/h (NEA 2003). The total installed capacity of the Integrated Nepal Power System (INPS) is approximately 585 MW. To meet present increasing demand of power generation the existing capacity of the transmission needs to be upgraded or new transmission line should be constructed. The Khimti region (Watershed of Tamakoshi and Khimti Khola) has the hydropower potential of about 1041 MW. This potential is mainly from the development of Tamakoshi (Rolwalling), Likhu-4, Khimti -II Hydroelectric Projects. Thus in view of future system development plan Nepal Electricity Authority (NEA) proposed Khimti –Dhalkebar 220 kV Transmission Line Project. The Power Development Projects, of which Khimti-Dhalkebar 220 kV project is a component, financed by World Bank aims to meet the objectives of HMG/N in extending access to electricity supply to a larger percentage of the population by supporting the development of Nepal’s power sector. As a component of this project the Khimti –Dhalkebar 220 kV line is proposed to evacuate the power generated from Rolwaling Hydroelectric Project. This transmission line will also be connected with two existing Independent Power Producer (IPP) plants, Khimti and Bhotekoshi, with a view to exporting power to India as well as to serve the eastern region of the country. It will also provide an attractive route to evacuate the power from the IPP plants since they are already connected to the grid system through the Bhaktapur substation. Since the proposed project will be funded under Power Development fund provided by the World Bank the study has to satisfy requirement of "Policy Framework for Environmental Impact Assessment for projects under the Power Development Fund"2002. This Policy Framework was agreed by Ministry of Water Resources and World Bank for financing Projects under Power Development fund in Nepal.
The policy framework is more specific on socio-economic and cultural aspects of the development projects. It identifies certain criteria, which are salient in Environment Protection Rules 1997(EPR) and Environment Protection Act (EPA) 1997 and needs to be addressed during Project Preparation. Considering aforementioned requirement a separate Social Impact Assessment (SIA) report is prepared focusing on social baseline, impacts, mitigation measures and social monitoring of Khimti - Dalkebar 220 kV transmission line project. This report is prepared by the Environmental and Social Studies Department (ESSD) of NEA as per the contract signed between Transmission Line/Substation Construction Department and ESSD.
1.2 Objectives of the Study The main objective of this study is to identify social baseline conditions of project area, assessment of potential impacts and to propose mitigation measures and monitoring plan on social aspects.

CHAPTER-2
STUDY METHODOLOGY
2.0 General Literature review, field survey by the team of experts (observation, checklist and questionnaire survey), meeting and discussion with line agencies, group meetings and impact assessment matrix were the main methodology applied for the SIA study. The details of methodology applied to conduct SIA study of the proposed project is presented below. District Mahottari includes only forest area and Dolakha District is nominally connected by the route alignment. Therefore the social study focused mostly on Ramechhap, Sindhuli and Dhanusha districts out of 5 affected districts by the project.
2.1 Literature Review Relevant information from various sources (Central Bureau of statistics (CBS), District Profiles-, VDC Profiles and Publications of local NGOs have also been collected and reviewed for baseline information. Review of topographical maps and district map has also been done. The feasibility study report (2003) and scoping document of Khimti –Dhalkebar 220 kV Project has been reviewed. The World Bank guideline for transmission line project and SIA guideline prepared for the Nepal Power Development Fund were reviewed to determine frame of reference for SIA study. 2.2 Field Study
The field investigation was carried out by a group of social scientist comprising Socio-economist, Sociologist, ACRP expert and Senior Surveyor. The fieldwork was conducted in February- March and May –June 2004 and lasted for about 40 days. Team traversed throughout the alignment from Sahare of Dolkha to Dhalkebar of Dhanusha district to collect information on socio-economic and cultural aspects of the project area. The following methodology was applied to collect baseline information and impact prediction in Socio-economic and cultural environment. Inventory of Landowners from Cadestral Map
Maps interpretation was an integral part of field survey. Topographic maps of the area were consulted and relevant information was collected. Khimti- Dalkebar 220 kV transmission line alignment drawn in topographic maps was transferred to cadastral maps of 1: 2500 scales by on the spot verification by junior surveyor (Amines). A 30m corridor was fixed on cadastral maps. By using parcel numbers within 30m-corridor landowner names were compiled which were further verified by the records of Land Revenue Office. The present list is outcome of aforementioned activities. The team faced the difficulty due to absent of uniform coordinates in topographic and cadastral maps. The area not covered by cadastral maps is covered by topographic map of route alignment. Thus total area is surveyed. Junior surveyor and staff of District Survey Office were mobilized to collect the list of landowners affected by the project. This list was further verified by Land Revenue Office to cross check and update the information.

Questionnaire Survey
Appropriate questionnaire was developed in Nepali language and administered in the project-affected area (Annex-1). The questionnaire was pre tested before administration to the local community at site. Cadestral maps and list of landholders along right of way of transmission line provided by District Revenue Office were considered for questionnaire interview. A random stratified questionnaire (sample) survey with equal probability of selection, proportionate to number of landowners was selected out of 16 VDCs and one municipality. Local enumerators were hired for questionnaire survey and 210 (29% of the total affected HH) were interviewed. A census was carried out for affected houses and land falling within Angle Towers. Separate data sheets for prices prevailing in the area were administered. The sample size is appropriate and represents the project area to draw conclusions and recommendations. The responses of the questionnaires were edited for consistency. The list of persons interviewed during the field survey is given in Annex-2. Checklist Survey/In depth Interview Former VDC Chairman, secretary and schoolteachers were interviewed to document information about local conditions expected impacts and mitigation measures. Thirty-two checklists were filled from above mentioned different persons, which include two from each VDC/Municipality affected by the project. Focused Group Discussion Group meeting was conducted at Kamlamai Municipality –10, Bhiman, Dhungarebas, Bijaya Chap, Rajabash, Tilpung, Kathjore, and Tulasi Bahunmara to discuss various issues likely to arise due to implementation of the project, existing socio-economic condition of the areas and views/ concerns of former representatives of VDCs, intellectuals and local people. Similarly, a meeting was also conducted with local NGOs such as Community Development Society, Tamakoshi Sewa Sammittee and Rural Health Development Project (Annex-3). The size of group ranges from 5-8 people. Local employment, rural electrification, compensation for the private assets and implementation of income generation program are the major concerns raised in-group meetings. The list of presentees and issues raised by them were noted down and are summarized in various sections of this report.
2.3 Data Analysis
Data analysis was carried out by access computer program and as per formats of output tables provided by the expert. The main output data are presented in various chapters of this report. The collected data seems reliable because these data closely correlate with other available maps and publications. The impacts both positive and negative were identified and their severity was predicted. The appropriate mitigation measures are suggested as per the severity (i.e. magnitude, extent and duration) of the corresponding impacts. 2.4 Public Hearing Program The notice regarding the program was published in Gorkhapatra daily on 2061/5/25. The copy of the notice along with request letter for participation in the program was sent to concern ministries and departments, DDC office, local VDCs and district level line agencies. Audio record was made for the entire program and written concerns of the participants were collected.

Public hearing was conducted at Manthali of Ramechhap district and Dhalkebar of Dhanusha district in order to provide opportunity for the maximum participation of local people and to discuss the findings of the EIA and SIA study and to collect the issues/ concerns of local people. The public hearing was focus on awareness about the project plan and program, building of mutual consensus about the implementation of the project, identification of the key impacts/issues and consideration of these issues/impacts during the preparation of final report. 2.5 Impact Assessment
Matrix method was used to assess impact of the project on socio- economic and cultural environment. The magnitude, extent and duration of the impacts were categorized according to the National Environmental Impact Assessment Guidelines, 1993. The impacts were further categorized as high, medium and low in terms of magnitude, short term, medium term and long term in terms of duration and local, site specific and regional in terms of extent. The families who loose land or any assets are classified project-affected families (PAFs) and those who lost their houses are classified as Seriously Project Affected Families (SPAFs).
2.5.1 Magnitude of Impacts Low Impact (L): If the impact is significant but limited to small magnitude Medium Impact (M): If the impact is of considerable magnitude High Impact (H): If the impact is of severe nature 2.5.2 Extent of Impacts Site Specific (S): If the impact is limited to the site itself then it is a site specific one. Local (L): If the impact of the work extends to the adjoining wards and or VDCs then it is termed as local Regional (R): If the impact of the work extends to the entire district or further then it is termed as regional. 2.5.3 Duration of Impacts Short Term (ST): If the duration of the impact is limited to the particular construction site then it is termed as a short-term impact.
Medium Term (MT): If the impact of the work extends throughout construction period then it is termed as medium-term Impact.
Long Term (LT): If the span of the impact expands beyond the construction phase of the project then it is termed as a long-term impact.
2.6 Study Team
A multidisciplinary team of experts conducted the SIA study. The following professionals were deployed for the SIA study of Khimti -Dhalkebar 220 kV Transmission Line Project.
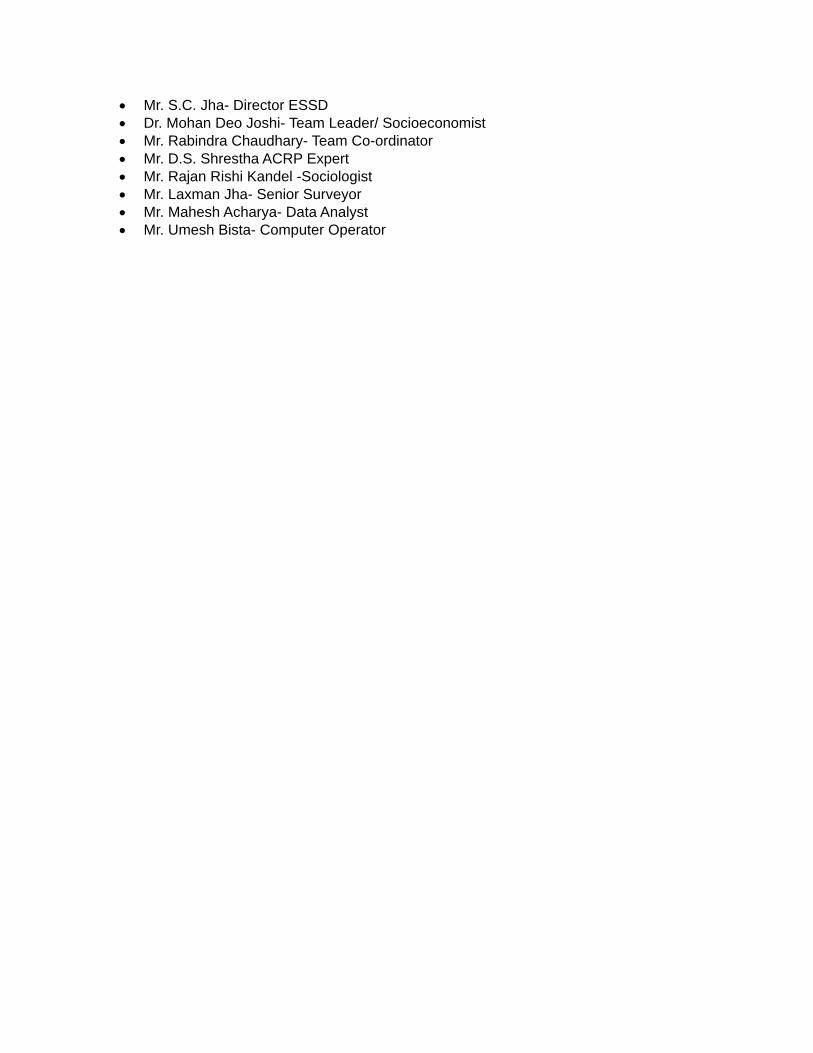
Mr. S.C. Jha- Director ESSD Dr. Mohan Deo Joshi- Team Leader/ Socioeconomist Mr. Rabindra Chaudhary- Team Co-ordinator Mr. D.S. Shrestha ACRP Expert Mr. Rajan Rishi Kandel -Sociologist Mr. Laxman Jha- Senior Surveyor Mr. Mahesh Acharya- Data Analyst Mr. Umesh Bista- Computer Operator
CHAPTER - 4.0
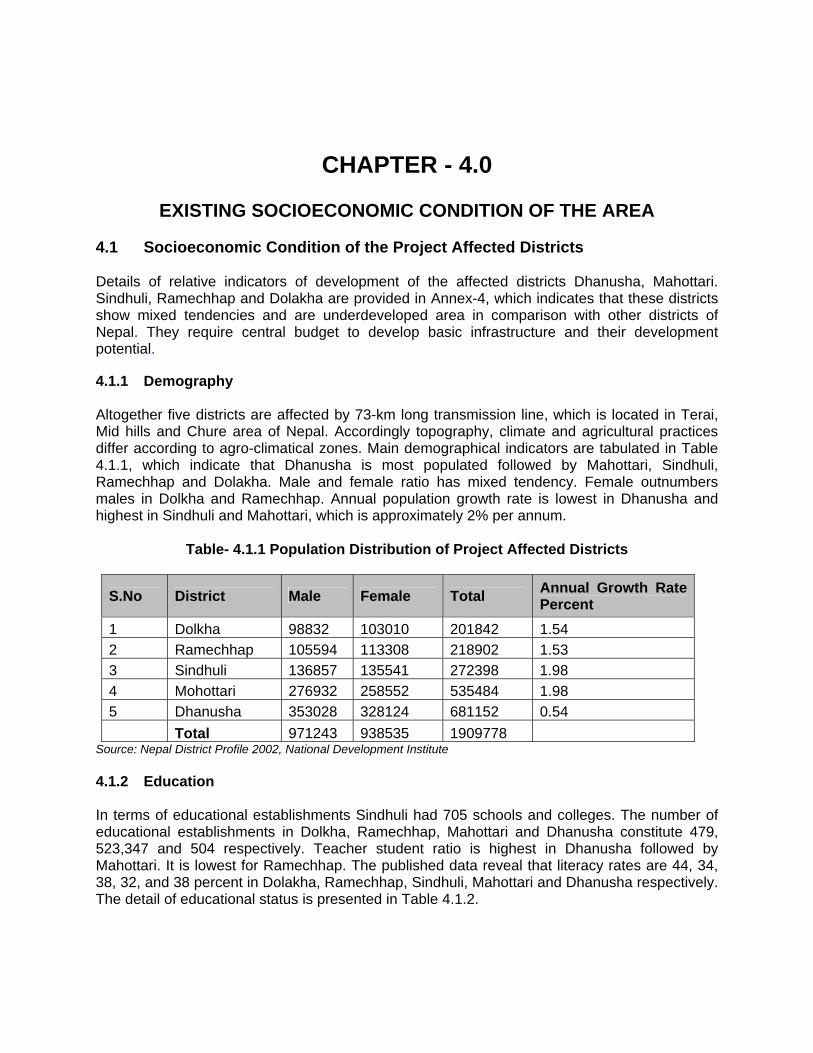
EXISTING SOCIOECONOMIC CONDITION OF THE AREA 4.1 Socioeconomic Condition of the Project Affected Districts Details of relative indicators of development of the affected districts Dhanusha, Mahottari. Sindhuli, Ramechhap and Dolakha are provided in Annex-4, which indicates that these districts show mixed tendencies and are underdeveloped area in comparison with other districts of Nepal. They require central budget to develop basic infrastructure and their development potential. 4.1.1 Demography Altogether five districts are affected by 73-km long transmission line, which is located in Terai, Mid hills and Chure area of Nepal. Accordingly topography, climate and agricultural practices differ according to agro-climatical zones. Main demographical indicators are tabulated in Table 4.1.1, which indicate that Dhanusha is most populated followed by Mahottari, Sindhuli, Ramechhap and Dolakha. Male and female ratio has mixed tendency. Female outnumbers males in Dolkha and Ramechhap. Annual population growth rate is lowest in Dhanusha and highest in Sindhuli and Mahottari, which is approximately 2% per annum.
Table- 4.1.1 Population Distribution of Project Affected Districts
S.No District Male Female Total Annual Growth Rate Percent
1 Dolkha 98832 103010 201842 1.54
2 Ramechhap 105594 113308 218902 1.53
3 Sindhuli 136857 135541 272398 1.98
4 Mohottari 276932 258552 535484 1.98
5 Dhanusha 353028 328124 681152 0.54
Total 971243 938535 1909778 Source: Nepal District Profile 2002, National Development Institute 4.1.2 Education In terms of educational establishments Sindhuli had 705 schools and colleges. The number of educational establishments in Dolkha, Ramechhap, Mahottari and Dhanusha constitute 479, 523,347 and 504 respectively. Teacher student ratio is highest in Dhanusha followed by Mahottari. It is lowest for Ramechhap. The published data reveal that literacy rates are 44, 34, 38, 32, and 38 percent in Dolakha, Ramechhap, Sindhuli, Mahottari and Dhanusha respectively. The detail of educational status is presented in Table 4.1.2.

Table -4.1.2 Education Status of Project Affected Districts
S.No District Number of School / College
Number of Student
Number of Teacher
Literacy Rate
1 Dolakha 479 54610 1486 44%
2 Ramechhap 523 55235 1355 34%
3 Sindhuli 705 62027 1247 38%
4 Mahottari 347 74088 1279 32%
5 Dhanusha 504 115642 2517 38%
Total 2558 361602 7884 Source: Nepal District Profile 2002, National Development Institute 4.1.3 Agriculture Paddy, wheat, maize and other cereal and cash crops are produced in the affected districts but the productivity is low due to traditional techniques and marginal use of modern agricultural inputs. Total estimated cereal production is 21653, 64988, 79648, 161485 and 198797 Mt. for Dolakha, Ramechhap, Sindhuli, Mahottari and Dhanusha districts respectively. Details regarding agriculture production in these districts are provided in Table 4.1.3.
Table - 4.1.3 Agriculture Production of Project Affected Districts
S.No District Paddy Production
Maize Wheat Other Total
1 Dolakha 6625 9095 1617 4316 21653
2 Ramechhap 16420 36333 4020 8215 64988
3 Sindhuli 26225 30172 10400 12851 79648
4 Mohottari 123935 2300 34240 1010 161485
5 Dhanusha 149816 2351 46000 630 198797
Total 323021 80251 96277 27022 526571 Source: Nepal District Profile 2002, National Development Institute 4.1.4 Food Balance Food balance as estimated by Agricultural Department indicates that only Ramechhap and Sindhuli have food surplus estimated to be for 15 and 3 days per capita. Deficit ranges in between 19.3 and 4 days/ capita (Table -4.1.4).
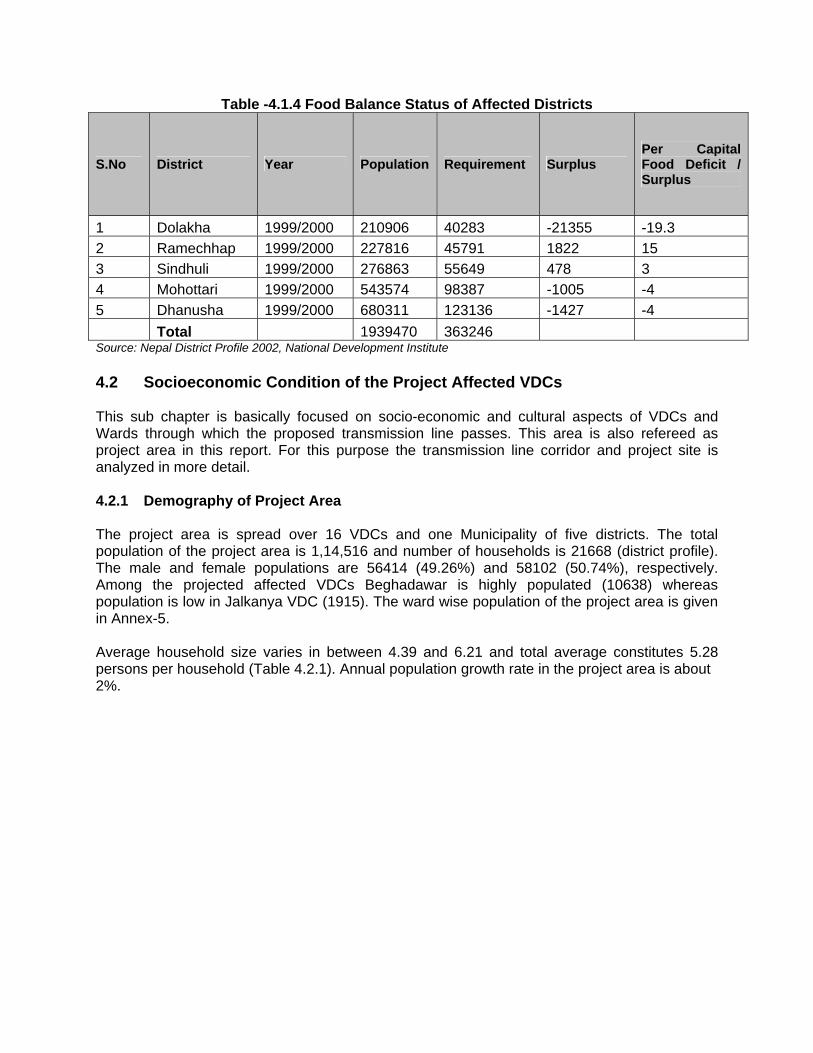
Table -4.1.4 Food Balance Status of Affected Districts
S.No District Year Population Requirement Surplus Per Capital Food Deficit / Surplus
1 Dolakha 1999/2000 210906 40283 -21355 -19.3
2 Ramechhap 1999/2000 227816 45791 1822 15
3 Sindhuli 1999/2000 276863 55649 478 3
4 Mohottari 1999/2000 543574 98387 -1005 -4
5 Dhanusha 1999/2000 680311 123136 -1427 -4
Total 1939470 363246 Source: Nepal District Profile 2002, National Development Institute
4.2 Socioeconomic Condition of the Project Affected VDCs This sub chapter is basically focused on socio-economic and cultural aspects of VDCs and Wards through which the proposed transmission line passes. This area is also refereed as project area in this report. For this purpose the transmission line corridor and project site is analyzed in more detail. 4.2.1 Demography of Project Area The project area is spread over 16 VDCs and one Municipality of five districts. The total population of the project area is 1,14,516 and number of households is 21668 (district profile). The male and female populations are 56414 (49.26%) and 58102 (50.74%), respectively. Among the projected affected VDCs Beghadawar is highly populated (10638) whereas population is low in Jalkanya VDC (1915). The ward wise population of the project area is given in Annex-5. Average household size varies in between 4.39 and 6.21 and total average constitutes 5.28 persons per household (Table 4.2.1). Annual population growth rate in the project area is about 2%.

Table- 4.2.1 Population of the Project Area S.N. District VDCs/Municipality Male
Population Female population
Total Population
Households Ave.HH size
1 Dolakha Sahare 1293 1453 2746 554 4.96
2
Ramechhap
Gelu 2812 3335 6147 1192 5.16
Khimti 2032 2390 4422 910 4.86
Tilpung 1993 2325 4318 792 5.45
Kathjor 2174 2605 4779 921 5.19
Manthali 2609 2444 5053 1150 4.39
Bhaluajor 1686 1870 3556 631 5.63
3
Sindhuli
Bhimeshor 961 1063 2024 380 5.33
Ratanchura 1275 1375 2650 488 5.43
Ranichauri 4591 4580 9171 1477 6.21
Bhadrakali 2241 2350 4591 744 6.17
Jalakanya 908 1007 1915 351 5.46
Kamalamai Municipality
16388 16450 32838 6447 5.09
4 Mahottari Gauribas 2872 2860 5732 1094 5.24
5
Dhanusa
Tulasi Bahunmara 1934 2090 4024 800 5.03
Begadawar 5513 5125 10638 1965 5.41
Dhalkebar 5132 4780 9912 1772 5.59
Total 56414 58102 114516 21668 5.28
Source: Nepal District Profile 1997
4.2.2 Ethnicity Being a less developed multiethnic society Nepal has caste system. The ethnic composition differs in different part of the alignment. Altogether sixty-three castes are found in the project area. Chettri (25.56%), Tamang (15.40%), Newar (11.35%), Magar (9.93% and Brahmin (9.79%) are major ethnic group found in the project area (Annex-6). Other includes Kami, Sarki, Damai, Majhi and Yadav. 4.2.3 Language Social integration of the society is in process and population distribution by mother tongue for affected VDCs indicates that dominant language is Nepali followed by Tamang and Maithili. Besides this some dialects are also spoken in the area. Normally Nepali is spoken and understood by all residents. 4.2.4 Religion and Religious Sites Hinduism is the predominate (82.50%) religion followed by Buddha (15.72%) in the project area (Table- 4.2.2). Some households are the followers of Islam (0.14%) and Christian (0.24%).
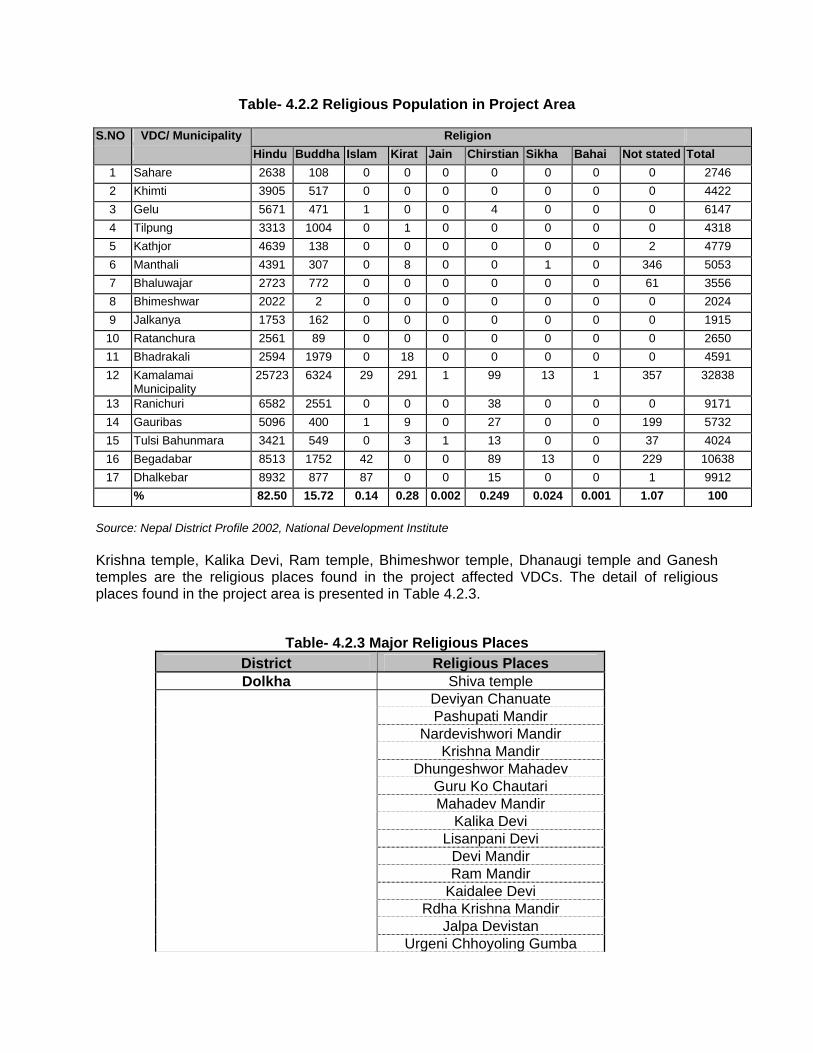
Table- 4.2.2 Religious Population in Project Area S.NO VDC/ Municipality Religion
Hindu Buddha Islam Kirat Jain Chirstian Sikha Bahai Not stated Total
1 Sahare 2638 108 0 0 0 0 0 0 0 2746
2 Khimti 3905 517 0 0 0 0 0 0 0 4422
3 Gelu 5671 471 1 0 0 4 0 0 0 6147
4 Tilpung 3313 1004 0 1 0 0 0 0 0 4318
5 Kathjor 4639 138 0 0 0 0 0 0 2 4779
6 Manthali 4391 307 0 8 0 0 1 0 346 5053
7 Bhaluwajar 2723 772 0 0 0 0 0 0 61 3556
8 Bhimeshwar 2022 2 0 0 0 0 0 0 0 2024
9 Jalkanya 1753 162 0 0 0 0 0 0 0 1915
10 Ratanchura 2561 89 0 0 0 0 0 0 0 2650
11 Bhadrakali 2594 1979 0 18 0 0 0 0 0 4591
12 Kamalamai Municipality
25723 6324 29 291 1 99 13 1 357 32838
13 Ranichuri 6582 2551 0 0 0 38 0 0 0 9171
14 Gauribas 5096 400 1 9 0 27 0 0 199 5732
15 Tulsi Bahunmara 3421 549 0 3 1 13 0 0 37 4024
16 Begadabar 8513 1752 42 0 0 89 13 0 229 10638
17 Dhalkebar 8932 877 87 0 0 15 0 0 1 9912
% 82.50 15.72 0.14 0.28 0.002 0.249 0.024 0.001 1.07 100
Source: Nepal District Profile 2002, National Development Institute Krishna temple, Kalika Devi, Ram temple, Bhimeshwor temple, Dhanaugi temple and Ganesh temples are the religious places found in the project affected VDCs. The detail of religious places found in the project area is presented in Table 4.2.3.
Table- 4.2.3 Major Religious Places
District Religious Places Dolkha Shiva temple
Deviyan Chanuate Pashupati Mandir
Nardevishwori Mandir Krishna Mandir
Dhungeshwor Mahadev Guru Ko Chautari Mahadev Mandir
Kalika Devi Lisanpani Devi
Devi Mandir Ram Mandir
Kaidalee Devi Rdha Krishna Mandir
Jalpa Devistan Urgeni Chhoyoling Gumba

Ramechhap
Nil Kanteshwor Boudha Mandir
Ram Mandir Thanpati Mahadev
Mahadevsthan Shiva Mandir
Pashupatinath Mandir Radha Krishna
Indrabati Temple Ram Sita Mandir
Kusheshwor Shiva Mandir
Rupkali Mandir Bhagwati
Bhagwati Mandir
Sindhuli Krishna Mandir Ganesh Mandir Bhimsen Mandir
Viajaychhap Mahottari Nava durga temple
Dhanusha
Durga Mandir Dhanaugi
Mahadevsthan Bahunmara
Chure Shiva Mandir Bhimeshwor
Aakhidi Mandir Bisara Mandir Ram Mandir
Source: Checklist Field Survey, 2004 4.2.5 Education and Educational Institution
56.85 % population of the project area is literate. The literacy rate varies in different VDCs. The literacy rate is high (68.28%) in Gauribas VDC of Mahottari district and lowest (43.40%) in Kathjore of Ramechhap district. The detail of literacy status in project area is given in Annex-7. Altogether 102 educational institutions of different levels are found in the project area. Out of the total educational institutions primary level constitutes 70.59% and plus 2 is only 2.94 %. The number of educational institutions is more in Ramechhap part of the project area in compare to other district (Table 4.2.4).
Table -4.2.4 Educational Institutions in the Project Area
Types of Institutions Project Area
Total % Dolkha Ramechhap Sindhuli Mahottari Dhanusha
Primary School 5 34 10 3 20 72 70.59 Lower Secondary School 0 8 0 2 5 15 14.71 Secondary School 0 6 2 1 3 12 11.76 Plus 2 0 2 1 0 0 3 2.94 Total 5 50 13 6 28 102 100 Source: Field Survey, 2004

The number of educational establishments by levels, number of teachers and students in the project area are tabulated in following tables-4.2.5. Preliminary data indicate that in primary level students/teacher ratio in Ramechhap is 29. Similar indicators for Dhanusha and Sindhuli are 30 and 29. In lower secondary level student/ teacher ratio for Ramechap and Dhanusha is 39 and 46. In secondary level the ratio is almost same except for Sindhuli and Dhanusha where it is more than 50.
Table- 4.2.5 Number of Schools in Project Area
District
Primary School
Number Teacher Students Male Female Total Male Female Total
Ramechhap 34 90 23 113 1840 1419 3259 Sindhuli 10 14 6 20 275 300 575 Dhanusha 20 69 17 86 1438 1140 2578
Source: Checklist Field Survey, 2004
District
Lower Secondary School
Number Teacher Students Male Female Total Male Female Total
Ramechhap 8 47 15 62 1230 1170 2400 Sindhuli 0 0 0 0 0 0 0 Dhanusha 5 29 7 36 865 785 1650
Source: Checklist Field Survey, 2004
District
Secondary School
Number Teacher Students Male Female Total Male Female Total
Ramechhap 6 77 5 82 1225 1025 2250 Sindhuli 2 18 8 26 800 600 1400 Dhanusha 3 30 9 39 1102 898 2000
Source: Checklist Field Survey, 2004
District
Plus 2
Number Teacher Students Male Female Total Male Female Total
Ramechhap 2 18 3 21 530 585 1115 Sindhuli 1 10 3 13 250 200 450 Dhanusha 0 0 0 0 0 0 0
Source: Checklist Field Survey, 2004 4.2.6 Occupation
Agriculture is predominant occupation in project area flowed by livestock farming, poultry, trade and business, manufacturing industries, transport and business.
According to available data 17.63% population of the project area is economically active. Out of that 10.7% are involved in manufacturing sector and 33.3% in trade and business. The other

areas are 3.6%, 29% and 21.6% for transport, service and others respectively. The detail of economic active and non active population in the project area is presented in Annex- 8.
4.2.7 Land Holding Size and Land Transaction
Checklist survey provides average landholding by types of land in the project area, which shows that Terai households have more land than hilly families. Land distribution is uneven. Most of lands are concentrated on few landholders. Average household in Dolakha, Ramechhap, Sindhuli, Mahottari and Dhanusha, sector of the project area corresponds to 0.66 ha, 0.60 ha, 0.35 ha, 0.67 and 0.91 ha per households respectively (Table- 4.2.6). It shows that subsistent farming system prevails in project area and per capita land availability is low.
Table - 4.2.6 Land Holding Size in Project Area
Project Area Land Area Ropani Total
Irrigated Land
Unirrigated Land
Khar Bari
Pakha / Bari
Ropani Ha.
Dolkha 3 2 3 5
13
0.66
Ramechhap 1.70 1.72 2.61 5.77 11.8 0.60 Sindhuli 1.00 0.50 1.00 4.50 7 0.35 Mahottari 6 5 0 2.16 13.16 0.67 Dhanusha 6.50 0.00 0.00 11.50 18 0.91
Source: Checklist Field Survey, 2004 Land transaction in terms of land purchase and sale is limited in the project area. Therefore, land holdings appear to be stable. However, the price of land depends upon the location, quality of land and varies from VDC to VDC (Table- 4.2.7).
Table - 4.2.7 Land Price in Project Area
District VDC Irrigated Land (NRs.) Unirrigated Land (NRs.)
Kharbari Unit Abbal Doyam Sim Chahar Abbal Doyam Sim Chahar
Sindhuli Kamalamai 80000 70000 60000 50000 60000 50000 40000 30000 30000 Per
Kattha Sindhuli Ratanchura 200000 150000 100000 200000 150000 100000 10000 '' Sindhuli Bhimeshwor 500000 400000 200000 200000 250000 200000 150000 100000 ''
Dhanusha Tulasi Bahunmara 35000 22000 20000 18000 20000 16000 10000 9000
per Kattha
Dhanusha Bengadawar 40000 35000 20000 15000 20000 15000 7000 5000 '' Dhanusha Dhalkebar 20000 18000 16000 14000 15000 14000 13000 12000 ''
Ramechhap Manthali 200000 150000 100000 90000 20000 15000 10000 8000 10000 Per
Ropani Ramechhap Katahare 125000 100000 90000 75000 90000 75000 70000 65000 40000
Source: Field Survey, 2004 4.2.8 Agriculture Practice and Production Average productivity of crops shows that Sindhuli is more productive for paddy and maize. Per Ropani wheat and millet production is highest in Ramechhap. Details are provided in the Table 4.2.8.
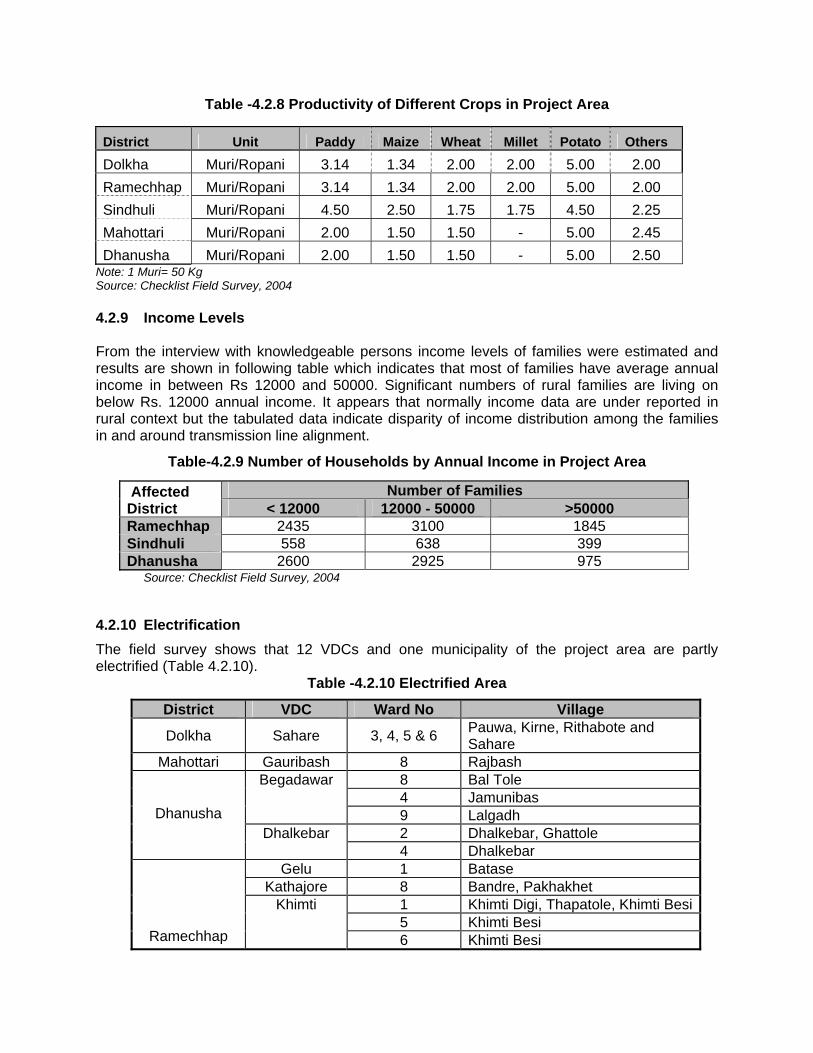
Table -4.2.8 Productivity of Different Crops in Project Area
District Unit Paddy Maize Wheat Millet Potato Others
Dolkha Muri/Ropani 3.14 1.34 2.00 2.00 5.00 2.00
Ramechhap Muri/Ropani 3.14 1.34 2.00 2.00 5.00 2.00
Sindhuli Muri/Ropani 4.50 2.50 1.75 1.75 4.50 2.25
Mahottari Muri/Ropani 2.00 1.50 1.50 - 5.00 2.45
Dhanusha Muri/Ropani 2.00 1.50 1.50 - 5.00 2.50 Note: 1 Muri= 50 Kg Source: Checklist Field Survey, 2004 4.2.9 Income Levels From the interview with knowledgeable persons income levels of families were estimated and results are shown in following table which indicates that most of families have average annual income in between Rs 12000 and 50000. Significant numbers of rural families are living on below Rs. 12000 annual income. It appears that normally income data are under reported in rural context but the tabulated data indicate disparity of income distribution among the families in and around transmission line alignment.
Table-4.2.9 Number of Households by Annual Income in Project Area
Affected District
Number of Families < 12000 12000 - 50000 >50000
Ramechhap 2435 3100 1845 Sindhuli 558 638 399 Dhanusha 2600 2925 975
Source: Checklist Field Survey, 2004
4.2.10 Electrification
The field survey shows that 12 VDCs and one municipality of the project area are partly electrified (Table 4.2.10).
Table -4.2.10 Electrified Area
District VDC Ward No Village
Dolkha Sahare 3, 4, 5 & 6 Pauwa, Kirne, Rithabote and Sahare
Mahottari Gauribash 8 Rajbash
Dhanusha
Begadawar 8 Bal Tole 4 Jamunibas 9 Lalgadh
Dhalkebar 2 Dhalkebar, Ghattole 4 Dhalkebar
Ramechhap
Gelu 1 Batase Kathajore 8 Bandre, Pakhakhet
Khimti 1 Khimti Digi, Thapatole, Khimti Besi5 Khimti Besi 6 Khimti Besi

Manthali 1 Lisanpani 2 Machhedanda 6 Nalamitol, Dahalgaun 7 Dahalgaun 8 Tekanpur
Tilpung 2 Mange
Sindhuli
Bhadrakali 1 Dhungre Bhanjyang 2 Dhungre Bhanjyang 3 Lamishwara, Mudekharka
Bhimeshwor 2 Tari, Baghbazar, Raj Dei 3 Rato Tar, Khurkot Ratotar
4 Pokhrelthok, Dhungeni Danda, Kushgaun, Khurkot
9 Mathillo Besi Kamalamai 6 Aandheri, Ratamate
7 Bhadautar, Dandatole, Majhitar, Panitanki, Thulitar
9 Kattike Ratanchura 1 Khanigaun, Thapatole
2 Vijaychhap, Ghhata Mathi 11 Khanigaun
Source: Field Survey, 2004 Electricity consumption is primarily domestic in nature and large industries consuming considerable energy is absent in project area. Between the periods the number of consumers was slightly increased. Per consumer revenue may be taken as proxy of consumer's willingness to pay. In domestic sector willingness to pay varies in between Rs.163 and 168. Overall revenue per consumer during winter is Rs. 352 and during the summer it decreases to Rs. 289. Household consumption is more or less stable and constitutes 29.5 units per month.
Table -4.2.11 Energy consumption in Project Area during winter
S.N. Consumer Number of Consumer
Units Revenue Rs.
Revenue per Consumer Rs.
1 Domestic 2122 62531 346954 163.5 2 Commercial 13 4496 45709 3516 3 Noncommercial 71 9722 92526 1303 4 Industrial 26 8425 58178 2238 5 Others 8 29056 254564 31820 6 Total 2240 124231 787933 352
Source: NEA, Sindhuli Branch - Monthly Statement for 060, Paush
Table-4.2.12 Energy Consumption in Project Area during summer
S.N. Consumer Category
Number of Consumers
Units Revenue Rs.
Revenue per Consumer Rs.
1 Domestic 2017 60093 338956 1682 Commercial 12 3158 33124 27603 Non -commercial 67 13268 120501 13034 Industrial 23 8205 55629 1798

5 Others 8 13978 67329 84166 Total 2127 98702 615540 289
Source: NEA, Sindhuli Branch - Monthly Statement for 060, Jestha 4.2.11 Land use Pattern Map interpretation of the project area reveals that altogether 68.44 ha of cultivated area along ROW with 68 tower pads will be required for the construction of the Project. The land use pattern of the alignment by affected districts is provided in this table-4.2.13 which shows area under forests is 106.6 ha. River crossing, road crossing and barren lands constitute 53.6 ha. Cultivated area is not affected in Dolakha and Mahottari districts and social issues, if any, may be only related to use of forests in these districts.
Table- 4.2.13 Land use Pattern in Transmission Line ROW S.No District Cultivated
Land (ha) Forest Land
(ha) River
Crossing (ha)
Road Crossing
(ha)
Barren Land (ha)
1 Dolakha - - 1.8 0.059 1.1187 2 Ramechhap 28.318 25.905 7.6 1.185 17.241 3 Siindhuli 30.355 59.488 6.4 1.778 - 4 Mahottari - 7.946 1.7 0.059 - 5 Dhanusha 9.7671 13.261 4.9 10.119 -
Total 68.4401 106.6 22.4 13.2 18.3597 Source: Field Survey, 2004
4.2.12 Development Activities Hydropower, drinking water, health, road, suspension bridge and rural electrification are the major development project implemented in the project area. The field survey shows that number of development program are more in Ramechhap part of the project area compare to other areas (Annex-9). 4.2.13 Institutional Analysis and Infrastructure NGOs More than 20 NGOs are working in the project area. Rural Health Development Project (RHDP), Community Development Society (CDS), Tamakoshi Sewa Samiti, Dhruba Tara Yuva Club and Dhanusha Sewa Samiti are the main NGOs actively working in environment, drinking water, health, social service & public awareness and income generation areas. The list of NGOs, objectives/work area and people employed are presented in Annex-10. Infrastructure The main local markets are Khimti Besi, Gogane, Kubinde, Khurkot, Panitanky, Sindhure Bagmara and Hardia. The infrastructures for people services are 11kV transmission line in Manthali area and 33KV T/L in Ratanchaur and Bhadrakali area, airport in Manthali, irrigation canal in Khurkot. Sindhuli – Banepa Road and Bardibas – Sindhuli Road is the other features encounter in the transmission line corridor.
The other infrastructure found in the area are hospital, police office, forest office, irrigation,

agriculture service center, veterinary, water supply office and banks (Annex-11). 4.2.14 Manthali Airport About 350 –400 m stretch of the proposed alignment extent in the vicinity of the Manthali airport. This stretch lies at a distance about 730 m from the airport. This airport is located in Manthali of Manthali Village Development Committee and occupies 0.04 ha of land. There are three flights (Sunday, Tuesday & Thursday) of Royal Nepal Airlines from Kathmandu to Mathali in a week. This airport also serves as transit point for the landing of aircraft if the whether of Lukla and other mountainous flight are not clear. The airport has landing facilities from north and south direction depending on wind direction. 4.2.15 Information Decimation in Project Area The field survey compiled the data regarding knowledge about the project, which reveals that 70 % of households had knowledge about the project. 30 % of respondents said that they have no information regarding the project. Information on the project is to be provided before and during the project construction so that people will be aware of activities in the route alignment. Public consultation and activities regarding information disclosure will enable the local people to know more about the project (Table 4.2.14).
Table 4.2.14 Knowledge About the Project Knowledge About the Project No. of HHs % of HHs Yes 147 70.00 No 63 30.00 Total 210 100.00 Source: Field Survey, 2004
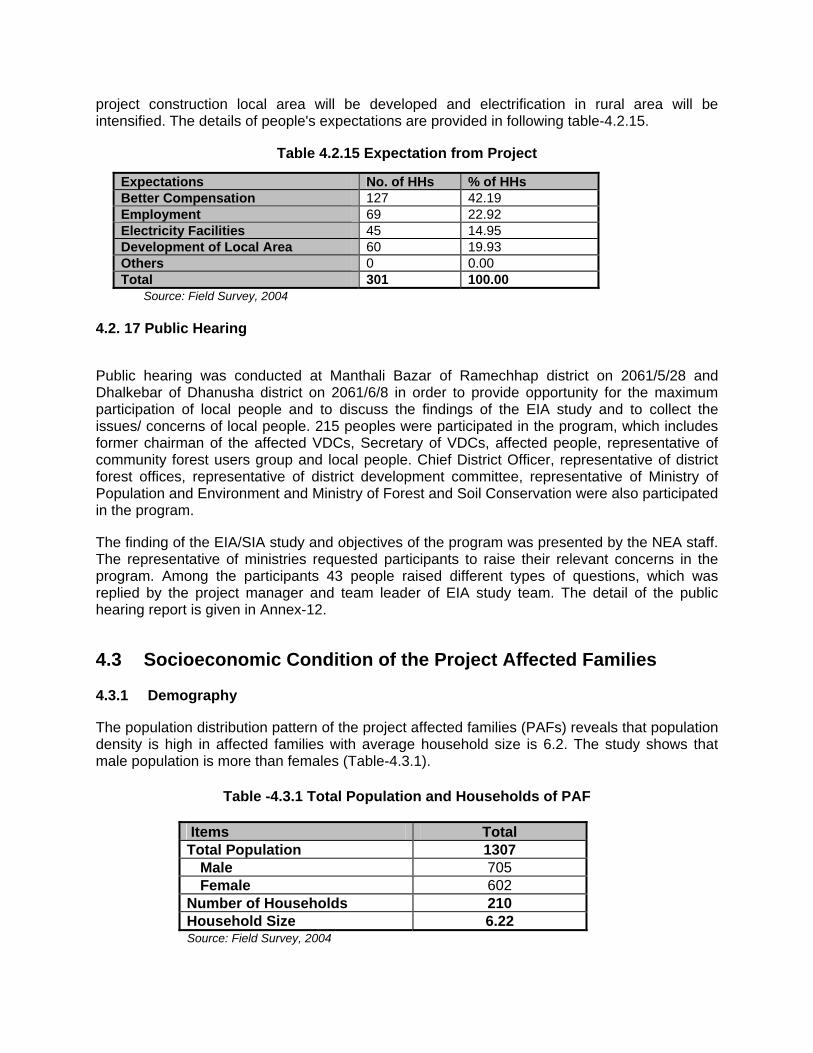
4.2.16 Expectation The survey team records various expectations of affected households. Most of people (42.19 %) expect that project will provide better compensation followed by employment. As a result of
Knowledge About the Project
Yes70%
No30%
Fig 4.2.1
project construction local area will be developed and electrification in rural area will be intensified. The details of people's expectations are provided in following table-4.2.15.
Table 4.2.15 Expectation from Project
Expectations No. of HHs % of HHs Better Compensation 127 42.19 Employment 69 22.92 Electricity Facilities 45 14.95 Development of Local Area 60 19.93 Others 0 0.00 Total 301 100.00
Source: Field Survey, 2004 4.2. 17 Public Hearing Public hearing was conducted at Manthali Bazar of Ramechhap district on 2061/5/28 and Dhalkebar of Dhanusha district on 2061/6/8 in order to provide opportunity for the maximum participation of local people and to discuss the findings of the EIA study and to collect the issues/ concerns of local people. 215 peoples were participated in the program, which includes former chairman of the affected VDCs, Secretary of VDCs, affected people, representative of community forest users group and local people. Chief District Officer, representative of district forest offices, representative of district development committee, representative of Ministry of Population and Environment and Ministry of Forest and Soil Conservation were also participated in the program. The finding of the EIA/SIA study and objectives of the program was presented by the NEA staff. The representative of ministries requested participants to raise their relevant concerns in the program. Among the participants 43 people raised different types of questions, which was replied by the project manager and team leader of EIA study team. The detail of the public hearing report is given in Annex-12.
4.3 Socioeconomic Condition of the Project Affected Families 4.3.1 Demography The population distribution pattern of the project affected families (PAFs) reveals that population density is high in affected families with average household size is 6.2. The study shows that male population is more than females (Table-4.3.1).
Table -4.3.1 Total Population and Households of PAF
Items Total Total Population 1307
Male 705 Female 602
Number of Households 210 Household Size 6.22
Source: Field Survey, 2004
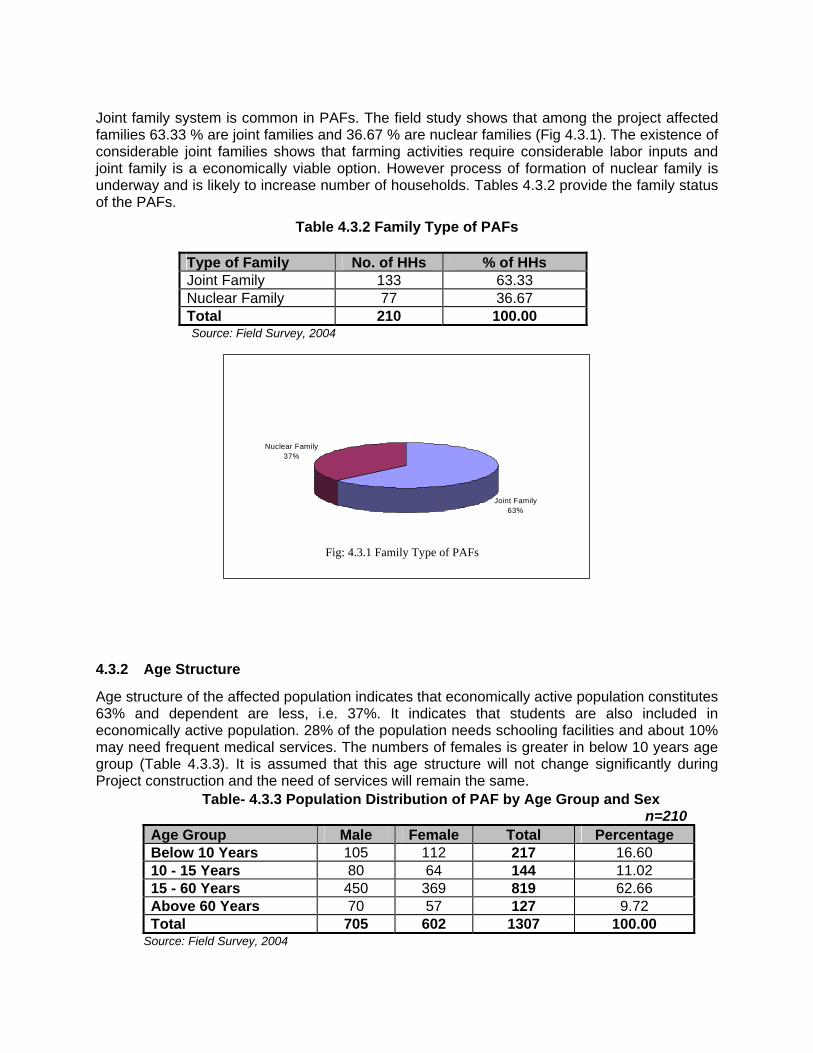
Joint family system is common in PAFs. The field study shows that among the project affected families 63.33 % are joint families and 36.67 % are nuclear families (Fig 4.3.1). The existence of considerable joint families shows that farming activities require considerable labor inputs and joint family is a economically viable option. However process of formation of nuclear family is underway and is likely to increase number of households. Tables 4.3.2 provide the family status of the PAFs.
Table 4.3.2 Family Type of PAFs
Type of Family No. of HHs % of HHs Joint Family 133 63.33 Nuclear Family 77 36.67 Total 210 100.00 Source: Field Survey, 2004
Joint Family63%
Nuclear Family37%
4.3.2 Age Structure
Age structure of the affected population indicates that economically active population constitutes 63% and dependent are less, i.e. 37%. It indicates that students are also included in economically active population. 28% of the population needs schooling facilities and about 10% may need frequent medical services. The numbers of females is greater in below 10 years age group (Table 4.3.3). It is assumed that this age structure will not change significantly during Project construction and the need of services will remain the same.
Table- 4.3.3 Population Distribution of PAF by Age Group and Sex n=210
Age Group Male Female Total Percentage Below 10 Years 105 112 217 16.60 10 - 15 Years 80 64 144 11.02 15 - 60 Years 450 369 819 62.66 Above 60 Years 70 57 127 9.72 Total 705 602 1307 100.00
Source: Field Survey, 2004
Fig: 4.3.1 Family Type of PAFs
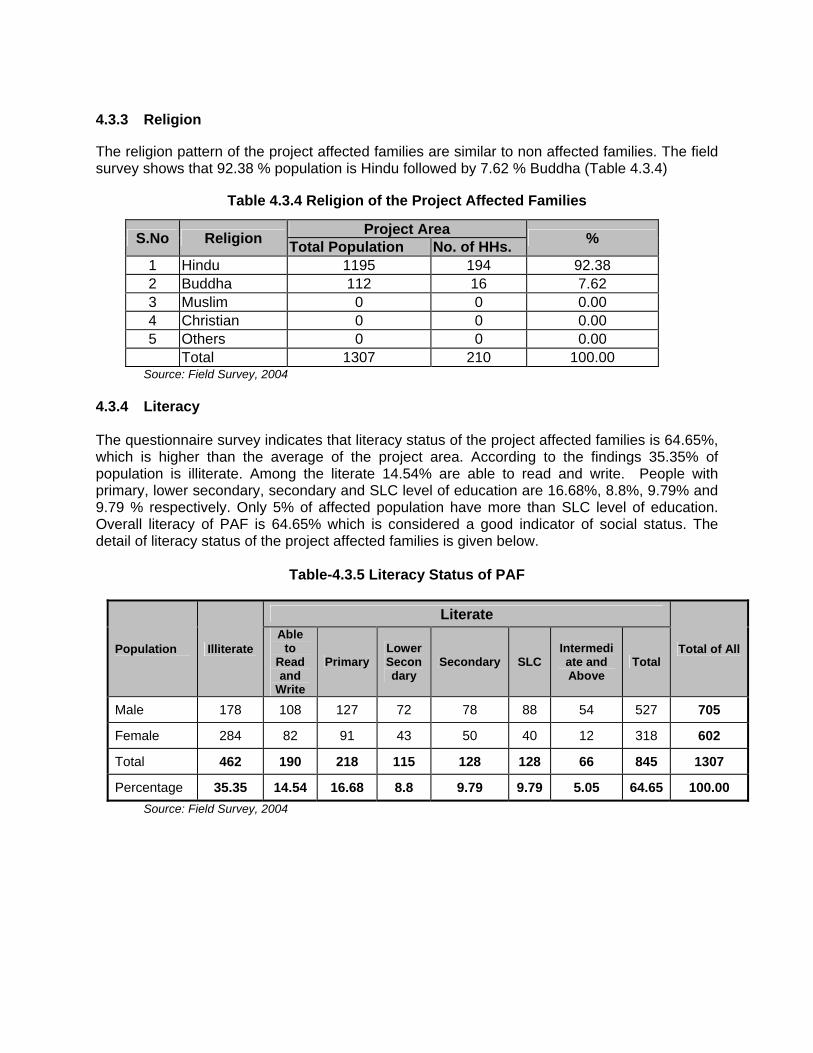
4.3.3 Religion The religion pattern of the project affected families are similar to non affected families. The field survey shows that 92.38 % population is Hindu followed by 7.62 % Buddha (Table 4.3.4)
Table 4.3.4 Religion of the Project Affected Families
S.No Religion Project Area
% Total Population No. of HHs.
1 Hindu 1195 194 92.38 2 Buddha 112 16 7.62 3 Muslim 0 0 0.00 4 Christian 0 0 0.00 5 Others 0 0 0.00
Total 1307 210 100.00 Source: Field Survey, 2004
4.3.4 Literacy The questionnaire survey indicates that literacy status of the project affected families is 64.65%, which is higher than the average of the project area. According to the findings 35.35% of population is illiterate. Among the literate 14.54% are able to read and write. People with primary, lower secondary, secondary and SLC level of education are 16.68%, 8.8%, 9.79% and 9.79 % respectively. Only 5% of affected population have more than SLC level of education. Overall literacy of PAF is 64.65% which is considered a good indicator of social status. The detail of literacy status of the project affected families is given below.
Table-4.3.5 Literacy Status of PAF
Population Illiterate
Literate
Total of All Able
to Read and
Write
Primary Lower Secondary
Secondary SLC Intermediate and Above
Total
Male 178 108 127 72 78 88 54 527 705
Female 284 82 91 43 50 40 12 318 602
Total 462 190 218 115 128 128 66 845 1307
Percentage 35.35 14.54 16.68 8.8 9.79 9.79 5.05 64.65 100.00
Source: Field Survey, 2004

4.3.5 Migration Pattern The field survey shows that most of the households (83.33%) are local resident but some people migrated into the area due to various reasons. One family migrated recently. Three families came to the area within five years. Thirty- one households are migrant for more than five years (Table 4.3.6). It appears that a few families may immigrate to the project area until the construction of the project starts. The Project Affected Families are comparatively stable and present data reflects socio- cultural issues during construction when seasonal in migration may occur. Out migration was not considered which has primarily seasonal character.
Table 4.3.6 Migration Pattern of PAFs
Types No. of HHs % of HHs
Local Resident 175 83.33
Migrated Within 1 Year 1 0.48
Migrated Within 5 Years 3 1.43
Migrated More Than 5 Years 31 14.76
Total 210 100.00 Source: Field Survey, 2004
4.3.6 Occupation Among the project-affected families 49% of population responded that their primary occupation is agriculture. 8.8% reported that service is their main occupation. Study is also taken as an occupation and 17% of the respondents reported their occupation as a student. Share of business, labor and wages are almost equal and constitute 2.68 and 2.37 percent respectively (Table-4.3.7). It appears that labor and wages will be required during project construction and operation and local skills will be utilized as far as practicable. Existing occupational distribution reflects rural nature of sampled population where agriculture is dominant characteristics. Some diversification of occupation is expected during construction.
Table- 4.3.7 Occupation Distribution of PAF by Sex
Occupation Male Female Total Percentage
Agriculture 285 356 641 49.04
Business 28 7 35 2.68
Service 102 13 115 8.80
Labour and Wages 29 2 31 2.37
Students 148 106 254 19.43
Unable to Work 107 116 223 17.06
Others 6 2 8 0.61
Total 705 602 1307 100.00
Source: Field Survey 2004

4.3.7 Skills During the field survey an inquiry was made about skills of affected population and only 10% of population have some skills. A variety of skills including mason (7.52%) carpenter (3.01%), tailor (1.50%), blacksmith (3.01%), shoemaker (3.01%), weaving (10.53%) and driver (4.51%) are found in the project area. These and other skills of affected population may be utilized during transmission line construction. The details are shown in table 4.3.8.
Table 4.3.8 Distribution of Skilled Population in Project Affected Families n=210
Skill Type Number of Person Percentage Mason 10 7.52 Carpenter 4 3.01 Tailor 2 1.50 Blacksmith 4 3.01 Shoemaker 4 3.01 Weaving 14 10.53 Driver 6 4.51 Construction 1 0.75 Nursery Works 4 3.01 Others 84 63.16 Total 133 100.00 Source: Field Survey, 2004
4.3.8 Land Holding Size and Land Transaction The project affected families located along the RoW use irrigated, unirrigated and grassland. Distribution of PAF by size of land holding reveals that most of the families cultivate less than 1 ha of land. 21.43 % of PAF reported that they have no irrigated land and 13.3 % of PAF do not own unirrigated land. Similarly 67% of them are deprived of grassland. On the average total landholding of a PAF is 1.05ha which includes 0.4 ha irrigated land, 0.58 ha unirrigated land and 0.07 ha grassland. Area distribution according to size of landholding is presented in Table 4.3.9.
Table- 4.3.9 Distribution of PAFs by Land Holding Size n=210
Size of Land Holding
Irrigated Land (Khet) Unirrigated Land (Bari) Grassland (Kharbari) Total Land
No. Percent Area (ha)
No. Percent Area (ha)
No. Percent Area (ha)
Area (ha)
Percent
Holding without land
45 21.43 0.00 28 13.33 0.00 141 67.14 0.00 0.00 0.00
Less Than 0.1 ha 20 9.52 0.98 21 10.00 4.67 10 4.76 0.53 6.18 2.79 0.1 - 0.2 ha 33 15.71 4.54 35 16.67 17.78 30 14.29 3.90 26.21 11.83 0.2 - 0.5 ha 63 30.00 19.55 61 29.05 17.78 19 9.05 4.91 42.24 19.07 0.5 - 1.0 ha 25 11.90 17.32 38 18.10 26.51 6 2.86 3.31 47.14 21.28 Greater Than 1 ha 24 11.43 40.78 27 12.86 54.31 4 1.90 4.63 99.72 45.02 Total 210 100.00 83.17 210 100.00 121.04 210 100.00 17.28 221.49 100.00
Source: Field Survey, 2004

4.3.9 Area Allocation and Productivity
The project area includes predominantly rural economy with agriculture as a main source of livelihood and income. Agricultural practices with age old equipment result in low productivity of major crops. The primary crops cultivated in the project area are paddy, wheat, maize, millet and pulses and their productivity is estimated at 1.48, 0.56, 0.78, 0.94 and 2.77 t/ha respectively. Area allocation indicates that area under maize is highest followed by wheat, paddy and pulses. Annual average production per household is estimated to be 3514 Kg. or 567 kg per capita or 47.23 Kg per capita per month. The details are provided in following table 4.3.10.
Table -4.3.10 Agricultural Practice and Production
n=210
Types of Product
Paddy Wheat Maize Millet Pulses Others Potatoes Mustard
Total Area (sqm)
443037.24 450312.03 1147935.3 327008.21 440772.71 19712.45 259873.86 78676.31
Khet (sqm) 236351.3 240378.32 265674.99 40658.65 112237.49 2371.64 125554.27 37354.82 Bari (sqm) 206685.94 209933.71 882260.31 286349.56 328535.22 17340.81 134319.59 41321.49 Production (kg)
298150 25125 89200 30825 122250 375 136800 35275
Yield (Ton/ha)
1.48 0.56 0.78 0.94 2.77 0.19 5.26 4.48
Source: Field Survey, 2004
4.3.10 Livestock with PAFs
Livestock development is one of the major sources of income besides their own consumption of livestock and their products. Cattle, buffaloes, goats, pigs and birds are the major livestock domesticated in the project area. The number of these animals differs from house to house. On the average each household possesses 2.18 cattle, 8.5 buffaloes, 3 goats and sheep and 6.2 hen and duck (Table 4.3.11).
Table -4.3.11 Livestock Population with PAFs by Type
S. No. Type of Livestocks Numbers
% of S. No. 1 and 2 % of Total
Milk/Month (Liter)
Average Milk/Month
(Liter)
1 Cattle 459 100.00 Male 260 56.64 6.20 Female 168 36.60 4.01
Milking 31 6.75 0.74 968.57 4.61 2 Buffalo 1786 100.00
Male 1539 86.17 36.71 Female 175 9.80 4.17
Milking 72 4.03 1.72 3488.57 16.61 3 Goats and Sheep 621 14.81 4 Pigs 24 0.57 5 Hen and Duck 1302 31.06 Total 4192 100.00 4457.14 21.22
Source: Field Survey, 2004
4.3.11 Fruit Trees
Fruit trees are the sources of additional income. Inventory conducted during the field survey concludes that fruits like orange, lemon, mango, guava, junar and banana are prevalent in

project area. Total number of trees estimated as 4769 owned by 210 households. Share of banana, guava and mango is highest followed by lemon and orange. Species wise distribution of the fruits and number of trees per household are tabulated in following table.
Table - 4.3.12 Fruit Trees in the Project Affected Area
Types of Tree Total Number Percentage Average / HH Orange 213 4.47 1.01 Lemon 111 2.33 0.53 Mango 503 10.55 2.40 Guava 509 10.67 2.42 Banana 2699 56.59 12.85 Others 734 15.39 3.50 Total 4769 100.00 22.71
Source: Field Survey, 2004
4.3.12 Health Facilities and Diseases Health facilities in project area are inadequate and main diseases prevalent are stomachache, diarrhea, fever, tuberculosis, hysteria, skin diseases and others. The percentage wise distribution of main diseases is provided in following table. It appears that communicable diseases exist in the project area (Table 4.3.13). As a supplement to the survey findings annual records of Manthali Health Post are annexed which are typical of project area (Annex-15).
Table - 4.3.13 Number of PAF Affected by Diseases
Types of Diseases Number of
Households Percentage
Tuberculosis 6 2.51 Stomachache 61 25.52 Diarrhea 56 23.43 Hysteria 3 1.26 Fever 63 26.36 Skin Diseases 2 0.84 Others 48 20.08 Total 239 100.00
Source: Field Survey, 2004 Methods of treatment indicate that in most cases patients consult health post, private clinics and pharmacy. Local baidya and dhami/jhakri also contribute to patient's treatment. There are the cases when patient was not treated at all. Following table provides the information about common methods of treatment in project area (Table 4.3.14). The present data suggest that health facilities are not developed in project area.
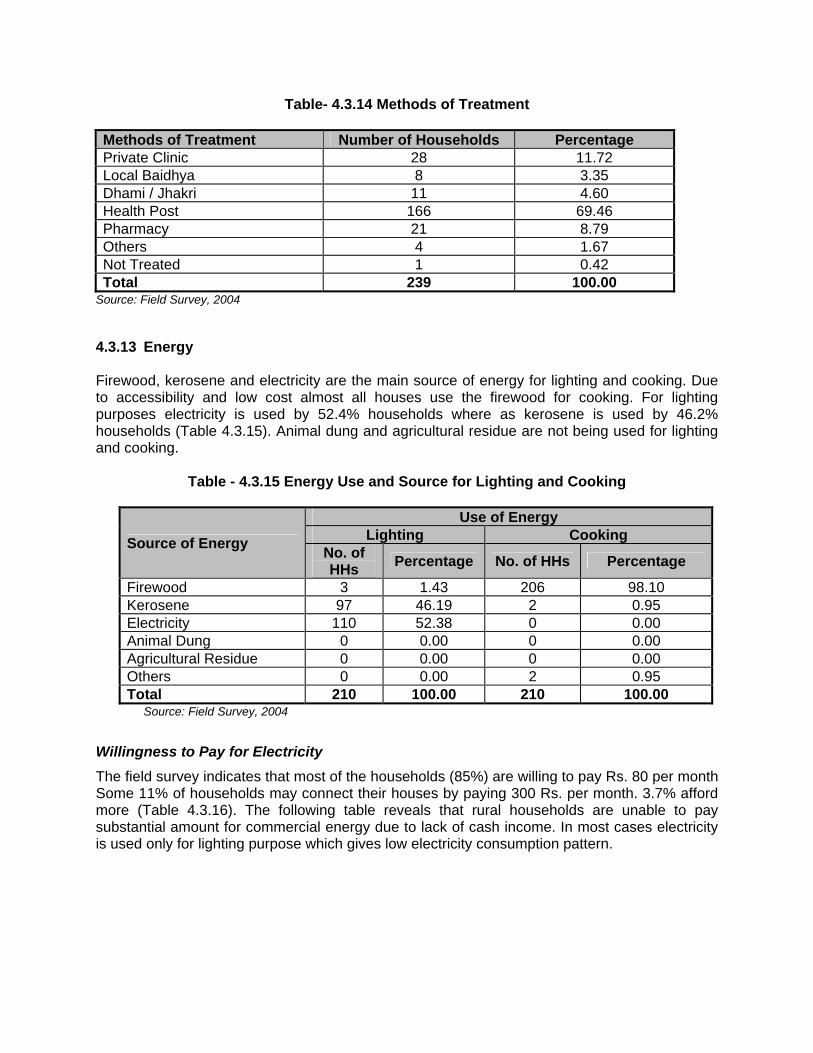
Table- 4.3.14 Methods of Treatment
Methods of Treatment Number of Households Percentage Private Clinic 28 11.72 Local Baidhya 8 3.35 Dhami / Jhakri 11 4.60 Health Post 166 69.46 Pharmacy 21 8.79 Others 4 1.67 Not Treated 1 0.42 Total 239 100.00
Source: Field Survey, 2004
4.3.13 Energy Firewood, kerosene and electricity are the main source of energy for lighting and cooking. Due to accessibility and low cost almost all houses use the firewood for cooking. For lighting purposes electricity is used by 52.4% households where as kerosene is used by 46.2% households (Table 4.3.15). Animal dung and agricultural residue are not being used for lighting and cooking.
Table - 4.3.15 Energy Use and Source for Lighting and Cooking
Source of Energy
Use of Energy Lighting Cooking
No. of HHs
Percentage No. of HHs Percentage
Firewood 3 1.43 206 98.10 Kerosene 97 46.19 2 0.95 Electricity 110 52.38 0 0.00 Animal Dung 0 0.00 0 0.00 Agricultural Residue 0 0.00 0 0.00 Others 0 0.00 2 0.95 Total 210 100.00 210 100.00
Source: Field Survey, 2004
Willingness to Pay for Electricity
The field survey indicates that most of the households (85%) are willing to pay Rs. 80 per month Some 11% of households may connect their houses by paying 300 Rs. per month. 3.7% afford more (Table 4.3.16). The following table reveals that rural households are unable to pay substantial amount for commercial energy due to lack of cash income. In most cases electricity is used only for lighting purpose which gives low electricity consumption pattern.
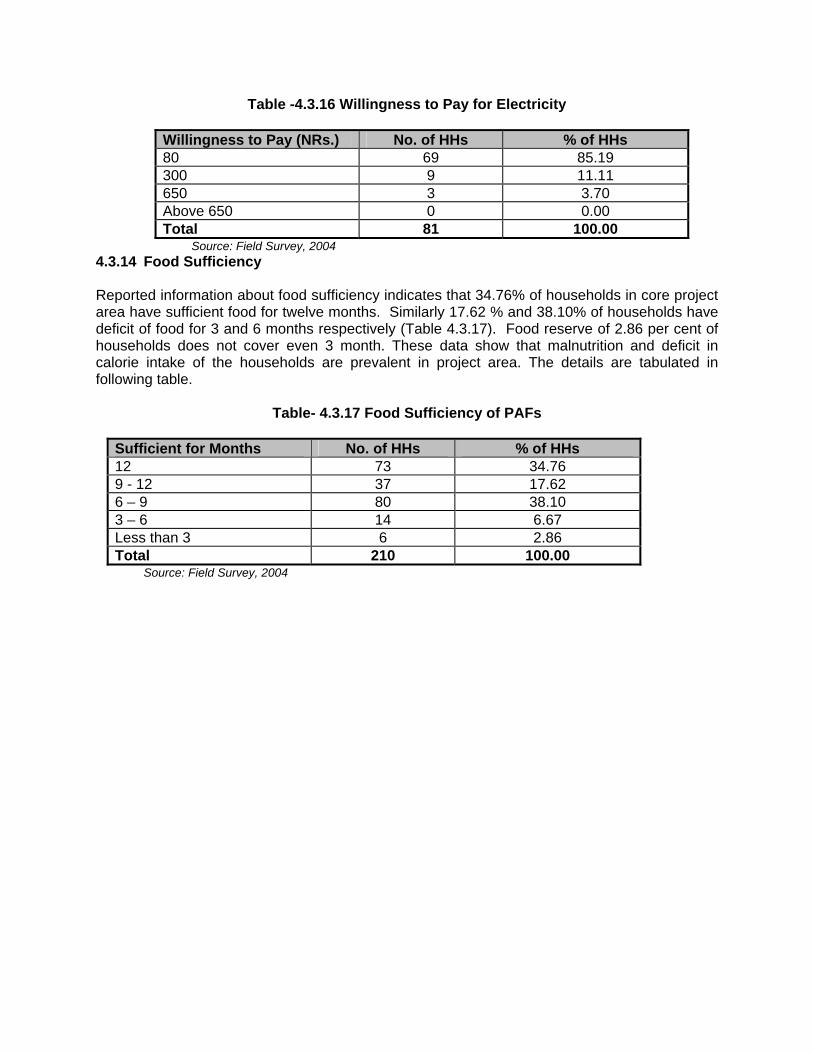
Table -4.3.16 Willingness to Pay for Electricity
Willingness to Pay (NRs.) No. of HHs % of HHs 80 69 85.19 300 9 11.11 650 3 3.70 Above 650 0 0.00 Total 81 100.00
Source: Field Survey, 2004 4.3.14 Food Sufficiency Reported information about food sufficiency indicates that 34.76% of households in core project area have sufficient food for twelve months. Similarly 17.62 % and 38.10% of households have deficit of food for 3 and 6 months respectively (Table 4.3.17). Food reserve of 2.86 per cent of households does not cover even 3 month. These data show that malnutrition and deficit in calorie intake of the households are prevalent in project area. The details are tabulated in following table.
Table- 4.3.17 Food Sufficiency of PAFs
Sufficient for Months No. of HHs % of HHs 12 73 34.76 9 - 12 37 17.62 6 – 9 80 38.10 3 – 6 14 6.67 Less than 3 6 2.86 Total 210 100.00
Source: Field Survey, 2004
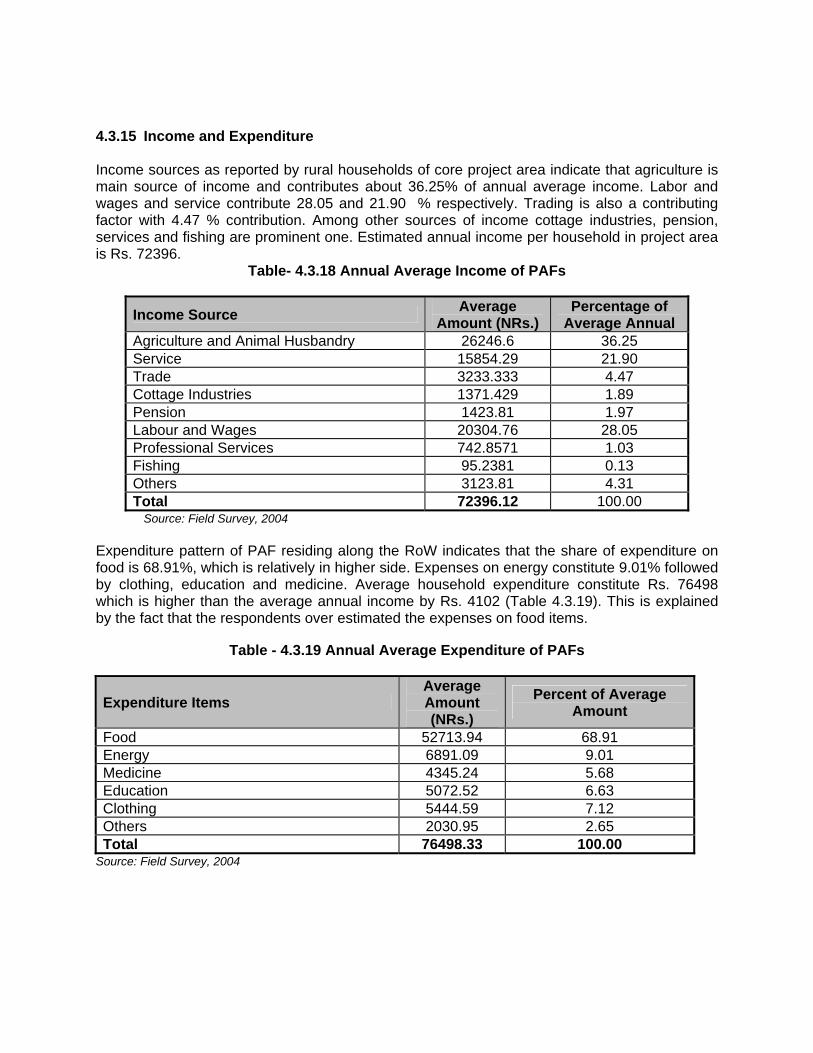
4.3.15 Income and Expenditure Income sources as reported by rural households of core project area indicate that agriculture is main source of income and contributes about 36.25% of annual average income. Labor and wages and service contribute 28.05 and 21.90 % respectively. Trading is also a contributing factor with 4.47 % contribution. Among other sources of income cottage industries, pension, services and fishing are prominent one. Estimated annual income per household in project area is Rs. 72396.
Table- 4.3.18 Annual Average Income of PAFs
Income Source Average
Amount (NRs.) Percentage of
Average Annual Agriculture and Animal Husbandry 26246.6 36.25 Service 15854.29 21.90 Trade 3233.333 4.47 Cottage Industries 1371.429 1.89 Pension 1423.81 1.97 Labour and Wages 20304.76 28.05 Professional Services 742.8571 1.03 Fishing 95.2381 0.13 Others 3123.81 4.31 Total 72396.12 100.00
Source: Field Survey, 2004 Expenditure pattern of PAF residing along the RoW indicates that the share of expenditure on food is 68.91%, which is relatively in higher side. Expenses on energy constitute 9.01% followed by clothing, education and medicine. Average household expenditure constitute Rs. 76498 which is higher than the average annual income by Rs. 4102 (Table 4.3.19). This is explained by the fact that the respondents over estimated the expenses on food items.
Table - 4.3.19 Annual Average Expenditure of PAFs
Expenditure Items Average Amount (NRs.)
Percent of Average Amount
Food 52713.94 68.91 Energy 6891.09 9.01 Medicine 4345.24 5.68 Education 5072.52 6.63 Clothing 5444.59 7.12 Others 2030.95 2.65 Total 76498.33 100.00
Source: Field Survey, 2004

4.3.16 Sanitation and Drinking Water The field survey with regards to sources of drinking water reveals that 68.10 % of households have piped water supply and 30% use water from wells for drinking (Table -4.3.20). Some households replied that they are using river and spring water for daily consumption. The water supply scenario seems to be good that majority of population have piped water supply and have less probability of infection by water related diseases.
Table -4.3.20 Sources of Drinking Water and Percentage of Users
Source No. of HHs Percent River / Spring 3 1.43 Well 63 30.00 Pipe 143 68.10 Others 1 0.48 Total 210 100.00 Source: Field Survey, 2004
4.3.17 Use of Forest Resources Field data regarding firewood collection reveals that majority of households (61.06 %) collect firewood from community forest where as 20% of households use the government forest (Table- 4.3.21). The source of firewood for 14.90 % of families residing along the RoW is private forest to meet their requirement. Some households 3.37 % used to by firewood for their domestic use. It appears that pressure on forest resources does exist but is not so severe.
Table- 4.3.21 Sources of Firewood Collected by PAFs
Source No. of HHs % of HHs Government Forest 42 20.19 Private Forest 31 14.90 Community Forest 127 61.06 Purchase 7 3.37 Others 1 0.48 Total 208 100.00 Source: Field Survey, 2004
4.3.18 Gender
Males and females of the project area not equally participate in decision making. Decision on child care and health and cleanliness are primary responsibility of women where as issues related to give and take, education, shopping and community development are decided by males (Table 4.3.22). In certain areas both men and women take the decision. Relative weightage of the roles is presented in following table.

Table -4.3.22 Gender Issues in the Decision Making of Various Activities n-210
Activities Decision Making By
Male % Female % Both % No
Response %
Agriculture 34 6.50 17 4.71 159 15.96 0 0.00 Education 71 13.58 14 3.88 121 12.15 4 40.00 Shopping 82 15.68 23 6.37 105 10.54 0 0.00 Child Care 7 1.34 142 39.34 58 5.82 3 30.00 Community Development 73 13.96 24 6.65 112 11.24 1 10.00 Income Generating Activities 65 12.43 17 4.71 128 12.85 0 0.00 Health and Cleanliness 19 3.63 96 26.59 95 9.54 0 0.00 Give and Take 109 20.84 13 3.60 88 8.84 0 0.00 Social Work 63 12.05 15 4.16 130 13.05 2 20.00 Total 523 100.00 361 100.00 996 100.00 10 100.00
Source: Field Survey, 2004
4.4 Socioeconomic Condition of the Seriously Project Affected
Families (SPAFs) 4.4.1 Demography Project Affected families whose houses are located under the RoW are considered as Seriously Project Affected Families (SPAFs). The Power Development fund Guidelines places relatively more emphasis on Project Affected Families loosing principal residence and these are specified as SPAFs. Altogether 17 houses of three districts fall under RoW in 73-km alignment. Out of that 3 from Ramechhap, 9 from Sindhuli and 5 from Dhanusha districts are within the RoW (Table 4.4.1). All houses are kachchi with tiled and thatched roofing. Types of houses are more or less similar and reflect construction and roofing materials used by the households.
Table 4.4.1 Location of Houses found in RoW
S.No. Type of Houses No. of Houses % 1 Ramechhap 3 17.64 2 Sindhuli 9 52.94 3 Dhanusha 5 29.42 Total 17 100.00
Source: Field Survey, 2004 The total population of SPAF is 100 with average household size 5.88, which is low in comparison of PAFs. The male female ratio is 52% and 48% respectively (Table 4.4.2).
Table -4.4.2 Total Population and Households of SPAF
Indicators Total Total Population 100 Male 52 Female 48 Number of Households 17 Household Size 5.88
Source: Field Survey, 2004
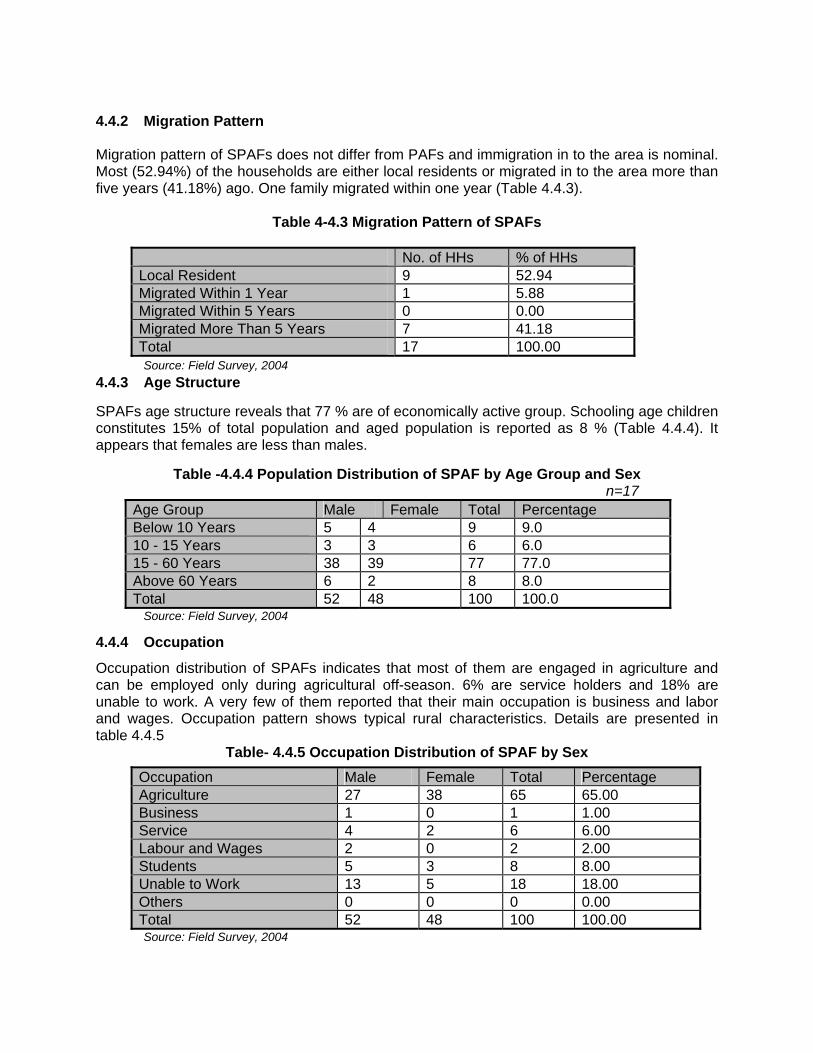
4.4.2 Migration Pattern Migration pattern of SPAFs does not differ from PAFs and immigration in to the area is nominal. Most (52.94%) of the households are either local residents or migrated in to the area more than five years (41.18%) ago. One family migrated within one year (Table 4.4.3).
Table 4-4.3 Migration Pattern of SPAFs
No. of HHs % of HHs Local Resident 9 52.94 Migrated Within 1 Year 1 5.88 Migrated Within 5 Years 0 0.00 Migrated More Than 5 Years 7 41.18 Total 17 100.00
Source: Field Survey, 2004
4.4.3 Age Structure
SPAFs age structure reveals that 77 % are of economically active group. Schooling age children constitutes 15% of total population and aged population is reported as 8 % (Table 4.4.4). It appears that females are less than males.
Table -4.4.4 Population Distribution of SPAF by Age Group and Sex n=17
Age Group Male Female Total Percentage Below 10 Years 5 4 9 9.0 10 - 15 Years 3 3 6 6.0 15 - 60 Years 38 39 77 77.0 Above 60 Years 6 2 8 8.0 Total 52 48 100 100.0
Source: Field Survey, 2004
4.4.4 Occupation
Occupation distribution of SPAFs indicates that most of them are engaged in agriculture and can be employed only during agricultural off-season. 6% are service holders and 18% are unable to work. A very few of them reported that their main occupation is business and labor and wages. Occupation pattern shows typical rural characteristics. Details are presented in table 4.4.5
Table- 4.4.5 Occupation Distribution of SPAF by Sex
Occupation Male Female Total Percentage Agriculture 27 38 65 65.00 Business 1 0 1 1.00 Service 4 2 6 6.00 Labour and Wages 2 0 2 2.00 Students 5 3 8 8.00 Unable to Work 13 5 18 18.00 Others 0 0 0 0.00 Total 52 48 100 100.00 Source: Field Survey, 2004

4.4.5 Educational Status
Educational status of Seriously Project Affected Families indicates that 36 % are illiterate and 64 % are under SLC. None of them have received higher education. It shows their poor economical status also. Low level of education may prevent them to perform skilled construction activities. The following table shows disparity regarding educational status among males and females (Table 4.4.6).
Table -4.4.6 Literacy Status of SPAF n=17
Pop
ulat
ion
Illite
rate
Literate
Total of All
Abl
e to
R
ead
and
Writ
e
Prim
ary
Low
er
Sec
onda
ry
Sec
onda
ry
SLC
Inte
rmed
iate
an
d A
bove
Tot
al
Male 13 9 14 7 5 4 0 39 52 Female 23 9 7 8 1 0 0 25 48 Total 36 18 21 15 6 4 0 64 100 Percentage 36.00 18.00 21.00 15.00 6.00 4.00 0.00 64.00 100.00
Source: Field Survey, 2004 4.4.6 Landholding Analysis of landholding size reveals that most of the holdings are small i.e. less than one hectare consisting of irrigated and unirrigated land. Population pressure on cultivated land has resulted in fragmentation of land holding which may not be sufficient for supporting minimum needs of the households. The table 4.4.7 provides more information on distribution of landholding by SPAFs.
Table -4.4.7 Distribution of SPAFs by Land Holding Size n=17
Size of Land Holding
Irrigated Land (Khet)
Unirrigated Land (Bari)
Grassland (Kharbari)
Total Land
No.
Per
cent
Are
a (h
a)
No.
Per
cent
Are
a (h
a)
No.
Per
cent
Are
a (h
a)
Are
a (h
a)
Per
cent
Holding without land
9 52.94 0.00 2 11.76 0.00 14 82.35 0.00 0.00 0.00
Less Than 0.1 ha
2 11.76 0.03 3 17.65 0.17 0 0.00 0.00 0.20 2.15
0.1 – 0.2 ha
1 5.88 0.15 3 17.65 0.40 3 17.65 0.31 0.86 9.14
0.2 – 0.5 ha
3 17.65 1.02 5 29.41 1.51 0 0.00 0.00 2.53 27.04
0.5 – 1.0 ha
0 0.00 0.00 4 23.53 3.30 0 0.00 0.00 3.30 35.25
Greater Than 1 ha
2 11.76 2.47 0 0.00 0.00 0 0.00 0.00 2.47 26.43
Total 17 100.00
3.68 17
100.00 5.38 17 100.00
0.31 9.36 100.00
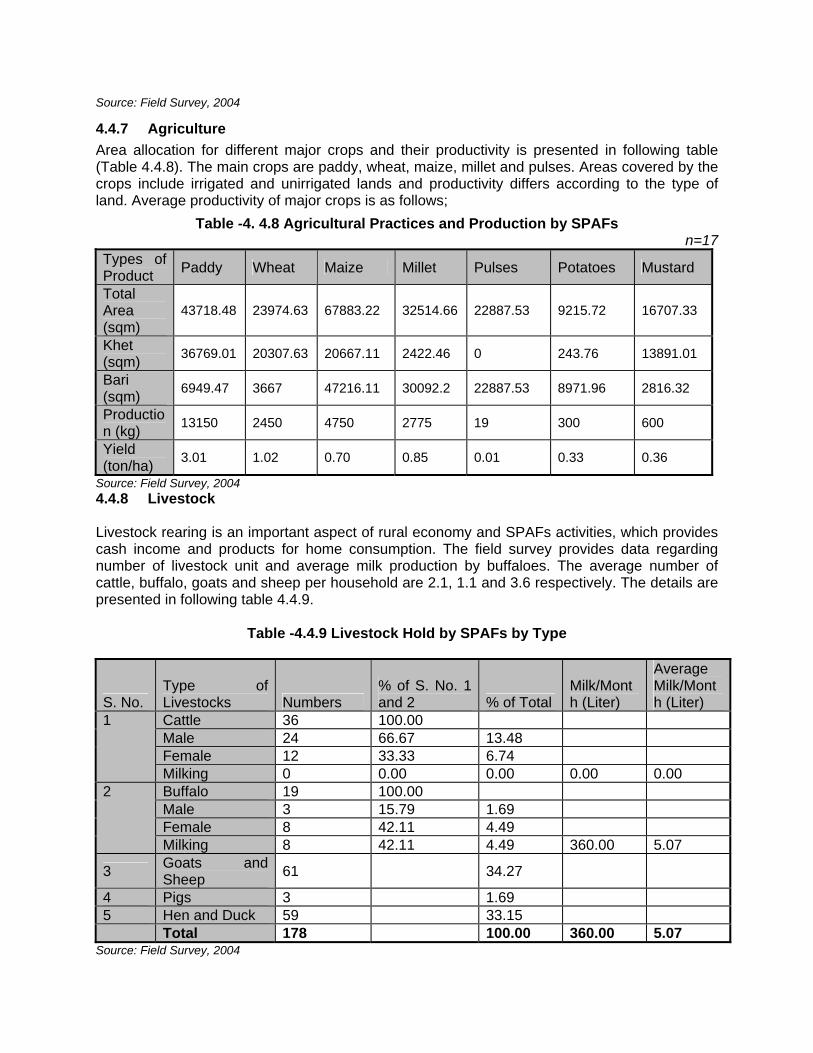
Source: Field Survey, 2004
4.4.7 Agriculture
Area allocation for different major crops and their productivity is presented in following table (Table 4.4.8). The main crops are paddy, wheat, maize, millet and pulses. Areas covered by the crops include irrigated and unirrigated lands and productivity differs according to the type of land. Average productivity of major crops is as follows;
Table -4. 4.8 Agricultural Practices and Production by SPAFs n=17
Types of Product
Paddy Wheat Maize Millet Pulses Potatoes Mustard
Total Area (sqm)
43718.48 23974.63 67883.22 32514.66 22887.53 9215.72 16707.33
Khet (sqm)
36769.01 20307.63 20667.11 2422.46 0 243.76 13891.01
Bari (sqm)
6949.47 3667 47216.11 30092.2 22887.53 8971.96 2816.32
Production (kg)
13150 2450 4750 2775 19 300 600
Yield (ton/ha)
3.01 1.02 0.70 0.85 0.01 0.33 0.36
Source: Field Survey, 2004 4.4.8 Livestock Livestock rearing is an important aspect of rural economy and SPAFs activities, which provides cash income and products for home consumption. The field survey provides data regarding number of livestock unit and average milk production by buffaloes. The average number of cattle, buffalo, goats and sheep per household are 2.1, 1.1 and 3.6 respectively. The details are presented in following table 4.4.9.
Table -4.4.9 Livestock Hold by SPAFs by Type
S. No. Type of Livestocks Numbers
% of S. No. 1 and 2 % of Total
Milk/Month (Liter)
Average Milk/Month (Liter)
1 Cattle 36 100.00 Male 24 66.67 13.48 Female 12 33.33 6.74 Milking 0 0.00 0.00 0.00 0.00
2 Buffalo 19 100.00 Male 3 15.79 1.69 Female 8 42.11 4.49 Milking 8 42.11 4.49 360.00 5.07
3 Goats and Sheep
61 34.27
4 Pigs 3 1.69 5 Hen and Duck 59 33.15 Total 178 100.00 360.00 5.07
Source: Field Survey, 2004
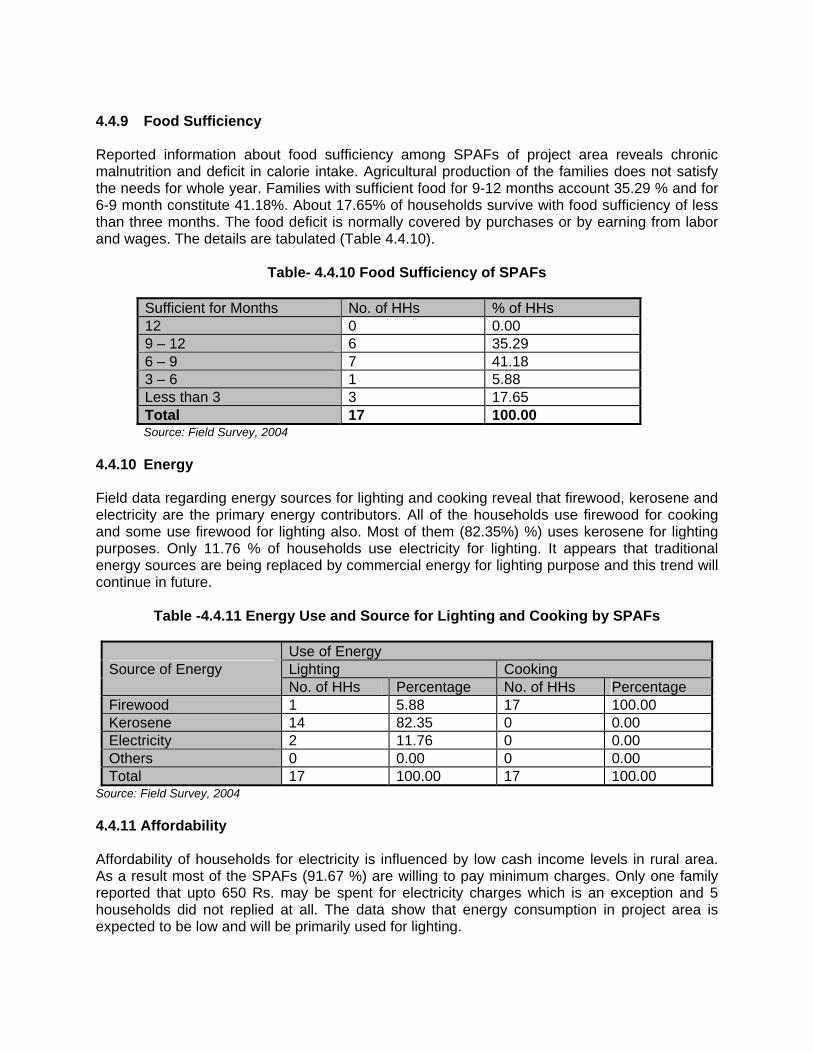
4.4.9 Food Sufficiency Reported information about food sufficiency among SPAFs of project area reveals chronic malnutrition and deficit in calorie intake. Agricultural production of the families does not satisfy the needs for whole year. Families with sufficient food for 9-12 months account 35.29 % and for 6-9 month constitute 41.18%. About 17.65% of households survive with food sufficiency of less than three months. The food deficit is normally covered by purchases or by earning from labor and wages. The details are tabulated (Table 4.4.10).
Table- 4.4.10 Food Sufficiency of SPAFs
Sufficient for Months No. of HHs % of HHs 12 0 0.00 9 – 12 6 35.29 6 – 9 7 41.18 3 – 6 1 5.88 Less than 3 3 17.65 Total 17 100.00 Source: Field Survey, 2004
4.4.10 Energy Field data regarding energy sources for lighting and cooking reveal that firewood, kerosene and electricity are the primary energy contributors. All of the households use firewood for cooking and some use firewood for lighting also. Most of them (82.35%) %) uses kerosene for lighting purposes. Only 11.76 % of households use electricity for lighting. It appears that traditional energy sources are being replaced by commercial energy for lighting purpose and this trend will continue in future.
Table -4.4.11 Energy Use and Source for Lighting and Cooking by SPAFs
Source of Energy Use of Energy Lighting Cooking No. of HHs Percentage No. of HHs Percentage
Firewood 1 5.88 17 100.00 Kerosene 14 82.35 0 0.00 Electricity 2 11.76 0 0.00 Others 0 0.00 0 0.00 Total 17 100.00 17 100.00
Source: Field Survey, 2004 4.4.11 Affordability Affordability of households for electricity is influenced by low cash income levels in rural area. As a result most of the SPAFs (91.67 %) are willing to pay minimum charges. Only one family reported that upto 650 Rs. may be spent for electricity charges which is an exception and 5 households did not replied at all. The data show that energy consumption in project area is expected to be low and will be primarily used for lighting.
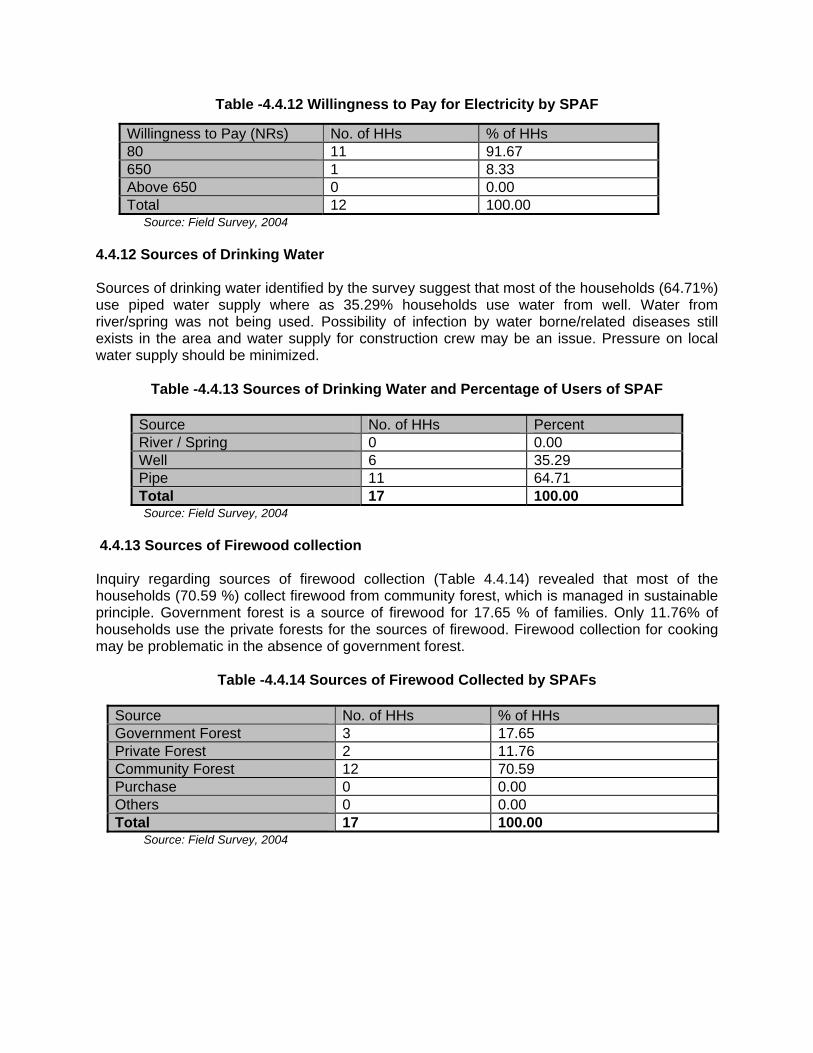
Table -4.4.12 Willingness to Pay for Electricity by SPAF
Willingness to Pay (NRs) No. of HHs % of HHs 80 11 91.67 650 1 8.33 Above 650 0 0.00 Total 12 100.00
Source: Field Survey, 2004 4.4.12 Sources of Drinking Water Sources of drinking water identified by the survey suggest that most of the households (64.71%) use piped water supply where as 35.29% households use water from well. Water from river/spring was not being used. Possibility of infection by water borne/related diseases still exists in the area and water supply for construction crew may be an issue. Pressure on local water supply should be minimized.
Table -4.4.13 Sources of Drinking Water and Percentage of Users of SPAF
Source No. of HHs Percent River / Spring 0 0.00 Well 6 35.29 Pipe 11 64.71 Total 17 100.00 Source: Field Survey, 2004
4.4.13 Sources of Firewood collection Inquiry regarding sources of firewood collection (Table 4.4.14) revealed that most of the households (70.59 %) collect firewood from community forest, which is managed in sustainable principle. Government forest is a source of firewood for 17.65 % of families. Only 11.76% of households use the private forests for the sources of firewood. Firewood collection for cooking may be problematic in the absence of government forest.
Table -4.4.14 Sources of Firewood Collected by SPAFs
Source No. of HHs % of HHs Government Forest 3 17.65 Private Forest 2 11.76 Community Forest 12 70.59 Purchase 0 0.00 Others 0 0.00 Total 17 100.00
Source: Field Survey, 2004

4.4.14 Health and Sanitation Identification of common diseases for SPAFs was conducted during the field survey and results shows that fever is most common followed by stomachache (Fig 4.4.1). Some of the common diseases likely to be found in the area were not reported (Table 4.4.15). Anyway health and sanitation situation in the project area is far from satisfactory.
Table -4.4.15 Number of SPAFs Affected by Diseases n=17
Types of Diseases Number of Households Percentage Tuberculosis 0 0.00 Stomachache 9 36.00 Diarrhoea 3 12.00 Fever 10 40.00 Skin Diseases 0 0.00 Others 3 12.00 Total 25 100.00 Source: Field Survey, 2004
Methods of treatment adopted by SPAFs indicate that health post and private clinics are being used for treatment. The locals are using modern method of treatment. Traditional methods were not reported but interviews with local residents during the site visit shows that traditional methods are still being used in the project area (Table 4.4.16).
Number of SPAFs Affected by Diseases
0
5
10
15
20
25
30
Sto
ma
cha
che
Dia
rrh
oe
a
Fe
ver
Oth
ers
To
tal
Fig:4.4.1
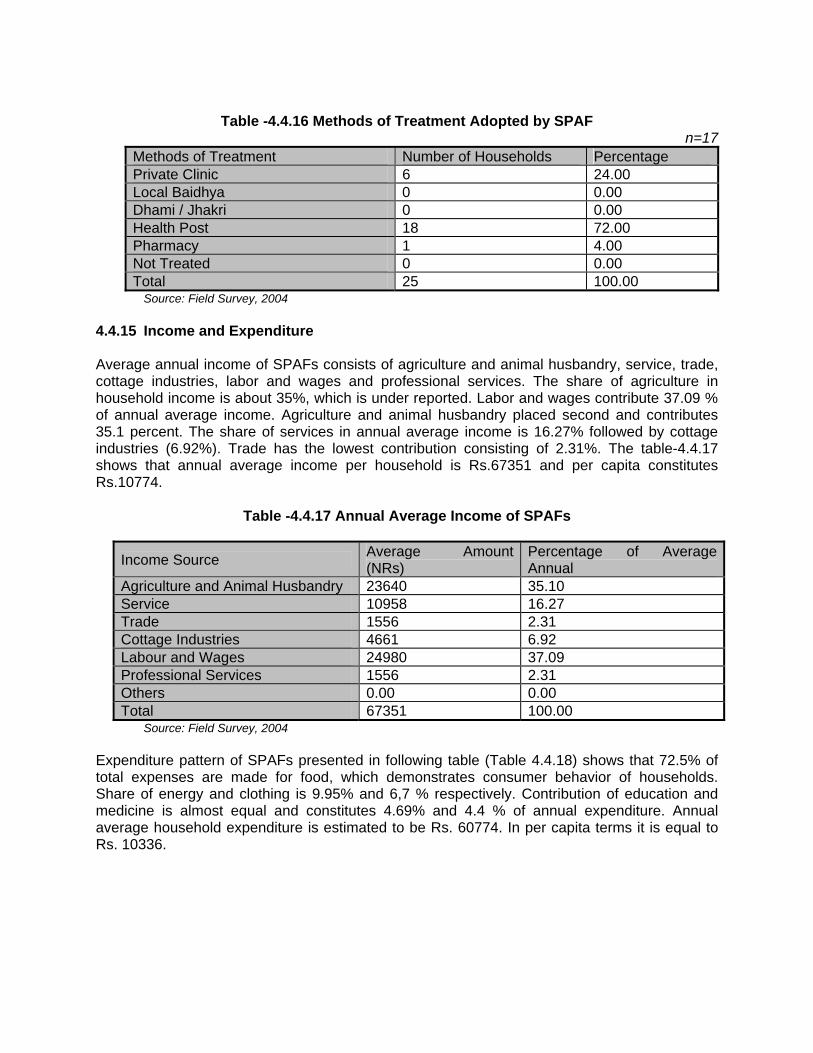
Table -4.4.16 Methods of Treatment Adopted by SPAF
n=17 Methods of Treatment Number of Households Percentage Private Clinic 6 24.00 Local Baidhya 0 0.00 Dhami / Jhakri 0 0.00 Health Post 18 72.00 Pharmacy 1 4.00 Not Treated 0 0.00 Total 25 100.00
Source: Field Survey, 2004 4.4.15 Income and Expenditure Average annual income of SPAFs consists of agriculture and animal husbandry, service, trade, cottage industries, labor and wages and professional services. The share of agriculture in household income is about 35%, which is under reported. Labor and wages contribute 37.09 % of annual average income. Agriculture and animal husbandry placed second and contributes 35.1 percent. The share of services in annual average income is 16.27% followed by cottage industries (6.92%). Trade has the lowest contribution consisting of 2.31%. The table-4.4.17 shows that annual average income per household is Rs.67351 and per capita constitutes Rs.10774.
Table -4.4.17 Annual Average Income of SPAFs
Income Source Average Amount (NRs)
Percentage of Average Annual
Agriculture and Animal Husbandry 23640 35.10 Service 10958 16.27 Trade 1556 2.31 Cottage Industries 4661 6.92 Labour and Wages 24980 37.09 Professional Services 1556 2.31 Others 0.00 0.00 Total 67351 100.00
Source: Field Survey, 2004 Expenditure pattern of SPAFs presented in following table (Table 4.4.18) shows that 72.5% of total expenses are made for food, which demonstrates consumer behavior of households. Share of energy and clothing is 9.95% and 6,7 % respectively. Contribution of education and medicine is almost equal and constitutes 4.69% and 4.4 % of annual expenditure. Annual average household expenditure is estimated to be Rs. 60774. In per capita terms it is equal to Rs. 10336.
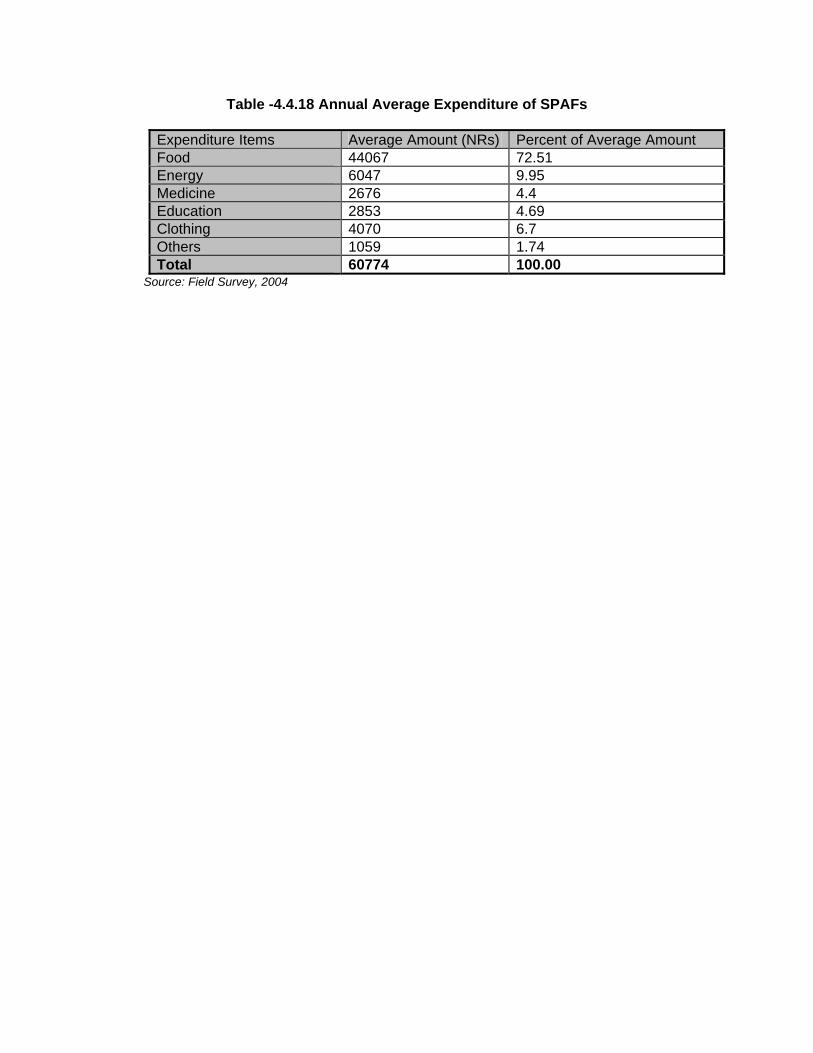
Table -4.4.18 Annual Average Expenditure of SPAFs
Expenditure Items Average Amount (NRs) Percent of Average Amount Food 44067 72.51 Energy 6047 9.95 Medicine 2676 4.4 Education 2853 4.69 Clothing 4070 6.7 Others 1059 1.74 Total 60774 100.00
Source: Field Survey, 2004
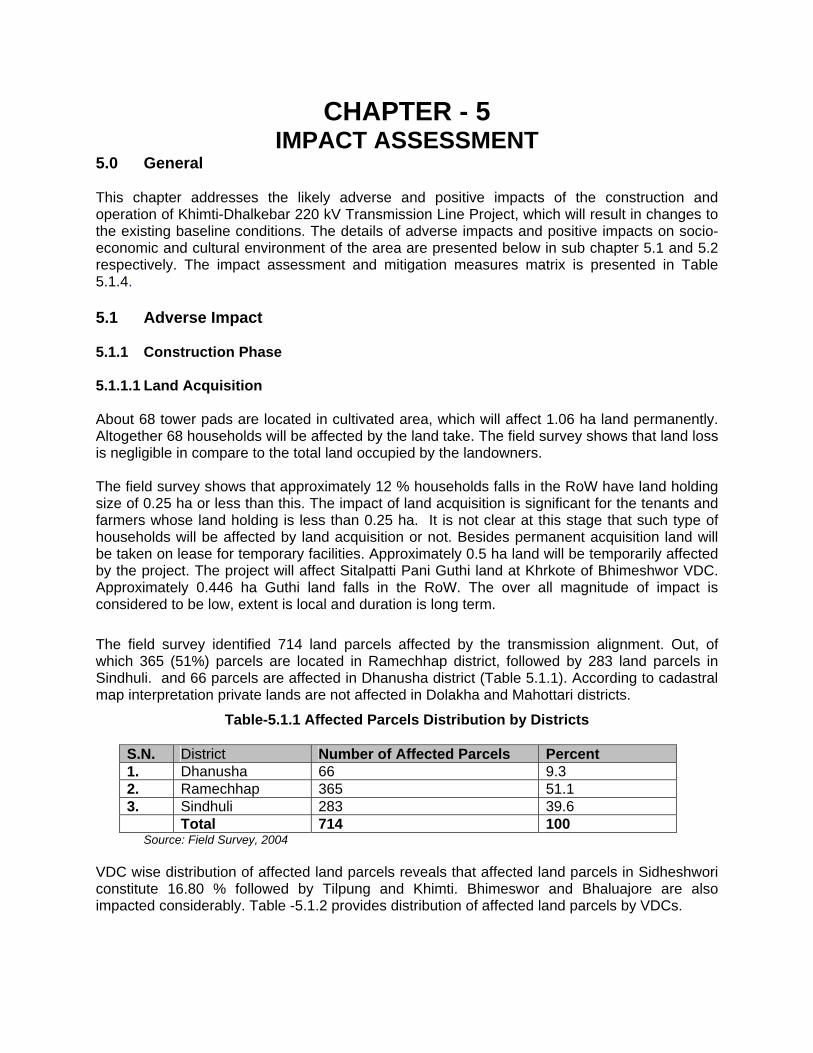
CHAPTER - 5 IMPACT ASSESSMENT
5.0 General This chapter addresses the likely adverse and positive impacts of the construction and operation of Khimti-Dhalkebar 220 kV Transmission Line Project, which will result in changes to the existing baseline conditions. The details of adverse impacts and positive impacts on socio-economic and cultural environment of the area are presented below in sub chapter 5.1 and 5.2 respectively. The impact assessment and mitigation measures matrix is presented in Table 5.1.4. 5.1 Adverse Impact 5.1.1 Construction Phase 5.1.1.1 Land Acquisition About 68 tower pads are located in cultivated area, which will affect 1.06 ha land permanently. Altogether 68 households will be affected by the land take. The field survey shows that land loss is negligible in compare to the total land occupied by the landowners. The field survey shows that approximately 12 % households falls in the RoW have land holding size of 0.25 ha or less than this. The impact of land acquisition is significant for the tenants and farmers whose land holding is less than 0.25 ha. It is not clear at this stage that such type of households will be affected by land acquisition or not. Besides permanent acquisition land will be taken on lease for temporary facilities. Approximately 0.5 ha land will be temporarily affected by the project. The project will affect Sitalpatti Pani Guthi land at Khrkote of Bhimeshwor VDC. Approximately 0.446 ha Guthi land falls in the RoW. The over all magnitude of impact is considered to be low, extent is local and duration is long term.
The field survey identified 714 land parcels affected by the transmission alignment. Out, of which 365 (51%) parcels are located in Ramechhap district, followed by 283 land parcels in Sindhuli. and 66 parcels are affected in Dhanusha district (Table 5.1.1). According to cadastral map interpretation private lands are not affected in Dolakha and Mahottari districts.
Table-5.1.1 Affected Parcels Distribution by Districts
S.N. District Number of Affected Parcels Percent 1. Dhanusha 66 9.3 2. Ramechhap 365 51.1 3. Sindhuli 283 39.6 Total 714 100
Source: Field Survey, 2004 VDC wise distribution of affected land parcels reveals that affected land parcels in Sidheshwori constitute 16.80 % followed by Tilpung and Khimti. Bhimeswor and Bhaluajore are also impacted considerably. Table -5.1.2 provides distribution of affected land parcels by VDCs.
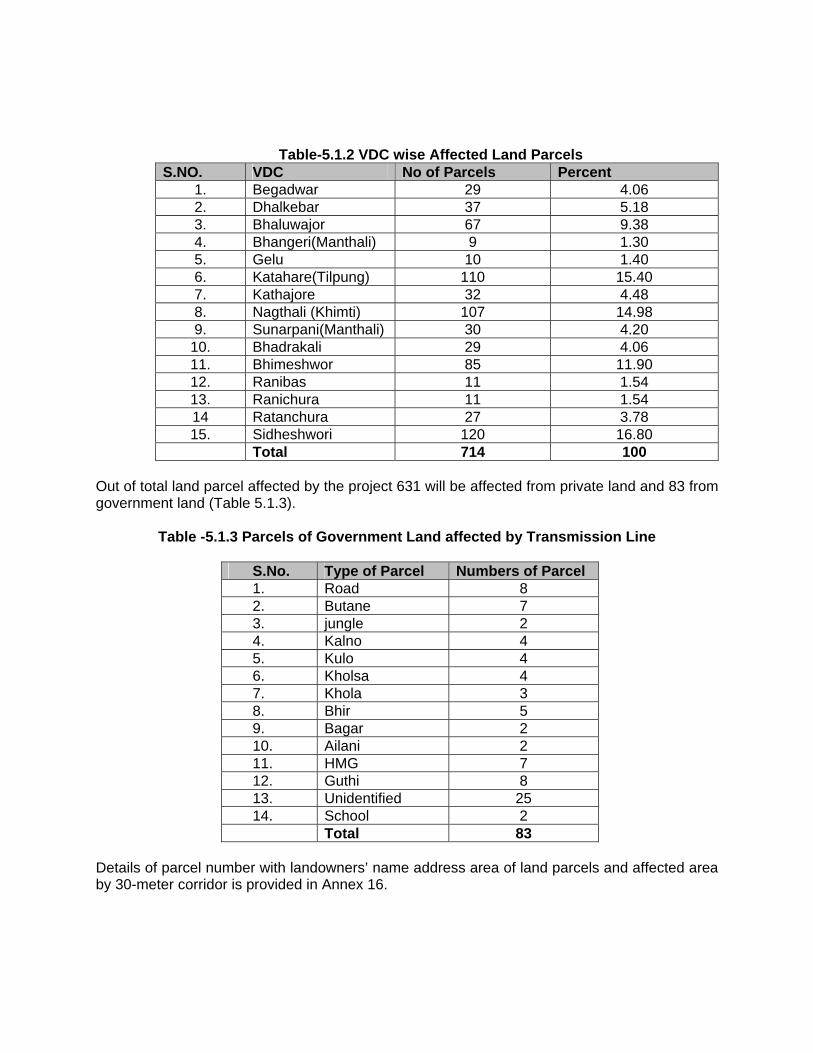
Table-5.1.2 VDC wise Affected Land Parcels S.NO. VDC No of Parcels Percent
1. Begadwar 29 4.06 2. Dhalkebar 37 5.18 3. Bhaluwajor 67 9.38 4. Bhangeri(Manthali) 9 1.30 5. Gelu 10 1.40 6. Katahare(Tilpung) 110 15.40 7. Kathajore 32 4.48 8. Nagthali (Khimti) 107 14.98 9. Sunarpani(Manthali) 30 4.20
10. Bhadrakali 29 4.06 11. Bhimeshwor 85 11.90 12. Ranibas 11 1.54 13. Ranichura 11 1.54 14 Ratanchura 27 3.78 15. Sidheshwori 120 16.80
Total 714 100 Out of total land parcel affected by the project 631 will be affected from private land and 83 from government land (Table 5.1.3).
Table -5.1.3 Parcels of Government Land affected by Transmission Line
S.No. Type of Parcel Numbers of Parcel 1. Road 8 2. Butane 7 3. jungle 2 4. Kalno 4 5. Kulo 4 6. Kholsa 4 7. Khola 3 8. Bhir 5 9. Bagar 2 10. Ailani 2 11. HMG 7 12. Guthi 8 13. Unidentified 25 14. School 2 Total 83
Details of parcel number with landowners’ name address area of land parcels and affected area by 30-meter corridor is provided in Annex 16.

Table 5.1.5 Entitlement Matrix
S.N
Type of Loss / Impacts
Definition of Entitlement
Definition of entitled Unit
Applicable Guidelines
Responsible Organization
1. Loss of land Replacement value in cash
Land owner, a person with landowner certificate
Owners will be compensated in cash
HMG/N
2. Land falling under ROW
Hardship allowance 10% of land value
Owners with certificate
Amount will be paid in cash
The Project
3. Land occupied by residential house
Replacement value in cash
House owner Will be paid in cash
The Project
4. Tenants 50% of the cash compensation
A person cultivating land under lease
The amount is deducted from total compensation
The Project
5. Loss of Community land (Guthi)
33% of total compensation
Person who pays rent to Guthi
67 % goes to Guthi and 33% to the cultivator
The Project
6. Loss of houses Replacement cost without depreciation
House owner Will be paid in cash allowing to use previous construction materials
The Project
7. Cultivated Area by non titleholders
Value of one year crop production
Household should be cultivating the land for more than one year
If the cultivator provides documentation of more than one year use cash will be provided.
The Project
8. Loss of standing Crops
Value of Crops Cultivator Damage assessment Committee will determine extent of losses and amount to be paid
The Project
9. Loss of tree in Private Land
Cost of trees Five years production of fruit and fodder trees
Tree owner Damage assessment Committee considering wood volume
The Project
10. Common Property resources
Continued assess to resources
All users Alternative arrangements are to be made
The Project
11. Loss of Community forestry Land
Replacement of affected land
User group Equivalent land will be provided
The Project Ministry of Forest
5.1.1.2 Relocation of Houses Seventeen houses are likely to be affected due to implementation of the project, which include 9 in Sindhuli 3 in Ramechhap and 5 in Dhanusha districts (Table 5.1.6). Out of the total affected
houses 9 houses have tiled shaded and 8 with thatched roof. 7 houses are double story and 10 are single story. Eight VDC and one municipality will be affected by the house relocation. About 100 people will be affected by house relocation. The age structure indicates that the stress caused by relocation may not be crucial for economically active group, which is supposed to be active participant of project construction.
Table- 5.1.6 Houses Affected in Different part of the Project Area
Type Story Roof type District VDC Ward No/Settlement Kachhi
Ramechhap Khimti Khatri tole -6 1 2 Thatch
Manthali Dahal Guan-6 1 2 do Bhaluwajore Lisanpani-1 1 2 do
Sindhuli Bhadrakali Mudekhrka 1 1 Thatch Ratanchura Ward-2 1 1 do Ratanchura Ward-2 1 2 do Kamalamai Municpality Sano Karkare 1 1 Thatch Kamalamai Municipality Karkare 1 2 Tyal Kamalamai Municipality Thukitar 1 1 Thatch Ranichuri Bhuttaya-Khatyar 3 2 Tyal
Dhanusha Tulasichauda Ram chandra tole -2 3 2 Tyal Beghadabar Ward-4 1 1 Tyal Beghadabar Ward-4 1 2 Tyal
Total 17
The transmission line crosses the school building (one block) and toilet of Tamakoshi Higher Secondary School at Khimti besi of Khimti VDC. The magnitude of impact is considered to be high, extent is local and duration is long term. 5.1.1.3 Loss of Standing Crops Preferably construction of transmission line is to be carried out during lean season so that standing crops are not damaged or minimum damaged due to construction related activities. However it is not completely ignored during construction and area close to tower pads and RoW may disturb due to movement of contractor machines, labor force and for line pulling. Normally the winter crop will be affected as construction will be curtailed or even closed down completely during the monsoon. This impact is considered more at Khimti besi, near Sindhuli bazar area and at Lalghadh area. It is not possible to calculate the exact loss at this stage. The magnitude of impact is considered to be low, extent is local and duration is long term. 5.1.1.4 Occupational and Safety Hazards Construction related accidents are common in Nepal, primarily because of unsafe construction practices. The erection of towers and stringing of line in steep slopes are difficult and risky job and any negligence on the part of personal protective guidelines may cause accident. Work-related injuries and vehicle accidents are the likely impact expected due to implementation of the proposed project. The magnitude of impact is moderate, extent is local and duration is long term.

5.1.1.5 Historical and Cultural Sites Devithan of Gelu VDC falls between AP-1 to AP-2 and Mahadevthan of Bhaluwajor VDC is located close to AP-16. The clearance height of the Devithan is more than 50 meter whereas Mahadeothan is located about 12 meter from the Angle Tower. The access trail to the religious site at AP-16 will be disturbed which may pose difficulty to worshipers. Since movement of people is not restricted in the RoW the likely impact on cultural site is considered to be low, extent is local and duration is long term. 5.1.1.6 Conflict of Interest and Law and Order Situation During the construction of the transmission line labor force from different places with different religion and faiths will be employed by the contractor and possibilities of conflict of interest exists and law and order situation may be detoriated. Since the labore force is limited and mobile the magnitude of impact is considered to be low, extent is local and duration is medium term. 5.1.1.7 Gender and Vulnerable Group Normally female has greater workload than male and role of women in decision making is limited. During project construction daily wages labor will be deployed for excavation, transportation of construction materials and other construction related works. The contractor especially the sub contractors may discriminate the women and vulnerable group while hiring the workers. Field study shows that there are some vulnerable groups, such as minors, aged and handicapped but project impact on such groups is minimum. It is assumed that most of the labor force required for the construction of the transmission line will be farmers and land less people from the vicinity of the actual work place moving around the alignment as the construction proceeds. In general the employment opportunity will be more to men in comparison to women in development projects implemented so far in Nepal and this trend may continue in this project also. This will not only change the daily workload patterns within families, but will alter the relation between men and women and between the generations too. While men gain access to the cash economy women remain in the weakened subsistence sector. Although the number of the local labours in the project shall be limited, the possibility of employing child labour cannot be ruled out for lesser wage rates. Considering the number of labors to be employed, the significance of impact will be low. On the other hand in practice rural minors can support their family by performing light works. In the absence of which the family is deprived of financial help earned by respective minors. It appears that by forbidding the child labor we are depriving them an opportunity of financial assistance. The overall magnitude of impact is considered low, extent is local and duration is medium term considering the nature of construction work and manpower deployed. 5.1.1.8 Life Style The interaction among different people and ethnic group may attract the rural people towards more advanced society. Experience with other project indicates that sudden cash flow in project area and cash earning of workers is spend unproductively. The availability of cash and alcohol may divert workers towards gambling and more alcohol consumption. The concentration of a

labor force of some hundreds may encourage prostitution, which could encourage the spread of Acquired Immune Deficiency Syndrome (AIDS) and other sexually transmitted diseases. A particular risk group is long distance Truk drivers who are often responsible for disease transmission. The migration of large workers from out side may affect the local social and cultural norms and other local facilities of the area. However local labors may be exposed to the new lifestyle with its minuses and pluses and some may try to adopt new values. In this sense a new culture may be developed within the project area. This impact is considered significant in low population area especially in hills. The magnitude of impact is low, extent is local and duration is medium term. 5.1.1.9 Health and Sanitation The project area has relatively poor health and sanitation facilities. Health care facilities are located far. The likely increase in population of the area during construction may add further stress on local health posts. The lack of proper sanitary measures in temporary camps affects the health condition of the workers. The most vulnerable will be women and children. Since the proposed project requires small labor and local labor force will be used mostly the magnitude of likely impact is considered to be low, extent is local and duration is medium term. 5.1.1.10 Social and Cultural Practices Construction of proposed project requires 225 number of workers and their dependents having different cultural traditions, norms and values, which may interact with, established local sociological and cultural aspects. Due to short stay of new comers most of their sociological and cultural ways of life hardly could be observed by local society. But certain values may be exchanged among the workers such as inter caste marriages, demonstration impact of lifestyle, health and sanitation, skill transfer, opportunity of new jobs, working discipline etc. This impact is comparatively high in hills with respect to the Terai area because Terai is already facing rapid changes in social patterns due to migration from the hills and from India. The magnitude of impact is considered to be low, extent is local and duration is medium term. 5.1.1.11 Impact on Infrastructure and Communal Resources The influx of labor increases population density in project area and infrastructures (school health post, banks, road and drinking water facilities) established for permanent population. In this respect influx of construction crew may pose some additional pressure on existing facilities. Since the number of construction crew is limited the likely pressure on local infrastructure facilities may not be considerable and the project construction may not require additional capacities of these facilities. The project will disturb access trail near AP-16. The magnitude of impact is considered to be moderate, extent is local and duration is medium term. 5.1.1.12 Expectations The proposed project is not designed for rural electrification. Despite this local people interviewed during the field survey and in-group meetings expressed their belief that rural electrification will follow line construction. The other demands are local employment; appropriate compensation based on the value loss and assistance in local development works such as gabian wire, fencing wire etc. It is unwise to ignore these expectations but difficult to fulfill the requirements since some are not directly related with project. The experience at other projects
is that when peoples expectations of benefits are not fulfilled the consequences are disappointment and frustration which may affect during the construction of this project as well as other development project in the region. 5.1.2 Operation Phase 5.1.2.1 Interference to the Airport The transmission line passes near the Manthali airport at a distance of approximately 740m from the existing airport. Discussion with the Civil Aviation Authority and representative of Mathali airport reveals that technically the alignment is not interfering the existing airport and no impact is anticipated for aviation traffic. No objection letter for the proposed transmission line is provided for the final selected route by the Civil Aviation Authority. 5.1.2.2 Loss of Agricultural Production 1.06 ha of cultivated land for 68 tower pads will be permanently acquired. Assuming 150 % cropping intensity and existing cropping pattern there will be annual loss 4.2 tons food grain. Paddy, wheat, maize, millet, potato and pulses are the crops likely to be affected by the land acquisition. This loss is divided among 68 landowners and every cultivator will loose about 62Kg of grain. The production loss is spread over 23.33 Km length of transmission line, which reduces intensity of impact in one place. The magnitude of impact is low, extent is local and duration is long term. 5.1.2.3 Reduction of Land Value Land transaction in hilly districts (Ramechhap and Sindhuli) are rare but in Dhanusha selling and buying the land are common. As per electricity regulation houses are not allowed to build along right of way due to safety reason. The value of land especially at Khimti besi, Manthali Bazar, Sindhuli Bazar and Dhalkebar areas the market value of adjoining parcels is reduced since the land will not be applicable for construction of house. This phenomenon exists but it is difficult to quantify and other factors also contribute to price fixation mechanism. The overall magnitude of impact is moderate, extent is local and duration is long term. 5.1.2.4 Farming Hindrance The placement of one tower will occupy 0.015 ha (12.5mx12.5m) of land. The towers constructed in cultivated area, especially those erected in the middle of land parcels pose hindrance while ploughing the agro- field. The field may be cultivated by using human labor that will increase the cost of agriculture production. This impact is considered more significant at Khimti besi, Sindhuli Bazar area and Dhalkebar. The overall magnitude of impact is considered to be low, extent is local and duration is long term. 5.1.2.5 Withdrawal of Economic opportunity During the project construction induced economic opportunities benefit the local peoples, local economy and project area as a whole. At the end of project construction these opportunities ceased to exist. Worker will lose the job and salary. Demand for local agricultural production by

construction crew will be minimized. Community and local commodity transactions will be reduced. The withdrawal or decrease in economic activity during operation and maintenance may affect the life style of the local people. Local people are habitual of more earning and expenses are rises as increase in economic condition of the people. People will face difficulty to mange the lifestyle once the economic activities will reduce and earning will drastically decline. However the magnitude of impact is considered to be low because the economic activities are limited and some might be continued during operation phase also. The extent is local and duration is long term. 5.1.2.6 Occupational Health and Safety The new lines will be larger and carry a much higher current than any previously operated in Nepal. During operation phase, the flow of 220kV current and the operation of substation- makes the people, in the immediate vicinity of the line, vulnerable to electrical hazards such as fire, electrical shocks or even electrocution. Furthermore lack of training, operation and maintenance skill and unavailability of the necessary safety equipment may add further risk with safety regards. The public can be affected principally through their own acts, such as children climbing towers, high vehicles attempting to pass beneath the lines, surveyors using metal leveling staffs under the conductors and attempt at power theft. These risks have a low probability of occurrences, but a very high (terminal) significance to the individuals involved. The overall magnitude of impact is considered to be low, extent is local and duration is long term. 5.1.2.7 Visual Aesthetic Value Approximately 73-Km transmission line along Tamakoshi valley, Middle Hills and Terai creates some short of visual barrier. More over 230 towers erected along the corridor affect the visual aesthetic value. Sometimes the route passes near the settlement and may create visual barrier but ridge to ridge alignment does not reduce the aesthetic value. The Gadhi palace is located approximately 700-meter distance from the proposed line hence no direct impact is expected. The overall magnitude of impact is considered to be low, extent is local and duration is long term. 5.1.2.8 Electric and Magnetic Field Effects Electric power transmission lines create electric and magnetic field together known as electromagnetic field or EMF. Electric fields are created by the presence voltage and are expressed in volts per meter (V/m). Magnetic field is produced by the presence of current in the line and is expressed in terms of ampere per meter (A/m). Power line EMFs are strongest beneath the lines and diminish rapidly with distance. For high voltage lines, they merge into normal background levels at a distance of 200 – 300 meters. EMFs are also created at substation. EMFs may pose a hazard to human health. The scientific community has not reached consequences on specific biological response to EMFs but it is expected some impacts are likely to occur due to long term exposure. The magnitude of overall impact is considered to be low, extent is local and duration is long term.
5.2 Positive Impacts 5.2.1 Construction Phase 5.2.1.1 Local Employment One of the major positive impacts of the project during the construction stage is the creation of employment opportunity. Altogether 225 people will be deployed during the construction of the project, which include 110 unskilled, 65 semi skilled and 50 skilled manpower. 48% of labor force is estimated to be unskilled. Normally high cast people are reluctant to low grade physical labor and lower caste people may take advantages of the situation. Cash income is needed in rural household to pay for debts, manufactured goods, education and cloths. To some extent such employment opportunities may check out migration of the area and promote in migration. In this sense the employment opportunities contribute to poverty alleviation in rural area. The possible increase in local employment opportunity will be positive impact to the area as people are currently facing acute unemployment. The magnitude of impact is considered to be moderate, extent is local and duration is medium term.
5.2.1.2 Local Economy
The employment opportunity, income from shops, house rental, increases demand for fresh vegetable, meat and rental/lease of land are the areas of income during construction period. Furthermore local contractor will also be used for some construction work which is considered positive impacts for the local economy. The likely impacts due to increased economic activities during construction phase and contribution of project to enhance rural economy is considered positive impact for the area. As a result of increased trade and business, significant amount of cash will be channeled in to local economy. This short term economic boom will contribute to diversify and development of local economy. The increase in trade and business will enhance the economic status of local people. The magnitude of impact is considered to be moderate, extent is local and duration is medium term. 5.2.2 Operation Phase 5.2.2.1 Increase in Local Skills Experience shows that local employed people gain experience in tower pad assembling, erection of towers, stringing of line, driving and transportation of equipment. The work enhances traditional skills and some marketable new skills will emerge in the area. With the skill learned during the construction of the project, local people will be able to get employment in similar projects elsewhere in Nepal. The magnitude of impact is considered to be moderate, extent is national and duration is long term. 5.2.2.2 National Economy The transmission line project will evacuate the energy produced in Khimti area and provide reliable power supply in load centers in eastern region. It will also reduce transmission losses and generates revenue by exporting power to India. This will be the first 220 kV voltage line in Nepal and will contribute to value added of the national economy.

5.2.2.3 Employment Opportunity For the smooth operation the project will require manpower which will provide employment opportunity to the people. Similarly, regular maintenance such as vegetation clearance in RoW and other maintenance work is vital for the smooth operation of power line. This will also provide short-term employment opportunity to the local people. The employment opportunity will provide income source to some of the local people.

CHAPTER - 6 MITIGATION MEASURES
6.0 General The following mitigation measures are proposed to ameliorate the possible adverse impacts of the project during construction and operation phases. NEA being the proponent of the project has prime responsibility in carrying out the indicated mitigation measures. Contractors will implement some of the mitigation measures mentioned below on behalf of NEA. 6.1 Construction Phase 6.1.1 Compensation for the Land Loss Legal Procedure of Compensation The legal basis of land acquisition and compensation is the Land acquisition Act, 2034 and specific regulations to be pursuant to the Act. According to Article -3 of the Act His Majesties Government can acquire any land, anywhere and in any amount for the public works by paying compensation. Article -9 outlines the procedures to be followed regarding notification of land acquisition (i.e. publishing lists of landowners and parcel numbers in the newspapers). The article states that to notify certain individuals the local officer may send a notice personally to such persons. Article -13 and 16 of the Act relates to creation of a Compensation Fixation Committee. The committee will be formed under the chairmanship of Chief District Officer of the concerned district and includes chairman of affected VDCs, representative of affected people, representative of the District Development Committee, representative of land revenue office and representative of Khimti-Dhalkebar 220 kV Transmission Line Project. The primary duty of the Committee is to fix compensation rates. Article -14 of the Act relates to land for land compensation. As per Article 27 the required land can be acquired through negotiation process between HMG/N and concerned residents in order to device a just and fair method and rate of compensation. According to Article -34 the land not required by the project should be returned to the concerned landowner. The Project will follow Policy Framework for Environmental Impact Assessment for Projects Under the power development Fund, 2002 underlines the need for Grievance Redress Committee and Compensation Fixation Committee which will be formed to undertake the respective responsibilities. The "Policy Framework for Project under the Power Development Fund" provides guidelines for acquisition and compensation of this Project. A Grievance Redress Committee will be established to address complains and grievances of projects acquisition and compensation process. Compensation The private land affected by the project will be compensated as per the rate fixed by the Compensation Fixation Committee. Affected people were asked (210 H.H) about the mode of compensation. Most the households affected by the land acquisition requested for cash compensation. The payment will be made on cash and all the procedures will be completed prior to implementation of the project.
Reported land cost figures from the local people is in higher side and land revenue office accepts lower rates for the purpose of revenue collection than market price of land. The market value is still more for housing plots, land near the roads and market centers. Hence the rates provided by Land Revenue Office are considered as inapplicable in the case of Khimti- Delkebar 220 kV Transmission line. The rates are to be differentiated for municipalities and District headquarters. Both government’s rate and market rates in the area will be taken in to account by Compensation Fixation Committee while determining compensation rates. The land price varies from place to place, parcel to parcel and according to proximity of road and market centers. The average land price in the area is considered for the estimate of compensation (Table 6.1.1). Land less (tenants), Guthi holders etc affected by the project will also be compensation as per the recommendation of the Compensation Fixation Committee and the decision of the project. Persons who do not have formal legal rights but have a claim to such rights (continued possession of public lands) provided that such claims becomes recognized through an appropriate process are eligible for compensation. The affected Guthi land of Shitalpatti Pani Gughi will be compensated as per Guthi Act 2033. Besides compensation, land registration fee upto 7 % of the compensation amount or the actual amount spent in land purchase by the project affected families whichever is low will also be provided (if any affected family purchases land of similar type of equal area to replace land taken by the project within six months). The affected families must submit proper documentation to the project to receive such facilities. The estimated compensation amount for the land to be acquired by the project is as follows.
Table- 6.1.1 Land Compensation Cost
S.N. Items Area(ha) Rate NRs.( ha) Amount/NRs. 1 Land acquisition 1.06 491250 5,20,725 2 Land Registration Fee 1.06 7% of the compensation
amount 36,450.75
Total 5,57,175.75 Source: Field Survey 2004
Preference of Compensation Regarding types of compensation the household survey indicated that 87.62 % of affected households prefer cash compensation. Land for land compensation was reported by 10.48 % of households but small piece of land located in distant place can hardly be economically cultivated.1.43 % of household prefer house to house compensation for house loss (Table 6.1.2). Following table and Fig 6.1.1 provide the details of preference for compensation.
Table 6.1.2 Preference of Compensation for Affected Lands
Types of Compensation No. of HHs % of HHs
Cash 184 87.62
Land for Land 22 10.48
House for House 3 1.43

Others 1 0.48
Total 210 100.00 Source: Field Survey, 2004
Fig: 6.1.1 Preference of Compensation by PAFs
Cash87.62%
Land for Land10.48%
House for House1.43%
Others0.48%
Preferable Use of Compensation Money
The field survey results (Fig 6.1.2) regarding preferable use of compensation amount indicate that most of households (72.05%) are thinking to spend on buying land followed by construction of house (21.26%). Some of the households are planning to invest in business (5.12%) and some may pay the outstanding debt (Table 6.1.3).
Table 6.1.3 Preferable Use of Compensation Money by Percent of Users
Use of Compensation No. of HHs % of HHs
Buy Land 183 72.05
Construction of House 54 21.26
Business 13 5.12
Pay Debt 4 1.57
Others 0 0.00
Total 254 100.00 Source: Field Survey, 2004
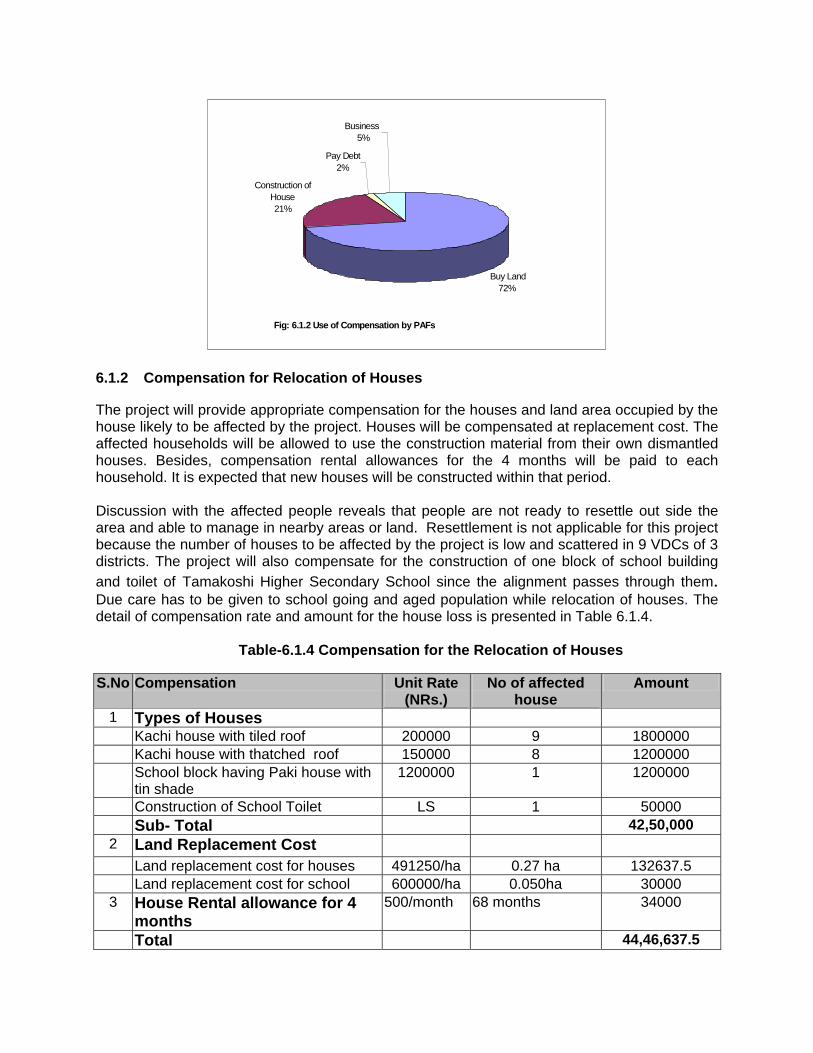
Fig: 6.1.2 Use of Compensation by PAFs
Buy Land72%
Construction of House
21%
Pay Debt2%
Business5%
6.1.2 Compensation for Relocation of Houses The project will provide appropriate compensation for the houses and land area occupied by the house likely to be affected by the project. Houses will be compensated at replacement cost. The affected households will be allowed to use the construction material from their own dismantled houses. Besides, compensation rental allowances for the 4 months will be paid to each household. It is expected that new houses will be constructed within that period. Discussion with the affected people reveals that people are not ready to resettle out side the area and able to manage in nearby areas or land. Resettlement is not applicable for this project because the number of houses to be affected by the project is low and scattered in 9 VDCs of 3 districts. The project will also compensate for the construction of one block of school building and toilet of Tamakoshi Higher Secondary School since the alignment passes through them. Due care has to be given to school going and aged population while relocation of houses. The detail of compensation rate and amount for the house loss is presented in Table 6.1.4.
Table-6.1.4 Compensation for the Relocation of Houses S.No Compensation Unit Rate
(NRs.) No of affected
house Amount
1 Types of Houses Kachi house with tiled roof 200000 9 1800000 Kachi house with thatched roof 150000 8 1200000 School block having Paki house with
tin shade 1200000 1 1200000
Construction of School Toilet LS 1 50000 Sub- Total 42,50,000
2 Land Replacement Cost
Land replacement cost for houses 491250/ha 0.27 ha 132637.5 Land replacement cost for school 600000/ha 0.050ha 30000
3 House Rental allowance for 4 months
500/month 68 months 34000
Total 44,46,637.5
SPAFs preference for compensation indicates that 76.5 % of households prefer cash compensation and 11.7 % prefer replacement houses. Some households raised the question of house plots also. As a whole most of households are satisfied by cash compensation considering easy handling of cash for different purposes.
Table 6.1.5 Preference of Compensation of SPAFs
Types of Compensation No. of HHs % of HHs
Cash 13 76.47
Land for Land 1 5.88
House for House 2 11.76
Others 1 5.88
Total 17 100.00 Source: Field Survey, 2004
6.1.3 Compensation for Crop Loss Construction work shall be scheduled at best to avoid cropping season. People of the concerned land shall be informed in advance so these disturbances shall be minimized. Compensation shall be paid for any unavoidable crop damage or area depending on the crop production. Damage of any standing crop shall be paid based on the present value. Compensation shall also be paid for the loss of fruit trees. The implication of food deficit in project area indicates that the project contractor has to manage food requirement for construction crew independently without relying on local food supply. 6.1.4 Occupational Safety Measures The construction area shall be declared as hard hat area and all the necessary precaution and warning sign must be placed at work site. This area shall be restricted for the entry of un-authorized people. Hard hat, eyeglass, safety boot, fire fighting accessories, caution signals and other safety equipment as required at particular site and work area must be provided. The contractor shall conduct safety awareness program and any loss of life or injury shall be compensated at prevailing rules. The likely increase in injuries and accidents shall be minimized and contractual requirements should be strict. 6.1.5 Infrastructure The access trail to the cultural site at AP-16 shall be reconstructed to facilitate the access for worshipper. 6.1.6 Coordination The project shall develop a good coordination mechanism with local and district level administration of HMG/N. Cordial relation shall also be established with local VDCs, NGOs, CBOs and project workers working in the area. The project shall establish good information system to coordinate the work between the different project partners such as contractor,
consultant and client. 6.1.7 Gender and Vulnerable Group The project shall not discriminate to the local people based on gender, cast, color or place of origin in Nepal and vulnerable group. The project shall completely ban the use of child labor. Consultant, contractor and sub contractor shall be instructed that use of child labor is not allowed in project works. Due priority shall be given to project related employment and other benefits to vulnerable group and poor people. 6.1.8 Awareness Program Awareness program will be implemented by the project for the proper use of compensation amount, areas of employment and likely effect on people due to withdrawal of economic opportunity. The awareness program will also include about the problem associated with social and cultural disintegrate and awareness against girls trafficking and sexually transmitted disease (STD) such as AIDS. 6.1.9 Health and Sanitation Temporary camp shall be provided for the project workers. The temporary camp established by sub contractor must have toilet facilities and the drinking water sources shall be tested prior to mobilization. The contractor shall maintain at least first aid kits and vaccines against infectious and communicable diseases, which will decrease pressure on local health and sanitation facilities. Health check-up of workers and documentation of health status shall be made periodically. 6.1.10 Cultural Aspects To minimize the impact on cultural practice of local communities, a strong code of conduct need to be enforced to the outside construction workers. The workers shall be instructed to act in a responsible manner during and after the working hours, respecting the rights, property and practice of local people. 6.2 Operation Phase 6.2.1 Manthali Airport Since the alignment is shifted from the previously proposed location in consultation with Civil Aviation Department no mitigation measure is proposed.
6.2.2 Agricultural Production
The impact on agriculture production is in small scale and scattered in nature it is not possible to implement agriculture intensification program. The community support program elaborated in 6.3.1.2 especially for the poor and deprived people will minimize the likely impact.
6.2.3 Land Devaluation Private land (68.44 ha) within the RoW will be compensated at current market price as per standard practice of HMG/N. Such amount will be paid 10% of the total amount of land value. The land within RoW will be utilized as usual by the respective landholders. There is not such

standard practice for commercial and housing plots, where the value depends on a number of highly subjective factors. It is recommended that such areas shall be considered while determining devaluation cost. 6.2.4 Farming Hindrance This is unavoidable impact. However it is recommended that placement of tower pad at the center of field shall be avoided. 6.2.5 Awareness Program The awareness program mentioned in 6.1.8 will minimize the likely impacts due to withdrawal of economic activities. 6.2.6 Occupational Health and Safety Safety equipment required for the operation of the transmission line should be provided. During the maintenance major area shall be restricted for entry of unauthorized person to avoid disturbances and risk. Hard hat, eye glass, safety boot, ear plugs, good electric light system, power-cutting devices fire fighting accessories, caution signals and other safety equipment as required at particular site and work area must be provided. The aforementioned awareness program will also minimize the risk of accidents. 6.3 Enhancement Measures 6.3.1 Construction Phase 6.3.1.1 Priority to the Local Employment The project shall emphasize to hire the local people to the extent possible for the construction work. Due priority shall be given to project affected families, disadvantage people and women. 6.3.1.2 Community Support Program In order to minimize the project impact on affected families disadvantageous and vulnerable people and to develop cordial relation and safe operation of the project community support program is suggested. The survey identified about 40 poor and disadvantageous households in the transmission line alignment. The community support program should be implemented to support the disadvantageous people and lower caste people in addressing their pressing needs. The scope of the program should be further designed and refined in consultation with local NGOs, stakeholders and residents of route alignment. The basic principle of the program implementation is the local participation, contribution and support to the economically disadvantageous group and benefit sharing. At least the following aspects shall be covered under this scheme. Cash crop training especially vegetable and Junar Livestock raising training Poultry farming training
After completion of the training users groups will be formed in the leadership of the trained person and such group will be assisted for the farming of goat, pig and poultry where most of disadvantageous group are employed. This program is mostly designed for the poor and vulnerable people affected by the project. The training program and implementation of community support program will be revised and implemented in coordination with local NGOs. 6.3.1.3 Rural Electrification Main demand of the local people is to electrify the affected area. Although this project is not directly related for rural electrification it is recommended that project should facilitate rural electrification in the area through NEA regular scheme since NEA is responsible for the rural electrification in different part of the country. Some of the project areas in Sindhuli and Ramechhap districts are already proposed for rural electrification under the Rural Electrification and Distribution System Reinforcement Project. 6.3.2 Operation Phase 6.3.2.1 Priority to the Local Employment The project shall emphasize to hire the local people to the extent possible for the operation and maintenance work. Due priority shall be given to project affected families, disadvantage people and women.
6.3.2.2 Community Support Program The community support program implemented during the construction phase shall be continued for at least two years of project operation. 6.4 Social Mitigation Cost
The proposed social mitigation cost includes only the items described above, which are not included in project design and tender documents. The Total estimated mitigation cost for the proposed Khimti-Dhalkebar 220 kV Transmission Line Project is 36.47 Million NRs. out of which social mitigation cost include 12.36 million NRs. (Table-6.4.1).
Table 6.4.1 Social Mitigation Cost
S.N. Items Units Costs/NRs.
1 Compensation of land Ref. Table 4.2 557175.75 2 House relocation Ref. Table 4.3 4446637.5 3 Crop damage LS 300000 4 Compensation for the loss of private trees LS 500000 5 Awareness program LS 200000 6 Land compensation for ROW ( 10%) 491250/ha 3362115 7 Community support program LS 2500000 8 Miscellaneous LS 500000
Total 1,23,65,928.25 Besides the above-mentioned cost some social mitigation costs are included in project design and can not be separated. The item in built in project design and included in tender documents

is not included in this estimated mitigation cost. Those costs are tie up with other activities and included in total project cost. The following social mitigation programs are included in technical part of the project.
Camp with adequate facilities Safeguarding of the construction sites and safety equipment's Safety awareness program and associated mitigation measures Provision of first aid kits, health checkup of the workers and vaccines against infectious
disease

CHAPTER - 7 SOCIAL MONITORING
7.0 General Monitoring is an essential aspect of social management. It consists collection of data to measure social changes associated with construction and operation of the project. Depending on the location or the month of the year certain construction activities may have greater or lesser impacts. NEA will have prime responsibility for implementation of monitoring program. Khimti-Dhalkebar Environmental Management Unit, Consultant, Project Manager, Contractor and Line Agencies are responsible for monitoring of different components as specified below.
7. 1. Types of Monitoring Based on the study, type and size of the project and monitoring experience of other projects daily to quarterly monitoring depending on the parameter is recommended throughout construction period. The monitoring will be conducted in construction and operation phases of the project. 7.1.1 Baseline Monitoring Baseline monitoring is conducted to update the baseline condition of the project area prior to implementation of the project. 7.1.2 Impact Monitoring Impact monitoring is to be carried out to assess actual level of impact. The impact monitoring will be conducted during construction as well as operation phases of the project. The impact monitoring includes:
Monitoring of the impacts of the project on socioeconomic environment of the area Monitoring of the accuracy of the predicted impacts Monitoring of the effectiveness of social mitigation measures and community support
program
7.1.3 Compliance Monitoring
The compliance monitoring will be conducted to monitor the compliance of the recommended mitigation measures and monitoring activities. The compliance monitoring will mainly focus on;
Mitigation and monitoring requirements associated with the contractor shall be dually incorporated in tender document and contract agreement.
Compliance of the tender clause Compliance of the mitigation measures Monitoring of the allocation of adequate budget for the implementation of the mitigation
measures and monitoring works
7.2 Monitoring Parameters, Schedule and Agencies to be Consulted
Settlement, public health, infrastructure and compliance of the tender clauses are the few areas of monitoring. The schedule of monitoring will be daily, quarterly, half yearly and yearly depending on the parameters and type of monitoring. The details of monitoring parameters,

schedule, method and agencies to be consulted during construction and operation phase is presented in Table- 7.2.1.
7.3 Manpower Socio-economist along with supervisors and support staff will be mobilized for social monitoring of the project. 7.4 Monitoring Cost
The estimated total monitoring cost is 3.92 million NRs. including manpower, report production, transportation and others for pre construction, 18 months construction and 2 years operation phases (Table-10.2). This cost also includes monitoring of social sector ( Ref. EIA report fur further details). 7.5 Organizational Setup Environmental and Social Studies Department of NEA will be the organization responsible for pre construction monitoring. Khimti-Dhalkebar Environment Management Unit (KDTL-EMU) comprising of staff from ESSD, among others will be established for the construction phase monitoring of the project. This unit will work on behalf of Khimti-Dhalkebar 220 kV Transmission Line Project. The KDTL-EMU will be responsible for compliance and impact monitoring works as specified in Table 7.2.1. Grid Operation Department, NEA will conduct the operation phase monitoring up to first 2 years of the project and ESSD will conduct some of the monitoring works on behalf of the department. ( Ref. EIA report fur further details).

CHAPTER -8
CONCLUSION AND RECOMMENDATIONS 8.1 Conclusion Nepal Electricity Authority proposed Khimti –Dhalkebar 220 kV Transmission Line Project to evacuate the power generated from Tamakoshi and other hydropower project in the region. This SIA report is an outcome of the study conducted as per the World Bank Guidelines for the projects funded under the power development fund. The Social Impact Assessment study is based on field survey and review of secondary information. On the basis of the above analysis it may be summarized that social baseline has been determined and impacts are predicted. Social mitigation measures are proposed to support the construction & post acquisition scenario that Project Affected Families are at least as well off as before the project construction. The major social impacts likely to occur due to implementation of proposed project are summarized below. 8.1.1 Adverse Impact Construction Phase
Loss of 1.06 ha private land for the placement of towers Likely impact on 68 households due to land acquisition for tower pads Relocation of one block and toilet of Tamakoshi Higher Secondary School at Khimti
besi Relocation of 17 houses Likely impact on standing crop Occupational safety impacts Likely disturbance in cultural worship Likely detoriation in law and order situation Likely impact on gender and vulnerable group Changes in life style Impact on local health and sanitation situation Likely impact on social and cultural practices Likely impact on community services and institutions Expectations of local people
Operation Phase
Loss of approximately 4.2 Mt. food grain annually Withdrawal of economic opportunity Reduction of land value in Khimti besi, Manthali, Sindhuli and Dhalkebar market
areas Farming hindrance Likely impact on aesthetic value Occupational and safety impacts Electromagnetic impact

8.1.2 Positive Impact
Construction Phase
Employment to 225 people Likely improvement in local economy
Operation Phase
Enhancement in technical skill and know- how Improvement in national economy Local employment opportunity
8.2 Recommendations Social impacts can be mitigated by paying appropriate compensation, preferential hiring rehabilitation grant based on entitlement policy and other mitigation measures which will contribute to enhance the quality of life of Project Affected Families and rural society. The following mitigation measures are proposed to minimize the likely impacts of the proposed project on socioeconomic and cultural environment of the area. Construction Phase
Compensation for the loss of private land and provision of land registration fee up to 7 % of the compensation amount or the amount spend for land purchase (within 6 months) whichever is low.
Appropriate rent for leased land Compensation for Relocation of Houses Compensation for the relocation of one block of school building and toilet Appropriate compensation for the loss of crop Implementation of occupational safety measures and regular checkup of the project
workers Construction of access trail at AP-16 Coordination with local administration, VDCs, DDCs local people etc
Due priority shall be given to project related employment and other benefits to vulnerable group and poor people
The contractor shall maintain at least first aid kits and vaccines against infectious and communicable diseases
Awareness program
Strict rule and regulation for the workers Land prices are subject to change and are to be updated prior to meeting of
compensation fixation committee meeting. Landowners name, types of land, and other essential information has to be confirmed
before the project implementation due to time lag between this study and time of project implementation.
Modalities and scope of work of Community Support Program are to be further refined in consultation with Project Affected Families.
Operation Phase
Private land falls within the RoW will be compensated. Such amount will be paid 10% of

the total amount of land value Tower shall not be placed at the center of field to the extent possible Safety equipment required for the operation of the transmission line shall be provided
and safety measures must be applied
Enhancement Measures
Construction Phase
Priority for local employment Implementation of community support program
Operation Phase
Due priority shall be given to local employment Continuation of community support program for 2 years Due priority shall be given for rural electrification to the affected area
In summary the project is socio-economically feasible and appropriate arrangements are to be made to compensate and rehabilitate project affected families. Any omission and/ or discrepancy regarding entitlement, list of landowners etc will be sorted out during project implementation. The study concludes that construction of the proposed Khimti-Dhalkebar 220 kV Transmission Line Project is feasible if recommended social mitigation measures and monitoring plan is implemented.

REFERENCES
CBS, Statistical year Book of Nepal 2003
CBS, Population of Nepal: Caste/ Ethnicity, Mother tongue and Religion (CDR) 2001
DDCO, 2060. District Level Monitoring and Evaluation Report. District Development
Committee Office, Information and Collection Center, Ramechhap
DDCO, 2059. Ramechhap Development Overview for the improvement of the communication
and transparency in development. District Development Committee Office, Information
Collection Center, Ramechhap.
DDCO. 2058. Ramechhap Development Overview. District Development Committee,
Information and Collection Center, Ramechhap.
DDCO. 2059. Ramechhap in Maps. District Development Committee Office, Human Resources
Development Center, Ramechhap.
DDCO. 2060. Ramechhap Development Overview for the Improvement of the Communication
and Transparency in Development. District Development Committee, Information and
Collection center, Ramechhap.
HMG/N Electricity Regulation 2050, Nepal Rajpatra
KM. 2059. An Overview of Kamalamai. Second Edition. Kamalamai Municipality, Sindhuli
NEA, 2003, Detail Route Alignment Survey of Khimti Dhalkebar 220 kV Transmission Line
Project. Project Development Department, NEA.
NEA (2002). A Year in Review, Nepal Electricity Authority, Fiscal year 2001/02, Durbar Marg,
Kathmandu
NEA 2003. A Year in Review, Nepal Electricity Authority Fiscal year 2002/03
NPC. Tenth Five-year Plan 2059-2064
NRA National Research Associates Nepal District Profile 2002
NDP National District Profile (1997) Kathmandu.