neil cliffe, department of agriculture and fisheries,...
TRANSCRIPT
Neil Cliffe, Department of Agriculture and Fisheries, Mackay

} Climate timescales } Rainfall variability } Climate drivers } Seasonal (MJO) } Annual (ENSO) } Decadal } Current seasonal conditions } Seasonal rainfall outlooks } Decisions, decisions…???

Components of the climate system
• Weather (Daily) • MJO (~40-60 days) • El Niño Southern Oscillation (seasonal/annual) ENSO • Indian Ocean Dipole and Southern Annular Mode • Quasi-Decadal (9-13 years) • Inter-Decadal (PDO, IPO; 20 years) • Human induced trends (GHGs, aerosols, ozone hole) • Solar variability (thousands of years, ice ages) • Volcanic activity • Feedback of land surface on climate

Rainfall Variability in Australia

Posi%on of the Inter-‐tropical Convergence Zone (ITCZ) or Monsoon Trough in January and July
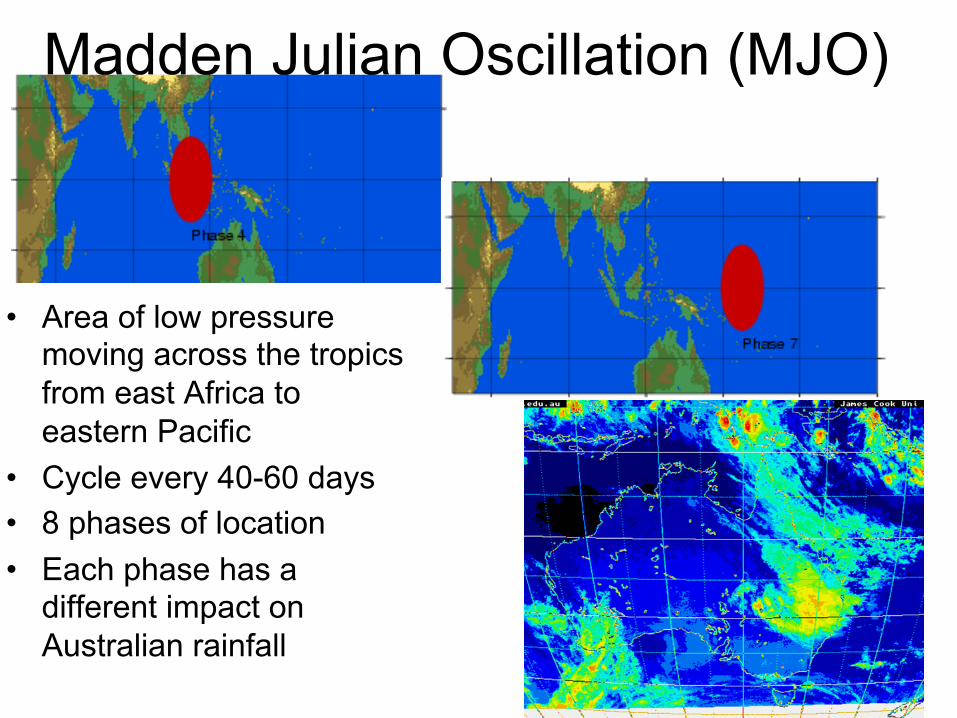
Madden Julian Oscillation (MJO)
• Area of low pressure moving across the tropics from east Africa to eastern Pacific
• Cycle every 40-60 days • 8 phases of location • Each phase has a
different impact on Australian rainfall

ENSO -‐ El Nino Southern Oscilla3on
La Nina e.g. 2011
SST Patterns
El Nino e.g. 1982

ENSO El Nino - Southern Oscillation

SOI values

El Nino and La Nina rainfall
El Niño years
Neutral years
La Niña years
% chance of exceeding median rainfall
0-20
40-60%
70-90%
Percentile 0-10 10-20 20-30 30-40 40-50 50-60 60-70 70-80 80-90
90-100
Extremely low Average Extremely high

Quasi-‐decadal (9-‐13 year cycles) 1991- 1996 1996 - 2001 .
.
.
.
2001 - 2007
www.LongPaddock.qld.gov.au
.
.
.
.
.
2007 - 2012
low
high
Rainfall relative to historical records
.
. .
.
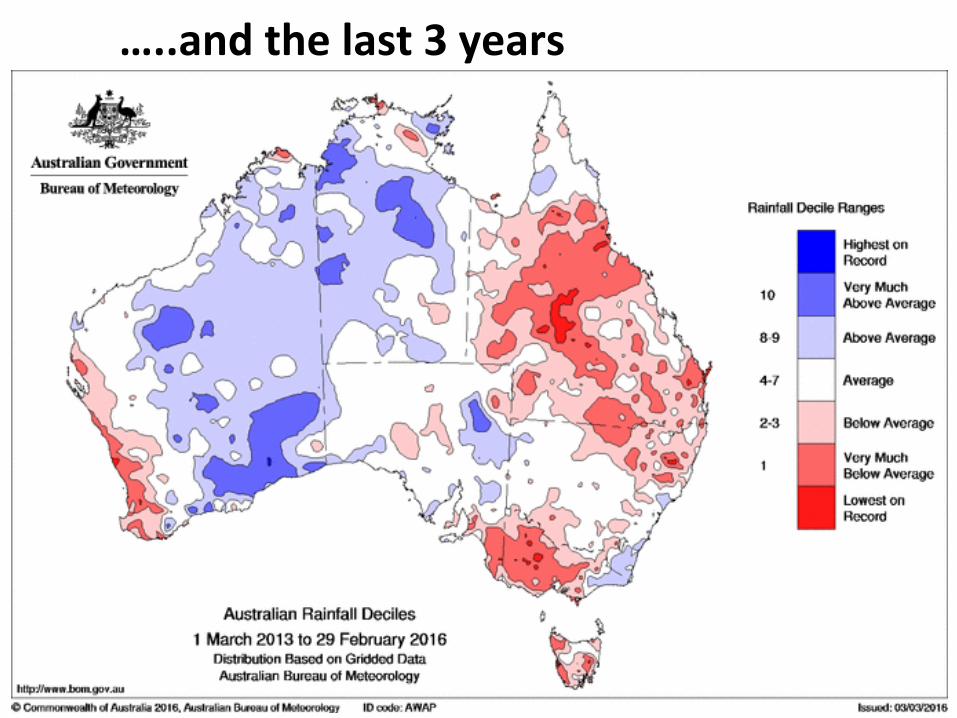
…..and the last 3 years

Summary from Grazing Forum 2015 • El Nino climate pattern developing – central Pacific SST’s, SOI
values, WWB’s etc. with occasional fluctuations (e.g. MJO) triggering relief rain.
• All surveyed models indicate this pattern will intensify towards El Nino (~70% BoM).
• ECMWF forecast products provide a range of newer options to look at rainfall outlooks.
• Negative SOI values will reduce rainfall probabilities during winter, spring and early summer.

Recent condi%ons

Summer pasture growth


Recent Pacific Condi%ons

SOI values

Chance >median rain 3 month (SOI)


Chance >median rainfall 3month (ECMWF)
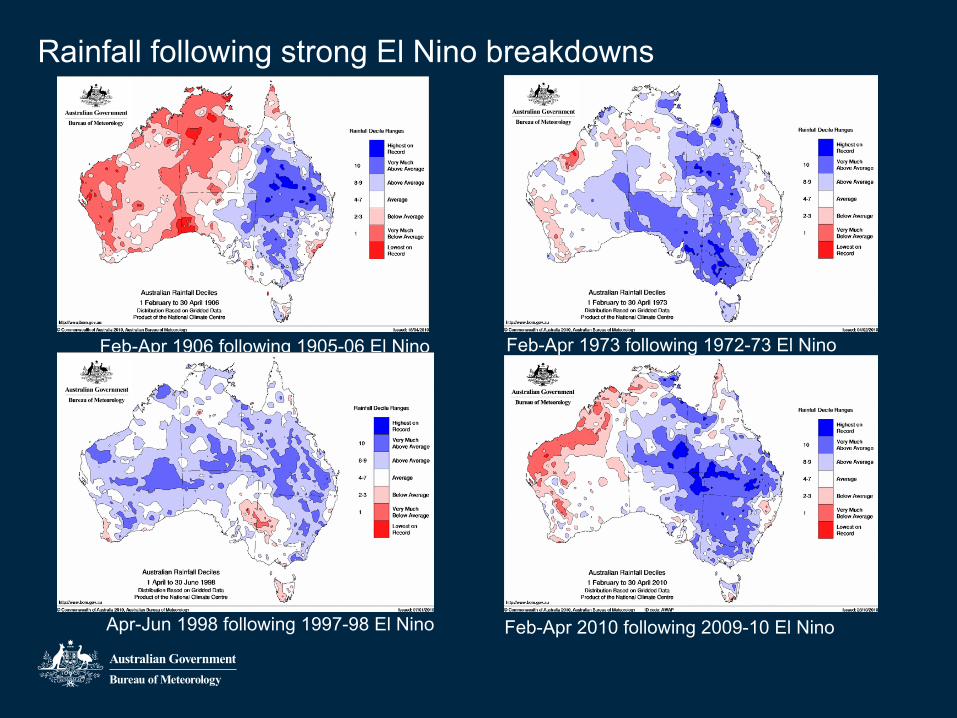
Rainfall following strong El Nino breakdowns
Feb-Apr 1906 following 1905-06 El Nino Feb-Apr 1973 following 1972-73 El Nino
Apr-Jun 1998 following 1997-98 El Nino Feb-Apr 2010 following 2009-10 El Nino

Chance >median rainfall 3month (ECMWF)

ENSO Model outlooks

SST Anomalies Forecast

Mackay Sugar Mill Rainfall Probabili%es -‐ March to May 2016 (Consistently Nega%ve SOI Jan-‐Feb)
• Mackay Sugar March to May 2016 • 100% chance of exceeding 220mm • 90% 248mm • 80% 299mm • 70% 305mm • 60% 347mm • 50% 414mm • 40% 453mm • 30% 547mm • 20% 592mm • 10% 873mm Max ever recorded this pa\ern 911mm Probability of exceeding the long-‐term median: 50%

Grazing decisions made using weather and climate forecasts
Decisions Short-‐term (tac3cal) – days, weeks, months – 7-‐10 days, MJO
Long-‐term (strategic) – season, mul3-‐season, mul3-‐years – ENSO, SOI, SST, PDO, ECMWF
Stocking rate management and adjustment (i.e. buy, breed, wean, sell, agistment), pasture establishment, animal supplementa%on, labour, helicopter hire, holidays
Enterprise mix, water infrastructure, fencing, herd dynamics, pasture improvement, woody weed and regrowth control, drought prepara%on (fodder storage), herd reduc%on, marke%ng, property investment/divestment

Informa%on sources…
• Numerous websites • Weekly text based email updates from Dr Roger
Stone covering: – Rainfall in the next week – Experimental forecast output for two weeks ahead – Passage of the MJO – Seasonal update including SOI
• Monthly reports updating climate outlook in greater depth with links to useful sites.

Summary • Current El Nino climate pattern has peaked – Watch SOI and other
climate model outputs to understand what pattern we will enter next.
• Knowing when the MJO is likely to pass through our latitudes can be a useful guide to the timing of rainfall events.
• ECMWF forecast products provide a range of newer options to look at rainfall outlooks with a longer lead time.
• Strong El Nino events in the past have broken with higher than average rainfall amounts.
• Continually update yourself with information to stay informed.


Grazing in Queensland
• Native pasture occupies ~90% Qld • Value of production $3.6b 2012/13 (35% of Qld Agriculture) • Grazing industry is highly variable
– Climate (decadal, annual, seasonal, daily variation) • annual rainfall variability (Co-efficient of variation %)
– Charters Towers 40%, Longreach 50%, Birdsville 70%, Innamincka 90% • seasonal variability - winter pasture growth is limited by
– moisture, frost, temperature
– Efficiency of water use (WUE) 2-10 kg/ha/mm – Nutrient availability is low and variable (10-30 kgN/ha/yr) which is
enhanced by competition from trees – Use of fire has decreased resulting in an increase in the
establishment of woody weeds

SOI projec%ons next 12 months
BOM SOI predictions over the next 12 monthsMay June July August September October November December-‐10.07 -‐10.26 -‐8.84 -‐9.11 -‐9.49 -‐9.49 -‐9.43 -‐9.07January February March April-‐8.59 -‐9.65 -‐8.74 -‐6.96

Decadal • Pacific decadal
Oscilla%on • Inter-‐decadal
Pacific Oscilla%on • Limited forecast
capability


Nebo – 10 year moving average

Nebo (Nov-‐Mar)

Chance >median rainfall 3month (ECMWF)

Chance >median rainfall 3month (ECMWF)

Madden Julian Oscilla%on (MJO)