neighborhood environment and the functional health...
TRANSCRIPT

NEIGHBORHOOD ENVIRONMENT AND THE FUNCTIONAL HEALTH OF OLDER ADULTS
by
Donald Musa
BS, Pennsylvania State University, 1969
MA, University of Pittsburgh, 1977
Submitted to the Graduate Faculty of
the Graduate School of Public health in partial fulfillment
of the requirements for the degree of
Doctor of Public Health
University of Pittsburgh
2005

UNIVERSITY OF PITTSBURGH
Graduate School of Public Health
This dissertation was presented
by
Donald Musa
It was defended on
April 7, 2005
and approved by
Committee Chairperson Dr. Jeanette Trauth, PhD
Associate Professor Department of Behavioral and Community Health
Graduate School of Public Health University of Pittsburgh
Committee Member Dr. John Marx, PhD
Professor Department of Sociology
Faculty of Arts and Sciences University of Pittsburgh
Committee Member
Dr. Ravi Sharma, PhD Assistant Professor
Department of Behavioral and Community Health Graduate School of Public Health
University of Pittsburgh
Committee Member Dr. Myrna Silverman, PhD
Professor Department of Behavioral and Community Health
Graduate School of Public Health GSPH, University of Pittsburgh
ii

Jeanette Trauth, PhD
NEIGHBORHOOD ENVIRONMENT AND THE FUNCTIONAL HEALTH OF OLDER ADULTS
Donald Musa, DrPH
University of Pittsburgh, 2005
With the growing number of older adults and, therefore, the increasing importance of disability
as a public health outcome, it is important to better understand the causes and correlates of
functional decline and disability in the elderly. Traditionally, most research on disability has
focused on individual risk factors. However, a growing body of research is finding evidence of
the role of the social and physical environment in health outcomes generally. But to date, limited
research has examined the neighborhood environment as a causal factor in disability among
older adults. This dissertation examines the influence of the socioeconomic and social
characteristics of neighborhoods and municipalities in Allegheny County, Pennsylvania on
individual functional status prevalence and change among a sample of adults 65 and older in the
County. The research suggests that some effects of neighborhood social environments on
functional status may be present, but are weak relative to individual risk factors. Neighborhood
effects were not found for disability prevalence in this sample, but were found for change in
function over a period of 20 months. The analysis indicates that neighborhoods with higher rates
of serious crime are associated with declines in function. Also, neighborhoods with more
concentrated social and economic disadvantages as well as those with more concentrated
affluence were both associated with some improvement in function. The association of
iii

disadvantage with improvement in function requires further clarification. The analysis suggests
that more sensitive measures of disability and function may be required to detect neighborhood
effects. This type of research is of great public health relevance because it has the potential to
suggest and inform a range of new community-based public health interventions to improve the
functional health of the elderly.
iv
TABLE OF CONTENTS
PREFACE....................................................................................................................................... x
1. INTRODUCTION .................................................................................................................. 1
1.1. BACKGROUND ............................................................................................................ 1
1.2. SPECIFIC AIMS ............................................................................................................ 3
2. DISABILITY AS A HEALTH OUTCOME FOR OLDER ADULTS .................................. 6
2.1. MODELS OF THE DISABLEMENT PROCESS.......................................................... 6
2.2. LAWTON’S ECOLOGICAL MODEL OF AGING...................................................... 8
2.3. WHY SHOULD NEIGHBORHOOD ENVIRONMENTS AFFECT FUNCTIONAL
HEALTH AND DISABILITY?................................................................................................ 10
3. REVIEW OF THE LITERATURE ON NEIGHBORHOOD EFFECTS ON HEALTH..... 11
3.1. EVIDENCE OF NEIGHBORHOOD EFFECTS ON HEALTH.................................. 11
3.2. ARE NEIGHBORHOOD ENVIRONMENTS MORE IMPORTANT FOR THE
HEALTH OF OLDER ADULTS? ........................................................................................... 18
3.3. NEIGHBORHOOD ENVIRONMENTS AND THE HEALTH STATUS OF OLDER
ADULTS................................................................................................................................... 20
3.4. NEIGHBORHOOD ENVIRONMENTS AND THE FUNCTIONAL HEALTH OF
OLDER ADULTS .................................................................................................................... 23
3.5. MODELS OF NEIGHBORHOOD EFFECTS ON HEALTH ..................................... 27
3.6. CONCEPTUAL FRAMEWORK FOR THE RESEARCH.......................................... 32
v
3.7. RESEARCH HYPOTHESES ....................................................................................... 35
4. AN ECOLOGICAL STUDY OF DISABILITY IN SMALL GEOGRAPHIC AREAS...... 38
4.1. OVERVIEW ................................................................................................................. 38
4.2. METHODS ................................................................................................................... 39
4.2.1. DATA SOURCES ................................................................................................ 39
4.2.2. DEFINITION OF THE GEOGRAPHICAL UNITS ............................................ 39
4.2.3. MEASURES ......................................................................................................... 42
4.2.3.1. MEASURES OF DISABILITY.................................................................... 42
4.2.3.2. MEASURES OF NEIGHBORHOOD STRUCTURE AND PROCESS...... 43
4.2.4. DATA ANALYSIS............................................................................................... 49
4.3. RESULTS ..................................................................................................................... 50
4.3.1. DISABILITY RATES .......................................................................................... 50
4.3.2. INTERCORRELATIONS OF NEIGHBORHOOD MEASURES....................... 51
4.3.3. CORRELATES OF DISABILITY ....................................................................... 52
4.3.4. GEOGRAPHICAL CLUSTERING OF DISABILITY........................................ 58
4.4. CONCLUSIONS........................................................................................................... 58
5. A CONTEXTUAL STUDY OF FUNCTIONAL AND DISABILITY OUTCOMES......... 65
5.1. OVERVIEW ................................................................................................................. 65
5.2. METHODS ................................................................................................................... 65
5.2.1. DATA SOURCES ................................................................................................ 65
5.2.2. MEASURES ......................................................................................................... 70
5.2.2.1. INDIVIDUAL LEVEL VARIABLES.......................................................... 70
5.2.2.2. NEIGHBORHOOD LEVEL VARIABLES ................................................. 72
vi
5.2.3. DATA ANALYSIS............................................................................................... 72
5.3. RESULTS ..................................................................................................................... 74
5.3.1. CROSS-SECTIONAL ANALYSIS OF PREVALENCE .................................... 74
5.3.2. LONGITUDINAL ANALYSIS OF CHANGE.................................................... 75
5.3.3. LONGITUDINAL ANALYSIS OF DISABILITY ONSET ................................ 79
5.3.4. ANALYSIS OF OTHER FUNCTIONAL OUTCOMES..................................... 81
5.4. CONCLUSIONS........................................................................................................... 84
6. SUMMARY AND DISCUSSION........................................................................................ 85
BIBLIOGRAPHY......................................................................................................................... 89
vii
LIST OF TABLES Table 4.1 Factor Analysis Results ................................................................................................ 44
Table 4.2 Additional Neighborhood Variable Definitions ........................................................... 48
Table 4.3 Disability Rates Per 100 Persons Age 65 and Over...................................................... 50
Table 4.4 Correlation Matrix for Neighborhood Characteristics.................................................. 52
Table 4.5 Disability Rates Per 100 Persons Age 65 and Over by Neighborhood Characteristics 53
Table 4.6 Regression Results for Unstandardized Disability Rates ............................................. 57
Table 5.1 Baseline Demographic and Health Characteristics of Self-Care Study Sample By Study
Index Disease ........................................................................................................................ 69
Table 5.2 Cross-sectional Regression Results with Robust Variance Estimation for Clustered
Data for Basic Activities of Daily Living and Instrumental Activities of Daily Living....... 77
Table 5.3 Residualized Regression Results with Robust Variance Estimation for Clustered Data
for Basic Activities of Daily Living and Instrumental Activities of Daily Living Disability at
20 Months ............................................................................................................................. 78
Table 5.4 Logistic Regression Results with Robust Variance Estimation for Clustered Data for
Onset or Worsening of Disability at 20 Months ................................................................... 80
Table 5.5 Regression Results for SF-36 and SF-12 Physical Function Subscales ...................... 83
viii

LIST OF FIGURES Figure 3.1 Model of Neighborhood Effects on Health Status ...................................................... 33
Figure 4.1 Physical Health Disability Rates for Allegheny County Neighborhoods ................... 60
Figure 4.2 Self-Care Disability Rates for Allegheny County Neighborhoods ............................. 61
Figure 4.3 Going Outside the Home Disability for Allegheny County Neighborhoods .............. 62
Figure 4.4 Level of Concentrated Disadvantage for Allegheny County Neighborhoods............. 63
Figure 4.5 Level of Concentrated Advantage for Allegheny County Neighborhoods ................. 64
ix

PREFACE
I would like to express my sincere appreciation to the members of my committee who
encouraged me as well as offered invaluable help and suggestions along the way. Each in a
different way has been a friend and colleague, and this project would never have been completed
without their support. I must also thank my family and friends for their patience, and for never
failing to support my goal of completing a doctorate.
x

1. INTRODUCTION
1.1. BACKGROUND
The population of the United States is aging. By 2030, with the aging of the “baby boomers,” the
population age 65 and older is projected to double to about 70 million, and to approach 20
percent of the total population (Federal Interagency Forum, 2000). This continues a long-
standing demographic trend in which decreased mortality at younger ages and improved living
conditions have resulted in an increased life span, and thus increasing percentages of the
population over age 65. In this context, public health, which played a major role in creating the
conditions for longer life spans, has been shifting its primary focus from infectious disease as the
predominant cause of mortality and morbidity at the start of the 20th century, to chronic disease
at the beginning of the 21st century. Chronic diseases are largely diseases of the elderly, and a
new field of public health and aging, or public health gerontology, has developed to deal with the
increasingly important health problems of old age (Coreil, et al., 2001). Since the aging trend
will continue well into the future, it is safe to say that public health will focus to an increasingly
great extent on the health and well-being of older adults.
As a concomitant of aging and the increasing prevalence of chronic disease, the
maintenance of functional capacity and the prevention of disability - living better as well as
living longer - has also become a significant public health objective. The impairments associated
with many chronic diseases as well as the biological changes that occur with normal aging have
1

led to increasing numbers of people with limitations and disabilities, both cognitive and physical.
The growing number of older adults with disability has placed, and continues to place, great
pressure on administrative systems and community services that care for the elderly. Thus,
maximizing the ability of older adults to live independently is a major goal of national aging
policy.
A significant amount of research attention has been paid to the genesis and prevention of
disability. However, most of this work has been focused on individual risk factors and lifestyles,
and has neglected the contexts in which people live. For example, a comprehensive review of the
literature on risk factors for functional status decline in community-dwelling elderly people
(Stuck, et al., 1999) concluded that there was evidence for a number of risk factors including
cognitive impairment, depression, disease burden (comorbidity), lower extremity functional
limitation, low frequency of social contacts, low level of physical activity, and poor self-
perceived health. The review also concluded that some types of factors contributing to functional
status decline, such as the environment, have been neglected in research.
There is a growing body of research on the effects of neighborhood environments on
various aspects of health, with mounting evidence of contextual effects independent of individual
risk factors (e.g., Kawachi and Berkman, 2003). Studies of both the physical and social
environment and particularly the environments of local neighborhoods as factors affecting health
are an increasingly important focus of study, and the idea of place as important to health has
reemerged in the last few years (Diez Roux, 2001). Although the individual risk factor approach
has dominated, contextual analysis of individual health in social and physical neighborhood
environments (i.e., the social ecological approach) represents an attractive means of reconciling
individual and group approaches (Pickett and Pearl, 2001). Gerontologists interested in the health
2

and well-being of older adults also have begun to call for greater attention to the role of
neighborhood environments in functional health and maintenance of independence (Satariano,
1997). However, there are still few studies that have examined the health of older adults in
relation to neighborhood environments, and the role of the neighborhood in the genesis of
functional limitations and disability among older adults has rarely been studied.
Thus, a good bit of evidence suggests that neighborhood environments do, in fact, affect
health. It also seems reasonable to suppose that the health status of older adults may be more
susceptible to environmental influences than that of younger adults because of their greater
vulnerability. Evidence addressing these issues will be reviewed below. Given this, it is
important that health researchers address the question of the degree to which neighborhoods
affect the functional health of the elderly, how this effect comes about, and what can be done
about it to improve health. Furthermore, the mechanisms and processes through which
neighborhoods affect individual health remain to a great extent unexplored.
1.2. SPECIFIC AIMS
Given the lack of empirical studies examining neighborhood effects on the functional health and
disability of older adults, the goal of this dissertation is to add to this literature by examining the
association of social structural characteristics and social processes of neighborhood
environments with physical functional status and the onset of disability. In order to accomplish
this, the study combines neighborhood level data from the 2000 Census and police crime reports
to characterize neighborhoods, and links individual level data from a longitudinal study of self-
care for chronic disease among older adults in Allegheny County, Pennsylvania to
3

neighborhoods in order to assess the effects of the neighborhood social environment on
individual functional status. Two separate data analyses are carried out and reported here: 1) an
ecological analysis of the distribution of functional disability in small geographic areas (i.e.,
neighborhoods) in Allegheny County, and 2) a contextual study of individual disability outcomes
utilizing both individual level and neighborhood level predictors. The specific aims of the study
are:
At an ecological (small area) level of analysis:
1. To assess the distribution of physical disability rates as measured in the 2000 Census among
older adults in neighborhoods in Allegheny County, and to determine whether these rates are
uniform or vary across areas.
2. To determine whether the socioeconomic characteristics of these areas are associated with
variation in disability rates across areas.
At an individual level of analysis, taking into account environmental context:
3. To assess whether neighborhood socioeconomic and social structural variables are related to
individual levels of function and disability while controlling for individual covariates in a cross-
sectional analysis of individual health data.
4. To assess whether neighborhood socioeconomic and social structural variables are related to
individual loss of function and the onset of disability while controlling for individual covariates
in a longitudinal analysis of individual health data,
4

Since limited empirical work has been done so far examining the effects of neighborhood
social environments on functional health and disability of older adults, this research is, to some
extent exploratory, and attempts to determine whether significant neighborhood effects can be
found apart from individual characteristics. Also, since there are a variety of measures of
functional status and disability available in the research literature, measuring different aspects of
function and with differing levels of sensitivity to context and change, the study compares
alternative measures to assess the degree to which neighborhood environments affect different
aspects of function and disability.
The study of social environmental effects on the functional health of the elderly is
important not just because it is of academic interest to understand social causes and correlates of
poor health. It also has potentially important policy implications. Attempts to modify individual
health behavior have had mixed results, and in many cases, have had limited success in
improving health. However, intervention approaches that address neighborhood and community
conditions and processes, based on a fuller understanding of these factors, have the potential to
be more successful in improving health than many behavioral and lifestyle interventions -- they
address more fundamental social causes of poor health affecting whole communities and often
affect many people at once. This research area is thus of practical as well as theoretical
importance.
5

2. DISABILITY AS A HEALTH OUTCOME FOR OLDER ADULTS
2.1. MODELS OF THE DISABLEMENT PROCESS
As people age, the risk of chronic disease such as cardiovascular disease, cancer, diabetes,
arthritis, dementia, and the loss of function often associated with these diseases increases. The
higher prevalence of chronic disease, coupled with the normal physical and cognitive changes
associated with aging that may lead to greater frailty has led to increasing numbers of older
people at risk of falling below the threshold of competence required for completing everyday
tasks and becoming disabled (Albert, 2004). Disability has a major impact on an older person’s
quality of life and ability to maintain independence, as well increasing the risk for
hospitalization, nursing home admission and death (Mor, et al., 1994; Branch and Jette, 1982;
Manton, 1988). It also has an impact on the need for care by informal and formal caregivers and
thus has major implications for service utilization. For these reasons, disability has been called
both a critical health issue and the central outcome for public health and aging, as well as a
health challenge requiring a stronger and clearer public health presence (Guralnick, et al., 1996;
Albert, 2004; Lollar and Crews, 2003).
Models of the disablement process were originally largely biomedical in nature. A
conceptual scheme put forward by the World Health Organization’s International Classification
of Impairments, Disabilities, and Handicaps (1980), begins with disease which results in
impairment of bodily systems, then disability, and finally in handicap (cited in Verbrugge and
6

Jette, 1994). A conceptual model developed by Nagi (1979) utilized a similar scheme but placed
the disablement process in a socially constructed context, stressing the importance of the
physical and social environment (Verbrugge and Jette, 1994; Reynolds and Silverstein, 2003).
Currently, next generation models of disability have been proposed, but they share many
components and give them different emphases. The most influential current model of disability is
one proposed by Verbrugge and Jette (1994), which defines disability as self-reported difficulty
in carrying out the activities of daily life. This model of the disablement process (Verbrugge and
Jette, 1994; Albert, 2004) consists of four temporally sequenced stages: 1) pathology (diseases
and conditions), leading to 2) impairments (dysfunctions or structural abnormalities in specific
body systems), which in turn lead to 3) functional limitations (or altered performance in daily
tasks, such as gait speed below age and gender specific norms) and, finally, to 4) disability (a
self-reported difficulty or a need for help to carry out fundamental daily tasks). Commonly used
measures of disability in this scheme are the Basic Activities of Daily Living scale (BADLs) and
the Instrumental Activities of Daily Living (IADLs) scale. This disablement process model is
useful because it takes into account other features of disability such as individual risk factors,
intra-individual factors (e.g., behaviors, psychosocial attributes and coping) and, most useful
here, extra-individual factors such as medical care, external supports, and the built, physical, and
social environment (Verbrugge and Jette, 1994). In addition, the process model of disablement
applies to both physical and cognitive functioning.
Thus, contemporary notions of disability tend to assert the critical nature of the
environment in causing disability (Lollar and Crews, 2003). That is, disability or self-reported
difficulty may be defined as (or alternatively thought to be a direct result of) a lack of fit between
the person and the environment in which he/she functions (Lollar and Crews, 2003). Given a
7

supportive and appropriate environment, impairments and functional limitations need not lead to
disability. Thus, opportunities for minimizing disability and its impacts may be found in
modifying the environment. Compensatory mechanisms, such as assistive equipment,
technology, and environmental modification can aid in coping with functional loss, and in
avoiding or deferring disability. However, when these things no longer suffice or are not
available, disability is much more likely.
2.2. LAWTON’S ECOLOGICAL MODEL OF AGING
Much of the work on the role of the environment in the development of functional limitations
and disability in the elderly derives from Lawton’s work (e.g., Lawton, 1980), and his ecological
model of aging (EMA). In this model the fit between the person and his or her environment is the
key concept in functioning and well-being. The demands of the environment are balanced against
the capabilities of the individual to produce behavior and outcomes (Scheidt and Norris-Baker,
2004; also see Glass and Balfour, 2003, for a useful discussion of the model in the context of the
neighborhood effects literature). A feature of the model is that the relative balance of
environmental “press” (or demand) and the individual’s “competence” (or capability) to deal
with it may result in either a balance of the two (and maximal comfort and functioning) or an
imbalance. An imbalance may arise because the demand is too great or, alternatively, is too small
for the person’s capabilities. In other words, an individual whose capabilities are not in balance
with environmental demands may be either overwhelmed by the environment or insufficiently
stimulated and bored. In either case, increased risk of deterioration and disability can occur. “Use
8

it or lose it” is one way to think about functional capabilities, and at either extreme of the
environment, less engagement resulting in disuse and loss of function can occur.
Lawton distinguished five different classes of environment (Scheidt and Norris-Baker,
2004): the physical environment, including natural and human-built dimensions, the personal
environment (one-on-one relationships), the small-group environment (the dynamics of group
interaction), the supra-personal environment (the characteristics of people in geographic
proximity to the subject as in social area analysis), and the social environment (organizations,
institutions, norms, culture, psychosocial factors, etc.). This conceptualization clearly takes into
account the fit with the broader social and geographical environments of older adults as
important to their well-being. Lawton and his collaborators, however, focused primarily on the
immediate environment in their empirical work. Although there is much recent empirical work in
environmental gerontology utilizing the ideas of Lawton (e.g., Wahl, et al., 2003), most of this
research has focused on nursing home and home environments and their modification, rather
than on larger-scale social and physical neighborhood environments. Thus, application of the
EMA in a broader context is a possible avenue for future research. This model will be discussed
again below.
9
2.3. WHY SHOULD NEIGHBORHOOD ENVIRONMENTS AFFECT FUNCTIONAL HEALTH AND DISABILITY?
As noted, much of the previous research on determinants and risk factors for disability has been
on individual risk factors (Stuck, et al., 1999). However, there are empirical reasons beyond the
theoretical arguments of Lawton to believe that social contextual variables also play a role in the
loss of function and the onset of disability. For example, the review by Stuck et al, (1999)
indicates that a low level of social activity and a low level of social contact are associated with
poor functional outcomes. Moritz, et al. (1995) found, after accounting for cognitive functioning,
that social isolation was associated with incident limitations in activities of daily living. Both
social involvement and emotional support appear to have a favorable impact on function (Stuck,
et al., 1999), but instrumental support (active assistance) may in fact have the opposite effect,
lending support to the “use it or lose it” hypothesis.
In addition, individual socioeconomic factors such as income and education show strong
associations with functional status in both longitudinal and cross-sectional studies (Stuck, et al.,
1999). If individual socioeconomic status is affected by the social environment and also affects
function, it is reasonable to hypothesize that function may also be directly affected by
neighborhood SES. Finally, the review by Stuck et al. (1999) also points out that there are
multiple pathways to functional decline, and that risk factors interact to produce limitations.
Thus, it is plausible that contextual factors interact with individual risk factors to produce
functional decline. While these arguments are not conclusive, they suggest that the social and
physical environmental effects on the functioning of older adults should be further investigated.
10

3. REVIEW OF THE LITERATURE ON NEIGHBORHOOD EFFECTS ON HEALTH
This chapter will review evidence for neighborhood environmental effects on health in general,
and then will consider neighborhood effects on the health of older adults, including their
functional status, level of disability, and other health outcomes.
3.1. EVIDENCE OF NEIGHBORHOOD EFFECTS ON HEALTH
Numerous studies have demonstrated that health outcomes vary across geographic areas.
However, an ongoing question has been whether these area-based variations are in fact due to the
characteristics of the individuals who live in an area or are, at least in part, a result of the area
context itself - whether there are neighborhood level effects over and above individual level
effects on health (contextual versus compositional effects). Recent developments in concepts and
methods have made it possible to more adequately investigate this question empirically, and a
growing body of research has emerged. A number of reviews and discussions of the literature on
neighborhoods and health (e.g., Robert and House, 2000; Ellen, et al., 2001; Pickett and Pearl,
2001; Kawachi and Berkman, 2003), and neighborhood effects more generally (Ellen, et al.,
1997; Sampson, et al., 2002) have recently been published. In general, these studies support the
notion that there are independent effects of neighborhood environments, both social and
physical, on various aspects of health and well-being, but seem to indicate that the size of the
effects is generally modest. Pickett and Pearl (2001), for example, noted that all but two of the 25
11

studies they reviewed reported a statistically significant association between at least one measure
of the social environment and a health outcome after adjusting for at least some individual level
(compositional) factors, but the contextual effects were generally much smaller than the
compositional effects. It should be noted that many of the studies conducted thus far have
substantial methodological and conceptual limitations. However, the tentative conclusion
appears to be that neighborhood environments do matter to health, but that considerable work
remains to be done. Questions which need to be addressed in detail include: Which aspects of the
environment affect which health outcomes, for which groups of people, to what degree, and
how?
A methodological comment which can be made regarding the modest effects on health
that are generally found is that controlling for many individual characteristics (e.g., income,
education, occupation) when investigating the role of neighborhood characteristics (e.g.,
neighborhood SES) may not reflect a sophisticated enough model of the process. The logic often
employed suggests that contextual effects are only valid if found after controlling for as many
individual factors as possible. While including many individual characteristics in statistical
models lessens correlations (i.e., effect sizes) for contextual effects, it may also be incorrectly
specifying the causal relationships at work since, in the SES example, neighborhood SES may, in
fact, influence the life chances and the health of individuals by influencing their income,
education and occupation (Diez Roux, 2001). That is, individual variables may, in fact, be
mediators of the effects of neighborhoods on health, and this view of the process may be lost if
individual variables are routinely treated only as confounders. The main point here is that there is
a need for complex and sophisticated models of how neighborhood effects are transmitted and
investigation of the mechanisms by which they affect health.
12

Another important methodological issue which must be addressed is the question of the
appropriate geographical unit of analysis for studies of the social and physical environment and
health. How does one define a neighborhood or community, and is one of these the appropriate
unit or is there some other geographical unit that should be used for analysis? The most direct
answer to this question appears to be that the appropriate geographical unit depends on the
neighborhood process under investigation (Diez Roux, 2001), and this varies from one study to
another. That is, for studies of physical environmental effects such as air and water pollution,
wind direction and proximity to rivers and streams may be operative criteria. However, in
investigating the effects of social processes, communities based on social interaction and
solidarity are more appropriate units, and subjective perceptions of belonging to a community
may be one mechanism transmitting health effects. Alternatively, for studies of the importance of
community resources and services, administrative jurisdictions such as municipalities may be
appropriate units. In this discussion, the term “neighborhood” will generally be used to indicate
the geographical (environmental) unit. However, this unit has been defined differently by many
of the studies cited. Here it will be taken to mean a relatively small and relatively homogeneous
area on the neighborhood dimension of interest, with potential effects on health. The definition
of neighborhoods used in this research will be discussed in Chapter 4.
Looking now at more specific evidence of environmental effects on health, one of the
strongest findings to date has been the relationship between neighborhoods and all-cause
mortality (the risk of dying from any cause). The bulk of the evidence seems to indicate a
moderate (statistically significant relative risks between 1.1 and 1.8) association between
neighborhood environment and health, controlling for individual socioeconomic and other
characteristics (Kawachi and Berkman, 2003; Ellen, et al., 2001; Haan, et al., 1987; Anderson, et
13

al., 1997; Waitzman and Smith, 1998). Associations have also been found between neighborhood
environments and mental health (e.g., Adams, 1992), health related behaviors (e.g., Yen and
Kaplan, 1998; Ross, 2000; Diez Roux, et al., 2003), and to a lesser degree with low birth weight
(e.g., O’Campo, et al., 1997). In addition, associations have been found with measures of
morbidity such as adult self-reported health (e.g., Malmstrom, et al., 1999). In an important
study, Diez Roux, et al. (2001) demonstrated that, even after controlling for individual
characteristics, living in a disadvantaged neighborhood is associated with an increased incidence
of coronary heart disease. Typically (with some exceptions including Diez Roux, et al., 2001),
stronger relationships have been found with overall or generalized health measures (e.g., all
cause mortality, self-rated health), rather than with specific conditions. This may indicate that
living in poor or disadvantaged neighborhoods may have a broad and cumulating effect on health
rather than a large effect on specific risk factors and conditions (or alternatively that the effects
on individual risk factors are small by themselves but accumulate to affect health).
Various aspects of neighborhoods have been found to relate to a variety of health
outcomes, and literatures exist on both the social and physical aspects of the environment that
affect health. The greatest amount of empirical work to date has been on the effects of the
socioeconomic characteristics of neighborhoods on the health of the residents (e.g., Robert and
House, 2000). Socioeconomic status is a fundamental characteristic of an area and likely
determines or affects most other features of it; however, specific aspects of the neighborhood
that more directly affect health have not yet been sufficiently examined in empirical research.
Macintyre et al. (2002) and Macintyre and Ellaway (2003) suggest a conceptual framework and a
set of measures to unpack the black box of neighborhoods, listing five features that might be
health promoting or health damaging: 1) the physical features of the environment shared by all
14

(e.g., air and water quality), 2) the availability of healthy environments at home, work and play
(e.g., decent housing, safe play areas); 3) services provided to support people in their daily lives
(e.g., education, transportation, policing); 4) socio-cultural features of a neighborhood (e.g.,
political and economic characteristics and history and degree of community integration); and 5)
the reputation of an area (how the area is perceived by residents and others). Ellen, et al. (2001),
focusing on how features of an area can affect health, suggest in their review of the literature that
four pathways can summarize the range of models of neighborhood effects on health: institutions
and resources, stresses in the physical environment, stresses in the social environment, and
neighborhood-based networks and norms. There is clear overlap in these two schemes and in
other similar discussions, and they provide a starting point for further investigation of
neighborhood environments.
One consistent theme in studies of both health and other effects of neighborhoods is that
there are areas with “concentrated disadvantage”. That is, evidence shows that the communities
which are the most economically deprived also exhibit a range of negative social outcomes
including higher rates of infant mortality, lower birth weights, teenage childbearing, more high
school dropout, child maltreatment, adolescent delinquency, homicide and other crimes, social
disorder, accidental injury, suicide, and other problem behaviors (Sampson, et al., 2002). The
same areas also typically have substandard and dilapidated built environments as well as the
most exposure to environmental pollutants. These areas are often inner-city neighborhoods with
concentrations of racial minorities, in many cases African Americans. Thus, there is strong
evidence for spatial clustering of economic and social problems, so called geographic “hot
spots”, which are characterized by multiple forms of disadvantage, and characterized as well by
multiple forms of poor health and health-related behavior (Sampson, et al., 2002; Kawachi and
15

Berkman, 2003). Clearly economic inequalities and racial discrimination play a major role in this
process. It should be noted that the degree of concentration of both poverty and affluence appears
to have increased significantly in the U.S. in recent decades, resulting in an increasingly divided
society, greater levels of economic inequality, and likely growing levels of health inequalities
(Massey, 1996; Sampson and Morenoff, 2000; Kawachi and Berkman, 2003).
The evidence suggests that the negative health effects of disadvantaged neighborhoods
are significant. Recently, there has also been increasing research interest in the positive effects of
concentrated affluence and of neighborhood advantage (e.g., Massey, 1996; Brooks-Gunn at al.,
1993; Sampson, et al., 1999; Browning and Cagney, 2003). Research has suggested that the
effects of good environments, especially affluent ones, is not neutral in its effects on health, but
actually improves health (Browning and Cagney, 2003; Browning, et al., 2003). The argument
made here is similar to that made in studies of the effects of individual socioeconomic status on
health, and the SES gradient. Evidence suggests that the improvement in health is seen at all
levels of the individual SES-health gradient, with each step up the scale resulting in positive
returns in health state. This is in contrast to an earlier conception of the effects of SES as a
threshold effect in which SES levels below some point (deprivation) result in poorer health.
Thus, a similar argument is now being made with respect to the socioeconomic status of
neighborhood environments and their effects.
Another recent line of argument is that economic inequality contributes to poor health,
either through relative deprivation mechanisms or through the unequal distribution of resources.
While inequality is broad based in U.S. society and the relevant processes are likely to be at
work on a large scale, relative inequalities within a neighborhood may also contribute to
16

inequalities in health. More visible and extensive inequalities in a relatively small neighborhood
area may be more acute in nature and thus be direct causes of poor health.
Throughout this discussion however, the compositional versus contextual debate about
individual or neighborhood causes continues. Not enough research has been done to answer the
question whether those living in poor communities are sicker because they are poor or because
there is something unhealthy about living in such neighborhoods, and conversely whether there
is something healthy about more advantaged neighborhoods.
In another recently developing area of research, public health has become interested in
the built environment and health, with a special issue of the American Journal of Public Health
devoted to this topic (September, 2003). Articles in this issue discuss evidence that many
physical and mental health problems are related to aspects of the environment that we build for
ourselves and thus are amenable to intervention (e.g., Srinivasan, et al., 2003; Frumkin, 2003).
For example, there is mounting evidence that health friendly land use decisions, housing and
transportation policies, the availability of adequate public places (e.g., streets and sidewalks that
are user-friendly), the opportunity for contact with nature (as opposed to concrete buildings), and
places that lead people to be integrated with others as opposed to socially isolated are all
potentially important to health. Current efforts to develop “smart growth” policies and
“sustainable communities” incorporate policy and design elements that attempt to address these
kinds of issues in the built environment in order to promote health. While this is a logical
extension and useful addition to the neighborhood effects on health literature, a possible danger
is that with an emphasis on such elements as user-friendly sidewalks and bike paths to encourage
exercise in middle and upper income communities, the effects of poor and disadvantaged
neighborhoods on health, and the ubiquitous presence of health inequalities due to neighborhood
17

conditions may be deemphasized. However, a focus on what is healthy about built environments
is clearly a welcome addition to the research literature.
3.2. ARE NEIGHBORHOOD ENVIRONMENTS MORE IMPORTANT FOR THE HEALTH OF OLDER ADULTS?
Turning now to the effects of neighborhoods on the health of older adults, an important question
to ask is whether neighborhood environments are more or less salient for the health and well
being of older adults than they are for younger age groups (Glass and Balfour, 2003). In fact, a
good deal of literature suggests that they are more important for older adults. For example,
Lawton and Nahemow (1973) point out that reduced or compromised physical, cognitive, and
psychological capabilities (i.e., greater biological vulnerability) make the interaction with the
environment particularly important for determining the health of older adults. Adverse
environments may affect older adults disproportionately because of this greater vulnerability.
Changes associated with normal aging thus may reduce an individual’s competence, exacerbate
barriers to service use, and increase vulnerability to environmental stresses (Glass and Balfour,
2003). Lawton (1977) also suggests that younger people are more mobile and therefore are
exposed to many different social environments such as work, home, community and recreation.
In contrast, older people tend to be less mobile and limit their pattern of spatial use. Similarly,
the social networks of older persons also may shrink due to deaths and relocations, as well as to
retirement (Glass and Balfour, 2003). Therefore, they may experience the local community as
their primary physical and social environment. Here reduced mobility may refer both to
functional limitations and physical disability and, in a broader sense, to reduced social roles and
limited exposure to multiple social environments. In general, the image of the older adult’s life
18
suggested here is one of increased dependence on the immediate surroundings and a somewhat
reduced social world (although this is clearly not true of all older adults but becomes
increasingly so with advancing age).
Robert (1999) argues that the socioeconomic characteristics of communities may also
have more of an impact on older adults. While exposure to negative risk factors associated with
lower SES such as pollution, crime and limited service availability may be the same for all age
groups, the impact of these factors may be greatest among older adults since they are more
vulnerable to them. Still another line of argument is that older adults may have a longer duration
of exposure to potentially unhealthy environments since they are likely to have been in place for
a longer time (Elreedy, et al., 1999; Glass and Balfour, 2003; Robert, 1999). Older adults are also
likely to be more vulnerable to their neighborhood context since they often live alone, have
limited incomes, have limited transportation choices, and have greater concerns for safety and
accessible physical structures (Klinenberg, 2002). In sum, a good deal of literature suggests that
neighborhood environments may have a greater impact on older adults than on younger adults
due primarily to greater vulnerability, greater exposure, and more limited mobility, and that the
most likely population group in which to find neighborhood effects is likely to be older adults.
To date, however, although there is a large body of work in environmental gerontology (e.g.,
Wahl, 2001; Kendig, 2003), most of this has focused on home, residential and nursing home
environments, and there has been a limited amount of research in gerontology dealing
specifically with the effects of neighborhoods on the health and functional ability of older adults.
19
3.3. NEIGHBORHOOD ENVIRONMENTS AND THE HEALTH STATUS OF OLDER ADULTS
Studies that have focused specifically on neighborhood effects on the health of older adults
indicate that there are some differences in the effects of neighborhoods on the health of older
adults versus other groups in the population. In particular, studies that found significant
contextual effects on all-cause mortality among younger adults found reduced or no contextual
effects on mortality among older age groups (Haan, et al., 1987; Anderson, et al., 1997;
Waitzman and Smith, 1998; Kawachi and Berkman, 2003; Glass and Balfour, 2003). Glass and
Balfour (2003) suggest several possible explanations for this finding: a) selective mortality - in
the worst neighborhoods for health, mortality occurs earlier than in better neighborhoods,
resulting selectively in more “hearty” older survivors who do not reflect general population
patterns (also see Pickett and Pearl, 2001); b) the relative ubiquity of death as an outcome -
among the oldest age groups death is a more frequent occurrence, making it harder to detect risk
factors (of which there are many) compared with less prevalent outcomes; c) methodological
problems – for example, using measures of income to measure neighborhood resources rather
than wealth or assets (which are often more relevant to older adults) may make it less likely that
contextual effects on mortality will be detected (Robert, 1996). However, in a recent analysis of
the effects of neighborhood environments (census block groups) on mortality using data from the
Cardiovascular Health Study, Diez Roux, et al (2004) found that neighborhood disadvantage was
related to rates of cardiovascular death (not all-cause mortality) in elderly white adults. This
study suggests that specific causes of mortality in older adults may be more detectable than all-
cause mortality. Thus, despite limited or no findings of contextual effects on mortality in many
studies among the elderly, more investigation of this relationship is still warranted. While these
20

findings may seem to contradict the assertion that older adults are more affected by the
neighborhood environment, they may simply be pointing out that certain health outcomes are
more sensitive to environmental effects than others.
Other health outcomes that have been examined among older adults include morbidity
and self-rated physical health, nursing home admissions and functional health. Robert and Li
(2001) examined age variation in the relationship between socioeconomic status of communities
and adult health using two cross-sectional national studies. They found that the association
between community SES and individual health (self-rated health and number of chronic
conditions) is nonexistent or weak during younger adulthood, stronger through the middle ages,
strongest at ages 60 to 69, and weak again at ages 70 and older. At ages 60 to 69, community
SES effects were stronger or comparable to individual SES effects. This suggests that
neighborhood effects may be important determinants of morbidity, that the effects vary with age,
and that they are particularly important among the young-old age groups. Perhaps a similar
argument may be made to explain the lack of significant SES-health associations for the oldest
age groups as for the lack of all-cause mortality effects among older adults discussed previously:
the greater prevalence of poor self-rated health and chronic conditions among the older old leads
to less sensitivity in detecting risk factors.
Nordstrom, et al (2004), in another analysis of the Cardiovascular Health Study data,
examined the association of both individual and neighborhood SES with subclinical
cardiovascular disease in an elderly cohort. Although they found strong associations between
neighborhood SES and subclinical CVD, these associations were not significant when individual
SES and behavioral factors were controlled. However, the authors recommend caution in
interpreting their results due to measurement error in neighborhood characteristics.
21

Kobetz, et al. (2003) examined the relationship between neighborhood socioeconomic
context and self-reported health among low-income rural women age 50 and over in North
Carolina. They found that neighborhood poverty was associated with a greater likelihood of poor
self-reported health, adjusted for age, race and SES. The association was strongest for
individuals with incomes below the median neighborhood income. This study, in addition to
providing support for neighborhood effects on self-perceived health, indicates that rural as well
as urban settings have an influence on health, and that contextual effects may vary by
geographical setting and by individual characteristics like income - i.e., that contextual variables
like urban-rural setting or individual factors like income may moderate, or condition, the effects
of context on health. While all adults over 50 were included in the analysis, neither race nor age
was a significant predictor of health when adjustments for individual income, education, and
employment were included.
Krause (1996) examined the effects of the physical living environment on self-rated
health among older adults utilizing data from a cross-sectional national survey. He hypothesized
that those older adults who reside in deteriorated neighborhoods, particularly in the most
dilapidated conditions, will report more physical problems than those who live in better physical
environments. The physical environment was measured by questions about such features as the
physical condition of the respondent’s dwelling and the neighborhood, the quality of the air, and
the amount of noise. The hypothesis was supported by the data and Krause also showed that part
of the effect of dilapidated environments on health can be attributed to effects on the social
support systems of residents (i.e., friendship strains) that arise in such environments. This study
demonstrates that there are effects of the physical environment on self-perceived health of older
22

adults, and that they vary with specific environmental conditions. Further it suggests that one
mechanism through which environments affect health is by affecting support systems and social
networks.
With respect to studies of neighborhood effects on nursing home admission, a health
outcome which occurs when increasing disability no longer allows independence, it has been
found that features of the environment such as housing type (home versus more institutional
settings – e.g., retirement home or assisted living facility), number of available primary care
providers, degree of urbanization, and percent foreign born are related to admission to long-term
care services (Glass and Balfour, 2003). The important underlying ecological factors here seem
to revolve around the availability in the environment of supports and resources for the older adult
to remain independent.
3.4. NEIGHBORHOOD ENVIRONMENTS AND THE FUNCTIONAL HEALTH OF OLDER ADULTS
There has been little direct study of neighborhood environments and functional health among
older adults. Balfour (1999), in her doctoral dissertation, analyzed the effects of neighborhood
environments on the loss of physical function utilizing census data and three secondary (survey)
data sets from the California Bay Area. She found, first, that there was substantial variation
among census tracts in mobility disability in the elderly using 1990 census data, and that this
variation was related to the socio-demographic characteristics of the tracts. An earlier study
(Satin and Monetti, 1985) also found differences in census tract disability prevalence in the
general population which was inversely related to census tract SES. These findings are important
because if there are neighborhood effects on functional loss and disability, one would expect to
23

be able to demonstrate these differences when comparing small geographical areas. These
prevalence findings are consistent with the neighborhood effects argument.
Using survey data, Balfour (1999) also found that perceived neighborhood characteristics
were prospectively associated with incident loss of function among older people who were
functionally healthy at baseline (controlling for individual characteristics). In a follow-up to her
dissertation, Balfour and Kaplan (2002) examined the effects of neighborhood environment on
loss of physical function using data from the Alameda County Study. They examined the effects
of six self-reported neighborhood problems (traffic, noise, crime, trash and litter, lighting, and
public transportation) at baseline on change in self-reported difficulty with physical tasks after
one year. The physical tasks (consisting of pushing a large object, lifting a weight of more than
10 pounds, reaching the arms up above the shoulders, writing or handling small objects, stooping
or crouching, getting up from a stoop, standing in place for more than 15 minutes, walking a
quarter mile, and walking up a flight of stairs) were viewed as representing functional
limitations, rather than disability. The degree of severe difficulty with all nine tasks was used to
measure overall functional limitations, and degree of severe difficulty with the last five tasks
alone was used to assess lower extremity functional limitations. Those who reported multiple-
problem neighborhoods were at greater risk of both overall and lower extremity functional loss
than those who reported non-problem neighborhoods. These studies suggest that perceptions of
neighborhood environment affect the processes that lead to functional loss.
In a multilevel study of the effects of area of residence in the U.K. on health among
adults age 40 to 84, Wainwright and Surtees (2003) investigated effects on both physical and
mental functional health using the SF-36 physical and mental component summary scores as
outcomes. The SF-36 includes physical functioning and mental health subscales as well as
24

subscales for other dimensions of health (e.g., bodily pain, general health, vitality), and the
summary scores thus may be viewed as measuring multiple dimensions of health including
functional limitations and disability. The authors demonstrate a small but significant effect of
neighborhood deprivation on physical functional health, independent of individual level SES
factors. Those with low individual social class (SES) who also lived in a deprived area reported
especially low levels of physical functional health, a similar interaction effect to those in
previously described studies. Evidence for an association between neighborhood conditions and
mental functional health was weak. It should be noted that the SF-36 physical and mental
component summary scores are not simply physical or mental functioning measures, and are
described by some researchers as measuring self-rated health or health-related quality of life in
totality. Their use as surrogates for functional health may be problematic, and the subscales
measuring function from the SF-36 may have been a better choice as an outcome. However, the
findings are consistent with other studies that have shown effects of neighborhood environments
on global self-rated health.
In another study in the U.K., Feldman and Steptoe (2004) investigated pathways through
which neighborhood SES and subjective neighborhood characteristics have effects on individual
functional health. Their measure of physical health functioning was the physical functioning
subscale of the MOS 36-item short form health survey, an earlier version of the SF-36 and quite
similar to it in content. This scale asks participants to evaluate the extent to which they are
limited in their ability to carry out 10 activities (e.g., bending, stooping, kneeling) by their health.
Their sample included adults between the ages of 18 and 94, and thus does not only address the
health of older adults. They do not report an analysis of age differences. However, the value of
this study is that they report a structural equation model that shows that living in a lower SES
25

neighborhood and perceiving greater neighborhood strain was associated with poorer physical
functioning through the pathways of lower social integration, lower perceived control and greater
financial strain, net of individual SES. In other words, in addition to replicating the finding that
neighborhood conditions are related to individual physical functioning, they also provide some
evidence for how neighborhood conditions and perceptions of them are translated into individual
processes that affect health.
Summarizing this selective review, some effects of the neighborhood physical and social
environment on the health of older adults have been found, although perhaps not to the degree
suggested by the work that implies that older adults’ health should be more sensitive to the
environment than younger adults’ health. Effects on mortality are diminished in older adults, but
effects on morbidity as measured by various indicators of self-reported health have been
demonstrated, and these seem to peak in the young-old age group. Further, they may be
moderated (or conditioned) by both neighborhood and individual characteristics. This implies
complex relationships between environmental context and individual health. General measures
of physical functioning and loss of physical functioning have also been shown to be responsive
to features of the environment. Finally, the availability of supports and resources for the older
adult to remain independent in the community has been found to be a factor in nursing home
admission.
There are numerous conceptual, analytic, and measurement limitations in the studies
discussed here and these must be considered – most of the authors recommend caution in
interpreting results. For example, the question of neighborhood definition is a major one. Many
studies define neighborhoods by using administrative or census boundaries that may or may not
reflect subjective neighborhoods, and may not reflect the appropriate unit for some health-
26

affecting processes (e.g., pollution). Depending on the outcome considered, the neighborhood
boundaries may thus be misspecified and this may affect the results. Another issue has to do with
the role of objective neighborhood conditions versus the subjective perception of them by the
residents and how each of these affects health (Krause, 2004). Again, the specific mechanisms
through which neighborhoods are thought to affect health must be specified and appropriate
geographical units identified. While some progress has been made, there is a clear need for more
research to explore age differences in the relationship between (better specified) neighborhood
processes and indicators and health.
3.5. MODELS OF NEIGHBORHOOD EFFECTS ON HEALTH
A number of theoretical approaches and models have been suggested for understanding the
effects of neighborhood social environments on health. An explicitly sociological approach to
understanding neighborhood effects social is represented by Sampson and colleagues (1997;
1999; 2000; 2002) and Browning and Cagney (2003a; 2003b). Their discussions elaborate on
social theories and mechanisms through which the social environment of a neighborhood is
thought to affect the health of individuals. They discuss work that draws on and extends social
disorganization theory from urban studies and sociology, and applies it to health outcomes. In
brief, social disorganization theory and its elaborations postulate that features of neighborhood
structure (e.g., poverty, residential instability, and ethnic heterogeneity) limit resources to
support local institutions, diminish community attachment due to high population turnover, and
impede communication across diverse racial and ethnic groups. These conditions, in turn, lead to
reduced community levels of solidarity and social control of deviant behavior, and limit the
27

ability of neighborhoods to realize the common values of residents, resulting in social
disorganization and disorder. These conditions are, in turn, detrimental to health.
In more recent work on neighborhood effects, the concept of social capital has been used
to bring together a number of approaches to understanding what it is about the social
organization of neighborhoods and communities that might lead to various health outcomes
(Sampson and Morenoff, 2000). Social capital has been defined as a resource stemming from the
structure of social relationships that can facilitate the achievement of collective goals (Coleman,
1990), and as features of social organization, such as networks, norms, and trust that facilitate
cooperation and coordination for mutual benefit (Putnam, 1993). Thus, social capital is a
potential resource that can be realized through relationships (Sampson and Morenoff, 2000), and
is a property of a social structure such as a community. Communities high in social capital are
better able to achieve collective goals and common values, and are thought to be more able to
facilitate factors that improve the health of residents.
Whereas social capital represents a potential resource, Sampson and colleagues conceive
of collective efficacy as the willingness of the residents to actually work to achieve their
common goals, or the actualization of the resources that are inherent in social capital (Sampson,
et al., 1997). Collective efficacy is dependent on conditions of social cohesion (mutual trust and
solidarity) and shared expectations for beneficial actions (informal social control) in a
neighborhood (Sampson, et al., 2000). Poverty, residential instability, ethnic heterogeneity, and
the lack of social capital are not conducive to this type of collective action. Thus, mechanisms
through which social structural conditions are likely to influence individual health include the
presence or absence of social ties (much empirical work attests to the role of social support in
health) and greater or less collective efficacy (greater collective efficacy is hypothesized to lead
28

to more normative limiting of health-risk behavior and to promoting of health-beneficial and
helping behavior). These in turn result in greater or less access to services and amenities and to
an increase or reduction of stressors both physical and social (Browning and Cagney, 2003).
In the context of the functional status of older adults, the effects of social disorganization,
the lack of social capital, and the lack of collective efficacy of a neighborhood can be seen as
affecting both the physical and social environments. As a result of poverty and residential
instability, the physical environment is likely to be in poor condition with boarded up buildings,
poor physical infrastructure (e.g., sidewalks, stairs), trash and litter, and limited transportation
choices. Stores and businesses necessary for health such as grocery stores and other shops are
likely to be either unavailable or too expensive, and crime rates are likely to be high and the
perception of safety low. At the same time, these conditions lead to low levels of trust, limited
social cohesiveness and low levels of social support for others (limited collective efficacy). In
this environment, older adults are likely to experience a great deal of stress, not to venture far
from their homes, and to become more socially isolated. For example, studies of older
populations have found that neighborhood characteristics are associated with social isolation and
depression among the elderly (Krause, 1993; Roberts, et al., 1997; Balfour and Kaplan, 2002).
Since maintaining functional capacity requires activity and involvement, social isolation and fear
of leaving home can lead to functional loss and eventual disablement. In contrast more affluent
neighborhood environments are likely not to have this constellation of problems, and potentially
have a health enhancing effect rather than simply have an absence of health damaging factors.
Another approach to understanding the effects of neighborhoods on the functional health
of older adults is represented by the ecological model of aging (EMA) of Lawton (e.g., 1980)
and colleagues, discussed previously. This has been suggested as one component in bringing
29
together the literature on disability and the literature regarding neighborhood effects on the
health of older adults. Glass and Balfour (2003) have synthesized the sociological and EMA
approaches and presented a model of neighborhood effects which is consistent with both. Their
model provides a starting point for the empirical approach to be taken in this research in
examining functional loss and disability among older adults in Allegheny County.
Glass and Balfour’s (2003) model comprises five components in a temporal and causal
sequence. They begin with neighborhood factors and characteristics as the first component:
socioeconomic conditions are viewed as a fundamental neighborhood causal factor which affects
other neighborhood level factors, including social integration in the neighborhood, the physical
aspects of the neighborhood, and the services and resources of the neighborhood. They elaborate
the discussion of social integration by describing three aspects of social integration (or
characteristics of the social organization of a neighborhood), the degree of social capital of the
neighborhood, the fear of crime and the sense of safety in the neighborhood, and the degree of
age concentration of the neighborhood. Physical aspects of neighborhoods they discuss include
environmental pollution, the condition of housing and infrastructure, and noise levels. Services
and resources include access to goods and services such as adequate medical care, restaurants,
stores (including grocery stores), transportation, and recreation. Note the overlap between many
of these neighborhood environmental features and those discussed earlier. The neighborhood
characteristics can be elaborated utilizing some of the ideas suggested in previously reviewed
articles.
The neighborhood factors result in the second component in the model: varying
environmental demands (environmental press) and environmental assists (or environmental
buoys as they call them). Glass and Balfour extend Lawton’s work to some extent by
30

emphasizing the buoys as well as the demands of the environment thus emphasizing that
neighborhoods can be relatively healthy as well unhealthy. Examples of environmental presses
are physical barriers, social stresses and resource inadequacy, and examples of environmental
buoys are resource availability, social support, and environmental flexibility.
These factors in the environment as they are experienced by the individual are balanced
against the competencies of the individual, the third component. The resulting balance between
personal competencies and environmental press/buoy is, in turn, hypothesized to alter the
probability that adaptive or maladaptive behavioral responses (the fourth component) will be
chosen by the individual. These behavioral responses (such as physical activity versus inactivity,
social engagement versus isolation, active versus passive coping, and use of health services
versus the presence of unmet needs) are the individual’s way of coping with the environment and
are thought to directly influence the individual’s health and functioning, the final component.
They are hypothesized to be the pathways by which environments “get into the body” to affect
functioning and health.
Note that the match between environmental demands and individual competencies is the
transition point between the macro dimension of neighborhood and the micro dimension of
individual behavior and resultant well-being. This provides a possible clue about how to
conceptualize some contextual mechanisms affecting health. The model is inherently a
conditional or interaction model with the effects of the environment depending on the capacities
of the individual (except perhaps at the extremes of environmental variation). This is consistent
with some of the empirical work reviewed previously that suggests conditional effects of
neighborhood context. The model is useful in that it suggests a framework for further specifying
how neighborhoods affect health, specifically of older adults, and may provide the basis for
31
32
further conceptual elaboration. This model provides the basic conceptual framework for this
research.
3.6. CONCEPTUAL FRAMEWORK FOR THE RESEARCH
The goal of this research is to investigate the effects of the social environment of a neighborhood
on the functional health of the residents. Derived from the literature reviewed above, the
conceptual framework for the research is adapted from the model of Glass and Balfour (2003),
with elaborations of neighborhood social processes based on the sociological approaches of
Sampson and colleagues and Browning and Cagney. Since not all aspects of these theoretical
models can be addressed in this data set, the focus here will be on selected neighborhood social
characteristics and the transition from macro processes to micro processes as discussed in the
person-environment fit model. This transition can be conceptualized as a conditioning or
moderating effect, or as an interaction effect. Figure 3.1 presents the theoretical model.

Figure 3.1 Model of Neighborhood Effects on Health Status
33

The first element in the model is socioeconomic status. Glass and Balfour (2003) and
many of the other research studies discussed above identify the socioeconomic conditions of a
neighborhood as the most fundamental structural characteristic affecting all other neighborhood
characteristics and processes. SES is intimately bound up with the presence of other social
conditions leading to pockets of concentrated disadvantage and concentrated affluence both of
which have been associated with health outcomes. For this study, neighborhood SES and its
associated structural properties will be conceptualized by measures of both concentrated
disadvantage and concentrated affluence. In addition, relative neighborhood internal inequality
(as opposed to inequality between adjacent neighborhoods or areas), or the juxtaposition of poor
and affluent residents, which has also been found to be associated with negative health
consequences, will be investigated. Measures of these concepts will be discussed below.
Flowing from the socioeconomic status and structural characteristics of a neighborhood,
the figure shows social processes that provide mechanisms mediating effects on health. Three
types of neighborhood process are addressed.
a) The presence of social capital, conceptualized as the presence of social relations
among persons that facilitate collective action, an emergent property of a social organization
such as a neighborhood (Coleman, 1990). This idea of social capital is compatible with theories
of collective efficacy (Sampson, et al., 1997), the willingness of residents to activate social
capital and intervene for common goals. The presence of social capital and higher levels of
collective efficacy promote health through supporting social ties, normative control of positive
and negative health-related behaviors, development of greater levels of collective resources and
services, and the reduction of social stressors. Factors such as greater residential stability and the
34

presence of a middle class in a neighborhood have been found to be related to higher levels of
social capital. Since there are no direct measures of social capital available, these indirect
measures will be utilized as surrogates.
b) The level of social stress in a neighborhood that may itself be a health threat and has
psychological and physical health consequences for the residents. An important stressor in
neighborhoods is crime and the fear of crime. Another type of stressor is overcrowding and its
resultant health consequences.
c) The concentration of older adults in a neighborhood. This may result in improved
access to services and resources necessary for health because of the greater prevalence of people
requiring them, and may also be a marker for the presence of denser social support networks for
older adults (Balfour and Kaplan, 2003).
3.7. RESEARCH HYPOTHESES
Based on the preceding discussion, a number of hypotheses can be elaborated.
At an ecological (small area) level of analysis:
• There will be wide variation in physical disability rates across neighborhoods.
• These rates will be associated with the neighborhood social structural conditions outlined
above: neighborhood SES stats including concentrated disadvantage, concentrated
affluence, residential instability, age concentration, and social stress.
35
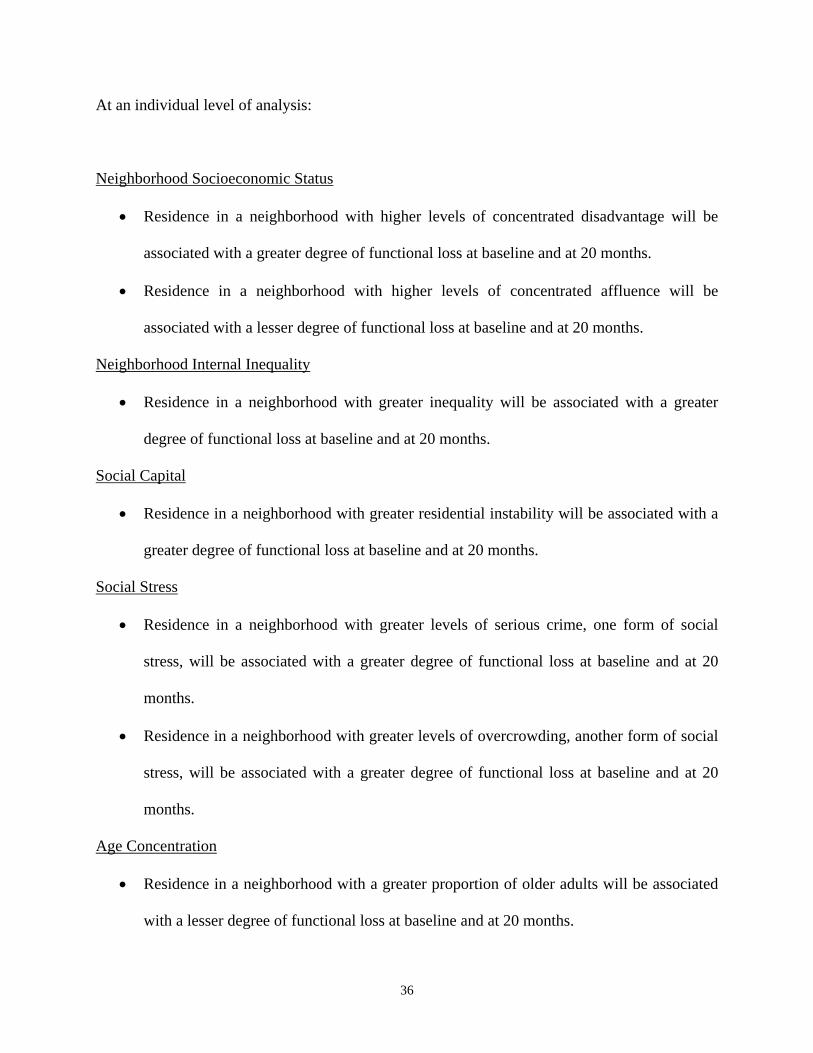
At an individual level of analysis:
Neighborhood Socioeconomic Status
• Residence in a neighborhood with higher levels of concentrated disadvantage will be
associated with a greater degree of functional loss at baseline and at 20 months.
• Residence in a neighborhood with higher levels of concentrated affluence will be
associated with a lesser degree of functional loss at baseline and at 20 months.
Neighborhood Internal Inequality
• Residence in a neighborhood with greater inequality will be associated with a greater
degree of functional loss at baseline and at 20 months.
Social Capital
• Residence in a neighborhood with greater residential instability will be associated with a
greater degree of functional loss at baseline and at 20 months.
Social Stress
• Residence in a neighborhood with greater levels of serious crime, one form of social
stress, will be associated with a greater degree of functional loss at baseline and at 20
months.
• Residence in a neighborhood with greater levels of overcrowding, another form of social
stress, will be associated with a greater degree of functional loss at baseline and at 20
months.
Age Concentration
• Residence in a neighborhood with a greater proportion of older adults will be associated
with a lesser degree of functional loss at baseline and at 20 months.
36

Conditioning and moderating effects
• All of these individual effects will be conditional on the functional health status and other
characteristics of the individuals at baseline. The effects will be greatest for those
individuals who interact with the environment the most and least for those who are least
exposed to the environment. Thus, the effects of the neighborhood environment are likely
to be greatest at 20 months for those who were not disabled at baseline, diminished for
those with mild disability at baseline, and least for those who were most disabled at
baseline.
• Effects will also be conditional on varying neighborhood conditions.
37
4. AN ECOLOGICAL STUDY OF DISABILITY IN SMALL GEOGRAPHIC AREAS
4.1. OVERVIEW
The purpose of this chapter is to ecologically examine whether disability rates among the elderly
vary across small geographically based neighborhoods, and whether this variation is related to
the socioeconomic characteristics of the neighborhoods. If there are neighborhood effects on
functional status and disability prevalence, one would expect to find this reflected in the rates of
disability across neighborhoods. Thus, the hypotheses to be tested are that there is a wide range
of disability rates by neighborhood and that the disability rates will be related to the
neighborhood characteristics discussed in the last chapter. Examining aggregate data at an
ecological level addresses these issues and provides initial evidence regarding neighborhood
effects. While observed differences in the disability rates of small geographic areas and their
correlation with neighborhood socioeconomic and social characteristics do not prove that the
neighborhood contextual environment has effects on the functional status of elderly individuals,
they are consistent with this argument. As already noted, compositional effects or the
characteristics of the individuals who live in an area may also result in differing rates of
disability. However, observed area differences are also consistent with contextual effects or the
effect of context over and above individual causes of disability, and may be considered a
necessary precondition for individual effects to be observed.
38

Balfour (1999) conducted a similar analysis using 1990 census data at the census tract
level in three counties in southern California, and found consistent differences in mobility
disability rates that were related to the socioeconomic characteristics of the tracts. This chapter
presents a similar analysis for Allegheny County, Pennsylvania, and examines both the
geographical patterning and the socioeconomic correlates of disability rates by neighborhood.
4.2. METHODS
4.2.1. DATA SOURCES
The data for the analysis is drawn from the 2000 Census of Population and Housing and from
police crime report summaries recorded in the Uniform Crime Report (UCR) reporting system
for Pennsylvania, and for the City of Pittsburgh. The analysis will be conducted at the
“neighborhood” level (i.e., combinations of census tracts) as defined in the next section.
4.2.2. DEFINITION OF THE GEOGRAPHICAL UNITS
A critical issue for all neighborhood effects research is the definition of theoretically relevant
geographical units (“neighborhoods”) for analysis. In principal, a geographical unit should be
defined which reflects the theory or mechanisms thought to affect health. For example, the
effects of polluting chemical plants may require defining large geographical units depending on
the directionality and strength of the prevailing winds, or a study of municipal resource
availability may focus on the administrative units in which such resources reside. In studying
disability and functional loss among the elderly, a relatively small unit of analysis may be
39

appropriate because of the much greater relevance of the immediate social and physical
environment, particularly since the social and physical world of the elderly person has a
tendency to narrow somewhat. In practice, however, much empirical research examining
neighborhood effects is based on administrative units because of the much more readily available
data for these areas. Thus, the convenience of data availability often trumps the theoretical
appropriateness of geographical units.
In this research, since the primary concern is the immediate neighborhood environment, a
relatively small geographical unit was desired. The first possible choice was the census tract.
There are a total of 416 census tracts in Allegheny County. The census tract is a small, relatively
permanent statistical subdivision of a county that is intended to be relatively homogeneous with
respect to population characteristics, economic status, and living conditions. Census tracts
generally vary in population size between 1500 and 8000, and have an optimum population of
about 4000 (U.S. Census Bureau, 2002). A great deal of information is available at the census
tract level versus considerably less for smaller census units (e.g., the block or block group),
which makes this an attractive choice. The drawback of census tracts is that the boundaries are
somewhat arbitrary and are not usually known or recognized by the residents. Thus social and
community processes often do not coincide with tracts.
A second possible choice for a geographical unit is a set of administrative units made up
of combinations of census tracts to coincide with administrative boundaries. The advantage of
these units is that they are recognized places with characteristics perceived by their residents,
albeit they are sometimes slightly larger than desired. People often feel that they live in these
recognized places, and certain types of social process are more likely to occur within these
identifiable boundaries. For these reasons, the analysis below will make use of a set of
40

geographical units based on combinations of census tracts that reflect administratively
meaningful boundaries and units, and the municipal structure of the County. In fact, much of the
analysis to follow was conducted at both the census tract and administrative unit level, but only
the latter results are presented since the two analyses are largely consistent, and parts of the data
are only available at the administrative unit level.
Allegheny County consists of 130 municipalities, including the City of Pittsburgh, in an
area of 730 square miles, one of the greatest concentrations of local governments in the nation.
Forty-six of these municipalities are less than one square mile in area. While the size of the
municipalities varies, most are relatively homogeneous in nature, and consist of one, two, or a
few census tracts. The City of Pittsburgh, by far the largest municipality in the County, contains
90 administratively recognized neighborhoods, each defined by a combination of a small number
of census tracts. Municipalities in the County and most city neighborhoods are widely
recognized by their residents and have separate identities, with each uniquely defined by one or
more mutually exclusive census tracts (census tracts do not overlap municipal and neighborhood
boundaries). In this document, the combination of 129 County municipalities and 90 City of
Pittsburgh neighborhoods will be referred to as a set of “neighborhoods”. This “neighborhood”
structure, consisting of 219 separate units, has been spatially captured using a Geographic
Information System (GIS). The data set for these neighborhoods was constructed by aggregating
data from census tracts.
41

4.2.3. MEASURES
4.2.3.1. MEASURES OF DISABILITY The 2000 Census included two questions on disability (questions 16 and 17 on the census long
form). These questions asked the following (U.S. Census Bureau, 2002):
Does this person have any of the following long-lasting conditions (Yes or No):
a.) Blindness, deafness, or a severe vision or hearing impairment?
b.) A condition that substantially limits one or more basic physical activities such as
walking, climbing stairs, reaching, lifting, or carrying?
Because of a physical, mental or emotional condition lasting 6 months or more, does this person
have any difficulty in doing any of the following activities (Yes or No):
a.) Learning, remembering, or concentrating?
b.) Dressing, bathing, or getting around inside the home?
c.) Going outside the home alone to shop or visit a doctor’s office (16 years or over)?
From yes responses to the parts of these two questions, census summary data is reported
for disability on six different dimensions (with the descriptive terms used by the census): sensory
disability (Q16a), physical disability (Q16b), mental disability (Q17a), self-care disability
(Q17b), going outside the home disability (Q17c), and employment disability (Q17d). The
analysis reported in this chapter focuses on the three of these that are concerned with physical
function: physical disability, self-care disability, and going outside the home disability.
42

Caslyn, et al. (2001), in a study of how well the census questions correlate with standard
measures of disability such as basic activities of daily living and instrumental activities of daily
living, equated self-care disability (as measured by the census questions) with basic activities of
daily living (BADLs), and physical disability and going outside the home disability (as measured
by the census questions) with instrumental activities of daily living (IADLs). They concluded
that the validity of the three 2000 Census disability items was moderate to good compared to a
criterion of a standard measure of disability (with Kappas of approximately 0.60), and that these
questions may be sufficiently valid for planning purposes. The three measures are similar to the
measures of individual BADL and IADL to be used in the next chapter and provide contextual
information about prevalence of BADL and IADL disability. The rates of disability are presented
as rates per 100 persons age 65 and over.
4.2.3.2. MEASURES OF NEIGHBORHOOD STRUCTURE AND PROCESS The neighborhood level variables utilized in the research were derived from the 2000 decennial
census and from crime reports, and are intended to reflect neighborhood differences in
concentrated disadvantage, concentrated affluence, residential instability, internal inequality, age
concentration and social stress. The variables are based on both a series of factor analyses of
census variables at both the tract and neighborhood level of analysis, and on conceptual
considerations. In order to parsimoniously represent neighborhood characteristics, factor analytic
techniques were used to reduce the number of variables and represent the underlying dimensions
captured by these variables. The basic approach to measurement generally follows the
procedures used by Sampson and colleagues (Sampson, et al., 1997; Sampson, et al., 1999;
Morenoff, et al., 2001).
43

The first three variables, concentrated disadvantage, concentrated affluence and
residential instability, were based on factor analysis results for 15 census variables describing
relevant aspects of the neighborhoods. The final factor analysis results for the neighborhoods are
shown in Table 4.1. The factor analysis was done in SPSS-12 and used principle components
extraction with varimax rotation in order to maximize the orthogonal nature of the factors. Scales
representing the three factors were constructed using the regression method for estimating factor
score coefficients from all the variables in the analysis. The scale values produced have a mean
Table 4.1 Factor Analysis Results
Variable
Factor Loading
Concentrated Disadvantage Percent black .876 Percent female-headed families with children .806 Percent with public assistance income .772 Percent unemployed in civilian labor force .761 Percent vacant housing units .715 Percent of households below poverty level .708 Percent of households with > 1.0 persons per room .527 Concentrated Affluence Percent middle class (% prof/mgr/tech occupations) .920 Percent with a college degree .910 Percent households with income > $50,000 .792 Residential Instability Percent not in same house as five years ago .787 Population density .769 Percent foreign-born .687 Percent renter-occupied housing units .640 Percent Hispanic .482 Principle Components Extraction with Varimax Rotation
44

of 0 and a variance equal to the squared multiple correlation between the estimated factor scores
and the true factor values. The scores from different factors may be correlated even though the
factors are orthogonal.
The first factor, labeled concentrated disadvantage, represents economic disadvantage in
economically segregated neighborhoods and is consistent with the findings of much research on
the characteristics of U.S. cities. It includes the variables percent black, percent of families
having children with a female head, percent of the population with public assistance income,
percent of the civilian labor force that is unemployed, percent of housing units that are vacant,
percent of households with income below the poverty level, and the percent of households with
more than one person per room. The percent of the population which is black is clearly not a
measure of disadvantage. However, as Morenoff, et al., (2001) point out, it is empirically
problematic to separate the percent black from the variables measuring disadvantage in this type
of analysis because of the highly segregated nature of U.S. cities, and the extreme neighborhood
disadvantage experienced by black neighborhoods. This is clearly the case in Allegheny County
and the City of Pittsburgh, based on the factor analysis results. In this analysis, therefore, the
measure of concentrated disadvantage is also a measure of the racial makeup of the
neighborhood.
Note that the concentrated disadvantage factor includes one of the two measures of
crowding included in the factor analysis, the percent of households with more than one person
per room. This variable and the population density variable were included in the factor analysis
as potential measures of one form of social stress in a neighborhood, crowding. However, since
both variables are highly correlated with other variables in the analysis and empirically didn’t
45

separate into a crowding factor, no separate crowding scale was included in the analysis reported
below.
Concentrated affluence, the second factor, includes the variables percent of employed
persons in professional, managerial, and technical occupations (intended to measure the presence
of a middle class since these occupations typically tend to be middle income and middle class in
nature), the percent of the population with a college degree, and the percent of households with
income above $50,000. This factor represents the concentration of relatively greater affluence in
a neighborhood, and is included to assess the positive health effects of the clustering of
advantage. While often found to be inversely related to concentrated disadvantage, research has
also suggested that concentrated affluence has a separate set of protective mechanisms
advantageous to health (Morenoff, et al., 2001).
The third factor, labeled residential instability, includes variables measuring whether a
person lived in a different house from five years previously (versus the same house), the
population density, the percent foreign-born, the percent of renter-occupied housing units (versus
owner-occupied), and the percent Hispanic residents. Sampson, et al. (1997) in a similar analysis
of Chicago neighborhoods found a somewhat different clustering. They found that the percent
Latino and the percent foreign-born formed a separate factor which they labeled immigrant
concentration, and the percent in the same house as five years previously and the percent owner-
occupied housing units formed a second factor they labeled residential stability. The separation
of these two factors in Chicago, versus their combination in Allegheny County, may be due to
differences in foreign-born and Hispanic residents in the two cities. In Allegheny County there
has been limited in-migration of permanent residents in recent years, with many foreign-born
residents having lived in the County for many years, and a very small percentage of Hispanic
46

residents (the principle minority in Pittsburgh is African American). However, a significant
proportion of the residential mobility that does occur tends to be among persons affiliated with
an institution of higher education (of which there are many in the County), and a significant
percentage of these persons are foreign-born. Among Metro regions in the U.S., the Pittsburgh
MSA (including Allegheny County) was ranked first in having immigrant flows with the highest
share of college graduates (Frey, 2004). Thus, in Allegheny County immigration and residential
mobility is associated to some extent with racial and ethnic diversity and higher education rather
than with poverty as in many other urban areas.
In addition to scales based on the factor analysis, three other neighborhood variables were
utilized in the analysis (see Table 4.2). Neighborhood internal inequality was measured by the
index of concentration at the extremes (ICE), developed by Massey (Massey and Denton, 1993).
This index consists of a ratio of the number of affluent households (households with income
greater than $50,000) minus the number of poor households (households below the poverty
level) divided by the total number of households. This measure ranges from -1 to +1 with -1
indicating a completely poor neighborhood and +1 a completely affluent neighborhood. Zero
indicates an equal proportion of poor and affluent families. The measure can be conceptualized
as an inequality measure that taps both ends of the economic distribution. A number near zero
suggests a neighborhood with a greater degree of (internal) equality, while a score near either
end of the scale suggests a neighborhood with more (internal) inequality. Conceptualized in this
way, the measure obviously ignores the issue of the socioeconomic status of adjoining areas and
the effects this has on perceptions of inequality. A more sophisticated spatial analysis of adjacent
areas and their indirect effects on health is required to address this issue. However, as
conceptualized the measure will address one aspect of neighborhood inequality.
47

Table 4.2 Additional Neighborhood Variable Definitions
Index of Concentration at the Extremes (ICE)
(HH with income > $50,000) – (HH below poverty level) Total households Age Concentration
Percent of population age 65+ Rate of Serious Crime
Number of UCR Part I Offenses per 1000 persons (Includes murder, manslaughter, rape, robbery, assault, burglary, larceny, motor vehicle theft, and arson)
Age concentration was measured by a single variable, the percent of the population of a
neighborhood age 65 and over. This measure is intended to tap into the effects of a concentration
of elderly on the availability of resources for the elderly as a positive factor in health.
Finally, social stress was measured by the rate of serious crime per 1000 persons within a
neighborhood. Serious crime was defined as all Part I Offenses from the Uniform Crime Report
(UCR), which includes murder, manslaughter, rape, robbery, assault, burglary, larceny, motor
vehicle theft, and arson. UCR data for 1999, 2000, and 2001 was obtained for Pittsburgh at the
census tract level from the Pittsburgh Police data system, and for municipalities (other than
Pittsburgh) in Allegheny County from the Pennsylvania State Police UCR website that maintains
the Uniform Crime Reporting System for the state (http://ucr.psp.state.pa.us/UCR/). Because of
the variability of the incidence of crime from year to year, the relatively small crime rates for
serious crime in many communities, and the limitations and variations of reporting adequacy by
48

municipality, the crime rates were averaged over three years (1999, 2000, 2001) in order to
stabilize the data and provide improved reliability. These years were chosen in order to pre-date
the individual level data to be examined in the next chapter, which was collected from mid-2001
to mid-2002, and because the greatest effect of crime as a source of social stress is most likely to
be relatively soon after its occurrence. Serious crime data was available for only 190 of the 219
neighborhoods in Allegheny County because some small or economically troubled municipalities
either did not report incident data to the (voluntary) UCR system or had no police department
and received police coverage from the state police or from other municipalities.
4.2.4. DATA ANALYSIS
The analysis first presents summary statistics for the three types of disability analyzed, including
the mean unstandardized and standardized disability rates, standard deviations and the range of
rates across neighborhoods. Then the correlations among the neighborhood measures are
examined, and finally, the relationship between disability rates and neighborhood characteristics
is examined utilizing both bivariate (ANOVA) and multivariate (OLS regressions) statistics.
49
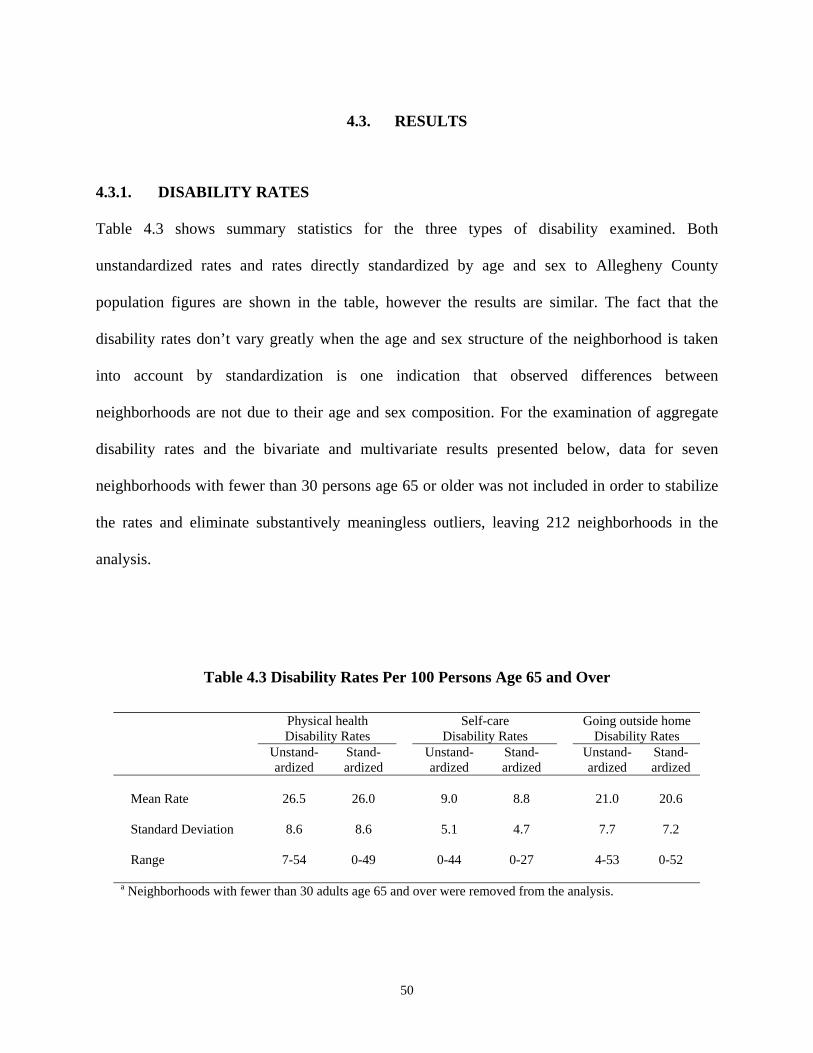
4.3. RESULTS
4.3.1. DISABILITY RATES
Table 4.3 shows summary statistics for the three types of disability examined. Both
unstandardized rates and rates directly standardized by age and sex to Allegheny County
population figures are shown in the table, however the results are similar. The fact that the
disability rates don’t vary greatly when the age and sex structure of the neighborhood is taken
into account by standardization is one indication that observed differences between
neighborhoods are not due to their age and sex composition. For the examination of aggregate
disability rates and the bivariate and multivariate results presented below, data for seven
neighborhoods with fewer than 30 persons age 65 or older was not included in order to stabilize
the rates and eliminate substantively meaningless outliers, leaving 212 neighborhoods in the
analysis.
Table 4.3 Disability Rates Per 100 Persons Age 65 and Over
Physical health Disability Rates
Self-care Disability Rates
Going outside home Disability Rates
Unstand-ardized
Stand-ardized
Unstand-ardized
Stand-ardized
Unstand-ardized
Stand-ardized
Mean Rate 26.5 26.0 9.0 8.8 21.0 20.6 Standard Deviation 8.6 8.6 5.1 4.7 7.7 7.2 Range 7-54 0-49 0-44 0-27 4-53 0-52 a Neighborhoods with fewer than 30 adults age 65 and over were removed from the analysis.
50
Table 4.3 shows that the disability rates are highest for physical health disability (mean
unstandardized rate per neighborhood of 26.5 per 100 persons age 65 and over), followed by
going outside the home disability (mean rate of 21.0). Both of these disability types were
conceptualized as instrumental activities of daily living. Rates for self-care disability,
conceptualized as the more basic activities of daily living, are lower with an unstandardized rate
of 9.0 per 100 persons age 65 and over. The range of rates over the neighborhoods for the three
measures is quite wide, ranging from almost no disability in some neighborhoods to more than
half the older population disabled. This large range indicates that there is substantial variation by
neighborhood in disability as hypothesized.
4.3.2. INTERCORRELATIONS OF NEIGHBORHOOD MEASURES
Table 4.4 shows the correlation matrix for all the neighborhood characteristics considered in the
analysis. The highest correlations are found between the index of concentration at the extremes
(ICE) and both concentrated disadvantage (-.67) and concentrated affluence (.65). This is not
surprising since the ICE index is constructed from the percent of households in poverty and the
percent of households having incomes above $50,000, both variables in the other two scales. The
ICE index also is moderately highly correlated with residential instability (-.40) and the rate of
serious crime (-.49). These relatively high correlations for the ICE measure led to
multicollinearity problems in the multivariate analysis which will be discussed below.
Concentrated disadvantage and concentrated affluence are not highly (negatively) correlated
since the scales were constructed from orthogonal factor scores. Finally, serious crime is, not
surprisingly, moderately highly correlated (.44) with concentrated disadvantage since higher
51

crime rates are one of the defining characteristics of neighborhoods with multiple social
problems and many disadvantages.
Table 4.4 Correlation Matrix for Neighborhood Characteristics
Neighborhood Characteristic CD CA ICE RI AC SC Concentrated Disadvantage (CD)
1.0
Concentrated Affluence (CA)
-.052 1.0
Index of Concentration at the Extremes (ICE)
-.673 .649 1.0
Residential Instability (RI)
-.002 -.068 -.400 1.0
Age Concentration (AC)
-.157 -.205 .025 -.243 1.0
Rate of Serious Crime (SC)
.440 -.139 -.494 .321 -.065 1.0
4.3.3. CORRELATES OF DISABILITY
Table 4.5 shows the disability rates broken out by levels of the neighborhood variables. For each
neighborhood variable, the neighborhoods were divided into three categories so that one-third of
the sample was in each, and these were labeled low, medium or high to designate level. The table
presents disability rates for each of these groups of neighborhoods, and also indicates statistically
significant differences between the rates for the groups. The pattern of results in the table is very
52

similar for both the standardized and unstandardized disability rates, and for the regression
analysis reported below, only the unstandardized rates were utilized.
Table 4.5 Disability Rates Per 100 Persons Age 65 and Over by Neighborhood Characteristics
Physical health
Disability Rates Self-care
Disability Rates Going outside home
Disability Rates Neighborhood Characteristic
Unstand-ardized
Stand-ardized
Unstand-ardized
Stand-ardized
Unstand-ardized
Stand-ardized
Concentrated Disadvantage (CD)
Low 24.5** 24.0** 8.4** 8.1** 19.9** 19.4** Medium 24.4 24.6 7.9 8.2 18.8 19.2 High 30.8 29.5 10.7 10.4 24.6 23.1 Concentrated Affluence (CA)
Low 30.6** 29.3** 10.4** 9.4+ 24.3** 22.5** Medium 28.1 27.3 9.7 9.3 22.1 21.9 High 20.7 21.3 7.1 7.7 16.7 17.2 Index of Concentration at the Extremes (ICE)
Low 33.5** 31.2** 11.5** 10.3** 26.1** 23.8** Medium 26.1 26.1 9.0 9.3 21.7 21.8 High 20.1 20.8 6.6 7.0 15.5 16.3 Residential Instability (RI)
Low 22.3** 22.6** 7.6* 7.9 18.7** 18.9* Medium 28.4 27.5 9.4 9.1 21.3 20.7 High 28.6 27.7 9.8 9.5 23.1 22.1 Age Concentration (AC)
Low 26.6 25.7 9.3 9.2 20.8 19.9 Medium 26.4 26.4 9.1 9.1 20.3 20.2 High 26.5 25.7 8.5 8.3 22.0 21.5 Rate of Serious Crimea (SC)
Low 22.5** 23.1** 7.1** 7.4** 17.9** 18.6** Medium 26.6 25.8 9.2 8.5 22.2 20.9 High 32.1 30.0 11.5 11.3 24.7 23.4 Neighborhoods with fewer than 30 adults age 65 and over were removed from the analysis. a N=190 ** p < .01; * p < .05; + p < .10; ANOVA for differences between neighborhood group mean rates.
53

Rates differed significantly across the levels of the neighborhood characteristics for all
variables except age concentration, for which no significant differences were found. For all three
types of disability, disability rates were generally highest for the neighborhoods with the highest
levels of concentrated disadvantage (although little difference was found between neighborhoods
low and medium on the disadvantage scale), lower levels of concentrated affluence, higher levels
of residential instability, and higher rates of serious crime, exactly as was hypothesized. For
groupings of the index of concentration at the extremes (ICE), conceptualized as a measure of
internal inequality, higher disability rates were found for neighborhoods low on the scale and
lower rates for those high on the scale. Neighborhoods that are low on the scale are those with a
greater proportion of households in poverty, and neighborhoods high on the scale are those with
a greater proportion of relatively wealthier households. The medium category is intended to
capture neighborhoods with greater levels of equality (and theoretically, therefore, the least
disability, controlling on wealth). Since the disability rate pattern for the ICE scale looks similar
to that of the disadvantage and affluence measures it is not clear whether this index is simply an
SES surrogate or an inequality measure, per se.
Table 4.6 presents regression results for models for all three types of disability with the
unstandardized rates as outcome and the neighborhood scale variables (rather than the
categorized variables) as predictors. This analysis examines the simultaneous effects of each
neighborhood variable while controlling for the others. In examining exploratory OLS linear
regressions which included concentrated disadvantage (CD), concentrated affluence (CA) and
the index of concentration at the extremes (ICE) as predictors, it became evident that these
variables demonstrate a high degree of multicollinearity. As noted in Table 4.3, although the CD
54
and CA variables are not highly correlated, the ICE index is highly correlated with both (-.673
with CD and .649 with CA). In regressions which included all three variables (not shown) the
variance inflation factor (VIF), a measure of the degree of multicollinearity, was quite high for
all three variables. A general rule of thumb is that VIFs larger than 10 provide evidence of
multicollinearity (Chatterjee and Price, 1991). The VIFs reported were 13.5 for CD, 9.5 for CA
and 26.8 for ICE. Thus, the conclusion can be drawn that because the operationalization of these
measures contain the same variables (the percent of households with income below the poverty
level and the percent with income above $50,000), they are too highly correlated to be used
simultaneously in multivariate models. For the remaining analysis, because of both the high
correlations with disadvantage and affluence measures, and its lack of conceptual clarity in the
analysis, the ICE index will be deemphasized. Future work with this data set should strive to
develop less correlated measures to better address the conceptualizations.
Table 4.6 presents three regression models for each type of disability. The first model
includes the CD and CA scales along with the residential instability (RI) and age concentration
(AC) measures, and the second model includes the ICE index as an alternative to the CD and CA
scales. The third model adds the rate of serious crime (SC) to the variables included in the first
model since the sample of neighborhoods is smaller for this measure. It was not included in all
models in order not to limit the sample size. Despite the data limitations, the regression results
were fairly consistent. The table shows that the strongest and most consistent significant
predictors of disability were the concentrated disadvantage scale (CD) and the concentrated
affluence scale (CA), which were both significantly related to all three types of disability. The
index of concentration at the extremes was also consistently significantly related to the disability
rates, but as noted its interpretation is less clear. The residential instability measure (RI) was also
55

56
significantly related to physical health disability and going outside the home disability. Age
concentration and the rate of serious crime were not significantly related to the disability rates.

57
Neighborhood
Physical health Disability Rates
Self-careDisability Rates
Going outside home Disability Rates
Variable Model 1 Model 2 Model 3a Model 1 Model 2 Model 3 a Model 1 Model 2 Model 3 a
CD
.420** - .380** .274** - .216** .411** - .394**CA -.486**
- -.475**
-.273**
- -.281**
-.431**
- -.425**
ICE - -.674** - - -.431** - - -.663** -RI .154** -.085 .098 .083 -.075 .035 .123* -.118+ .095AC .033 .025 .031 -.023
-.038 -.069 .050
.032 .007
SC - - .091 - - .070 - - .026
Adj. R2 .458 .408 .446 .152
.155 .143 .386
.384 .365 Table shows Standardized Regression Coefficientsa N=186 ** p < .01; * p < .05; + p < .10
Table 4.6 Regression Results for Unstandardized Disability Rates

4.3.4. GEOGRAPHICAL CLUSTERING OF DISABILITY
In order to graphically illustrate the variation in disability rates by neighborhood, Figures 4.1 to
4.3 show maps of the density of disability for neighborhoods in Allegheny County for the three
outcome measures: physical health disability, self-care disability, and going outside the home
disability, respectively. These maps illustrate that, for the most part, the highest rates of disability
are in neighborhoods within the City of Pittsburgh and along the three rivers in the old mill
towns. Figures 4.4 and Figure 4.5 show the level of concentrated disadvantage and concentrated
affluence in Allegheny County neighborhoods. These maps illustrate that many of the areas with
concentrated disadvantage are also those with the highest disability rates for the elderly, and the
areas of concentrated affluence are generally not areas with high disability rates.
4.4. CONCLUSIONS
The analysis in this chapter addresses hypotheses concerning ecological variation in disability
rates, and the relationship of these rates to neighborhood social characteristics. The analysis
confirms the hypotheses that disability of the types examined here does differ widely by
neighborhood, and that neighborhood characteristics, primarily the socioeconomic variables of
concentrated disadvantage and concentrated wealth, and the residential instability index are
strongly related to disability rates. The strongest relationship with neighborhood characteristics is
found for the instrumental activities of daily living (physical health and going outside the home
disabilities) and weaker relationships for the basic activities of daily living measure of self-care
activities. This indicates that activities of daily living that involve mobility and more complex
activities interacting with the environment appear to be more affected by neighborhood
58

59
characteristics than are activities that are more basic and likely to be present in older adults who
are more housebound and thus interacting with the environment less. These conclusions lend
support to the idea that the social characteristics of neighborhoods affect disability, but may
simply reflect the concentration in certain neighborhoods of people with more disability
(compositional effects). The next chapter will more directly address the question of
neighborhood effects on individual outcomes net of individual characteristics (contextual
effects).

Physical Health Disability (per 100)0.00 - 13.8413.85 - 22.8322.84 - 29.8229.83 - 38.3338.34 - 53.57
Figure 4.1 Physical Health Disability Rates for Allegheny County Neighborhoods
60

Self-Care Disability (per 100)0.00 - 4.774.78 - 8.868.87 - 14.2914.30 - 26.2826.29 - 50.00
Figure 4.2 Self-Care Disability Rates for Allegheny County Neighborhoods
61

Going Outside the Home Disability (per 100)0.00 - 13.5013.51 - 21.2221.23 - 27.9127.92 - 37.1137.12 - 53.02
Figure 4.3 Going Outside the Home Disability for Allegheny County Neighborhoods
62

Concentrated DisadvantageLowest
Highest
Figure 4.4 Level of Concentrated Disadvantage for Allegheny County Neighborhoods
63

Concentrated AffluenceLowest
Highest
Figure 4.5 Level of Concentrated Advantage for Allegheny County Neighborhoods
64

5. A CONTEXTUAL STUDY OF FUNCTIONAL AND DISABILITY OUTCOMES
5.1. OVERVIEW
This chapter reports on an analysis of individual disability and functional outcomes in the
context of neighborhood characteristics. Briefly stated, the overarching hypotheses of the chapter
is that neighborhood social conditions will be found to affect the functional health of individuals
after controlling on individual correlates of disability and functional loss. Confirmation of this
hypothesis would indicate that neighborhood influences are not merely compositional in nature
but also reflect the effects of neighborhood characteristics, per se. The analysis is performed as
both a cross-sectional analysis of the prevalence of functional limitations, and as a longitudinal
analysis to address the onset of disability and the progression of existing disability.
5.2. METHODS
5.2.1. DATA SOURCES
The analysis utilizes both individual data and neighborhood data. Individual level data is taken
from a National Institute on Aging funded research project entitled “Process of Self-Care:
Comparison of African Americans and Whites” which examines self-care for chronic disease
among a cohort of older adults with osteoarthritis or heart disease. The neighborhood level data
65
is the same set of variable utilized in Chapter 4, and is drawn from census data and crime reports.
This section describes the “Self-Care” study.
The Self-Care study is a four-year longitudinal study aimed at observing and describing
the process of self-care for chronic disease among community dwelling older adults in Allegheny
County, Pennsylvania. For two widely prevalent chronic diseases, ischemic heart disease (HD)
and osteoarthritis of the hip or knee (OA), the study is examining the adoption, maintenance and
change of self-care behaviors, and the effects of these behaviors on individuals’ assessment of
their illness care and their health-related quality of life. The study is also examining differences
in these processes and effects between African Americans and Whites.
Participants were recruited to the study through a population recruitment survey, and
since enrolled have been interviewed four times at approximately 10-month intervals: three in-
home, in-person interviews and one telephone interview at time 4. The data from this study
provides a variety of demographic, contextual, and health status information for a sample of
1127 older adults, including measures of disability and functional status. For the research
described here, data will be utilized from the recruitment survey, the baseline interview (carried
out within 1-2 weeks of the recruitment interview), and the time 3 interview (carried out at
approximately 20 months). At time 3, attrition had reduced the sample to 959 participants, and
longitudinal analyses of change will be limited to this group.
The sample for the population recruitment survey was randomly drawn from individuals
65 and over who were included in the Medicare Enrollment File for Allegheny County in April
2001, and the recruitment survey and baseline interviews took place between June 2001 and June
2002. The Medicare Enrollment File includes 96% or more of adults age 65 and over nationally
and thus is broadly representative of all older adults. Persons residing in nursing homes or other
66

dependent living situations were excluded. The survey was stratified by race and gender in order
to ensure adequate samples of African Americans and both men and women (since African
Americans are the primary minority group in Allegheny County, very few other minorities were
included). Thus, roughly similar numbers of men and women, and African American and non-
African American participants were recruited in the longitudinal study, and an attempt was made
to balance the sample sizes of the two diseases as well. This cohort provides a sufficient sample
size to investigate gender, race, and disease differences in neighborhood effects.
Since the Medicare Enrollment File contains only an address, telephone numbers for
potential participants were obtained before the recruitment survey from a commercial sampling
firm. Approximately one-third of the original sample was excluded at this stage because no
telephone number was available. This is a limitation of the data since not all older adults in the
County had an opportunity to be chosen for the survey. Those excluded were primarily
individuals with unlisted telephones and those with no telephones. Demographic comparison of
the older adult population and the interviewed sample indicates that the differences were
relatively small, thus the sample is still fairly representative of the older adult population of the
county with one of the two diseases. The response rate for the recruitment survey was 40%.
Table 5.1 provides a basic demographic and health status description of the participants at
baseline by the index disease for the study (either heart disease or osteoarthritis). The study
participants were, as a group, relatively frail, and the osteoarthritis participants were
disproportionately female, African American, younger and were less likely to be married. There
were no significant income or education differences in the two groups and they had similar
numbers of chronic conditions, overall. However, those with osteoarthritis had significantly
worse functional health, as would be expected since osteoarthritis is a disease of daily
67

debilitating symptoms and functional loss. Functional status is reported at baseline and at 20
months, and the measures of function will be discussed in the next section.
The addresses of individuals in the Self-Care study sample were “geocoded” for location
by the census tract in which their address is located. Since neighborhoods are constituted of
combinations of census tracts, the neighborhood of all participants in the study is known. Thus,
using geocoded addresses, neighborhood level data can be linked to the survey data for
contextual analysis.
68

Table 5.1 Baseline Demographic and Health Characteristics of Self-Care Study Sample By Study Index Disease
Heart
Disease Osteo- arthritis
(N=577) (N=550) p % Female 42.5 61.1 <.001 % African American 41.4 51.5 <.001 Age Mean Age (years) 74.8 73.4 <.001 % Age 65 – 74 53.9 63.3 .001 % Age 75+ 46.1 36.7 % Married 58.6 50.0 .002 Income % < $10,000 13.1 15.9 NS % $10,000-$19,999 25.9 29.3 % $20,000-$34,999 40.2 34.7 % $35,000-$49,999 10.3 9.5 % $50,000+ 10.5 10.5 Education Mean Years of Education 12.6 12.7 NS % Less than H.S. 20.9 20.4 NS % High School 34.4 36.0 % Some College/Vocat. 28.7 28.4 % Bach. Degree or higher 16.0 15.3 Chronic Conditions Mean # chronic conditions 5.3 5.1 NS Functional Status at Baseline Mean # BADL Impairment (0-6) 0.8 1.7 <.001 Mean # IADL Impairment (0-6) 0.7 1.1 <.001 % No Disability 41.8 15.1 <.001 % Mild Disability 13.0 6.5 % Moderate/Severe Disability 45.2 78.4 Mean SF-36 Physical Function Scale 43.7 35.1 <.001 Mean SF-12 Physical Function Scale 43.3 37.0 <.001 Functional Status at 20 mos. (N=959) Mean # BADL Impairment (0-6) 0.9 1.7 <.001 Mean # IADL Impairment (0-6) 0.9 1.5 <.001 % No Disability 35.8 12.1 <.001 % Mild Disability 17.6 9.2 % Moderate/Severe Disability 46.7 78.8 Mean SF-12 Physical Function Scale 42.8 37.2 <.001
69
5.2.2. MEASURES
5.2.2.1. INDIVIDUAL LEVEL VARIABLES The outcome measures for the research consist of the prevalence of functional limitations in a
cross-sectional analysis of disability at baseline, and change in functional status and disability by
the third wave of interviews. As discussed earlier, functional status and disability, related
concepts, are usually measured in non-clinical settings by self-report scales of basic and
instrumental activities of daily living, and these will be the main outcome measures used here.
The measure of basic activities of daily living (BADL) consists of self-reported difficulty in
completing six basic activities necessary to successful daily functioning (bathing or showering,
dressing, using the toilet, getting in and out of a bed or chair, eating and walking). Participants
were asked if they had difficulty completing each of these tasks, and if so how much difficulty.
Similar questions were asked about tasks of instrumental activities of daily living (IADL), which
address the higher level of activities necessary to role functioning in every day life (preparing
meals, shopping, managing money, using the telephone, doing heavy housework, doing light
housework, and getting to the doctor’s office). These two sets of activities are somewhat parallel
to the activities asked about in the census and described earlier. A scale calculated as a count of
the number of activities with reported difficulty was constructed to measure overall disability for
both BADL and IADL, and will be the primary outcome variables.
In addition to counts of difficulties in BADLs and IADLs, a combined disability scale
was constructed to reflect overall disability. In line with other studies of functional limitations,
those participants with neither BADL nor IADL limitations were classified as not disabled, those
with either one BADL and/or only IADL limitations were classified as mildly disabled, and
those with two or more BADLs were classified as moderately to severely disabled. Finally, the
70

physical functioning subscales of the SF-36 and SF-12 health quality of life scales were also
included in the analysis in order to have an alternative physical function measure. The SF-36 and
SF-12 scales are widely used and well validated, and the physical functioning subscales address
basic functional activities such as vigorous and moderate activities, and mobility. The subscales
have a range from 0 to 100, with a higher score indicating better physical function. At baseline
the SF-36 (version 2) scale was administered, and at 20 months the SF-12 (version 2) scale was
used. Since the SF-12 questions are a direct subset of the SF-36 questions it was also possible to
calculate an SF-12 score at baseline for comparability.
In addition to functional health outcomes, other individual level variables will be used in
the analysis to control for other (individual level) competing explanations of functional status
prevalence and change. These include the variables in Table 5.1: gender, race, age, marital status,
individual socioeconomic status (income or education), and number of comorbid chronic
conditions (measured as a count of conditions). Because of a significant amount of missing data,
only education was included in the analysis to measure SES. In addition, because of the obvious
importance of the index disease in the study (heart disease or osteoarthritis) in predicting
function levels, a dummy variable indicating whether the participant was brought into the study
for heart disease (0) or osteoarthritis (1) was included in all analyses.
Since the primary purpose of the analysis is to assess the effects of neighborhood social
conditions on functional health in a somewhat exploratory way, a relatively small set of
individual characteristics is included. Clearly there are other individual risk factors for disability
and functional loss which might be considered. However, as pointed out earlier, some of these
factors may, in fact, be mediators of neighborhood effects as opposed to competing explanations.
Therefore, the immediate goal is to identify (if possible) the presence of neighborhood effects on
71

individual outcomes that can be further investigated later to determine the causal paths by which
they act. Many individual variables may also act as moderators of the effects of neighborhood
environments on health.
5.2.2.2. NEIGHBORHOOD LEVEL VARIABLES The neighborhood level variables to be utilized in the analysis are derived from census data and
crime data, and are as described in Chapter 4. Based on the results of that analysis, the
neighborhood variables to be included are first, concentrated disadvantage and concentrated
affluence as indicators of socioeconomic conditions and, as an alternative to these two measures,
the index of concentration at the extremes (ICE). The ICE index, intended to be a measure of
internal inequality is highly correlated with the other two SES measures as discussed earlier and
can not be included in the same multivariate analyses as the others due to significant
muliticollinearity. In addition to these measures of socioeconomic conditions, residential
instability as an indirect indicator of the lack of formation of social capital, age concentration as
an indicator of the presence of larger numbers of older adults and the potentially resulting
positive resource and attitude effects, and the rate of serious crime as a measure of social stress
will be included in the analysis.
5.2.3. DATA ANALYSIS
The data analysis reported here is a multivariate analysis of neighborhood effects on individual
outcomes controlling for individual characteristics. This is inherently a two-level analysis. The
most appropriate statistical approach for analyzing data that has two levels of organization (i.e.,
individual and neighborhood) is multi-level statistical analysis (Raudenbush and Bryk, 2002;
72

Snijders and Bosker, 1999). This technique takes into account the clustered nature of individuals
in a sample (they live in the same neighborhood and are thus subject to the same neighborhood
influences), and allows the researcher to investigate both neighborhood effects and individual
effects within context on individual health. However, multi-level analytic techniques have
relatively stringent sample size requirements in order to provide sufficient power for an analysis.
Depending on the total number of neighborhoods and the types of causal processes specified, the
number of individuals required to meet the assumptions of the statistical analysis generally is at
least 10 individuals per neighborhood, and often many more are required. Although different
multi-level designs may have different sample size requirements, 10 appears to be a minimum.
For this research the sample size requirement of multi-level analysis is problematic.
Given the neighborhood definitions described above, the sample of individuals in many
neighborhoods is very small, and in many cases consists of only one, two or three individuals. In
total, 171 neighborhoods from the 219 in Allegheny County are represented in the individual
level data. The number of individuals per neighborhood ranges from 1 to 65 with a mean of 6.6
and a median of 4, clearly not sufficient for multi-level analysis. At least two remedies for this
situation are possible: either aggregate neighborhoods to achieve a larger sample size in each, or
utilize alternative statistical techniques which address contextual questions but in a slightly
different fashion than multi-level analysis. The first of these alternatives may not a satisfactory
solution for this research because neighborhoods as defined here are already quite large and
somewhat heterogeneous in some cases. Combining them will potentially increase the level of
heterogeneity considerably and diminish any neighborhood effects.
As an alternative for this analysis, the clustering of individuals within neighborhood will
be accounted for through the use of robust variance estimation as implemented in Stata/SE 8.0
73

for Windows. In ordinary least squares regression, standard errors are calculated under the
assumption that the information for each observation (i.e., individual) is independent from any
other. For individuals in the same neighborhood, this assumption is clearly not warranted since
they share neighborhood characteristics. Robust variance estimation is a technique which
provides an alternative calculation of standard errors in multivariate models and makes fewer
strong assumptions about the underlying statistical models used. The advantage of this technique
is that it can take into account the clustering of the individual data by neighborhood and thus
calculate more accurate standard errors and significance tests. While it is not as powerful or
flexible as multi-level analysis, it does provide accurate estimates for the purposes of this
analysis. Multivariate analyses include OLS regression for cross-sectional prevalence,
residualized OLS regressions to investigate change, and logistic regressions to investigate change
in disability level. All multivariate analyses were performed using Stata/SE 8.0 for Windows
which implements the robust variance estimation analysis.
5.3. RESULTS
5.3.1. CROSS-SECTIONAL ANALYSIS OF PREVALENCE
Table 5.2 presents regression results for a series of models in a cross-sectional investigation of
the prevalence of functional limitations in the sample at baseline. Four models are shown for
both BADL and IADL limitations. The first model predicts number of functional limitations
based on individual level factors alone. For both BADL and IADL, it is clear that the two health
measures included, number of chronic conditions and the presence of osteoarthritis, are the
strongest predictors of a greater number of limitations. This is as expected, since health status is
74

the primary determinant of function. For BADL, marital status is also marginally related to more
limitations with marriage providing a protective effect (p < .10). For IADL, the more complex
activities, females and older participants were more likely to report a greater number of
limitations, but marriage did not provide a protective effect. This pattern of individual results
held across most of the models in the table. Note that model 1 for both outcomes explains about
20% of the variance in functional limitations, with an R2 of about .2.
The first point to note about the remaining models (models 1 to 3) which include
neighborhood variables in addition to individual characteristics is that the R2 in each is almost
identical to that of model 1. This indicates that neighborhood characteristics, as measured here,
explain no or almost no variance in the BADL and IADL measures. Model 2 introduces
concentrated disadvantage, concentrated affluence, residential instability, and age concentration
into the equation. Model three includes the ICE index as an alternative to disadvantage and
affluence. Finally, model 4 includes the serious crime rate in addition to the variables in model 2
because of the smaller number of neighborhoods with data on this measure. In all of these
models, no neighborhood characteristics are statistically significant in predicting BADL and
IADL difficulties.
5.3.2. LONGITUDINAL ANALYSIS OF CHANGE
While cross-sectional prevalence rates are not related to neighborhood conditions in this data set,
it is possible that worsening/improvement in levels of BADL and IADL disability may be more
sensitive to immediate neighborhood conditions. Thus, the second analysis looked for change in
functional limitations as a result of neighborhood conditions while controlling for individual
characteristics. For this analysis, counts of BADL and IADL at 20 months were used as outcome
75

76
variables for the subset of participants still in the study at that time (N=959), and baseline BADL
and IADL levels were controlled (residualized regressions). The same set of individual and
neighborhood characteristics at baseline, were again included as predictors. The results of these
regressions are presented in Table 5.3.
Again four models are presented for BADL and IADL. Note that the R2 for these
relatively short-term change models is higher than for the prevalence models presented in the last
section (.36 for BADL and .41 for IADL). This indicates, not surprisingly, that current (baseline)
individual and neighborhood characteristics are much more likely to predict recent events than
they are to predict longer term outcomes. Individual characteristics predicting increases in
BADL (in addition to baseline limitations) include older age and the two health variable, number
of chronic conditions and presence of osteoarthritis. For IADL, in addition to the two health
measures (and baseline limitations), those who are married are significantly less likely and
African Americans are significantly more likely to have increased limitations at 20 months.

Table 5.2 Cross-sectional Regression Results with Robust Variance Estimation for Clustered Data for Basic Activities of Daily Living and Instrumental Activities of Daily Living
# Basic Activities of Daily Living (N=1125) # Instrumental Activities of Daily Living (N=1125) Model 1 Model 2 Model 3 Model 4a Model 1 Model 2 Model 3 Model 4 a Individual Variables
Female .081 .075 .077 .091 .402** .399** .401** .426**African American -.049 .029 -.003 .017 .037 .068 .044 .039 Age -.00001 -.0003 -.0003 .0002 .024** .024** .024** .023**
Married -.157+ -.163+ -.161+ -.136 .048 .046 .048 .056Education .009 .008 .007 .002 -.010 -.010 -.011 -.010 # Chronic conditions .185** .185** .186** .183** .165** .165** .165** .166** Osteoarthritis .926** .929** .928** .918** .459** .460**
.459** .439**
Neighborhood Variables Concentrated Disadvantage - -.061 - -.064 - -.028 - -.016 Concentrated Affluence - -.015 - -.003 - -.022 - -.012 ICE Index - - .151 - - - .020 - Residential Instability - .017 .040 .018 - .003 .010 .009 Age Concentration - -.005 -.001 -.004 - -.004 -.002 -.001 Serious Crime - - - .0003 - - - -.00002 Constant -.199 -.096 -.166 -.053 -2.114**
-2.056**
-2.082**
-2.027**
R2 .202 .203 .202 .198 .204
.204 .204 .202
Table shows unstandardized regression coefficients a N=1064 ** p < .01; * p < .05; + p < .10
77

Table 5.3 Residualized Regression Results with Robust Variance Estimation for Clustered Data for Basic Activities of Daily Living and Instrumental Activities of Daily Living Disability at 20 Months
78
# Basic Activities of Daily Living (N=956) # Instrumental Activities of Daily Living (N=956) Model 1 Model 2 Model 3 Model 4 a Model 1 Model 2 Model 3 Model 4 a Individual Variables
# BADLs/IADLs at baseline
.524** .521** .523** .519** .622**
.620** .621** .621**Female .102 .096 .100 .103 .032 .028 .030 .045African American
.052 .164+ .110 .162+ .214** .309** .278** .303**
Age .023** .023** .023** .022** .003 .003 ,003 .0002Married -.107 -.126 -.129 -.128 -.186**
-.204** -.201** -.191**
Education .008 .006 .005 .008 .011 .008 .008 .014# Chronic conditions
.065** .066** .066** .066** .094** .095** .095** .098**
Osteoarthritis
.415** .422** .419** .429** .180**
.181* .179* .157*
Neighborhood Variables Concentrated Disadvantage - -.082+ - -.104* - -.068 - -.068Concentrated Affluence
- .007 - -.013 - .020 - .017
ICE Index - - .195 - - - .226 -Residential Instability
- -.005 .023 -.017 - -.009 .019 -.011
Age Concentration - -.003 .0004 -.005 - .008 .011 .004Serious Crime
- - - .0006** - - - .0002
Constant
-1.681** -1.611** -1.694** -1.549** -.298
-.405 -.485 -.211
R2 .363 .365 .364 .362 .409
.412 .411 .413
Table shows unstandardized regression coefficients
a N=904 ** p < .01; * p < .05; + p < .10

79
Examining the neighborhood variables next, no neighborhood characteristics were
associated with IADL change, but significant relationships were found for BADL change.
Concentrated disadvantage was found to be significantly related to number of BADLs at 20
months in model 4 and marginally related in model 2 (p < .10). However, the relationship is the
opposite of that hypothesized, with individuals living in areas with more concentrated
disadvantage exhibiting less increase in BADL limitations. In addition, in model 4, those living
in neighborhoods with higher serious crime rates were much more likely to exhibit increases in
the number of BADL limitations. This finding is as hypothesized.
5.3.3. LONGITUDINAL ANALYSIS OF DISABILITY ONSET
In addition to examining the whole sample for change in function, and in order to test the
hypothesized conditional effects of neighborhood characteristics, the analysis also examined the
incident onset or worsening of disability among subsets of the participants. The original
hypothesis outlined earlier postulated that the effects of neighborhoods on function may differ by
the capabilities of the individual. That is, for example, persons who interact with the
environment more may be more susceptible to its characteristics, in comparison with those who
interact with it less. Thus, among those who had no disability at baseline, and who presumably
were more able to interact with the environment, the effects of the environment would be
expected to be greater, while among those with some impairment, it would be less. In order to
examine this hypothesis, Table 5.4 presents logistic regression results for either the onset of
disability or the worsening of disability for those with mild impairment at baseline.

80
Table 5.4 Logistic Regression Results with Robust Variance Estimation for Clustered Data for Onset or Worsening of Disability at 20 Months
Onset of Disability by 20 months
(No Disability at baseline) Worsening of Disability by 20 months
(Mild Disability at baseline) Model 1 Model 2 Model 1 Model 2
OddsRatio
95% CI
OddsRatio
95% CI
OddsRatio
95% CI
OddsRatio
95% CI
Individual Variables Female 1.705+ (.958-3.035) 1.664
(.894-3.096) .657 (.175-2.469) .616 (.161-2.359)African American .837 (.411-1.701) .984 (.477-2.031) 1.767 (.404-7.230) 1.610 (.371-6.996) Age 1.018 (.971-1.066) 1.004 (.957-1.053) (.969-1.126)1.045 1.046 (.966-1.132)Married .850 (.447-1.616) .877 (.444-1.736) 1.173 (.386-3.567) 1.242 (.416-3.714)Education .996 (.910-1.091) .997 (.906-1.096) .971 (.821-1.148) .990 (.836-1.174)# Chronic conditions 1.190* (1.034-1.369) 1.168* (1.009-1.353) 1.277 (.936-1.741) 1.309+ (.971-1.765) Osteoarthritis 2.257** (1.267-4.021)
2.208**
(1.227-3.973)
5.220**
(1.954-13.944)
5.251**
(1.957-14.090)
Neighborhood Variables Concentrated Disadvantage 1.159 (.815-1.648) 1.012 (.621-1.651) .813 (.430-1.538) .565 (.240-1.331) Concentrated Affluence 1.038 (.720-1.497) 1.042 (.721-1.506) 1.305 (.548-3.107) 1.482 (.638-3.446) Residential Instability 1.148 (.868-1.519) 1.088 (.783-1.514) .864 (.462-1.615) .662 (.343-1.279) Age Concentration 1.027 (.961-1.098) 1.006 (.939-1.077) 1.057 (.920-1.214) 1.049 (.927-1.186) Serious Crime - - 1.004
(.991-1.016)
-
- 1.020
(.993-1.048)
N 292 276
89
88
** p < .01; * p < .05; + p < .10
The table presents results from two logistic regression models for each group of
individuals, those with no disability at baseline and those with mild disability at baseline. The
outcome was either onset of disability for those with no existing disability, or the worsening of
disability for those with mild impairments. The first model includes individual variables and the
same neighborhood variables included in the basic models in the previous two tables,
disadvantage, affluence, residential stability, and age concentration. The second model
introduces the rate of serious crime and therefore has a lower sample size.
In this analysis, fewer significant results were found in general. The two individual level
health variables were again the strongest predictors, although the presence of osteoarthritis was
the best predictor of both disability incident onset and disability worsening. No neighborhood
variables were found to be significantly related to either outcome in any of the models. Thus no
effect of neighborhood characteristics on the onset or worsening of disability was found at the
neighborhood level of analysis for either group.1
5.3.4. ANALYSIS OF OTHER FUNCTIONAL OUTCOMES
The analysis thus far has relied on the BADL and IADL activity limitation questions as measures
of functional loss and disability. In order to examine whether a different and perhaps more
sensitive measure of physical function would give different results, an analysis was also carried
out with the SF-36 and SF-12 physical function subscales. Table 5.5 presents these results. First,
1 The analysis was also carried out at the census tract level and for that geographic unit there was some indication that concentrated disadvantage was marginally positively related to onset of disability (results not shown), with marginally significant results for BADL onset and significant results predicting worsening in either BADL or IADL. This census tract analysis is still only suggestive at this point, and further work must be done before the results are conclusive. The results are mentioned here in order to point out some evidence that the effects of neighborhoods on individual function are likely to be conditional on the size and characteristics of the geographic unit of analysis as discussed earlier., and may require more nuanced investigation to identify effects.
81

a cross-sectional regression predicting the score on the SF-36 physical function subscale at
baseline was performed to investigate prevalence. This measure was used (as opposed to the SF-
12 subscale) since the SF-36 questions concerning physical function are more numerous and
more detailed. They also contain more detailed questions on mobility and lower extremity
limitations (e.g., climbing one or several flights of stairs, walking one hundred or several
hundred yards, or walking more than a mile), and thus might be considered more sensitive to
activities involved with interaction with the environment. (It should be noted however, that the
SF-36 and SF-12 physical function subscales at baseline are highly correlated (r = .83). Second,
change in the physical function subscale of the SF-12 at 20 months was also examined for
relationships with neighborhood variables. Since only the SF-12 measure was available at 20
months, this measure was used for comparability.
Table 5.5 indicates that neighborhood variables are somewhat more likely to be related to
the SF measures than to the BADL and IADL measures, particularly for change at 20 months.
For the cross-sectional analysis using the SF-36 physical function scale as the outcome,
participants who lived in neighborhoods with higher rates of serious crime were more likely to
have a lower level of physical functioning, as hypothesized. When examining change in physical
functioning at 20 months, residents in both areas with concentrated disadvantage and
concentrated affluence were more likely to have improved physical function. While affluence
was hypothesized to have a protective effect, disadvantage was hypothesized to have a
deleterious effect on physical function, and this is contrary to the hypothesis. However, this
result is consistent with the results
82

Table 5.5 Regression Results for SF-36 and SF-12 Physical Function Subscales
SF-36 Physical Function
Subscale at Baseline
Change in SF-12 Physical Function
Subscale at 20 months
(N=1064) (N=903) Individual Variables Baseline scale score - .541** Female -3.200** -1.107 African American -3.964** -1.559* Age -.122+ -.066 Married 1.437+ .828 Education .033 -.279* # Chronic conditions -1.787** -.833** Osteoarthritis -7.762** -1.390* Neighborhood Variables Concentrated Disadvantage .452 .860* Concentrated Affluence .452 .808* Residential Instability -.043 -.476 Age Concentration -.053 .017 Serious Crime -.008** -.003+ Constant 65.2** 31.5** R2 .277 .463 ** p < .01; * p < .05; + p < .10
for the analysis of change in BADL, where disadvantage also had a protective effect. In addition,
persons who lived in neighborhoods with higher crime rates were more likely to have worse
physical function at 20 months.
83

5.4. CONCLUSIONS
Although some indications of neighborhood effects on individual outcomes have been observed
in the preceding analysis, on the whole the results have been somewhat weak and not entirely
consistent. When neighborhood effects were present, they explained very little of the variance in
functional status. No significant effects of neighborhood variables were found for the cross-
sectional analysis of the prevalence of disability, and none were found for the analysis of the
onset or worsening of disability over time among selected subsets of the sample (those without
disability at baseline and those with mild disability, respectively). The principal significant
findings were, first, for change over time in the entire sample, and indicated that serious crime
rates in a neighborhood are associated with worsening of function over time, a confirmation of
the hypothesis with respect to the social stress of crime. Second, both concentrated disadvantage
and concentrated affluence provide protective effects against worsening of physical function
over time. The finding with regard to affluence is consistent with the initial hypothesis, but the
finding with regard to disadvantage requires further investigation and clarification since it is
contrary to the initial hypothesis.
To some degree the findings were contingent on which variables were included in the
models (results varied when different combinations of neighborhood variables were included –
results not shown), and significantly high correlations among some neighborhood variables led
to possible collinearity problems in the analysis. Thus, ill-conditioned data may be contributing
to some inconsistency in the findings. The significant findings for the SF-36 and SF-12 perhaps
indicate that more sensitive measures of function and disability than the BADL and IADL
activity questions may be more responsive to the neighborhood environment.
84

6. SUMMARY AND DISCUSSION
This research has investigated the role of neighborhood social characteristics on functional health
and the onset of disability. The overall conclusions are, first, that at an ecological level of
analysis, disability rates vary greatly and are clearly patterned across neighborhoods. Second,
disability rates in a neighborhood are strongly related to the neighborhood socioeconomic
conditions. These results confirm the hypotheses set out at the outset at an ecological level of
analysis. This provides evidence of (or at least is consistent with) potential neighborhood effects
on individual functional outcomes independent of individual factors, but it does not conclusively
demonstrate neighborhood effects since this finding may be due to the characteristics of the
individuals who live in the neighborhood (composition).
The second set of conclusions concerns the contextual analysis which attempted to
address this question. This analysis examined individual function and disability outcomes
utilizing neighborhood characteristics as predictor variables and controlling on individual
characteristics. Neighborhood concentrated disadvantage, internal inequality, residential
instability as a measure of the potential for social capital, and serious crime rates as a measure of
social stress were all hypothesized to be associated with more disability, and neighborhood
concentrated affluence and the age concentration of those age 65 and older were hypothesized to
be protective in nature, leading to lower rates of disability.
The overall conclusions from this analysis are that some effects of neighborhood social
environments on functional status are present, but are weak relative to individual risk factors. In
85

the cross-sectional analysis of the prevalence of disability at baseline, no significant
neighborhood effects were found in this sample. Similarly, in the analysis of disability onset or
worsening among appropriate subsets of the sample, again no significant effects were found. For
these analyses, the initial hypotheses were not confirmed.
However, significant neighborhood effects were found for change in function for the
whole sample over a period of 20 months. This analysis indicated that, as hypothesized,
neighborhoods with higher rates of serious crime were associated with declines in function, and,
conversely, that neighborhoods with both more concentrated social and economic disadvantages
as well as those with more concentrated affluence were associated with some improvement in
function. The association of affluence with improvement in function was hypothesized, but the
association of disadvantage with improvement requires further clarification and investigation
since it is contrary to the hypothesis. It is possible that residents of areas with greater social and
economic disadvantages, because they may have fewer resources, may be more likely to
maintain function for as long as possible - they may have no other choice. Additionally, they
may be less willing to self-report disability; in fact, they perceive themselves as managing to
function because they must. Finally, the hypotheses with regard to inequality, residential
instability and age concentration were not confirmed.
Most of the analysis utilized BADL and IADL measures of function. When different
measures of physical function, the SF-36 and SF-12 measures (which are more sensitive to
mobility and lower extremity function), were employed stronger longitudinal effects of
neighborhoods were found. This suggests that more sensitive measures of disability and function
than the BADL and IADL measures may be required to detect strong neighborhood effects. The
measures of both neighborhoods (to some extent due to collinearity), but particularly of function
86

and disability thus may not be the best set of measures to demonstrate neighborhood effects on
function and disability. The analysis suggests that some effects are present but may be more
strongly detectable given better measures. The BADL and IADL limitation questions are fairly
broad and non-specific in wording and are not very sensitive to small changes in function.
Although the set of functional activities which theoretically may be measured is limitless, these
scales select a few activities which may not be fully representative. For example, they do not
stress mobility and lower extremity functional limitations. Further they conflate the perceived
limitation in ability to carry out certain activities with the successful adjustment via aids or help
from others in overcoming limitations (which often may result in a reply that no difficulty is
present). The fact that the physical function scale from the SF-12 was found to be related to
neighborhood characteristics indicates that a scale more focused on functional limitations per se,
rather than to the presence of gross disability may be more appropriate to detect neighborhood
effects. One set of consistent findings in the literature regarding neighborhood effects is that self-
reported health is more strongly related to neighborhood characteristics than specific conditions
are. This may be parallel to the findings discussed here, since (relatively more objective)
disability measures may be less directly affected by neighborhood environment than self-report
measures of functional limitations.
A limitation of the analysis is that the sample was made up of older adults with specific
chronic diseases and thus may not be representative of the whole population of older adults.
However, the two index diseases (osteoarthritis and heart disease) are widely prevalent and
contribute greatly to the loss of function among the elderly. Furthermore, the majority of older
adults has some chronic condition, so the results should be fairly broadly applicable despite the
limitations of the sample.
87

Another limitation of the analysis is related to the issue of the spatial contiguity of other
immediate neighborhoods or geographic areas. It seems artificial to assume that effects on health
occur only from immediate neighborhood surroundings. That is, while one can make the case
that the geographical scope of the elderly narrows to some extent for the reasons outlined earlier,
it would not seem to be accurate to assume that health effects can only arise from this smaller
area. Not only should the immediate (smaller) neighborhood or census tract area be considered
as a determinant of health, but also the characteristics of nearby neighborhoods should be
considered as well. One way of addressing this issue is through the contrast between
neighborhoods and census tracts which was made at certain points in the analysis. This contrast
indicated that although the results were largely consistent at the two levels of geography, there
were some differences. Further examination of the effects of different levels of geography should
be pursued. Another way the spatial contiguity of nearby neighborhoods should be considered in
this type of analysis is through the explicit modeling of spatial effects using appropriate
statistical techniques. In other words, analysis of multiple levels of geography, taking into
account the nearness of other areas is a more appropriate way to analyze environment effects.
While it was beyond the scope of this research to conduct such a spatial analysis, future research
in this area should utilize spatial analysis techniques as well as contextual analysis.
This research is of public health importance because it provides evidence, albeit still
somewhat weak and preliminary evidence, that geographical areas do matter for functioning. In
doing so, it begins to suggest neighborhood factors that may be potential intervention points to
improve the function of older adults. Future research in this area has the potential to inform a
range of new community-based public health interventions to improve function.
88

BIBLIOGRAPHY
Adams, R. E. "Is Happiness a Home in the Suburbs? The Influence of Urban Versus Suburban Neighborhoods on Psychological Health." Journal of Community Psychology 20(1992): 353-72.
Albert, Steven M. Public Health and Aging: An Introduction to Maximizing Function and Well-Being. New York: Springer, 2004.
Anderson, R. T. and others. "Mortality Effects of Community Socioeconomic Status." Epidemiology 8(1997): 42-47.
Balfour, Jennifer L. Neighborhood Environment and Loss of Physical Function in Older People: Evidence From Three Studies of Aging in the California Bay Area (Doctoral Thesis Dissertation). University of California, Berkeley, 1999.
Balfour, Jennifer L. and George A. Kaplan. "Neighborhood Environments and Loss of Physical Function in Older Adults: Evidence From the Alameda County Study." American Journal of Epidemiology 155, no. 6(2002): 507-15.
Branch, L. G. and A. M. Jette. "A Prospective Study of Long-Term Care Institutionalization Among the Aged." American Journal of Public Health 72(1982): 1373-79.
Brooks-Gunn, J. and others. "Do Neighborhoods Influence Child and Adolescent Behavior? " American Journal of Sociology 99(1993): 353-95.
Browning, C. R. and K. A. Cagney. "Moving Beyond Poverty: Neighborhood Structure, Social Processes, and Health." Journal of Health and Social Behavior 44(2003): 552-71.
Browning, C. R., K. A. Cagney, and M. Wen. "Explaining Variation in Health Status Across Space and Time: Implications for Racial and Ethnic Disparities in Self-Rated Health." Social Science and Medicine 57(2003): 1221-35.
Caslyn, R. J., J. P. Winter, and R. D. Yonker. "Should Disability Items in the Census Be Used for Planning Services for Elders?" The Gerontologist 41(2001): 583-88.
89
Chatterjee, S. and B. Price. Regression Analysis by Example, 2d Ed. New York: John Wiley & Sons, 1991.
Coleman, James S. Foundations of Social Theory. Cambridge, Mass: Harvard University Press, 1990.
Coreil, Jeannine, Carol A. Bryant, and J. Neil Henderson. Social and Behavioral Foundations of Public Health. Thousand Oaks, CA: Sage, 2001.
Diez Roux, A. V. and others. "Neighborhood Environments and Mortality in an Elderly Cohort: Results From the Cardiovascular Health Study." Journal of Epidemiology & Community Health 58(2004): 917-23.
Diez Roux, A. V. and others. "Area Characteristics, Individual-Level Socioeconomic Indicators, and Smoking in Young Adults." American Journal of Epidemiology 157, no. 4(2003): 315-26.
Diez Roux, Ana V. "Investigating Neighborhood and Area Effects on Health." American Journal of Public Health 91, no. 11(2001): 1783-89.
Diez Roux, Ana V. and others. "Neighborhood of Residence and Incidence of Coronary Heart Disease." New England Journal of Medicine 345, no. 2(2001): 99-106.
Ellen, Ingrid Gould, Tod Mijanovich, and Keri-Nicole Dillman. "Neighborhood Effects on Health: Exploring the Links and Assessing the Evidence." Journal of Urban Affairs 23, no. 3-4(2001): 391-408.
Ellen, Ingrid Gould and M. A. Turner. "Does Neighborhood Matter? Assessing Recent Evidence." Housing Policy Debate 8, no. 4(1997): 833-66.
Elreedy, S. and others. "Relations Between Individual and Nighborhood-Based Measures of Socioeconomic Position and Bone Lead Concentrations Among Community-Exposed Men: The Normative Aging Study." American Journal of Epidemiology 150(1999): 129-41.
Federal Interagency Forum on Aging-Related Statistics. "Older Americans 2000: Key Indicators of Well-Being." Http://Www.Agingstats.Gov/Chartbook2000/Default.Htm (2000).
Feldman, Pamela J. and Andrew Steptoe. "How Neighborhoods and Physical Functioning Are Related: The Role of Neighborhood Socioeconomic Status, Perceived Neighborhood Strain, and Individual Health Risk Factors ." Annals of Behavioral Medicine 27, no. 2(2004): 91-99.
90

Frey, W. H. "Brain Gains, Brain Drains." American Demographics June(2004): 19-23.
Frumkin, Howard. "Healthy Places: Exploring the Evidence." American Journal of Public Health 93, no. 9(2003): 1382-84.
Glass, Thomas A. and Jennifer L. Balfour. "Neighborhoods, Aging, and Functional Limitations." in Neighborhoods and Health, eds Ichiro Kawachi and Lisa F. Berkman, 303-34. New York: Oxford University Press, 2003.
Guralnick, J. M., L. P. Fried, and M. E. Salive. "Disability As a Public Health Outcome in the Aging Population." Annual Review of Public Health 17(1996): 25-46.
Haan, M., G. A. Kaplan, and T. Camacho. "Poverty and Health. Prospective Evidence From the Alameda County Study." American Journal of Epidemiology 125(1987): 989-98.
Kawachi, Ichiro and Lisa F. Berkman. "Introduction." in Neighborhoods and Health, eds Ichiro Kawachi and Lisa F. Berkman, 1-19. New York: Oxford University Press, 2003.
________. Neighborhoods and Health. Oxford: Oxford University Press, 2003.
Kendig, Hal. "Directions in Environmental Gerontology: A Multidisciplicary Field." The Gerontologist 43, no. 5(2003): 611-15.
Klinenberg, Eric. Heat Wave: A Social Autopsy of Disaster in Chicago. Chicago, IL: University of Chicago Press, 2002.
Kobetz, E., M. Daniel, and J. A. Earp. "Neighborhood Poverty and Self-Reported Health Among Low-Income, Rural Women, 50 Years and Older." Health & Place 9(2003): 263-71.
Krause, Neal. "Neighborhood Deterioration and Self-Rated Health in Later Life." Psychology and Aging 11(1996): 342-52.
Krause, Neal. "Neighborhood Deterioration and Social Isolation in Later Life." International Journal of Aging and Human Development 36(1993): 9-38.
________. "Neighborhoods, Health, and Well-Being in Late Life." in Annual Review of Gerontology and Geriatrics, 2003: Focus on Aging in Context: Socio-Physical Environments, eds Hans-Werner Wahl, Rick J. Scheidt, and Paul G. Windley, 223-49. New York: Springer, 2004.
91

Lawton, M. P. Environment and Aging. Monterey, Cal.: Brooks/Cole, 1980.
________. "The Impact of the Environment on Aging and Behavior." in Handbook of the Psychology of Aging, eds J. E. Birren and W. K. Schaie, 276-301. New York: Van Nostrand Reinhold, 1977.
Lawton, M. P. and L. Nahemow. "Ecology and the Aging Process." in The Psychology of Adult Development and Aging, eds C. Eisdorfer and M. P. Lawton, 464-88. Washington, DC: American Psychological Association, 1973.
Lollar, Donald J. and John E. Crews. "Redefining the Role of Public Health in Disability." Annual Review of Public Health 24(2003): 195-208.
Macintyre, Sally and Anne Ellaway. "Neighborhoods and Health: An Overview." in Neighborhoods and Health, eds Ichiro Kawachi and Lisa F. Berkman, 20-42. New York: Oxford University Press, 2003.
MacIntyre, Sally, Anne Ellaway, and Steven Cummins. "Place Effects on Health: How Can We Conceptualise, Operationalise and Measure Them?" Social Science and Medicine 55(2002): 125-39.
Malmstrom, Marianne, Jan Sundquist, and Sven-Erik Johansson. "Neighborhood Environment and Self-Reported Health Status: A Multilevel Analysis." American Journal of Public Health 89, no. 8(1999): 1181-86.
Manton, K. G. "A Longitudinal Study of Functional Change and Mortality in the United States." Journal of Gerontology B: Psychological and Social Sciences 43(1988): S153-S161.
Massey, D. and N. Denton. American Apartheid: Segregation and the Making of the Underclass. Cambridge, Mass: Harvard University Press, 1993.
Massey, Douglas S. "The Age of Extremes: Concentrated Affluence and Poverty in the Twenty-First Century." Demography 33, no. 4(1996): 395-412.
Mor, V. and others. "Functional Transitions Among the Elderly: Patterns, Predictors, and Related Hospital Use." American Journal of Public Health 84(1994): 1274-80.
Morenoff, J. D., R. J. Sampson, and S. W. Raudenbush. Neighborhood Inequality, Collective Efficacy, and the Spatial Dynamics of Urban Violence, Research Report No. 00-451. Ann Arbor: Population Studies Center, University of Michigan, 2001.
92

Moritz, D. J., S. V. Kasl, and L. F. Berkman. "Cognitive Functioning and the Incidence of Limitations in Activities of Daily Living in an Elderly Community Sample." American Journal of Epidemiology 141(1995): 41-49.
Nagi, S. Z. "The Concept and Measurement of Disability." in Disability,Policies and Government Programs, Ed E. D. Berkowitz, pp 1-15. New York: Praeger, 1979.
Nordstrom, C. K and others. "The Association of Personal and Neighborhood Socioeconomic Indicators With Subclinical Cardiovascular Disease in an Elderly Cohort. The Cardiovascular Health Study." Social Science and Medicine 59(2004): 2139-47.
O'Campo, P. and others. "Neighborhood Risk Factors for Low Birth Weight in Baltimore: A Multilevel Analysis." American Journal of Public Health 87, no. 7(1997): 1113-18.
Pickett, K. E. and M. Pearl. "Multilevel Analyses of Neighborhood Socioeconomic Context and Health Outcomes: a Critical Review." Journal of Epidemiology & Community Health 55(2001): 111-22.
Putnam, Robert. "The Prosperous Community: Social Capital and Community Life." The American Prospect (1993): 35-42.
Raudenbush, Stephen W. and Anthony S. Bryk. Hierarchical LInear Models: Applications and Data Analysis Methods, Second Edition. Thousand Oaks, CA: Sage, 2002.
Reynolds, Sandra L. and Merril Silverstein. "Observing the Onset of Disability in Older Adults." Social Science and Medicine 57(2003): 1875-89.
Robert, S. "Socioeconomic Position and Health: the Independent Contribution of Community Socioeconomic Context." Annual Review of Sociology 25(1999): 489-516.
Robert, S. and Lydia W. Li. "Age Variation in the Relationship Between Community Socioeconomic Status and Adult Health." Research on Aging 23, no. 2(2001): 234-59.
Robert, Stephanie A. "SES Differentials in Health by Age and Alternative Indicators of SES." Journal of Aging and Health 8(1996): 359-88.
Robert, Stephanie A. and James S. House. "Socioeconomic Inequalities in Health: Integrating Individual-, Community-, and Societal-Level Theory and Research." in Handbook of Social Studies in Health and Medicine, eds Gary L. Albrecht, Ray Fitzpatrick, and Susan C Scrimshaw, 115-35. London: Sage, 2000.
93

Roberts, R. E., G. A. Kaplan, and S. J. et al. Shema. "Prevalence and Correlates of Depression in an Aging Cohort: the Alameda Coutny Study." Journal of Gerontology B: Psychological and Social Sciences 52(1997): S252-S258.
Ross, Catherine E. "Walking, Exercising, and Smoking: Does Neighborhood Matter?" Social Science and Medicine 51(2000): 265-74.
Sampson, Robert J. and Jeffrey D. Morenoff. "Public Health and Safety in Context: Lessons From Community-Level Theory on Social Capital." in Promoting Health: Intervention Strategies From Social and Behavioral Research, Eds B. D. Smedley and S. L. Syme. Washington: Institute of Medicine, National Academy of Sciences, 2000.
Sampson, Robert J., Jeffrey D. Morenoff, and Felton Earls. "Beyond Spatial Capital: Spatial Dynamics of Collective Efficacy for Children." American Sociological Review 64(1999): 633-60.
Sampson, Robert J., Jeffrey D. Morenoff, and Thomas Gannon-Rowley. "Assessing "Neighborhood Effects": Social Processes and New Directions in Research." Annual Review of Sociology 28(2002): 443-78.
Sampson, Robert J., Stephen W. Raudenbush, and Earl Felton. "Neighborhoods and Violent Crime: A Multilevel Study of Collective Efficacy." Science 277(1997): 918-24.
Satariano, William A. "Editorial: The Disabilities of Aging - Looking to the Physical Environment." American Journal of Public Health 87, no. 3(1997): 331-32.
Satin, M. S. and C. H. Monetti. "Census Tract Predictors of Physical, Psychological, and Social Functioning for Needs Assessment ." Health Services Research 20(1985): 341-58.
Scheidt, R. J. and C. Norris-Baker. "The General Ecological Model Revisited: Evolution, Current Status, and Continuing Challenges." in Annual Review of Gerontology and Geriatrics, 2003: Aging in Context: Socio-Physical Environments, eds Hans-Werner .Wahl, Rick J. Scheidt, and Paul G Windley, 34-58. New York: Springer, 2004.
Snijders, Tom and Roel Bosker. Multilevel Analysis. London: Sage, 1999.
Srinivasan, Shobha, Liam R. O'Fallon, and Alan Dearry. "Creating Healthy Communities, Healthy Homes, Healthy People: Initiating a Research Agenda on the Built Environment and Public Health." American Journal of Public Health 93, no. 9(2003): 1446-50.
Stuck, Andreas E. and others. "Risk Factors for Functional Status Decline in Community-Living Older People: a Systematic Literature Review." Social Science and Medicine 48(1999): 445-69.
94

U.S. Census Bureau. 2000 Census of Population and Housing, Summary File 3 Technical Documentation. Washington: U.S. Department of Commerce, 2002.
Verbrugge, L. M. and A. M. Jette. "The Disablement Process." Social Science and Medicine 38(1994): 1-14.
Wahl, Hans-Werner. "Environental Influences on Aging and Behavior." in Handbook of the Psychology of Aging. Fifth ed., eds J. E. Birren and W. K. Schaie, 215-37. San Diego: Academic Press, 2001.
Wahl, Hans-Werner, Rick J. Scheidt, and Paul G. Windley. Annual Review of Gerontology and Geriatrics: Focus on Aging in Context: Socio-Physical Environments. New York: Springer, 2003.
Wainwright, N. W. J. and P. G. Surtees. "Places, People, and Their Physical and Mental Functional Health." Journal of Epidemiology & Community Health 58(2003): 333-39.
Waitzman, N. J. and K. R. Smith. "Phantom of the Area: Poverty-Area Residence and Mortality in the United States." American Journal of Public Health 88(1998): 973-76.
World Health Organization. International Classification of Impairments, Disabilities, and Handicaps. Geneva: 1980.
Yen, I. H. and G. A. Kaplan. "Poverty Area Residence and Changes in Physical Activity Level: Evidence From the Alameda County Study." American Journal of Public Health 88(1998): 1709-12.
95