neighborhood disadvantage and transitional care … · 2017-12-08 · neighborhood disadvantage and...
TRANSCRIPT
Neighborhood Disadvantage and Transitional Care
for Persons with Dementia
Amy JH Kind, MD, PhDAssociate Professor, Division of Geriatrics
Director, Department of Medicine Health Services and Care Research ProgramUniversity of Wisconsin School of Medicine and Public Health
&Associate Director-Clinical
Madison VA Geriatrics Research Education and Clinical Center (GRECC)

Financial Disclosures
Amy JH Kind, MD, PhD: [email protected]
Funding:NIH/National Institutes on AgingNIH/National Institutes on Minority Health and Health DisparitiesUS Department of Veterans AffairsUS Centers for Medicare and Medicaid ServicesMultiple non-profit foundationsConsultant, State of MarylandUK Alzheimer’s Society

Overarching Goal
Develop practical approaches towards the elimination of AD health disparities across all vulnerable populations nationally
“Big Data”- geo-linked sets of >59 million subjects; large computing capacity
• Policy• Program targeting
Engineer sustainable, feasible and effective models of care adaptable to low-resource settings

© cnbc.com
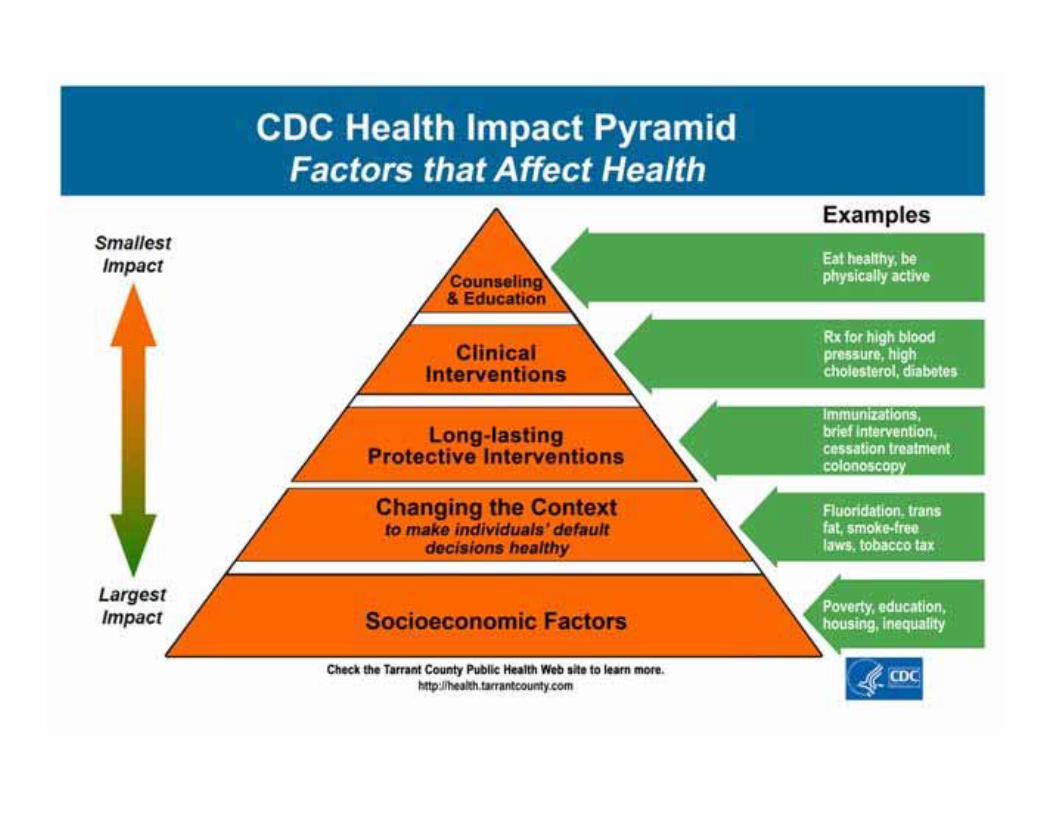
Improving Health
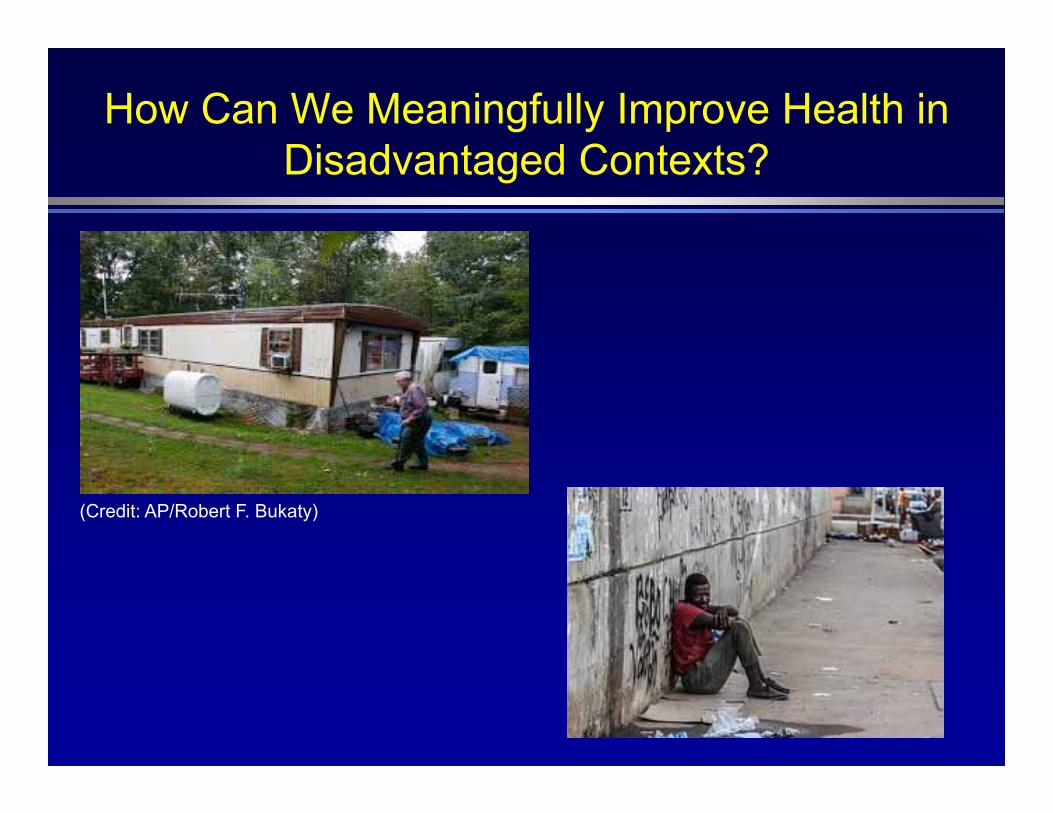
(Credit: AP/Robert F. Bukaty)
How Can We Meaningfully Improve Health in Disadvantaged Contexts?
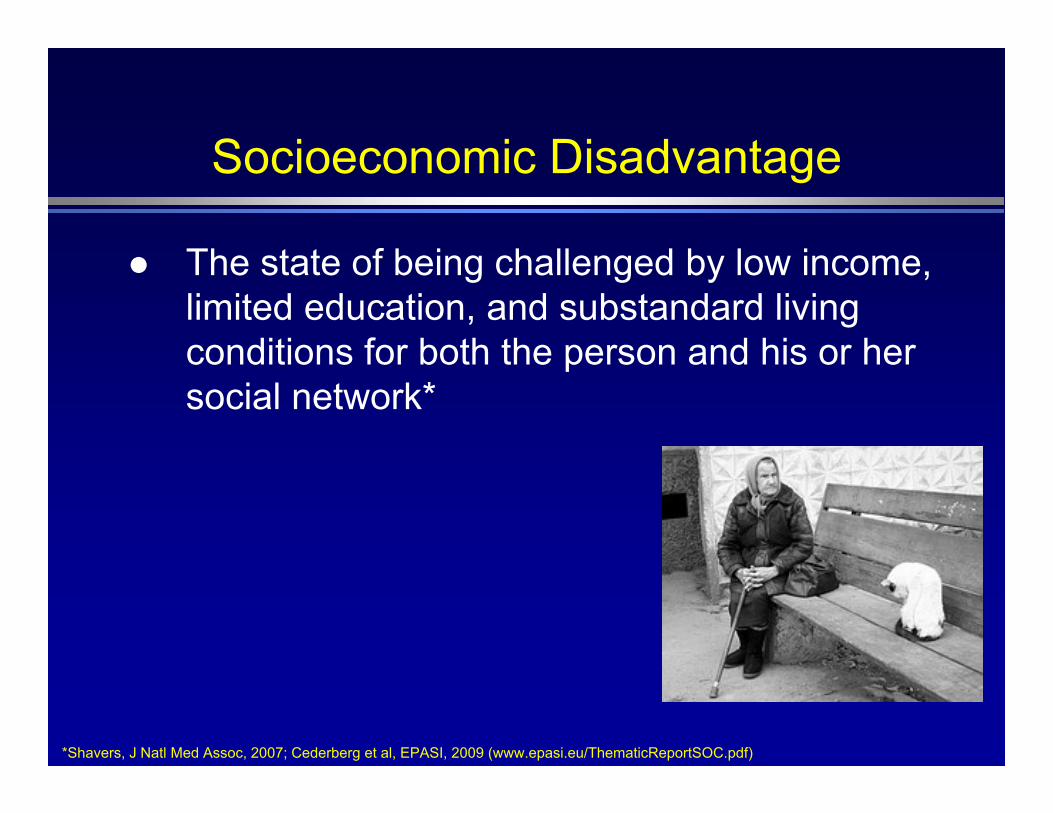
Socioeconomic Disadvantage
The state of being challenged by low income, limited education, and substandard living conditions for both the person and his or her social network*
*Shavers, J Natl Med Assoc, 2007; Cederberg et al, EPASI, 2009 (www.epasi.eu/ThematicReportSOC.pdf)

Neighborhood Socioeconomic Disadvantage Impacts Health
Associated with behaviors*, access to food**, safety†
Linked to outcomes like mortality††, development of diabetes***, birth weight‡
Health indicators improve with moving persons to areas of less concentrated poverty‡‡
*Lantz et al, JAMA, 1998; **Franco et al, Am J Prev Med, 2008; †Hsieh and Pugh, Criminal Justice Review, 1993; ***Christine et al, JAMA IntMed, 2015; ††Joynt and Jha, JAMA, 2013; ‡Blumenshine, et al, Am J Prev Med, 2010; ‡‡Ludwig et al, NEJM, 2011; •Milbank Q, 1990; ••Krumholz, NEJM, 2013

Moving to Opportunity Study
Sponsored by the US Dept of Housing and Urban Development (HUD)
Random lottery (1994-1998) offered some public housing families, but not others, the chance to move into a less distressed (lower-poverty) neighborhood (N=4,604 families)
Five cities: Baltimore, Boston, Chicago, Los Angeles, New York
Data collected for 10-15 years post-randomization Included measures on racial segregation of neighborhoods
* Ludwig et al, Science, 2012

Results
“Moving from a high-poverty to lower-poverty neighborhood leads to long-term improvements in adult physical and mental health and subjective well-being, despite not affecting economic self-sufficiency.”
* Ludwig et al, Science, 2012
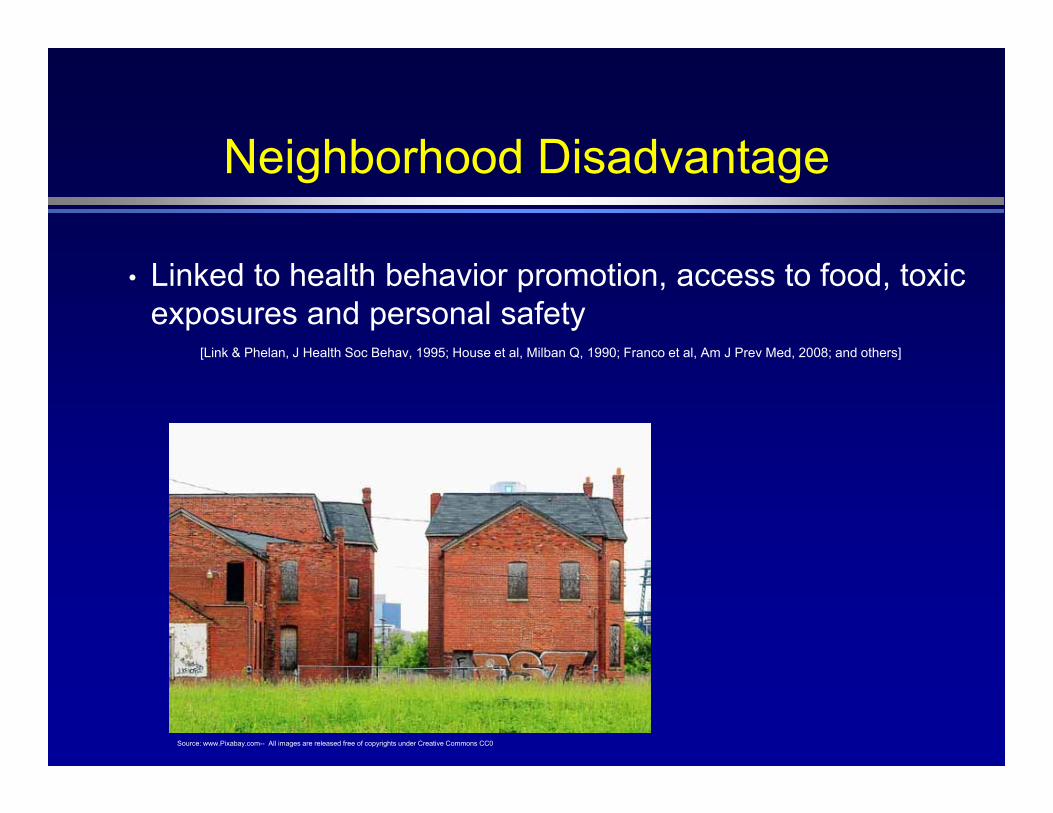
Neighborhood Disadvantage
• Linked to health behavior promotion, access to food, toxic exposures and personal safety
[Link & Phelan, J Health Soc Behav, 1995; House et al, Milban Q, 1990; Franco et al, Am J Prev Med, 2008; and others]
Source: www.Pixabay.com-- All images are released free of copyrights under Creative Commons CC0

Neighborhood Socioeconomic Disadvantage Increases Rehospitalization Risk
Living in a disadvantaged neighborhood is equivalent to having emphysema in terms of one’s rehospitalization risk.
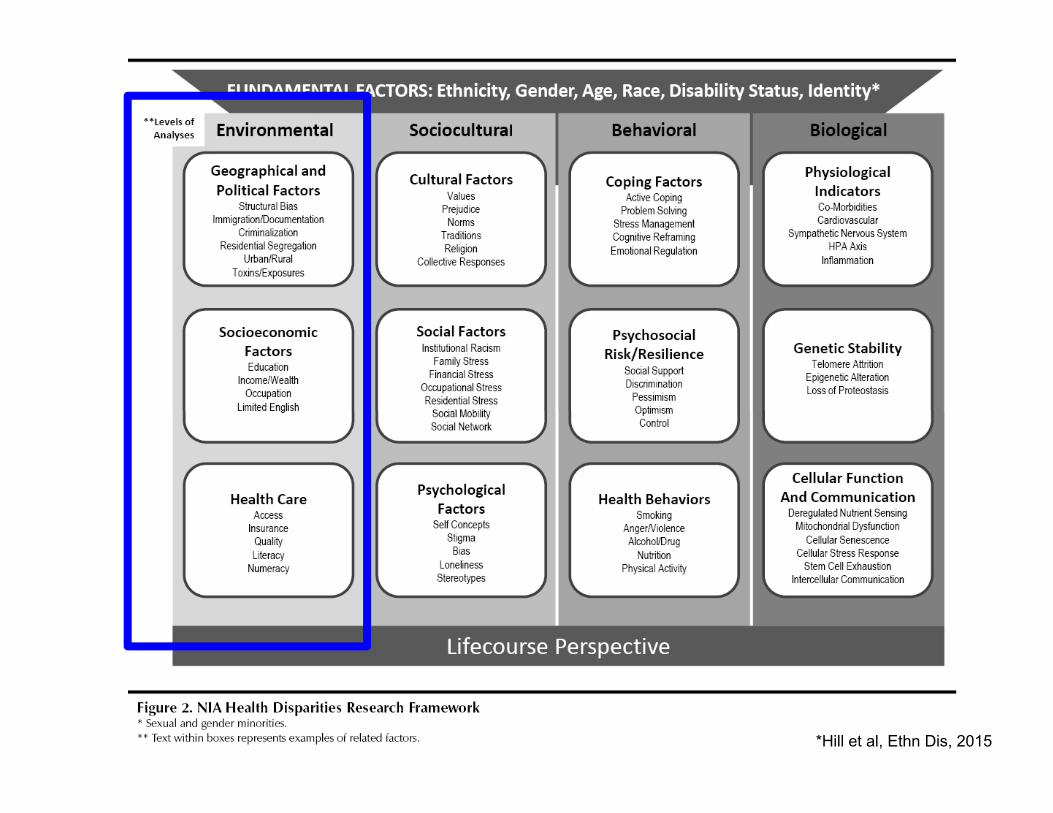
*Hill et al, Ethn Dis, 2015
Dementia and Disadvantage
• Dementia due to Alzheimer’s Disease (AD) disproportionately impacts racial/ethnic minorities and the socioeconomically disadvantaged—populations often exposed to US socioeconomic contextual disadvantage (“neighborhood disadvantage”)
Al Hazzouri et al, Am J Epi, 2011; Yaffe et al, BMJ, 2013; Barnes et al, Health Aff, 2014; Mayeda et al, Alz Dem 2016] [
• Neighborhood disadvantage is modifiable
• The impact of neighborhood disadvantage on the development of dementia remains unknown
Objective
To examine the association between neighborhood disadvantage, baseline cognition, and CSF biomarkers of AD
Source: www.Pixabay.com-- All images are released free of copyrights under Creative Commons CC0

Wisconsin Registry for Alzheimer’s Prevention (WRAP) Study
• Longitudinal study of asymptomatic middle-aged individuals enriched for parental AD history [Sager et al, J of Geri Psych and Neurology, 2005]
• Baseline cognitive testing to construct robust normative factor scores Immediate memory (Rey AVLT trails 1,2) Verbal learning (AVLT trials 3,4,5 and delayed recall) Working memory (digit span, letter-number sequencing) Speed/flexibility (Trails A/B, Stroop color-word task) [Sager et al, J of Geri Psych and Neurology, 2005; Dowling et al, 2010; Koscik et al, 2014; Clark et al, 2016]
• CSF biomarkers collected for Aβ42 and P-tau181 [Racine et al, Neuroimage Clinical, 2014; Starks et al, J of AD, 2015; Palmqvist et al, JAMA Neurol, 2014; Starks et al, J of AD, 2015]

Methods
• Created, validated neighborhood-level quantifications of socioeconomic contextual disadvantage for the full US—over 50 million Zip+4 codes—employing latest American Community Survey and Census data
• This metric--the Area Deprivation Index (ADI)--incorporates poverty, education, housing and employment indicators; predicts disparity-related health outcomes; and is employed by Maryland and Medicare through our provision [https://www.linkedin.com/feed/update/urn:li:activity:6244899965945024512/]
• The ADI provides a novel, nationally-generalizable way to study impacts of exposure to neighborhood disadvantage, while simultaneously offering a practical option for resource and outreach targeting

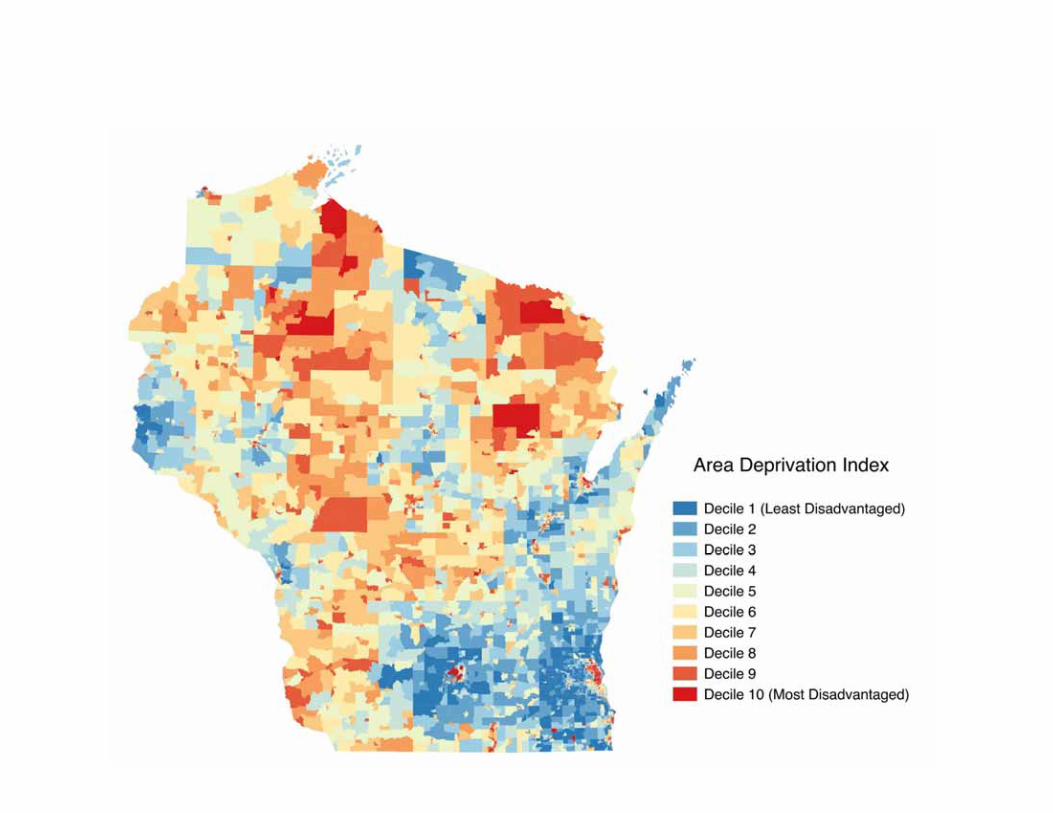
Area Deprivation Index (ADI): A Measure of Neighborhood Disadvantage
• Theoretical Domains:EducationPovertyHousing QualityUnemployment
• Factor-based ranking index
• Census block group level
[Kind et al, Annals of Internal Medicine, 2014]

Typical Geo-Political Boundaries
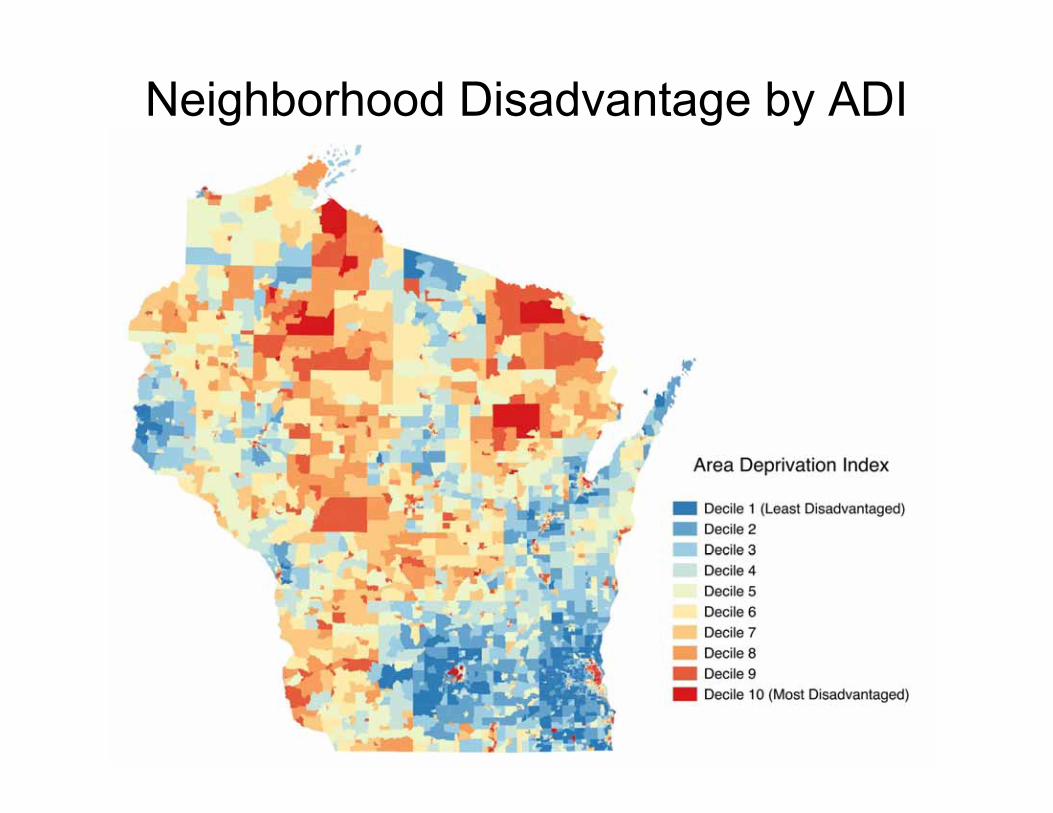
Neighborhood Disadvantage by ADI
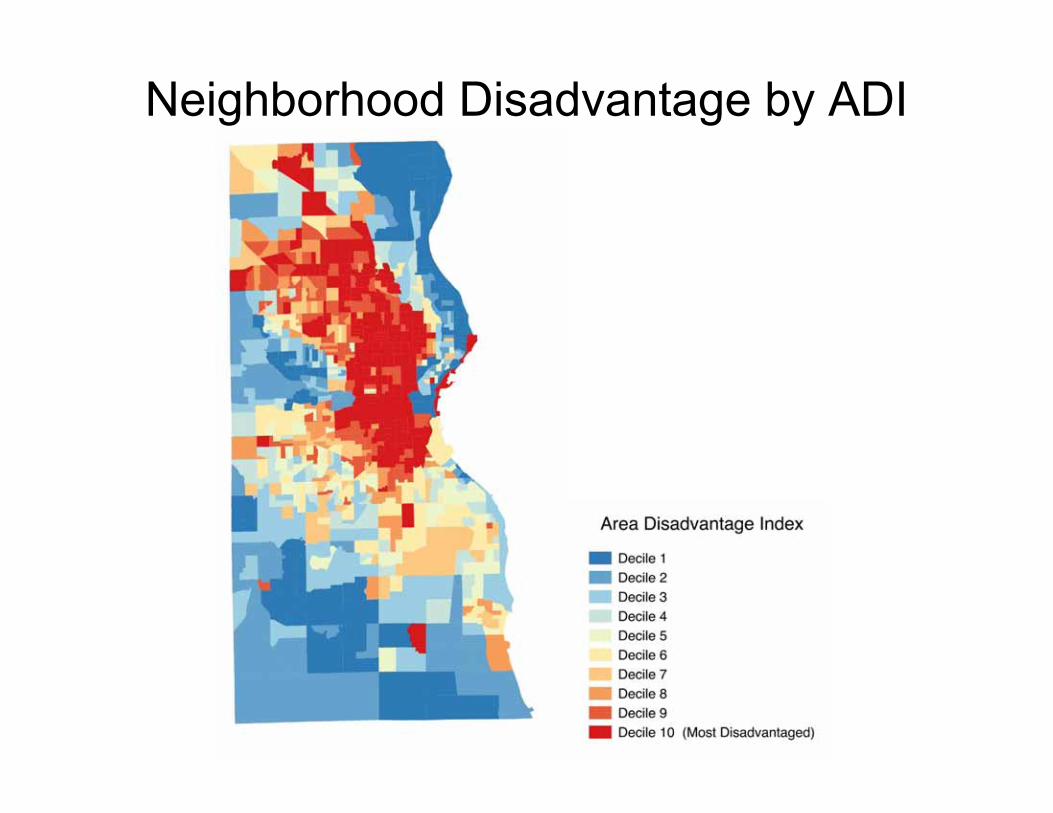
Neighborhood Disadvantage by ADI
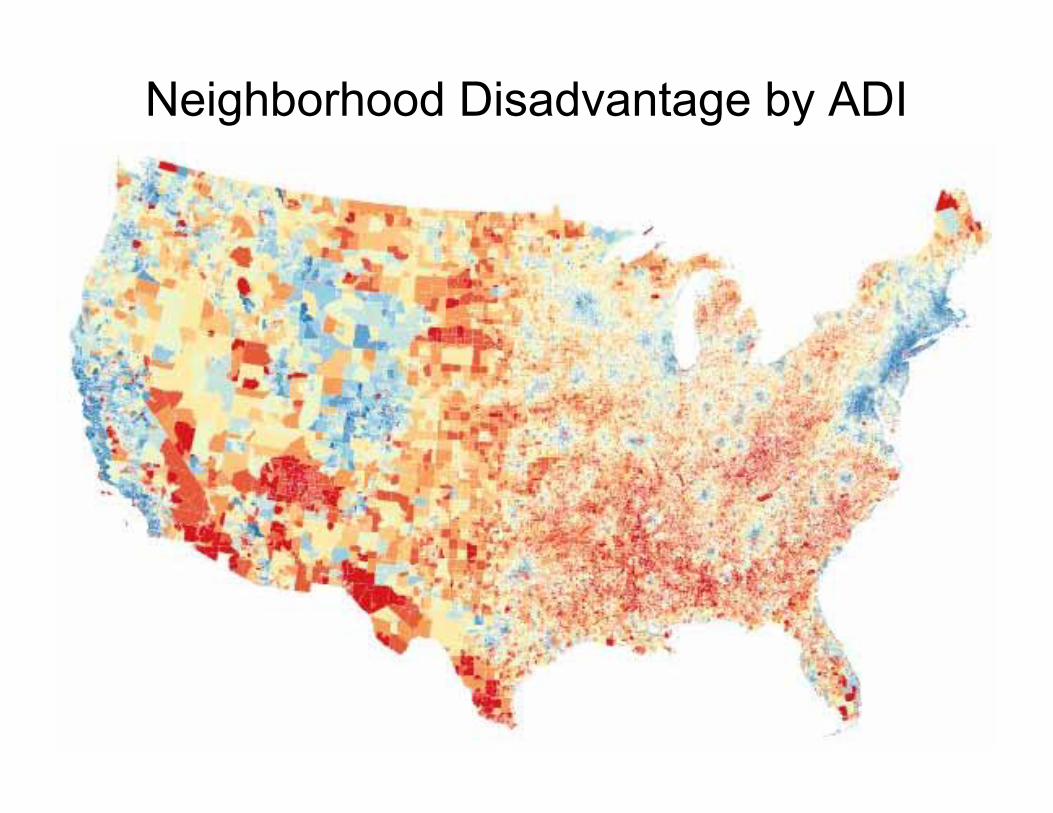
Neighborhood Disadvantage by ADI

Limitations
• Unclear generalizability beyond the state of Wisconsin
• Limited number of CSF samples from participants within the most disadvantaged neighborhoods limits analytic power within biomarker analyses. Future studies will include larger participant numbers
• Interactions amongst neighborhood disadvantage and other fundamental factors (including race, genetics, etc.) will be examined within future studies.

Conclusions
• These early data suggest that neighborhood disadvantage (a modifiable fundamental risk factor) may account for some of the observed disparities in prevalence of dementia
• Given the urgent need to reduce dementia and AD disparities, the current results suggest that neighborhood disadvantage deserves additional study
Source: www.Pixabay.com-- All images are released free of copyrights under Creative Commons CC0

Case: One of Many…
78yo hospitalized with pneumonia
Mild dementia, not recognized
Discharged on oral antibiotic x 7 days
Discharge teaching performed once (intensively) on the day of discharge. Caregiver not notified. (Daughter working 2 jobs to make ends meet.) Home health won’t visit due to neighborhood safety concerns.
Rehospitalized 3 days later; recurrent pneumonia
Antibiotic prescription found in patient’s pocket. He forgot to fill the medication.

Transitional Care
Broadly, a set of actions designed to ensure the coordination and continuity of health care as patients transfer between different locations or different levels of care in the same location*
* Coleman. JAGS. 2003
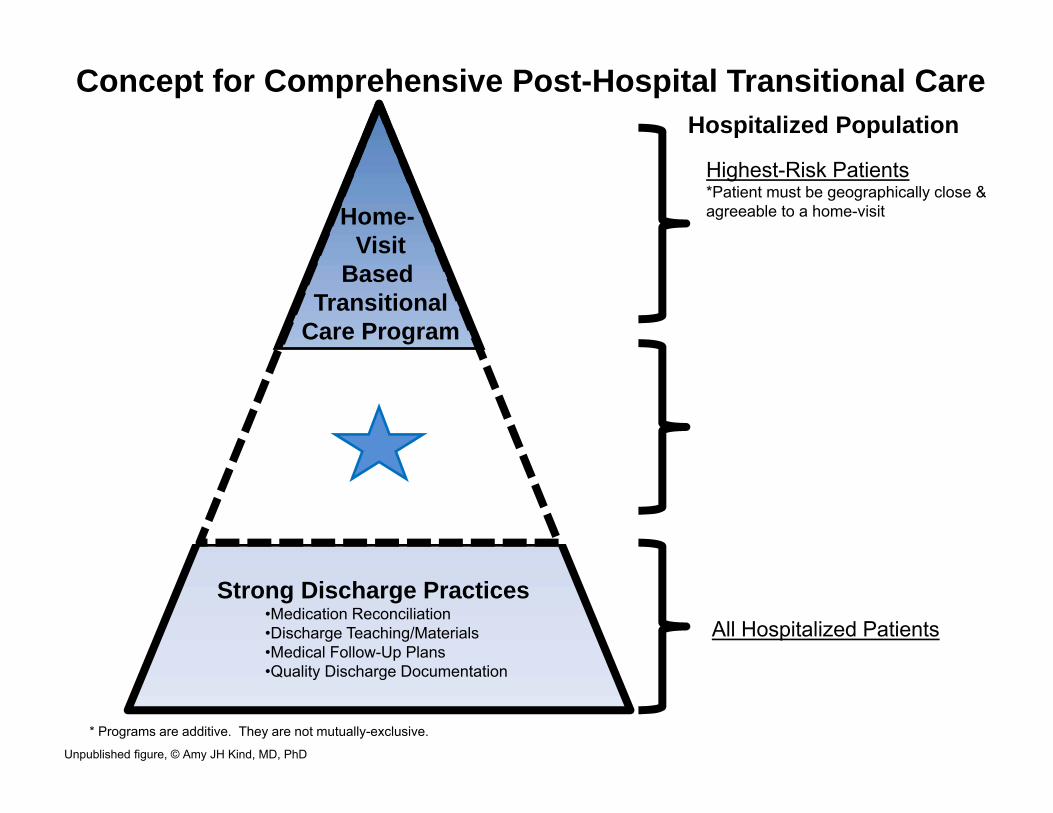
Home-Visit
Based Transitional
Care Program
Strong Discharge Practices•Medication Reconciliation•Discharge Teaching/Materials•Medical Follow-Up Plans•Quality Discharge Documentation
Coordinated-Transitional
Care Program (C-TraC)•Hospital-Based C-TraC Nurses•Outpatient Integration
All Hospitalized Patients
Highest-Risk Patients*Patient must be geographically close &agreeable to a home-visit *Could be identified by C-TraC nurses in addition to pre-defined patient characteristics
Hospitalized Population
All Higher-Risk Veterans*Examples: cognitively impaired orlives-alone or prior hospitalization ormedically complex *Could be identified via existing C-TraC protocols in addition to referrals from veteran’s care team
* Programs are additive. They are not mutually-exclusive.
Concept for Comprehensive Post-Hospital Transitional Care
Unpublished figure, © Amy JH Kind, MD, PhD

Unmet Need
Many of the patients who need special care to support their post-hospital transition cannot access such services Socioeconomically disadvantaged populations Areas with poor health care access
We need programs that adapt, succeed and sustain in underserved and disadvantaged areas

Coordinated-Transitional Care Program (C-TraC)
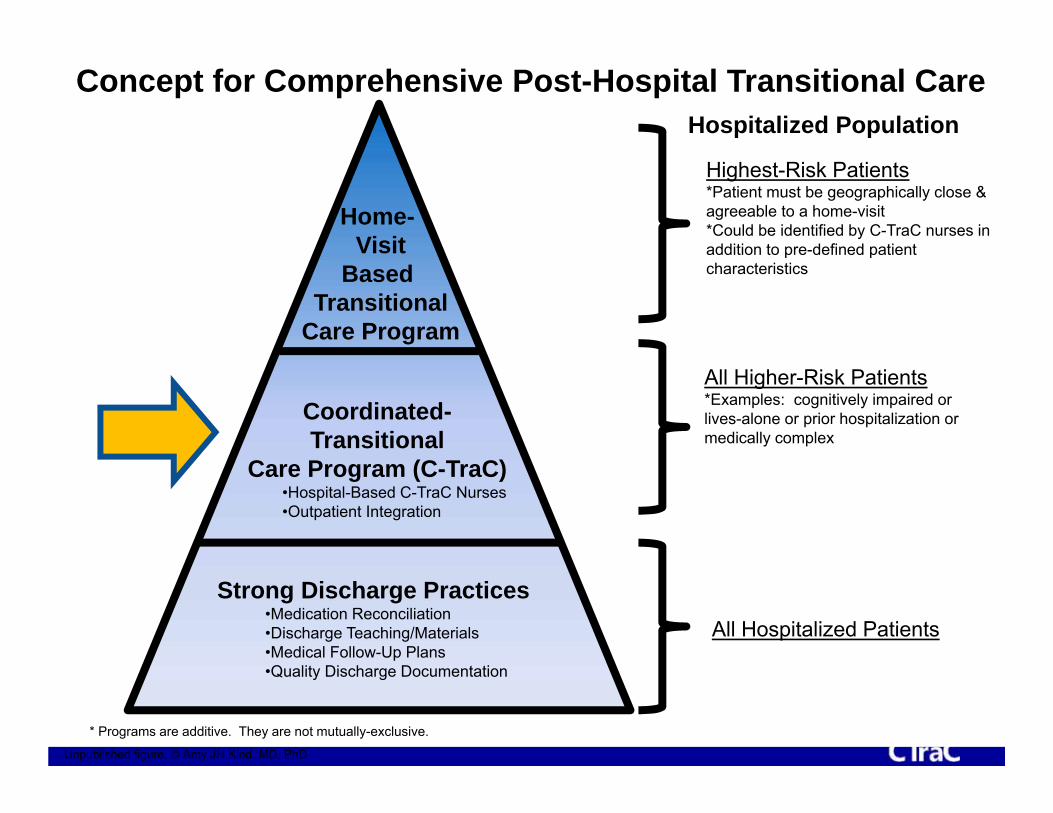
Home-Visit
Based Transitional
Care Program
Strong Discharge Practices•Medication Reconciliation•Discharge Teaching/Materials•Medical Follow-Up Plans•Quality Discharge Documentation
Coordinated-Transitional
Care Program (C-TraC)•Hospital-Based C-TraC Nurses•Outpatient Integration
All Hospitalized Patients
Highest-Risk Patients*Patient must be geographically close &agreeable to a home-visit *Could be identified by C-TraC nurses in addition to pre-defined patient characteristics
Hospitalized Population
All Higher-Risk Patients*Examples: cognitively impaired orlives-alone or prior hospitalization ormedically complex
* Programs are additive. They are not mutually-exclusive.
Concept for Comprehensive Post-Hospital Transitional Care
Unpublished figure, © Amy JH Kind, MD, PhD

C-TraC Goals
1. Educate and empower the patient/caregiver in medication management
2. Ensure the patient/caregiver has medical follow-up
3. Educate the patient/caregiver regarding red flags
4. Ensure the patient/caregiver knows whom to contact if questions arise
* Kind, Health Affairs, 2012.

Coordinated-Transitional Care (C-TraC) Program
* Kind at al, JAGS, 2016

Pilot Data: C-TraC Cut Rehospitalizations in Patients with Dementia
20% of intervention patients versus 33% of comparison patients experienced a 30-day rehospitalization (p-value = 0.03)
Adjusted Odds Ratios for 30-Day Rehospitalization for Patients with Dementia in C-TraC versus Baseline
Adjusted** Odds Ratio
95% CI P-Value
Baseline period, n = 64 1.00
Intervention period, n = 81 0.34 (0.14 - 0.82) 0.017
30 Day Rehospitalization
**Multivariate logistic regression model adjusted for veteran age, gender, race, Medicaid status, education level, and charlson comorbidity score
C-TraC Group Participants with Dementia
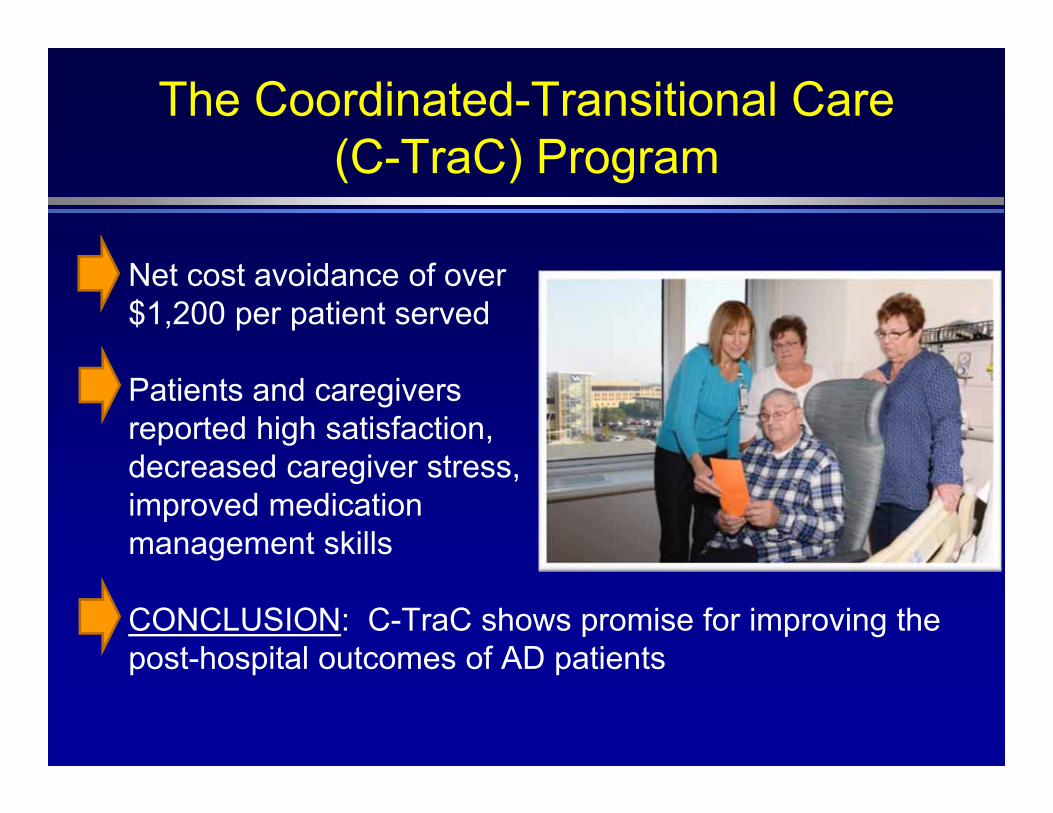
The Coordinated-Transitional Care (C-TraC) Program
Net cost avoidance of over $1,200 per patient served
Patients and caregivers reported high satisfaction, decreased caregiver stress, improved medication management skills
CONCLUSION: C-TraC shows promise for improving the post-hospital outcomes of AD patients

CTRAC (Madison WI) FY 2011-2012Enrollees (N=387)
Comparisons (N=2,126)
Difference P value
30-day post-discharge rehospitalization rate (VA inpatient )
7.5% 11.1% -3.6% 0.019
30-day rehospitalization rate (VA or Medicare inpatient )
9.8% 14.9% -5.0% 0.004
Any use of inpatient, ER or observation days within 30-day of discharge (VA or Medicare)
11.1% 17.2% -6.1% 0.001
Total VA costs 30-days post discharge
$4,585 $6,081 -$1,496 0.006
30-day mortality 5.7% 4.5% 1.2% 0.32790 day mortality 8.8% 9.3% -0.5% 0.739
GEC Bending the Cost Curve 26 December 2016 36

Wisconsin ADRC Project 3:5-year C-TraC RCT
Single-blind, prospective, randomized controlled trial to determine the effects of C-TraC versus usual care on:
1. Rehospitalizations at 14, 30 and 90 days2. Post-Hospital Delirium, Function, Falls 3. Caregiver Stress
in patients with dementia discharged from the hospital to the community
Completion: 2020

Goal: Engineer Sustainable Programs for the Most Socioeconomically Disadvantaged Areas

39
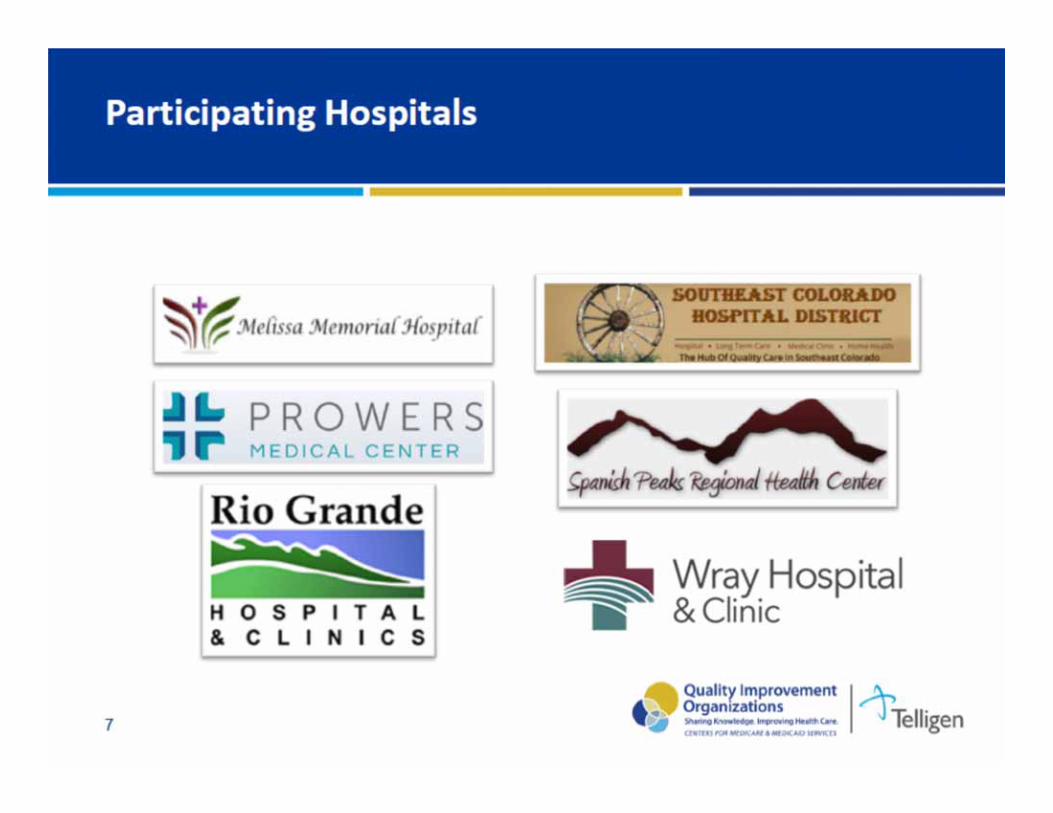
Implementing the Coordinated-Transitional Care (C-TraC) Model in Critical Access Hospitals in Rural Colorado
This material was prepared by Telligen, the Medicare Quality Innovation Network Quality Improvement Organization, under contract with the Centers for Medicare & Medicaid Services (CMS), an agency of the U.S. Department of Health and Human Services. The contents presented do not necessarily reflect CMS policy. 11SOW-CO-SIP1-07/07/17-2180.


Spec
ific
Step
s
1. Document existing local discharge processes
2. Provide a comprehensive overview of C-TraC
1. Convene local multidisciplinary key-stakeholder group
2. Coach local key-stakeholders to define local high-impact outcomes, goals
3. Detailed discussion of core C-TraC elements, processes
4. Formally adapt C-TraC operations to accommodate local VA system
5. Ensure integration with (not duplication of) existing processes
6. Train newly hired C-TraC local staff in clinical program delivery, and provide on-going coaching of program leadership in program assessment, reporting and administrative barrier reduction
1. Coach local C-TraC staff to ensure they achieve widespread local stakeholder engagement prior to launch
2. Coach local C –TraC leadership through iterative phased protocol refinement post-launch
3. Mentor local teams to perform continuous process monitoring, documentation
4. Mentor local C-TraC teams to perform key outcome monitoring and reporting to ensure strongest chances of post-grant sustainability
1. Mentor local C-TraC teams in final results feedback to health system leadership and stakeholders
2. Achieve local C-TraC program sustainment
Pre-Conditions• Identification of
need• Review existing
interventions
Pre-Implementation
• Core elements• Customize delivery• Logistics/training
Implementation• Process evaluation• Feedback/protocol
refinement
Maintenance and Evolution
• Sustain• Disseminate
Implementation Mentoring* for C-TraC18-24 months for full process
* Adapted from CDC’s Replicating Effective Programs Implementation Theory Model * Kind et al, JAGS, 2016
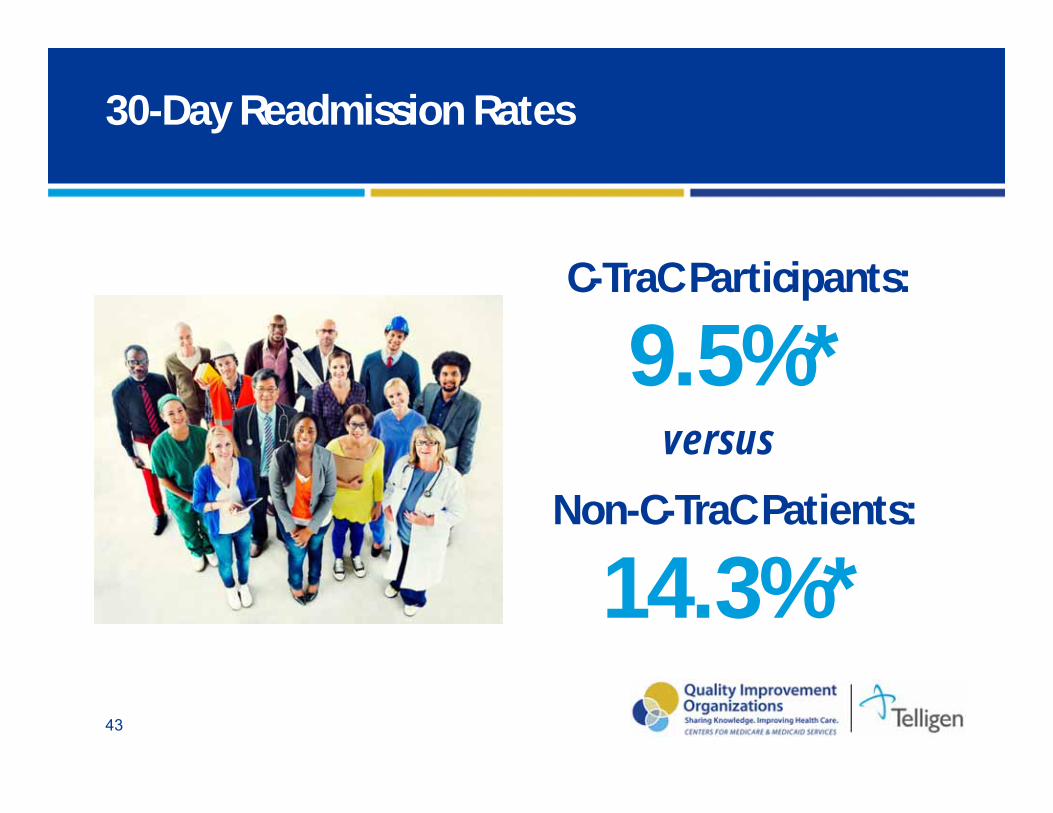
43
30-Day Readmission Rates
C-TraC Participants:
9.5%*Non-C-TraC Patients:
14.3%*
versus
Medicare-funded 2-year C-TraC Pilot
Consideration for additional spread
Initial findings promising for local sustainability (report):
” …CEO confirmed decreased ER visits, increased clinic visits, and a potential increase in HCAPS scores, which they attribute to C-TraC…”

(Credit: AP/Robert F. Bukaty)
How Can We Meaningfully Improve Health in Disadvantaged Contexts?

Neighborhood Disadvantage by ADI
FundingNIMHD R01MD010243-01 (Kind PI)NIA 2P50AG033514-06 (Asthana PI; Kind Project 3 PI) NIA R01AG027161 (Johnson PI)UW Institute for Clinical and
Translational Research (1UL1RR025011)Madison VA GRECCVA T-21 GEC: Innovative Patient Centered Alternatives to Institutional CareWisconsin Partnership ProgramCenters for Medicare and Medicaid Services
Thank you!C-TraC patients and familiesWRAP participants
AcknowledgementsTeam/CollaboratorsLaury Jensen Ken Shay, Karen MasseyMadison VA Hospital LeadershipVACO LeadershipMadison VA C-TraC Team Kind-team Bendlin-team WAI leadership, faculty and staffWADRC leadership, faculty and staffUW Department of Medicine