neighborhood differences in attitudes toward policing
TRANSCRIPT

Journal of Criminal Law and CriminologyVolume 79Issue 2 Summer Article 5
Summer 1988
Neighborhood Differences in Attitudes TowardPolicing: Evidence For a Mixed-Strategy Model ofPolicing in a Multi-Ethnic SettingRoger G. Dunham
Geoffrey P. Alpert
Follow this and additional works at: https://scholarlycommons.law.northwestern.edu/jclc
Part of the Criminal Law Commons, Criminology Commons, and the Criminology and CriminalJustice Commons
This Criminology is brought to you for free and open access by Northwestern University School of Law Scholarly Commons. It has been accepted forinclusion in Journal of Criminal Law and Criminology by an authorized editor of Northwestern University School of Law Scholarly Commons.
Recommended CitationRoger G. Dunham, Geoffrey P. Alpert, Neighborhood Differences in Attitudes Toward Policing: Evidence For a Mixed-Strategy Modelof Policing in a Multi-Ethnic Setting, 79 J. Crim. L. & Criminology 504 (1988-1989)

0091-4169/88/7902-504THE JOURNAL OF CRIMINAL LAw & CRIMINOLOGY Vol. 79, No. 2Copyright © 1988 by Northwestern University, School of Law riinted in U.S.A.
CRIMINOLOGY
NEIGHBORHOOD DIFFERENCES INATTITUDES TOWARD POLICING:
EVIDENCE FOR A MIXED-STRATEGYMODEL OF POLICING IN A
MULTI-ETHNIC SETTING
ROGER G. DUNHAM*GEOFFREY P. ALPERT**
There are prevalent in society two general conceptions of the duties ofthe police officer. Middle class people feel that he should enforce thelaw without fear or favor. Cornerville people and many of the officersthemselves believe that the policeman should have the confidence ofthe people in his area so that he can settle many difficulties in a per-sonal manner without making arrests. These two conceptions are in alarge measure contradictory.'
William Foote Whyte made these general observations morethan forty years ago in Street Corner Society. The sharply contrastingsocial pressures that existed in different neighborhoods were impor-tant consequences of urban life. Whyte noted, more specifically,that the police must adapt to these different standards of acceptableconduct prevalent in different neighborhoods. 2 His observationshave been echoed by many,3 but tested by few. Other researchershave continued Whyte's theme that in the context of community po-licing, effective policing requires an understanding of the differentcitizens' expectations and values toward police practices. 4
* Associate Professor, Department of Sociology, University of Miami** Professor, College of Criminal Justice, University of South Carolina
I W. WHYTE, SREET CORNER SOCIETY, 136 (1943).2 Id. at 138.3 See A. REISS, JR., THE POLICE AND THE PUBLIC (1975); J. WILSON, VARITIES OF PO-
LICE BEHAVIOR (1968).4 See J. WILSON & G. KELLING, Broken Windows: The Police and Neighborhood Safety, 249
ATLANTIC MONTHLY (March, 1982) 29-38; and P. Manning, Community Policing, in POLIC-ING AMERICA (R. Dunham & G. Alpert ed.) (in press).
504

NEIGHBORHOOD DIFFERENCES
After a substantial amount of police research during the 1960's,there has recently occurred a resurgence of interest concerning howthe police respond in different neighborhood contexts. 5 However,much of the emphasis of this research has been on how the policecategorize the "good" and "bad" areas or neighborhoods, and dis-criminate against citizens in the "bad" areas with a process of eco-logical contamination. 6 The police react as if everyone in the "bad"areas are suspect, and treat them more harshly.
Lawrence Sherman argues that depending on the neighbor-hood there is considerable variation in the way the police manageresources, exercise discretion, and decide when to respond toproblems.7 Yet, he concludes there is little relativity in basic policestrategy.8 Due to this, Sherman argues for a mixed strategy modelto policing particular communities based upon their unique charac-teristics. 9 Unfortunately, there is little empirical data assessing theassumption that residents of neighborhoods or communities havedistinct preferences or dislikes for specific police strategies or prac-tices. Indeed, it is unclear whether these preferences or dislikesvary from one type of neighborhood to another.
The purpose of this Article is to examine the differences inagreement and disagreement with various police practices amongthe residents of ethnically distinct neighborhoods in Miami, Florida.The findings provide needed empirical evidence for determiningwhether William F. Whyte was correct, and whether significant dif-ferences among neighborhoods really do exist. Further, these find-ings can guide police training to meet citizens' expectations foracceptable and effective policing. Research comparing ethnicallydistinct neighborhoods has not fully examined this aspect of neigh-borhood influences on policing.
This Article will show that communities vary considerably inresidents'expectations for police services. Residents of various cul-turally distinct neighborhoods may have different values dictating
5 See J. SKOLNICK & D. BAYLEY, THE NEW BLUE LINE: POLICE INNOVATION IN SIXAMERICAN CITIES (1986); R. TAUB, D. TAYLOR & Y. DUNHAM, PATHS OF NEIGHBORHOOD
CHANGE: RACE AND CRIME IN URBAN AMERICA (1984); Decker, Citizens'Attitudes Toward thePolice: A Review of Past Findings and Suggestions for Future Policing 9 J. POL. ScI. & ADMIN.80-87 (1981);Jacob, Black and White Perceptions ofJustice in the City 6 LAW & Soc'Y REV. 69-89 (1971); Sherman, Policing Communities: What Works?, COMMUNITIES & CRIME 343-86(1986); Smith, A Neighborhood Context of Police Behavior, COMMUNITIES & CRIME 313-41(1986).
6 These studies view neighborhood context as the independent variable affectinghow the police use their discretion.
7 Sherman, supra note 5, at 344-46.8 Id. at 346-47.9 Id. at 379-80
1988] 505

DUNHAM AND ALPERT
the appropriateness of police behavior and of the policing stylesused in specific situations. These preferences and dislikes may beinterwoven into the fabric of the culture, the attitudes toward gen-eral authority, and more specifically toward police authority. Inturn, police strategies and practices incongruent with the basic cul-ture and values of a neighborhood would likely be ineffective andperhaps even counterproductive to maintaining order and control-ling crime.
I. THE EFFECT OF NEIGHBORHOOD CHARACTERISTICS ON POLICING
It is apparent that neighborhood differences are important toeffective policing, and that the police routinely operate differently insome specific ways in response to neighborhood differences. It isunfortunate that there are insufficient data to aid police in respond-ing appropriately. This Article will examine how residents of differ-ent neighborhoods evaluate specific police practices. Severalstudies are directly relevant to this research in that they examinespecific neighborhood differences in attitudes toward the police andpolicing.
Two important studies deserve particular attention. First,Schuman and Gruenberg concluded that the primary factor explain-ing satisfaction and dissatisfaction with police services is the neigh-borhood.10 They found race to be an important factor as well, butrace variation was largely accounted for by the neighborhood. I" Ap-parently, the interaction between race and neighborhood accountsfor much of the variation in attitudes toward the police and policeservices. Second, Walker and his colleagues also found neighbor-hood context to be an extremely important factor in attitudes to-ward the police and, more specifically, in the amount of supportresidents give to the police. 12 Walker found that involuntary con-tacts with the police contributed to the more negative attitudes ex-hibited by blacks toward the police. 13 However, they found that thenature of the contact and the cumulative contextual effect within theneighborhood best accounted for the low level of support for thepolice reported among blacks.
This Article goes beyond these research findings to examine
10 Shuman & Greenberg, Dissatisfaction with City Services: Is Race an Important Factor?,
PEOPLE: & POL. URB. Soc'Y 386-87 (1972).11 Id. at 386.12 Walker, Richardson, Denyer, Williams, & McGaughey, Contact and Support: An Em-
pirical Assessment of Public Attitudes Toward the Police and the Courts, 51 N.C.L. REV. 43-79(1972) [hereinafter Walker].
13 Id. at 65.
506 [Vol. 79

NEIGHBORHOOD DIFFERENCES
more directly attitude differences in five culturally distinct neighbor-hoods. Research on attitudes towards police practices typically usessamples combining various and diverse social groups to representlarge populations. While this approach can be used to characterizewhole geographical areas, it may mask the unique attitudes of thevarious social groups. 14 In turn, findings resulting from attempts tocharacterize generalized attitudes of an entire population are of lim-ited use to police planners and trainers, since the police must re-spond to the needs and concerns of citizens that are often unique toparticular cultural groups. Neighborhoods are important to policebecause police are deployed to them. This is especially importantwhen neighborhoods are ethnically homogeneous. In these cases,police deployment is, accidently or by design, partially ethnicspecific.
Given the mixed social character of our cities and the mosaicthat makes our social fabric, police administrators must decide howto prepare officers to function effectively in the many diverse cul-tural environments they serve.
II. METHODS AND PROCEDURES
The present article involves a sample of neighborhoods inMiami, Florida and a sample of individuals within those neighbor-hoods. Each sample was chosen to allow for the most advantageousstudy of the issues central to our concerns: the relationships be-tween the police and communities. The sample of neighborhoodsallows for comparisons between areas with high versus low crimerates and distinct ethnic and social class compositions. Within eachneighborhood, the survey data allows for study of how individualattitudes and values towards various policing practices form the ag-gregate patterns unique to each neighborhood.
A. NEIGHBORHOOD SAMPLES
Neighborhoods were selected because of their uniqueness,rather than to represent a balanced cross section of Miami or DadeCounty, Florida. Indeed, the overall population of Dade County isso segmented by ethnicity and social class that any overall character-ization of the population would be difficult, if not impossible. Withthe assistance of police officials, officials from the Dade County
14 See Sullivan, Dunham & Alpert, Attitude Structures of Diferent Ethnic and Age Groups
Concerning the Police and Police Procedures, 78 J. CRIM. L. & CRIMINOLOGY 177-196 (1987);Scaglion and Condon, The Structure of Black and White Attitudes Toward Police, 39 HUM.ORGANIZATION 280 (1980).
1988] 507

DUNHAM AND ALPERT
Planning Department, and the 1980 census data, five neighbor-hoods, each representing a meaningful geographic unit to the policeunits operating in these areas, were chosen.
1. Rolling Oaks
Rolling Oaks is a relatively small community of about 150 re-cently built homes. Nearly all of the residents are upper-middle-class black professionals. Every third house was studied to completea sample of fifty households.
2. James Scott Housing Project
The James Scott Housing Project is a government subsidizedhousing project populated almost exclusively by low income blacks.There are a total of 858 units, most of which are occupied.' 5 Everysixteenth unit was surveyed to complete a sample of fifty units.
3. 1960 Cuban Entrants
The third neighborhood is a combination of middle-class andworking-class homes that contain a very high percentage of Latinresidents, most of whom are Cubans who immigrated during thefirst wave of Cuban immigration in the 1960s. There were nearly 700homes in the neighborhood, and every fourteenth residence wassurveyed to yield a sample of fifty residences.
4. 1980 Cuban Entrants
The procedure used to sample the fourth neighborhood repre-sents an attempt to identify the attitudes of a new group of Cubanimmigrants in the Miami area. Officials from the planning depart-ment identified a neighborhood of Cubans who arrived in this coun-try during the 1980 boatlift. Interviewers screened prospectivesubjects and interviewed only those who immigrated from Cubaduring the 1980 Mariel Boatlift.
5. Kendall Area
The fifth neighborhood is a well established anglo middle andupper-middle-class area. There are about 900 houses in the particu-lar Kendall neighborhood chosen, and every eighteenth home wassurveyed to yield a total of fifty homes.
A sampling procedure was developed to select the member ofthe household to be interviewed to insure a representative sample of
15 Of the 858 units, 837 (98%) are occupied.
508 [Vol. 79

NEIGHBORHOOD DIFFERENCES
individuals living within households. Interviewers sampled onlyadults 18 years of age or older. Interviewers asked the number ofadults and the number of men and women living in the house. Theinterviewer then used a table of random selections to decide whichadult to interview. 16 Provisions were made for the inability to con-tact the selected person after two visits. Substitutions of an under-represented group were allowed for, but such substitutions weremade in less than 15% of the houses. The procedure also called forsubstituting houses after an unsuccessful second visit. The inter-viewer was instructed to go first to the house on the right and thento the one on the left. This was not a very important factor, as theneighborhoods were so homogeneous.
Measures
In order to determine the attitudes towards policing practicesheld by the residents of the neighborhoods selected, an exhaustivereview of the research literature was conducted. There are numer-ous studies on the interrelationship between the police and the com-munity, with numerous arrays of questions concerning attitudestoward policing. We selected scales and sets of questions that wererelevant to our research that had withstood the test of time with re-gard to reliability and the validity of testing. This resulted in thirtyquestions coming from a variety of attitude scales: Hostility Index,Attitudes Toward the Police Questionnaire, Perceptions of PoliceScale, Citizens Perception of Police, 17 Police Aggressiveness Scale,Selectiveness of Law Enforcement, Perceived Limits on Discretionand Perception of Supervisor's Behavior, Patrolman's and Supervi-sor's Attitudes Toward Priorities, Patrolman's and Supervisor's Atti-tudes Toward Aggressiveness, Patrolman's and Supervisor'sAttitudes Toward Order-Maintenance. 8 The thirty questions werescored on a one to five Likert-type scale. A "one" signified strongagreement. A "two" represented agreement, a "three" meant un-decided, a "four" signified disagreement, and a "five" representedstrong disagreement.
Factor Analysis
In the present study, these thirty items were administered to asample of 451 high school students and to a sample of 296 Dade
16 For example, the table might call for the oldest man living at the residence.17 BRODSKY & SMITHERMAN, Handbook of Scales for Research, CRIME & DELINQ. 43-96
(1983).18 M. Brown, Working the Street: Police Discretion and the Dilemmas of Police
Work 310-12 (1981).
1988] 509

DUNHAM AND ALPERT
County police officers, in addition to the study population of 250Dade County residents. The data from the additional samples wereused to provide a wide variety of respondents for scale construction.
The expectation was that certain, specific attitudinal domainswould emerge from the combination of the 997 subjects. An effortwas made to reduce the total number of items, eliminate thosewhich were highly correlated, and identify the concepts which werebelieved to be the most important by the subjects. In other words,there was a search for attitude domains which can be identified bygroups of questions which are answered in patterned ways. The fac-tor analytic technique to detect such patterned deviations from thegrand mean was chosen because individuals do not agree exactlyconcerning their judgments about police practices. This techniqueaided in identifying the sets of question which represent the mostsignificant attitudinal domains.
Clearly patterned deviations will produce a much smallernumber of factor dimensions than loosely patterned deviations us-ing an analysis of both slope and response level. If the patterns ofdeviation in the data pertain mainly to the level of response, all thestimulus values in a continuum ought to load on the same factor.This indicates that if an individual has a higher score than the groupmean on one question, that he or she will tend to be high on all ofthe questions. If, on the other hand, slope differences predominate,the stimulus values from the extremes of a continuum should loadin opposite directions, because a person who was higher than thegroup mean in the high range should also be lower than the groupin the low range.
A separate factor analysis was completed for each of the popu-lations, citizens, police, and students, to find out if the items wouldfactor the same for each group so that the groups could be com-bined requiring one overall factor analysis. Some differences werefound, but they were so minor that combining the samples was justi-fied. In addition, a separate factor analysis was completed for ethnicgroups and age groups.1 9 This analysis resulted in the finding thatalthough there were many similarities in the cognitive structures ofmembers of the various groups, the attitudes toward the police arestructured differently for these groups. However, the greatest dif-ferences were between age groups, such as teens and adults.
To investigate more specifically the attitudes of each of the eth-nic groups, one should examine the unique conceptualizations ofeach group. However, since the data include only adults, and the
19 See Sullivan, Dunham & Alpert, supra note 14.
510 [Vol. 79

NEIGHBORHOOD DIFFERENCES
purposes of the study involve general comparisons between groups,more general measures are appropriate. The resulting overall fac-tor analysis generalizes to the several different populations.
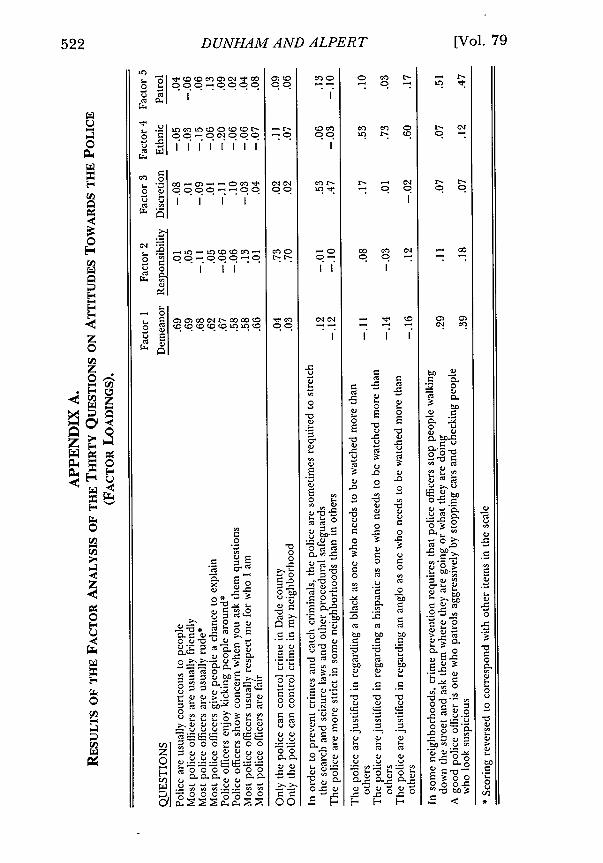
A factor analysis with a varimax rotation was performed on thescores of the thirty questions for the total sample. The factor analy-sis for the total sample, 977, revealed five factors, or attitudinal do-mains, which included items with factor loadings greater than .50.There are two factor loadings, however, that are just under our .50cut off point (.47) that are included in factors three and five. Thesetwo exceptions were made because of the questions' conceptualcongruence with the factors and because they were just below thecut off limit.20
The Five Scales
Demeanor: This scale consists of eight questions which measurethe subject's perceptions of the general demeanor of police officersor his orientation toward citizens. Specific questions illicit re-sponses concerning courteousness, friendliness, rudeness and con-cern or respect for citizens displayed by police officers. This scaleincludes the eight questions measuring specific behaviors represent-ing a comprehensive measure of police officer demeanor. Thelower the score, the stronger the perception of a positive demeanor.
The inter-item correlations for the questions in this scale arequite low, indicating the independence of the questions. 21 An Al-pha of .88 for this scale indicates a high reliability.
Responsibility: This scale consists of two questions concerningthe role of the police and citizens in controlling crime: "only thepolice can control crime in Dade County/my neighborhood." Thelower the score, the stronger the agreement with the statement thatmost of the responsibility for controlling crime rests with the police.The inter-item correlation for this scale is .55, and the Alpha is .71.
Discretion: Two questions are involved in this scale, which meas-ures agreement with the need for variability in enforcing the law,and especially in stretching procedural safeguards22 in some neigh-borhoods or areas. The lower the score, the stronger the agreementwith the need for variability in enforcement and in applying proce-dural safeguards. The inter-item correlation for this scale is .27,while the Alpha is quite low, equalling .43. Further analysis of the
20 See Appendix A.21 See Appendix B.22 These are the procedural safeguards that police follow to insure the rights of al-
leged offenders are protected.
1988]

DUNHAM AND ALPERT
reliability of this scale revealed that the reliabilities for two of theneighborhoods were extremely low: .03 forJames Scott and.12 forthe 1980 Cuban immigrants. Apparently, this scale did not repre-sent the way the poor blacks and the recent Cuban immigrants con-ceptualize police use of discretion. Interpretation of the scores onthis scale in those two neighborhoods must be made with caution.
Ethnic: This scale consists of three questions concerning thejustification for the suspicion that certain ethnic groups are morecrime prone. The three questions are identical except each makesreference to a different ethnic group: black, hispanic and anglo.The lower the score, the stronger the agreement with the idea thatcertain ethnic groups need to be watched more closely than others.The inter-item correlations are quite low, [anglo/black=.23,black/hispanic=.29, anglo/hispanic=.52,] indicating the indepen-dence of the questions. The Alpha is moderate at .62.
Patrol: Two questions comprise this scale, which measures theapproval of active patrol strategies, such as stopping and question-ing people walking down the street and stopping cars for randomchecks. The lower the score, the stronger the agreement that activepatrol strategies are appropriate and necessary to control crime.The inter-item correlation is .49, and the Alpha is .66.
Findings
These scales represent five very different yet interlocking atti-tude domains concerning police strategies and practices.
The first concern is with the variability among neighborhoodson each of the five scales in relation to the variance within neighbor-hoods. This is used to determine whether there is more varianceamong neighborhoods than within neighborhoods. Second, anysignificant differences in scale scores between males and females,among ethnic groups, and their relationship to family income areexamined. Social class and ethnicity, potentially the two major con-taminating factors in this analysis, are controlled naturally by theresearch design, through the selection of neighborhoods. 23 There-fore, these variables do not need to be controlled statistically.There is almost no variation within neighborhoods on these twovariables. However, all neighborhood samples are combined to ob-serve the overall effects of ethnicity and social class on the scalescores. Family income is used as an indicator of social class. Finally,a comparison is made between the neighborhoods and the relativehomogeneity of attitudes and values.
23 R. DUNHAM & G. ALPERT, POLICING MULTI-ETHNIC NEIGHBORHOODS 41-47 (1988).
512 [Vol. 79

1988] NEIGHBORHOOD DIFFERENCES 513
Instead of using the absolute magnitudes of the standard devia-tions, coefficients of relative variation (CRV) were calculated, whichcontrol for variation in the size of the means. The CRV is merelythe standard deviation divided by the group mean, and can be inter-preted as a standard deviation that is further standardized by thesize of the mean. The lower the CRV, the greater the degree ofcohesiveness within the group. This measure allows for determina-tion of the relative cohesiveness, relative to the other groups, ofopinions and values within each neighborhood on each of the scales.In addition, the relative cohesiveness of attitudes about each of thefive scale constructs within the entire population of subjects can bedetermined.
The data in Table 1 summarize the scores on the Demeanor scalefor each of the neighborhood samples as well as for ethnic groups.Overall, the perception of police demeanor is slightly in the positivedirection. A "one" signifies strong agreement with a positive state-ment about police demeanor. A "two" represents agreement, a"three" means undecided, a "four" signifies disagreement and a"five" represents strong disagreement. All of the means are lessthan three or in the agreement range.
TABLE 1SCORING ON THE DEMEANOR SCALE BY NEIGHBORHOOD
AND ETHNICiTY
DemeanorMean S.D. S.E. N CRV*
1. Rolling Oaks 2.88 .38 .05 49 .132. James Scott 2.82 .36 .06 43 .133. 1980 Cubans 2.88 .54 .08 49 .194. 1960 Cubans 2.46 .45 .06 50 .185. Kendall 2.64 .32 .05 50 .12
Significance .000Significantly Different Pairs (4 from 1,2 and 3) (5 from 1 and 3)
1. Anglo 2.67 .35 .06 402. Black 2.84 .37 .04 873. Latin 2.66 .52 .05 104
Significance .022Significantly Different Pairs (2 from 3)
S* coefficient of relative variation (V = -7" )
x
The 1960 Cuban immigrants perceive police demeanor the

DUNHAM AND ALPERT
most positively. Kendall residents view police demeanor more posi-tively than the remaining groups, but not nearly as much as the1960 Cubans. The two black neighborhoods and the 1980 Cubansreported the most negative responses toward police demeanor.There is no significant difference between males and females on thisscale. There are small but statistically significant differences be-tween ethnic groups and perceptions of police demeanor. Anglosand Cubans gave more positive evaluations of police demeanor thandid blacks. The relationship between family income and scores onthe demeanor scale is significant, .053, but weak, with r=. 112.
The significant main effect obtained from the analysis of vari-ance indicates that the variance is more pronounced between neigh-borhoods than within neighborhoods. The CRV analysis indicatesthat all of the neighborhoods are quite cohesive concerning atti-tudes about police demeanor, relative to the cohesiveness of groupson the other scales. In fact, each neighborhood had more internalcohesiveness on police demeanor than on any of the other attitudedomains.
Thus, there is not a drastic amount of variance among groupson the demeanor scale. All of the groups report attitudes in a posi-tive direction, with the 1960 Cubans and the Kendall residents hold-ing the most positive perceptions of police demeanor. There is notany evidence showing a need to develop specific neighborhoodstrategies concerning police demeanor.
The data in Table 2 summarize the scores on the Responsibilityscale. There are clear differences among neighborhoods as towhether the major responsibility for controlling crime lies with thepolice. The two Cuban groups agree with this notion while all ofthe other groups disagree. Further, of those groups that disagree,the Kendall residents report the strongest disagreement. Not onlydo the Kendall residents report the strongest disagreement, butthey also have the highest level of consensus, as indicated by a com-parison of the CRVs. In contrast, although the two Cuban groupsare the only groups agreeing that the police are solely responsiblefor crime control, they have the lowest level of concensus.
There is no significant difference between males and females onthis scale, and its relationship with family income is not significant.The breakdown of the three ethnic groups indicates that the Cubanswere the only ones to agree with the idea that the major responsibil-ity for crime control rests with the police. All others disagreed. TheAnglo respondents reported the strongest disagreement. With theexception of the Kendall residents, each neighborhood group re-
[Vol. 79

NEIGHBORHOOD DIFFERENCES
TABLE 2SCORING ON THE RESPONSIBILITY SCALE BY NEIGHBORHOOD
AND ETHNICITY
ResponsibilityMean S.D. S.E. N CRV*
1. Rolling Oaks 3.13 .88 .12 50 .282. James Scott 3.26 .91 .14 45 .283. 1980 Cubans 2.52 .78 .11 50 .314. 1960 Cubans 2.40 .98 .14 50 .415. Kendall 3.83 .56 .08 50 .15
Significance .000Significantly Different Pairs (1 from 4 and 3) (2 from 4 and 3)(5 from 1,2,3 and 4)
N/S
1. Anglo 3.91 .50 .08 402. Black 3.20 .89 .09 903. Latin 2.50 .86 .08 105
Significance .000Significantly Different Pairs (3 from 1 and 2) (2 from 1)
S* coefficient of relative variation (V = -" )
x
ported lower levels of consensus on the responsibility scale whencompared to the other four scales.
In summary, there are considerable differences among thegroups concerning agreement with the notion that only the policeshould contol crime. The residents of both Cuban neighborhoodsagree, while all the other groups disagree. Kendall residents had notonly the strongest disagreement, but also the most consensus. Aftercombining all these groups to assess ethnic differences, Cubans re-main the only group to agree, while Anglos have the strongestdisagreement.
The data in Table 3 summarize the scores on the Discretion scalefor each of the samples. The general sentiment among all groups isthat police should use considerable discretion when applying proce-dural safeguards and other procedures in the different neighbor-hoods. The respondents in both of the Cuban neighborhoods gavethe strongest approval for the use of discretion, and the residents ofRolling Oaks gave the weakest level of approval. Even these lowerscoring groups, however, still approve of the use of discretion.They simply approve of it less empathetically than the other groups.Due to the low reliability coefficients of this scale for two of our
1988]

DUNHAM AND ALPERT
TABLE 3SCORING ON THE DISCRETION SCALE BY NEIGHBORHOOD
AND ETHNICITY
DiscretionMean S.D. S.E. N CRV*
1. Rolling Oaks 2.71 .73 .11 48 .272. James Scott 2.55 .67 .11 39 .263. 1980 Cubans 2.03 .52 .07 49 .264. 1960 Cubans 1.86 .61 .09 50 .335. Kendall 2.22 .66 .09 50 .30
Significance .000Significantly Different Pairs (1 from 3,4 and 5) (2 from 4 and 3) (5 from 4)
1. Anglo 2.21 .71 .11 402. Black 2.63 .69 .08 823. Latin 1.96 .56 .05 104
Significance .000Significantly Different Pairs (2 from 1 and 3)
S* coefficient of relative variation (V = - )
x
neighborhoods, James Scott and the 1980 Cuban immigrants, inter-pretation of these findings is only suggestive and tentative.
As in the demeanor and responsibility scales, gender was not asignificant factor. Family income was significantly related to scoreson this scale, .019, but the relationship is very weak, with r=.143.When combining all groups, the blacks reported the weakest level ofapproval for the use of discretion in comparison to the Anglos andLatins.
Thus, there is more overall agreement in attitudes toward po-lice use of discretion than for any of the other scales. The two Cu-ban groups report the strongest agreement, while residents ofRolling Oaks showed the weakest agreement. blacks, in general,showed the weakest level of agreement. Analysis of the CRVs indi-cates a moderate level of consensus within groups that is quiteevenly distributed among the groups.
The data in Table 4 summarize the scores for the Ethnic Suspi-don scale. Generally, all of the study groups, except one, disap-proved of the notion that some ethnic groups need to be watchedmore closely for criminal activity than others. The one exception isthe James Scott project. The mean score for this group indicatesthat these respondents either agreed or were undecided about theneed to have police watch some ethnic groups more closely than
516 [Vol. 79

1988] NEIGHBORHOOD DIFFERENCES 517
TABLE 4SCORING ON THE ETHNIC SCALE BY NEIGHBORHOOD
AND ETHNICITY
EthnicMean S.D. S.E. N CRV*
1. Rolling Oaks 3.70 .71 .10 50 .192. James Scott 2.94 .61 .09 43 .213. 1980 Cubans 3.33 .79 .11 50 .244. 1960 Cubans 3.93 .61 .09 50 .165. Kendall 3.75 .75 .11 50 .20
Significance .000Significantly Different Pairs (2 from 1,4 and 5) (3 from 4 and 5)
1. Anglo 3.74 .75 .12 402. Black 3.35 .75 .08 883. Latin 3.60 .78 .08 105
Significance .03Significantly Different Pairs (1 from 2)
S* coefficient of relative variation (V = - )
X
others. The residents of the 1960 Cuban neighborhood respondedwith the strongest disagreement to ethnic suspicion. There is nosignificant difference between males and females on this scale and asignificant, .003, but weak relationship with family income, withr=.191. Anglos are significantly stronger in their disagreementwith this idea than are blacks, while Cubans score in-between theAnglos and the blacks.
Analysis of CRVs shows a high level of consensus within neigh-borhoods on the ethnic suspicion scale when compared to the re-sponses or the other scales. In addition, consensus levels are fairlyevenly distributed across the groups.
There exists, therefore, a general disagreement with the ideathat ethnic suspicion is justified, except for the residents of theJames Scott Housing Project, who generally agree. The 1960Cubans disagree more than the the residents of other neighbor-hoods, while Anglos disagree more strongly than any other ethnicgroup. There exists considerable consensus within neighborhoodson attitudes concerning this practice.
In Table 5 the scores on the scale testing for agreement or disa-greement with active patrol strategies is summarized. There is consid-erable variation among groups concerning agreement with thesestrategies. In fact, there is more variation among groups on this

DUNHAM AND ALPERT
TABLE 5SCORING ON THE PATROL SCALE BY NEIGHBORHOOD
AND ETHNICITY
Patrol
Mean S.D. S.E. N CRV*
1. Rolling Oaks 3.12 .79 .11 50 .252. James Scott 3.02 .74 .11 44 .253. 1980 Cubans 2.55 .90 .13 50 .354. 1960 Cubans 2.16 .97 .14 50 .455. Kendall 2.96 1.01 .14 49 .34
Significance .000Significantly Different Pairs (4 from 1,2 and 5) (3 from 1)
1. Anglo 2.99 1.02 .16 392. Black 3.10 .73 .08 893. Latin 2.36 .95 .09 105
Significance .000Significantly Different Pairs (3 from 1 and 2)
S* coefficient of relative variation (V = - )
X
scale than on any of the other four scales. This scale also has thelowest level of consensus within neighborhoods, as demonstrated bythe CRV analysis. The first wave of Cuban entrants in 1960 approveof active patrol strategies more than any other group. The 1980Cuban entrants also approve of these strategies, but not as stronglyas their earlier cohort. Finally, Kendall residents weakly agreed withactive patrol strategies, while Rolling Oaks andJames Scott disagreewith these strategies.
There are no significant gender effects. Family income is signif-icantly related to scores on this scale, .040, but the relationship isweak, with r=.120. When combining all the samples together, it isthe Cubans who stand out as different from the other ethnic groups.They agree that active patrol strategies are appropriate, while blacksand Anglos score, on an average, near to the undecided category.However, this does not mean that residents do not have opinions onactive patrol strategies. Analysis of the CRVs indicates that there isa considerable lack of consensus within groups on this procedurefor the black neighborhoods and Kendall residents. For example,residents of the 1960 Cuban neighborhood exhibited the highestlevel of agreement with active patrol strategies, but they had consid-erable disagreement within their group. This is demonstrated by
518 [Vol. 79
NEIGHBORHOOD DIFFERENCES
the CRV of .45, which is the highest CRV for any neighborhood onany scale.
In sum, attitudes about active patrol strategies vary considera-bly among the five neighborhoods. The 1960 Cubans had thestrongest agreement with active patrol strategies, but the weakestconsensus. While the 1980 Cubans agreed with the strategies, theywere not as strong in their agreement as the 1960 Cubans. Cubansagreed with active patrol strategies, differentiating themselves fromAnglos and blacks who did not.
It is also instructive to assess the level of consensus for eachneighborhood across the five scales, to indicate the general level ofconsensus within each neighborhood Do certain neighborhoodshave a greater degree of agreement on their general feelings aboutthe police and police practices? The 1960 Cubans had the highestaverage CRV, equalling .31, indicating the weakest level of overallconsensus. They also had the most extreme attitudes on many ofthe police practices. They showed fairly strong consensus on thedemeanor and ethnic scales, but the weakest levels of consensus onthe three remaining scales. Kendall residents reached a very highlevel of consensus on three of the scales, demeanor, responsibilityand ethnic, but showed some disagreement on the discretion andpatrol scales. Residents of both the black neighborhoods, RollingOaks and James Scott, had fairly even levels of consensus across thescales. The 1980 Cubans were moderate in their levels of consensusacross all five scales when compared to the other fourneighborhoods.
Discussion and Conclusions
It is very clear that there is more variation on attitudes towardpolice practices among neighborhoods than within the neighbor-hoods. In fact, a surprising degree of consensus was found withinneighborhoods. In all of the scales, with the exception of the de-meanor scale, there is enough variation among neighborhoods tosuggest a need for differences in police practices, in at least one ofthe neighborhoods.
Variation on the responsibility scale indicated that it is believedby residents of the Cuban neighborhoods that crime control ismainly a police matter and that there is very little that citizens cando to help. In contrast, Kendall residents had the strongest disa-greement with this notion. Residents of the middle-class Kendallarea are heavily involved in Citizen's Crime Watch and similar pro-grams that activly involve citizens in crime control. Obviously, the
1988] 519

DUNHAM AND ALPERT
police need to approach crime control in each of these areas in adifferent manner. They will receive much more help and support inthe Kendall area, but should begin to change the attitudes of theCuban residents by educating them on how they can help the policecontrol crime more effectively. The fact that the Cubans had higherlevels of disagreement over this idea than any of the other groupsleads to the belief that a significant change in attitudes could takeplace.
Analysis of responses to the discretion scale suggests that thereis a greater degree of support for using discretion in applying proce-dural safeguards in the neighborhood comprised of 1960 Cuban im-migrants than in other neighborhoods. Cubans apparentlyconceptualize a greater degree of latitude than others in applyingpolice procedures, whereas middle-class blacks tend to be moreskeptical of the ability of the police to use discretion without ethnicdiscrimination. Procedural safeguards need to be strictly adhered toin the black areas if the police expect to gain any degree of citizencooperation and support.
The variation of the scores on the ethnic scale indicate a differ-ent grouping of neighborhoods than was found on the other scales.The residents of the James Scott housing project and the 1980Cubans, to a lesser degree, are the only groups that did not showsignificant disagreement with the appropriateness of ethnic suspi-cion. It is ironic that they are not strongly opposed to it, becauseresidents of these two neighborhoods are the most likely to be vic-tims of ethnic suspicion in Miami. Apparently, the majority of theresidents in these neighborhoods are law-abiding citizens living inhigh crime areas. These residents call for more and tougher policeprotection. It may be that they view, first hand, the extent of thecrime and violence in their neighborhoods and believe that there issome justification for ethnic suspicion. It is interesting that themore successful and established counterparts to each of theseneighborhoods, the middle-class blacks and the 1960 Cuban en-trants are at the opposite end of the continuum. They expressed thestrongest disapproval of ethnic suspicion. Perhaps residence intheir safe neighborhoods has shifted their concerns from safety toending discrimination. These differences reflect a need for differentpolice strategies in the different neighborhoods.
Analysis of the responses to the scale on active patrol strategiesindicates that there is more variation on this scale than on any of theothers. The 1960 Cuban entrants report considerable agreementwith active patrol strategies, as do, to a lesser degree, the 1980Cubans. Middle-class blacks, such as those residing in Rolling Oaks,
[Vol. 79

NEIGHBORHOOD DIFFERENCES
reIort the strongest disagreement with active patrol strategies. Theactive strategies gain more support and cooperation in the 1960 Cu-ban neighborhood and in the 1980 Cuban neighborhood than in theother neighborhoods. These same strategies, however, would causesome concern in the middle-class black neighborhood. The policemay be more effective if they find some alternative strategy for thisneighborhood.
Of course, there are other police practices that need to be in-cluded in future analyses of community policing. However, this lim-ited study has demonstrated that significant neighhorhooddifferences do exist concerning attitudes toward police practices,which is evidence for what Sherman has called a mixed strategy ap-proach to policing.24
From this study, it appears that neighborhood differences thatare significant to policing go beyond traditional ethnic distinctions.The analysis of differences among general ethnic groups, as op-posed to analysis of specific neighborhoods, reveals very little. Thefew exceptions, with differences falling along general ethnic lines,appeared when the two Cuban neighborhoods or the two blackneighborhoods held the same general values toward specific policepractices. However, this agreement cannot be taken for granted. Itappears that the main factors that define neighborhoods, for polic-ing purposes and, as a result, for this study, are ethnicity and socio-economic status. The various combinations of these two factorsseem to generate specific neighborhood climates or cultures that in-fluence attitudes toward policing practices.
Of course, this research is just a beginning. However, this typeof empirical data is important due to the recent advent of interest ininstituting community policing strategies. 25 Many times the policedevelop new strategies, out of necessity, without adequate informa-tion to know if such strategies will work. Before the police embracecommunity policing changes, social scientists need to provide themwith an adequate data base.
9
24 Sherman, supra note 5, at 379-81.25 See Alpert & Dunham, Community Policing, 14J. POL. ScI. & ADMIN. 212-222 (1986).
1988]
522 DUNHAM AND ALPERT [Vol. 79
o .0 0 ". . . .
cz0
~ -0~..-.-0 o"c~ . ,q.co. r- - o. 1. .:
m 0
u " " I" I" I
U
, C-
r 0
.0
-~~oc- ~0 - +c o' -+
rC 02 00 C- '00 t-.. 0 0" - C- -
0.0 cz0N~(
z .0 -S
e., 1.. . , -, 0
0 ~ ~~~~ E 0.,..>-o - -
0 0o
,+.uu*~0to
uo. 0
0ooo
0 r-C
a..-.

1988] NEIGHBORHOOD DIFFERENCES 523
APPENDIX B.INTER-ITEM CORRELATION FOR DEMEANOR SCALE
1 2 3 4 5 6 7 8
1. Friendly -2. Courteous .46 -3. Rude .46 .50 -4. Enjoy Kicking People Around .34 .51 .52 -5. Give Chance To Explain .60 .59 .52 .50 -6. Fair .43 .56 .42 .44 .53 -7. Show Concern .39 .44 .44 .45 .55 .44 -8. Show Respect .40 .46 .37 .51 .50 .45 .49 -